1. Introduction
Network representation learning (NRL) plays a pivotal role in many areas, which aims at learning low-dimensional, compressed, and distributed representation vectors for all kinds of networks. Network representation learning tasks can be intuitively regarded as network encoding tasks, where each node is given a unique vector in representation space, consequently, the neighboring vertices possess a closer space distance based on the distance evaluation function. Distributed representation learning is derived from a language-embedding application. The representative algorithm of language embedding is Word2Vec, proposed by Mikolov et al. [
1,
2]. Motivated by the Word2Vec algorithm, the network representation learning algorithm was consequently proposed by Perozzi [
3], who adopted the random walk strategy to generate the vertex sequences, which are the same as “sentences” in language models. DeepWalk receives multiple vertex sequences
as the input of the network representation learning model, where
denotes the length of the random walk sequence. In the middle layer of the learning model, the sequence
is converted into the vertex pairs
,
,
, and
, where the window size needs to be set and the number of vertex pairs is controlled by the window size. The output of DeepWalk is a low-dimensional vector,
, where
is the size of the network representation vector. Recently, the DeepWalk algorithm has been successfully applied to many tasks [
4].
There exist various relationships between network vertices. The structural relationships can be captured by DeepWalk and the community relationships can be captured by community detection algorithms or vertex labels. The vertex relationships in real-world networks also can be intuitively captured by the rich vertex contents (texts). For example, different titles of network vertices may contain the same words in citation networks, so the higher the overlap of words, the greater the probability of reference between them. Indeed, it is also well acknowledged that most existing NRL models ignore the semantic relationships between vertices. However, some NRL models try to integrate node contents into network representation learning. For example, text-associated deep walk (TADW) [
5] and tri-party deep network representation (TriDNR) [
6] provide a novel NRL framework, which integrates text features into representations by matrix factorization and joint learning. More specifically, TADW adopts inductive matrix completion (IMC) [
7] to integrate text features into a network representation model; the essence of TADW is a kind of matrix factorization. Thus, it is not suitable for tasks of large-scale network representation learning. Two neural networks are applied by TriDNR to integrate text contents and label information from network vertices into a network representation learning model, which learns network representations in three parts (i.e., node structure, node content, and node label), consequently, TriDNR captures the inter–node, node–word, and label–word relationships. Because it considers the relationships between inter–node, node–word, and label–word, TriDNR has a higher computational complexity, and it would take a longer training time for representation learning, even in some smaller networks. Therefore, the objective of this paper is to research how to make full use of the network node text contents and how to improve the performance of network representation learning by node text contents. Finally, we hope that the proposed algorithm can obtain smaller computational complexity in tasks of large-scale network representation learning and can also gain a higher precision and desirable performance.
Multi-relational data modeling was first proposed by Bordes et al. [
8], and it is a directed graph containing entities and relationships such as triplet form (head, label, tail). The triplet is denoted in the form
in this paper. An example is knowledge bases, such as Freebase [
9] and DBpedia [
10], where each entity is an abstract concept and the relationships are the facts involving two entities. TransE [
8] can model multi-relational data using more generic methods that take all heterogeneous relationships into account at the same time. The TransE algorithm mainly learns knowledge embedding based on Freebase and DBpedia, etc.
The feature matrix of the network is factorized by TADW to gain the node representations, where the text feature matrix is as an auxiliary matrix. Note that the node contents are converted to a text feature matrix in TADW. This kind of TriDNR algorithm considers words in node contents as kind of special vertices and models node–word and word–label relationships, where all words in node contents are input into the neural network to train and learn the network representation vectors. Thus, we want to propose a novel network representation learning algorithm, which can model inter–vertex and vertex–word relationships with a lower calculation complexity. More importantly, the node representations can possess semantic information. To achieve the above goal, we first constructed the vertex relationships by node contents in this paper. We then converted these vertex relationships into vertex triplets in the form
, where
denotes the semantic relationship between vertex
and vertex
. Consequently, we propose an optimized network representation learning algorithm using vertex triplets, called MRNR, which focuses on modeling the network structure and multi-relational data at the same time. Motivated by the TransE model, we introduce the idea of the TransE algorithm to optimize the network representation learning process and adopt DeepWalk to model network structure features. Please note that we propose a new approach based on DeepWalk to model all knowledge triplets. Through this we learn the representations of triplets
using the improved algorithm without TransE. The TransE [
8] and DeepWalk [
3] are all proposed based on the Word2Vec [
1,
2]. So, we propose a unified joint learning framework and objective function without concatenating two kinds of vertex representations. In this framework, MRNR learns the network representations and model the multi-relational data using a single neural network (TriDNR uses two neural networks). Moreover, only some words in the node text contents are involved in the tasks of network representation learning. Therefore, MRNR is competent to the tasks of the large-scale network representation learning. Finally, we introduce a kind of optimization algorithm to improve the performance of network representation learning. However, MRNR is a novel node semantic relationship preserving network representation algorithm. By jointly optimizing the DeepWalk structure preserving objective and TransE [
8] node semantic relation preserving objective, the proposed MRNR algorithm learns informative node representations.
To summarize, we make the following contributions:
- (1)
We propose a novel vertex triplet-based NRL model, MRNR. It incorporates the multi-relational data between vertices into the network representation learning model. As a simple and straightforward model, it models the network representations between vertices and vertex triplets with a unified joint learning framework at the same time.
- (2)
To the best of our knowledge, we are the first to introduce the idea of a vertex triplet into network representation learning, which means that the external multi-relational data are introduced into DeepWalk as a regularization term to guide and constrain the training procedure. Moreover, we introduce a kind of higher order transformation strategy to optimize the learnt network representation vectors.
- (3)
We conduct experiments on the three real-world datasets with the task of node classification, the experimental results show that the MRNR is an effective and robust network representation approach. Importantly, MRNR can achieve excellent performance in large-scale network learning tasks, especially in terms of accuracy and time complexity.
2. Related Work
Representation learning [
11] algorithms aim at avoiding huge feature engineering and improving the application areas of network features. Representation learning algorithms learn features via neural network or matrix factorization methods. DeepWalk [
3] is a network representation learning algorithm based on Word2Vec [
1,
2]. DeepWalk [
3] can encode complex network structures into the low-dimensional representation vector space, showing better network classification performance on various network tasks.
Consequently, some improved algorithms are proposed for network representation learning tasks. Several are based on DeepWalk [
3], such as node2vec [
12], NEU [
13], WALKLETS [
14] and HARP [
15] etc., while node2vec [
12] optimizes the strategy of random walk. For example, node2vec [
12] adopts breadth first search and depth first search to sample the node sequences. The breadth first search provides a local microscopic view and depth first search provides a global macroscopic view. DeepWalk [
3] can capture node relationships of lower order, and NEU [
13] introduces a novel approach, which can obtain higher order network representations using simple representation transformation. Moreover, the NEU [
13] algorithm implicitly approximates higher order proximities with theoretical approximation bound, WALKLETS [
14] obtains higher order representations by the
k-step random walk strategy, and HARP [
15] learns higher order representations by graph compression strategy. The low order features are just to consider the local relations amongst vertices, and the high order features mainly take the global relations amongst vertices into account.
Another kind of improvement is based on neural matrix factorization of DeepWalk [
3], such as Line [
16], GraRep [
17], TADW [
5], MMDW [
18]. Specifically, the Line [
16] fully researches the 1st order proximity and the 2nd order proximity based on matrix factorization. DeepWalk [
1] actually aims at factorizing the structure feature matrix of the networks. Consequently, GraRep [
17] introduces a matrix factorization strategy to obtain higher order representations of the networks. GraRep [
17] obtains higher order features of networks through multiplication of adjacency matrix. The uses inductive matrix completion (IMC) [
7] is adopted by TADW [
5] to integrate the node contexts into network representations. The max-margin method is used by MMDW [
18] to optimize the learnt network representations. In fact, both TADW [
5] and MMDW [
18] adopt the matrix factorization approach to obtain the network representations.
The third kind of improvement is based on the joint learning model, such as DDRW [
19], TriDNR [
6], GCN [
20], M-NMF [
21], AANE [
22], COSINE [
23], and comE, [
24] etc. Specifically, the DDRW is an improved algorithm based on DeepWalk [
3], and DDRW [
19] jointly improves the objective of classification and the objective of embedding entities. Two neural networks are adopted by TriDNR to learn the network representations from three parts (the node’s structure, node’s content, and node’s label), consequently, TriDNR [
6] captures the inter–node, node–word, and label–word relationships. Compared with TADW [
5], the relationships of the node–label could be learnt based on these two neural networks. Both the local graph structures and features of the nodes can be encoded by GCN [
20] by learning the hidden layer representations. And M-NMF [
21] is a modularized non-negative matrix factorization approach, which incorporates the community structures into network representations. Both COSINE [
23] and comE [
24] also incorporate the community information into network representations. In addition, AANE [
22] is an accelerated attributed network embedding approach, which enables the joint learning framework to be conducted by decomposing the complicated learning and training into many sub-problems.
There exist some network representation approaches for special network structures, such as DynamicTriad [
25], DepthLGP [
26], and DHNE [
27], etc. In addition, motivated by generative adversarial networks (GANs) [
28], some network representation learning algorithms introduce GANs to optimize the learning procedure, such as ANE [
29], GraphGAN [
30], and NetGan [
31].
To sum up, various solutions and novel algorithms are proposed for tasks of network representation learning. The focus of this paper is to research how to efficiently use network node contents to improve the performance of network representation learning. More importantly, we research how to use the network node contents to conduct learning and training tasks of network representation on large-scale networks, which can overcome higher calculation complexity like TADW [
5] and TriDNR [
6] algorithms. We mainly use TADW [
5] and MRNR [
6] proposed in this paper to make a comparative analysis in a fair way, as these algorithms only adopt node structures and node contents to learn network representation vectors.
3. Method
The MRMR algorithm proposed in this paper aims to embed the text features of network vertices into the network representation vectors. Some network representation learning methods based on matrix factorization take the text features of network vertices as the feature matrix to optimize the factorization procedures of the network structure feature matrix, for example, the TADW algorithm belongs to this kind of NRL algorithm. Other network representation learning methods based on neural networks simultaneously model the relationships between vertices and the relationships between vertices and text through multiple neural networks, for example, the TriDNR algorithm belongs to this kind of NRL algorithm. Different from the TADW and TriDNR algorithms, a novel text-embedding method was adopted in this paper, namely, the text between network vertices was transformed into the triplets between vertices. In order to embed vertex triplets into the network representation learning task, we introduced the idea of multi-relationship modeling, namely, we adopted the idea of knowledge-embedding learning using TransE to model the triplet relationships between network vertices. In order to constrain the modeling of network vertex relationships by modeling vertex triplet relationships, we propose the objective function of the MRNR algorithm based on the CBOW model optimized by the negative sampling and TransE algorithms. Therefore, we first introduce how to construct the triplets between vertices in this section, then introduce the modeling procedure of the TransE algorithm, and then we introduce the CBOW model based on negative sampling optimization, and finally we introduce how the MRNR algorithm proposed in this paper can simultaneously model the network vertex relationships and triplet relationships.
In
Section 3.1, we introduce some definitions of the parameters used in this paper. In
Section 3.2, we introduce how to construct the vertex triplets based on text contents of two vertices. In
Section 3.3 and
Section 3.4, the TransE algorithm and CBOW algorithm are introduced. After that, we propose the MRNR algorithm based on the improvements of these two algorithms in
Section 3.5. Therefore, we introduce in detail how to embed vertex triplets into the network representation learning procedure based on the idea of the TransE algorithm in
Section 3.5, and how to optimize the learnt network representation vectors obtained from the MRNR algorithm in
Section 3.6.
3.1. Formalization
The parameters used in this paper are defined as follows. For a network , we denote as the vertex set, as the edge set, and as the size of vertex set, where each vertex and each edge . The purpose of the MRNR is to train the representation for a given vertex , which is also the goal of network representation learning. Here, is the size of network representation vector and it is expected to be much smaller than . Namely, usually denotes the number of vertices in the network, and we often set the size of the network representation vector as 100, 200, 300, etc., which is much smaller than the number of vertices. Note that is not task-specific and it can be used for various tasks. Because of the output of the DeepWalk algorithm, so can the learnt network representation vectors be used for network node classification, network visualization, link prediction, and recommendation systems, etc. For the multi-relational data modeling, we set the as vertex triplets, where denotes the head entity, denotes the tail entity, and denotes the relations between head entity and tail entity. For the CBOW model in DeepWalk, we set the as the context vertices of the current vertex and denotes the negative sampling procedure for the current vertex . Here, the high-frequency variables are defined and explained, and the other variables adopted by this paper will be explained in detail at the corresponding sections.
3.2. Triplet Construction
The semantic relationships between vertices are extracted from the vertex texts. In this paper, we take two kinds of strategies to denote the relationships between vertices. The first kind of relationship is called as Unitary Relationship, where the relationship is constructed by one same word amongst word sequences from two vertex’s texts. The second kind of relationship is called as Binary Relationship, where the relationship is constructed by two same words amongst the word sequences from two vertex’s texts. We give a simple example in
Table 1.
3.3. TransE Model
Inspired by Word2Vec [
1,
2], Bordes et al. [
8] proposed the TransE algorithm, and the TransE algorithm models the relationships by training the triplets (head, label, tail) (denoted by
) of multi-relational data as a form of translation tasks. It means that TransE needs to continuously adjust the representations of parameters
,
, and
to get a global equilibrium,
The objective function of TransE is as follows:
where
Here, is the set of triplets and is the set of negative samples. The energy of a triplet is equal to for the dissimilarity measure and is a margin hyperparameter. is the positive part of variable .
3.4. CBOW Using Negative Sampling
DeepWalk can be implemented by CBOW and Skip-Gram introduced from Word2Vec, which all can be optimized by negative sampling (NEG) and Hierarchical Softmax [
1,
2]. In terms of training efficiency, CBOW and negative sampling outperforms Skip-Gram and Hierarchical Softmax. Thus, the CBOW using NEG is applied in our model.
For current vertex
, we define its context vertices as
, the negative sampling procedure is defined as
. Here,
. For
,
is the vertex set. We define the label as follows:
where
is the sampling label of vertex
, for example, the label of positive sampling is 1, and the label of negative sampling is 0.
For one vertex and its contexts
, our aim was to maximize the following probability in the entire representation space:
where
and
is the Sigmoid function,
is the summing operation of each representation in
,
is an assistant training vector of the current vertex
Equation (5) can also be formalized as follows:
so,
can be calculated based on Equations (4) and (6) as follows:
Therefore, for a given corpus
, the function:
is defined as the overall objective function, the objective function of CBOW using NEG is denoted based on Equations (6)–(8) as follows:
We optimize Equation (9) by the stochastic gradient ascent algorithm. Consequently, the updating of
is computed as follows:
The updating approach of each context vertex
is calculated as follows:
where
.
3.5. MRNR Model
On citation networks, the relationships between vertices have reference relationships and referenced relationships. Generally, we just considered these relationships as a kind of edge existence. Some network representation learning algorithms based on shadow neural networks focus on learning the context relationships between the current vertex and context vertices. Consequently, the learnt representations tend to show the similarity if two vertices almost possess the same structure. Network vertices usually contain rich text contents on citation networks, such as paper title, abstract, and running title, etc. Empirically, the vertex without reference relationships maybe contain the same words in their titles, so we can construct unitary relationships and binary relationships by extracting one same word or two same words in titles. Therefore, we propose an optimized network representation learning algorithm using multi-relational data (MRNR) inspired by, literature [
32,
33], which jointly learns the network representations from the network representation learning model and knowledge representation learning model using TransE. Roughly speaking, MRNR integrates multi-relational data (triplets) into the procedure of learning the network representations. The detailed training diagram is shown in
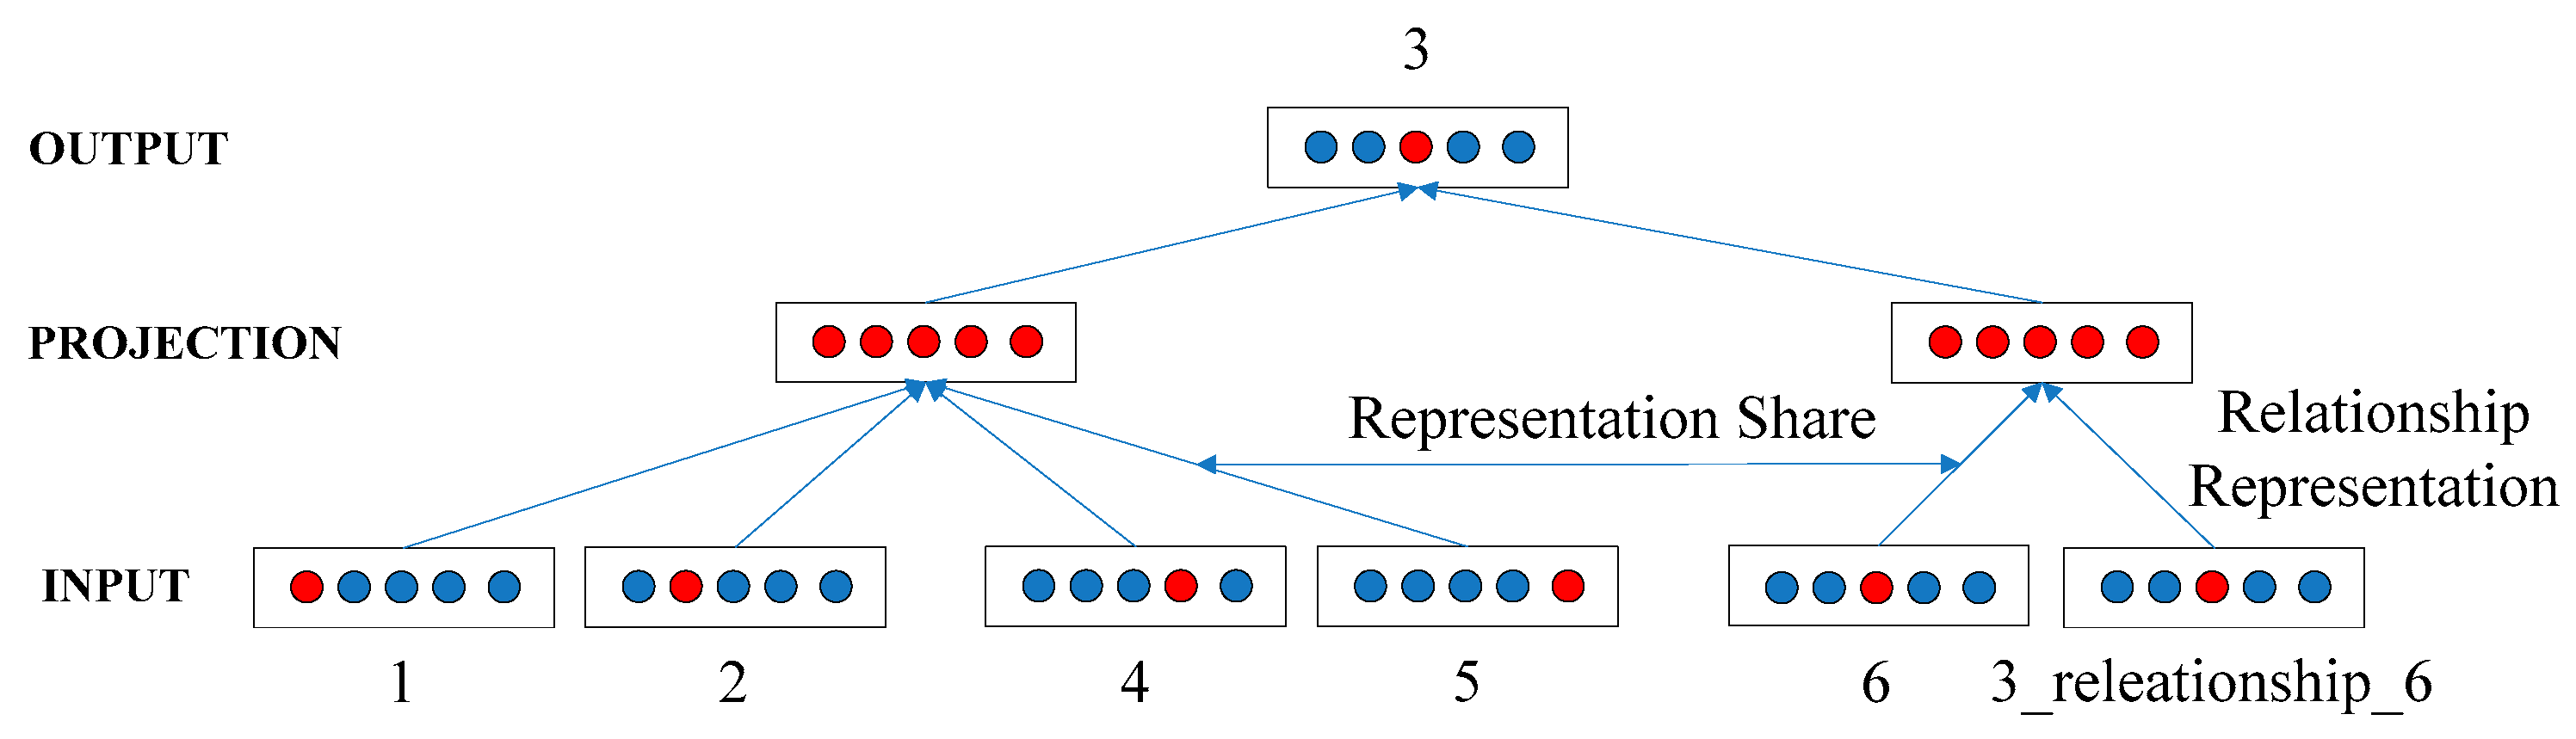
Figure 1.
As shown in
Figure 1, the left training procedures are based on CBOW modeling and the right training procedures are based on multi-relation data modeling. For the current vertex 3, its context vertices are 1, 2, 4, and 5, in addition, there exists some unitary relationships and binary relationships between vertex 3 and 6. For all vertices, two kinds of learning models share common representation space, for the relationships between vertices, MRNR creates a new representation space, which can avoid conflicts between vertex representations and relationship representations.
Figure 1 shows the detailed model training procedures and the following contents would introduce the objective function of MRNR.
Equation (9) is the objective function of DeepWalk using CBOW and negative Sampling, it then can be simplified as follows:
The MRNR algorithm introduces the triplets into DeepWalk, meanwhile, triplets should satisfy which means that should possess a nearest vector space distance with , otherwise, should possess a further vector space distance with . We get inspiration from the TransE algorithm, namely, if holds, then the representation of the vertex should be closed to the representation of the vertex plus the representation of the relationship .
Motivated by the TransE model, we finally use the DeepWalk algorithm to model all the triplets. Consequently, we propose a new approach based on DeepWalk to learn the relationships of the triplet
. The objective function is as follows:
where
is the all triplets containing
. We can build the relationship between CBOW modeling and multi-relational modeling. In the MRNR model, we can regard the triplet
as a regularization term constraint to DeepWalk. To propose a joint learning framework, we define our objective function as follows:
Here, we introduce the hyper-parameter to balance the weights between structural features and triplet features.
For Equation (13), it can be replaced by Equation (9):
where
We use the stochastic gradient ascent algorithm to get the updating expressions of each parameter as follows:
In Equation (14), we add the weight for the triplet relation modeling. Therefore, we need to add a weight to the Equations (16)–(18) when the variables are updated, namely, we replace the variable with the variable .
3.6. Higher Order Proximity Approximation of MRNR
In Line [
16] algorithm, the neighboring vertices are captured to provide the first order similarity and the second order similarity between vertices, so it provides two kinds of models, namely, 1st Line and 2nd Line. In addition, GraRep [
17] adopts the form of adjacency matrix multiplication to capture higher order features. Moreover, WALKLETS [
14] captures higher order vertex relationships on random walk sequences, then it puts all vertex relationships of lower order and higher order into the DeepWalk model, generating effective and excellent network representations. However, these algorithms possess a higher computation complexity. Yang et al. [
13] propose a unified framework of higher order proximity approximation, NEU, which can approximate a higher order proximity matrix for learning better network representations. Importantly, NEU [
13] applies arbitrary network representations trained by lower order proximities as inputs of NEU to avoid the repeated computation.
The optimization expression of NEU is as follows:
where
is the network representation vectors of lower order proximities,
is the normalized adjacency matrix, and
is the network representation vectors of higher order proximity. Therefore, NEU can implicitly approximate higher order proximities based on a theoretical approximation bound. Therefore, we use the NEU algorithm to enhance the performance of MRNR, which is a kind of optimization for the learnt representation vectors of MRNR.
The algorithm framework proposed in this paper is not a task-specified algorithm for NLP and NRL tasks. Consequently, MRNR uses DeepWalk to verify the feasibility of the proposed framework. In network representation learning algorithms, some network representation learning algorithms are based on the framework of neural network, and others are based on matrix factorization. And MRNR uses the basic DeepWalk algorithm to construct a joint learning framework. Afterwards, some improved algorithms have been proposed based on the DeepWalk algorithm, such as node2vec [
12], MMDW [
18], and SDNE [
19]. Therefore, MRNR is a flexible framework which also can be applied to other NRL tasks.
In order to demonstrate the modeling procedure of the MRNR algorithm in more detail, we give the algorithm pseudocode, which does not add the procedure of higher order optimization, the pseudocodes of Algorithm 1 are shown as follows:
| Algorithm 1: MRNR Algorithm |
Input: graph: G(V, E), network representation vector size: k, random walk number: wn, random walk lengh: rl, triplet set: S, the weight of triplet: .
Output: vertex representation vectors of MRNR |
// get all walk sequences of network vertices
1: for i form 1 to wn do
2: O ← Shuffle(V)
3: for in O do
4: ← RandomWalkSequenceAppend(G, , rl)
5: end for
6: end for
//initialize all variables
7: vertex_amount ← GetVocabAmount(C)
8: relation_amount ← GetRaltionAmount(S)
9: Vec ← Init_Representation_Vector(vertex_amount, k)
10: ← Init_Representation_Vector(vertex_amount, k)
11: ← Init_Representation_Vector(relation_amount, k)
12: for v in C do
13:
14:
15: for do
16: q ←
17: g ←
18: e ← e + g
19: ← + g
20: end for
21: for do
22:
23: end for
24: for in do
25:
26: (h, l, ) ← ObtainTriplets(R, l,)
27: for do
28:
29: q ←
30: g ←
31: e ← e + g
32: ← + g
33: end for
34: Vec(v) ← Vec(v) + e
35: P(l) ← P(l) + e
36: end for
37: end for |
4. Experiments and Evaluations
4.1. Dataset Setup
We conducted our experiments on the Citeseer (M10), Database System and Logic Programming (DBLP) (V4), and Simplified DBLP (SDBLP) datasets. The descriptions of the three datasets are given in
Table 2:
The separate vertices are not connected with the other vertices. Therefore, the random walker cannot walk to the separate vertices for the DeepWalk, node2vec, and Line algorithms. For the GraRep algorithm, it was also impossible to learn the relationships between the separate vertices and other vertices, namely, the adjacency matrix was multiplied several times; however, the values in the multiplied matrix remained 0. Therefore, the NRL algorithm will get a poor performance for the sparse network containing separate vertices. Nevertheless, the NRL algorithm based on structures and vertex texts can gain satisfactory classification performance, such as the TADW algorithm. In order to fairly compare the performance of the above algorithms, we deleted all separate vertices on the Citeseer dataset as well as the DBLP dataset. The SDBLP dataset is a simplified dataset of DBLP. On the SDBLP, we only retained those vertices containing three edges at least.
The unitary and binary relationships between vertices were applied to the MRNR to improve the performance of DeepWalk. We used Equation (13) to model all the representations of triplets. The amount is shown in
Table 3.
4.2. Baseline Algorithms
DeepWalk: DeepWalk can learn network representations for large-scale networks. It is a basic algorithm of NRL, which is usually applied as a baseline algorithm. It provides two kinds of training models, such as CBOW and Skip-Gram, and it also provides two kinds of optimization methods, such as Hierarchical Softmax and negative sampling. In our experiment, we used the CBOW and negative sampling for DeepWalk.
Line: Line is a network representation learning method proposed by Tang et al. [
16]. And then Line studies the problem of encoding very large information networks into low-dimensional representation spaces. This method proposes the concept of first order proximity and second order proximity. Consequently, Line provides two kinds of models, 1st Line and 2nd Line. We use the 2nd Line model in this paper.
node2vec: Node2vec also adopts the BFS and DFS strategies to capture higher order neighboring vertices. Meanwhile, node2vec defines a second-order random walk to balance the DFS and BFS. The random walk path of node2vec is controlled by a parameter. Unlike the random walk of DeepWalk, the probability from the current vertex to next vertex is not exactly equal.
GraRep: GraRep learns the network representations by probability transition matrix, the probability transition matrix of the first order is , where is the adjacency matrix, and is the diagonal matrix. The probability transition matrix of k-th order is . In this paper, we set the k value to three, which means that GraRep could capture the neighboring vertices of the first order, second order, and third order.
Text Feature (TF): We took the vertex’s text feature matrix as the 100 dimensional representations of the network vertices.
DeepWalk + TF: We concatenated two vectors from DeepWalk and text feature to obtain the 100 dimensional representations of network vertices.
DeepWalk as Matrix Factorization (MFDW): DeepWalk has proved that it factorizes the matrix
. Here, we used the singular value decomposition (SVD) [
34] algorithm to factorize the matrix
M. The network representation vectors are calculated by the expression
.
TADW: The TADW incorporates text features of the networks into network representations with the IMC [
7]. And it factorizes the matrix
, where
consists of the reciprocal of the degree value of the vertex.
Simplified TADW (STADW): Because TADW adopts normalization to optimize text features two times. The first optimization is conducted before SVD factorization of text features and the second optimization is performed after SVD factorization. In STADW, we deleted the optimization procedures for the text feature, because the MRNR proposed in this paper simply adopted the unitary and binary vertex relationships, which are not optimized by the normalization methods.
MRNR@1: MRNR uses the unitary relationships to optimize the performance of NRL.
MRNR@2: MRNR uses the binary relationships to optimize the performance of NRL.
MRNR@1 + NEU: the proposed MRNR uses the unitary relationships to optimize the performance of NRL, meanwhile, the learnt representations are optimized by NEU.
MRNR@2 + NEU: the proposed MRNR uses the binary relationships to the performance of NRL, meanwhile, the learnt representations are optimized by NEU.
4.3. Classifiers and Experiment Setup
We conducted our experiments on the Citeseer, DBLP, and SDBLP datasets. We used the network classification task to verify the performance of MRNR. The classifier uses SVM implemented by Liblinear [
35]. In addition, we randomly took a portion of labeled data as a training set and the rest was a testing set. We evaluated the accuracy of the classification based on the different proportions of training sets. This proportion varied from 10% to 90%. For the above baseline algorithms, we set the dimension size as 100, walk length as 40, walk number as 10, window size as 5, negative number as 5, and minimum node frequency as 5. The minimum vertex frequency means that the algorithm will discard some vertices that appear less than five times in the random walk sequences. Note that the weight of the triplet was set to 0.5 in
Section 4.4. We repeated our experiment 10 times and reported the average accuracy in the following experiments.
4.4. Experimental Results and Analysis
The classification results are shown in
Table 4 (Citeseer),
Table 5 (DBLP), and
Table 6 (SDBLP). The MRNR consistently and significantly outperformed the most baseline algorithms on different training proportions, showing its feasibility on network vertex classification tasks.
(1) the introduced MFDW is a matrix factorization form of the DeepWalk algorithm. The performance of the MFDW algorithm was better than that of DeepWalk for the three datasets. The performance of TF was better than that of DeepWalk for the Citeseer and DBLP datasets. In addition, the performance of TF was better than that of Line, achieving an almost same performance with DeepWalk on the SDBLP dataset. The main reason why MFDW can achieve a better performance is that all vertices in MFDW participate and construct the structural feature matrix. Nevertheless, the DeepWalk algorithm avoids accurately calculating the structure feature matrix. Because TADW is an algorithm based on the MFDW, which incorporates the vertex texts into network representations, therefore, TADW can obtain a better performance and outperform the other baseline algorithms. In addition, TADW uses the inductive matrix completion algorithm rather than a simple SVD factorization. Therefore, the performance of inductive matrix completion can greatly prompt the performance of TADW to a certain extent. The performance of DeepWalk + TF shows that it is difficult to obtain performance improvement by concatenating two representations from DeepWalk and text features. In addition, the experimental results have proved that modeling the triplet relationships generally improves the performance of the original DeepWalk. Indeed, the proposed learning framework in this paper can be applied to other types of models.
(2) The performance of the MRNR@1 was better than that of TADW, DeepWalk, node2vec, MFDW, Line, and TF on the Citeseer, DBLP, and SDBLP. The performance of the MRNR@2 was slightly inferior than TADW on the Citeseer and DBLP. However, the performance of the MRNR@1 and MRNR@2 was superior to that of TADW on the SDBLP. The average degrees of Citeseer, DBLP, and SDBLP were 2.57, 11.936, and 25.339. The mean differences between MRNR@1 and TADW were 4.64%, 2.33%, and 1.6% on the Citeseer, DBLP, and SDBLP. It demonstrates that the performance differences were decreasing with the growth of the average degree. On the SBDLP dataset, although all baseline algorithms almost had the same performance, MRNR@1 and MRNR@2 achieved the best performance.
(3) The classification performance of the MRNR@1 was better than that of the MRNR@2, which demonstrated that the more triplets between vertices, the better the performance of the MRNR. However, the number of triplets had little impact on the performance of network representation learning on the dense SDBLP dataset. In addition, the learnt network representations were optimized by the NEU algorithm, therefore, the NRL performance of the MRNR@1 and MRNR@2 achieved significant improvement on the Citeseer and DBLP datasets. On the DBLP dataset, the optimization effect of NEU was not as good as that on the Citeseer and DBLP.
(4) the introduced TADW algorithm and the proposed MRNR algorithm also used text features to enhance the performance of network representation learning. More specifically, TADW used matrix factorization to incorporate the text features into network representations, but the MRNR adopted vertex triplets constructed by text features to constrain the modeling procedure of the MRNR. In the MRNR algorithm, we set the minimum vertex frequency to 5, which means these vertices with the degree value of less than 5 will be deleted in the procedure of random walk sampling. The influence of this behavior is that vertices of small occurrence frequency are not be input into the model to learn as the context vertices, which are only trained when they are the current vertices. In the TADW algorithm, all the vertices take part in the training procedure. The purpose of setting the minimum vertex frequency is to speed up the convergence of the model. Therefore, deleting low-frequency vertices in contexts can help improve the performance of network representation learning. However, STADW is a simplified algorithm based on TADW, which deletes all optimizations of text features, consequently, the performance of STADW is inferior to that of TADW on three datasets.
4.5. Parameter Sensitivity
The proposed MRNR algorithm converts the texts of the network vertices into the triplet form, and then MRNR concatenates the objective of the triplet constraint to the that of DeepWalk. In order to research the effect of the triplet on NRL, the weight parameter
was added to the constraint item of the triplet in Equation (14). By setting a weight value that varies from 0.1 to 0.9, we counted the accuracy of the classification tasks under different proportions of training datasets that ranged from 10% to 90% for each fixed weight value, and we then calculated the average accuracy in the last column. Because the classification performance of the triplets consisted of unitary relationships, it was better than that of the triplets composed of binary relationships; therefore, we only considered the triplets of binary relationships in this experiment. The detailed results are shown in
Table 7,
Table 8 and
Table 9.
As shown in
Table 7,
Table 8 and
Table 9, the classification accuracy slightly varied within 1%, with the increasing weight of the triplet on the DBLP and SDBLP datasets. However, the fluctuation of classification accuracy was relatively clear on the Citeseer dataset. Compared with the triplet weight of 0.1, the classification accuracy of the triplet weight of 0.9 approximately improved by 5.89%. In addition, the Citeseer dataset was a sparse network, and the DBLP and SDBLP datasets were dense networks. In conclusion, we found that the weight of the triplet had a great influence on the representation performance of sparse network representation learning, but the weight of the triplet had little effect on the representation performance of the dense network representation learning. The main reason was that the sufficient structural features enable all kinds of algorithms to almost possess the same performance on dense networks. On sparse networks, the opposite was true.
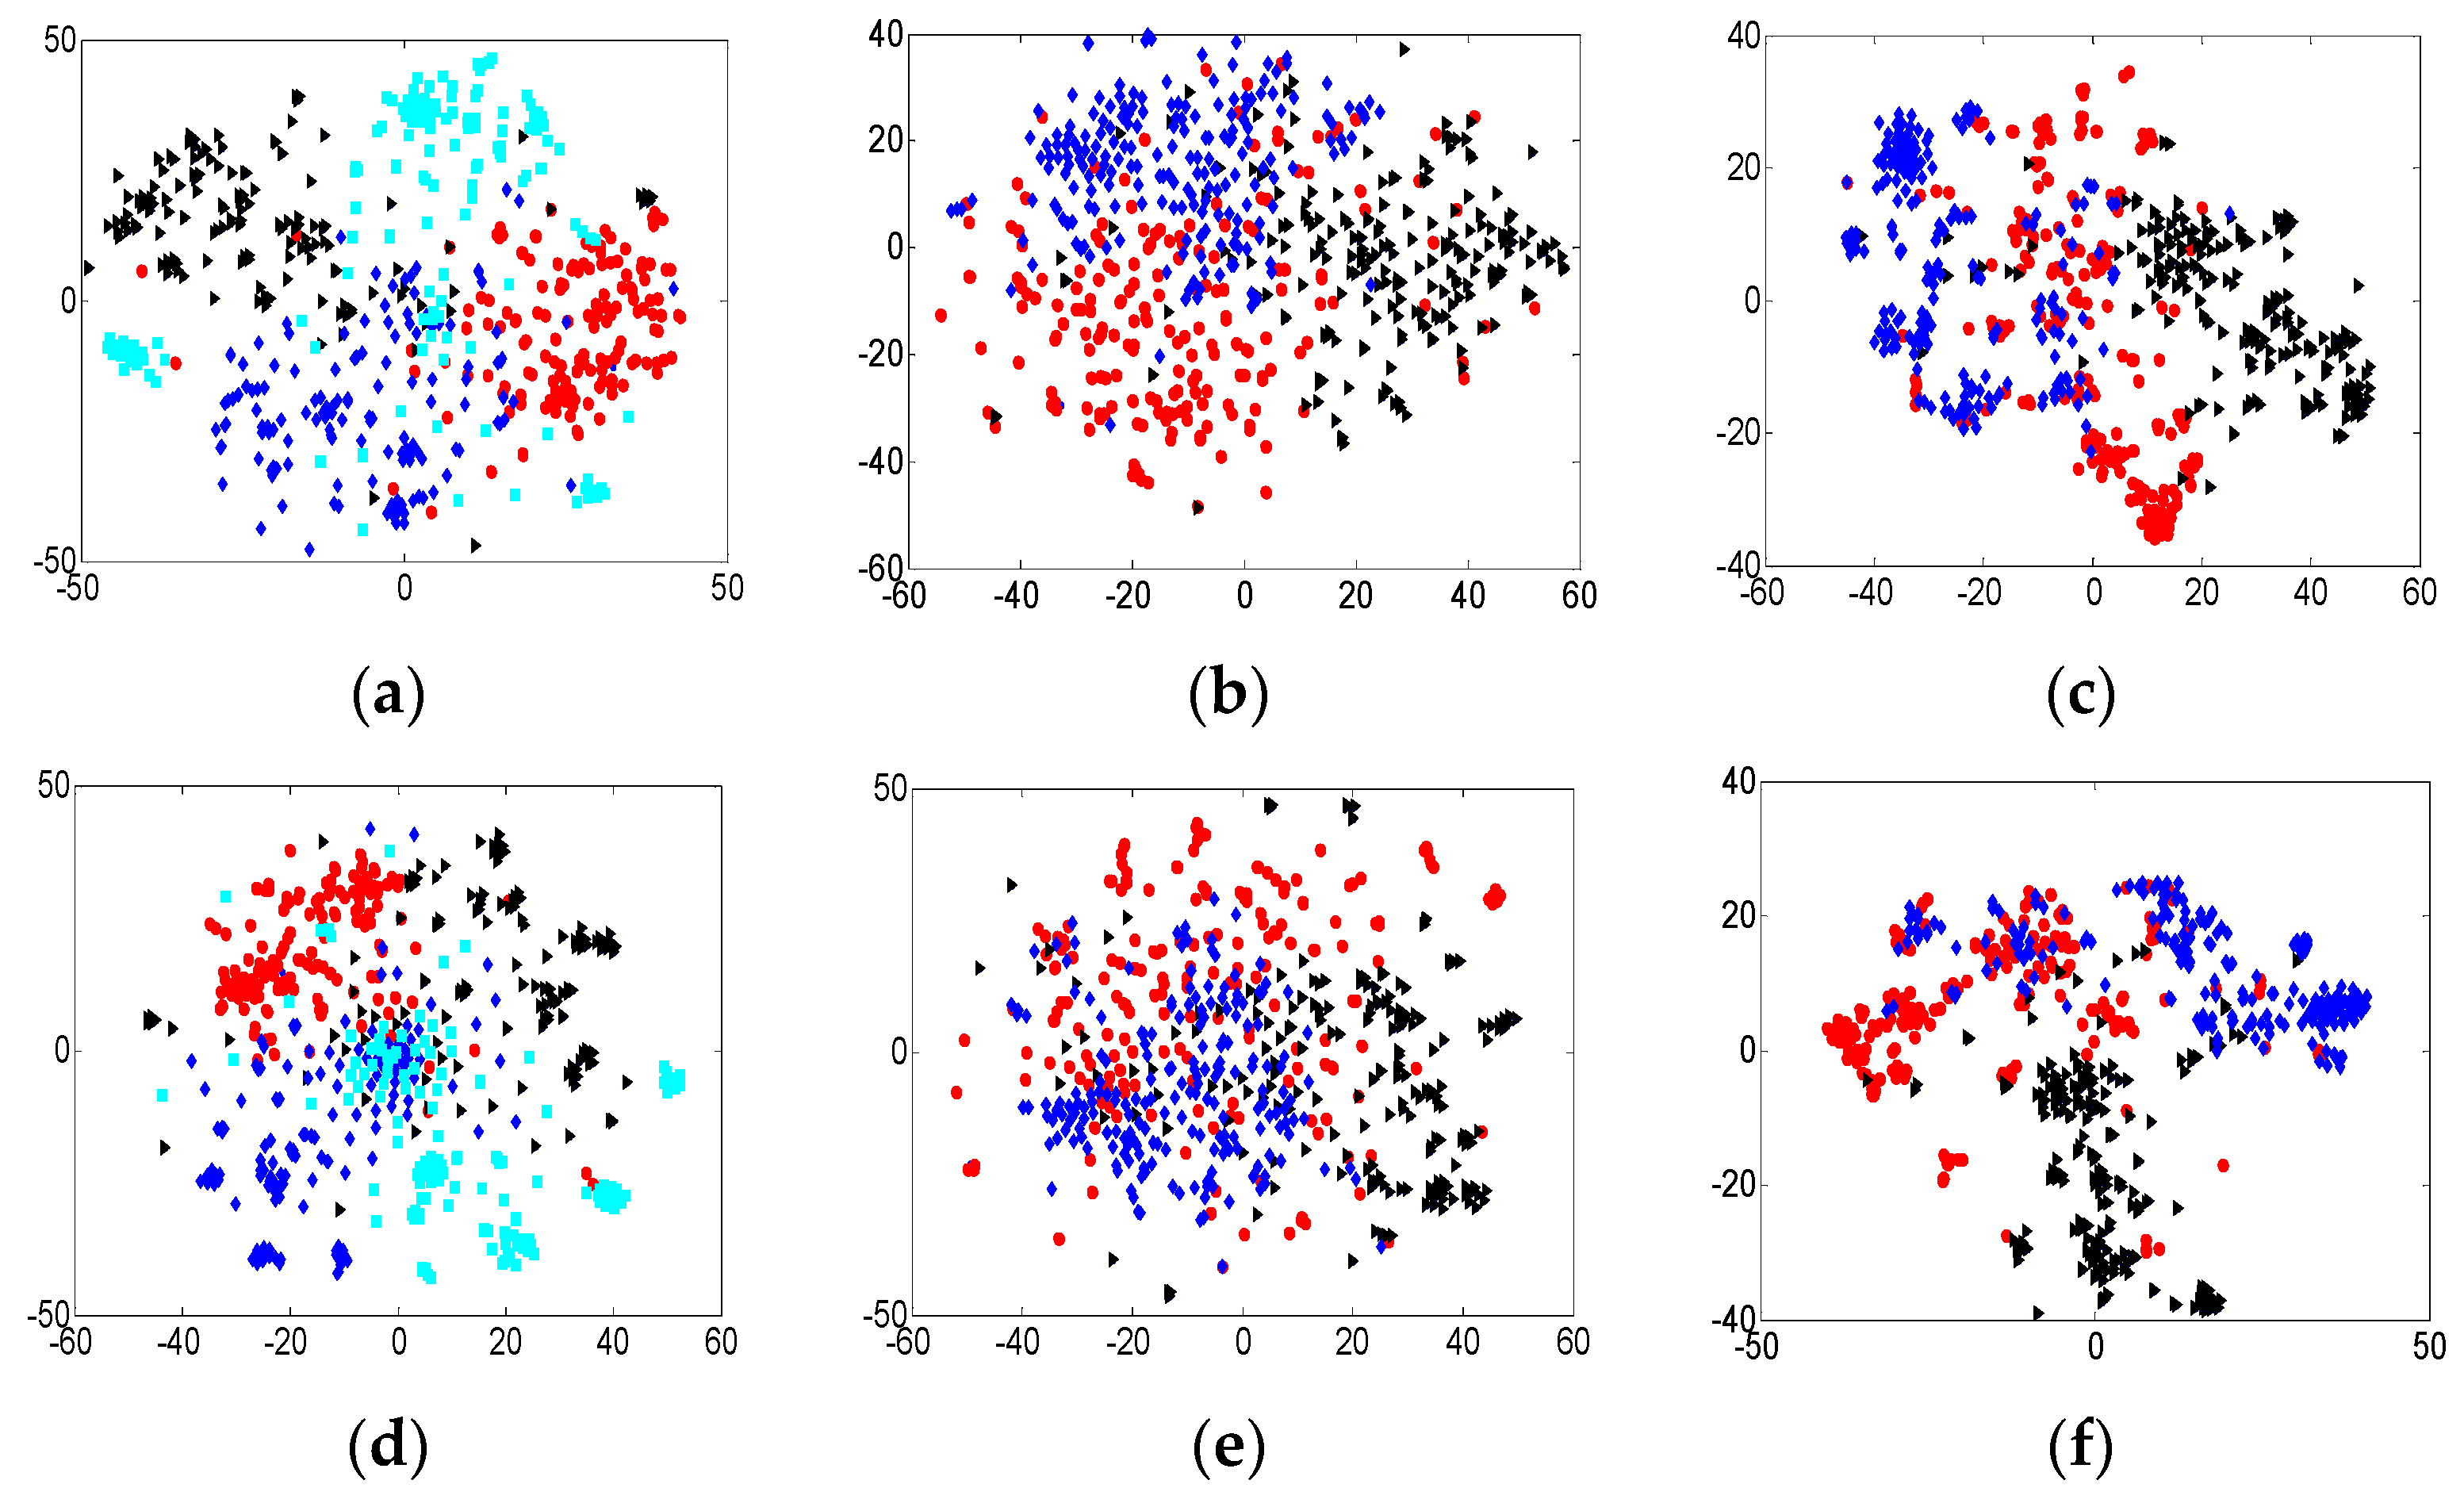
4.6. Visualizations
In the previous sections, we used classification tasks to verify the performance of the MRNR on the Citeseer, DBLP, and SDBLP. In this section, we explore the clustering ability of the learnt representations. We first randomly chose four network categories on the Citeseer and three categories on the DBLP and SDBLP. Each category contained 150 vertices on the Citeseer and 200 vertices on the DBLP and SDBLP. We used the t-SNE [
36] algorithm to visualize the learnt representation vectors. The visualization results are shown in
Figure 2.
As shown in
Table 2, the amount of triplets constructed by the unitary relations was more than that of the triplets constructed by binary relations, meanwhile, the amount of unitary relations was more than that of the binary relations on the Citeseer, DBLP, and SDBLP. Consequently, the visualization results show that the clustering ability of MRNR@1 is superior to that of MRNR@2 on the Citeseer and DBLP, and they almost achieved the same clustering performance on the SDBLP. The visualization experiments show that the number of triplets would affect the visualization and clustering performance on the sparse networks, namely, enough triplets would contribute to the feature learning. Consequently, we can obtain excellent representation vectors if the massive triplets are introduced into network representation learning on the sparse networks. On the dense networks, the influence of the number of triplets on visualization is negligible. Moreover, the results of visualization are just consistent with the results of classification in
Table 4,
Table 5 and
Table 6. Therefore, the feasibility of the proposed MRNR algorithm is confirmed from these two experiments.
4.7. Case Study
The proposed MRNR can learn the network representations using multi-relational data. In this section, we take a vertex’s title as an example to conduct an instance study on the Citeseer dataset. The target title is “An Evolutionary Algorithm That Constructs Recurrent Neural Networks”. Based on DeepWalk, TADW, MRNR@1, and MRNR@2, we then found the most relevant vertices using the cosine similarity method. We obtained the top three nearest neighboring vertices in
Table 10. The triplet weight was set as 0.5 in this experiment.
As shown in
Table 10, TADW uses a text feature matrix to improve the performance of network representation learning and MRNR applies the knowledge-based triplets to improve the performance of network representation learning, consequently, both TADW and MRNR show text generality and similarity based on the learnt representations. For example, the titles generated by TADW, MRNR@1, and MRNR@2 contain the same word “Neural Networks” or “Evolutionary”. This kind of representations trained by MRNR can be used for various tasks, such as recommendation systems, webpage ranking, etc. This example demonstrates that TADW and MRNR learn the network representations by balancing the weight between the structural feature similarity and text similarity.
5. Conclusions
In this paper, we introduced the idea of knowledge representation learning into the network representation learning, which is that we used knowledge triplets to constrain the training procedure of network representation learning. Consequently, we proposed a new network representation learning algorithm, MRNR, which uses the vertex’s texts to construct unitary and binary triplets between vertices. To testify the performance of MRNR, we conducted classification, visualization, and case study experiments on the Citeseer, DBLP, and SDBLP datasets. We found that the greater the number of triplets between vertices, the higher the accuracy of network classification, and the same results were obtained in visualization tasks. In this paper, we specially compare the classification performance of MRNR with the TADW algorithm. We found that the classification performance of TADW was inferior to that of the MRNR algorithm on the Citeseer, DBLP, and SDBLP. The MRNR and TADW also adopted text features to improve the performance of network representation learning. The difference was that TADW converts text features into a text matrix and MRNR converts the text features into knowledge-based triplets. Finally, according to the application requirements, we should choose the appropriate algorithm between MRNR and TADW. The MRNR algorithm proposed in this paper is more suitable for the task of large-scale network representation learning using text features due to its effectiveness. For small-scale networks, the matrix factorization-based TADW algorithm is also a suitable approach.

 ,
, 
