Article

Novel Transformer Fault Identification Optimization Method Based on Mathematical Statistics

1
State Key Laboratory of Power Transmission Equipment & System Security and New Technology, Chongqing University, Chongqing 400044, China
2
Quzhou Power Supply Company, State Grid Zhejiang Electric Power Co., Ltd., Quzhou 324002, China
*
Author to whom correspondence should be addressed.
Mathematics 2019, 7(3), 288; https://doi.org/10.3390/math7030288
Submission received: 7 December 2018 / Revised: 13 March 2019 / Accepted: 15 March 2019 / Published: 21 March 2019

Abstract

:
Most power transformer faults are caused by iron core and winding faults. At present, the method that is most widely used for transformer iron core and winding faults identification is the vibration analysis method. The vibration analysis method generally determines the degree of fault by analyzing the energy spectrum of the transformer vibration signal. However, the noise reduction step in this method is complicated and costly, and the effect of denoising needs to be further improved to make the fault identification results more accurate. In addition, it is difficult to perform an accurate determination of the early mild failure of the transformer due to the effect of noise on the results. This paper presents a novel mathematical statistics method based on the vibration signal to optimize the vibration analysis method for the short-circuit failure of the transformer winding. The proposed method was used for linear analysis of the transformer vibration signal with different degrees of short-circuit failure of the transformer winding. By comparing the slope value of the transformer vibration signal cumulative probability distribution curve and analyzing the energy spectrum of the signal, the degree of short-circuit failure of the transformer winding was identified quickly and accurately. This method also simplified the signal denoising process in transformer fault detection, improved the accuracy of fault detection, reduced the time of fault detection, and provided good predictability for early mild faults of the transformer, thereby reducing the hidden hazards of operating the power transformer. The proposed optimization procedure offers a new research idea in transformer fault identification.

1. Introduction

After a transformer has been used for a long time, various losses cause the transformer to malfunction due to its complicated internal structure. Only monitoring the operating state of the transformer accurately and timely can ensure the reliable and safe operation of the power system [1,2]. Transformer fault is primarily caused by iron core and winding faults. The winding fault is mainly due to the winding deformation and the iron core failure is mainly caused by the looseness of the core. The winding coil is one of the main components that caused the transformer fault [3,4,5].
Traditional methods for identifying transformer winding and iron core faults are low voltage pulse method and frequency response analysis method. The former method overcomes the shortcomings of the impedance analysis method, but this method is not ideal for anti-interference and repeatability in the practical application. In addition, factors, such as the double-shielded cable, the grounding wire arrangement, and surrounding objects, etc., all have influences on the test results. Compared with the low-voltage pulse method, the frequency response analysis method has a strong anti-interference ability and good measurement repeatability, which gives relatively higher sensitivity than the low-voltage pulse analysis method. However, it also requires a large amount of historical data. The lack of historical data of the transformer makes the promotion of this method difficult. These methods are based on the electrical model of the transformer windings. Accurate judgment can be made when the transformer windings are significantly deformed, but the sensitivity is not high when detecting windings that are loose or slightly deformed [6].
The vibration method has been an emerging method of transformer fault identification technology in recent years. By examining the vibration signals of the iron core and winding, this method can promptly and accurately monitor the working conditions of a transformer [7,8,9]. The components of a power transformer that can generate vibrations mainly include iron cores, windings, and cooling devices. Iron core vibration is attributed to the magnetostrictive silicon steel sheet and winding vibration is normally caused by the load current and magnetic flux loss [10,11]. When the vibration method is used to monitor transformer operation, an energy spectrum analysis of the collected vibration signals should be performed. In this process, the signal must be noise-reduced, and the effective signal can be separated and analyzed. However, several filter units are required to process the noise and facilitate its reduction, resulting in a relatively high cost of noise reduction. In addition, the current signal separation technology is complicated to implement in practical technical applications [12]. If noise reduction is unsatisfactory, then an energy spectrum analysis of the signal using the vibration method cannot quickly and accurately detect the faulty degree of the transformer. The safety hazard of the transformer then cannot process in a timely manner, which also reduces the safety and reliability of network operation. In order to solve these problems, Reference [13] proposed an improved algorithm for solving the band interleaving and aliasing of wavelet packet algorithm. The wavelet packet energy feature analysis obtained by this algorithm is used to determine the transformer winding deformation. However, this method requires multiple short-circuit current surges on the transformer windings, resulting in errors in the results, and the degree of deformation of the windings cannot be recognized. Reference [14] provided a blind source separation method for transformer winding and iron core vibration signal based on subband decomposition independent component analysis (SDICA). The method can directly separate the winding and iron core vibration signals, which can determine the phase of the transformer where the fault occurs. However, the error is large and the degree of failure cannot be identified. Reference [15] established a fault diagnosis model of transformer winding deformation, and proposed the diagnosis method based on the model. It can not only diagnose the fault inside the transformer winding but also judge the fault type and perform preliminary fault location. Yet, this method cannot identify the fault degree of the transformer. Reference [16,17,18] proposed the concept of a health index to assess the degree of aging of transformers and used the health index to effectively assess the physical health of the transformer, thus determining the probability of a transformer failure. However, the health index does not actually determine the degree of transformer failure that has failed. The health index is used more to provide justification for a capital plan which includes end-of-life asset replacement. Reference [19,20,21] proposed effective transformer fault identification methods, but these transformer fault identification methods mainly identify the type of transformer faults rather than the degree of faults. These methods can identify transformer faults, such as discharge fault, thermal fault, and partial discharge. However, these methods cannot determine the degree of transformer failure nor the transformer winding and core failure. The transformer fault identification method proposed in these articles, which identifies the actual type of transformer fault, is only effective in improving the accuracy based on the original dissolved gas analysis method.
The current study examined an optimized method of fault identification in power transformers. First, the vibration signal of the transformer was measured during transformer operation via a transformer short-circuit test. Second, the mathematical statistics method was used to analyze the probability distribution of the vibration signal. We observed that the fault degree of the transformer could be identified by comparing the slope of the vibration signal with the probability distribution after noise reduction. The optimization process could simplify signal noise reduction and optimize the transformer fault identification process. The proposed method was sensitive to the short-circuit fault detection of the winding and could quickly identify short-circuit faults of the power transformer at an early stage. The study’s results are of considerable importance for the development of transformer fault detection techniques.

2. Transformer Vibration Signal Characteristics

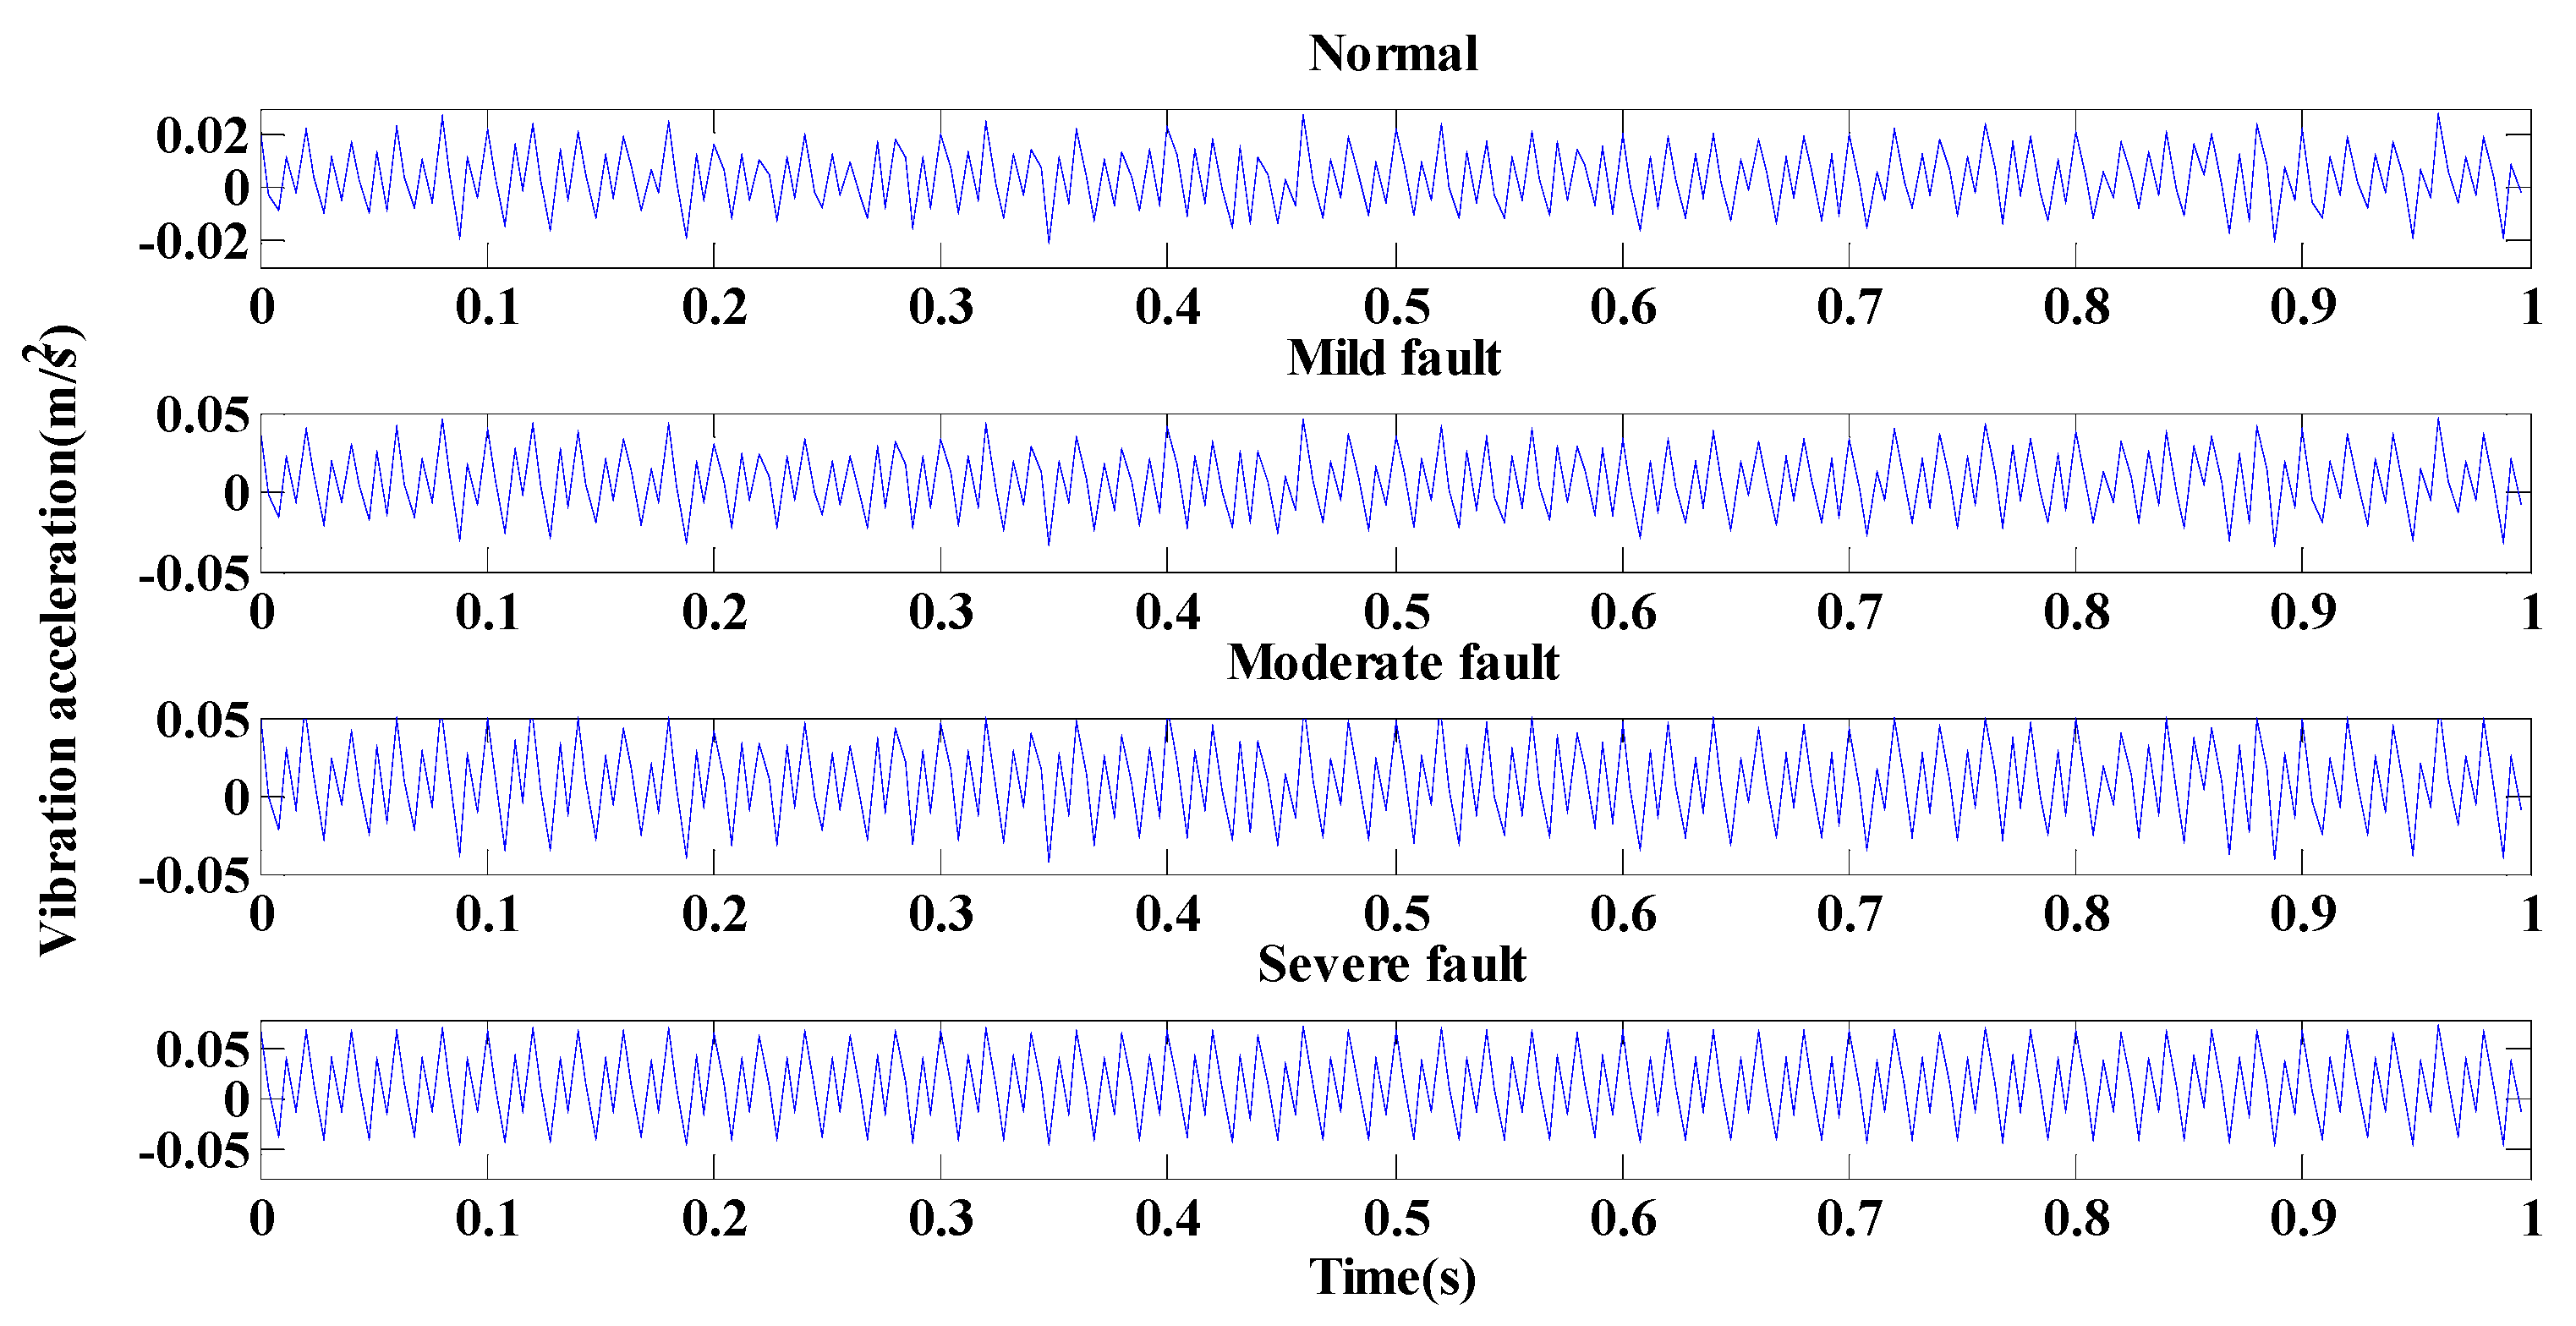
2.1. Characterization of Transformer Vibration Signals

The vibration of the transformer iron core depends on the magnetostriction of the silicon steel sheet. Therefore, under the condition that the iron core material and working temperature are constant, vibration acceleration ac of the iron core is proportional to the square of power supply voltage us [6,16].
a c u s 2
In Equation (1), we observed that the vibration of the iron core is independent of the winding current and related only to the applied voltage.
The vibration of the winding is caused by the electromagnetic force of the energized conductor in the leakage magnetic field. The vibration acceleration signal aw of the transformer winding operating stably under ideal conditions is proportional to the square of winding current Im:
a w I m 2 .
The phase difference of the vibration acceleration generated by the transformer winding and iron core is calculated in Equation (3) [5]:
ϕ = 2 ϕ 0 + β π 2
ϕ 0 and β represent the initial value of the load current of the power transformer winding and the winding parameters under fixed conditions, respectively.
The ac (iron core vibration acceleration) and aw (winding vibration acceleration) are used as vibration sources. The vibration acceleration amplitude of the vibration source radiation is calculated as:
a = ( a c 2 + a w 2 + 2 a c a w c o s ϕ ) 1 / 2
A relationship exists between the vibration acceleration amplitude and aw and ac:
| a c | | a w | a | a c | + | a w |
The vibration acceleration level can be expressed as the intensity of the vibration, and the same analogy can be applied to the noise level. The vibration acceleration level is expressed as:
L a = 20 log a a 0 .
a0 is the reference value of vibration acceleration, and the detection accuracy is set to 10−4 m/s2 according to the nature of the transformer.

2.2. Measurement of the Transformer Vibration Signal

The frequency spectrum of iron core vibration is wide, and the frequency component of winding vibration is relatively simple. In the signal measurement process, the frequency components of the winding and iron core are often mixed together, which makes it difficult to determine the type of fault.
In a transformer short-circuit test, the low-voltage side of the transformer is shorted under normal operating conditions, and a certain voltage is applied to the high-voltage side of the transformer to allow the winding current to reach the rated value. In Equation (1), we observed that the amplitude of the vibration acceleration generated by the iron core is small when no voltage is present on the low-voltage side. When the transformer has a short-circuit fault, the winding current sharply increases and occasionally increases to 20 to 30 times than the rated current amplitude, which increases the electromagnetic force of the winding and its fundamental frequency vibration. Therefore, the iron core vibration signal is negligible relative to the amplitude of the winding vibration signal in the short-circuit test [22]. Blind source separation technology can usually be used to eliminate the influence of iron core vibration on the winding signal during the measurement process. However, due to the complexity of the technical algorithm preparation process, the transformer short-circuit test was used to directly measure the vibration signal of the transformer winding, thereby simplifying signal acquisition. S-11-M-500/35 type transformer was used in this study to perform transformer short circuit test. The transformer connection group is Yyn0, the capacitance is 500 kVA, and the rated current is 8.25 A.
The vibration acceleration signal can be measured by the vibration sensor attached to the wall of the transformer tank. The transformer vibration acceleration signals of a no winding short-circuit fault, a slight winding short-circuit fault, a moderate winding short-circuit defect, and a severe winding short-circuit fault in the transformer short-circuit test were measured to obtain transformer vibration with different fault degrees and analyze the transformer fault condition. The signal amplitude is shown in Figure 1.

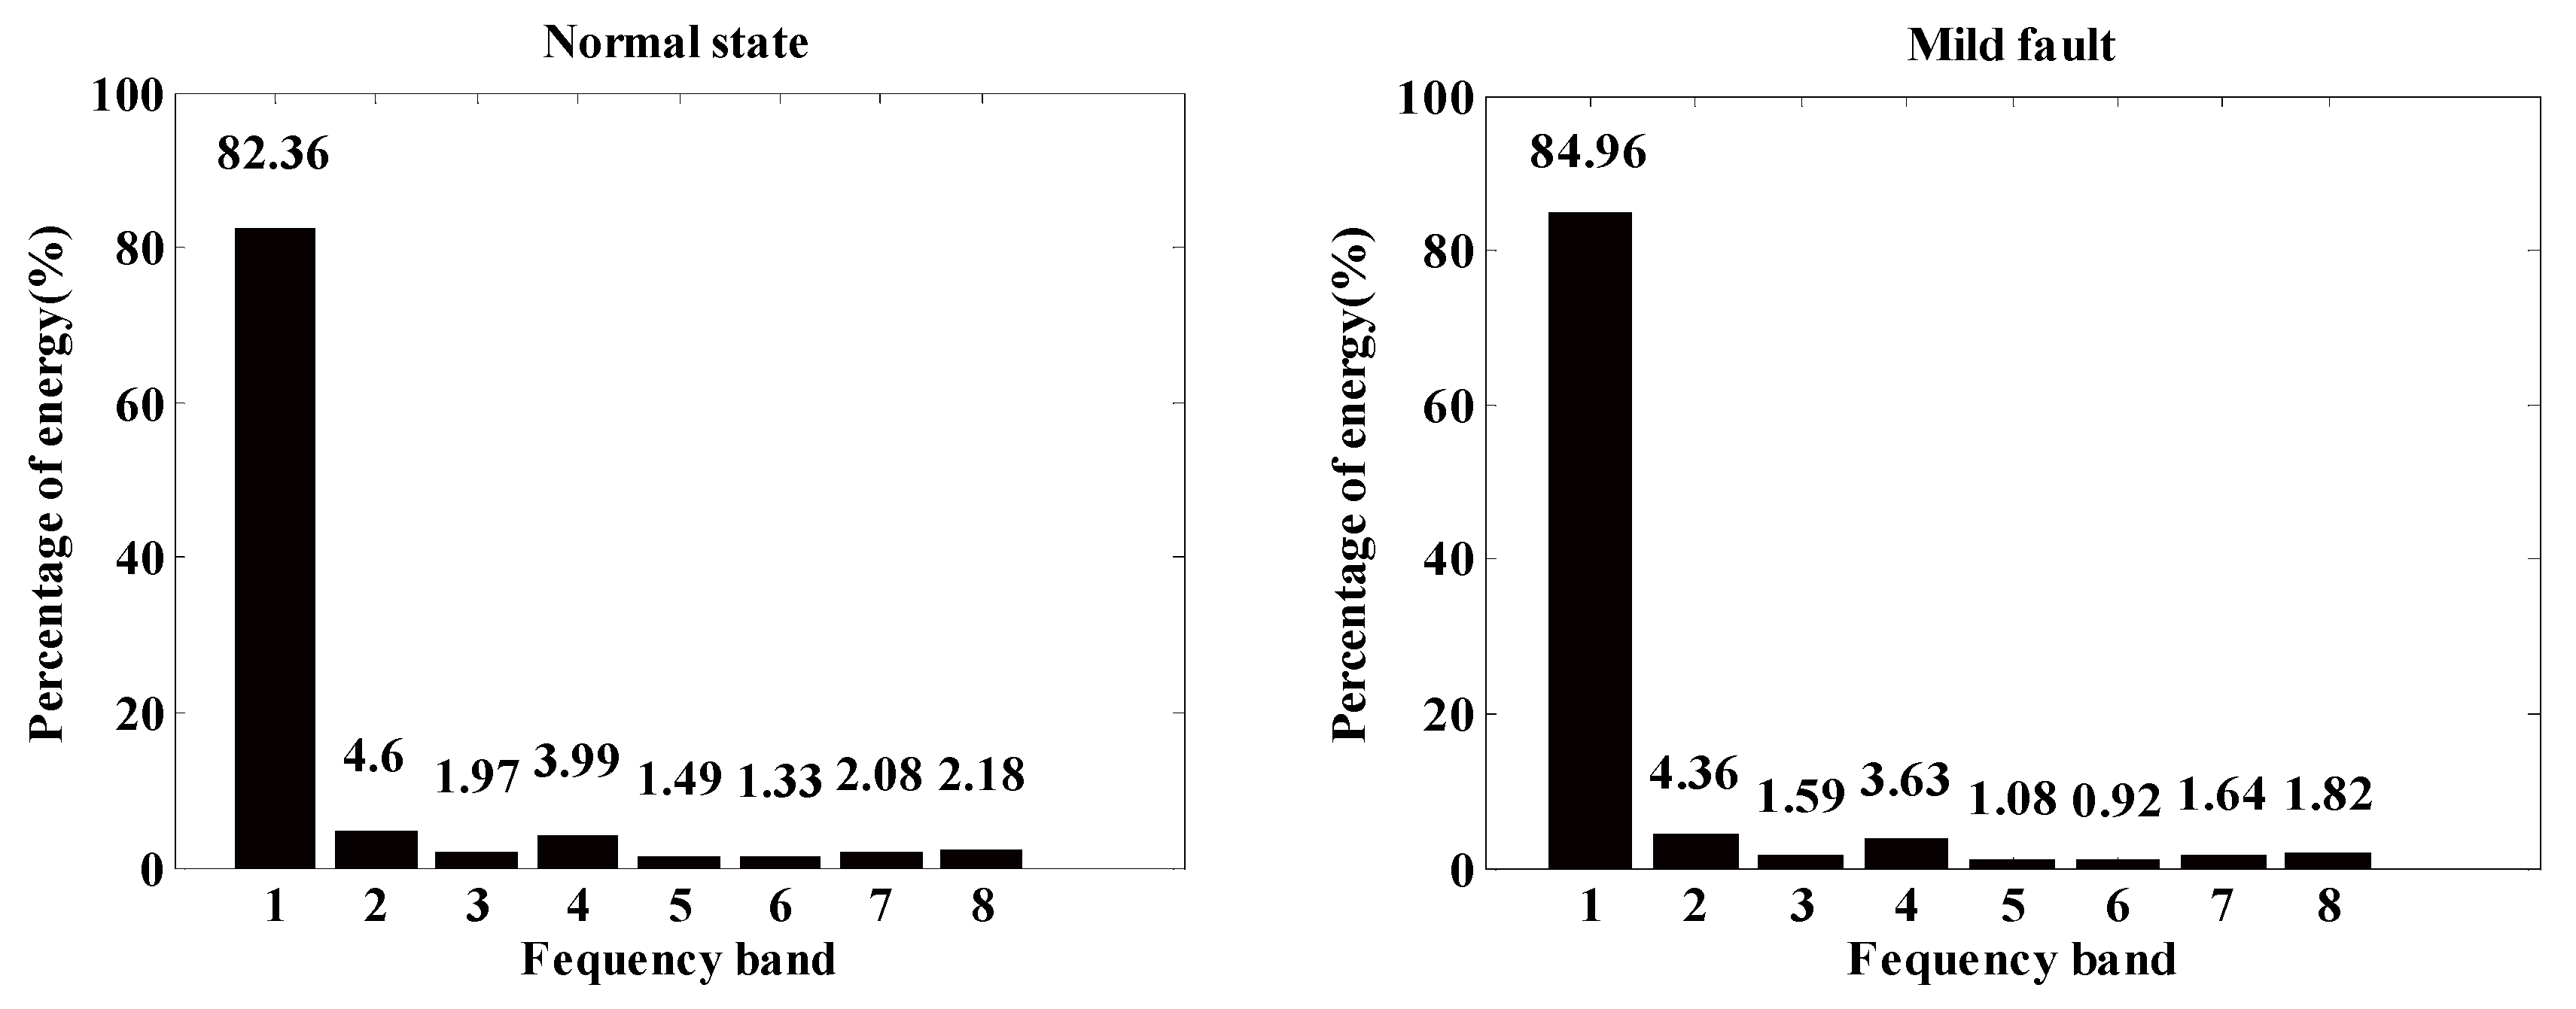
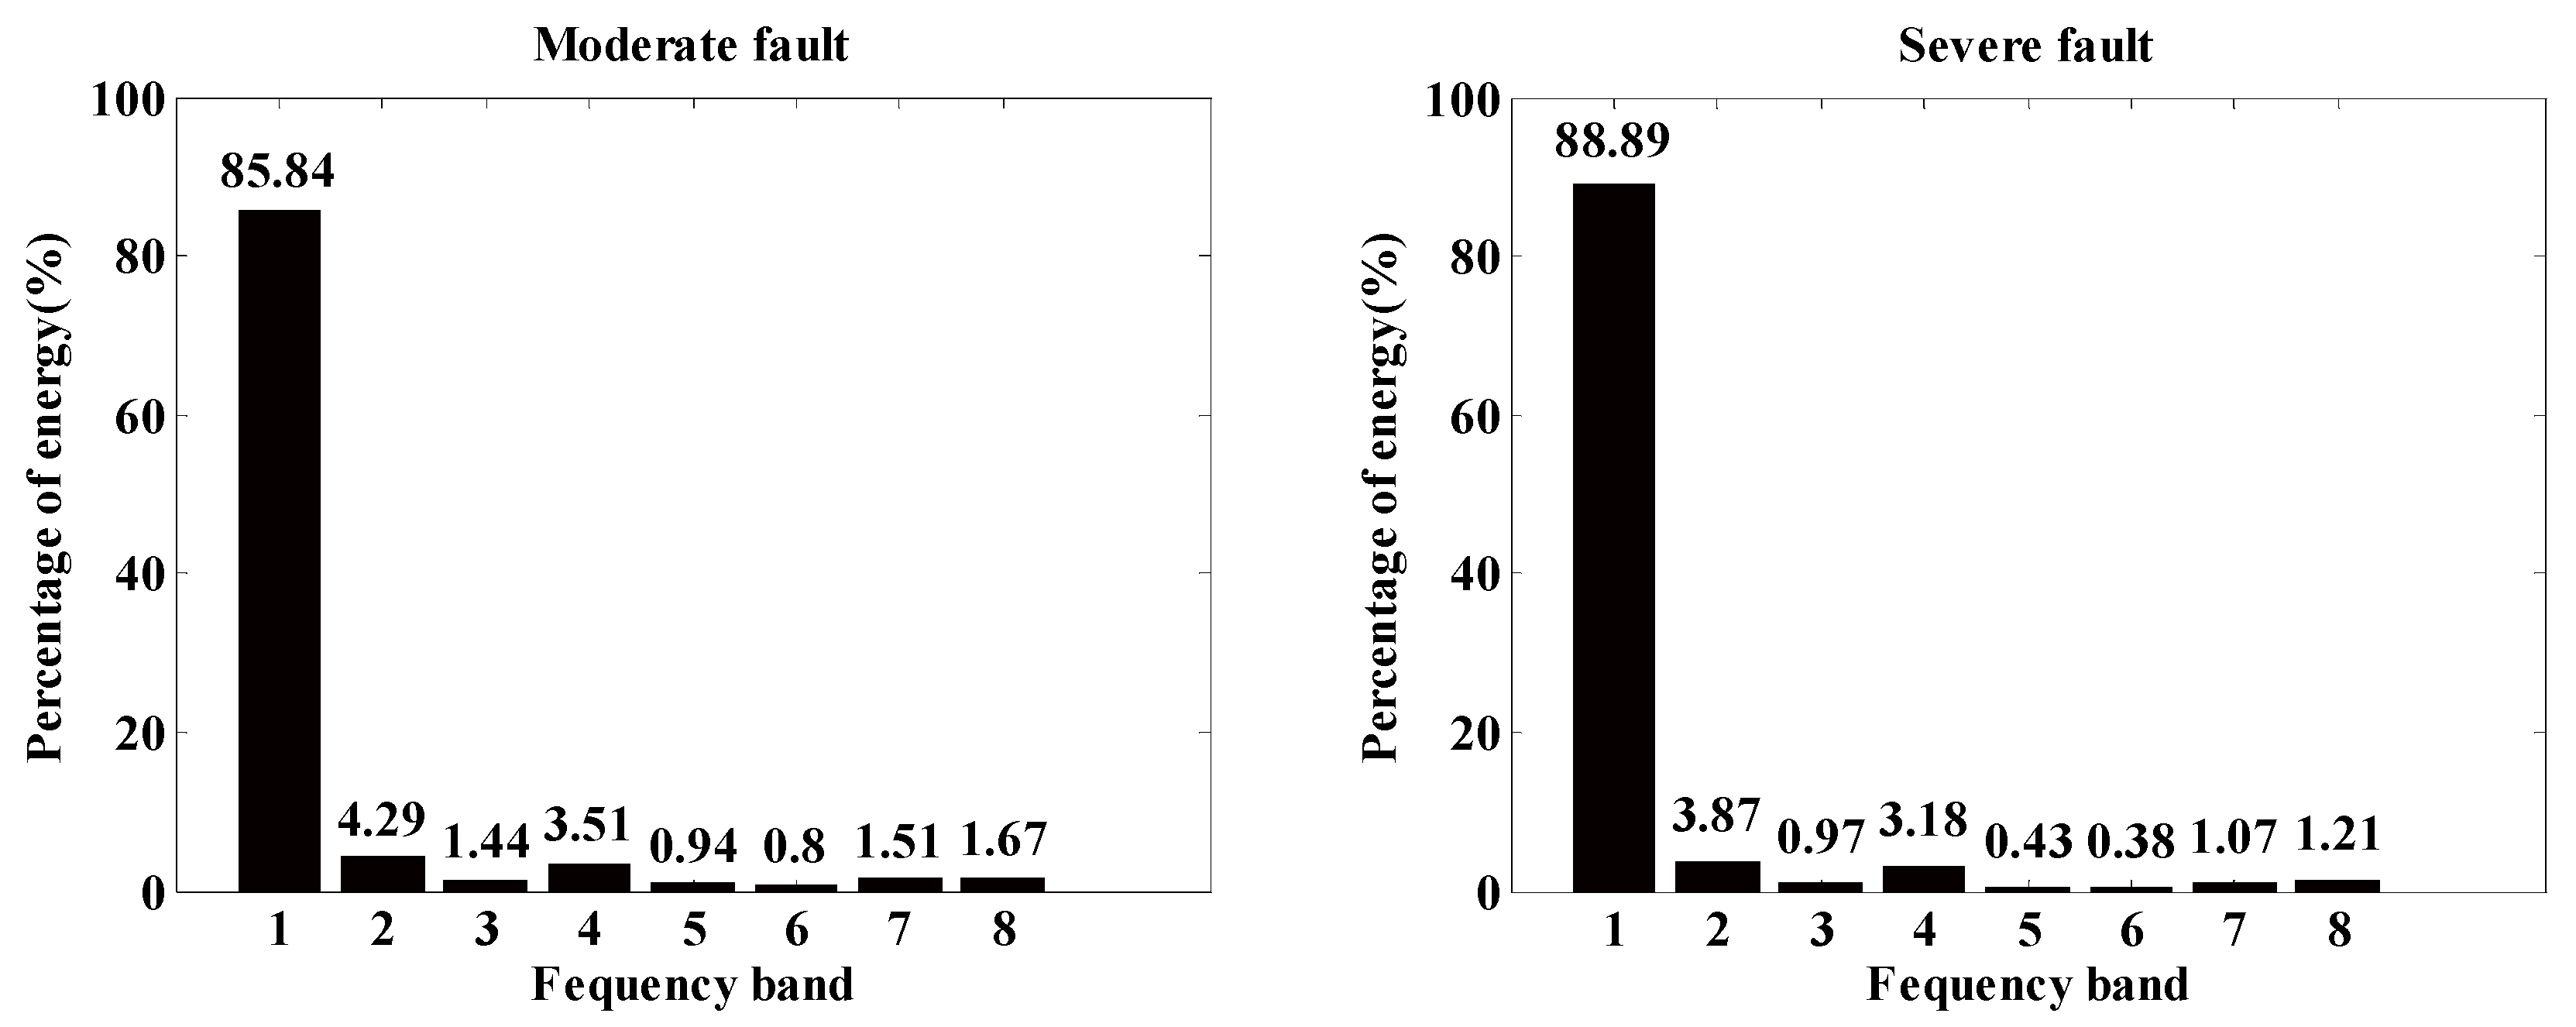
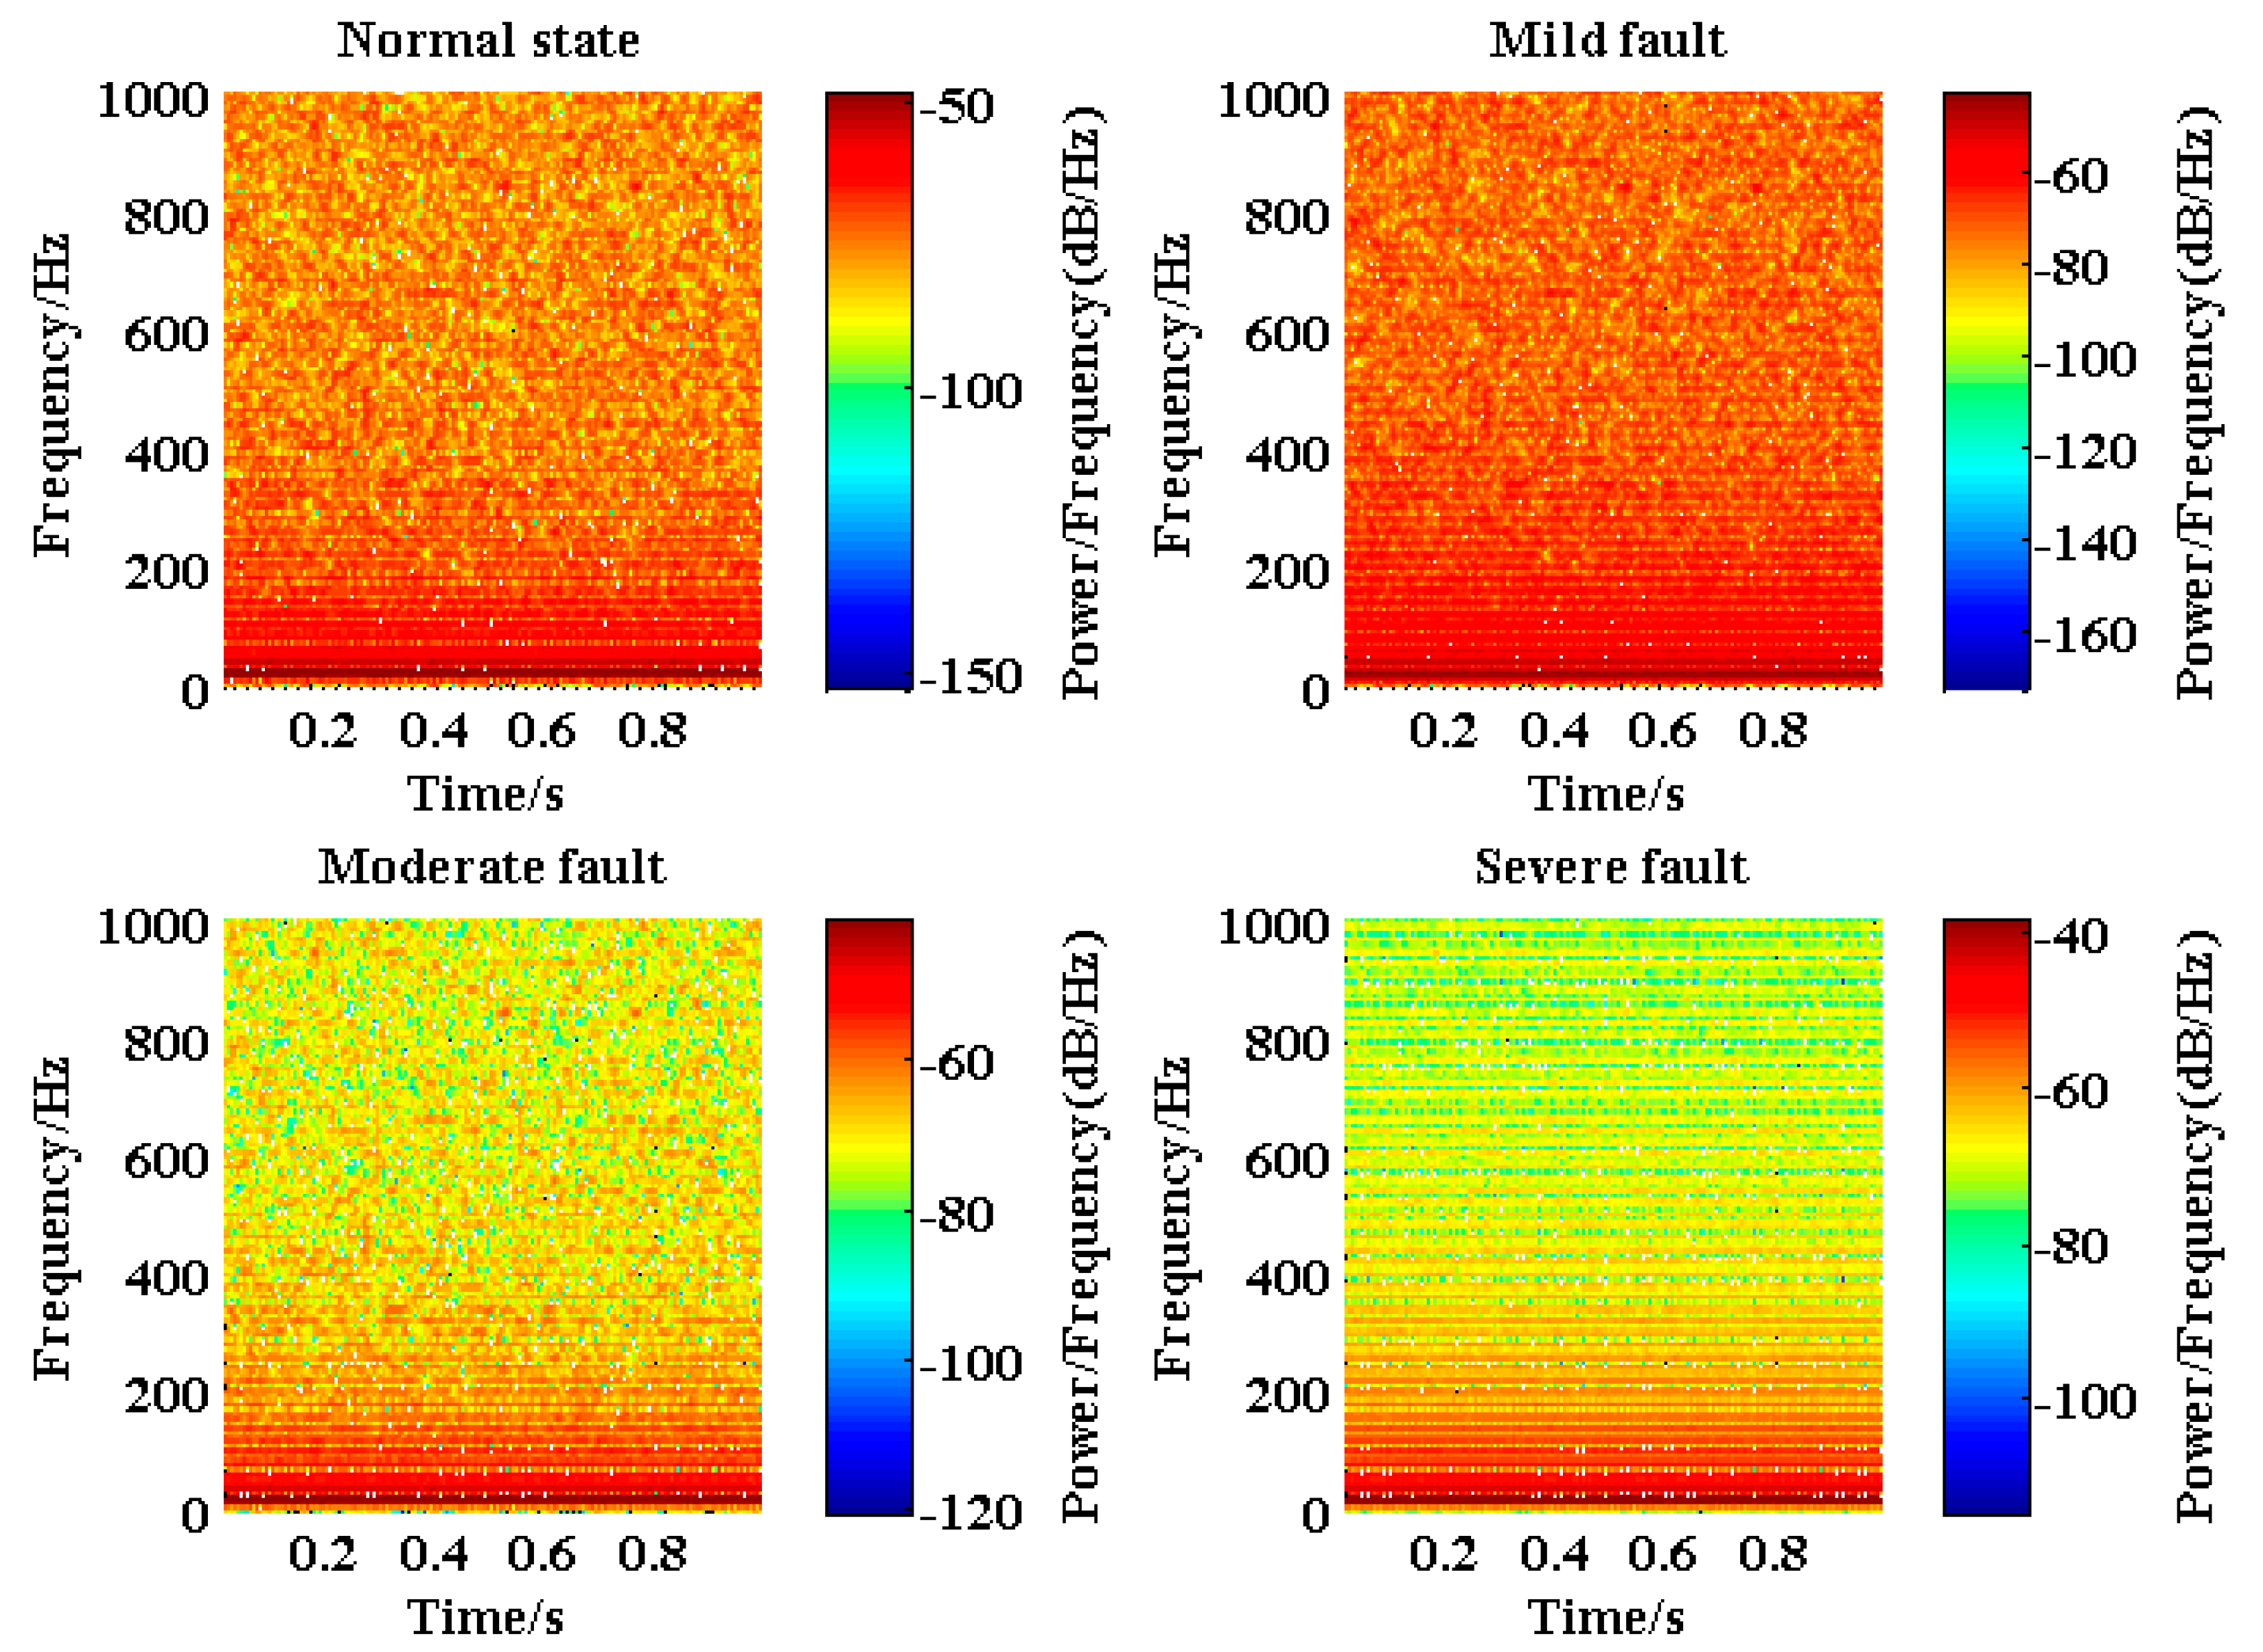
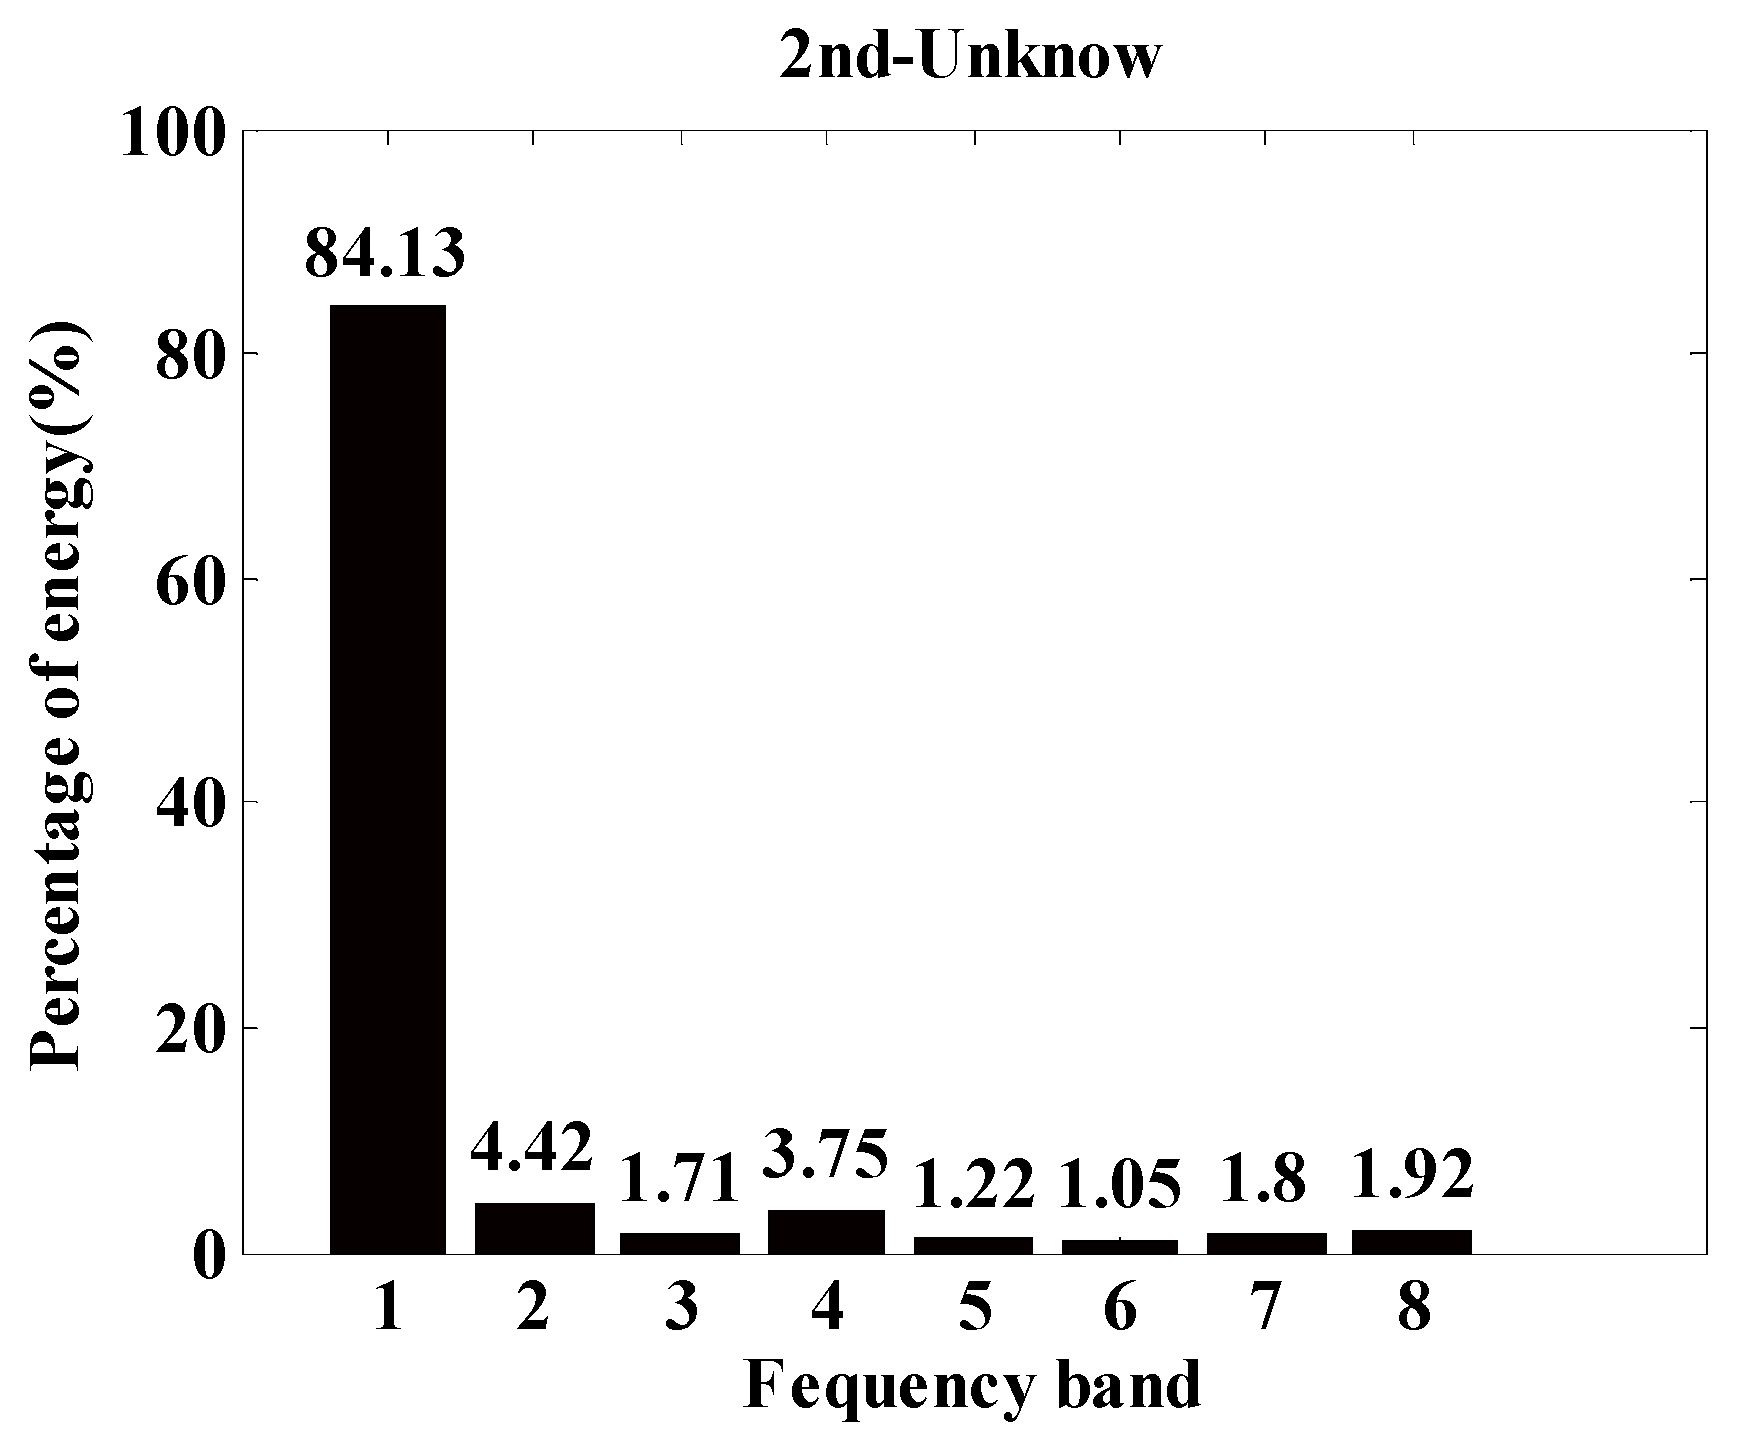
2.3. Transformer Vibration Signal Energy Spectrum Analysis

The conventional vibration method requires the determination of the energy threshold of each frequency band of the transformer vibration signal with different fault degrees, after which the transformer fault degree is identified by analyzing the energy variation of the signal. Therefore, a wavelet signal multi-frequency analysis is performed on the vibration signal. During the analysis, the scale is adjusted to quantify the energy of different frequency bands, and the frequency energy spectrum of the transformer vibration signal with different fault degrees is obtained [23].
Given that the result of decomposing the three-layer wavelet packet of the vibration signal can effectively decompose the frequency bands of the signal, the vibration signal of the normal state of the transformer and the various fault levels are completely denoised, and the three-stage wavelet coefficient is decomposed. In order to better analyze the signal, 100Hz~600Hz is evenly distributed into six frequency bands, 600-800Hz is set as one frequency band, and 800Hz is also set as one frequency band. The division method is determined by the characteristics of the transformer vibration signal [24]. Then an energy analysis is performed, and the Frequency-Band-Energy (FBE) occupation ratio threshold of the transformer vibration signal is determined in the transformer short-circuit test. Table 1 shows the threshold values of the energy content of each frequency band of the transformer vibration signal in the critical state with different fault degrees under the completely denoised condition obtained by the energy spectrum analysis. According to the method proposed in Reference [25], the transformer winding deformation degree is divided into normal state, mild winding short-circuit fault, moderate winding short-circuit fault, and severe winding short-circuit fault.
A frequency band energy diagram of the transformer vibration signal is plotted in Table 1 and shown in Figure 2. From left to right and from top to bottom, parts of this figure show the frequency band energy diagram of the transformer, representing the critical state of the normal state, middle winding short-circuit fault, moderate winding short-circuit fault, and severe winding short-circuit fault, respectively. The bars from left to right in the figure indicate the energy percentage in the different frequency ranges from low to high vibration signals. The vibration signal energy generated by the transformer is mostly in the low-frequency range of 100–500 Hz. When the winding of the power transformer has a short-circuit fault, the amplitude of the low-frequency vibration in the time domain distribution increases and the amplitude of the high-frequency vibration in the frequency domain distribution increases. The 100 Hz main frequency vibration exhibits the most evident increase. The distribution of the high- and low-frequency energy of the vibration signal changes considerably and the proportion of low-frequency energy increases [25]. In transformer fault identification, the fault is mainly identified by the change in the energy ratio of the fundamental frequency (1st frequency band).
However, the energy spectrum analysis of the signal in the conventional vibration method places high demands on noise reduction and separation technology. If the denoising effect or the signal separation result is not good, the vibration signal will be mixed with more high-frequency signals, resulting in incorrect recognition results. Therefore, the method must be optimized to achieve the purpose of the technical application.

3. Optimization Method for Transformer Fault Identification

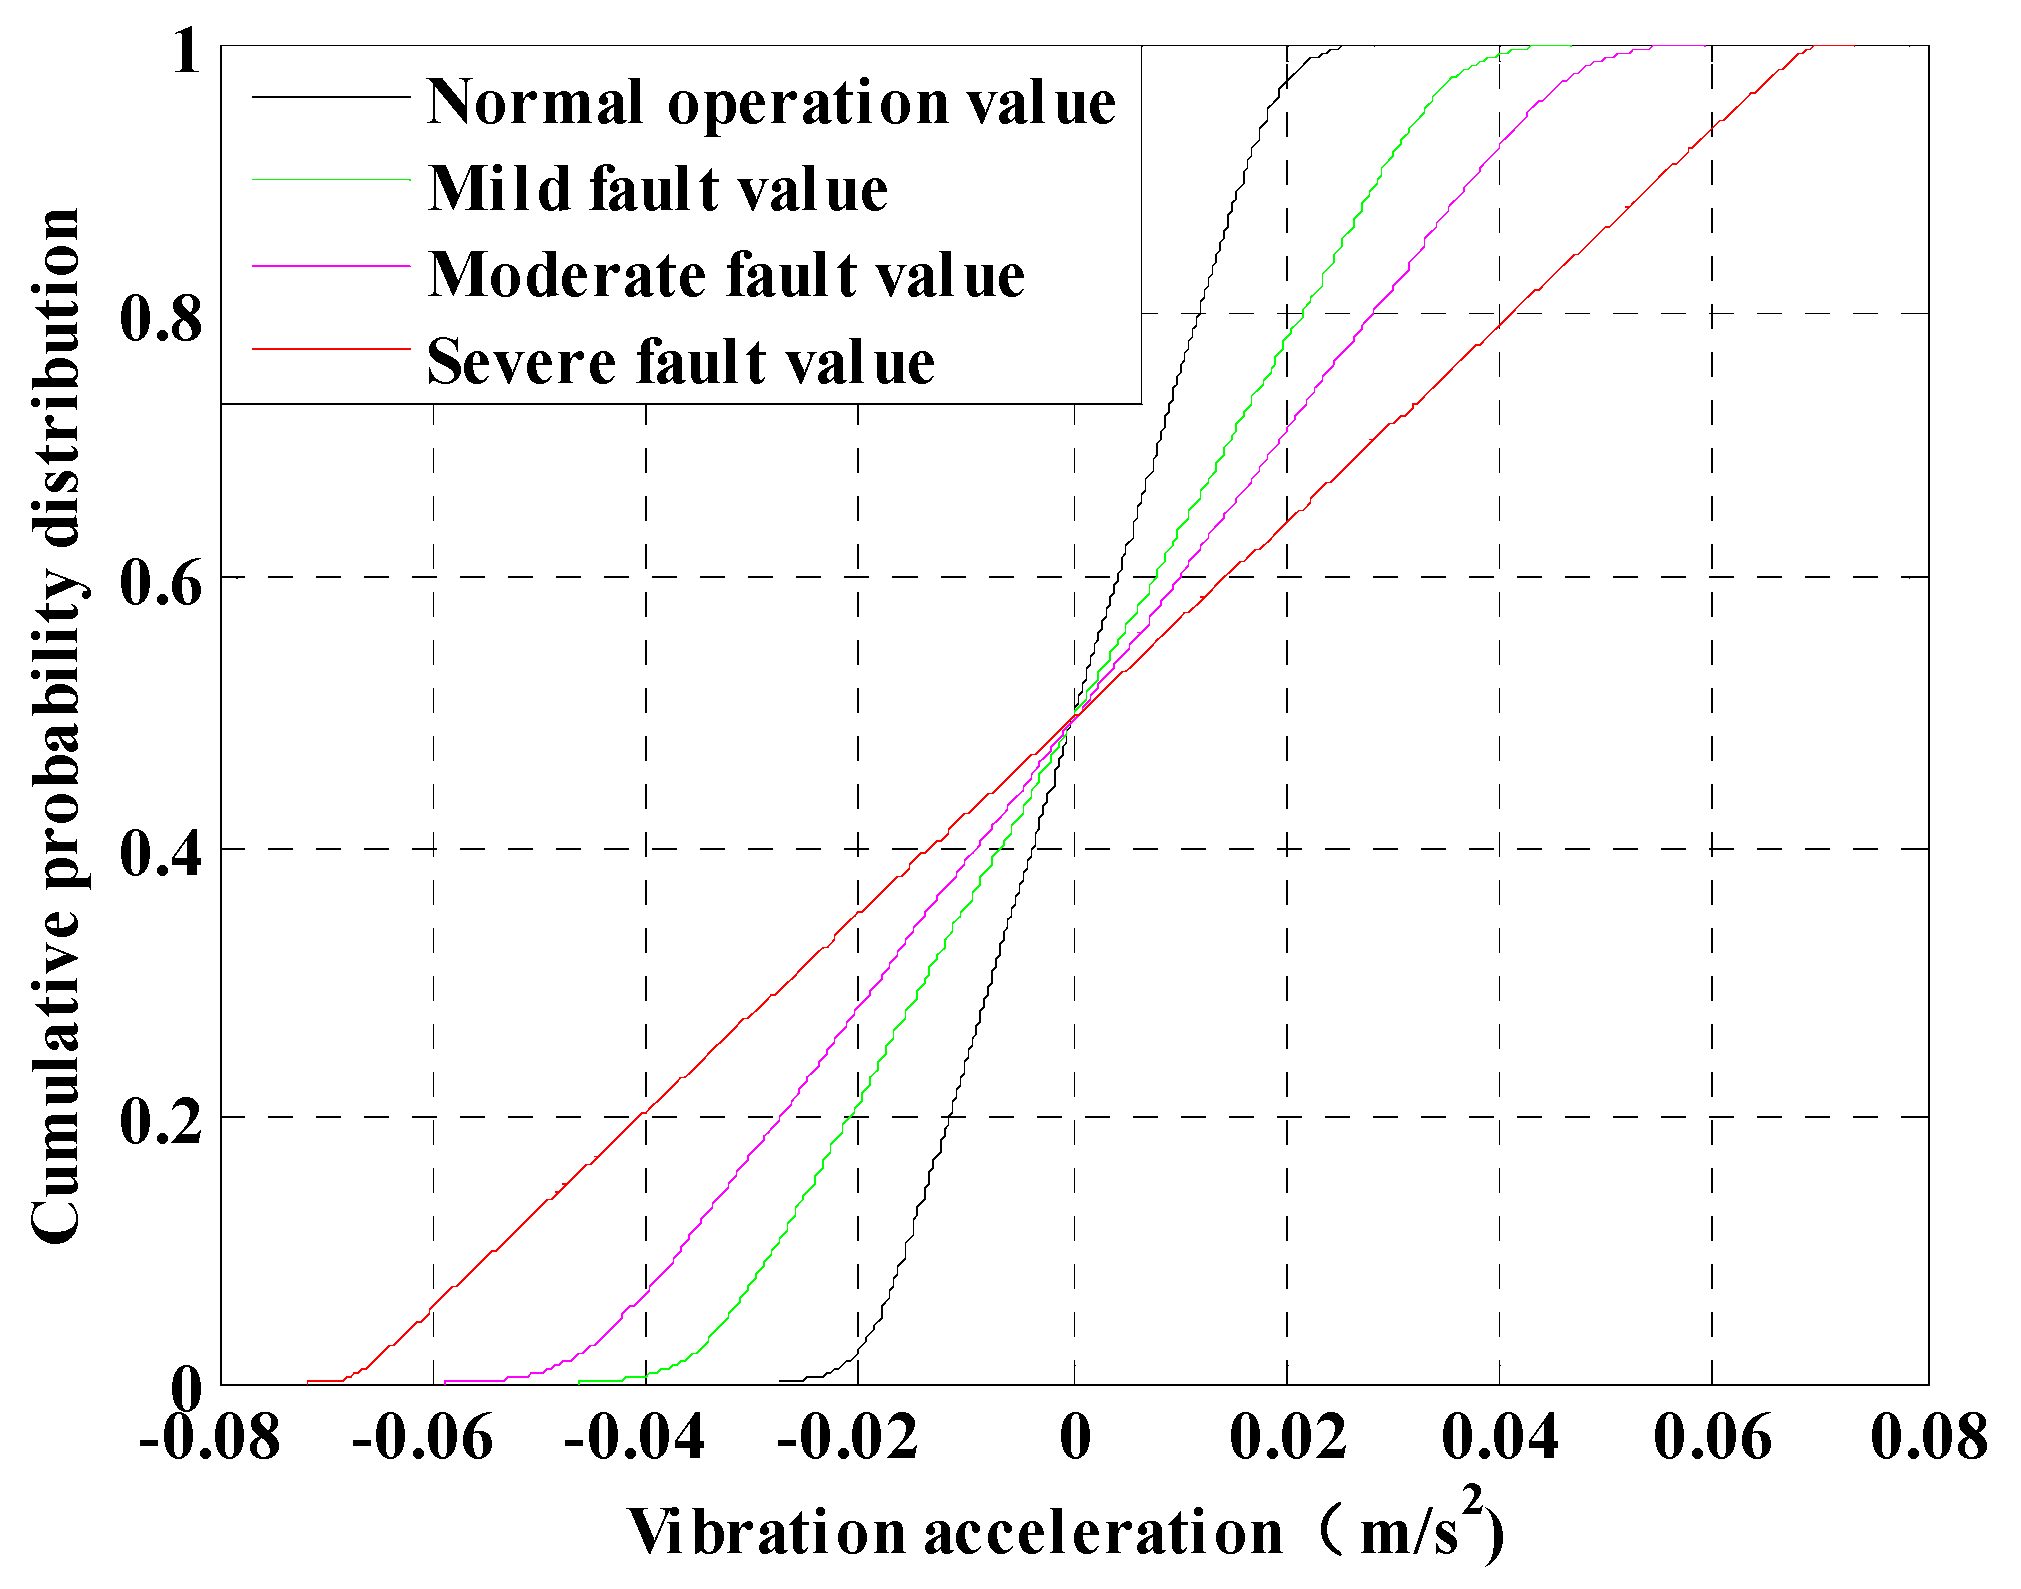
3.1. Distribution Characteristics of Transformer Vibration Signals

Assuming that the vibration signal of the transformer and the distribution of the vibration signal at different signal intervals are random makes it difficult to analyze the vibration signal trend. The cumulative probability distribution characteristics of the transformer vibration signal are analyzed because the cumulative probability distribution function can be used to observe the signal variation trend [26,27].
Figure 3 shows a difference in the cumulative probability distribution curves of the transformer vibration signal at various critical degrees of failure. The properties of the cumulative probability distribution curves were analyzed using the mathematical statistics method. The main content of the mathematical statistics method is the least-squares solution corresponding to the straight line of the vibration signal curve. With the cumulative probability distribution curve of the vibration signal, the least-squares straight line is used as the characteristic of the vibration signal distribution. It can intuitively observe the difference in the vibration signal under different working conditions of the transformer and conduct a preliminary judgment of the extent of transformer failure.

3.2. Basic Theory of Mathematical Statistics Methods

In a discrete random variable, the probability of each possible value xi (1, 2 … N) of the variable is calculated, and the obtained result is the law of distribution. During the vibration signal acquisition for the transformer, the vibration signal distribution law is satisfied by Equation (7) [28]:
{ i = 1 N p ( x i ) = 1 0 p ( x i ) 1
At this time, the transformer vibration signal is a random variable and can be any real number within the set threshold range. The cumulative probability distribution function F(x) satisfies the vibration signal in Equation (8), and the cumulative probability distribution function of the vibration signal is not reduced in the function:
{ F ( x ) = P { X x } 0 F ( x ) 1   .
After obtaining a cumulative probability distribution map of the signal, the least-squares method is used to find the fitting straight line (FSL) of the signal cumulative probability distribution function and to intuitively observe whether the transformer vibration signal is abnormal or not. The least-squares method is normally used to solve the fitting curve when considering over-determined equations (the over-determined unknown is smaller than the number of equations), as in Equation (9):
j = 1 n x i j β i = y i ,     ( i = 1 , 2 , 3 , , m )
where m represents m equations and n represents n unknowns β (m > n) after vectorization, as indicated in Equation (10):
x β = y
In Equation (10): x = [ x 11 x 12 x 21 x 22 x 1 n x 2 n x m 1 x m 2   x m n ] , β = [ β 1 β 2 β n ] , y = [ y 1 y 2 y n ] .
Evidently, the equation system generally has no solution. Thus, the function of the residual sum of the squares, S, is introduced in Equation (11) to select the most appropriate β to make the equation “possible”:
S ( β ) = x β y 2 .
When β = β ^ , S(β) takes the minimum value and can be recorded as:
β ^ = argmin ( S ( β ) ) .
By deriving the maximum value of S(β), we can obtain:
x T x β ^ = x T y .
If the matrix x T x is non-singular, then β has a unique solution, as:
β ^ = ( x T x ) 1 x T y .
According to the cumulative probability distribution function of the vibration signal, the FSL needs to be z = kx + b. From the aforementioned least-squares general solution, the FSL general solution formula can be obtained, where n is the number of sampling points, as:
{ ( x x ¯ ) ( y y ¯ ) = x y n x ¯ y ¯ ( x x ¯ ) 2 = x 2 n x ¯ 2
Using Equation (15), the fitted line slope k can be calculated as:
k = x y ¯ x ¯ y ¯ x 2 ( x ¯ ) 2
After calculating the slope, the intercepted b is obtained by the undetermined coefficient method according to the determined ( x ¯ , y ¯ ) and slope k. Then, the FSL of the cumulative probability distribution function of the vibration signal can be determined.

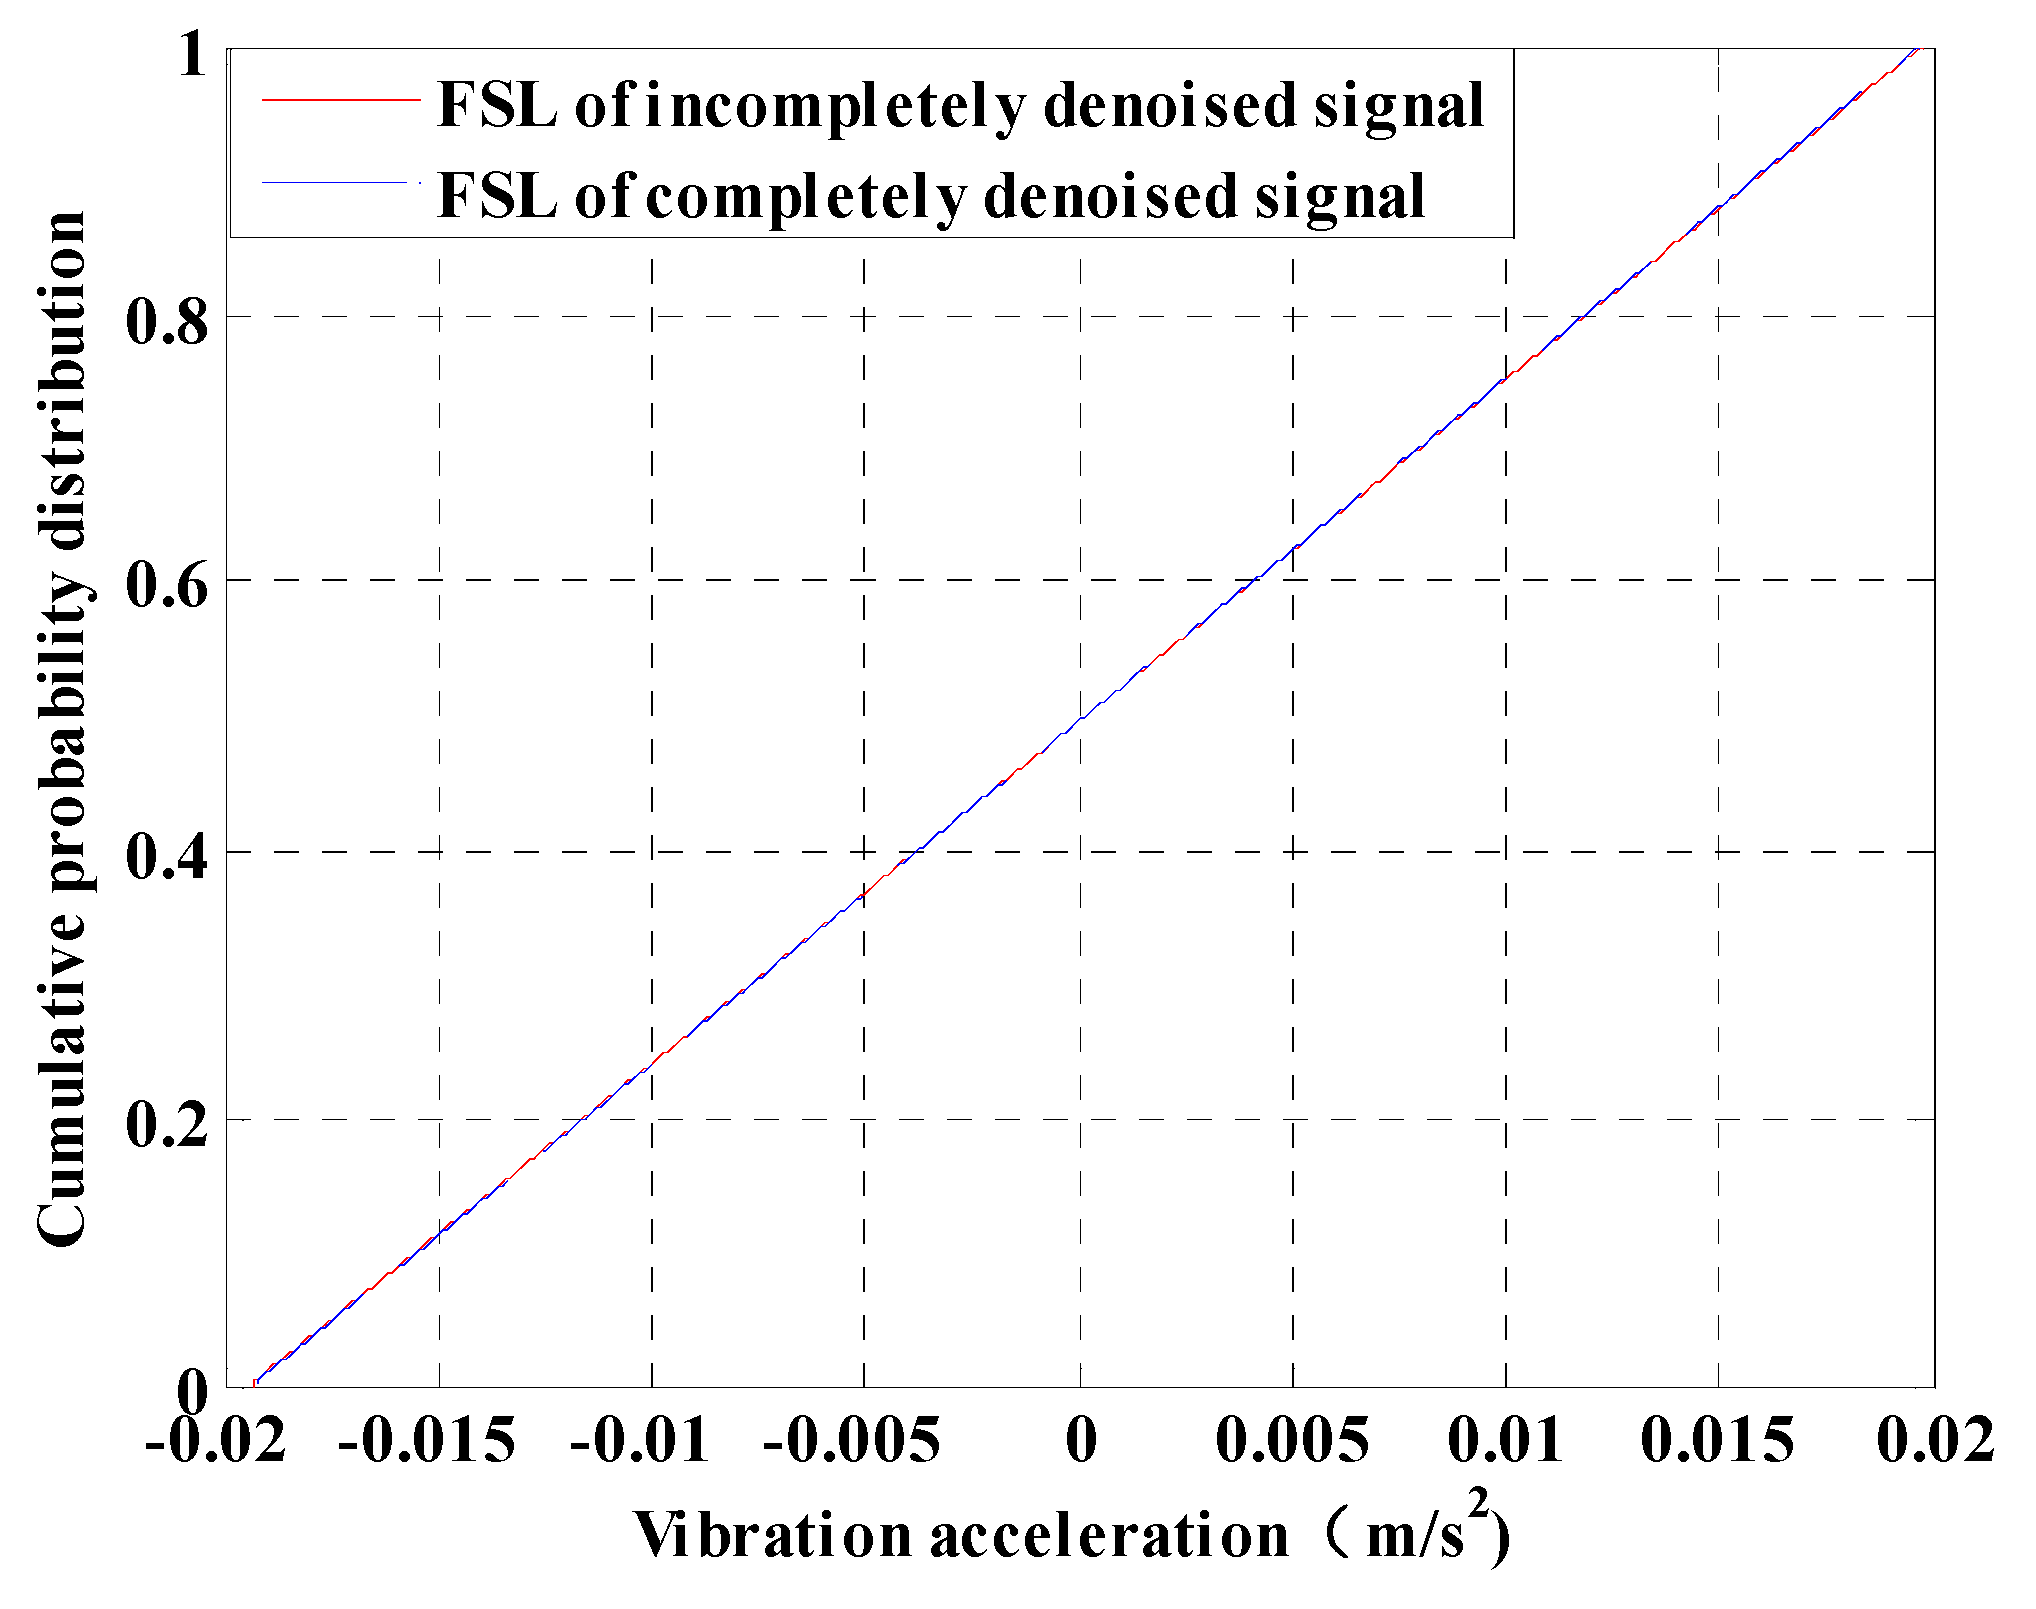
3.3. Feasibility Analysis of Simplifying Noise Reduction

The difference of the FSL of the cumulative probability distribution function of the vibration signal under the condition of complete and incomplete denoising must be analyzed to check the feasibility of the mathematical statistics method for simplifying the noise reduction link. Take the transformer without fault as an example, where the vibration signals are processed by incomplete and complete denoising and analyzed by mathematical statistics methods. By using Equation (14) and (15), the least-squares FSLs of the vibration signals are obtained after incomplete denoising, as shown in Figure 4. Table 2 presents a comparison of the corresponding fundamental frequency energy ratio and the least-squares FSL slope in the case of incomplete and complete denoising of the faultless transformer.
According to Figure 4 and Table 2, the transformer fault can be identified when the signal was incompletely denoised, according to the change in the proportion of the fundamental frequency energy of the vibration signal. The conclusion is that the transformer was in the moderate winding short-circuit fault at this time. According to the method of mathematical statistics, the fault of the slope of the FSL between incomplete and complete denoising is only 0.755%. At this time, the two curves were substantially coincident because the transformer was fault-free. The comparison results show that noise interference did not cause much deviation in adjusting the linear slope of the cumulative probability distribution of the vibration signal. This finding proves that the mathematical statistics method can clearly represent the cumulative probability distribution characteristics of the vibration signal itself and avoid noise interference when the denoising effect is unsatisfactory. Therefore, using the mathematical statistics method to analyze the characteristics of vibration signals can simplify the denoising link and ensure the accuracy of transformer fault identification.

3.4. Feasibility Analysis of the Mathematical Statistics Methods

After determining the energy threshold of each frequency band of the transformer vibration signal with different fault degrees, the transformer vibration signal is analyzed with a mathematical statistics method. Followed by the calculation of the corresponding slope of the FSL. Table 3 provides the threshold frequency range of the fundamental frequency (a frequency band) energy corresponding to the different short-circuit fault degrees of the transformer windings and the threshold range of least-squares FSL slope of the cumulative probability distribution function to conveniently and quickly assess the fault degree of the transformer.
According to Table 3, the least-squares FSL of the cumulative vibration distribution of the transformer vibration signal is plotted at various critical degrees of failure, as shown in Figure 5. When the degree of transformer failure is identified, it can be determined based on the least-squares fitting of the vibration signal cumulative probability distribution function. The use of mathematical statistics to analyze the trend of the vibration signal can help accurately identify the fault level of the transformer and detect the transformer’s early short-circuit fault in power grid maintenance.

4. Mathematical Statistics Method Application Examples

At present, the algorithms that can be used for transformer vibration signal processing mainly include Fourier transform, short-time Fourier transform, and empirical mode decomposition, except for wavelet transform. Due to the defect of the its decomposition rule, the result of signal decomposition after empirical mode decomposition (EMD) processing has the wrong intrinsic mode function (IMF) component, especially the low-frequency error IMF component, which will have a great influence on the extraction analysis and the processing of the fault characteristic signal [29,30]. It makes the error of transformer fault identification large, so the empirical mode decomposition method is usually not used to process the transformer vibration signal. Since the Fourier transform depicts the frequency characteristics over the entire time period, it is a global transformation that does not characterize the signal characteristics at a particular time or in a particular frequency band, which limits the application of this method. Transformer vibration signal processing requires the real-time acquisition of real-time processing, while the Fourier transform requires the analysis of a complete cycle of signals. This will inevitably lead to very serious processing delays and lags and further results hysteresis and limitations in the identification, so the current Fourier transform is usually not used for fault identification of transformers.
In order to improve the defect and hysteresis of the Fourier transform, the signal can be segmented by a short-time Fourier transform and calculated and represented to perform time-frequency analysis on the signal. This method decomposes the time domain signal simultaneously in the time-frequency domain. After this decomposition, the time domain signal can be characterized as the sum of the signals over multiple time periods in the time-frequency domain. At present, the short-time Fourier transform is widely used to process transformer vibration signals, which was used to process the vibration signal of the transformer with different fault levels and the power spectral density of the transformer vibration signal was obtained, as shown in Figure 6.
From Figure 6, it can be confirmed that when the transformer is in a normal state, the low-band power spectral density of the vibration signal is larger than the higher one. Compared with the vibration signal of the normal transformer, when the transformer winding has a moderate short-circuit fault and a severe short-circuit fault, the power spectral density of the high-frequency component and the low-frequency component of the faulty transformer vibration signal gradually increase and decrease, respectively, with the deepening of the transformer fault degree. Furthermore, the power spectral density near the fundamental frequency band increases significantly. However, when the transformer winding has a mild short-circuit fault, the result of the short-time Fourier transform process indicates that the power spectral density of the high-frequency component of the vibration signal only increases slightly. The result slightly deviates from the result obtained by the wavelet transform. This is due to the limitation that the short-time Fourier transform cannot meet the requirements of both frequency and time resolution. When the transformer vibration signal is processed by using the short-time Fourier transform, the window function has a high time resolution requirement for the high-frequency component and has a high-frequency resolution requirement for the low-frequency component. The transformer fault identification requires high-frequency resolution, and the short-time Fourier transform can only analyze the calculated signal power spectral density with one resolution. So, using a short-time Fourier transform algorithm is prone to large errors when identifying the mild short-circuit fault of the transformer winding. According to Section 3.4, we can observe that the mathematical statistics method is more accurate for the identification of transformer winding short-circuit faults compared with the short-time Fourier transform.

Mathematical Statistics Method Application Examples

Short-circuit tests were performed on two S-11-M-500/35 type transformers to verify the mathematical statistics method. The connection group is Yyn0, the capacity is 500 kVA, and the rated current is 8.25 A. In the test, the low-voltage side of the transformer was short-circuited, and the voltage was applied to the high-voltage side of the transformer to allow the winding current to reach the rated value. Then, the vibration signal of the transformer was measured, and the mathematical statistics method used for the analysis. Figure 7 and Figure 8 show a comparison between the FSL of the cumulative probability distribution of two transformer vibration signal with unknown degrees of faults and that with different critical fault degrees.
In Figure 7, the cumulative probability distribution curve FSL slope of the vibration signal of the first unknown-fault transformer in the short-circuit test is calculated to be 10.1912, which is in the range of the linear slope of the transformer during the short-circuit fault of the neutral winding. Therefore, the transformer has a moderate winding short-circuit fault. And in Figure 8, when the short-circuit test on the second transformer is performed, the slope is 14.8853. According to Table 3, the transformer is in a normal state, and there is no short-circuit fault. The measured two sets of vibration signals are completely denoised to verify the accuracy of the conclusion. Then, the denoised vibration signals are decomposed by three-layered wavelet packet, and its band energy histograms are obtained and shown in Figure 9 and Figure 10.
Figure 9 indicates that the fundamental frequency energy ratio of the transformer is 86.8%, and the ratio in Figure 10 is 84.13%. As shown in Table 3, the first transformer has a moderate winding short-circuit fault. Similarly, the second transformer is in a normal state and there is no winding short circuit fault. Comparative analysis results show that the calculation results of the frequency band energy method are same as those of the mathematical statistics method. However, the frequency band energy method requires a complicated noise reduction procedure and the accuracy of the fault identification method is slightly insufficient. The mathematical statistics method has good response characteristics and fault judgment scale, which demonstrates superiority in the accuracy and sensitivity of transformer fault identification. It can simplify the noise reduction process very well, which can be regarded as a good optimization method for the vibration method and a supplementary method of the band energy method for verification.

5. Summary

Vibration signals from power transformers can be used to identify transformer faults, but it is hard to achieve a complete denoising effect for vibration signals in conventional vibration techniques. Moreover, the cost of denoising is high, which reduces the accuracy of detecting faults and the stability of the power grid operation. This paper presented a mathematical statistical method to identify short-circuit faults degree of transformers. The main conclusions can be drawn as follows:
  • When the mathematical statistics method is used to analyze the vibration signal of the transformer, the noise exerts little influence on the accuracy of transformer fault identification. Simplification of the noise reduction of the signal reduces noise reduction costs and the fault identification time.
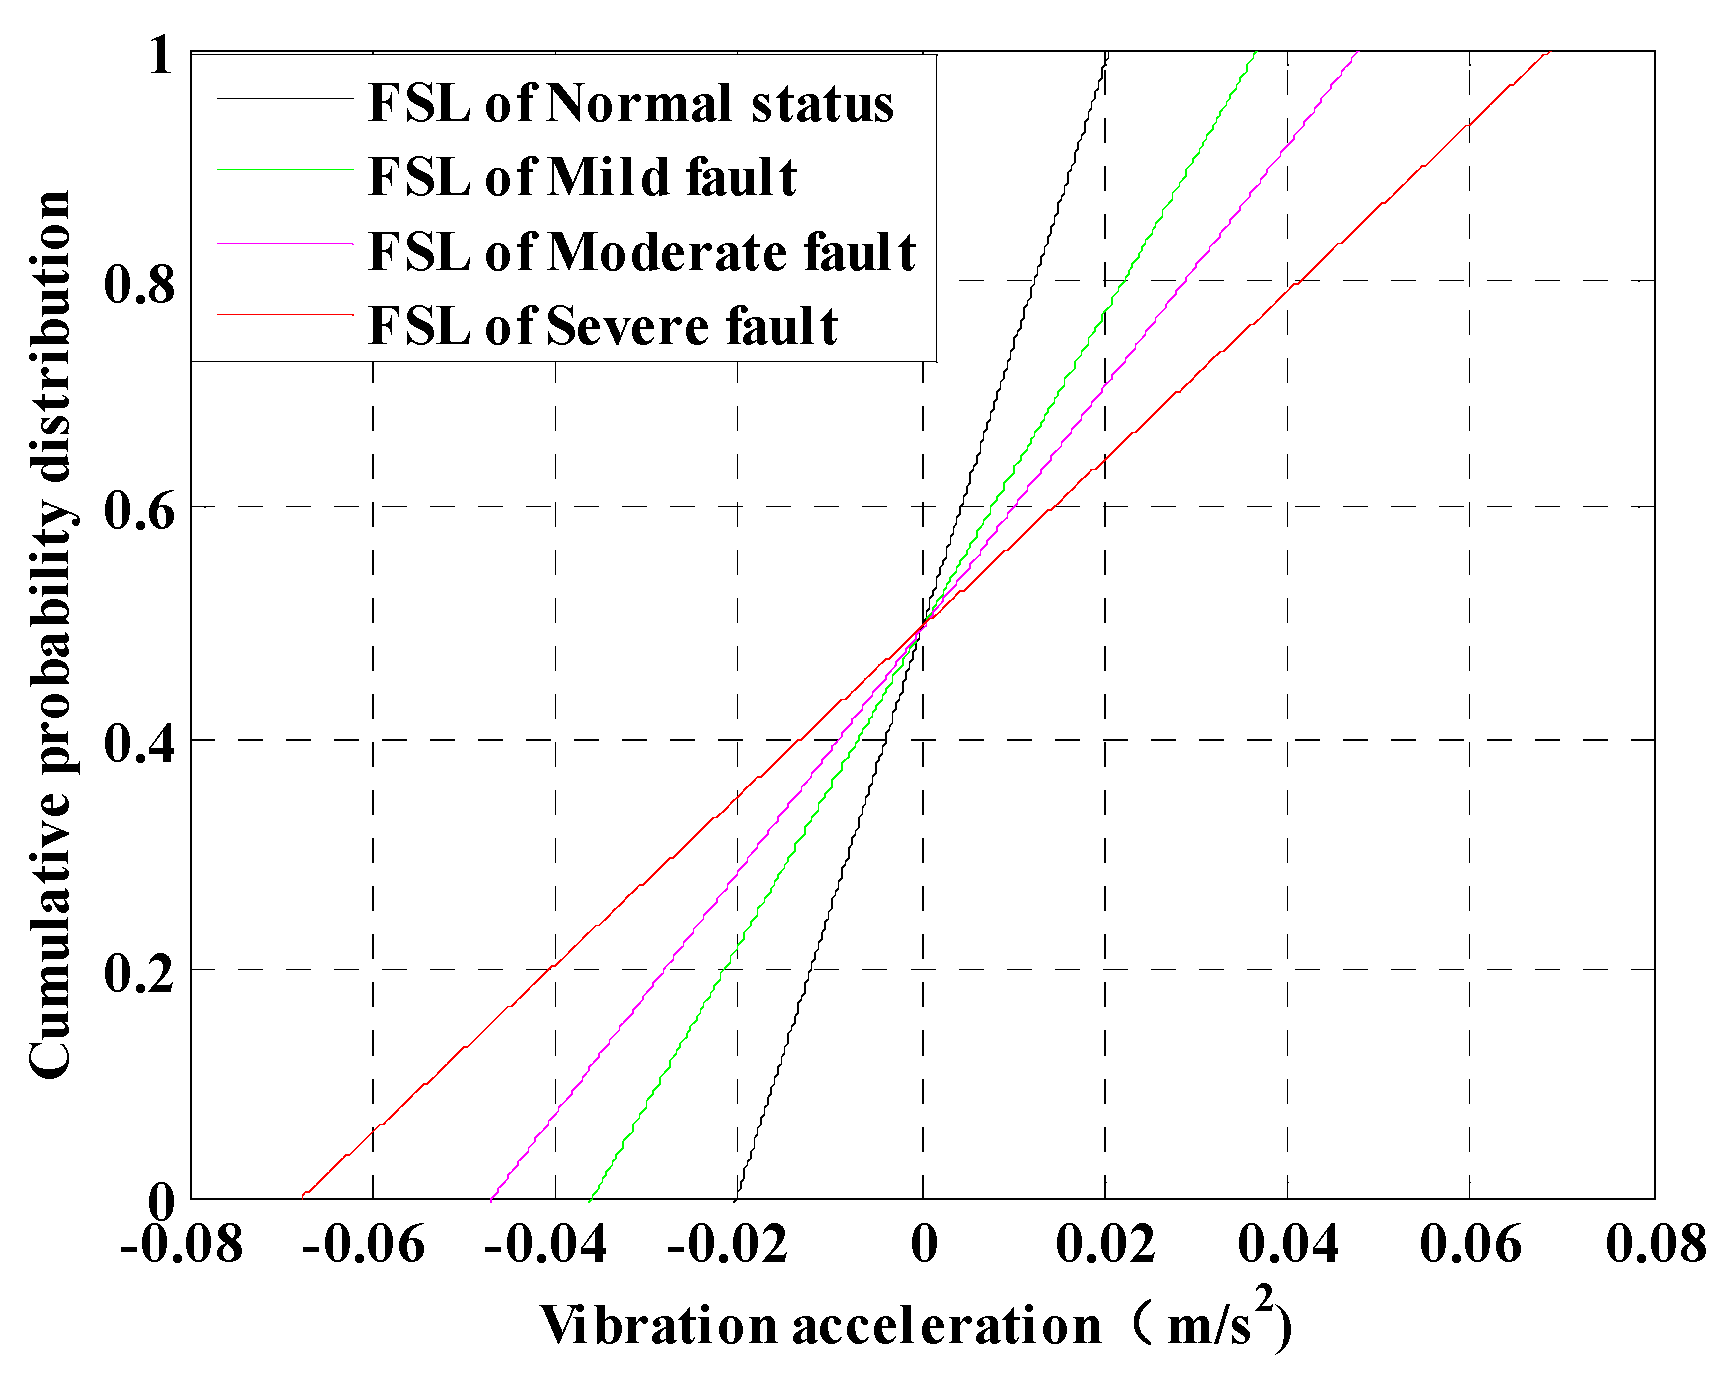
  • The vibration signal of the transformer is analyzed by a mathematical statistics method and the cumulative probability distribution curve of the vibration signal is illustrated. Then, the least-squares fitting line of the cumulative probability distribution function of the vibration signal is solved by the least-squares method. According to the wavelet transform of different scales, the proportion of the high-frequency component to the low-frequency energy is obtained by combining wavelet theory to quantify the frequency band energy of the vibration signal. Thus, the energy threshold of each frequency band of the transformer vibration signal with different fault degrees can be calculated, and the cumulative probability distribution corresponding to the vibration signal of the transformer with different fault degrees can be fitted to the straight line. The slope threshold can then be determined.
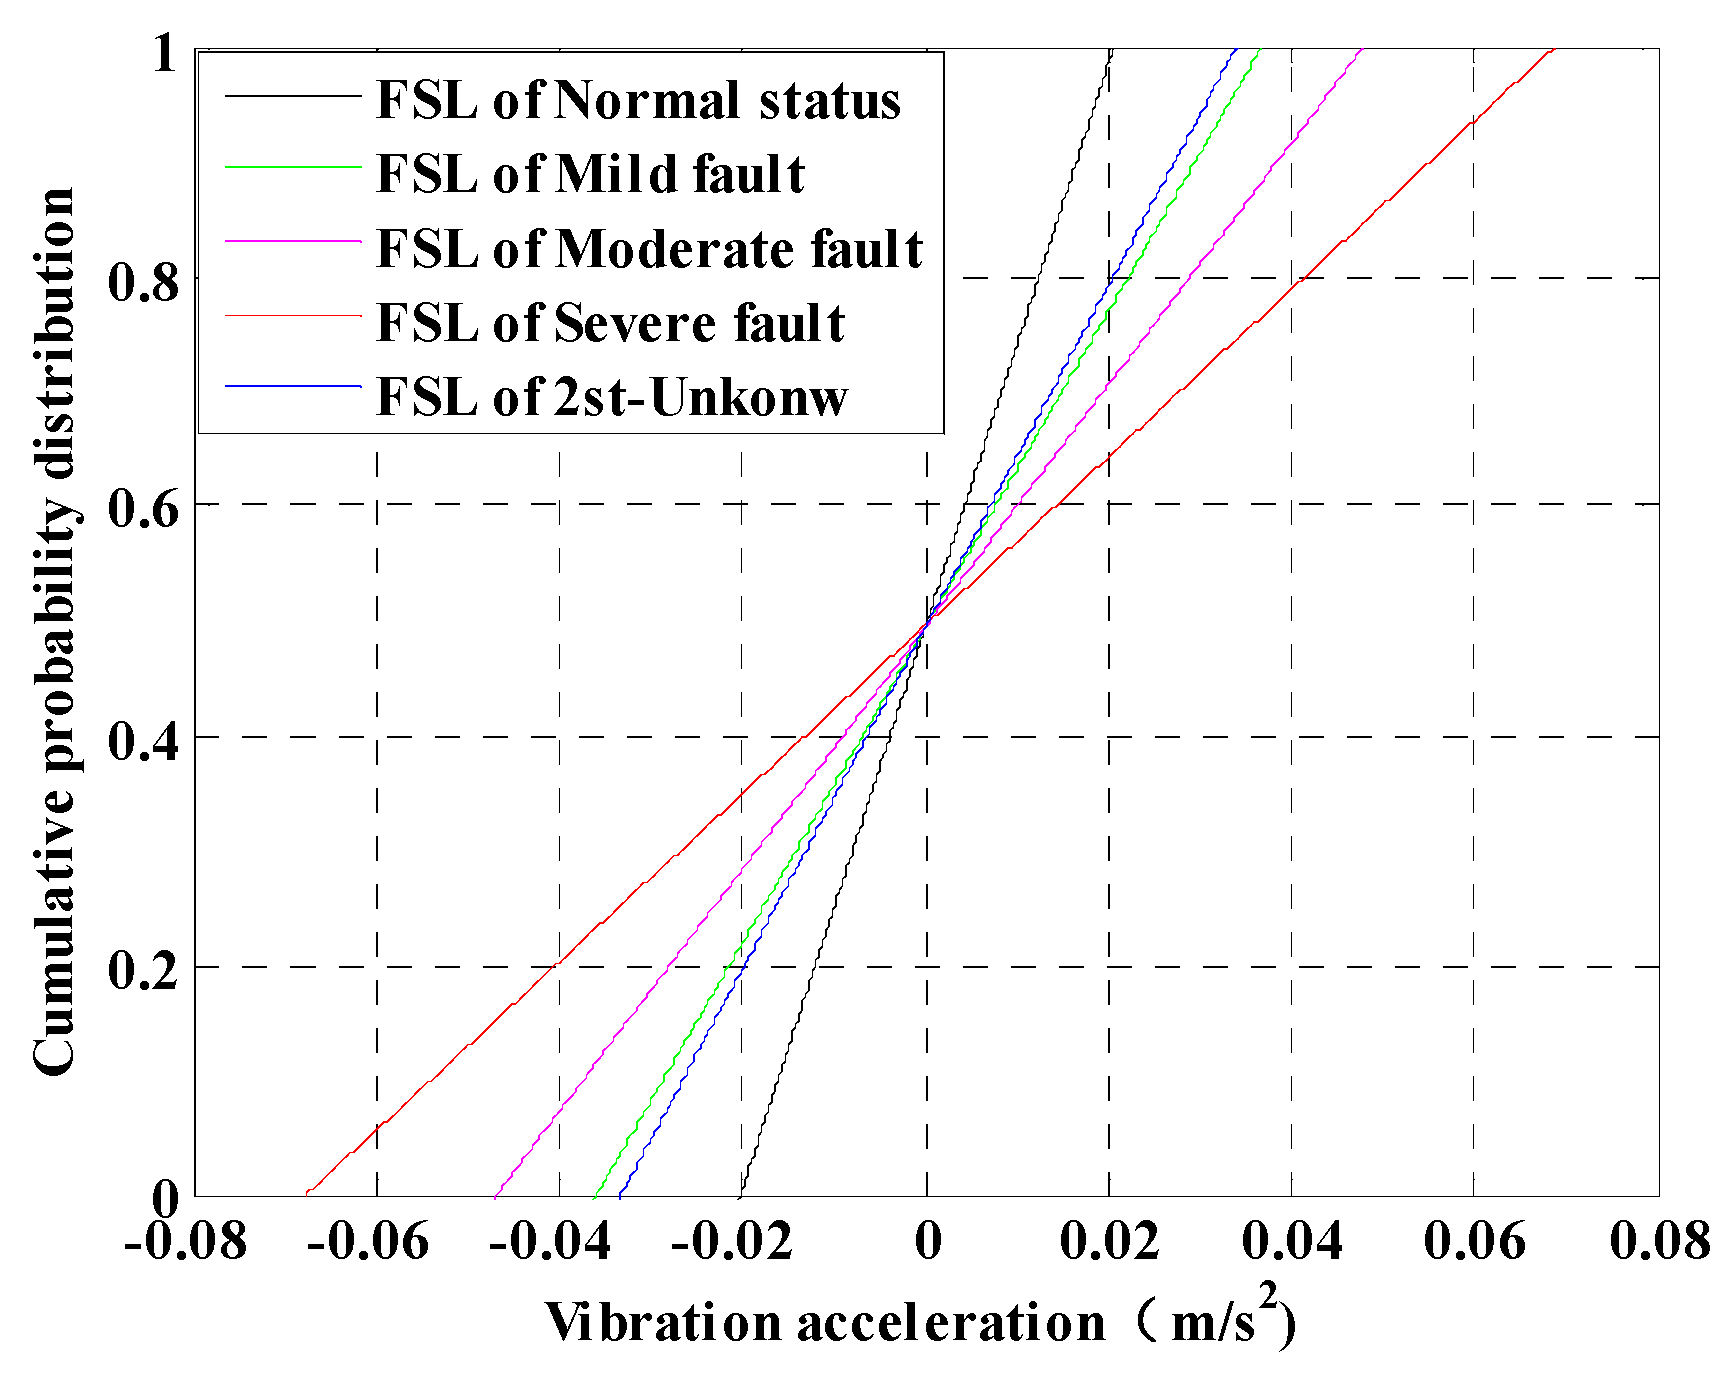
  • Transformer winding produces a short-circuit fault can be determined by comparing the slope of the cumulative probability distribution of the vibration signal with the fault threshold of the FSL. Therefore, the purpose of power transformer fault identification can be achieved and the feasibility of the mathematical statistics method can be verified. The mathematical statistics method can quickly determine the fault state of power transformers, reduce the safety hazards of transformers, and improve the safety and reliability of grid operation. This method also optimizes transformer fault identification to a certain extent and provides a new idea for the development of transformer fault identification techniques.
  • Since the short-time Fourier transform is more applicable to transformer vibration signal processing than the Fourier transform and the empirical modal decomposition algorithm, we used short-time Fourier transform to analyze the transformer vibration signal and, compared with the mathematical statistics methods proposed in this paper, it can be seen that the short-time Fourier transform can identify moderate and severe short-circuit faults of transformer winding, but the early mild faults of the transformer winding cannot be accurately identified, which is due to the time and frequency resolution of the window function cannot be determined by the optimal limitation at the same time in short-time Fourier transform. In comparison, the mathematical statistics method proposed in this paper is more accurate in identifying the short-circuit fault degree of the transformer winding.

Author Contributions

Z.Z. proposed conceptualization and methodology, Y.W finished formal analysis, investigation and wrote the original draft preparation, Y.W., P.J. and S.A wrote review and editing, R.Z was responsible for checking this paper, G.L. and Z.D. provided supervision.

Funding

This work was supported by the National Natural Science Foundation of China (No. 51577017).

Conflicts of Interest

The authors declare no conflict of interest.

References

  1. Xu, C.; Wang, F.; Huang, H.; Jin, Z. Information modeling and implementation of vibration on-line monitoring of power transformer based on IEC 61850. Autom. Electr. Power Syst. 2014, 4, 60–64. [Google Scholar]
  2. Berler, Z.; Golubev, A.; Rusov, V.; Tsvetkov, V.; Patterson, C. Vibro-acoustic method of transformer clamping pressure monitoring. In Proceedings of the IEEE Conference Record of the IEEE International Symposium on Electrical Insulation, Anaheim, CA, USA, 5 April 2000. [Google Scholar]
  3. Bartoletti, C.; Desiderio, M.; Dicarlo, D.; Carlo, D.; Fazio, G.; Muzi, F.; Sacerdoti, G.; Salvatori, F. Vibro-Acoustic Techniques to Diagnose Power Transformers. IEEE Trans. Power Deliv. 2004, 19, 221–229. [Google Scholar] [CrossRef]
  4. Garcia, B.; Burgos, J.C.; Alonso, A.M. Transformer tank vibration modeling as a method of detecting winding deformations-part I: Experimental verification. IEEE Trans. Power Deliv. 2005, 21, 157–163. [Google Scholar] [CrossRef]
  5. Garcia, B.; Burgos, J.C.; Alonso, A.M. Transformer tank vibration modeling as a method of detecting winding deformations-part II: Experimental verification. IEEE Trans. Power Deliv. 2005, 21, 164–169. [Google Scholar] [CrossRef]
  6. He, P.; Wen, X. Survey of Frequency Response Analysis on Winding Deformation of Transformers. High Volt. Eng. 2006, 32, 37–41. [Google Scholar]
  7. Hong, K.; Huang, H.; Zhou, J. Winding Condition Assessment of Power Transformers Based on Vibration Correlation. IEEE Trans. Power Deliv. 2015, 30, 1735–1742. [Google Scholar] [CrossRef]
  8. Qian, G.Q.; Lu, Y.; Wang, F.H.; He, M.Z. Vibration response analysis of transformer winding by finite element method. In Proceedings of the 2016 IEEE Transmission and Distribution Conference and Exposition, Dallas, TX, USA, 2–5 May 2016. [Google Scholar]
  9. Li, X.; Huang, X.; Zhou, Z.; Zhao, Y.; Chen, Y.; Song, Y. Analysis of the measuring points selection of power transformer winding deformation though vibration test. In Proceedings of the 2016 IEEE China International Conference on Electricity Distribution, Xi’an, China, 10–12 August 2016. [Google Scholar]
  10. Yang, W.; Dong, H.; Yu, F.; Zhang, S.; Li, D.; Liu, X. On-line monitoring system for transformer vibration based on vibration method. Transducer Microsc. Syst. Technol. 2016, 35, 88–94. [Google Scholar]
  11. Sheng-Chang, J.; Yang, M.; Yu-Wen, L. Study on the oil tank surface vibration characteristics for the running power transformer. Adv. Technol. Electr. Eng. Energy 2007, 26, 24–28. [Google Scholar]
  12. Yang, S.; Jiao, W.; Wu, Z. Independent component analysis based networks for fault features extraction and classification of rotating machines. Chin. J. Mech. Eng. 2004, 40, 45–49. [Google Scholar] [CrossRef]
  13. Xu, J.; Jin, Z.; Fu, J.; Shao, Y.; Wang, F.; Jaing, Y. Detection of Transformer Winding Deformation Under Short-circuit Impulse Based on Improved Wavelet Packet Algorithm. East China Electr. Power 2010, 38, 376–380. [Google Scholar]
  14. Guo, J.; Ji, S.; Shen, Q.; Zhu, L.; Ou, X.; Du, L. Blind Source Separation Technology for the Detection of Transformer Fault Based on Vibration Method. Trans. China Electrotech. Soc. 2012, 27, 68–78. [Google Scholar]
  15. Ma, H.; Geng, Z.; Chen, K.; Wang, C.; Li, K.; Li, Y. A New Method for Fault Diagnosis of Power Transformer Winding Deformation Based on Vibration. Autom. Electr. Power Syst. 2013, 37, 89–94. [Google Scholar]
  16. Jahromi, A.; Piercy, R.; Cress, S.; Service, J.; Wang, F. An approach to power transformer asset management using health index. IEEE Electr. Insul. Mag. 2009, 25, 20–34. [Google Scholar] [CrossRef]
  17. Dehghani, A.; Ma, H.; Saha, T.K.; Ekanayake, C. Application of fuzzy support vector machine for determining the health index of the insulation system of in-service power transformers. IEEE Trans. Dielectr. Electr. Insul. 2013, 20, 965–973. [Google Scholar]
  18. Ahmed, A.-E.; Salama, M.M.A.; Ibrahim, M. Calculation of a health index for oil-immersed transformers rated under 69 kV using fuzzy logic. IEEE Trans. Power Deliv. 2012, 27, 2029–2036. [Google Scholar]
  19. Abdolrahman, P.; Weddella, S.J.; Jalal, T.; CraigLapthorna, A. Evolutionary multi-objective fault diagnosis of power transformers. Swarm Evolut. Comput. 2017, 36, 62–75. [Google Scholar]
  20. Ghoneim, S.S.M.; Taha, I.B.M.; Elkalashy, N.I. Integrated ANN-based proactive fault diagnostic scheme for power transformers using dissolved gas analysis. IEEE Trans. Dielectr. Electr. Insul. 2016, 23, 1838–1845. [Google Scholar] [CrossRef]
  21. Ma, H.; Saha, T.K.; Ekanayake, C.; Martin, D. Smart transformer for smart grid—intelligent framework and techniques for power transformer asset management. IEEE Trans. Smart Grid 2015, 6, 1026–1034. [Google Scholar] [CrossRef]
  22. Shengchang, J.; Yongfen, L.; Yanming, L. Research on extraction technique of transformer core fundamental frequency vibration based on OLCM. IEEE Trans. Power Deliv. 2006, 21, 1981–1988. [Google Scholar] [CrossRef]
  23. Murthy, P.K.; Amarnath, J.; Singh, B.P.; Kamakshaiah, S.A.N.N. Based Internal Fault Diagnosis of HVDC Converter Transformer. Int. J. Appl. Eng. Res. 2009, 4, 867–877. [Google Scholar]
  24. Chun-Ning, W.; Ying, Z.; Kai, C.; Hong-zhong, M. Analysis on High and Low Frequency Energy Distribution of Transformer Winding Short-circuit Fault Vibration Signal. Proc. CSU-EPSA 2013, 25, 77–82. [Google Scholar]
  25. Dai, W.; Liu, B. Monitoring the destortion of transformer winding using frequency response method. High Volt. Appar. 2004, 40, 464–465. [Google Scholar]
  26. Bandler, J.W.; Biernacki, R.M.; Cai, Q.; Shen, S.H. A novel approach to statistical modeling using cumulative probability distribution fitting. In Proceedings of the IEEE MTT-S International Microwave Symposium Digest, San Diego, CA, USA, 23–27 May 1994; Volume 1, pp. 385–388. [Google Scholar]
  27. Choudhury, K.; Matin, M.A. Extended skew generalized normal distribution. Metron 2011, 69, 265–278. [Google Scholar] [CrossRef]
  28. Teyabeen, A.A. Statistical analysis of wind speed data. In Proceedings of the 2015 IEEE Renewable Energy Congress, Sousse, Tunisia, 24–26 March 2015. [Google Scholar]
  29. Peng, Z.K.; Tse, P.W.; Chu, F.L. An improved Hilbert–Huang transform and its application in vibration signal analysis. J. Sound Vib. 2005, 286, 187–205. [Google Scholar] [CrossRef]
  30. Wu, Z. Ensemble empirical mode decomposition: A noise assisted data analysis method. Adv. Adapt. Data Anal. 2009, 1, 1–41. [Google Scholar] [CrossRef]
Figure 1. Transformer vibration signals of four types of fault.
Mathematics 07 00288 g001
Figure 2. Transformer vibration signal Frequency-Band-Energy (FBE) Histogram.
Mathematics 07 00288 g002aMathematics 07 00288 g002b
Figure 3. Cumulative probability distribution curves of vibration signal in different working states of the transformer.
Mathematics 07 00288 g003
Figure 4. Incompletely denoised signal and fully denoised signal FSL comparison chart.
Mathematics 07 00288 g004
Figure 5. Transformer vibration signal cumulative probability distribution function FSL diagram.
Mathematics 07 00288 g005
Figure 6. Power spectral density of transformer vibration signal.
Mathematics 07 00288 g006
Figure 7. The first transformer’s vibration signal cumulative probability distribution curve FSL comparison diagram.
Mathematics 07 00288 g007
Figure 8. The second transformer’s vibration signal cumulative probability distribution curve FSL comparison diagram.
Mathematics 07 00288 g008
Figure 9. The first transformer vibration signal FBE Histogram.
Mathematics 07 00288 g009
Figure 10. The second transformer vibration signal FBE Histogram.
Mathematics 07 00288 g010
Table 1. Energy consumption ratio threshold values of each frequency band corresponding to transformer vibration signals of different fault levels.
Transformer Status1st FBE Ratio (%)2nd FBE Ratio (%)3rd FBE Ratio (%)4th FBE Ratio (%)5th FBE Ratio (%)6th FBE Ratio (%)7th FBE Ratio (%)8th FBE Ratio (%)
Normal status82.364.601.973.991.491.332.082.18
Mild fault84.964.361.593.631.080.921.641.82
Moderate fault85.844.291.443.510.940.801.511.67
Severe fault88.893.870.973.180.430.381.071.21
Table 2. Incomplete denoising signal and complete denoising signal characteristics comparison.
Denoising ConditionBase Frequency Energy Ratio (%)Fitting Straight line (FSL) Slope
Incomplete denoising signal87.1424.7081
Complete denoising signal82.3624.5230
Table 3. Transformer winding short circuit fault degree criterion.
Transformer StatusBase Frequency Energy Ratio (%)FSL Slope
Normal status82.36~84.9613.7605~24.5230
Mild fault84.96~85.8410.5501~13.7605
Moderate fault85.84~88.897.3297~10.5501
Severe fault≥88.89≤7.3297

