Article

A Novel Graphically-Based Network Reconfiguration for Power Loss Minimization in Large Distribution Systems

by
Ibrahim Mohamed Diaaeldin
1,
Shady H. E. Abdel Aleem
2,
Ahmed El-Rafei
1,
Almoataz Y. Abdelaziz
3 and
Ahmed F. Zobaa
4,*
1
Engineering Physics and Mathematics Department, Ain Shams University, Cairo 11517, Egypt
2
Mathematical, Physical and Engineering Sciences Department, 15th of May Higher Institute of Engineering, Cairo 11731, Egypt
3
Faculty of Engineering and Technology, Future University in Egypt, Cairo 11835, Egypt
4
Electronic and Computer Engineering Department, Brunel University London, Uxbridge UB8 3PH, UK
*
Author to whom correspondence should be addressed.
Mathematics 2019, 7(12), 1182; https://doi.org/10.3390/math7121182
Submission received: 7 November 2019 / Revised: 28 November 2019 / Accepted: 2 December 2019 / Published: 3 December 2019

Abstract

:
Distribution network reconfiguration (DNR) is the optimized change in the topological structure of distribution systems without violating its radial configuration. DNR has been of interest in applied mathematics and engineering because of its importance in modern power systems. In literature, various optimization techniques that constitute a large area of applied mathematics were proposed to obtain optimized radial configurations; however, most of them were tested in small distribution systems. In this paper, a novel graphically-based DNR is proposed to obtain the optimized radial configurations for power loss minimization. The proposed DNR is based on the graphical representation of the distribution system without any need for a radiality check. Case studies were conducted on 16-, 33-, 70-, 83-, 136-, 415-, 880-, 1760-, and 4400-node distribution systems in order to minimize the total power loss. Results have proven the ability of the proposed graphical DNR for power loss minimization by obtaining fast radial configurations in comparison with previous studies and also its ability to deal with large distribution systems efficiently. The proposed DNR succeeded in minimizing the total losses for large distribution systems as the 880-, 1760-, and 4400-node distribution systems by 69.45%, 72.51%, and 74.35%, respectively.

Graphical Abstract

1. Introduction

Distribution systems are the final stage to deliver power from the transmission system to the connected distributed loads. The contribution of the transmission and distribution systems is 30% and 70%, respectively as reported in [1]. Several strategies were demonstrated in [2] to minimize distribution system losses such as distribution network reconfiguration (DNR), reinforcement plans [3], power factor correction, voltage imbalance reduction, and harmonic distortion mitigation [4]. It was figured out that network losses can be reduced by 15%, which is economically beneficial for different network types. DNR is the change in the status of both sectionalized switches and tie-switches as long as the radial configuration of the distribution system, continuous supply of the connected loads, and system operational limits are maintained. DNR was previously used because of its ability in minimizing both the power losses (primary target) and load balancing (byproduct) between the main distribution feeders.
DNR is considered as a nonconvex mixed-integer nonlinear programming (MINLP) problem. Various optimization approaches were proposed to solve the DNR problem including mathematical and heuristic methods [5]. From the perspective of mathematical methods, various mathematical methods such as MINLP [6] and mixed-integer second-order cone programming (MISOCP) were used. Mixed-integer linear programming (MILP) and mixed-integer cone programming (MICP) were formulated in [7] using spanning tree constraints to convexify the DNR problem. The proposed approach succeeded in reaching optimal/near-optimal solutions for different distribution systems, but it demands more time for large practical systems. A linearized load flow model was proposed in [8] to solve the DNR problem for power loss minimization in which the DNR problem was implemented as a mixed-integer quadratic programming (MIQP) problem. A fuzzy multi-objective optimization approach was proposed in [9] to minimize power loss. A MISOCP formulation for the DNR problem was proposed in [10] to demonstrate the effectiveness of convexifying the distribution AC power flow. The proposed optimization approach successfully minimized power losses for the 33-, 70-, 136-, and 880-node distribution systems. From the perspective of heuristic and metaheuristic optimization approaches, numerous optimization techniques were employed to solve the DNR problem, such as an ant-lion optimization algorithm (ALO) [11], tabu search algorithm [12], genetic algorithm (GA), [13] and others. The main concern linked to the heuristic and metaheuristic approaches is the long computational time of these approaches resulting from the random search. To overcome this concern, a parallel genetic algorithm was implemented in a graphics processing unit (GPU) in order to minimize power loss for large distribution systems [14] which has proven its ability to provide an optimal/near-optimal solution for the DNR problem for large distribution systems. Moreover, another optimization approach was proposed in [15] using a discrete-continuous hyper-spherical search algorithm (DC-HSS) which is able to provide radial configurations directly and decrease the computational burden, but still the main problem was the time consumed to check radiality. In [16], a simultaneous strategy composed of reconfiguration and capacitor placement is proposed for power loss minimization using an ant colony search algorithm. It was tested on the 16- and 83- distribution systems. A theoretical approach based on graphical and matroid theories was proposed in [17] to enhance GA in finding the best configuration of distribution systems. The proposed approach was tested on the 16-, 33-, and 70-node distribution systems. In [18], a metaheuristic optimization technique called artificial immune system was deployed to optimize the 33- and 83- node distribution systems. An enhancement for the integer particle swarm optimization approach was proposed in [19] to find the optimal configuration of the 33- and 83-node distribution systems. A fast nondominated sorting GA (FNSGA) was proposed in [20] to optimize the distribution network to minimize power loss and number of switching actions, enhance voltage profile, and also for load balancing. The proposed FNSGA was tested on three distribution systems including 16-, 69-, and 136-node distribution systems.
In this paper, a novel graphically based DNR approach is proposed to obtain the optimized radial configurations for power loss minimization. The proposed DNR is based on the graphical representation of the distribution system without any need for a radiality check. Case studies were conducted on 16-, 33-, 70-, 83-, 136-, 415-, 880-, 1760-, and 4400-node distribution systems in order to minimize the total power loss. The proposed approach has proven its fast convergence in finding optimal/near-optimal solutions for the DNR problem compared with previous works in literature.
The remainder of this paper is organized as follows: Section 2 discusses the mathematical formulation of the DNR problem and the proposed graphically-based DNR mathematical programming approach. Section 3 presents the problem formulation. In Section 4, the obtained results for the DNR problem are presented for the distribution systems under investigation. Finally, Section 5 presents the conclusions and future works.

2. Problem Statement

In this section, distribution system modeling, the power flow equations, and the proposed graphically-based DNR mathematical approach are illustrated in the following subsections.

2.1. Power Flow Equations

Figure 1 presents the distribution system modeling.
The power flow equations used to solve the distribution system under investigation are illustrated as follows:
P j + 1 = P j P j + 1 L r j , j + 1 × P j 2 + Q j 2 | V j | 2 ,
Q j + 1 = Q j Q j + 1 L x j , j + 1 × P j 2 + Q j 2 | V j | 2 ,
| V j + 1 | 2 = | V j | 2 2 ( r j , j + 1 × P j + x j , j + 1 × Q j ) + ( r j , j + 1 2 + x j , j + 1 2 ) P j 2 + Q j 2 | V j | 2 ,
where P j and Q j are the injected active and reactive powers at the j t h node, P j + 1 L and Q j + 1 L are the active and reactive powers of the connected loads onto node j + 1 , | V j | is the magnitude of the j t h bus voltage, and r j , j + 1 and x j , j + 1 are the feeder resistance and reactance between nodes j and j + 1 .

2.2. Proposed Graphical Distribution Network Reconfiguration

Distribution networks are composed of feeders, nodes, lines, and switches. These switches are composed of sectionalized switches (normally closed switches) and tie-switches (normally open switches) in which tie-switches are joining between two feeders, loop laterals or two substations. Sectionalized switches are assumed to be located in each line, whereas tie-switches are assumed to be located in each tie-line. Both sectionalized and tie switches are the binary decision variables ( z i = W ,   W { 0 , 1 } ), presented using the vector X = [ z i ] ,   i L , where L = { 1 , , N b } and B = { 1 , , N n } , represent the set of lines (edges) and nodes (vertices), respectively. N b and N n are the number of lines and nodes, respectively. The proposed graphically-based DNR mathematical is a standalone optimizer. It has the ability to reconfigure the distribution network without using any optimization technique. Moreover, it provides an optimal/near-optimal configuration of the distribution network in a very fast manner even if the distribution system is very large, and also the requirement for checking radiality after generating each configuration is eliminated. The DNR mathematical approach is illustrated as follows:
Step 1: To represent the graphical structure of the distribution network, a matrix M is formulated, based on the branch-bus incidence matrix, where M = [ a i j ] N b × N n . Its rows i L and columns j B . Each line i in the distribution network is represented in M by a i   m i = 1 and a i   n i = 1 where i L and m i , n i B , denoting the starting and the ending nodes of the line i , respectively. A vector X b e s t r e c of dimension 1 × N b is initialized by the initial configuration of the system, where each element in X b e s t r e c takes a value “1” for a sectionalized line and “0” for a tie-line.
Step 2: A difference vector D r e c = X b e s t r e c [ 1 , 1 , , 1 ] 1 × N b is calculated by subtracting X b e s t r e c from a unity vector, where the i t h element in D r e c is denoted by D r e c ( i ) . If D r e c ( i ) equals 1 , that denotes that a tie-line is located at the i t h line. These tie-lines are gathered in a set T , and the number of elements in T is equal to the number of tie-lines ( N t ) . A temporary vector X t e m p r e c = X b e s t r e c is also assumed before starting Step 3.
Step 3: Starting from the concept that for every tie-line in a loop, in order to be changed to a sectionalized line, another sectionalized line in that loop must be changed to a tie-line. As a result of applying that concept, the radiality of the distribution network will be maintained. In order to apply that concept efficiently and in a very fast manner, the following procedure is applied to reconfigure the distribution system as follows:
(a)
Set t = 1 .
(b)
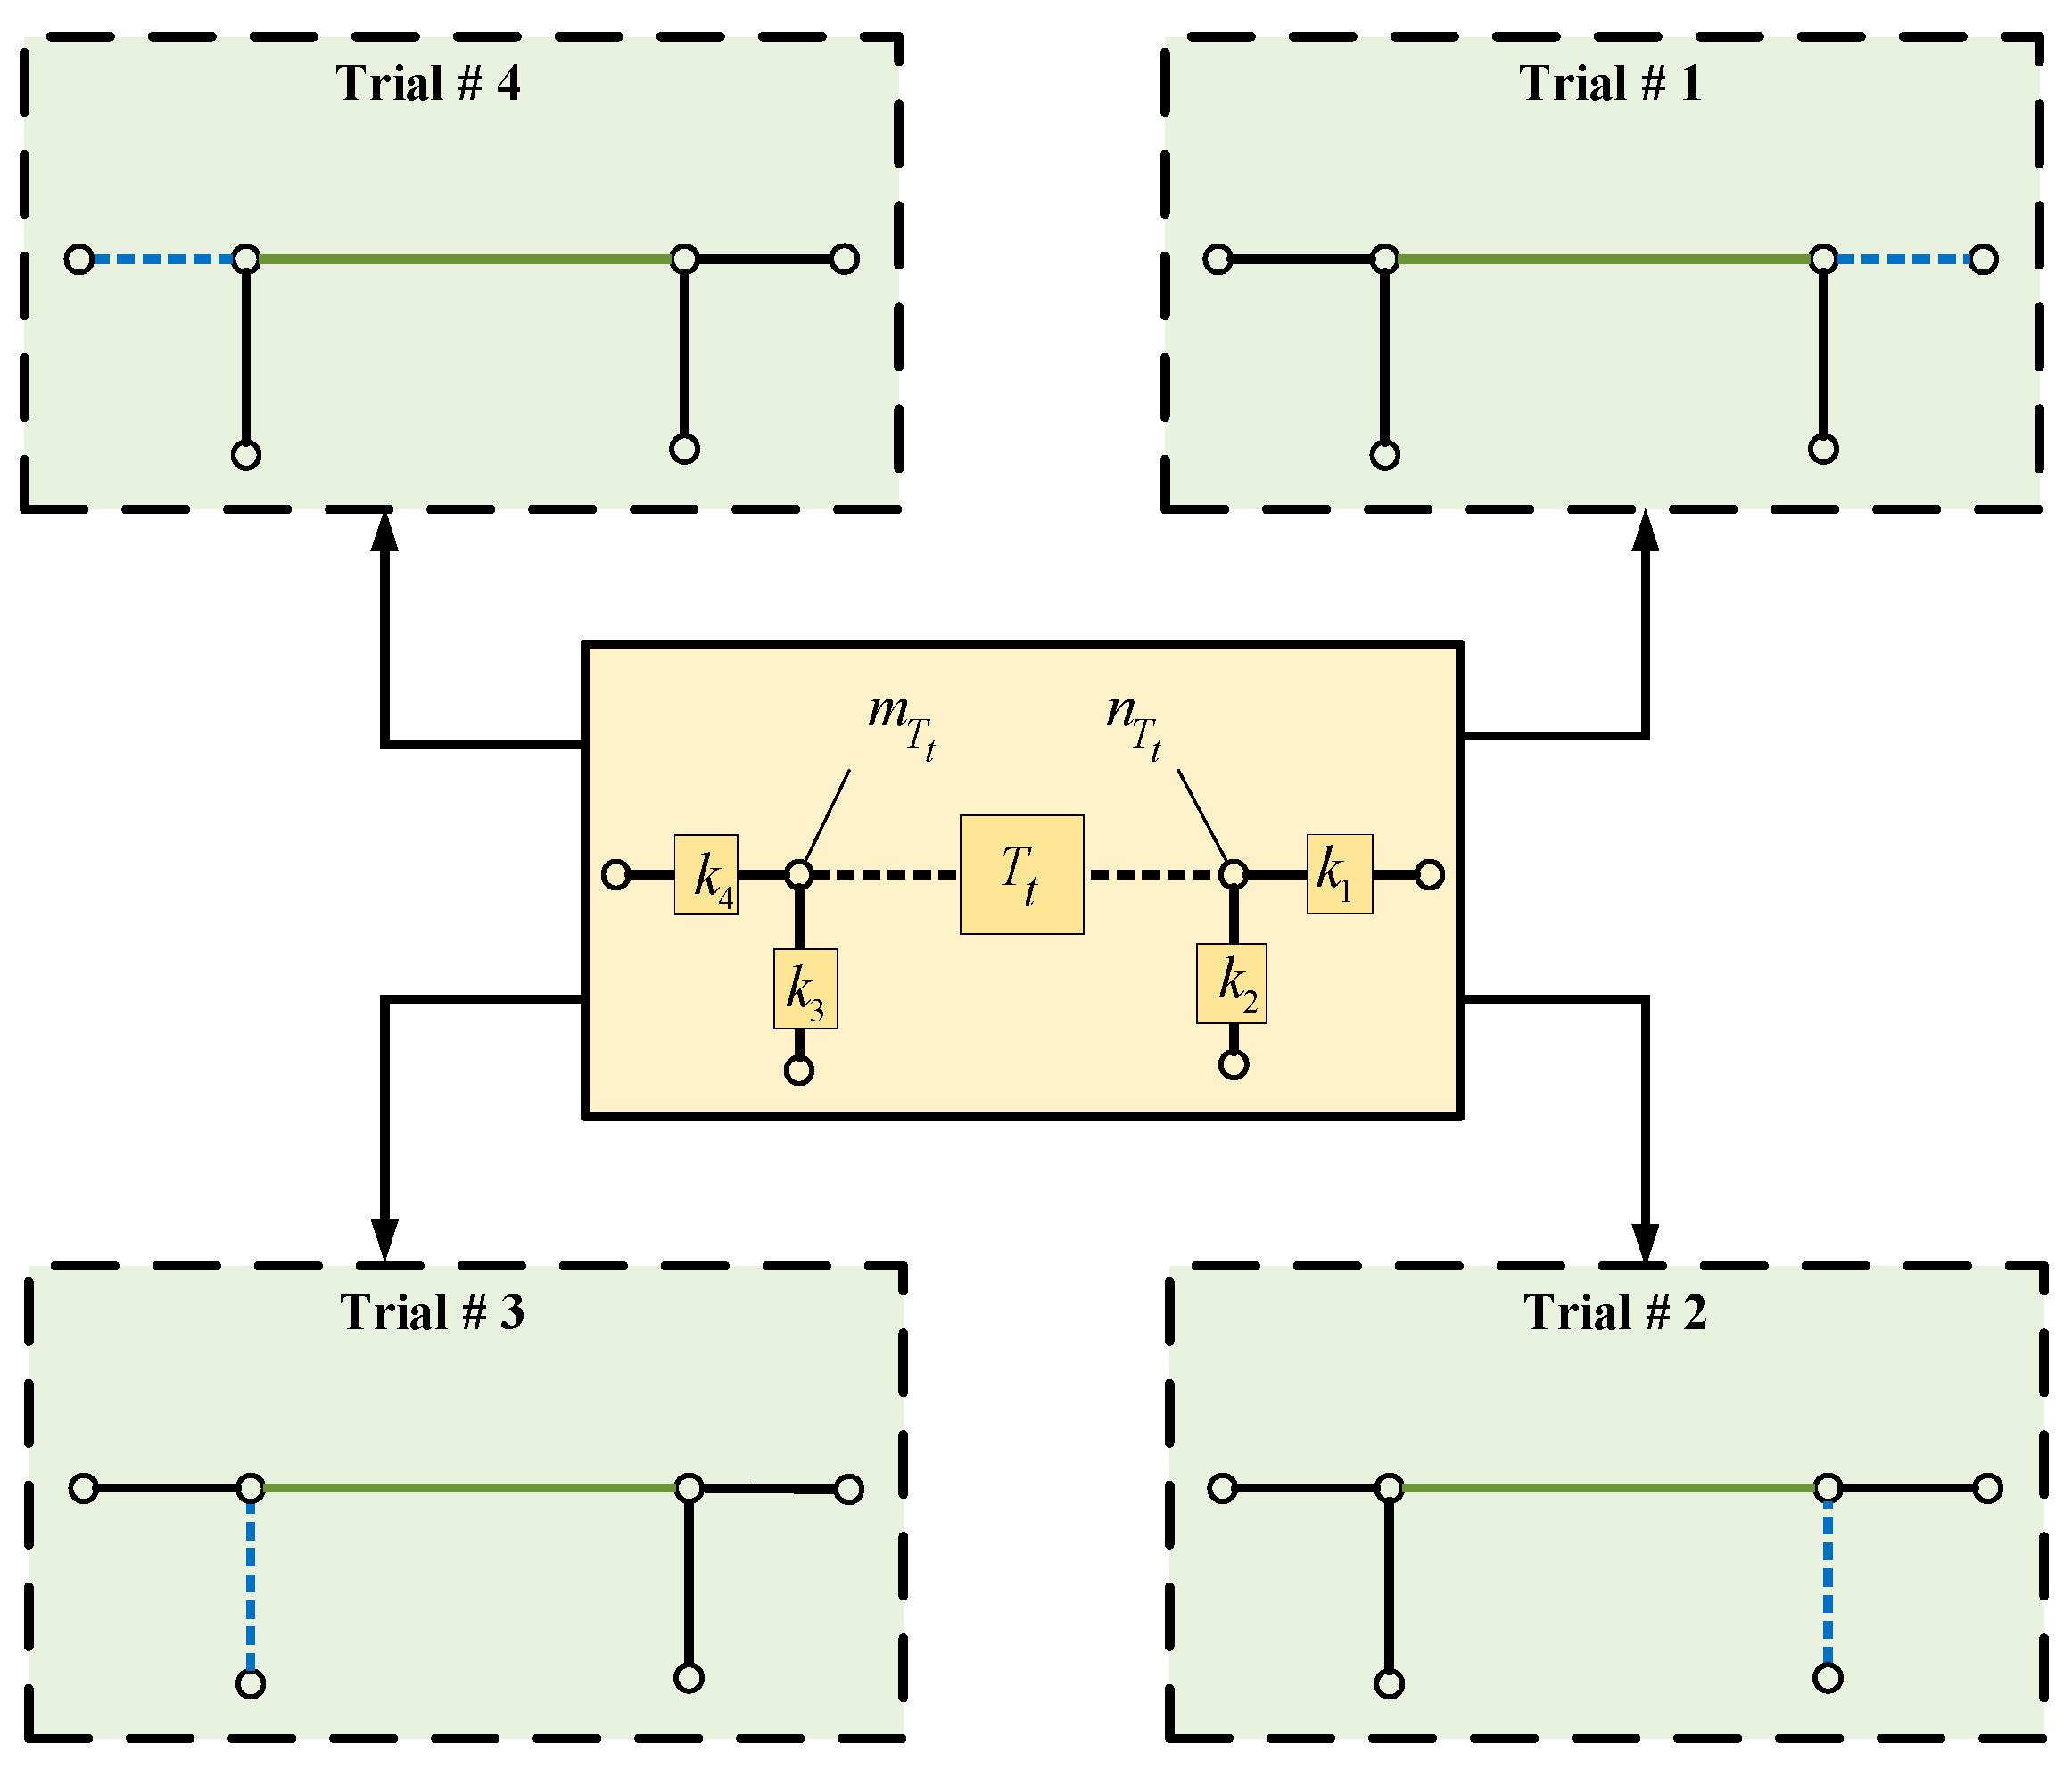
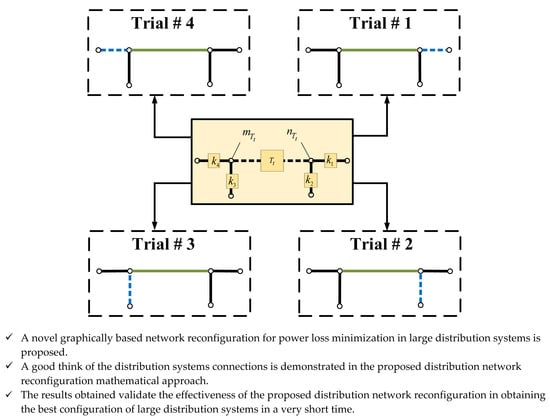
Start from the t t h tie-line in T represented by T t and connected from the m T t node to the n T t node. A set L t = { k 1 ,   k 2 , } is formed, including sectionalized lines connected by their ends to the T t line nodes, as shown in Figure 2, in which these sectionalized lines are proposed to be tie-lines where L t T and L t do not include main feeder lines.
(c)
A weighted voltage deviation ( W V D ) index is calculated for each candidate sectionalized line in the set L t and its corresponding tie-line T t . The W V D index for the E t h sectionalized line in L t is formulated as follows:
W V D = | | V m T t | | V n T t | | min { | V m T t | ,   | V n T t | } | | V m k E | | V n k E | | min { | V m k E | ,   | V n k E | }
(d)
Tie-lines and their corresponding sectionalized lines are then sorted according to their W V D value, where the highest W V D value takes the highest priority. Let N P represent the number of possible trials to reconfigure the distribution network. Further, a matrix S = [ s y u ] N P × 2 is formed, with rows y { 1 , , N P } and columns u { 1 ,   2 } . Its first and second columns include the tie-lines and their corresponding sectionalized lines, respectively, after the sorting procedure is done.
(e)
Set y = 1 .
(f)
Set X t e m p r e c ( s y 1 ) = 1 and X t e m p r e c ( s y 2 ) = 0 .
(g)
Calculate the objective function. Thus,
-
Assume that the mathematical problem is minimization. If the objective function is better than the initial objective function value, then update X b e s t r e c and repeat the reconfiguration process, starting from Step 2.
-
If the objective function value is greater than the initial objective function value or the power flow did not converge, and y < N P , then set y = y + 1 and repeat sub-step f.
-
If y = N P , then jump to Step 5.
Step 5: Display X b e s t r e c , where X b e s t r e c is the best configuration of the distribution network.

Illustrative Example on the Proposed DNR

The following example illustrates the application of the proposed DNR mathematical approach on the 16-node distribution system to achieve a better power loss minimization. The DNR procedure is illustrated in Table 1 for the 16-node distribution system. Figure 3a–c illustrates the switching actions done by the proposed DNR. The candidate L t lines connected to the T t nodes are highlighted in orange. Moreover, the new tie-lines after each iteration are highlighted in blue as shown in Figure 3b,c.

3. Problem Formulation

3.1. Objective Function

The objective functions required to be minimized are formulated as follows:
m i n   P l o s s = m i n { j = 1 N n 1 ( P j 2 + Q j 2 | V j | 2 × r j , j + 1 ) } .

3.2. Constraints

V m i n | V j | V m a x ,   j B ,
| I b | I b r a t e d ,   b L ,
z i = W ,   W { 0 , 1 } ,
where I b is the current flowing in the line b and its rated current is I b r a t e d .

4. Results and Discussion

DNR Only

The following case study is developed in MATLAB (r2019a MathWorks Inc., Natick, Massachusetts, USA), running on a Dell Latitude E7450 laptop (Dell Inc., Round Rock, Texas, USA) with 4-core Intel Core i5 CPU (Intel Corporation, Santa Clara, California and USA) at 2.3 GHz and 8 GB of RAM. In this case study, the objective function required to be minimized is P l o s s . The proposed DNR mathematical approach is tested on 16-, 33-, 70-, 83-, 136-, 415-, 880-, 1760-, and 4400-node distribution systems [21]. The 33-node system is a hypothetical system, in which its voltage level is 12.66 kV. Another set of the systems are illustrative systems (parts of real systems) that are used in previous works [21] as 16-, 70-, and 136-node distribution systems. Their voltage levels are 23, 11, and 13.8 kV, respectively. The 83-node is a real system from a power company in Taiwan [7] in which its voltage level is 11.4 kV. The 415-node system is assembled using five instances of the 83-node system with the addition of 8 new tie switches [7]. The 880-node is a hypothetical system in which its data were taken from [21]. The 1760-node system was assembled using two instances of the 880-node system by the addition of 20 extra tie switches to interconnect the two systems. The 4400-node system was built in the same manner but using 50 extra tie switches. These systems are usually examined in the literature in solving the DNR problem.
Table 2 illustrates the details of the distribution systems under study. The power loss obtained using the proposed DNR mathematical approach is compared with the corresponding power losses presented in previous works, as presented in Table 3.
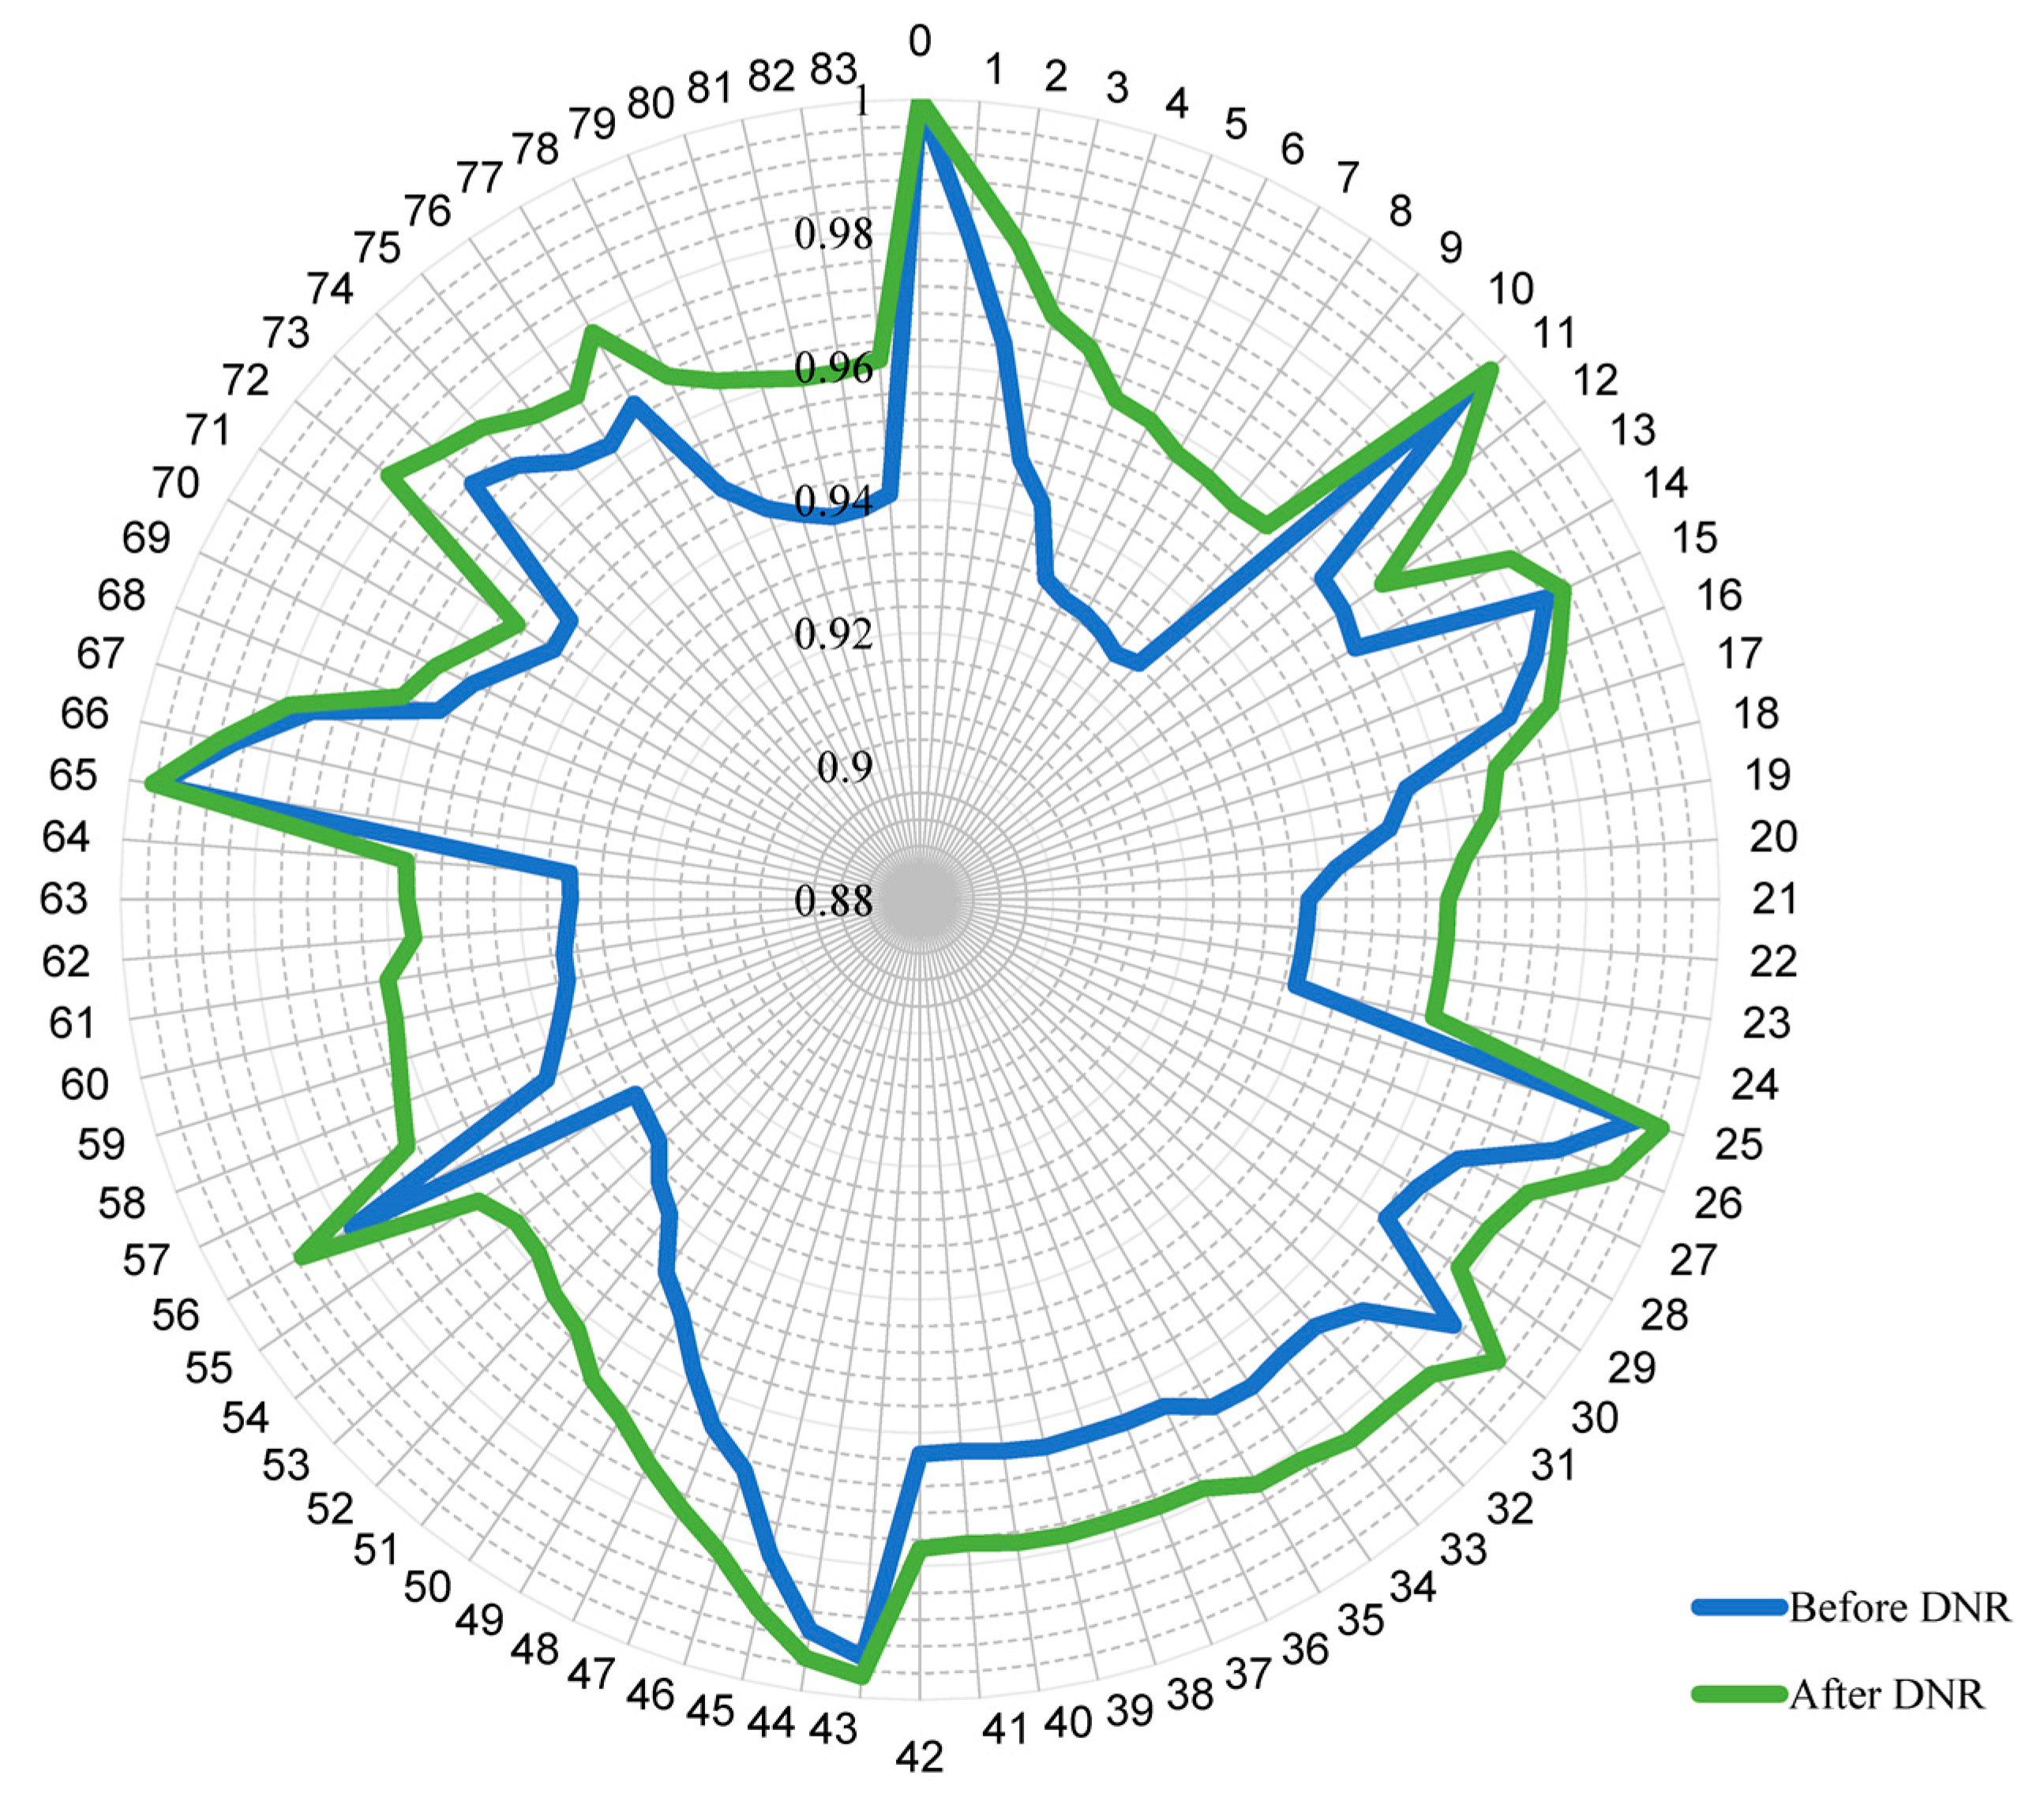
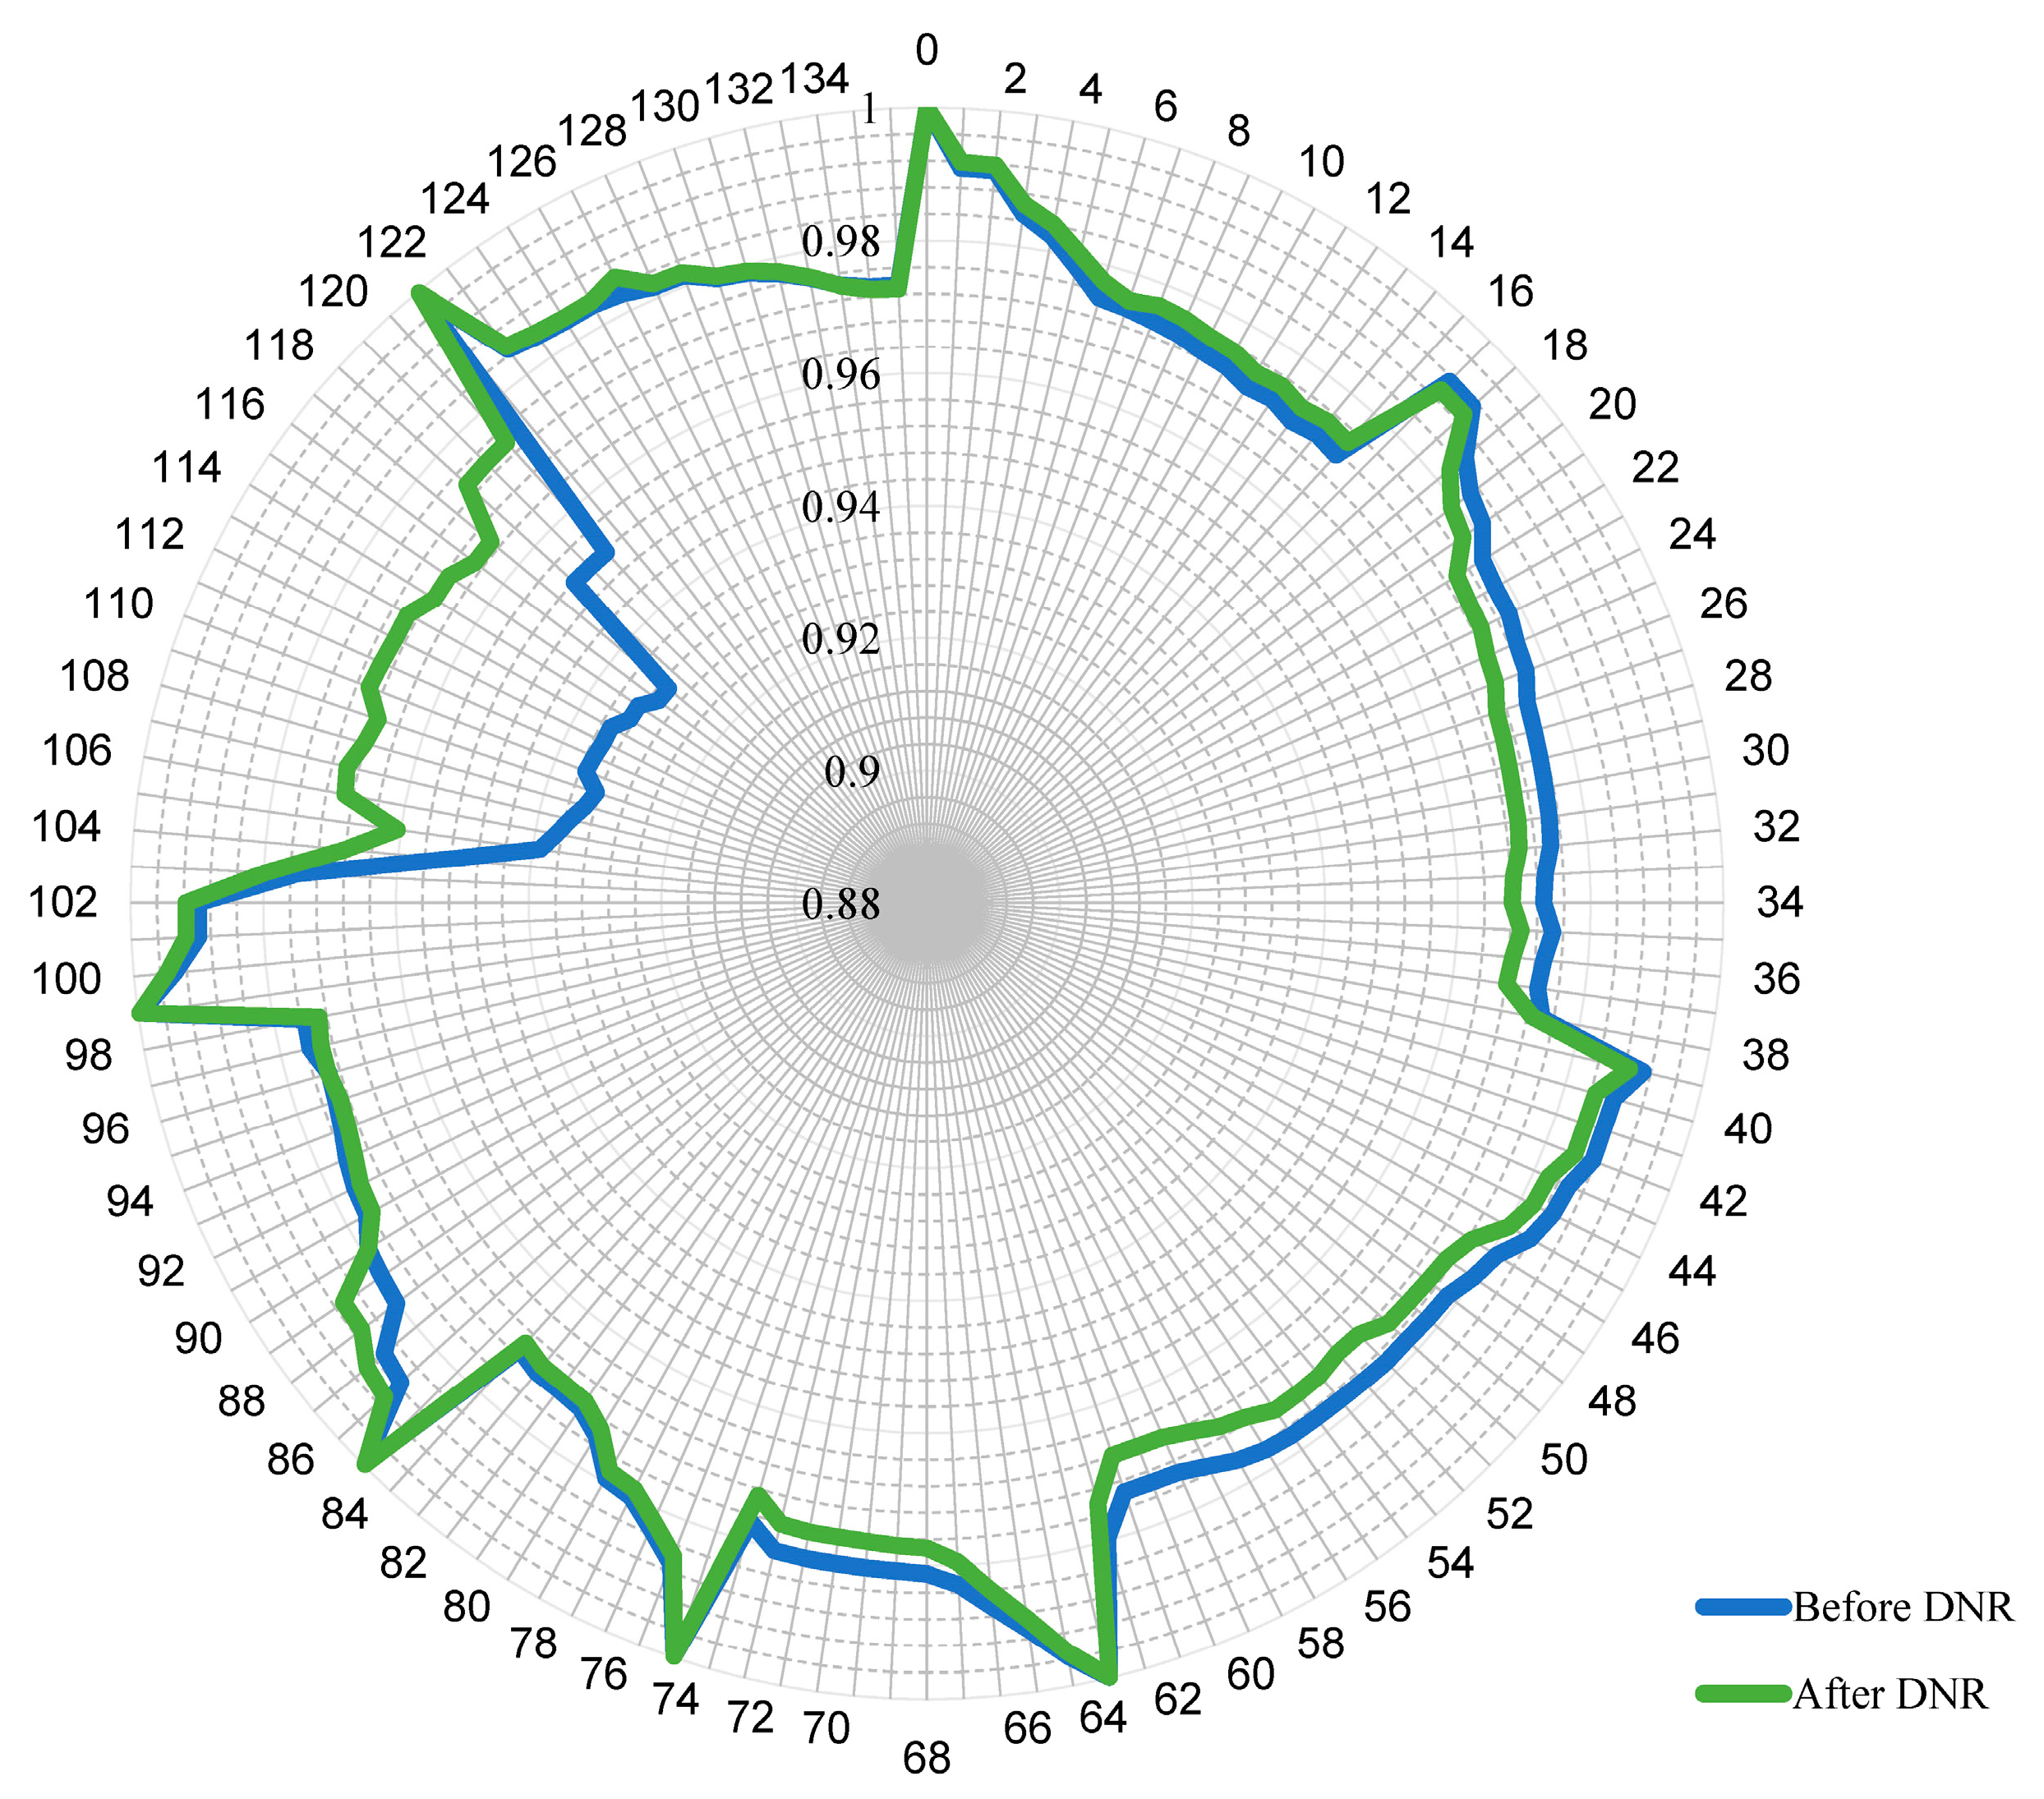
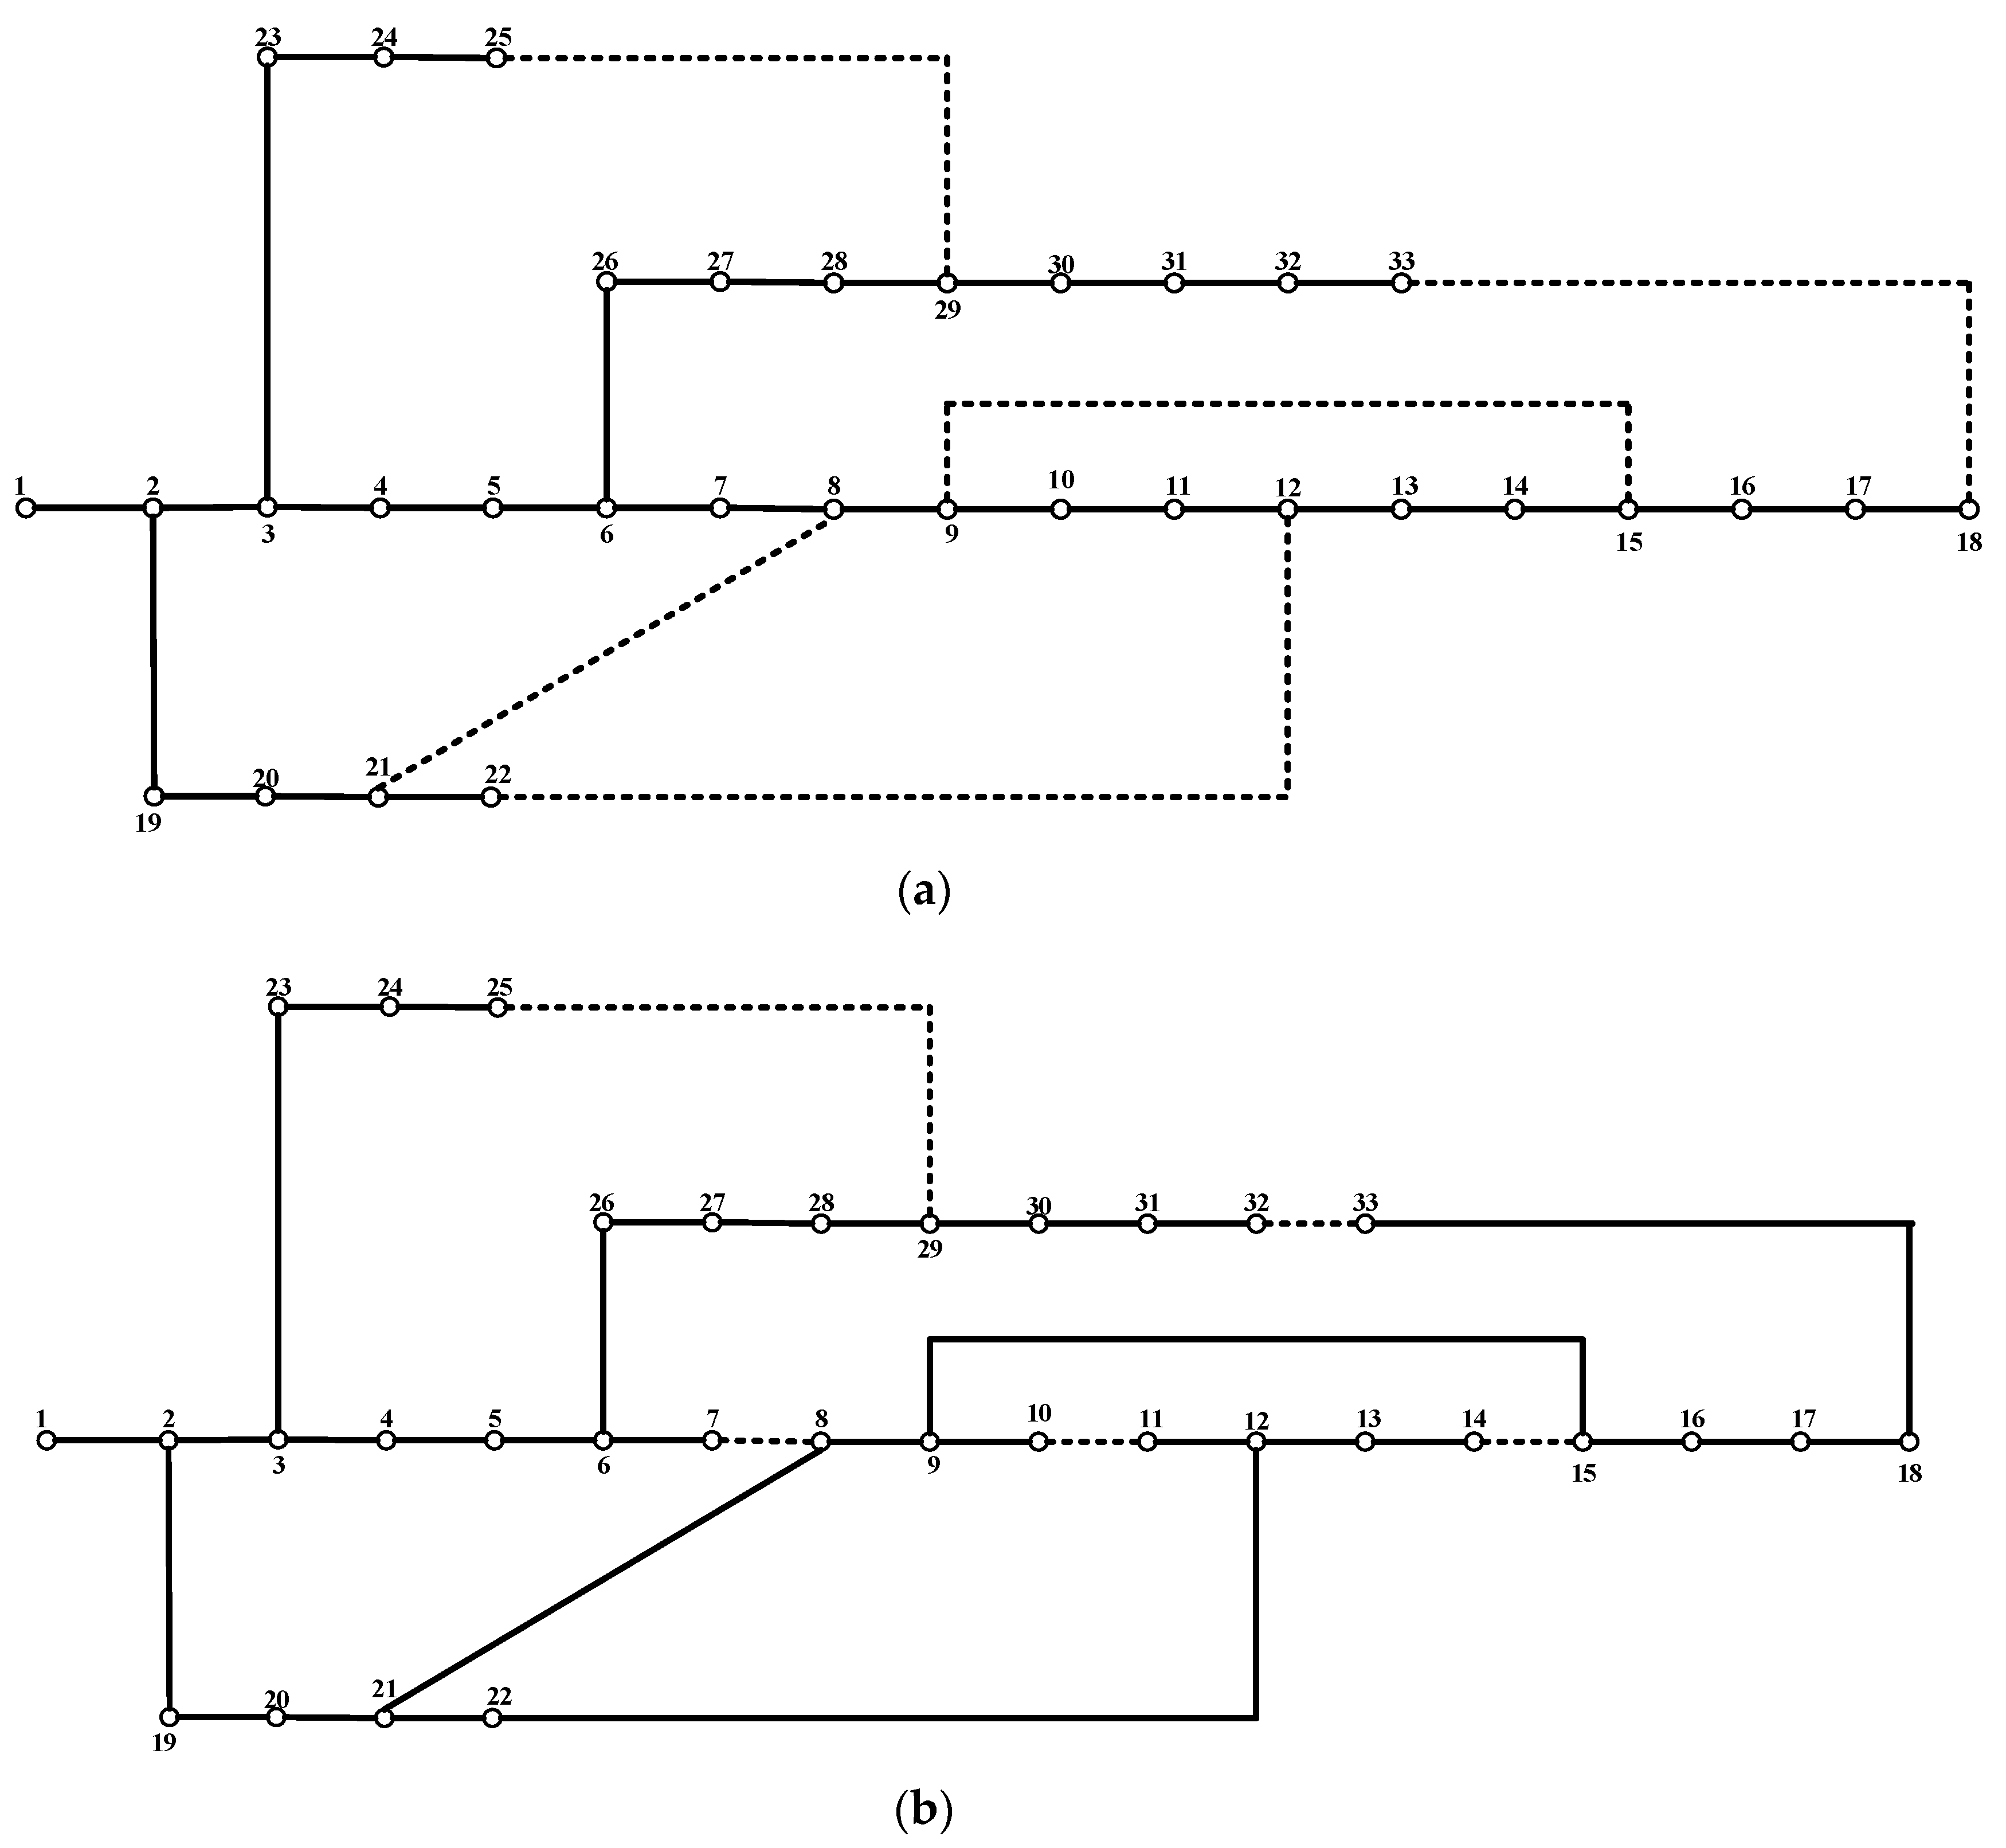
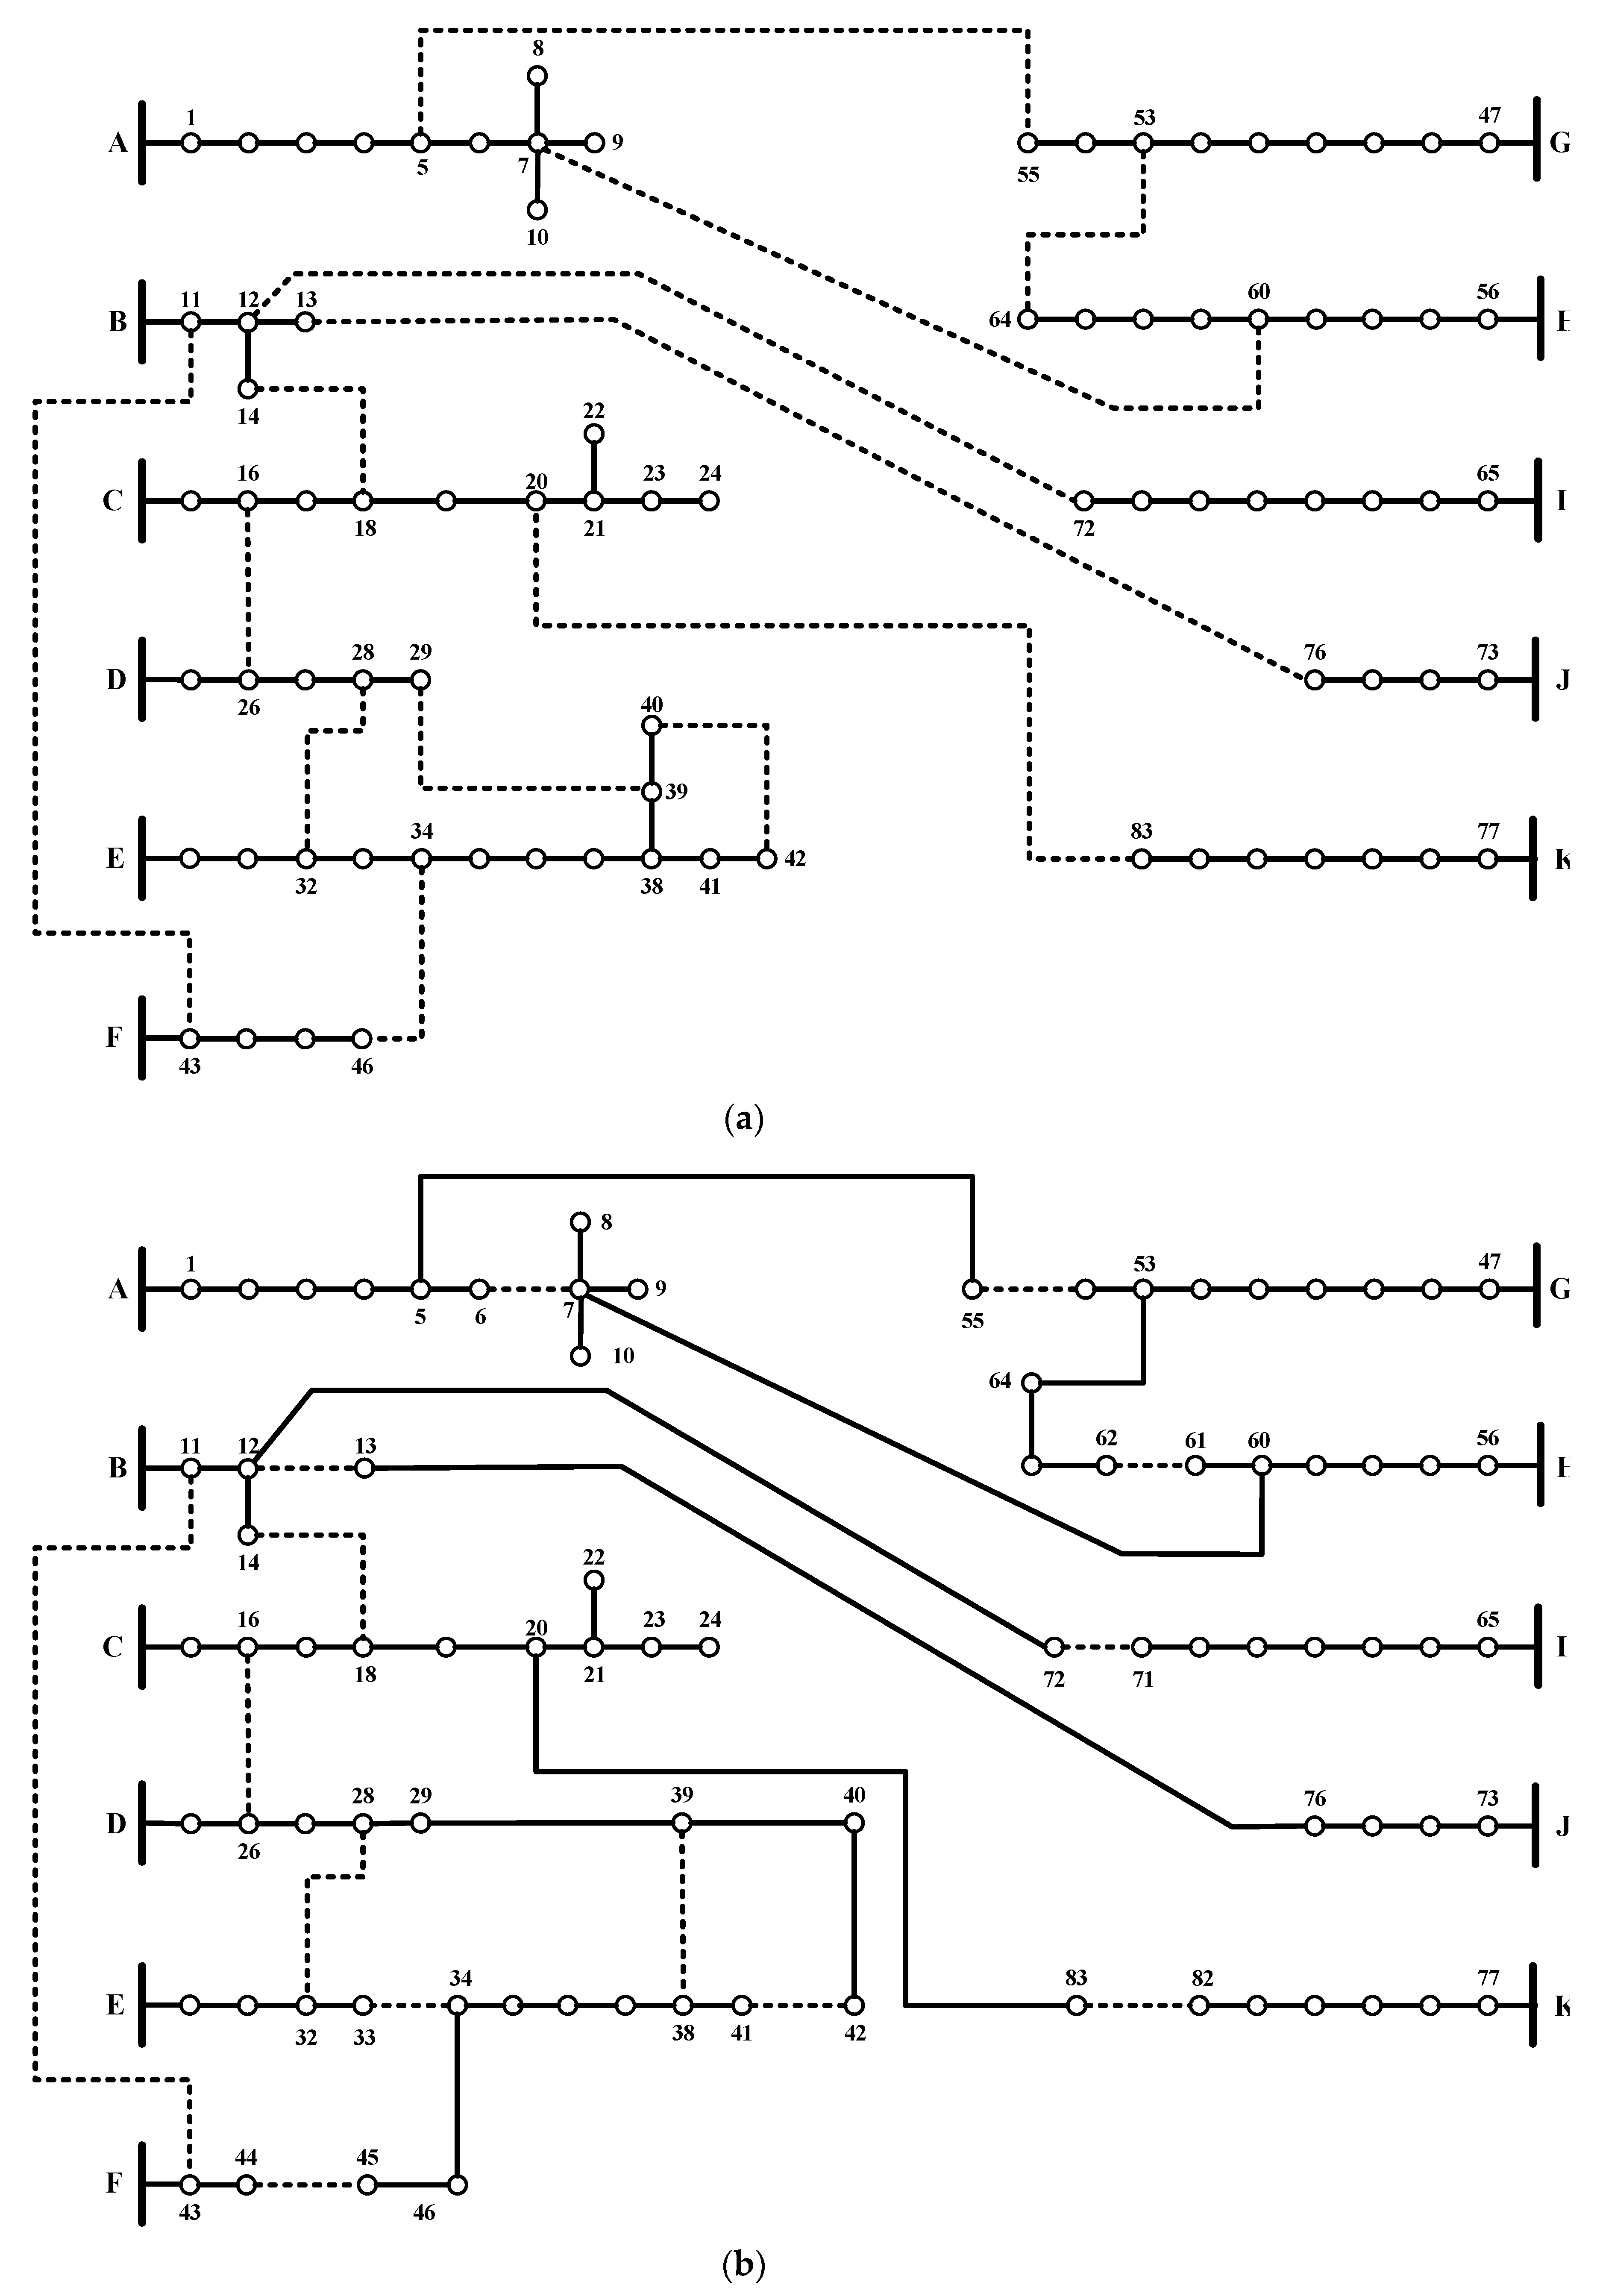
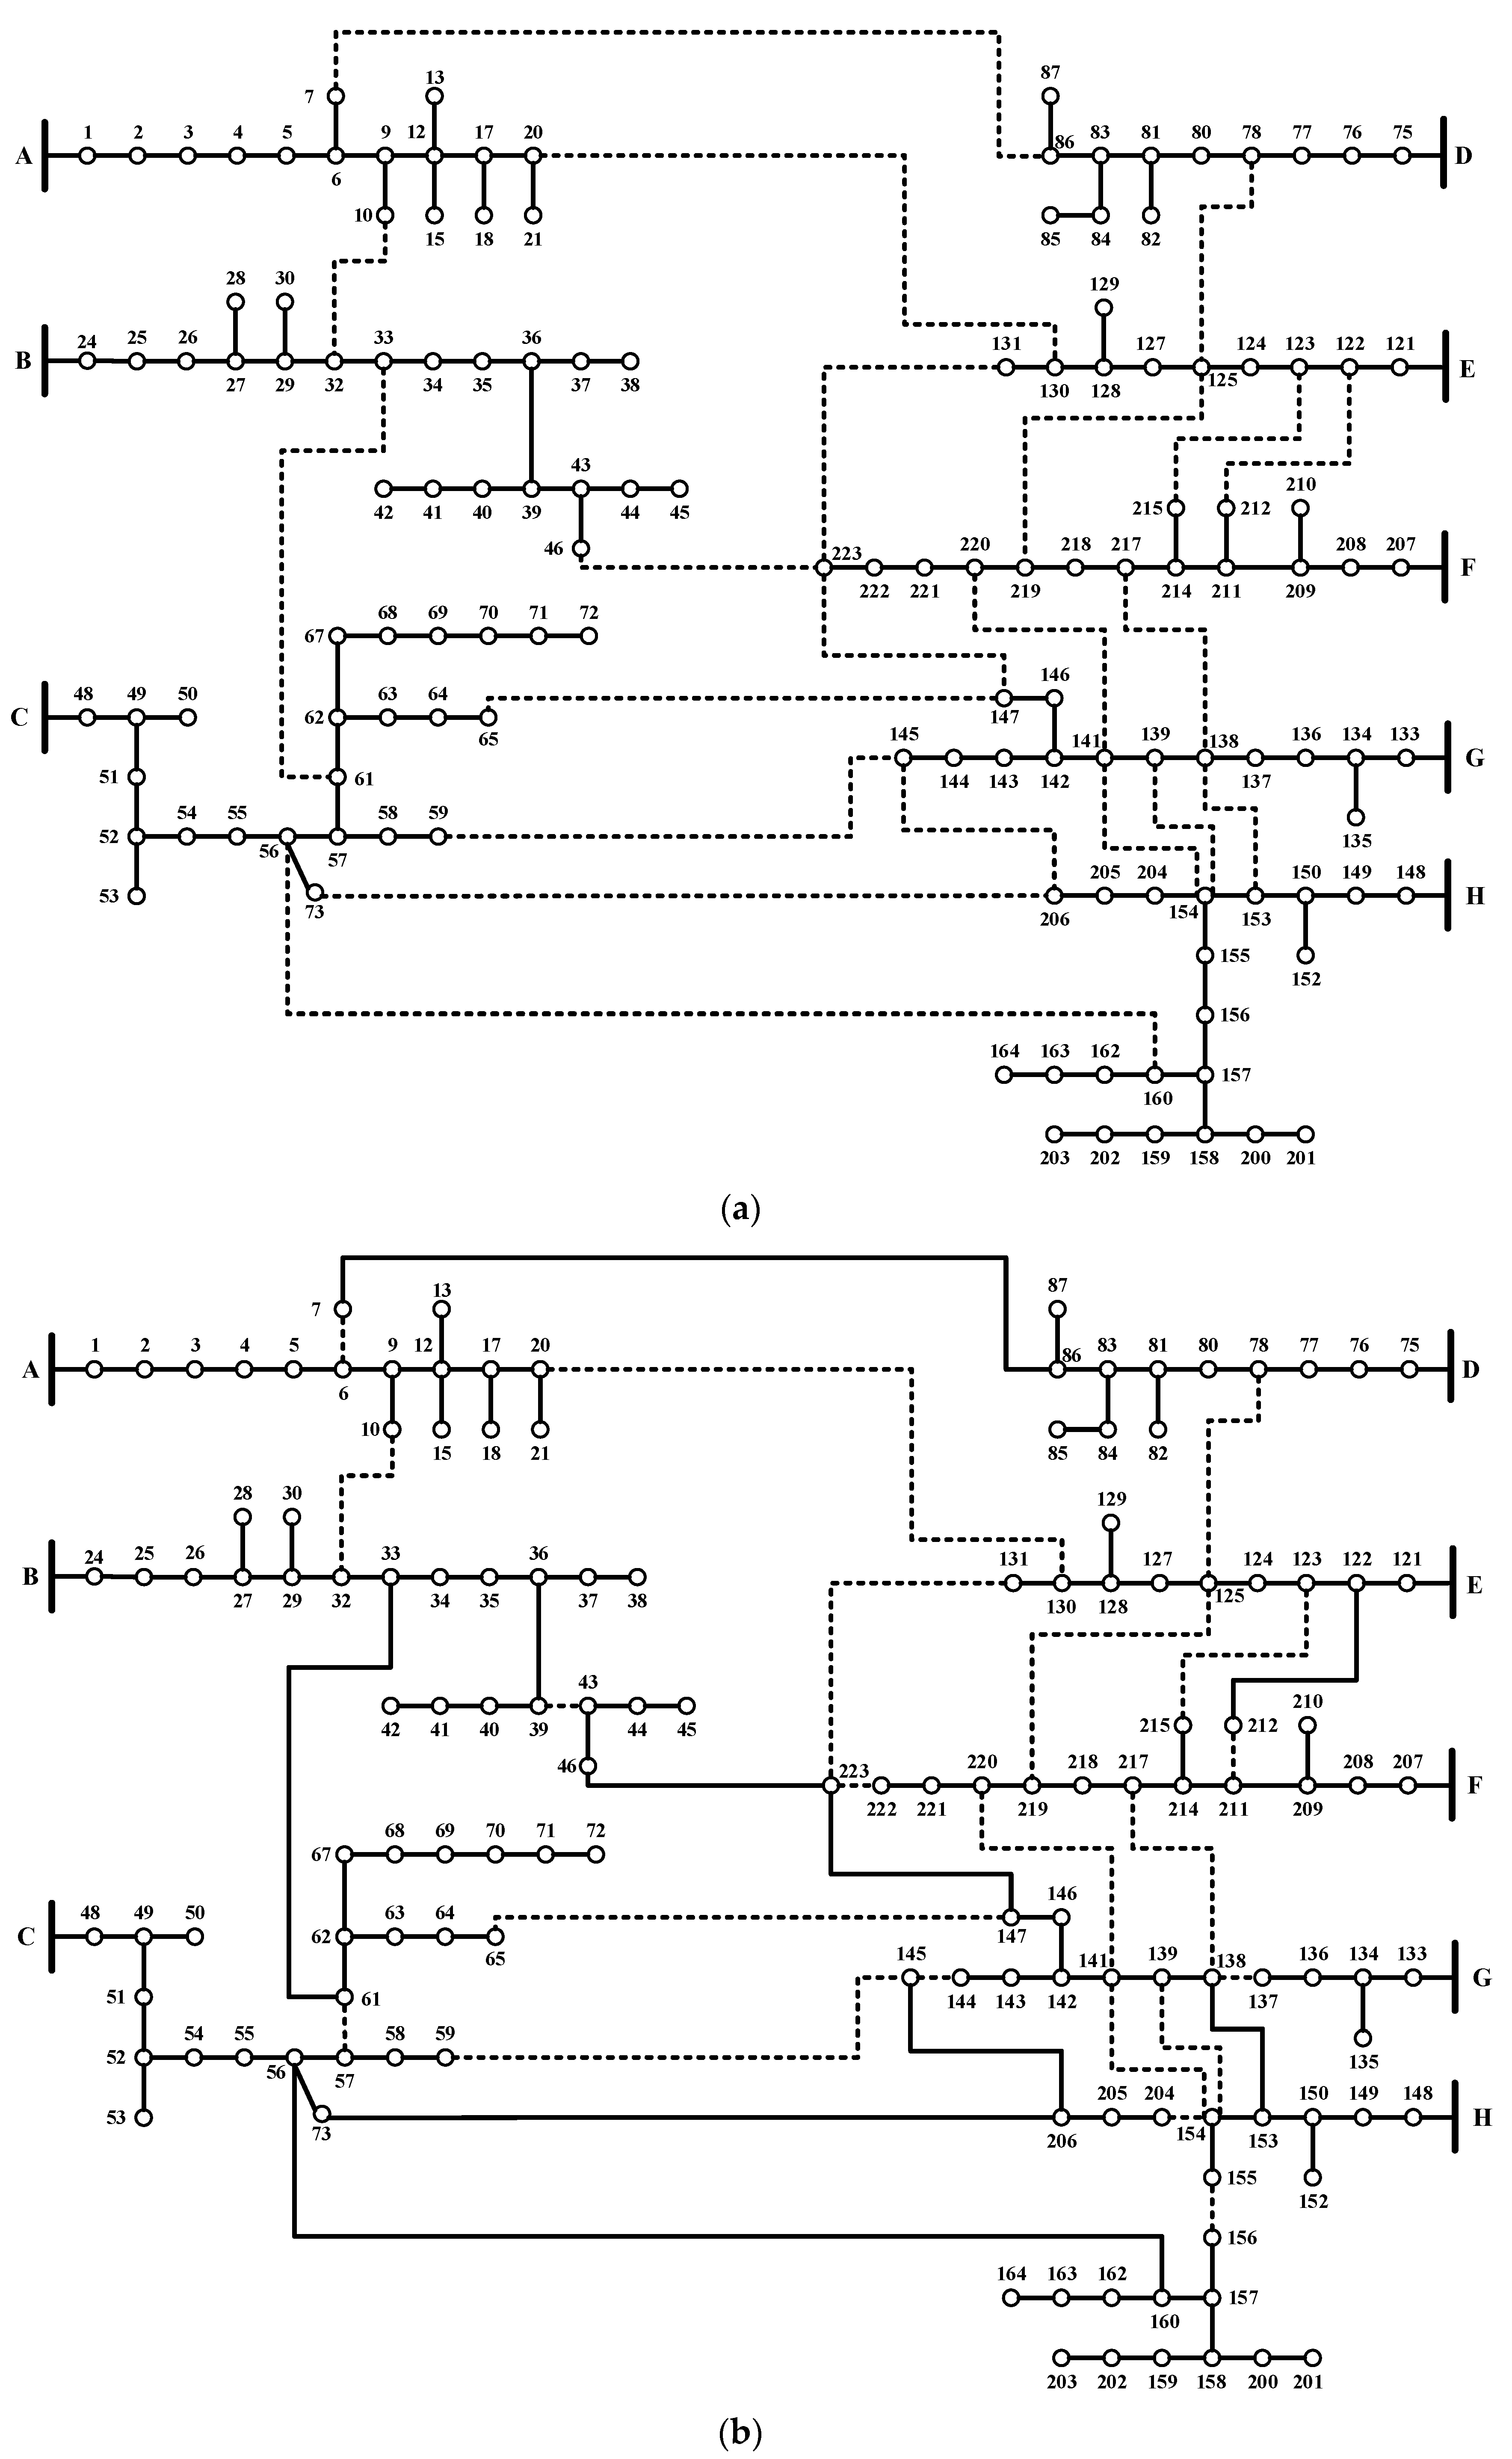
From Table 3, the ability of the proposed DNR arises in its fast search toward optimality in which its search procedure seeks to find the best exchange between tie-lines and its neighboring sectionalized lines. Before performing DNR on the 16-, 33-, 70-, 83-, 136-, 415-, 880-, 1760-, and 4400-node distribution systems, P l o s s was 511.4, 211, 227.5, 532, 320.3, 2660, 1496.4, 2992.2, and 7482.2 kW, respectively. After performing DNR, P l o s s is 466.1, 139.57, 201.4, 470.06, 280.1, 2349.4, 457.03, 822.4, and 1918.6 kW for the 16-, 33-, 70-, 83-, 136-, 415-, 880-, 1760-, and 4400-node distribution systems, respectively. From the results obtained, it was figured out that P l o s s was lower than that obtained by [18,19], [17,20], [20], [7], and [8,10] for the 33-, 70-,136-, 415-, and 880-node distribution systems, respectively. Moreover, the proposed DNR approach succeeded in minimizing P l o s s for two large distribution systems, the 1760- and 4400-node distribution systems by 72.51% and 74.35%, respectively. The results obtained are not changed for multiple runs as no randomness exists in the proposed DNR mathematical approach. In addition, the computational burden is low compared to the previous works presented in Table 3. The contour plots for the voltage profile of the 83- and 136-node distribution systems are provided in Figure 4 and Figure 5, respectively. Moreover, the 33-, 83-, and 136-node distribution system configurations before and after DNR are provided in Figure 6, Figure 7 and Figure 8, respectively. Table 4, Table 5, Table 6, Table 7 and Table 8 illustrate the optimization process using the proposed DNR for 16-, 83-, 136-, 415-, and 880-node distribution systems. The optimal configurations for the studied distribution systems are provided in Table 9.

5. Conclusions

In this work, a novel DNR mathematical approach is proposed based on the graphical structure of the distribution network under investigation. The proposed DNR mathematical approach is a direct optimization method that can obtain the best configuration of the distribution network under investigation in a fast and efficient manner. The proposed mathematical approach has been tested on various distribution systems up to a 4400-node distribution system. From this intensive study, it can be concluded that the proposed mathematical approach has provided an optimal/near-optimal solution for the reconfiguration problem even if the system is large. In addition, it has succeeded in reducing the total active losses for the 16-, 33-, 70-, 83-, 136-, 415-, 880-, 1760-, and 4400-node distribution systems by 8.85%, 33.85%, 11.47%, 11.64%, 12.55%, 11.67%, 69.45%, 72.51%, and 74.35%, respectively. Moreover, it has a fast convergence towards optimality. However, the load models and the number of the available tie switches differ in real systems than hypothetically based systems. However, the main difficulty with the real systems is the availability and completeness of their data. In this context, one can note that the losses are reduced up to >70% in the hypothetically based systems; however, in real systems such as the 83- and 415-node systems, the losses are reduced up to >11%. The difference in values clarifies the importance of handling real systems with representative load models. From experience gained from this work and other previous works by the same authors, we can say that the losses will be reduced in real systems up to >15% only. Moreover, as the cost of reinforcement is high, the economic case for the proposed DNR strategy, as a result, appears to be strong. Algorithmically, the proposed methodology can minimize power losses for any distribution system in a fast and efficient manner as validated by comparison with the results obtained from other previous studies. Therefore, applying the proposed DNR mathematical approach to modern distribution systems has fulfilled an economic aspect for different network types due to its ability to minimize the total power losses and in turn minimizing the investment costs to reinforce the existing distribution networks.
Finally, loss minimization is shown to be marginally higher performing but in a fraction of the computation time of benchmarks. Given the extensive nature of distribution, this is important from the perspective of scaling.
Future studies will be conducted to implement the proposed DNR with/without distributed generation and soft open points placement, using multi-objective optimization techniques for both balanced and unbalanced distribution systems. In addition, the impact of component-based aggregate load models on the performance of the proposed solution will be considered to emphasize the ability of the proposed DNR approach in minimizing the total power losses with various load models.

Author Contributions

I.M.D. and S.H.E.A.A. designed the problem under study; I.M.D. performed the simulations and obtained the results. S.H.E.A.A. analyzed the obtained results. I.M.D. wrote the paper, which was further reviewed by S.H.E.A.A., A.E.-R., A.Y.A., and A.F.Z.

Funding

This research received no external funding.

Conflicts of Interest

The authors declare no conflict of interest.

Abbreviations

ALOAnt-lion optimization algorithm
DC-HSSDiscrete-continuous hyper-spherical search algorithm
DNRDistribution network reconfiguration
FNSGAFast nondominated sorting genetic algorithm
GAGenetic algorithm
GPUGraphics processing unit
MICPMixed-integer cone programming
MILPMixed-integer linear programming
MINLPMixed-integer nonlinear programming
MISOCPMixed-integer second-order cone programming

Nomenclature

i t Iteration number.
L , B The set of lines (edges) and nodes (vertices), respectively.
M Line-node incidence matrix.
N b , N n The number of lines and nodes, respectively.
N P The number of possible trials to reconfigure the distribution network.
P j , Q j The injected active and reactive powers at the j t h node.
P j + 1 L , Q j + 1 L The active and reactive powers of the connected loads onto node j + 1 .
r j , j + 1 , x j , j + 1 The feeder resistance and reactance between nodes j and j + 1 .
| V j | The magnitude of the j t h node voltage.
WVD Weighted voltage deviation index.
X b e s t r e c The best configuration of the distribution network.
X t e m p r e c The temporary configuration of the distribution network.

References

  1. Sulaima, M.F.; Mohamad, M.F.; Jali, M.H.; Bukhari, W.M.; Baharom, M.F. A comparative study of optimization methods for 33kV distribution network feeder reconfiguration. Int. J. Appl. Eng. Res. 2014, 9, 1169–1182. [Google Scholar]
  2. Strategies for Reducing Losses in Distribution Networks. Imperial College London. 2018. Available online: https://www.ukpowernetworks.co.uk/losses/static/pdfs/strategies-for-reducing-losses-indistribution networks.d1b2a6f.pdf (accessed on 1 November 2019).
  3. Ismael, S.M.; Abdel Aleem, S.H.E.; Abdelaziz, A.Y.; Zobaa, A.F. Practical considerations for optimal conductor reinforcement and hosting capacity enhancement in radial distribution systems. IEEE Access 2018, 6, 27268–27277. [Google Scholar] [CrossRef]
  4. Ismael, S.; Abdel Aleem, S.; Abdelaziz, A.; Zobaa, A. Probabilistic hosting capacity enhancement in non-sinusoidal power distribution systems using a hybrid PSOGSA optimization algorithm. Energies 2019, 12, 1018. [Google Scholar] [CrossRef] [Green Version]
  5. Badran, O.; Mekhilef, S.; Mokhlis, H.; Dahalan, W. Optimal reconfiguration of distribution system connected with distributed generations: A review of different methodologies. Renew. Sustain. Energy Rev. 2017, 73, 854–867. [Google Scholar] [CrossRef]
  6. Paterakis, N.G.; Mazza, A.; Santos, S.F.; Erdinc, O.; Chicco, G.; Bakirtzis, A.G.; Catalao, J.P.S. Multi-objective reconfiguration of radial distribution systems using reliability indices. IEEE Trans. Power Syst. 2016, 31, 1048–1062. [Google Scholar] [CrossRef]
  7. Jabr, R.A.; Singh, R.; Pal, B.C. Minimum loss network reconfiguration using mixed-integer convex programming. IEEE Trans. Power Syst. 2012, 27, 1106–1115. [Google Scholar] [CrossRef]
  8. Ahmadi, H.; Marti, J.R. Distribution system optimization based on a linear power-flow formulation. IEEE Trans. Power Deliv. 2015, 30, 25–33. [Google Scholar] [CrossRef]
  9. Das, D. A fuzzy multiobjective approach for network reconfiguration of distribution systems. IEEE Trans. Power Deliv. 2006, 21, 202–209. [Google Scholar] [CrossRef]
  10. Taylor, J.A.; Hover, F.S. Convex models of distribution system reconfiguration. IEEE Trans. Power Syst. 2012, 27, 1407–1413. [Google Scholar] [CrossRef]
  11. Ali, E.S.; Abd Elazim, S.M.; Abdelaziz, A.Y. Ant lion optimization algorithm for optimal location and sizing of renewable distributed generations. Renew. Energy 2017, 101, 1311–1324. [Google Scholar] [CrossRef]
  12. Gandomkar, M.; Vakilian, M.; Ehsan, M. A genetic–based tabu search algorithm for optimal DG allocation in distribution networks. Electr. Power Compon. Syst. 2005, 33, 1351–1362. [Google Scholar] [CrossRef]
  13. Borges, C.L.T.; Falcão, D.M. Optimal distributed generation allocation for reliability, losses, and voltage improvement. Int. J. Electr. Power Energy Syst. 2006, 28, 413–420. [Google Scholar] [CrossRef]
  14. Roberge, V.; Tarbouchi, M.; Okou, F.A. Distribution system optimization on graphics processing unit. IEEE Trans. Smart Grid 2017, 8, 1689–1699. [Google Scholar] [CrossRef]
  15. Diaaeldin, I.; Abdel Aleem, S.; El-Rafei, A.; Abdelaziz, A.; Zobaa, A.F. Optimal network reconfiguration in active distribution networks with soft open points and distributed generation. Energies 2019, 12, 4172. [Google Scholar] [CrossRef] [Green Version]
  16. Chang, C.-F. Reconfiguration and capacitor placement for loss reduction of distribution systems by ant colony search algorithm. IEEE Trans. Power Syst. 2008, 23, 1747–1755. [Google Scholar] [CrossRef]
  17. Enacheanu, B.; Raison, B.; Caire, R.; Devaux, O.; Bienia, W.; HadjSaid, N. Radial network reconfiguration using genetic algorithm based on the matroid theory. IEEE Trans. Power Syst. 2008, 23, 186–195. [Google Scholar] [CrossRef]
  18. de Oliveira, L.W.; de Oliveira, E.J.; Gomes, F.V.; Silva, I.C.; Marcato, A.L.M.; Resende, P.V.C. Artificial immune systems applied to the reconfiguration of electrical power distribution networks for energy loss minimization. Int. J. Electr. Power Energy Syst. 2014, 56, 64–74. [Google Scholar] [CrossRef]
  19. Wu, W.-C.; Tsai, M.-S. Application of enhanced integer coded particle swarm optimization for distribution system feeder reconfiguration. IEEE Trans. Power Syst. 2011, 26, 1591–1599. [Google Scholar] [CrossRef]
  20. Eldurssi, A.M.; O’Connell, R.M. A fast nondominated sorting guided genetic algorithm for multi-objective power distribution system reconfiguration problem. IEEE Trans. Power Syst. 2015, 30, 593–601. [Google Scholar] [CrossRef]
  21. Roberge, V. Distribution Feeder Reconfiguration (DFR) Test Cases. Available online: http://roberge.segfaults.net/joomla/index.php/dfr (accessed on 1 November 2019).
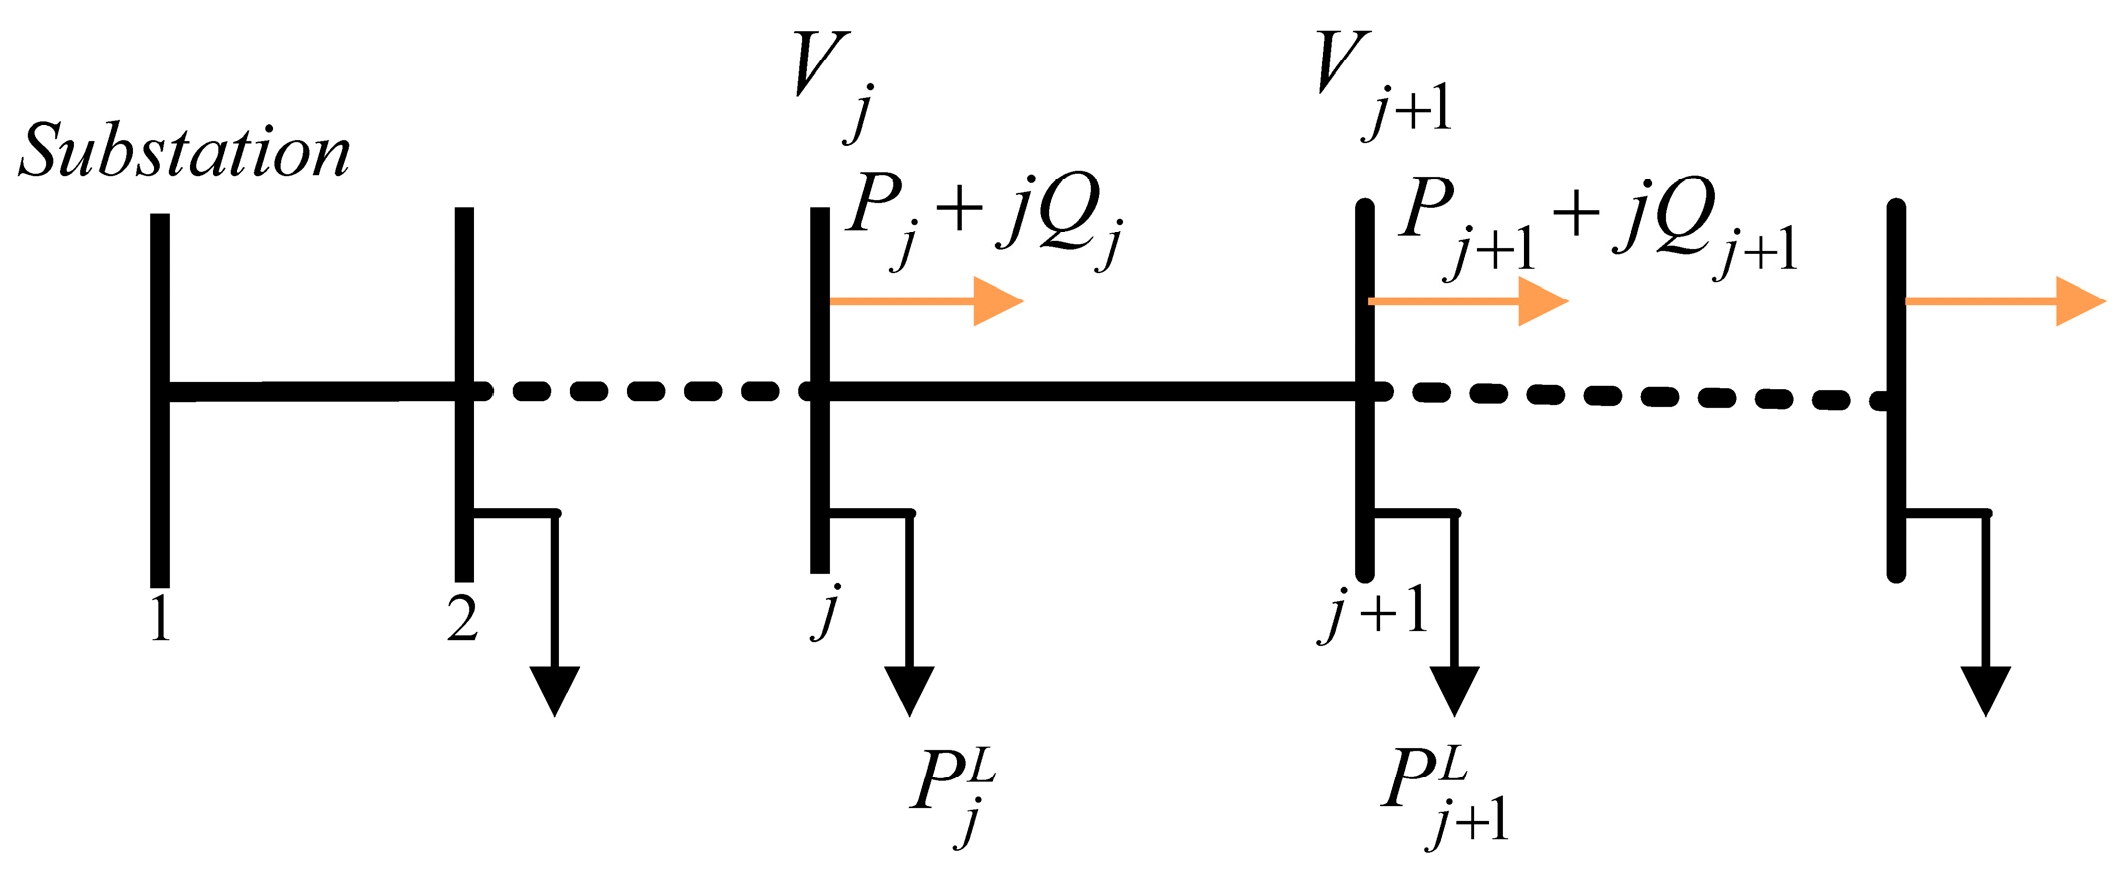
Figure 1. Distribution system modeling.
Mathematics 07 01182 g001
Figure 2. Possible trials for exchanging tie-line T t with its neighboring sectionalized lines.
Mathematics 07 01182 g002
Figure 3. DNR procedure for 16-node distribution system: (a) Initial configuration, (b) iteration 1 and (c) iteration 2.
Mathematics 07 01182 g003
Figure 4. Voltage profile before and after DNR for the 83-node distribution system.
Mathematics 07 01182 g004
Figure 5. Voltage profile before and after DNR for the 136-node distribution system.
Mathematics 07 01182 g005
Figure 6. 33-node distribution system: (a) Before DNR, (b) after DNR.
Mathematics 07 01182 g006
Figure 7. 83-node distribution system: (a) Before DNR, (b) after DNR.
Mathematics 07 01182 g007
Figure 8. 136-node distribution system: (a) Before DNR, (b) after DNR.
Mathematics 07 01182 g008
Table 1. Distribution network reconfiguration procedure for the 16-node distribution system.
i t   * Before SortingAfter Sorting Set   X t e m p r e c = X b e s t r e c ,
Then Set X t e m p r e c ( s y 1 ) = 1 and X t e m p r e c ( s y 2 ) = 0
T t T t   Nodes L t W V D Priority y s y 1 s y 2 Losses Reduction (%)Decision
113 m T t 510.0153311410NA **Jump to y = 2
n T t 1170.0182221373.568Update X b e s t r e c and jump to i t = 2
14 m T t 1060.016943131NANA
n T t 14100.018714146
15 m T t 730.0055651512
n T t 16120.006156153
27 m T t 950.0094411410NAJump to y = 2
n T t 11130.018122713NAJump to y = 3
14 m T t 1060.0167331468.854Update X b e s t r e c and jump to i t = 3
n T t 14100.01861475NANA
15 m T t 730.0054651512
n T t 16120.006156153
36 m T t 850.000361713NAJump to y = 2
n T t 10140.00823278NAJump to y = 3
7 m T t 980.013723614NAJump to y = 4
n T t 11130.0156141512NAJump to y = 5
15 m T t 730.003255153NAJump to y = 6
n T t 16120.00384665NATerminate and display X b e s t r e c
* i t : Iteration number performed by the proposed DNR mathematical approach. ** NA: Not applicable: It means that either the iteration is terminated without finding a better loss reduction percent or a better loss reduction percent was reached before y become equal to N p .
Table 2. Distributions systems for the DNR case study.
Distribution SystemFeeders N n N b Load (MVA)
16-node3131628.7 + 17.3 i
33-node132373.7 + 2.3 i
70-node268794.5 + 3.1 i
83-node11839628.4 + 20.7 i
135-node813515618.3 + 7.9 i
415-node55415480141.8 + 103.5 i
880-node7873900124.9 + 74.4 i
1760-node1417461820249.7 + 148.7 i
4400-node3543654550624.4 + 371.8 i
Table 3. Comparison of the proposed DNR with previous works.
SystemRef. P l o s s   ( kW ) Q l o s s   ( kVAr ) min | V j | Average Time (s)
16-nodeInitial511.4590.40.969NA
[16]466.1544.90.9721.81
[17]466.1544.90.9722.10
Proposed466.1544.90.9720.10
33-nodeInitial211.0143.00.904NA
[18]139.6102.30.9384.64
[19]139.6102.30.938160
Proposed139.57102.30.9380.55
70-nodeInitial227.5204.90.905NA
[17]203.2186.60.9314.64
[20]203.9191.10.927160
Proposed201.4185.10.9310.70
83-nodeInitial532.01374.30.929NA
[19]471.11252.10.95236.1
[7]469.91248.00.953160
Proposed470.061248.00.9531.4
136-nodeInitial320.3702.70.931NA
[20]280.7611.00.96132.6
[7]280.1611.10.9591800
Proposed280.1611.10.95935.1
415-nodeInitial2660.06871.60.929NA
[7]2359.9NANA1800
[7]2350.7NANA1800
Proposed2349.46240.00.95370
880-nodeInitial1496.41396.50.956NA
[10]461.4NA0.9823192
[8]461.0566.70.9921134
Proposed457.03563.30.992310
1760-nodeInitial2992.22793.00.956NA
Proposed822.41020.30.9921400
4400-nodeInitial7482.26982.50.956NA
Proposed1918.62412.70.99173600
Table 4. DNR optimization process for the 16-node distribution system.
i t Configuration (Tie-Lines)Losses (kW)
013, 14, 15511.40
17, 14, 15493.15
26, 7, 15466.12
Table 5. DNR optimization process for the 83-node distribution system.
i t Configuration (Tie-Lines)Losses (kW)
083, 84, 85, 86, 87, 88, 89, 90, 91, 92, 93, 94, 95532.00
16, 83, 85, 86, 87, 88, 89, 90, 91, 92, 93, 94, 95512.54
116, 12, 33, 38, 41, 54, 61, 71, 82, 85, 88, 89, 91470.06
Table 6. DNR optimization process for the 136-node distribution system.
i t Configuration (Tie-Lines)Losses (kW)
0135, 136, 137, 138, 139, 140, 141, 142, 143, 144, 145, 146, 147, 148, 149, 150, 151, 152, 153, 154, 155320.36
1109, 135, 136, 137, 138, 139, 140, 141, 142, 143, 144, 145, 146, 147, 148, 149, 150, 151, 153, 154, 155303.74
146, 34, 50, 89, 95, 105, 117, 125, 134, 136, 137, 140, 141, 143, 144, 145, 146, 147, 149, 150, 154280.18
Table 7. DNR optimization process for 415-node distribution system.
i t Configuration (Tie-Lines)Losses (kW)
0415, 416, 417, 418, 419, 420, 421, 422, 423, 424, 425, 426, 427, 428, 429, 430, 431, 432, 433, 434, 435,
436, 437, 438, 439, 440, 441, 442, 443, 444, 445, 446, 447, 448, 449, 450, 451, 452, 453, 454, 455, 456,
457, 458, 459, 460, 461, 462, 463, 464, 465, 466, 467, 468, 469, 470, 471, 472, 473, 474, 475, 476,
477, 478, 479
2660.0
16, 415, 417, 418, 419, 420, 421, 422, 423, 424, 425, 426, 427, 428, 429, 430, 431, 432, 433, 434, 435,
436, 437, 438, 439, 440, 441, 442, 443, 444, 445, 446, 447, 448, 449, 450, 451, 452, 453, 454, 455, 456,
457, 458, 459, 460, 461, 462, 463, 464, 465, 466, 467, 468, 469, 470, 471, 472, 473, 474, 475, 476,
477, 478, 479
2640.4
556, 12, 33, 38, 41, 54, 61, 71, 82, 89, 95, 116, 121, 124, 137, 144, 154, 165, 172, 178, 199, 204, 207, 220,
227, 237, 248, 255, 261, 282, 287, 290, 303, 310, 320, 331, 338, 344, 365, 370, 373, 386, 393, 403, 414,
417, 420, 421, 423, 430, 433, 434, 436, 443, 446, 447, 449, 456, 459, 460, 462, 469, 472, 473, 475
2349.4
Table 8. DNR optimization process for the 880-node distribution system.
i t Configuration (Tie-Lines)Losses (kW)
0873, 874, 875, 876, 877, 878, 879, 880, 881, 882, 883, 884, 885, 886, 887, 888, 889, 890, 891, 892, 893,
894, 895, 896, 897, 898, 899
1496.4
1793, 873, 874, 875, 876, 877, 878, 879, 880, 881, 882, 883, 884, 885, 886, 887, 888, 890, 891, 892, 893,
894, 895, 896, 897, 898, 899
1484.9
11183, 129, 140, 158, 189, 281, 287, 305, 311, 408, 410, 451, 493, 595, 615, 629, 630, 636, 697, 814, 843,
884, 887, 888, 889, 895, 899
457.0
Table 9. Distribution systems’ configuration after DNR.
SystemConfiguration (Tie-Lines)
16-node6, 7, 15
33-node6, 9, 13, 31, 36
70-node12, 29, 44, 50, 65, 69, 74, 75, 76, 77, 78
83-node6, 12, 33, 38, 41, 54, 61, 71, 82, 85, 88, 89, 91
136-node6, 34, 50, 89, 95, 105, 117, 125, 134, 136, 137, 140, 141, 143, 144, 145, 146, 147, 149, 150, 154
415-node6, 12, 33, 38, 41, 54, 61, 71, 82, 89, 95, 116, 121, 124, 137, 144, 154, 165, 172, 178, 199, 204, 207, 220, 227, 237, 248, 255, 261, 282, 287, 290, 303, 310, 320, 331, 338, 344, 365, 370, 373, 386, 393, 403, 414, 417, 420, 421, 423, 430, 433, 434, 436, 443, 446, 447, 449, 456, 459, 460, 462, 469, 472, 473, 475
880-node83, 129, 140, 158, 189, 281, 287, 305, 311, 408, 410, 451, 493, 595, 615, 629, 630, 636, 697, 814, 843, 884, 887, 888, 889, 895, 899
1760-node83, 117, 128, 133, 166, 189, 243, 281, 288, 305, 311, 343, 406, 412, 425, 451, 458, 493, 585, 613, 627, 629, 633, 638, 647, 680, 697, 793, 814, 837, 843, 956, 991, 1005, 1016, 1030, 1040, 1062, 1096, 1110, 1138, 1155, 1160, 1185, 1188, 1281, 1284, 1323, 1330, 1365, 1468, 1488, 1502, 1503, 1507, 1511, 1570, 1675, 1687, 1716, 1718, 1757, 1761, 1763, 1765, 1772, 1784, 1788, 1789, 1790, 1799, 1809, 1811, 1814
4400-node79, 115, 133, 172, 189, 231, 237, 281, 283, 287, 392, 405, 417, 423, 447, 451, 493, 555, 611, 614, 626, 633, 639, 645, 695, 697, 729, 842, 863, 870, 915, 952, 961, 1001, 1012, 1017, 1039, 1061, 1104, 1116, 1154, 1160, 1178, 1186, 1279, 1282, 1357, 1426, 1465, 1483, 1500, 1508, 1517, 1518, 1561, 1570, 1666, 1687, 1711, 1716, 1743, 1829, 1864, 1879, 1918, 1960, 1989, 2027, 2030, 2033, 2052, 2069, 2070, 2127, 2151, 2160, 2197, 2204, 2236, 2241, 2324, 2340, 2359, 2360, 2373, 2377, 2381, 2384, 2393, 2443, 2475, 2547, 2563, 2588, 2605, 2608, 2698, 2739, 2750, 2762, 2791, 2859, 2899, 2924, 2927, 2930, 2995, 3029, 3037, 3044, 3068, 3075, 3112, 3214, 3231, 3243, 3249, 3266, 3312, 3433, 3461, 3487, 3491, 3575, 3621, 3632, 3650, 3681, 3773, 3779, 3797, 3803, 3900, 3902, 3943, 3985, 4087, 4107, 4121, 4122, 4128, 4189, 4306, 4335, 4367, 4371, 4376, 4378, 4382, 4388, 4391, 4403, 4407, 4409, 4410, 4418, 4419, 4420, 4427, 4434, 4435, 4445, 4446, 4457, 4462, 4463, 4472, 4484, 4487, 4488, 4489, 4495, 4499, 4500, 4501, 4503, 4505, 4509, 4517, 4519, 4522, 4523, 4527, 4529, 4543