A Novel Graphically-Based Network Reconfiguration for Power Loss Minimization in Large Distribution Systems

 ,
,  ,
, 
 and
and 
Abstract
1. Introduction
2. Problem Statement
2.1. Power Flow Equations
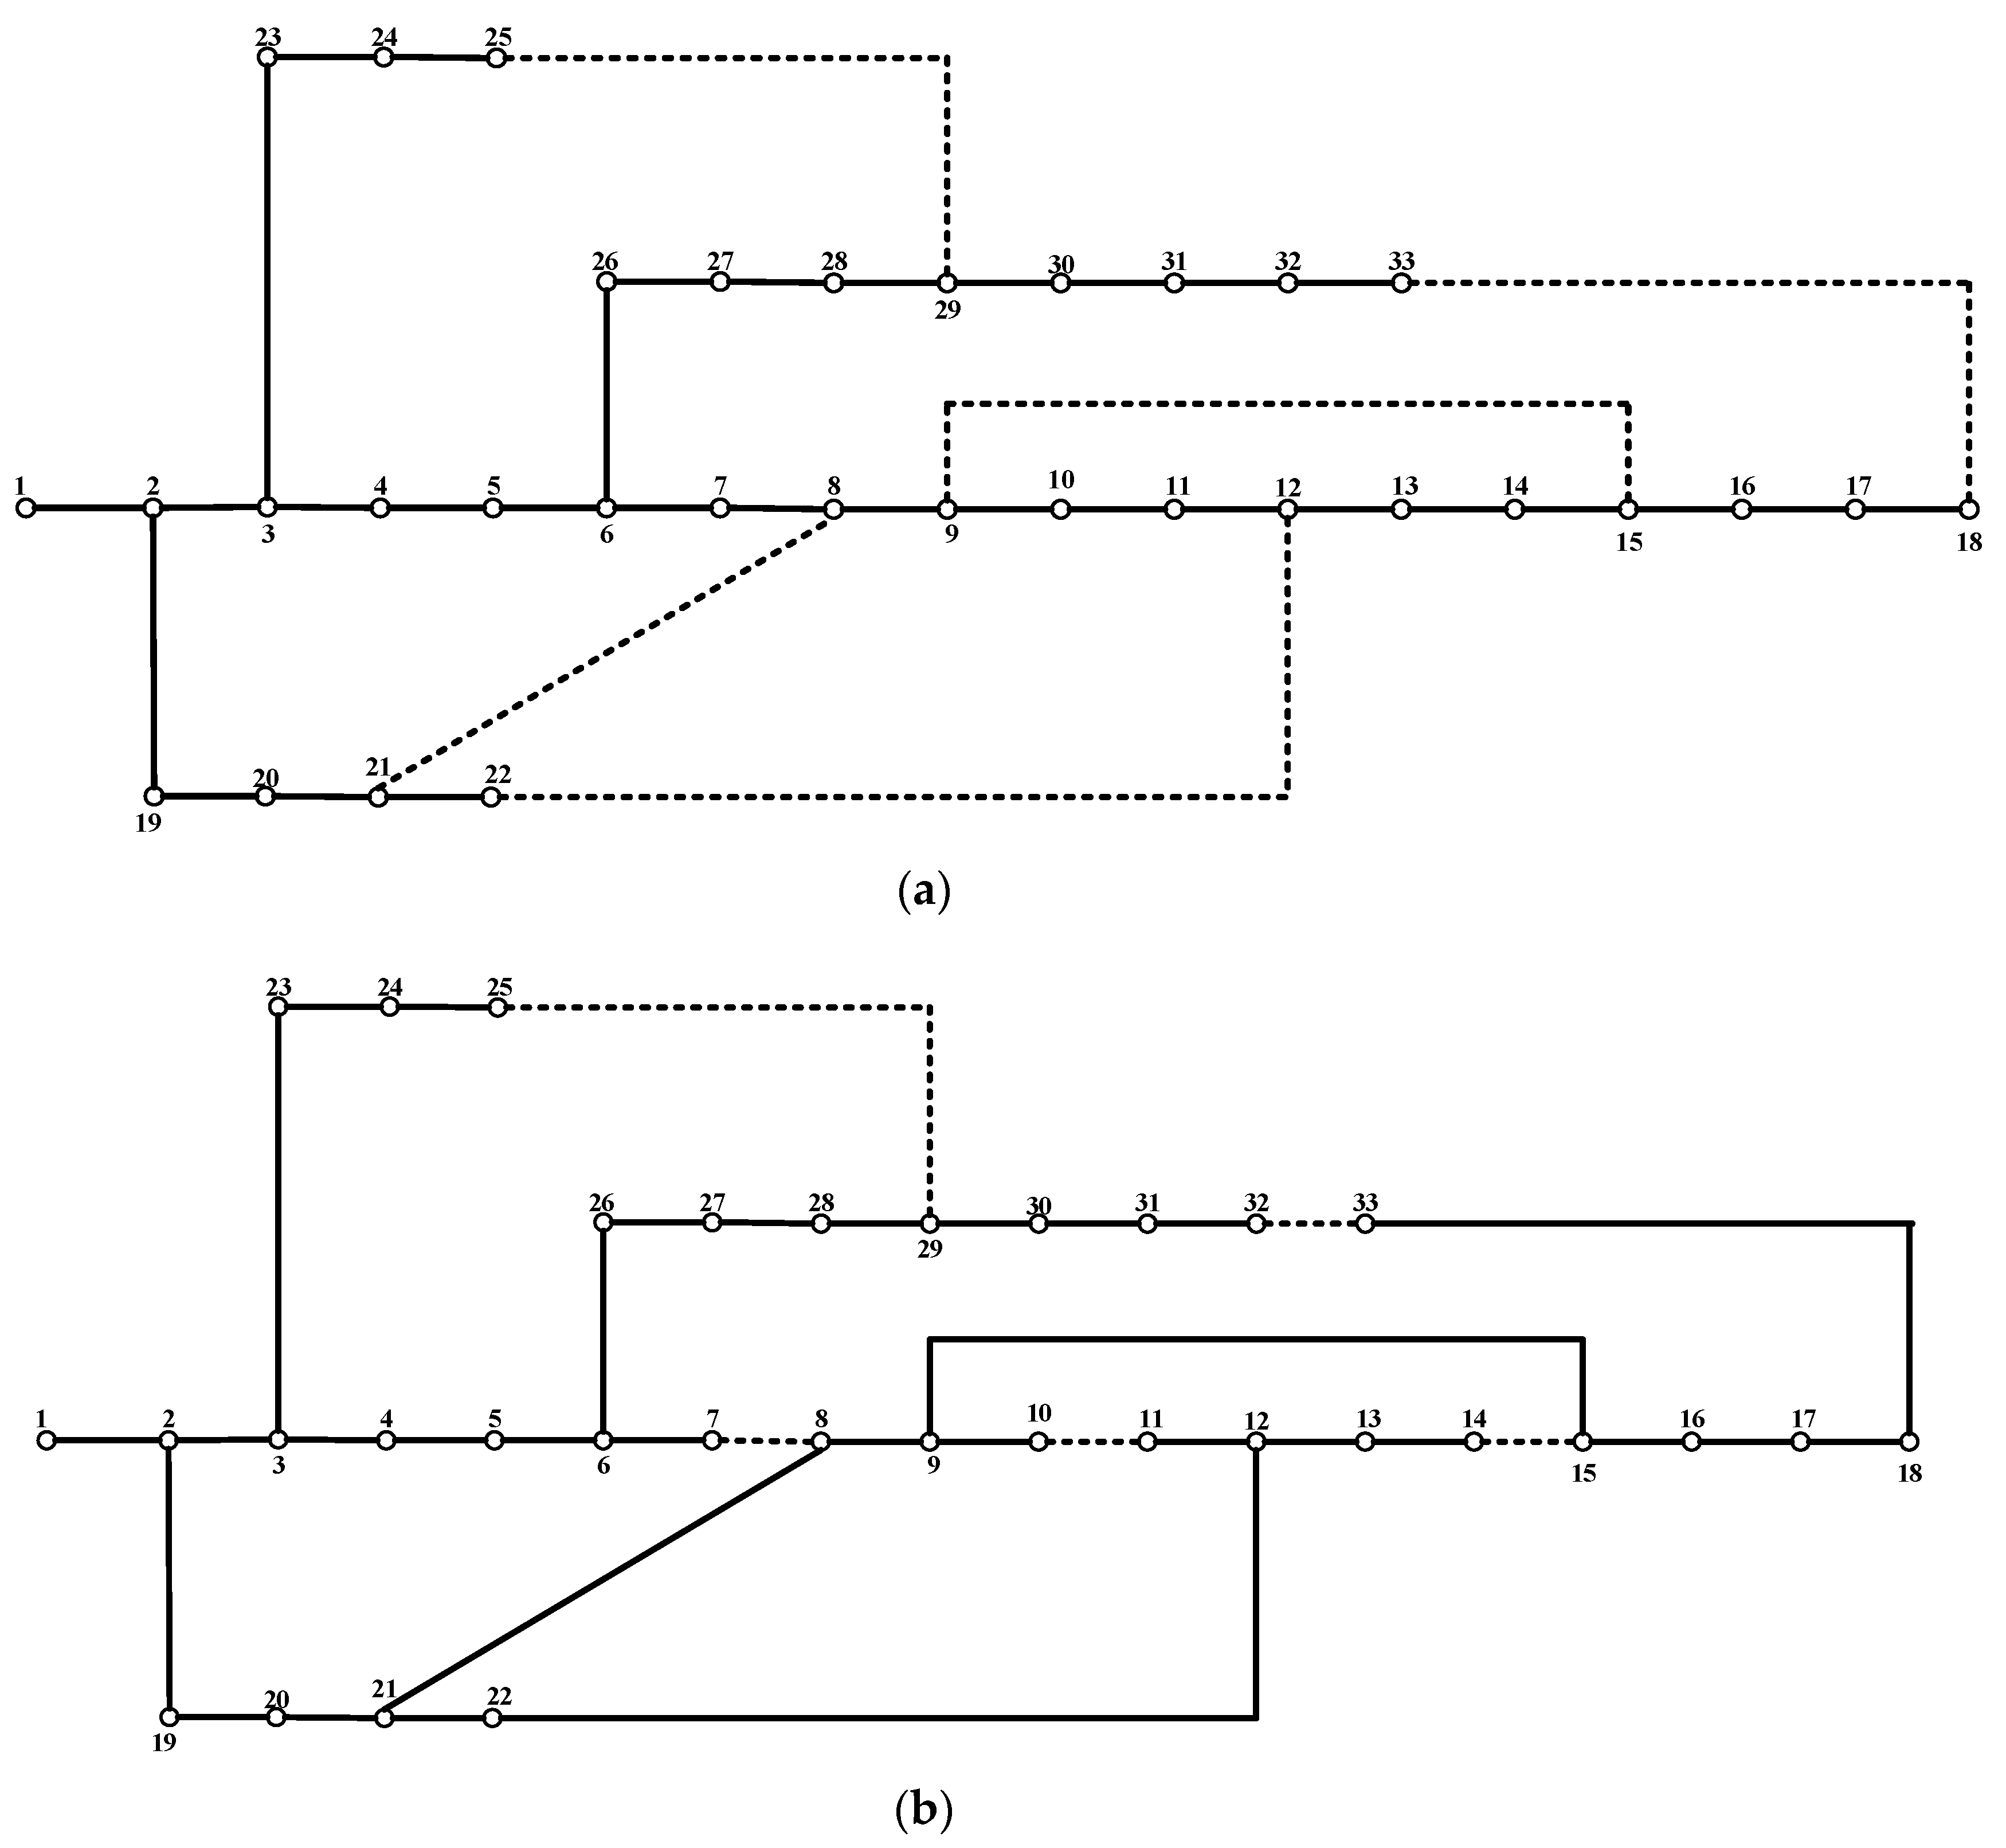
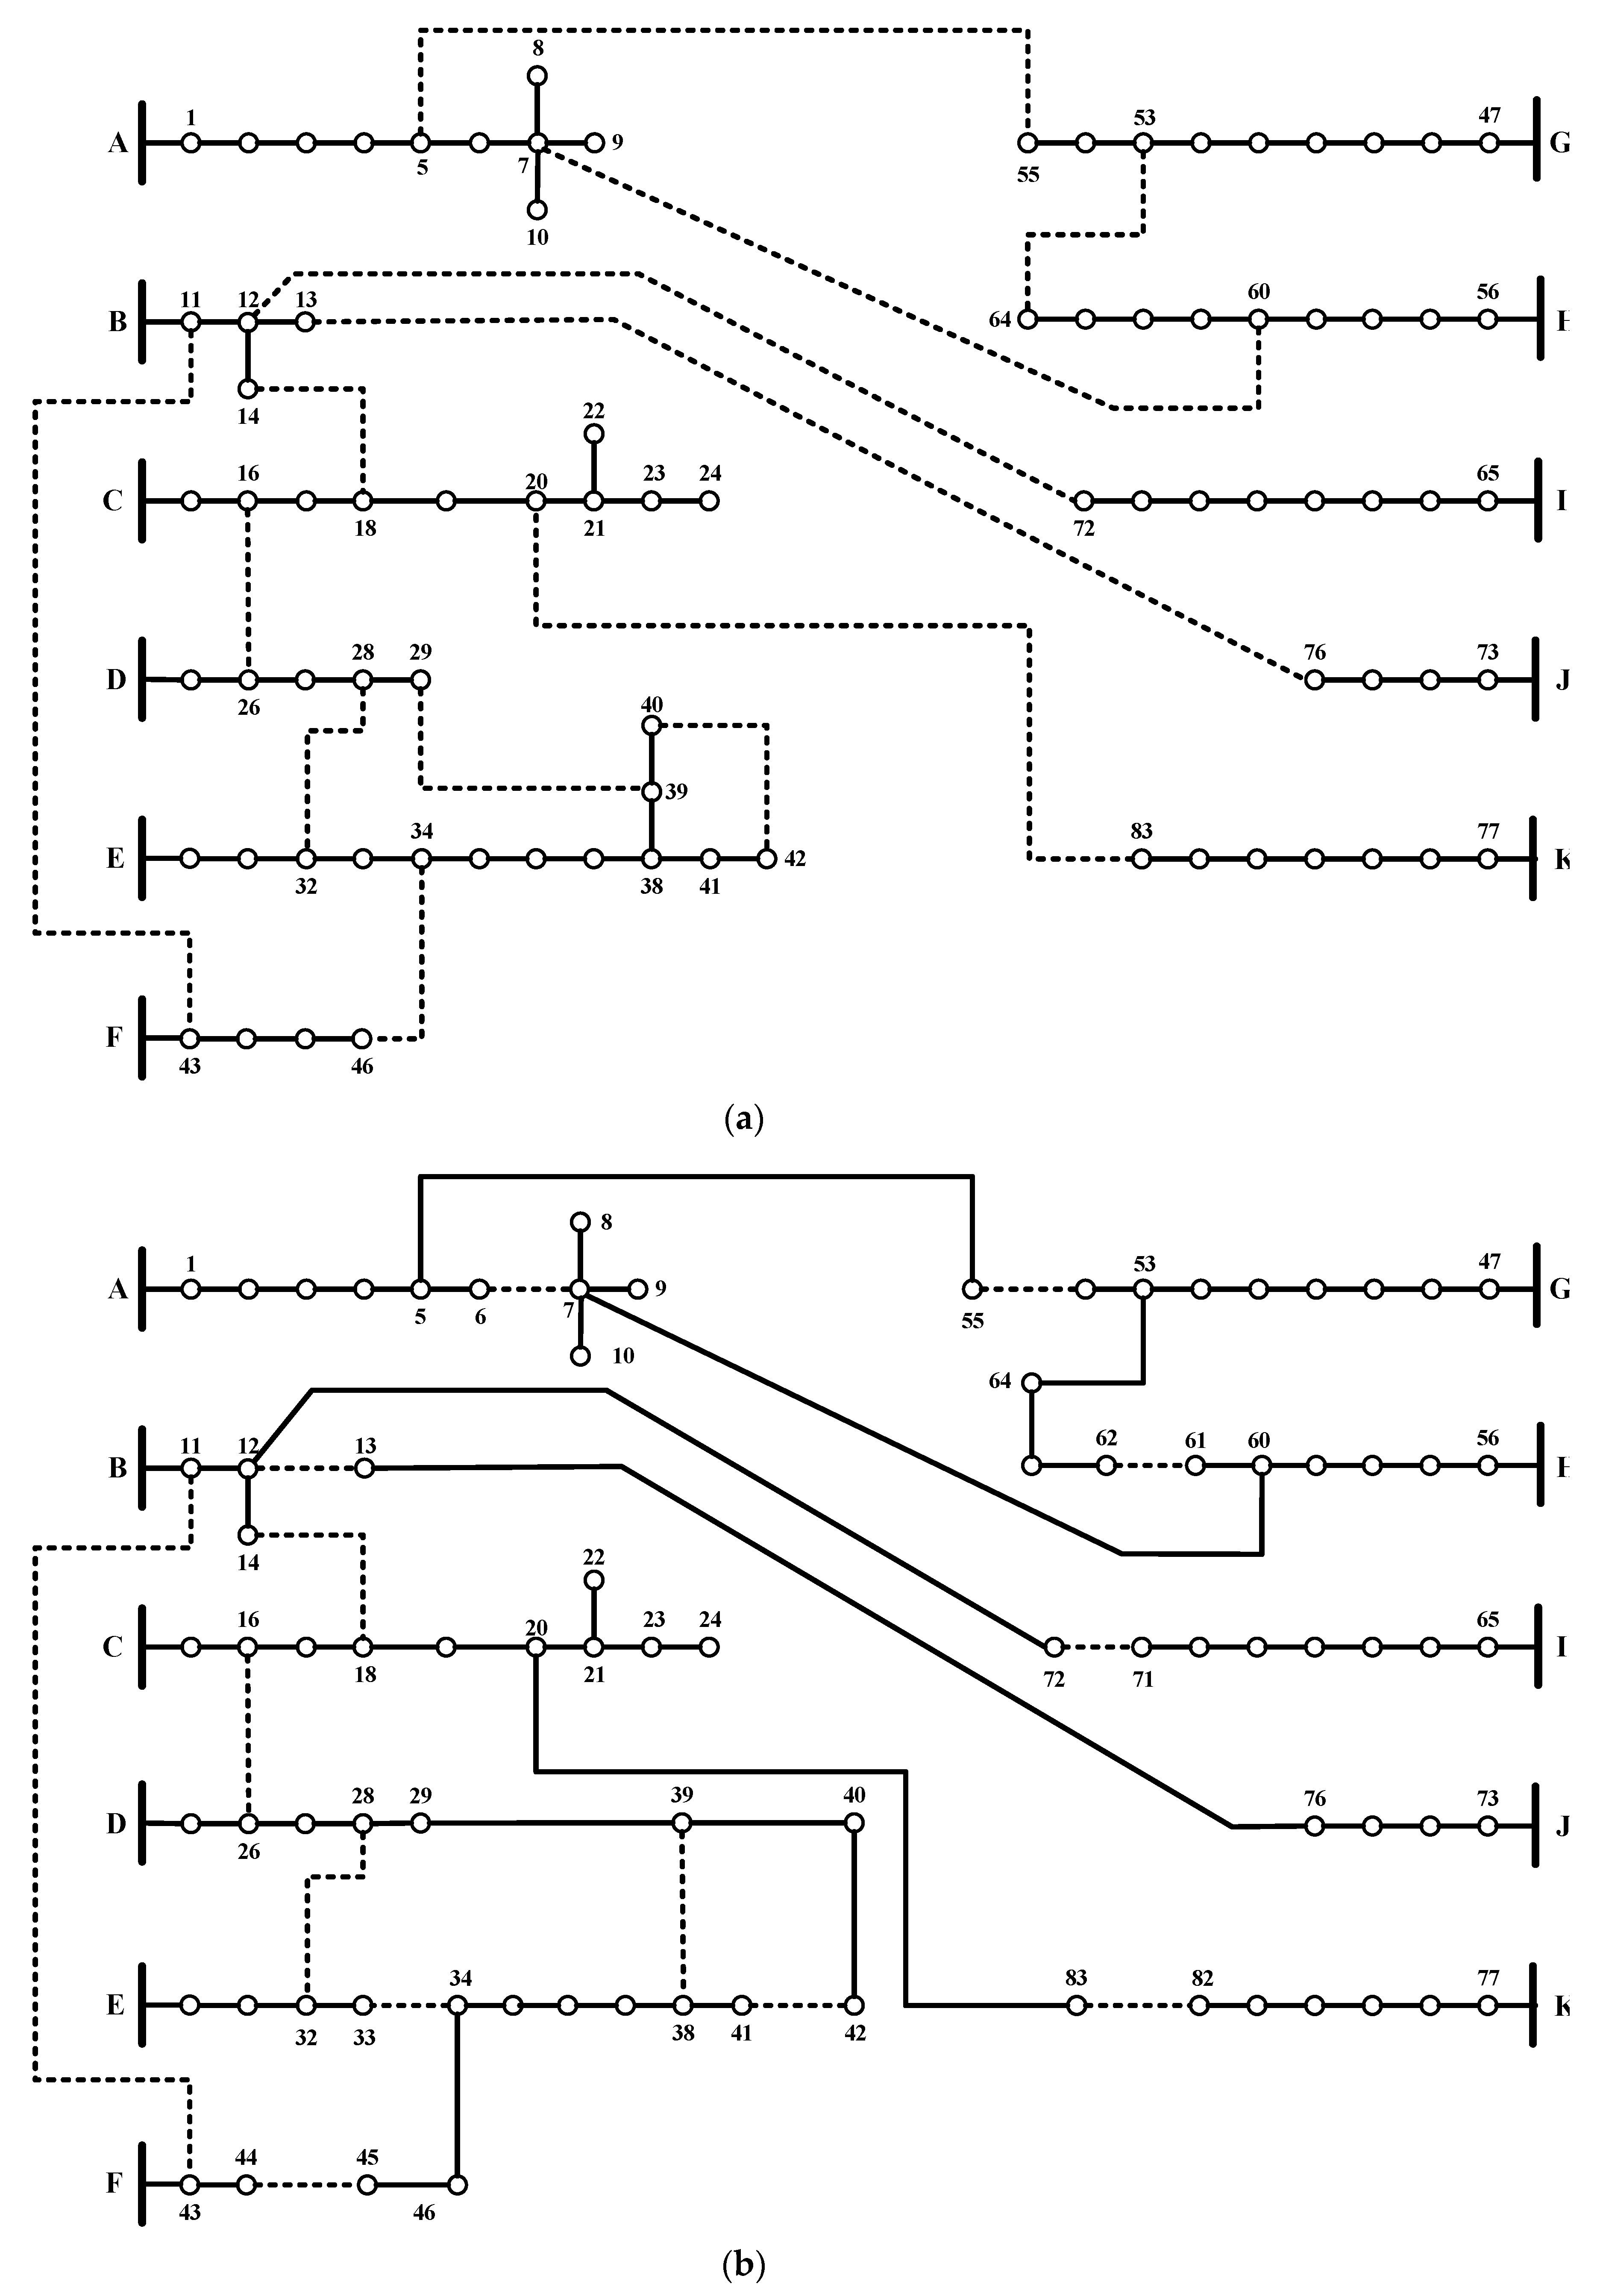
2.2. Proposed Graphical Distribution Network Reconfiguration
- (a)
- Set .
- (b)
- Start from the tie-line in represented by and connected from the node to the node. A set is formed, including sectionalized lines connected by their ends to the line nodes, as shown in Figure 2, in which these sectionalized lines are proposed to be tie-lines where and do not include main feeder lines.
- (c)
- A weighted voltage deviation () index is calculated for each candidate sectionalized line in the set and its corresponding tie-line . The index for the sectionalized line in is formulated as follows:
- (d)
- Tie-lines and their corresponding sectionalized lines are then sorted according to their value, where the highest value takes the highest priority. Let represent the number of possible trials to reconfigure the distribution network. Further, a matrix is formed, with rows and columns . Its first and second columns include the tie-lines and their corresponding sectionalized lines, respectively, after the sorting procedure is done.
- (e)
- Set .
- (f)
- Set and .
- (g)
- Calculate the objective function. Thus,
- -
- Assume that the mathematical problem is minimization. If the objective function is better than the initial objective function value, then update and repeat the reconfiguration process, starting from Step 2.
- -
- If the objective function value is greater than the initial objective function value or the power flow did not converge, and , then set and repeat sub-step f.
- -
- If , then jump to Step 5.
Illustrative Example on the Proposed DNR
3. Problem Formulation
3.1. Objective Function
3.2. Constraints
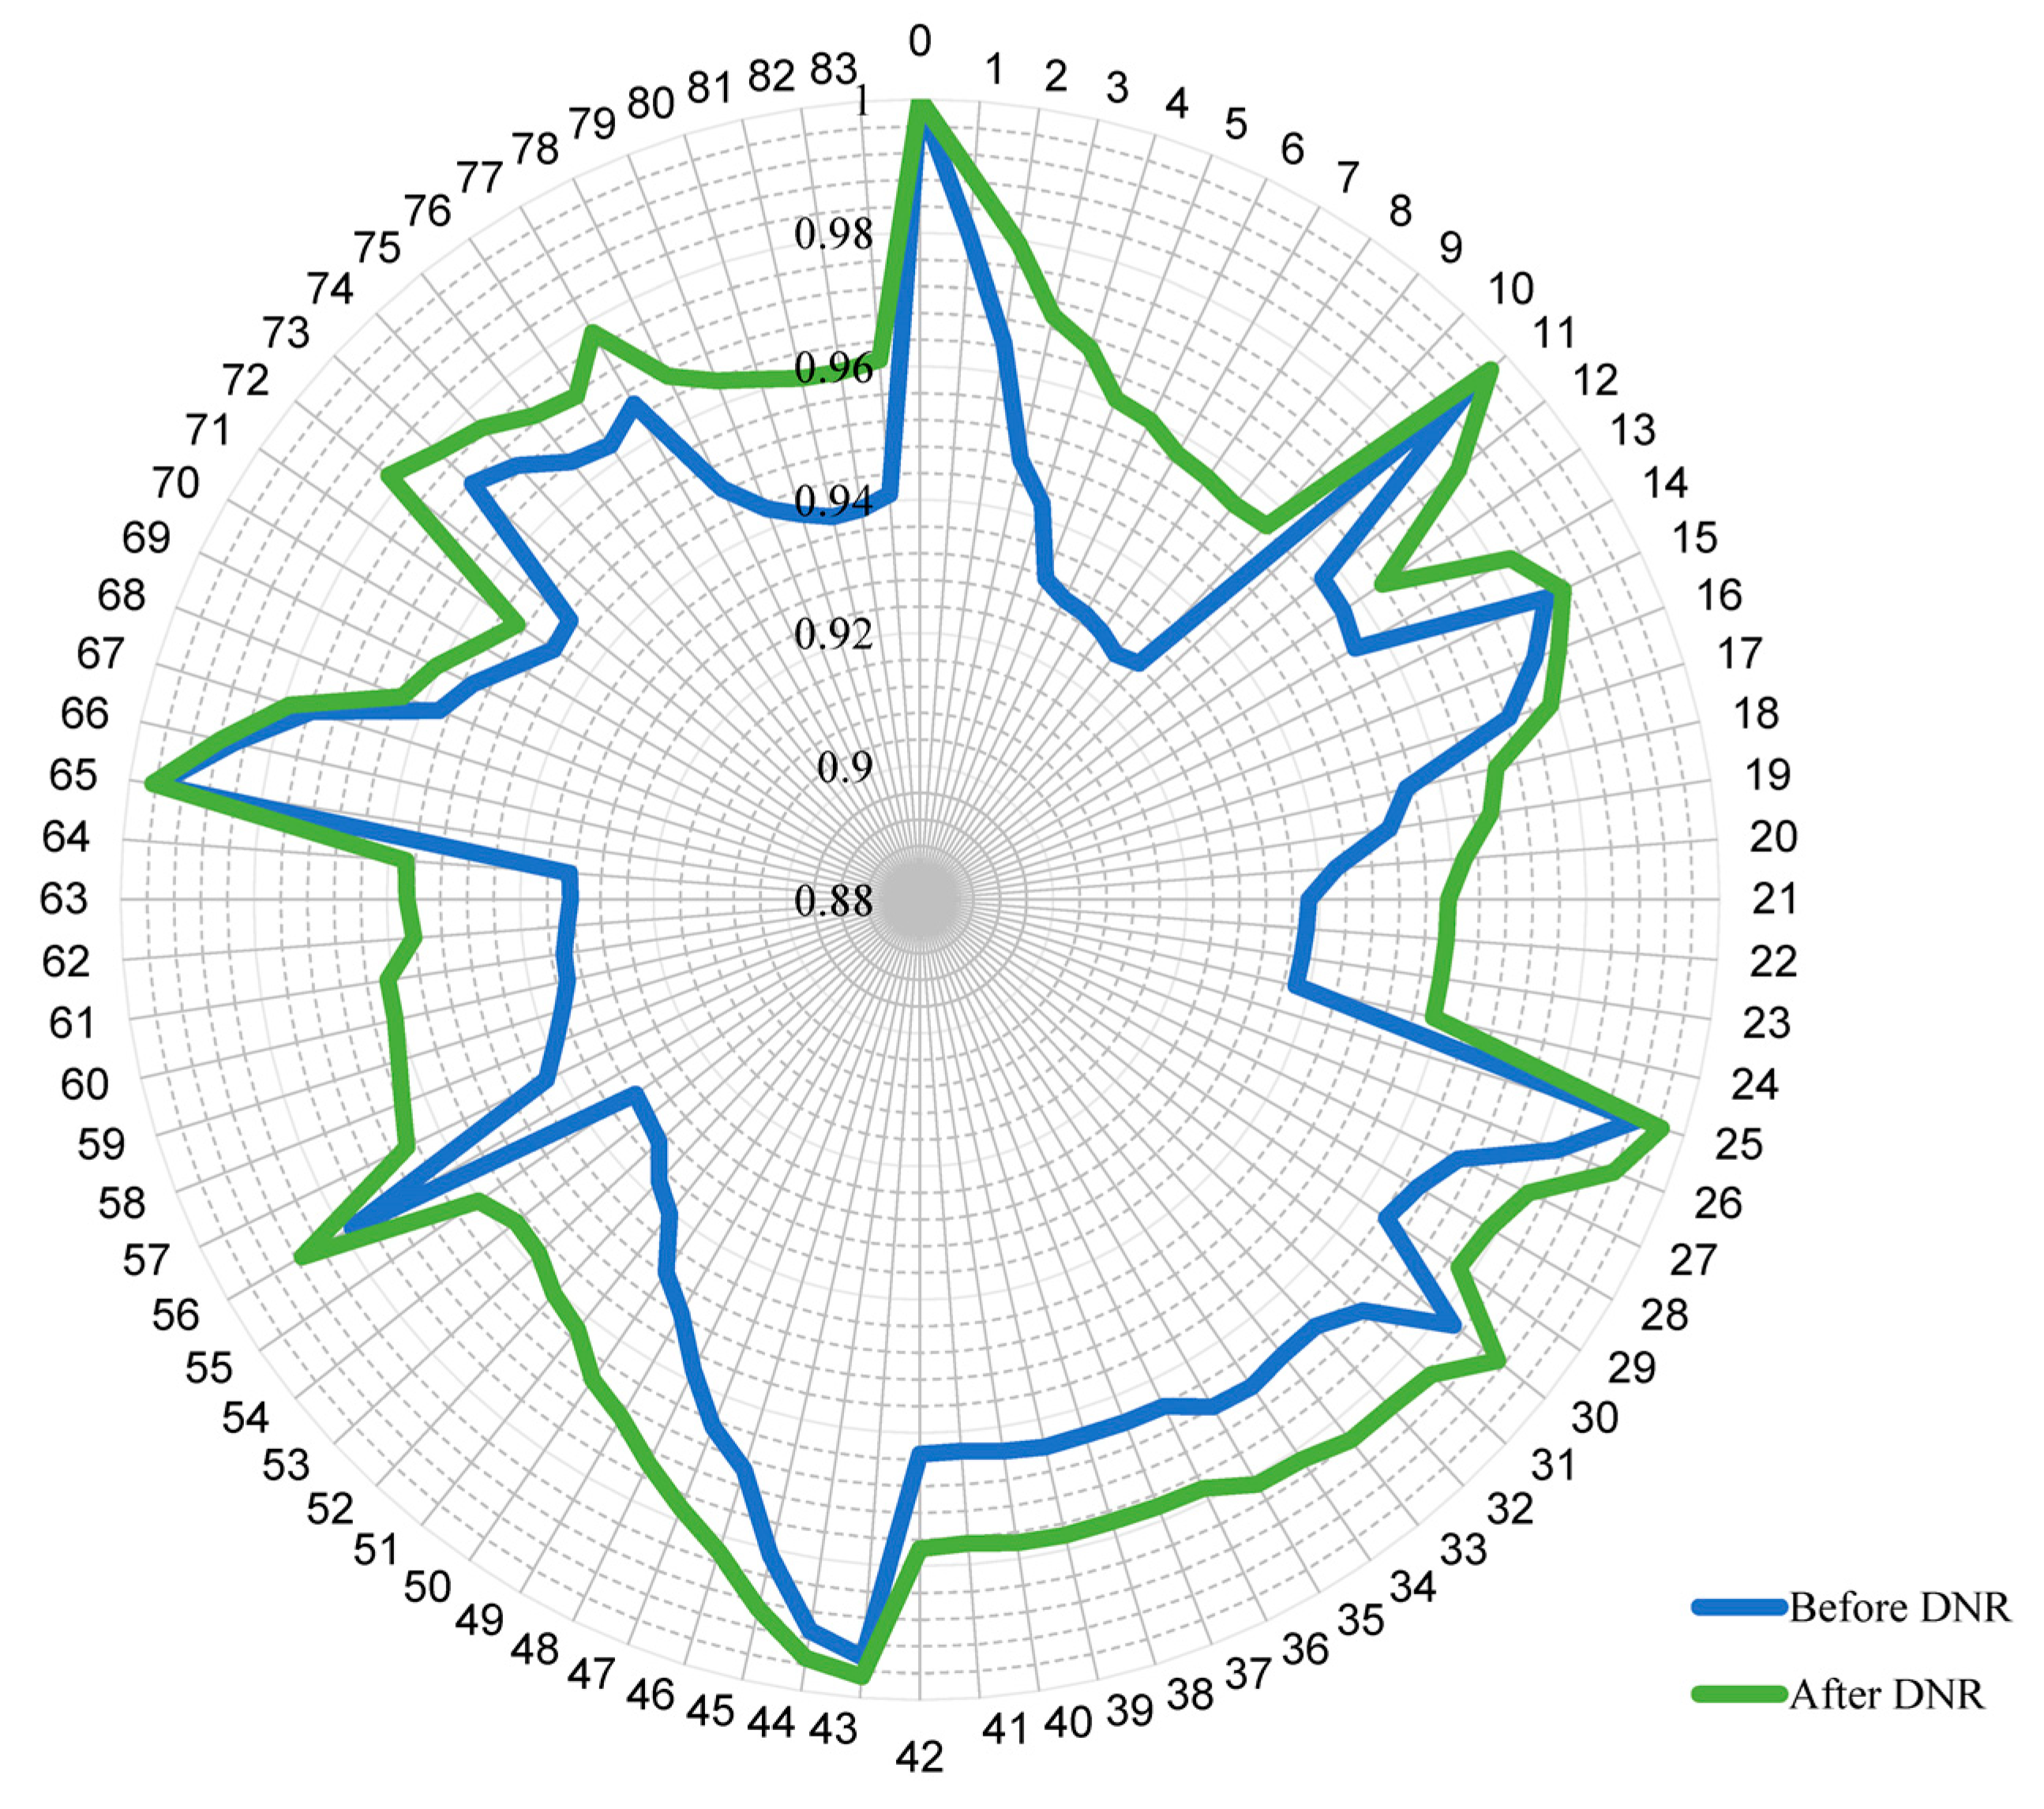
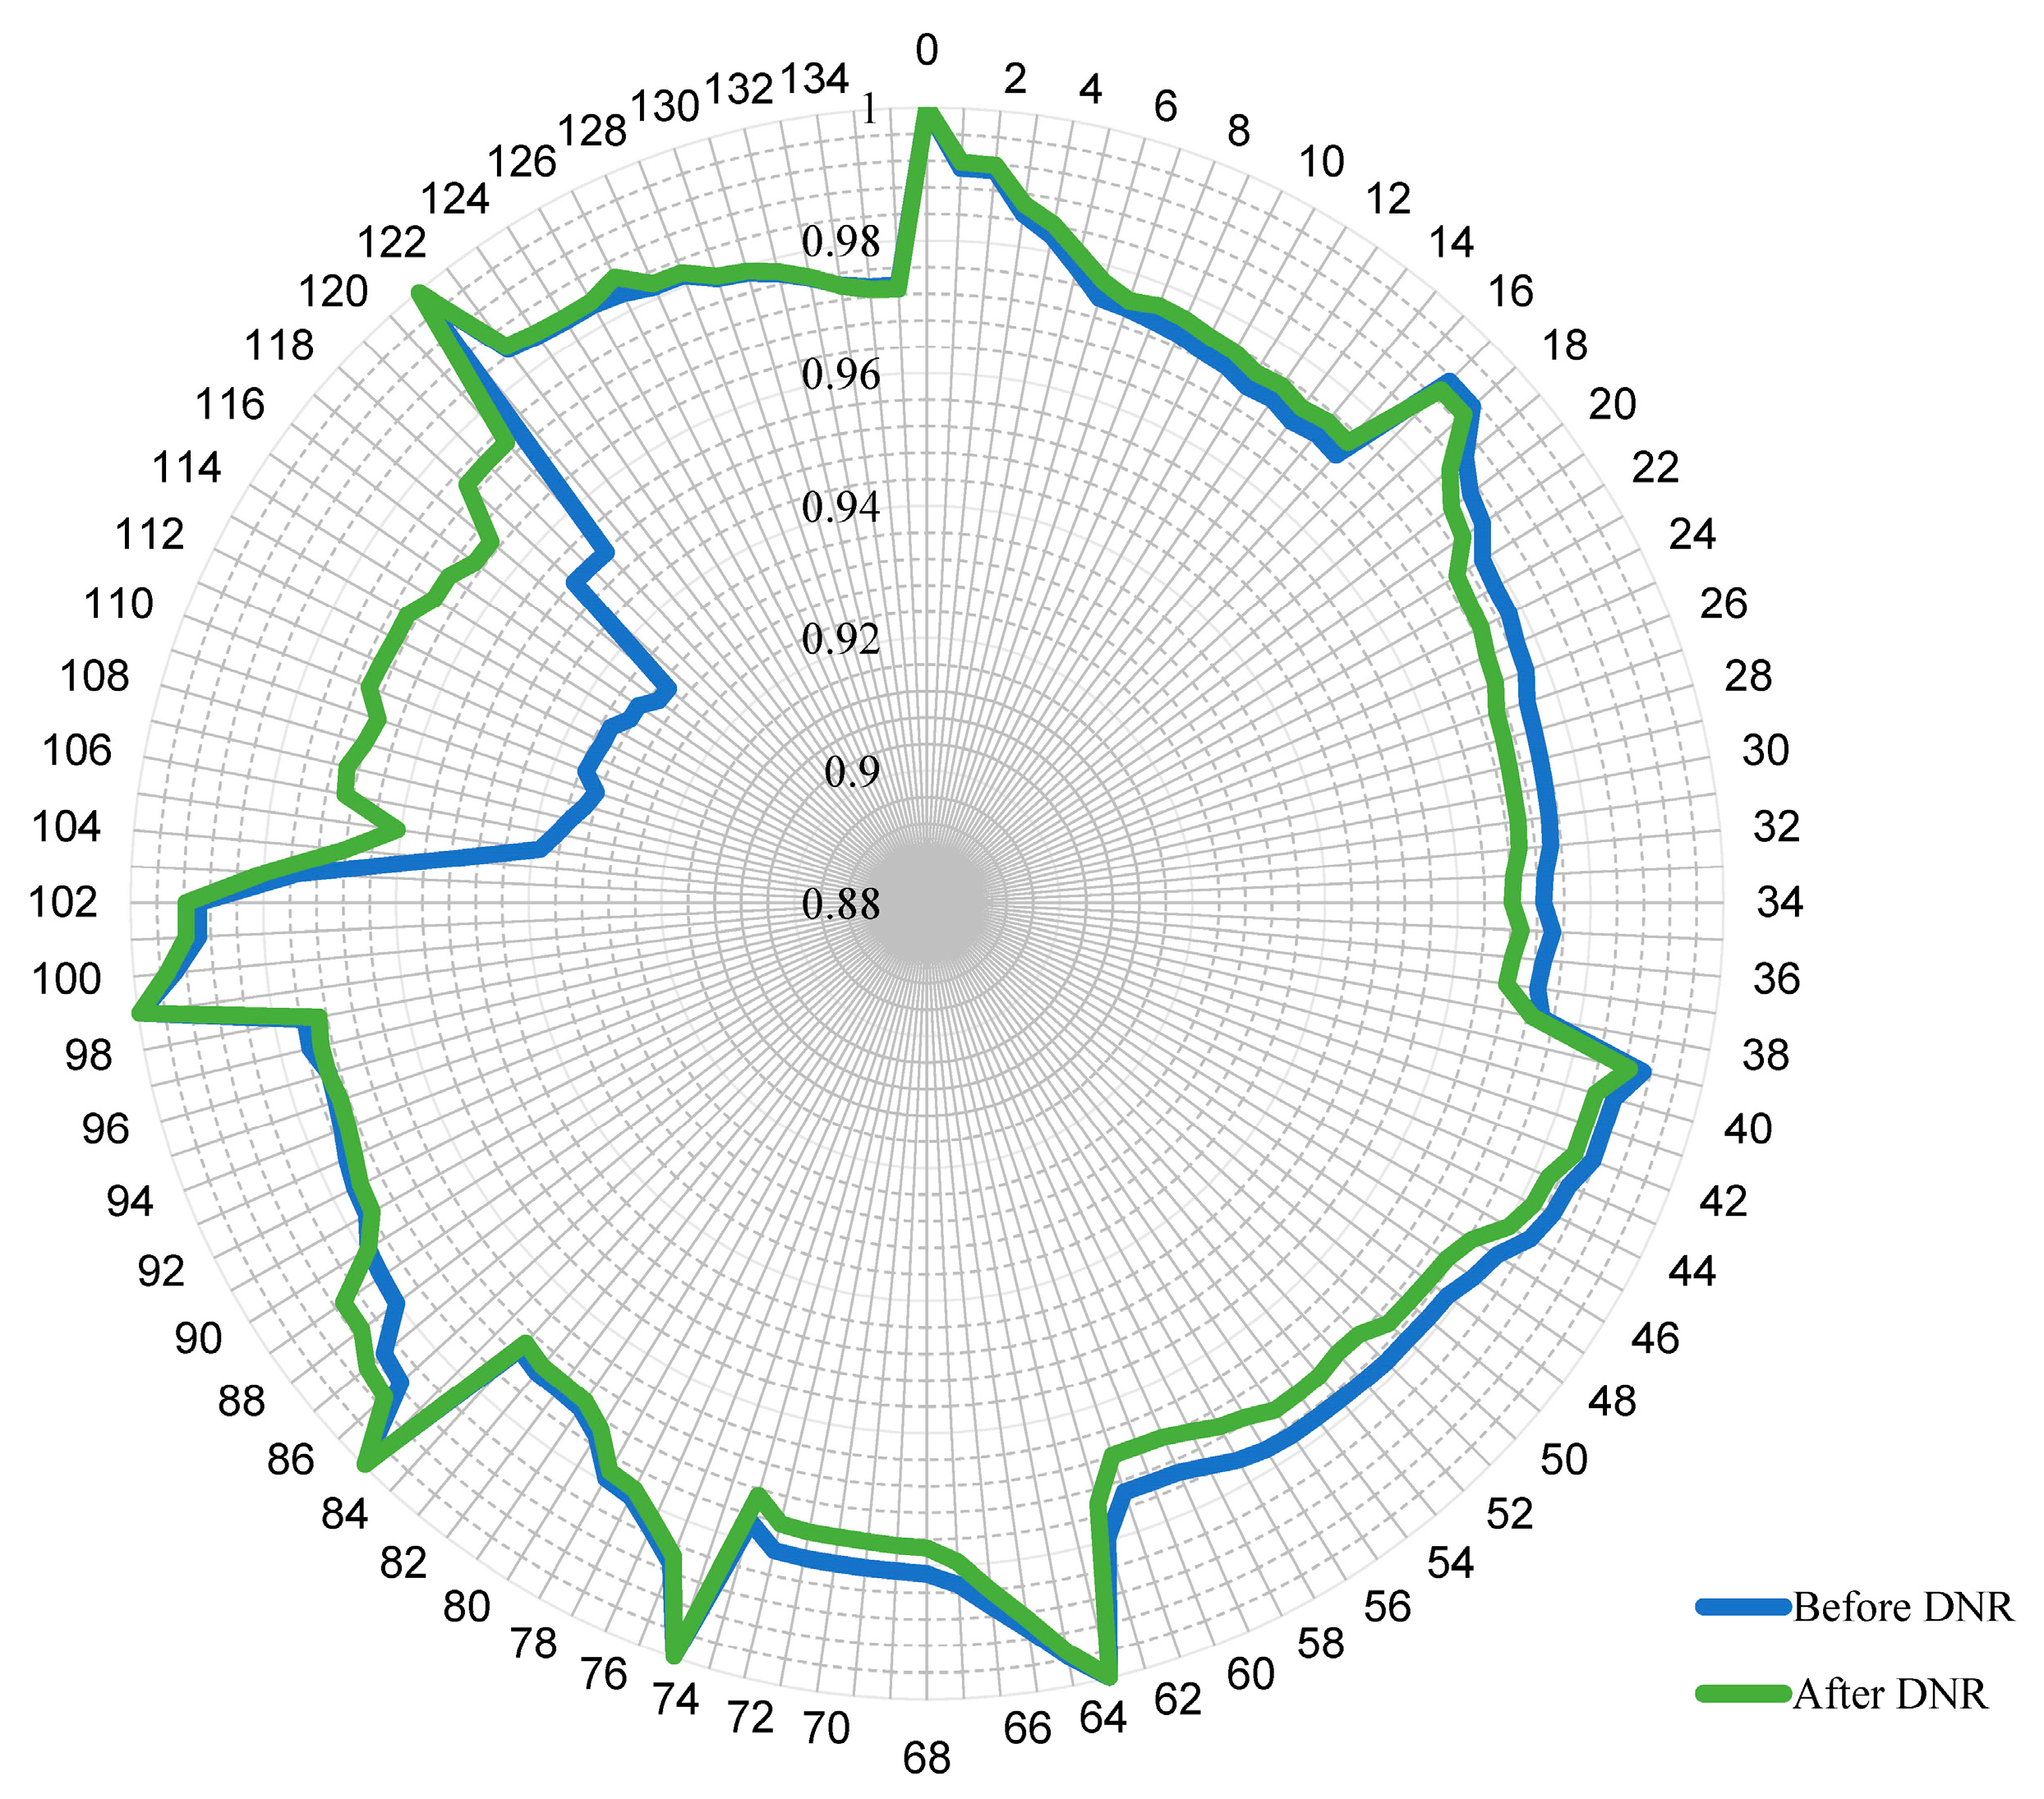
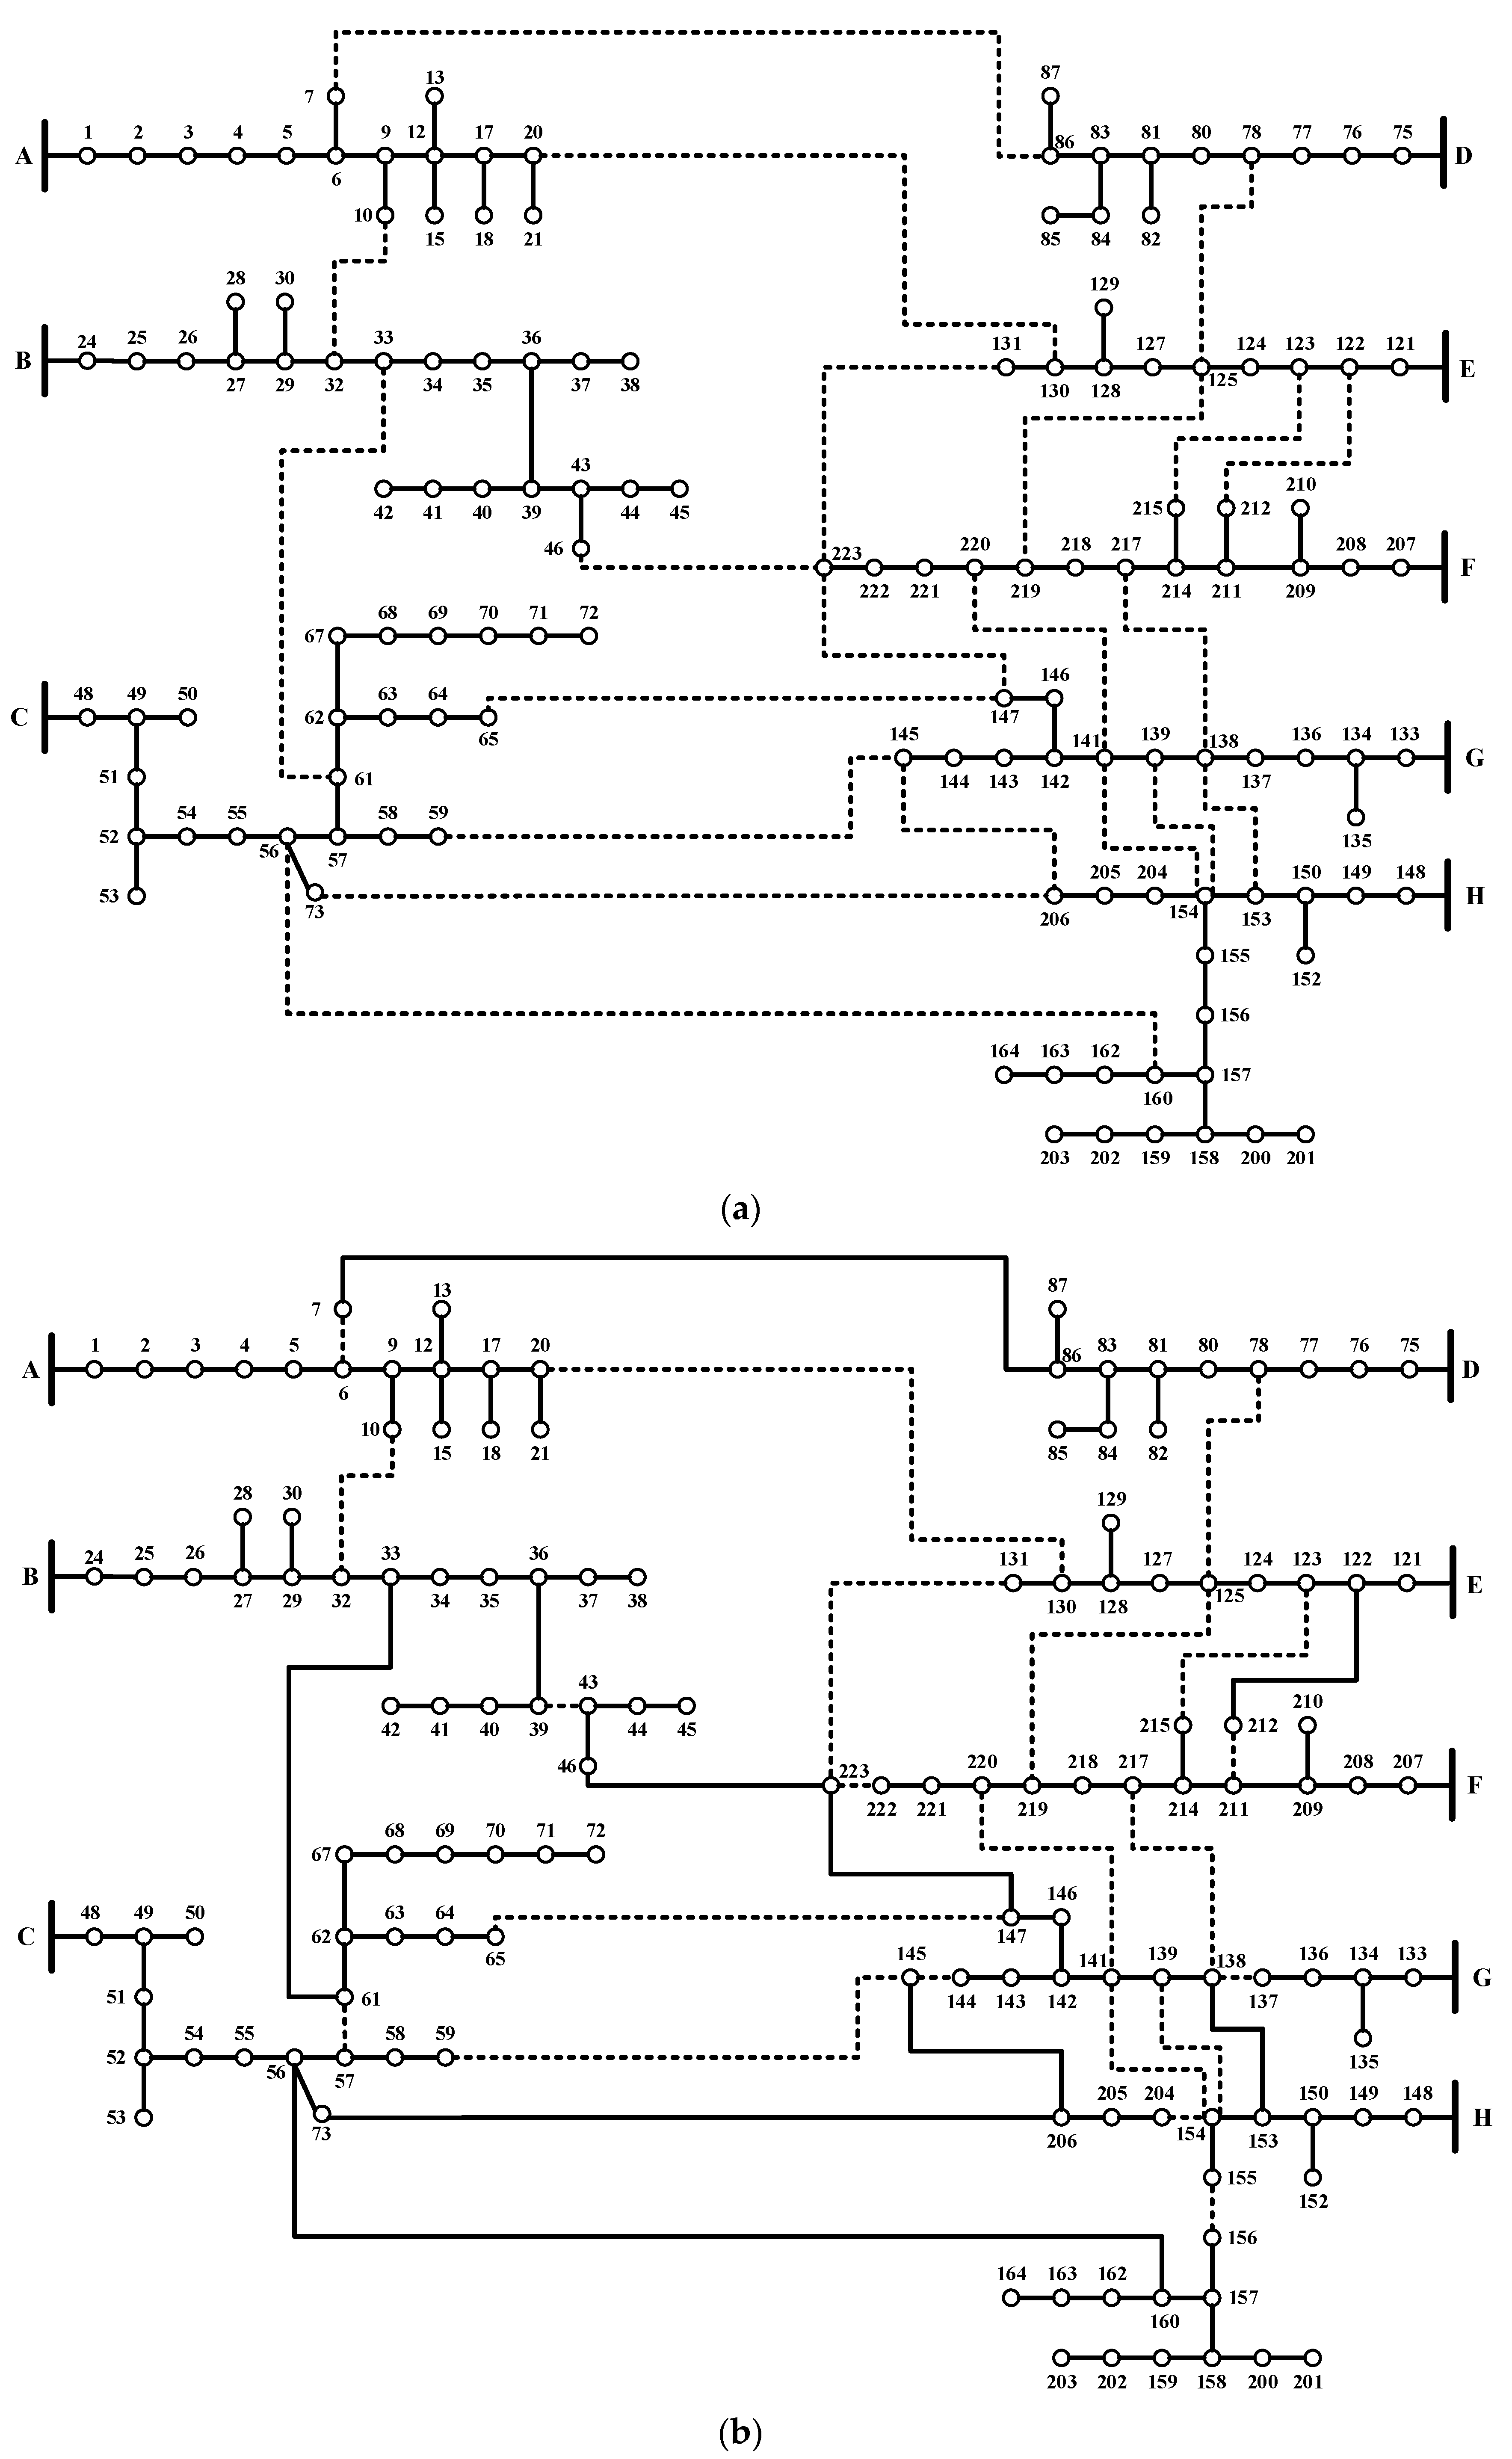
4. Results and Discussion
DNR Only
5. Conclusions
Author Contributions
Funding
Conflicts of Interest
Abbreviations
| ALO | Ant-lion optimization algorithm |
| DC-HSS | Discrete-continuous hyper-spherical search algorithm |
| DNR | Distribution network reconfiguration |
| FNSGA | Fast nondominated sorting genetic algorithm |
| GA | Genetic algorithm |
| GPU | Graphics processing unit |
| MICP | Mixed-integer cone programming |
| MILP | Mixed-integer linear programming |
| MINLP | Mixed-integer nonlinear programming |
| MISOCP | Mixed-integer second-order cone programming |
Nomenclature
| Iteration number. | |
| , | The set of lines (edges) and nodes (vertices), respectively. |
| Line-node incidence matrix. | |
| , | The number of lines and nodes, respectively. |
| The number of possible trials to reconfigure the distribution network. | |
| , | The injected active and reactive powers at the node. |
| , | The active and reactive powers of the connected loads onto node . |
| , | The feeder resistance and reactance between nodes and . |
| The magnitude of the node voltage. | |
| Weighted voltage deviation index. | |
| The best configuration of the distribution network. | |
| The temporary configuration of the distribution network. |
References
- Sulaima, M.F.; Mohamad, M.F.; Jali, M.H.; Bukhari, W.M.; Baharom, M.F. A comparative study of optimization methods for 33kV distribution network feeder reconfiguration. Int. J. Appl. Eng. Res. 2014, 9, 1169–1182. [Google Scholar]
- Strategies for Reducing Losses in Distribution Networks. Imperial College London. 2018. Available online: https://www.ukpowernetworks.co.uk/losses/static/pdfs/strategies-for-reducing-losses-indistribution networks.d1b2a6f.pdf (accessed on 1 November 2019).
- Ismael, S.M.; Abdel Aleem, S.H.E.; Abdelaziz, A.Y.; Zobaa, A.F. Practical considerations for optimal conductor reinforcement and hosting capacity enhancement in radial distribution systems. IEEE Access 2018, 6, 27268–27277. [Google Scholar] [CrossRef]
- Ismael, S.; Abdel Aleem, S.; Abdelaziz, A.; Zobaa, A. Probabilistic hosting capacity enhancement in non-sinusoidal power distribution systems using a hybrid PSOGSA optimization algorithm. Energies 2019, 12, 1018. [Google Scholar] [CrossRef]
- Badran, O.; Mekhilef, S.; Mokhlis, H.; Dahalan, W. Optimal reconfiguration of distribution system connected with distributed generations: A review of different methodologies. Renew. Sustain. Energy Rev. 2017, 73, 854–867. [Google Scholar] [CrossRef]
- Paterakis, N.G.; Mazza, A.; Santos, S.F.; Erdinc, O.; Chicco, G.; Bakirtzis, A.G.; Catalao, J.P.S. Multi-objective reconfiguration of radial distribution systems using reliability indices. IEEE Trans. Power Syst. 2016, 31, 1048–1062. [Google Scholar] [CrossRef]
- Jabr, R.A.; Singh, R.; Pal, B.C. Minimum loss network reconfiguration using mixed-integer convex programming. IEEE Trans. Power Syst. 2012, 27, 1106–1115. [Google Scholar] [CrossRef]
- Ahmadi, H.; Marti, J.R. Distribution system optimization based on a linear power-flow formulation. IEEE Trans. Power Deliv. 2015, 30, 25–33. [Google Scholar] [CrossRef]
- Das, D. A fuzzy multiobjective approach for network reconfiguration of distribution systems. IEEE Trans. Power Deliv. 2006, 21, 202–209. [Google Scholar] [CrossRef]
- Taylor, J.A.; Hover, F.S. Convex models of distribution system reconfiguration. IEEE Trans. Power Syst. 2012, 27, 1407–1413. [Google Scholar] [CrossRef]
- Ali, E.S.; Abd Elazim, S.M.; Abdelaziz, A.Y. Ant lion optimization algorithm for optimal location and sizing of renewable distributed generations. Renew. Energy 2017, 101, 1311–1324. [Google Scholar] [CrossRef]
- Gandomkar, M.; Vakilian, M.; Ehsan, M. A genetic–based tabu search algorithm for optimal DG allocation in distribution networks. Electr. Power Compon. Syst. 2005, 33, 1351–1362. [Google Scholar] [CrossRef]
- Borges, C.L.T.; Falcão, D.M. Optimal distributed generation allocation for reliability, losses, and voltage improvement. Int. J. Electr. Power Energy Syst. 2006, 28, 413–420. [Google Scholar] [CrossRef]
- Roberge, V.; Tarbouchi, M.; Okou, F.A. Distribution system optimization on graphics processing unit. IEEE Trans. Smart Grid 2017, 8, 1689–1699. [Google Scholar] [CrossRef]
- Diaaeldin, I.; Abdel Aleem, S.; El-Rafei, A.; Abdelaziz, A.; Zobaa, A.F. Optimal network reconfiguration in active distribution networks with soft open points and distributed generation. Energies 2019, 12, 4172. [Google Scholar] [CrossRef]
- Chang, C.-F. Reconfiguration and capacitor placement for loss reduction of distribution systems by ant colony search algorithm. IEEE Trans. Power Syst. 2008, 23, 1747–1755. [Google Scholar] [CrossRef]
- Enacheanu, B.; Raison, B.; Caire, R.; Devaux, O.; Bienia, W.; HadjSaid, N. Radial network reconfiguration using genetic algorithm based on the matroid theory. IEEE Trans. Power Syst. 2008, 23, 186–195. [Google Scholar] [CrossRef]
- de Oliveira, L.W.; de Oliveira, E.J.; Gomes, F.V.; Silva, I.C.; Marcato, A.L.M.; Resende, P.V.C. Artificial immune systems applied to the reconfiguration of electrical power distribution networks for energy loss minimization. Int. J. Electr. Power Energy Syst. 2014, 56, 64–74. [Google Scholar] [CrossRef]
- Wu, W.-C.; Tsai, M.-S. Application of enhanced integer coded particle swarm optimization for distribution system feeder reconfiguration. IEEE Trans. Power Syst. 2011, 26, 1591–1599. [Google Scholar] [CrossRef]
- Eldurssi, A.M.; O’Connell, R.M. A fast nondominated sorting guided genetic algorithm for multi-objective power distribution system reconfiguration problem. IEEE Trans. Power Syst. 2015, 30, 593–601. [Google Scholar] [CrossRef]
- Roberge, V. Distribution Feeder Reconfiguration (DFR) Test Cases. Available online: http://roberge.segfaults.net/joomla/index.php/dfr (accessed on 1 November 2019).


| Before Sorting | After Sorting | , Then Set and | |||||||||
|---|---|---|---|---|---|---|---|---|---|---|---|
| Priority | Losses Reduction (%) | Decision | |||||||||
| 1 | 13 | 5 | 1 | 0.0153 | 3 | 1 | 14 | 10 | NA ** | Jump to | |
| 11 | 7 | 0.0182 | 2 | 2 | 13 | 7 | 3.568 | Update and jump to | |||
| 14 | 10 | 6 | 0.0169 | 4 | 3 | 13 | 1 | NA | NA | ||
| 14 | 10 | 0.0187 | 1 | 4 | 14 | 6 | |||||
| 15 | 7 | 3 | 0.0055 | 6 | 5 | 15 | 12 | ||||
| 16 | 12 | 0.0061 | 5 | 6 | 15 | 3 | |||||
| 2 | 7 | 9 | 5 | 0.0094 | 4 | 1 | 14 | 10 | NA | Jump to | |
| 11 | 13 | 0.0181 | 2 | 2 | 7 | 13 | NA | Jump to | |||
| 14 | 10 | 6 | 0.0167 | 3 | 3 | 14 | 6 | 8.854 | Update and jump to | ||
| 14 | 10 | 0.0186 | 1 | 4 | 7 | 5 | NA | NA | |||
| 15 | 7 | 3 | 0.0054 | 6 | 5 | 15 | 12 | ||||
| 16 | 12 | 0.0061 | 5 | 6 | 15 | 3 | |||||
| 3 | 6 | 8 | 5 | 0.0003 | 6 | 1 | 7 | 13 | NA | Jump to | |
| 10 | 14 | 0.0082 | 3 | 2 | 7 | 8 | NA | Jump to | |||
| 7 | 9 | 8 | 0.0137 | 2 | 3 | 6 | 14 | NA | Jump to | ||
| 11 | 13 | 0.0156 | 1 | 4 | 15 | 12 | NA | Jump to | |||
| 15 | 7 | 3 | 0.0032 | 5 | 5 | 15 | 3 | NA | Jump to | ||
| 16 | 12 | 0.0038 | 4 | 6 | 6 | 5 | NA | Terminate and display | |||
| Distribution System | Feeders | Load (MVA) | ||
|---|---|---|---|---|
| 16-node | 3 | 13 | 16 | 28.7 + 17.3 |
| 33-node | 1 | 32 | 37 | 3.7 + 2.3 |
| 70-node | 2 | 68 | 79 | 4.5 + 3.1 |
| 83-node | 11 | 83 | 96 | 28.4 + 20.7 |
| 135-node | 8 | 135 | 156 | 18.3 + 7.9 |
| 415-node | 55 | 415 | 480 | 141.8 + 103.5 |
| 880-node | 7 | 873 | 900 | 124.9 + 74.4 |
| 1760-node | 14 | 1746 | 1820 | 249.7 + 148.7 |
| 4400-node | 35 | 4365 | 4550 | 624.4 + 371.8 |
| System | Ref. | Average Time (s) | |||
|---|---|---|---|---|---|
| 16-node | Initial | 511.4 | 590.4 | 0.969 | NA |
| [16] | 466.1 | 544.9 | 0.972 | 1.81 | |
| [17] | 466.1 | 544.9 | 0.972 | 2.10 | |
| Proposed | 466.1 | 544.9 | 0.972 | 0.10 | |
| 33-node | Initial | 211.0 | 143.0 | 0.904 | NA |
| [18] | 139.6 | 102.3 | 0.938 | 4.64 | |
| [19] | 139.6 | 102.3 | 0.938 | 160 | |
| Proposed | 139.57 | 102.3 | 0.938 | 0.55 | |
| 70-node | Initial | 227.5 | 204.9 | 0.905 | NA |
| [17] | 203.2 | 186.6 | 0.931 | 4.64 | |
| [20] | 203.9 | 191.1 | 0.927 | 160 | |
| Proposed | 201.4 | 185.1 | 0.931 | 0.70 | |
| 83-node | Initial | 532.0 | 1374.3 | 0.929 | NA |
| [19] | 471.1 | 1252.1 | 0.952 | 36.1 | |
| [7] | 469.9 | 1248.0 | 0.953 | 160 | |
| Proposed | 470.06 | 1248.0 | 0.953 | 1.4 | |
| 136-node | Initial | 320.3 | 702.7 | 0.931 | NA |
| [20] | 280.7 | 611.0 | 0.961 | 32.6 | |
| [7] | 280.1 | 611.1 | 0.959 | 1800 | |
| Proposed | 280.1 | 611.1 | 0.959 | 35.1 | |
| 415-node | Initial | 2660.0 | 6871.6 | 0.929 | NA |
| [7] | 2359.9 | NA | NA | 1800 | |
| [7] | 2350.7 | NA | NA | 1800 | |
| Proposed | 2349.4 | 6240.0 | 0.953 | 70 | |
| 880-node | Initial | 1496.4 | 1396.5 | 0.956 | NA |
| [10] | 461.4 | NA | 0.982 | 3192 | |
| [8] | 461.0 | 566.7 | 0.992 | 1134 | |
| Proposed | 457.03 | 563.3 | 0.992 | 310 | |
| 1760-node | Initial | 2992.2 | 2793.0 | 0.956 | NA |
| Proposed | 822.4 | 1020.3 | 0.992 | 1400 | |
| 4400-node | Initial | 7482.2 | 6982.5 | 0.956 | NA |
| Proposed | 1918.6 | 2412.7 | 0.9917 | 3600 |
| Configuration (Tie-Lines) | Losses (kW) | |
|---|---|---|
| 0 | 13, 14, 15 | 511.40 |
| 1 | 7, 14, 15 | 493.15 |
| 2 | 6, 7, 15 | 466.12 |
| Configuration (Tie-Lines) | Losses (kW) | |
|---|---|---|
| 0 | 83, 84, 85, 86, 87, 88, 89, 90, 91, 92, 93, 94, 95 | 532.00 |
| 1 | 6, 83, 85, 86, 87, 88, 89, 90, 91, 92, 93, 94, 95 | 512.54 |
| 11 | 6, 12, 33, 38, 41, 54, 61, 71, 82, 85, 88, 89, 91 | 470.06 |
| Configuration (Tie-Lines) | Losses (kW) | |
|---|---|---|
| 0 | 135, 136, 137, 138, 139, 140, 141, 142, 143, 144, 145, 146, 147, 148, 149, 150, 151, 152, 153, 154, 155 | 320.36 |
| 1 | 109, 135, 136, 137, 138, 139, 140, 141, 142, 143, 144, 145, 146, 147, 148, 149, 150, 151, 153, 154, 155 | 303.74 |
| 14 | 6, 34, 50, 89, 95, 105, 117, 125, 134, 136, 137, 140, 141, 143, 144, 145, 146, 147, 149, 150, 154 | 280.18 |
| Configuration (Tie-Lines) | Losses (kW) | |
|---|---|---|
| 0 | 415, 416, 417, 418, 419, 420, 421, 422, 423, 424, 425, 426, 427, 428, 429, 430, 431, 432, 433, 434, 435, 436, 437, 438, 439, 440, 441, 442, 443, 444, 445, 446, 447, 448, 449, 450, 451, 452, 453, 454, 455, 456, 457, 458, 459, 460, 461, 462, 463, 464, 465, 466, 467, 468, 469, 470, 471, 472, 473, 474, 475, 476, 477, 478, 479 | 2660.0 |
| 1 | 6, 415, 417, 418, 419, 420, 421, 422, 423, 424, 425, 426, 427, 428, 429, 430, 431, 432, 433, 434, 435, 436, 437, 438, 439, 440, 441, 442, 443, 444, 445, 446, 447, 448, 449, 450, 451, 452, 453, 454, 455, 456, 457, 458, 459, 460, 461, 462, 463, 464, 465, 466, 467, 468, 469, 470, 471, 472, 473, 474, 475, 476, 477, 478, 479 | 2640.4 |
| 55 | 6, 12, 33, 38, 41, 54, 61, 71, 82, 89, 95, 116, 121, 124, 137, 144, 154, 165, 172, 178, 199, 204, 207, 220, 227, 237, 248, 255, 261, 282, 287, 290, 303, 310, 320, 331, 338, 344, 365, 370, 373, 386, 393, 403, 414, 417, 420, 421, 423, 430, 433, 434, 436, 443, 446, 447, 449, 456, 459, 460, 462, 469, 472, 473, 475 | 2349.4 |
| Configuration (Tie-Lines) | Losses (kW) | |
|---|---|---|
| 0 | 873, 874, 875, 876, 877, 878, 879, 880, 881, 882, 883, 884, 885, 886, 887, 888, 889, 890, 891, 892, 893, 894, 895, 896, 897, 898, 899 | 1496.4 |
| 1 | 793, 873, 874, 875, 876, 877, 878, 879, 880, 881, 882, 883, 884, 885, 886, 887, 888, 890, 891, 892, 893, 894, 895, 896, 897, 898, 899 | 1484.9 |
| 111 | 83, 129, 140, 158, 189, 281, 287, 305, 311, 408, 410, 451, 493, 595, 615, 629, 630, 636, 697, 814, 843, 884, 887, 888, 889, 895, 899 | 457.0 |
| System | Configuration (Tie-Lines) |
|---|---|
| 16-node | 6, 7, 15 |
| 33-node | 6, 9, 13, 31, 36 |
| 70-node | 12, 29, 44, 50, 65, 69, 74, 75, 76, 77, 78 |
| 83-node | 6, 12, 33, 38, 41, 54, 61, 71, 82, 85, 88, 89, 91 |
| 136-node | 6, 34, 50, 89, 95, 105, 117, 125, 134, 136, 137, 140, 141, 143, 144, 145, 146, 147, 149, 150, 154 |
| 415-node | 6, 12, 33, 38, 41, 54, 61, 71, 82, 89, 95, 116, 121, 124, 137, 144, 154, 165, 172, 178, 199, 204, 207, 220, 227, 237, 248, 255, 261, 282, 287, 290, 303, 310, 320, 331, 338, 344, 365, 370, 373, 386, 393, 403, 414, 417, 420, 421, 423, 430, 433, 434, 436, 443, 446, 447, 449, 456, 459, 460, 462, 469, 472, 473, 475 |
| 880-node | 83, 129, 140, 158, 189, 281, 287, 305, 311, 408, 410, 451, 493, 595, 615, 629, 630, 636, 697, 814, 843, 884, 887, 888, 889, 895, 899 |
| 1760-node | 83, 117, 128, 133, 166, 189, 243, 281, 288, 305, 311, 343, 406, 412, 425, 451, 458, 493, 585, 613, 627, 629, 633, 638, 647, 680, 697, 793, 814, 837, 843, 956, 991, 1005, 1016, 1030, 1040, 1062, 1096, 1110, 1138, 1155, 1160, 1185, 1188, 1281, 1284, 1323, 1330, 1365, 1468, 1488, 1502, 1503, 1507, 1511, 1570, 1675, 1687, 1716, 1718, 1757, 1761, 1763, 1765, 1772, 1784, 1788, 1789, 1790, 1799, 1809, 1811, 1814 |
| 4400-node | 79, 115, 133, 172, 189, 231, 237, 281, 283, 287, 392, 405, 417, 423, 447, 451, 493, 555, 611, 614, 626, 633, 639, 645, 695, 697, 729, 842, 863, 870, 915, 952, 961, 1001, 1012, 1017, 1039, 1061, 1104, 1116, 1154, 1160, 1178, 1186, 1279, 1282, 1357, 1426, 1465, 1483, 1500, 1508, 1517, 1518, 1561, 1570, 1666, 1687, 1711, 1716, 1743, 1829, 1864, 1879, 1918, 1960, 1989, 2027, 2030, 2033, 2052, 2069, 2070, 2127, 2151, 2160, 2197, 2204, 2236, 2241, 2324, 2340, 2359, 2360, 2373, 2377, 2381, 2384, 2393, 2443, 2475, 2547, 2563, 2588, 2605, 2608, 2698, 2739, 2750, 2762, 2791, 2859, 2899, 2924, 2927, 2930, 2995, 3029, 3037, 3044, 3068, 3075, 3112, 3214, 3231, 3243, 3249, 3266, 3312, 3433, 3461, 3487, 3491, 3575, 3621, 3632, 3650, 3681, 3773, 3779, 3797, 3803, 3900, 3902, 3943, 3985, 4087, 4107, 4121, 4122, 4128, 4189, 4306, 4335, 4367, 4371, 4376, 4378, 4382, 4388, 4391, 4403, 4407, 4409, 4410, 4418, 4419, 4420, 4427, 4434, 4435, 4445, 4446, 4457, 4462, 4463, 4472, 4484, 4487, 4488, 4489, 4495, 4499, 4500, 4501, 4503, 4505, 4509, 4517, 4519, 4522, 4523, 4527, 4529, 4543 |
© 2019 by the authors. Licensee MDPI, Basel, Switzerland. This article is an open access article distributed under the terms and conditions of the Creative Commons Attribution (CC BY) license (http://creativecommons.org/licenses/by/4.0/).
Share and Cite
Mohamed Diaaeldin, I.; Abdel Aleem, S.H.E.; El-Rafei, A.; Abdelaziz, A.Y.; Zobaa, A.F. A Novel Graphically-Based Network Reconfiguration for Power Loss Minimization in Large Distribution Systems. Mathematics 2019, 7, 1182. https://doi.org/10.3390/math7121182
Mohamed Diaaeldin I, Abdel Aleem SHE, El-Rafei A, Abdelaziz AY, Zobaa AF. A Novel Graphically-Based Network Reconfiguration for Power Loss Minimization in Large Distribution Systems. Mathematics. 2019; 7(12):1182. https://doi.org/10.3390/math7121182
Chicago/Turabian StyleMohamed Diaaeldin, Ibrahim, Shady H. E. Abdel Aleem, Ahmed El-Rafei, Almoataz Y. Abdelaziz, and Ahmed F. Zobaa. 2019. "A Novel Graphically-Based Network Reconfiguration for Power Loss Minimization in Large Distribution Systems" Mathematics 7, no. 12: 1182. https://doi.org/10.3390/math7121182
APA StyleMohamed Diaaeldin, I., Abdel Aleem, S. H. E., El-Rafei, A., Abdelaziz, A. Y., & Zobaa, A. F. (2019). A Novel Graphically-Based Network Reconfiguration for Power Loss Minimization in Large Distribution Systems. Mathematics, 7(12), 1182. https://doi.org/10.3390/math7121182