Abstract
The prevalence of business-to-business (B2B) has made the relationship among firms more closer than ever. Whether in simple arm-length transactions or business cooperation, many firms, in order to reduce costs and achieve efficiency, have shifted their day-to-day operations from the tradition of relying on manpower to the use of information technology in handling tasks such as inventory, procurement, production planning, distribution, etc. As a result, the need of a business process information system is imminent for firms to coordinate with partners in the supply chain and to be sustainable in the competitive market. This study thus proposes a hybrid multi-criteria decision-making approach for evaluating business process information systems. First, the factors that should be taken into account in selecting an appropriate system are explored. The Decision-Making Trial and Evaluation Laboratory (DEMATEL) is adopted next to understand the interrelationships among the criteria. Based on the results from the DEMATEL, the Fuzzy Analytic Network Process (FANP) is applied to calculate the importance of the factors. Fuzzy Techniques for Order of Preference by Similarity to Ideal Solution (FTOPSIS) is used to rank the business process information systems. The interrelationship among the factors should be considered in the decision-making; thus, the FANP can be a recommended methodology. However, the FANP questionnaire is usually very lengthy and cumbersome. The use of DEMATEL in advance can shorten the questionnaire substantially. FTOPSIS is used to rank the alternatives so that the pairwise comparisons of the alternatives required in the FANP can be avoided. Fuzzy set theory is incorporated in the study so that the uncertainty and ambiguity present in decision-making can be considered. The proposed approach can provide references for decision makers for making relevant decisions and can be revised and adopted in similar problems.
1. Introduction
A business process information system can integrate various software modules to control the data flow of business process tasks in a company. It usually integrates processes such as production planning, purchasing, inventory control, sales, distribution, project management, etc. [1,2].
In a high-tech industry, technological development is the key to the success, and a close relationship with the upstream suppliers and downstream customers is important to manufacture specialized final products. The implementation of a business process information system is becoming a must for the firms in the supply chain so that information can be transparent among the firms, the manufacturing cost can be reduced, and the production efficiency and product quality can be improved. A successful adoption of the business process information system can facilitate the business operations within and outside of a firm and to be sustainable in the fierce market. For example, Taiwan Semiconductor Manufacturing Company (TSMC), founded in 1987 in Taiwan, is the largest semiconductor foundry in the world. TSMC, has been implementing the virtual fab concept to provide a wide variety of semiconductor products for customers in the computer, communications, consumer, industrial, and standard semiconductor markets [3]. In order to handle a diversified product portfolio, provide on-time-delivery and short production cycle time, and respond to customer demands spontaneously, TSMC introduced its business process information system in October 1996 and completed its implementation in January 1998. With its successful implementation of the system, the firm can handle its business operations efficiently. In 2017, it manufactured 9920 different products using 258 distinct technologies for 465 different customers [3]. Therefore, if the business process information system can be adopted successfully, it can be very beneficial to a firm and help the firm to be competitive in the fierce market environment.
In this research, a hybrid MCDM approach for evaluating business process information systems is proposed. The DEMATEL is applied to learn the interrelationships among the criteria so that the length of the fuzzy ANP questionnaire can be shortened and only the important interrelationships are considered. The fuzzy ANP is adopted then to calculate the priorities of the sub-criteria. The final ranking of the business process information systems is calculated using the FTOPSIS. The most suitable business process information system can be selected for implementation as a result. The proposed approach is examined using a semiconductor manufacturing company as an example.
The organization of this paper is as follows: Section 2 briefly reviews the MCDM methodologies adopted in this research. Section 3 contains literature reviews on business process information system evaluation. Section 4 is the proposed hybrid MCDM approach for business process information system evaluation using DEMATEL, FANP, and FTOPSIS. A case study is carried out in Section 5. Some conclusion remarks are made in the last section.
2. Multi-Criteria Decision-Making
Decision-making trial and evaluation laboratory (DEMATEL), first developed by the Battelle Geneva Institute, is a structural modeling approach to detect complex causal relationships and to build a relation structure among criteria [4,5]. By preparing a matrix or a diagram, a contextual relationship among the elements in a system can be observed [6]. Since its introduction, the DEMATEL has been adopted abundantly both in academic field and in real practice.
Analytic network process (ANP), a generalization of analytic hierarchy process (AHP), is a multiple-criteria decision-making methodology proposed by Saaty [7]. While the AHP considers a hierarchy, the ANP can consider a network [8]. The importance of the factors and the interrelationships among the factors are pairwise compared, and the eigenvectors are calculated and put in the designated locations in a supermatrix. To ensure column stochastic, a weighted supermatrix is calculated [7]. A limit supermatrix is calculated by raising the weighted supermatrix to powers. The final outcomes can be obtained in the limit supermatrix. Since uncertainty and ambiguity are often present in real practice, the fuzzy set theory has also been used in the ANP. The ANP that incorporates the fuzzy set theory is called fuzzy ANP, or FANP.
The Technique for Order Performance by Similarity to Ideal Solution (TOPSIS), proposed by Hwang and Yoon [9], is a commonly-used technique for solving multi-attribute multi-criteria decision-making (MCDM) problems. The concept of the TOPSIS is to determine a positive ideal solution (PIS), which maximizes all benefit criteria and minimizes all cost criteria, and a negative ideal solution (NIS), which maximizes all cost criteria and minimizes all benefit criteria, to a problem [10]. The ranking of alternatives is based on the relative distance of an alternative from the PIS and the NIS. That is, the best alternative should have the shortest distance from the PIS and the farthest distance from the NIS. An extension of TOPSIS to the fuzzy environment has also been studied [11,12,13]. Some recent works that adopted fuzzy TOPSIS (FTOPSIS) include Khatir and Akbarzadeh [14] and Nilashi et al. [15].
There are different types of MCDM techniques and the integrations of the MCDMs have often been proposed to tackle various real-world problems. Some works are reviewed here. Büyüközkan and Çifçi [16] constructed a hybrid fuzzy MCDM (FMCDM) model, which integrated the DEMATEL, the ANP, the TOPSIS, and the fuzzy set theory, for evaluating green suppliers in order to improve green supply chain management. Hsu and Liou [17] presented a hybrid MCDM model, which combined the DEMATEL and the ANP, to consider multiple criteria and the interdependencies among dimensions and then to calculate the criteria weights for selecting outsourcing providers for the airline industry. Deng et al. [18] proposed a hybrid MCDM model, which combined the balanced scorecard (BSC), the DEMATEL, the ANP and the VlseKriterijumska Optimizacija I Kompromisno Resenje in Serbian (VIKOR), to understand the sustainability performance factors for certified public accountant firms in Taiwan. Dinçer et al. [19] constructed an interval type 2 fuzzy sets MCDM approach, which combined the DEMATEL-based ANP and the multi-objective optimization on the basis of ratio analysis, to study the emerging industries based on the signaling theory. Chen and Yang [20] examined the critical auditing criteria for implementing green marketing activities and used an integrated AHP and DEMATEL approach to obtain the weights of the criteria. Khatir and Akbarzadeh [14] presented a fuzzy multi-attribute decision making (FMADM) model. The fuzzy DEMATEL and the FANP were applied to calculate the priorities of factors and sub-factors, and the FTOPSIS was used to rank the strengths, weaknesses, opportunities, and threats (SWOT) strategies for national science and technology. Nilashi et al. [15] applied two MCDM techniques, the DEMATEL and the fuzzy TOPSIS, to understand the interrelationships among the factors and to obtain the importance weights of the factors that influenced medical tourism adoption in Malaysia.
3. Business Process Information System Evaluation
The benefits from implementing business process information system, such as an enterprise requirement planning (ERP), can be classified into tangible and intangible benefits [21,22,23]. Some tangible benefits are: reduction of inventory level and order lead time, improvement in orders management, reduction of production cycle time, increased productivity, reduction of personnel, shortened financial cycles, improved cash flow management, improved customer service, reduction of expenses, increase of revenue and profits, reduction of transportation costs, and reduction of system maintenance needs [22,23,24]. Some intangible benefits are: increased visibility of corporate data, better integration of financial information, improved responsiveness to customers, better integration of customer-order information with other information, improved communications, better coordination among processes and information, standardization and acceleration of manufacturing processes, standardization of computing platforms, standardization of human-resource information, enhanced organizational flexibility, improved business performance, improved decision-making capabilities, strengthening supply chain partnerships, improved visibility into the supply chain management process, and increased competitive advantage [22,23,24,25].
With the potential benefits of the information systems, many firms still face barriers to implement systems successfully. Some barriers include: complexity of the business environment, need for extensive customization, unfit for the firm’s operations properties, limitations in available financial, human and technical resources, diversity of the systems, risks associated with the implementation, and absence of guidance for adoption [25,26,27,28,29,30].
If a firm does not fully consider the implications of its business and its compatibility with overall organizational goals and strategies, a wrong selection and inappropriate implementation of the information system can weaken the benefits of the information system that can bring to the firm or can even lead to adverse impact on company performance [29,31,32].
Thus, a firm needs to select suitable information system and IT tools, adjust its business process, and evaluate performance appropriately to successfully implementing a system [30]. Since firms often do not develop their own business process information systems, the support of software developers from the installation to the implementation and everyday operation of the system is essential. Therefore, various factors, including the software-related factors and vendor-related factors, need to be considered in selecting the system.
In order to solve the business process information system evaluation problem, scholars have proposed various kinds of approaches. Some related works that adopted MCDM techniques are reviewed here. Huang et al. [33] presented one of the first works that used a fuzzy analytic hierarchy process (FAHP)-based methodology for evaluating ERP software alternatives. Cebeci [34] constructed a decision support system for selecting ERP systems with two phases. In the first phase, the vision, the strategies and the key performance indicators (KPIs) of a firm were analyzed through the strengths, weaknesses, opportunities, and threats (SWOT) analysis and balanced scorecard (BSC), and the ERP systems that could not meet the requirements of the firm were eliminated. In the second phase, a hierarchy for evaluating the ERP systems was constructed, and the FAHP was adopted to obtain the weights of the attributes and the ranking of the ERP systems. Kahraman et al. [35] applied the fuzzy set theory and the analytic hierarchy process (AHP) for selecting ERP systems. The ERP outsourcing problem was studied, and a hierarchy with seven criteria and 22 sub-attributes was developed to assess three ERP outsourcing alternatives. Standardized trapezoidal fuzzy numbers (STFNs) were used to convert decision-makers’ judgments, and the fuzzy analytic hierarchy process AHP (FAHP) was applied to obtain the ranking of the ERP outsourcing alternatives. Hamidi [1] constructed a framework for selecting a suitable ERP system by applying the FAHP. The hierarchy is decomposed into three major factors, i.e., product factors, system factors and management factors. Each factor is further decomposed into several sub-factors, and there are a total of 12 sub-factors. The extent analysis on FAHP was then applied to calculate fuzzy weights of the sub-factors and the ranking of the ERP system alternatives. El-Mashaleh et al. [25] developed a multi-attribute decision-making model for selecting ERP system by applying data envelopment analysis (DEA). The two input factors were total cost and implementation schedule, and the four output factors were functionality, user friendliness, customization capability, and service and support quality. The total cost factor was measured in monetary values, the implementation schedule was measured in the length of time, the functionality was measured in the percentage of supported needs, and the rest were subjective scores given by the decision-maker.
The constructed model was adopted by a construction contractor to select ERP alternatives. Shen et al. [23] studied the performance evaluation of an ERP system after its implementation and constructed a post-implementation ERP performance evaluation framework. The framework considered the four perspectives, i.e., financial, customer, innovation and learning, and internal business process, of the BSC, and integrated linguistic variables and non-additive fuzzy integral. The framework could measure the performance level of the ERP system objectively and to examine the contribution of the ERP system to the strategic objectives of the firms. Shukla et al. [29] proposed a hybrid MCDM approach for ERP system selection by integrating stepwise weight assessment ratio analysis (SWARA) and PROMETHEE. The SWARA was adopted to evaluate the weights of the criteria first, and the PROMETHEE was applied next to aggregate the results from evaluating the performance of the ERP system alternatives with respect to the criteria. The final ranking of the alternatives could be obtained as a result. Efe [2] integrated the FAHP and fuzzy technique for order preference by similarity to ideal solution (fuzzy TOPSIS) for selecting ERP system and used an attribute based aggregation technique for group decision-making. The fuzzy extension of the AHP was applied to determine the weights of the criteria in the ERP system selection problem, and the fuzzy TOPSIS was used to rank the ERP systems in meeting the firm’s goals in an uncertain environment. Niu et al. [30] studied the ERP system selection problem and the performance evaluation of the ERP system after implementation. A manufacturing company was used as an example to examine the two proposed models. In the first model, two hierarchies were formed under two different objectives: choosing the most appropriate ERP system and choosing the most appropriate ERP vendor. Each hierarchy was decomposed into different attributes, but the alternatives were the same ERP systems under study. The AHP was applied to obtain the priorities of the ERP systems under the two objectives, and the final priorities of the systems were calculated by given the equal weights to the two objectives. In the second model, the Likert scale, the AHP, and fuzzy integrated evaluation (FIE) were integrated to evaluate the performance of the ERP system after its implementation. Tasnawijitwong and Samanchuen [36] studied the selection of open source ERP system, which was free or low cost, customizable and flexible, for small and medium enterprises (SMEs) since SMEs often have limited fund for investment and need open source ERP systems to increase competitiveness. The important criteria that SMEs need to evaluate open source ERP systems were listed, and a framework that adopted the AHP was constructed to help SMEs to select the most suitable ERP system.
Analytic network process (ANP), a general form of AHP, has also been applied for evaluating information systems. Unlike the AHP, which must assume the independence among the elements, the ANP can consider the variety of interactions, dependencies and feedbacks among elements and among clusters. Some recent works that adopted ANP in ERP system selection are reviewed as follows. Ayağ and Özdemİr [24] presented a fuzzy ANP (FANP) approach for ERP software selection to help firms make the most appropriate decision while satisfying the needs and expectations. Because of vagueness and uncertainty on judgments of the decision-makers, the crisp pairwise comparison in the conventional ANP may not be adequate to capture the correct judgments of decision-makers. Therefore, the fuzzy set theory was incorporated into the ANP. Kilic et al. [37] proposed a model that combined the ANP and the preference ranking organization method for enrichment evaluations (PROMETHEE) to evaluate the ERP systems for small and medium-sized enterprises in Turkey. The ANP was applied first to understand the relations among the criteria and to obtain the weights of the criteria. Based on the weights of the criteria, the PROMETHEE was adopted next to calculate the ranking of the ERP system alternatives. Chang et al. [38] proposed a FANP approach that integrated fuzzy set theory, triangular fuzzy number and ANP to assess ERP implementation risks, which were categorized into four groups, i.e., management and execution, software system, users, and technology planning. By addressing the imprecise nature of the vague problem and the dependence and feedback of the criteria, the approach could generate the most suitable ERP design for a firm.
While there are some MCDM approaches in evaluating business process information systems, this research, in the authors’ knowledge, is the first hybrid MCDM approach that integrates DEMATEL, FANP and FTOPSIS for the information system evaluation. With the adoption of the DEMATEL, the interrelationships among the criteria can be examined first and can be used to prepare FANP questionnaire. The FANP is applied next to calculate the priorities of the sub-criteria. Finally, the FTOPSIS is used to rank the information system alternatives.
4. Proposed Model
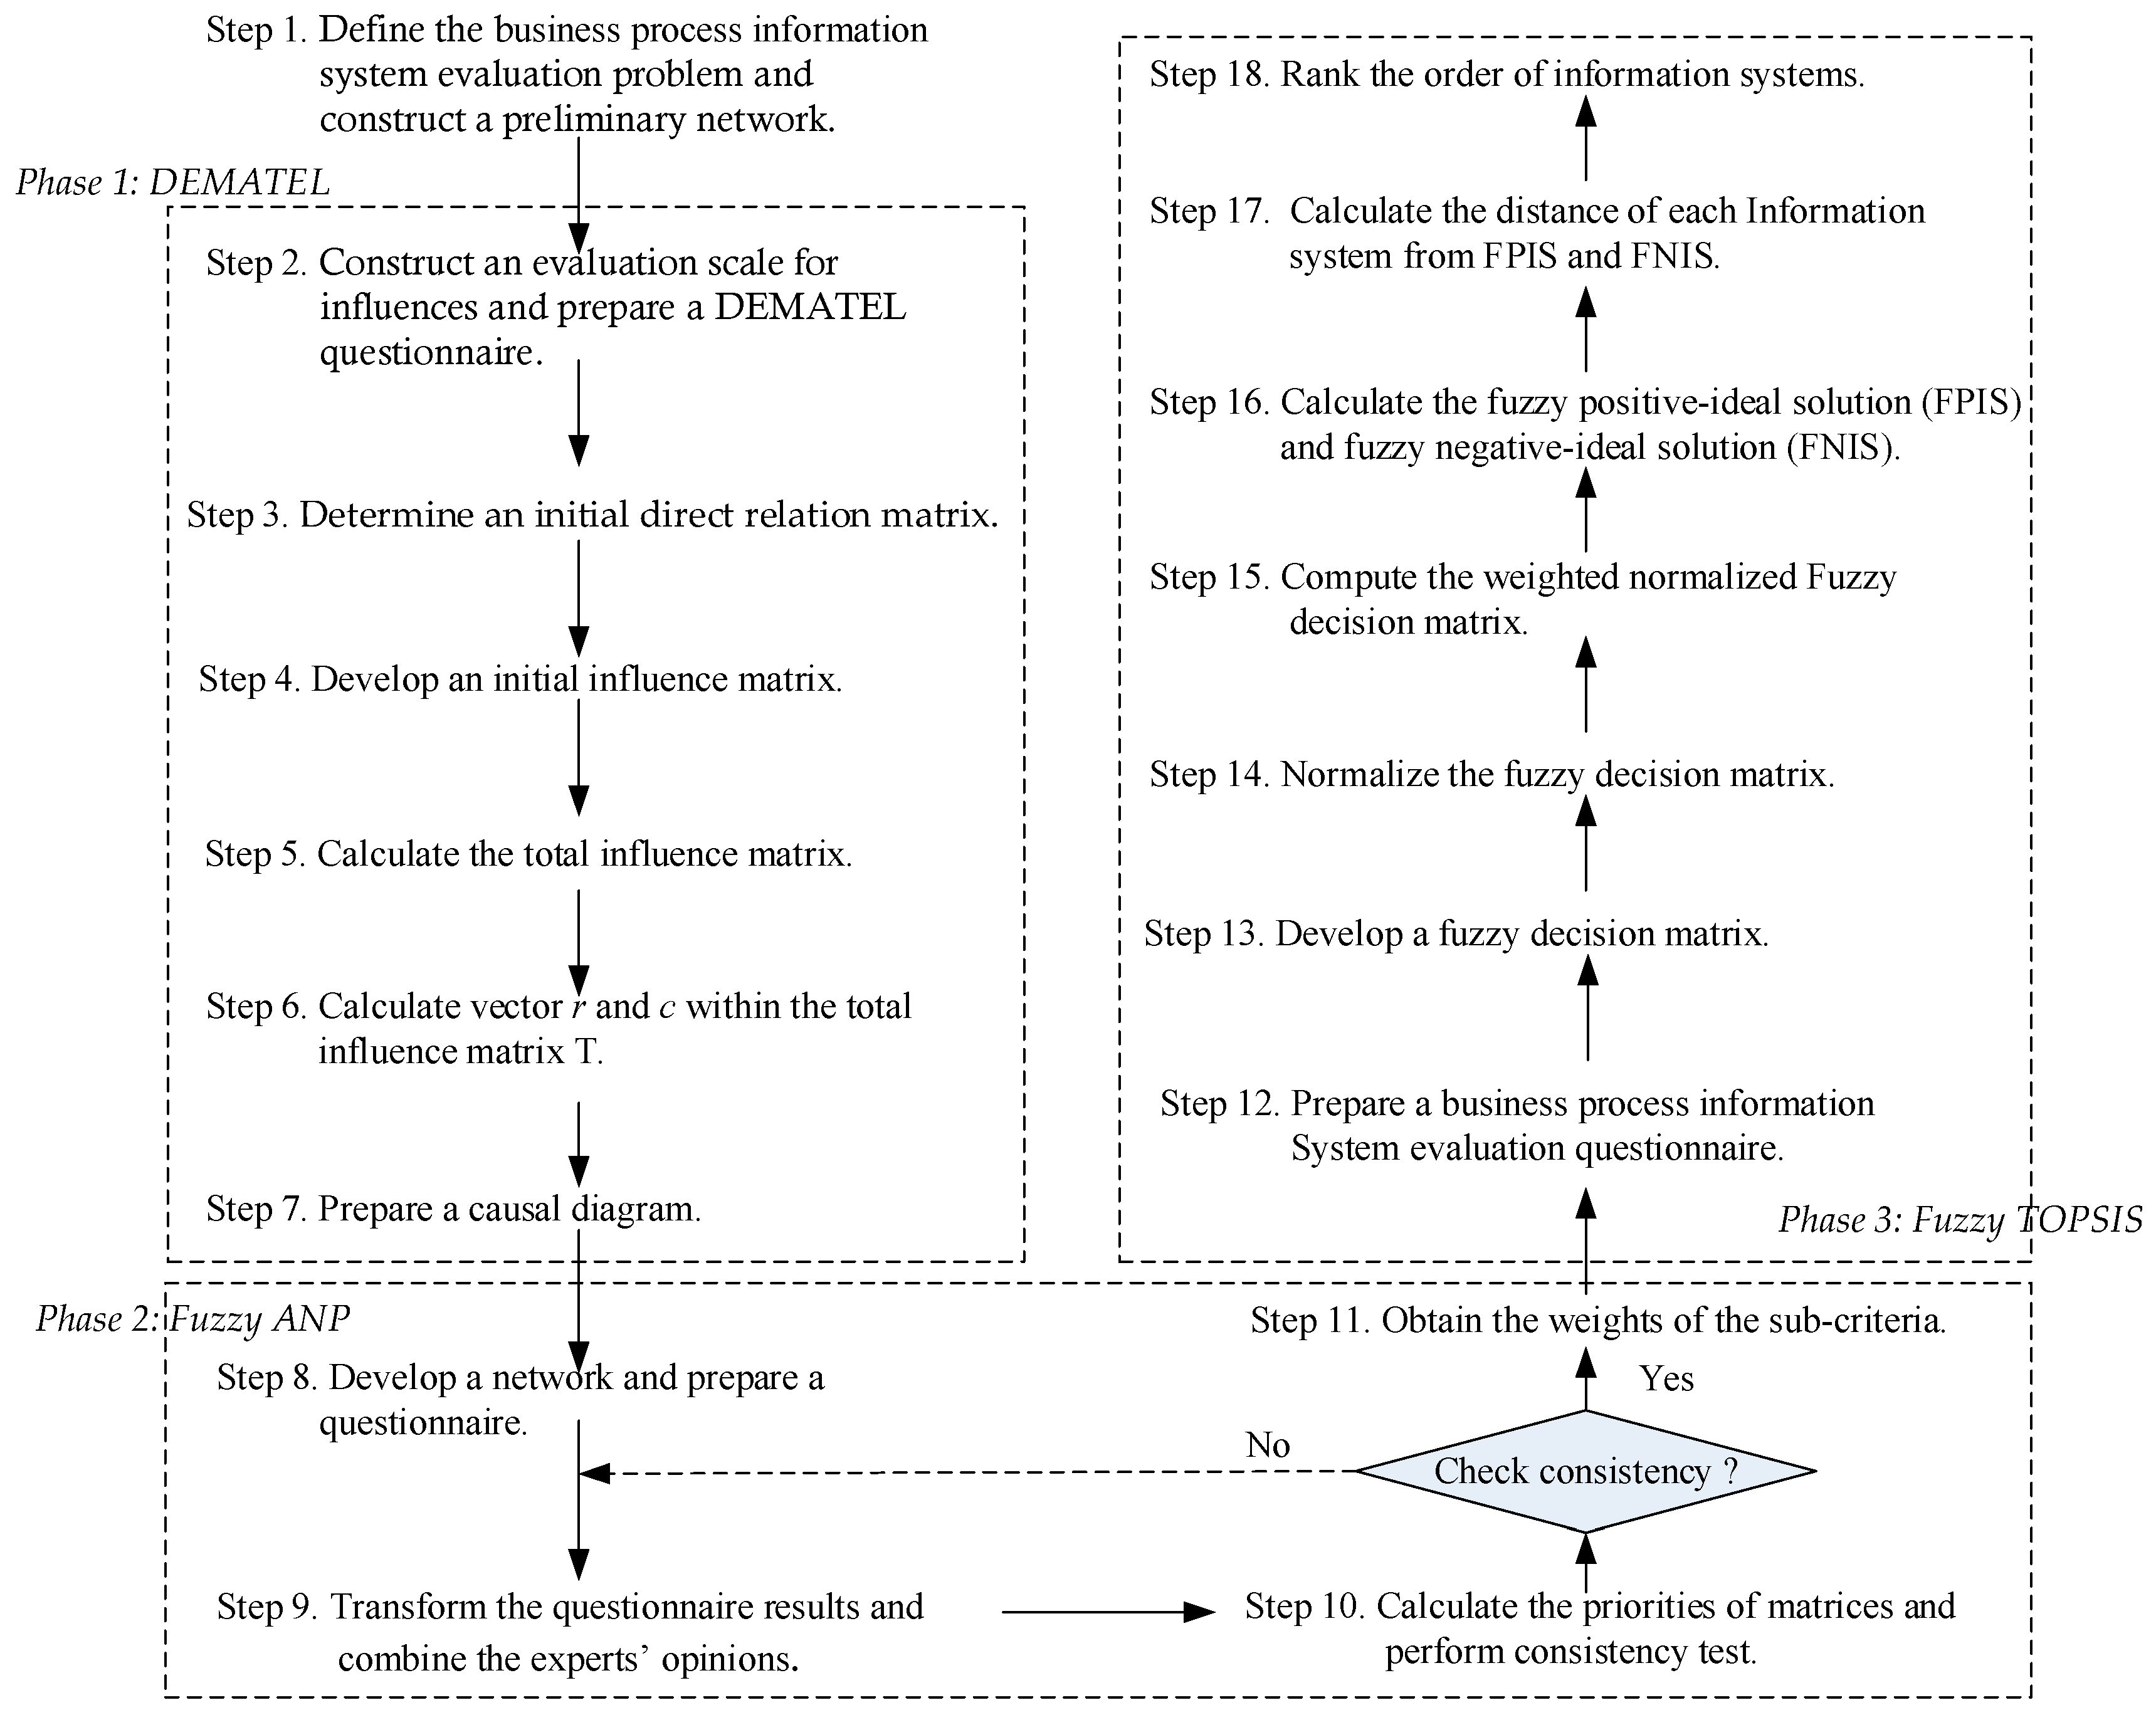
A business process information system evaluation model with two phases is developed, as shown in Figure 1. The steps are as follows:
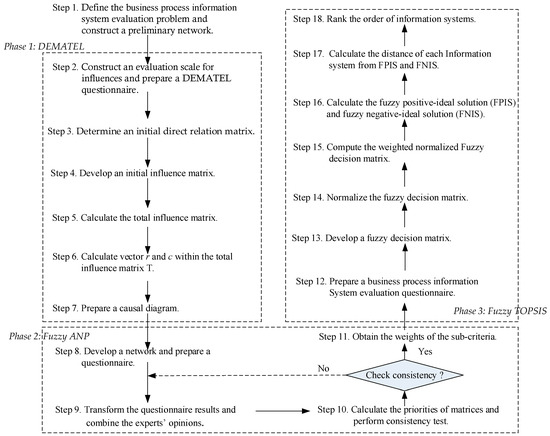
Figure 1.
Business process information system evaluation model.
- Step 1.
- Define the evaluation problem for business process information systems, and construct a preliminary network. Review past works of information system evaluation and selection, and interview with experts in the field. With the confirmation of the experts, an initial network is constructed.
4.1. Phase 1: DEMATEL
- Step 2.
- Construct an evaluation scale for influences and prepare a DEMATEL questionnaire. A scale is developed, with 0 indicating no influence, 1 indicating little influence, 2 indicating medium influence, 3 indicating high influence, and 4 indicating very high influence. Prepare a questionnaire to evaluate the interrelationship between each two criteria.
- Step 3.
- Develop an initial direct relation matrix. Based on the questionnaires collected from K experts, an initial direct relation matrix with n criteria can be developed by the geometric mean method. The initial direct relation matrix Z is as shown in Equation (1):where indicates the influence degree of criterion i to criterion j, and the values in the diagonal line from the top left to the bottom right are zeros.
- Step 4.
- Develop an initial influence matrix. The initial direct relation matrix Z is normalized using Equations (2)–(4) to calculate an initial influence matrix D [39,40]:
- Step 5.
- Calculate the total influence matrix. After infinite number of direct and indirect influences to each criterion, the total influence matrix T is obtained by Equation (5) [39,40].where m is an integer variable ranging from 1 to infinity, and I is the identity matrix.
- Step 6.
- Calculate vector r and c within the total influence matrix T by Equations (6) and (7) [39,40]:where superscript ‘ denotes transposition, ri shows the sum of direct and indirect influences of creation i on other criteria, cj shows the sum of direct and indirect influences that criterion j has received from other criteria.
- Step 7.
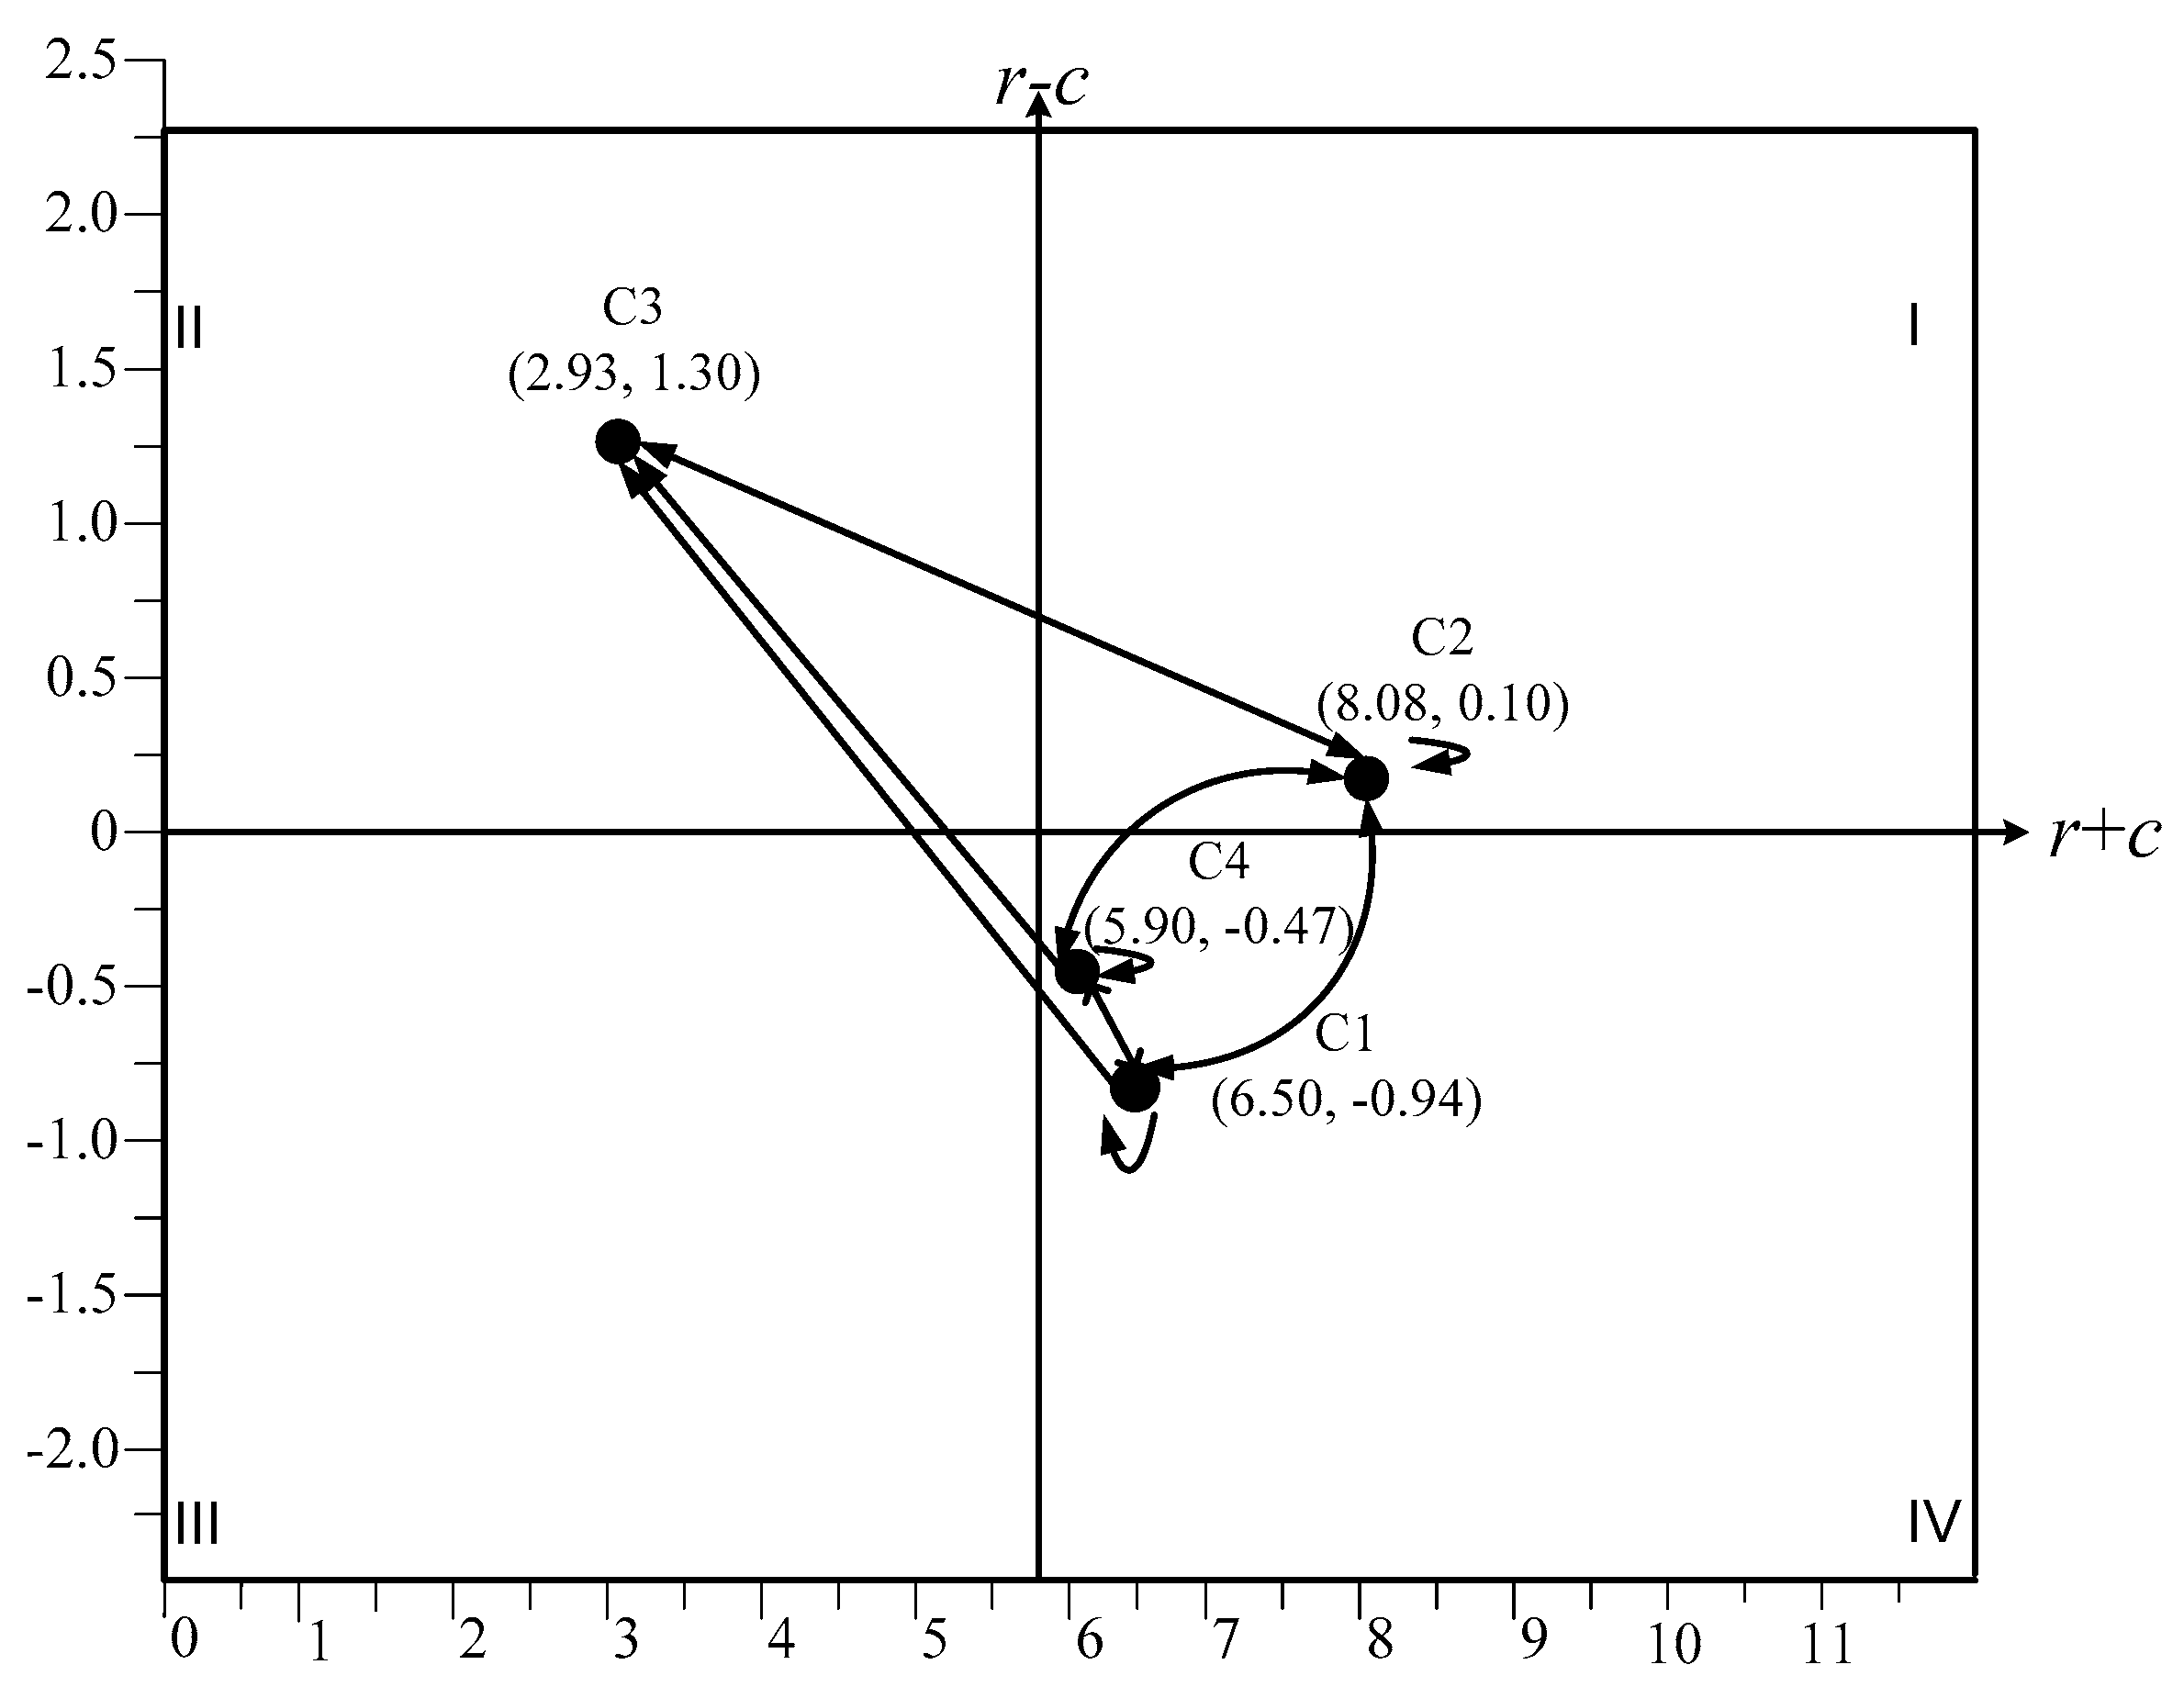
- Prepare a causal diagram. When j = i, ri + ci indicates an index of the strength of influences given and received, and it shows the degree criterion i plays in the problem [41]. When ri − ci is positive, criterion i is influencing other criteria. When ri − ci is negative, criterion i is being influenced by other criteria. A causal diagram is prepared with ri + cj as the horizontal axis and ri − cj as the vertical axis. Quadrant I contains the core criteria, also called intertwined givers, which have high prominence and high relation. Quadrant II contains driving criteria, which have low prominence but high relation. These driving criteria, or autonomous givers, only influence a few other criteria. Quadrant III contains independent criteria, which have low prominence and low relation. These independent criteria, or autonomous receivers, can be individually treated because they may not influence other criteria. Quadrant IV contains affected criteria, which have high prominence and low relation. These affected criteria, or intertwined receivers, do not influence other criteria but are influenced by other criteria.
4.2. Phase 2: Fuzzy ANP
- Step 8.
- Develop a network and prepare a questionnaire. Based on the result from DEMATEL, a network is developed. A questionnaire with pairwise comparisons is prepared and given to the experts to fill out. The questions include: the relative importance between two criteria, the relative importance between two sub-criteria, the influence of other criteria on one specific criterion, the influence of other sub-criteria on one specific sub-criterion, and the relative performance of each two systems with respect to a sub-criterion. The linguistic levels of importance and their corresponding triangular fuzzy numbers are listed in Table 1 [7,42,43,44,45].
 Table 1. Membership function of fuzzy numbers.
 - Step 9.
- Transform the questionnaire results and combine the experts’ opinions. Experts’ opinions are transformed into matrices with triangular fuzzy numbers first, and the matrices from multiple experts are combined next. Then, matrices with crisp numbers are formed. For instance, the comparison matrix for sub-criteria with triangular fuzzy numbers with respect to the goal for decision maker k is as shown in Equation (8) [42,43,44]:
Geometric mean method is applied to combine K experts’ opinions using Equations (9) and (10):
where , , .
Yager’s defuzzification approach [46] is adopted to defuzzify triangular fuzzy numbers, as shown in Equation (11):
- Step 10.
- Calculate the priorities of matrices and perform consistency test. For instance, the priorities for the defuzzified pairwise comparison matrix for criteria with respect to the goal are calculated using Equation (13) [7]:where is the defuzzified pairwise comparison matrix, is the eigenvector, and is the largest eigenvalue of .
The consistency index, CI, and the consistency ratio, CR, for each defuzzified pairwise comparison matrix are calculated, and the matrices that fail the consistency test must be revised by the experts. The CI and CR are calculated by Equations (14) and (15), respectively:
where is the largest eigenvalue of , n is the number of sub-criteria being compared in the matrix, and RI is random index found in Saaty [47].
- Step 11.
- Obtain the weights of the sub-criteria. After steps 8–10, all relevant vectors can be obtained, and an unweighted supermatrix (W′) can be formed, as in Equation (16). Form a weighted supermatrix (). By raising the weighted supermatrix to an infinite power, a limited supermatrix (W) is obtained, as in Equation (17) [42,43,44].where is a vector that represents the impact of the goal on the criteria, is a matrix that represents the impact of criteria on each of the sub-criterion, shows the interrelationships among the criteria, shows the interrelationships among the sub-criteria. The priorities of the sub-criteria can be found in the sub-criteria-to-goal column in the limit supermatrix (sj).
4.3. Phase 3: Fuzzy TOPSIS
- Step 12.
- Prepare a business process information system evaluation questionnaire. A questionnaire is formed to ask the expected performance of each business process information system with respect to each sub-criterion [48]. Table 2 lists the seven linguistic levels of performance [49].
Table 2. Membership function of fuzzy numbers for information system evaluation.
- Step 13.
- Develop a fuzzy decision matrix. Based on the questionnaires collected from the experts, a fuzzy decision matrix for the group can be developed by the arithmetic mean method by Equation (18) [14,15,16]:where is a fuzzy decision matrix, and is the synthesized performance of system with respect to sub-criterion j.
- Step 14.
- Normalize the fuzzy decision matrix:where and .
- Step 15.
- Compute the weighted normalized fuzzy decision matrix:where sj is obtained from Step 11.
- Step 16.
- Calculate the fuzzy positive-ideal solution (FPIS) and fuzzy negative-ideal solution (FNIS) [14,16]:where is the FPIS for sub-criterion j, and is the FNIS for sub-criterion j.
- Step 17.
- Calculate the distance of each information system from FPIS and FNIS [14,16]:where , is the distance of information system from FPIS, and is the distance of information system from FNIS.
- Step 18.
- Calculate the closeness coefficients (CC) and rank the order of information systems. The CC is obtained by Equation (24):where is the closeness coefficient of information system . The information system with the highest CC is the best alternative.
5. Case Study
A case study is examined using the proposed hybrid MCDM approach. The firm in this study is a semiconductor manufacturing company considering implementing a business process information system. Five experts from the company were asked to contribute their expertise. The experts include the chief operating officer, one project manager, two senior managers from the information technology department, and an information technology consultant. They were invited because they have been involved in the business process information systems and they know the basic concept of information technology and big data analysis. The evaluation process is as follows:
- Step 1.
- Define the evaluation problem for business process information systems, and construct a preliminary network.
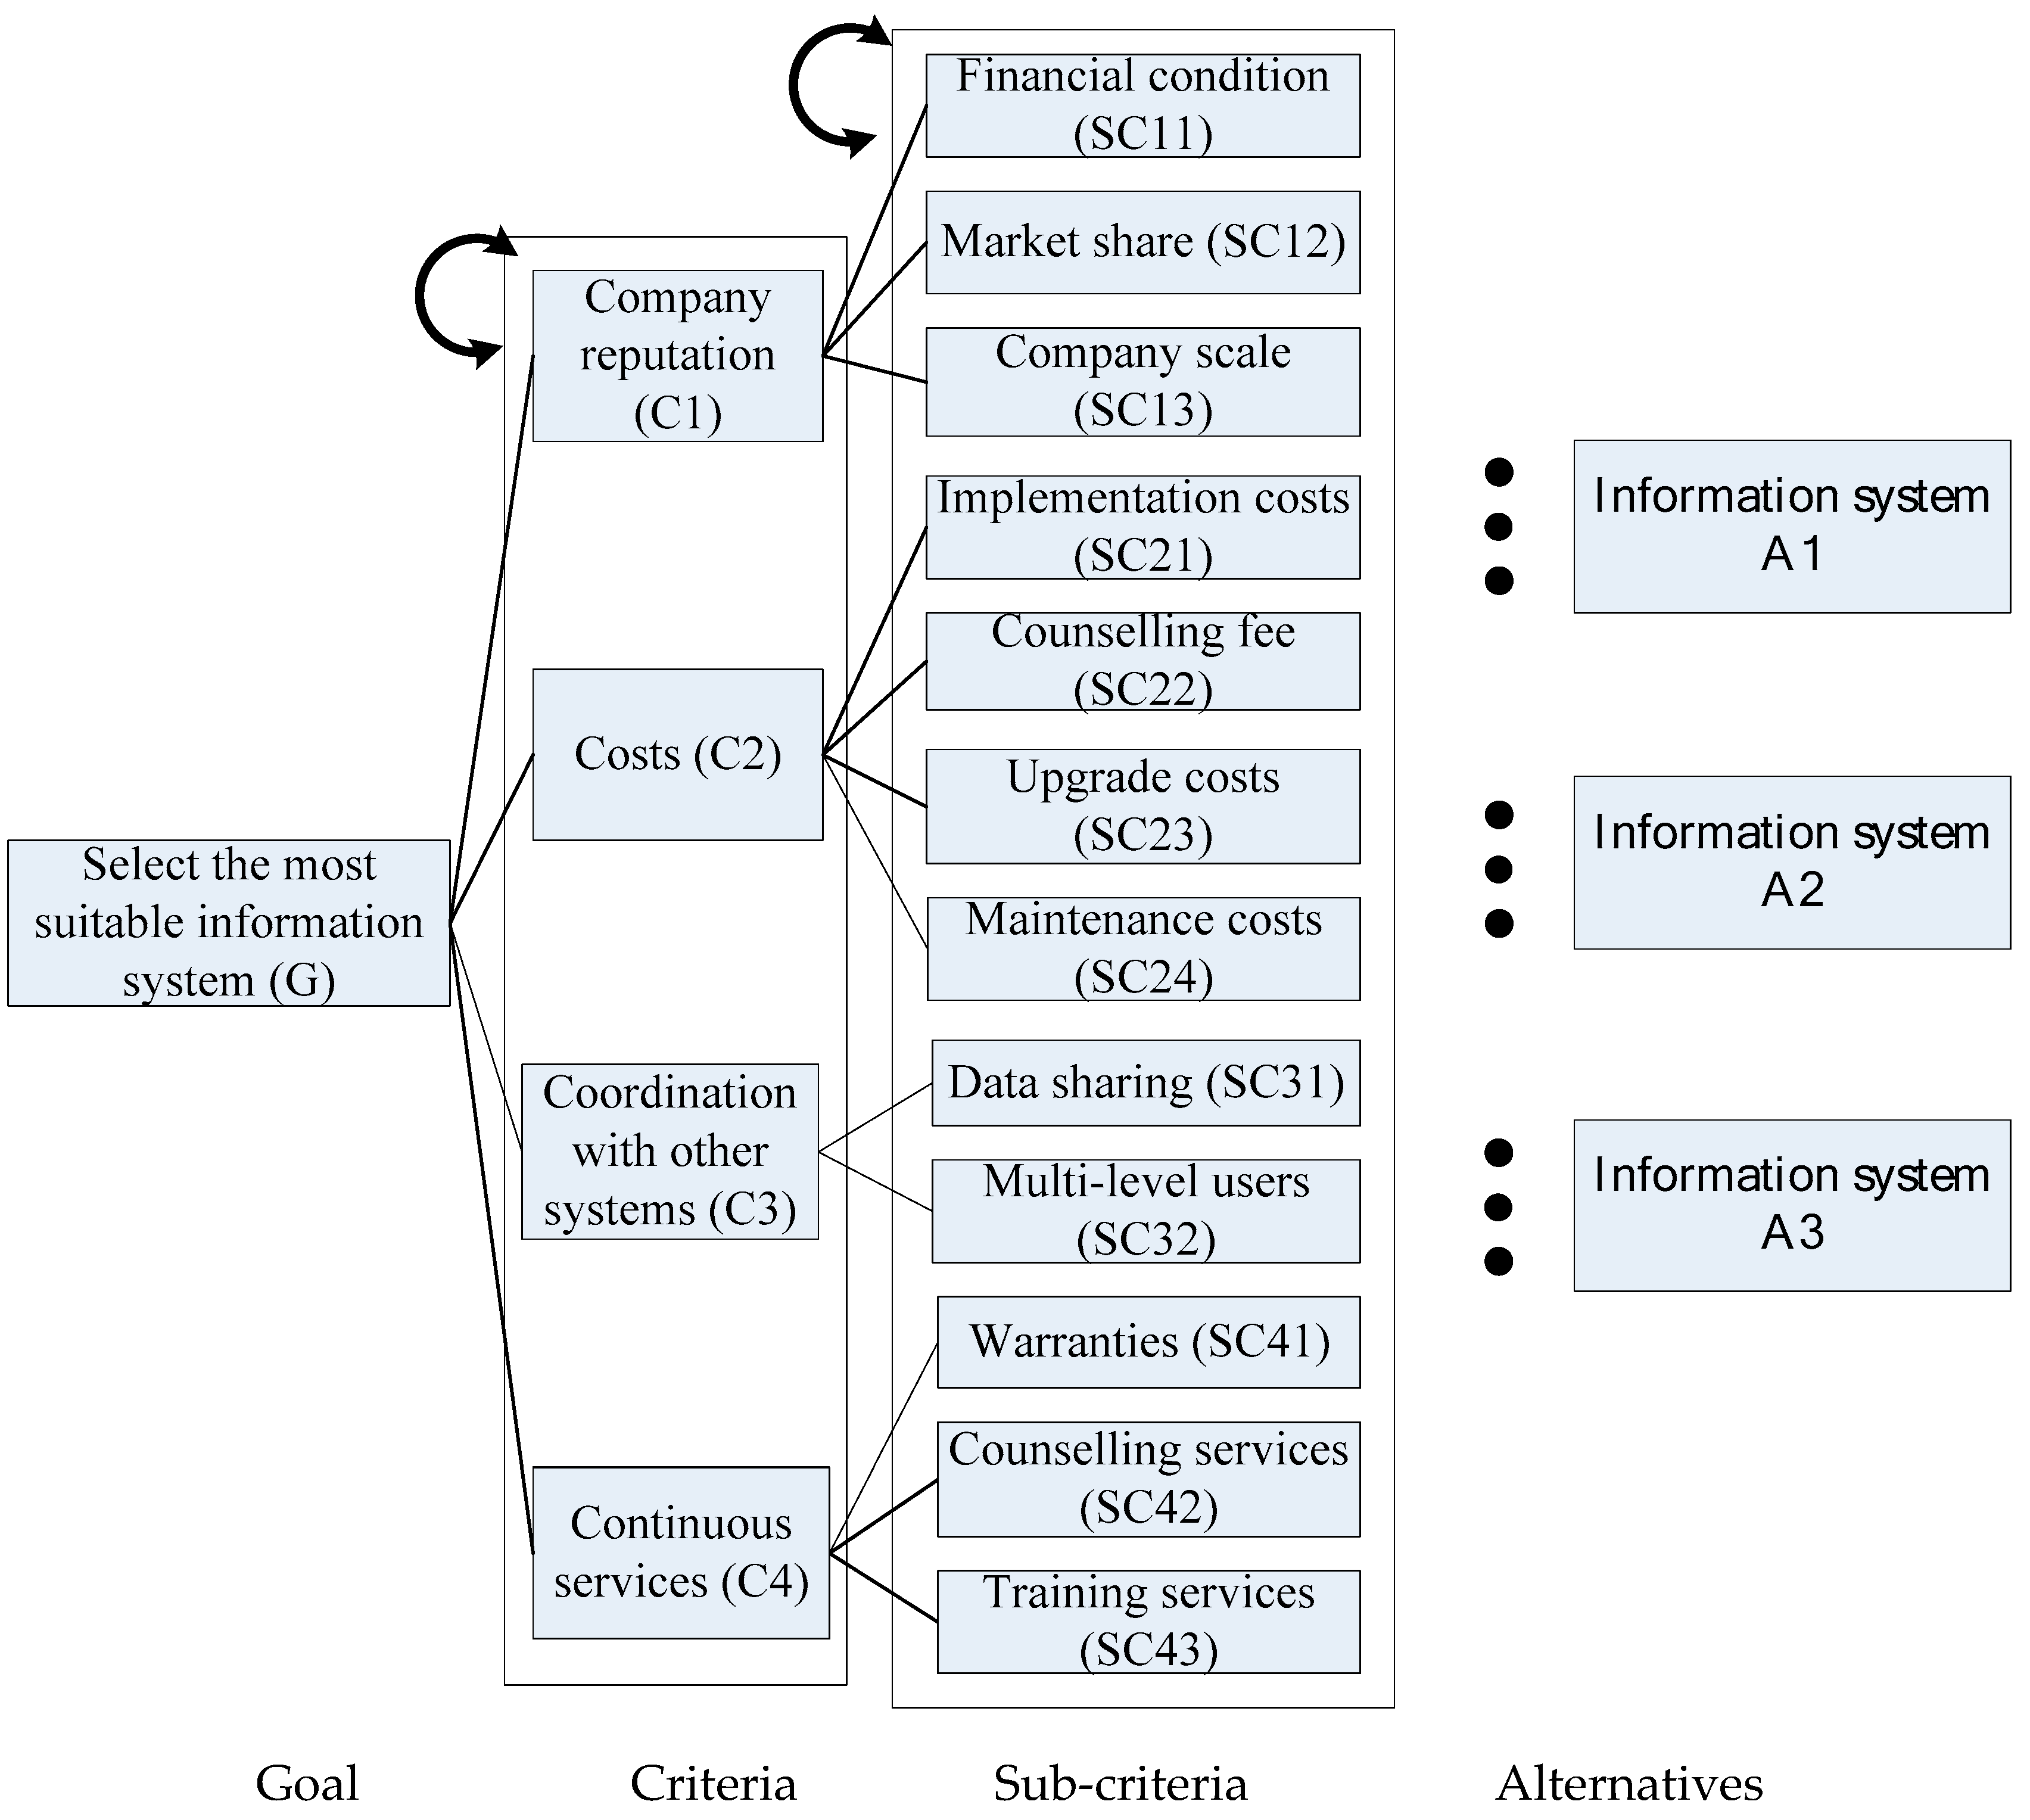
After an intensive literature review on information system evaluations and interviews with experts in the related field, the research constructs an initial network, as shown in Figure 2. To evaluate the suitability of the information system, four criteria are considered: reputation of the information system supplier, information system related costs, coordination of the information system with other systems, and continuous service from the supplier. Under each criterion, there are a number of sub-criteria. Three information systems under consideration are the alternatives.
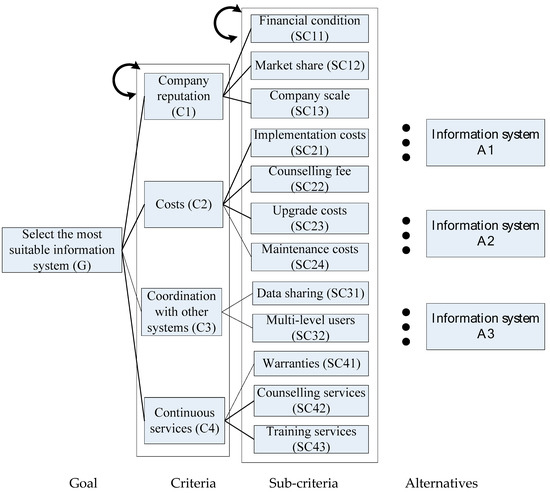
Figure 2.
Initial information system evaluation network.
5.1. Phase 1: DEMATEL
- Steps 2 and 3.
- Develop an initial direct relation matrix.
A questionnaire was prepared and given it to the experts to evaluate the interrelationship between each two criteria. Based on the results from the experts, an initial direct relation matrix is formed by applying the geometric mean method. The initial direct relation matrix Z is as follows:
- Steps 4.
- SDevelop an initial influence matrix.
Sum each column and each row of the initial direct relation matrix Z. The largest sum of all columns is 10.034, and the largest sum of all rows is 9.72. After normalization, the initial influence matrix D is as follows:
- Steps 5.
- Calculate the total influence matrix.
The total influence matrix T is calculated as follows:
Set a threshold value of 0.6, and the final total influence matrix is:
- Steps 6.
- Calculate vector r and c within the total influence matrix T.
Based on the final total influence matrix T, calculate vector r and c. The results are as shown in Table 3.
Table 3.
Relation of the criteria.
- Steps 7.
- Prepare a causal diagram.
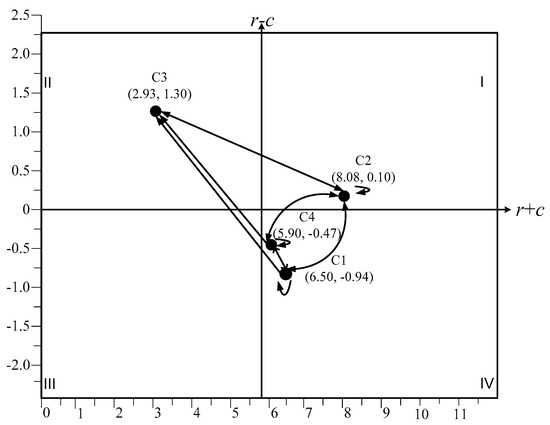
Figure 3.
Causal diagram for the criteria.
5.2. Phase 2: Fuzzy ANP
- Steps 8.
- Develop a network and prepare a questionnaire.
Based on the result from DEMATEL, a network is developed, as depicted in Figure 4. Company reputation (C1) is influenced by company reputation (C1), costs (C2), and continuous services (C4). This implies that the sub-criteria under company reputation (C1), namely financial condition (SC11), market share (SC12), and company scale (SC13) are influenced by the sub-criteria under company reputation (C1), costs (C2), and continuous services (C4). In addition, costs (C2) is influenced by company reputation (C1), costs (C2), coordination with other systems (C3), and continuous services (C4). Coordination with other systems (C3) is influenced by company reputation (C1), costs (C2), and continuous services (C4). Continuous services (C4) is influenced by company reputation (C1), costs (C2), and continuous services (C4). A questionnaire with pairwise comparisons is prepared and given to the experts to fill out.
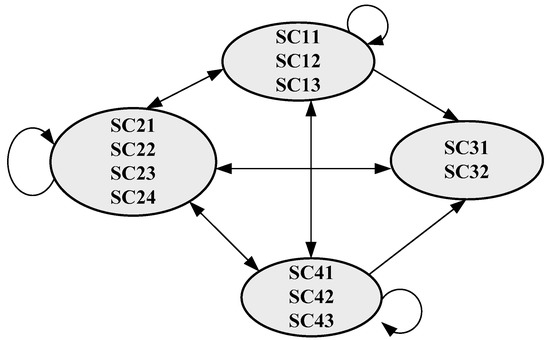
Figure 4.
Partial network with sub-criteria.
- Steps 9.
- Transform the questionnaire results and combine the experts’ opinions.
Based on the questionnaire results, experts’ opinions are transformed into matrices with triangular fuzzy numbers first, and the matrices from multiple experts are combined next. For example, the fuzzy pairwise comparison matrix of criteria for expert 1 is:
After transforming the questionnaire results into fuzzy pairwise comparison matrices from each decision maker, fuzzy group pairwise comparison matrices are formed by the geometric mean approach. For example, the fuzzy group pairwise comparison matrix for the criteria is:
Defuzzified pairwise comparison matrices are calculated using Yager’s defuzzification approach [46]. For instance, the defuzzified group pairwise comparison matrix for the importance of the sub-criteria, , is prepared:
- Steps 10.
- alculate the priorities of matrices and perform consistency test.
The priorities of all matrices are calculated, and the consistency test is performed. For instance, the priority vector of the criteria, , is calculated, and the maximum eigenvalue, , is obtained. Then, a consistency test is done by calculating and :
After the consistency test is passed, the eigenvector for the importance of the sub-criteria, , is confirmed. Costs (C2), with the highest priority of 0.36897, is the most important criterion, followed by company reputation (C1), with a priority of 0.27716, and coordination with other systems (C3), with a priority of 0.25548. In case that an inconsistency exists, the experts are asked to revise the specific portion of the questionnaire.
- Steps 11.
- Obtain the weights of the sub-criteria.
By forming the unweighted supermatrix, weighted supermatrix, and the limit supermatrix, the weights of the sub-criteria can be obtained. All the matrices generated from the questionnaires are solved, and the eigenvector of each defuzzified group pairwise comparison matrix can be entered into an unweighted supermatrix, as shown in Table 4. The weighted supermatrix and the limit supermatrix are then obtained, as shown in Table 5 and Table 6, respectively. In the sub-criteria-to-goal column in the limit supermatrix, the weights of the sub-criteria can be found. The relative importance of the sub-criteria may be valuable information for decision-makers. The priorities and ranking of the sub-criteria are listed in Table 7. In the study, upgrade costs (SC23), with a priority of 0.16206, is the greatest concern of the experts, followed by the company scale of the information system provider (SC13) with a priority of 0.14192, and data sharing among system users (SC31) with a priority of 0.12696. The fourth and fifth important sub-criteria are the counseling fee (SC22) and implementation costs (SC21), respectively.
Table 4.
Unweighted supermatrix.
Table 5.
Weighted supermatrix.
Table 6.
Limit supermatrix.
Table 7.
Priorities of the sub-criteria.
- Steps 12 and 13.
- Prepare a business process information system evaluation questionnaire and develop a fuzzy decision matrix.
A questionnaire is prepared to ask the experts to evaluate the expected performance of each business process information system with respect to each sub-criterion. Three information systems are evaluated, and five experts, k1–k5, are invited to fill out the questionnaire. The results are shown in Table 8. By the arithmetic mean method, a fuzzy decision matrix is developed, as shown in Table 9.
Table 8.
Performance evaluation of the three information systems by the experts.
Table 9.
Fuzzy decision matrix .
- Steps 14, 15 and 16.
- Normalize the fuzzy decision matrix, compute the weighted normalized fuzzy decision matrix, and calculate the fuzzy positive-ideal solution (FPIS), and fuzzy negative-ideal solution (FNIS).
The fuzzy decision matrix is normalized using Equation (19), and the result of are shown in Table 10. The weighted normalized fuzzy decision matrix is calculated using Equation (20) and shown in Table 11. The fuzzy positive-ideal solution (FPIS) and fuzzy negative-ideal solution (FNIS) are calculated using Equations (21) and (22), respectively. The results are shown in Table 12.
Table 10.
Normalized fuzzy decision matrix .
Table 11.
Weighted normalized fuzzy decision matrix.
Table 12.
Fuzzy positive-ideal solution (FPIS) and fuzzy negative-ideal solution (FNIS).
- Steps 17.
- Calculate the distance of each information system from FPIS and FNIS.
By applying Equations (23) and (24), the distance of each information system from FPIS, , and the distance of each information system from FNIS, , are calculated, respectively. The results are shown in Table 13 and Table 14.
Table 13.
Distance of each information system from FPIS.
Table 14.
Distance of each information system from FNIS.
- Steps 18.
- Calculate the closeness coefficients and rank the order of information systems.
By applying Equation (25), the closeness coefficient of each information system is calculated. The results are: = 0.2165, = 0.7191, and = 0.6400. Since the is the largest, information system 2 is the most recommended system.
6. Conclusions
This study aims to examine the selection of the most appropriate business process information system to implement in order to be a sustainable firm. A hybrid multi-criteria decision-making (MCDM) approach, that integrates the Decision-Making Trial and Evaluation Laboratory (DEMATEL), Fuzzy Analytic Network Process (FANP), and Fuzzy Technique for Order of Preference by Similarity to Ideal Solution (FTOPSIS), is constructed. Through the use of DEMATEL, the interrelationship among the criteria can be understood. Since the FANP questionnaire is usually very lengthy, the use of the results form DEMATEL can shorten the FANP questionnaire substantially. The FANP analysis can provide the relative importance of the criteria and of the sub-criteria for evaluating the information systems. The ranking of the systems can then be calculated by the FTOPSIS. The FANP is used in the study because the AHP must assume that all the factors are independent and the ANP can consider the feedback and interdependency of the factors in a network. Fuzzy set theory is adopted here because uncertainty and ambiguity is often present in decision-making and in the real business environment.
The results from the case study show that, under the opinions of the experts, costs (C2) is the most important criterion, followed by company reputation (C1) and coordination with other systems (C3). The most important sub-criteria are upgrade costs (SC23), company scale (SC13), data sharing among information system users (SC31), counseling fee (SC22), and implementation costs (SC21), in descending order. Based on the ranking of the systems, the firm can select the most suitable information system to be implemented in the firm.
In this research, the DEMATEL is applied to learn the interrelationship among the criteria only. In the future, the DEMTEL can also be used to study the interrelationship among the sub-criteria. In addition, fuzzy set theory can be integrated with the DEMATEL to consider the fuzziness and ambiguity in the evaluation process. In this paper, the FANP is applied and the crisp sub-criteria weights are obtained. The weights are subsequently used in the FTOPSIS. In the future, fuzzy weights may be used in the FTOPSIS by adopting the methods proposed by Chang [50] and Vinogradova et al. [51]. Some other methodologies, such as quality function deployment (QFD), VlseKriterijumska Optimizacija I Kompromisno Resenje in Serbian (VIKOR) and goal question metric (GQM) approaches can also be considered in constructing a framework for evaluating information systems.
Author Contributions
Conceptualization, A.H.I.L. and H.-Y.K.; Methodology, A.H.I.L. and H.-Y.K.; Software, H.-Y.K. and Y.-C.C.; Validation, A.H.I.L. and Y.-C.C.; Formal Analysis, A.H.I.L.; Investigation, H.-Y.K.; Resources, A.H.I.L. and H.-Y.K.; Data Curation, H.-Y.K. and Y.-C.C.; Writing—Original Draft Preparation, A.H.I.L. and H.-Y.K.; Writing—Review & Editing, A.H.I.L. and H.-Y.K.; Visualization, H.-Y.K. and Y.-C.C.; Supervision, A.H.I.L. and H.-Y.K.; Project Administration, A.H.I.L. and H.-Y.K.; Funding Acquisition, A.H.I.L. and H.-Y.K.
Funding
This work was supported in part by the Ministry of Science and Technology in Taiwan under Grant MOST 107-2410-H-167-005.
Conflicts of Interest
The authors declare no conflict of interest.
References
- Hamidi, H. Selecting enterprise resource planning system using fuzzy analytic hierarchy process method. J. Inf. Syst. Telecommun. 2015, 3, 205–215. [Google Scholar]
- Efe, B. An integrated fuzzy multi criteria group decision making approach for ERP system selection. Appl. Soft Comput. 2016, 38, 106–117. [Google Scholar] [CrossRef]
- Taiwan Semiconductor Manufacturing Company (TSMC). Available online: http://www.tsmc.com/ (accessed on 10 July 2018).
- Gabus, A.; Fontela, E. Perceptions of the World Problematique: Communication Procedure, Communicating with Those Bearing Collective Responsibility (DEMATEL Report No. 1); Battelle Geneva Research Centre: Geneva, Switzerland, 1973. [Google Scholar]
- Liou, J.J.; Tzeng, G.-H.; Chang, H.-C. Airline safety measurement using a hybrid model. J. Air Transp. Manag. 2007, 13, 243–249. [Google Scholar] [CrossRef]
- Jassbi, J.; Mohamadnejad, F.; Nasrollahzadeh, H. A Fuzzy DEMATEL framework for modeling cause and effect relationships of strategy map. Expert Syst. Appl. 2011, 38, 5967–5973. [Google Scholar] [CrossRef]
- Saaty, T.L. Decision Making with Dependence and Feedback: The Analytic Network Process; RWS Publications: Pittsburgh, PA, USA, 1996. [Google Scholar]
- Meade, L.M.; Sarkis, J. Analyzing organizational project alternatives for agile manufacturing processes: An analytical network approach. Int. J. Prod. Res. 1999, 37, 241–261. [Google Scholar] [CrossRef]
- Hwang, C.L.; Yoon, K. Multiple Attribute Decision-Making: Methods and Application; Springer: New York, NY, USA, 1981. [Google Scholar]
- Tsaur, S.-H.; Chang, T.-Y.; Yen, C.-H. The evaluation of airline service quality by fuzzy MCDM. Tour. Manag. 2002, 23, 107–115. [Google Scholar] [CrossRef]
- Chen, C.-T. Extensions of the TOPSIS for group decision-making under fuzzy environment. Fuzzy Sets Syst. 2000, 114, 1–9. [Google Scholar] [CrossRef]
- Jahanshahloo, G.; Lotfi, F.H.; Izadikhah, M. Extension of the TOPSIS method for decision-making problems with fuzzy data. Appl. Math. Comput. 2006, 181, 1544–1551. [Google Scholar] [CrossRef]
- Yang, T.; Hung, C.-C. Multiple-attribute decision making methods for plant layout design problem. Robot. Comput. Manuf. 2007, 23, 126–137. [Google Scholar] [CrossRef]
- Khatir, M.V.; Akbarzadeh, Z. Elucidation of structural relationships of SWOT: A mixed method approach based on FMADM for formulating science and technology strategies. Technol. Soc. 2019, 56, 44–56. [Google Scholar] [CrossRef]
- Nilashi, M.; Samad, S.; Manaf, A.A.; Ahmadi, H.; Rashid, T.A.; Munshi, A.; Almukadi, W.; Ibrahim, O.; Ahmed, O.H. Factors influencing medical tourism adoption in Malaysia: A DEMATEL fuzzy TOPSIS approach. Comput. Ind. Eng. 2019, 137, 106005. [Google Scholar] [CrossRef]
- Büyüközkan, G.; Çifçi, G. A novel hybrid MCDM approach based on fuzzy DEMATEL, fuzzy ANP and fuzzy TOPSIS to evaluate green suppliers. Expert Syst. Appl. 2012, 39, 3000–3011. [Google Scholar] [CrossRef]
- Hsu, C.-C.; Liou, J.J. An outsourcing provider decision model for the airline industry. J. Air Transp. Manag. 2013, 28, 40–46. [Google Scholar] [CrossRef]
- Deng, D.; Wen, S.; Chen, F.-H.; Lin, S.-L. A hybrid multiple criteria decision making model of sustainability performance evaluation for Taiwanese Certified Public Accountant firms. J. Clean. Prod. 2018, 180, 603–616. [Google Scholar] [CrossRef]
- Dinçer, H.; Hošková-Mayerová, Š.; Korsakienė, R.; Yüksel, S. IT2-based multidimensional evaluation approach to the signaling: Investors’ priorities for the emerging industries. Soft Comput. 2019. [Google Scholar] [CrossRef]
- Chen, H.-C.; Yang, C.-H. Applying a multiple criteria decision-making approach to establishing green marketing audit criteria. J. Clean. Prod. 2019, 210, 256–265. [Google Scholar] [CrossRef]
- Umble, E.J.; Haft, R.R.; Umble, M.M. Enterprise resource planning: Implementation procedures and criteria success factors. Eur. J. Oper. Res. 2003, 146, 241–257. [Google Scholar] [CrossRef]
- Al-Mashari, M.; Al-Mudimigh, A.; Zairi, M. Enterprise resource planning: A taxonomy of critical factors. Eur. J. Oper. Res. 2013, 146, 352–364. [Google Scholar] [CrossRef]
- Shen, Y.-C.; Chen, P.-S.; Wang, C.-H. A study of enterprise resource planning (ERP) system performance measurement using the quantitative balanced scorecard approach. Comput. Ind. 2016, 75, 127–139. [Google Scholar] [CrossRef]
- Ayag, Z.; Özdemir, R.G. An intelligent approach to ERP software selection through fuzzy ANP. Int. J. Prod. Res. 2007, 45, 2169–2194. [Google Scholar] [CrossRef]
- El-Mashaleh, M.S.; Hyari, K.H.; Bdour, A.N.; Rababeh, S.M. A multi-attribute decision-making model for construction enterprise resource planning system selection. Int. J. Constr. Educ. Res. 2016, 12, 66–79. [Google Scholar] [CrossRef]
- Shi, J.J.; Halpin, D.W. Enterprise Resource Planning for Construction Business Management. J. Constr. Eng. Manag. 2003, 129, 214–221. [Google Scholar] [CrossRef]
- Wei, C.-C.; Chien, C.-F.; Wang, M.-J.J. An AHP-based approach to ERP system selection. Int. J. Prod. Econ. 2005, 96, 47–62. [Google Scholar] [CrossRef]
- Chung, B.Y.; Skibniewski, M.J.; Lucas, H.C.; Kwak, Y.H. Analyzing Enterprise Resource Planning System Implementation Success Factors in the Engineering–Construction Industry. J. Comput. Civ. Eng. 2008, 22, 373–382. [Google Scholar] [CrossRef]
- Shukla, S.; Mishra, P.; Jain, R.; Yadav, H. An integrated decision making approach for ERP system selection using SWARA and PROMETHEE method. Int. J. Intell. Enterp. 2016, 3, 120–147. [Google Scholar] [CrossRef]
- Niu, B.; Chen, K.; Huang, H.; Li, Y. System Selection and Performance Evaluation for Manufacturing Company’s ERP Adoption. Int. J. Comput. Commun. Control 2017, 12, 347–364. [Google Scholar] [CrossRef]
- Hicks, D.A.; Stecke, K.E. The ERP maze: Enterprise resource planning and other production and inventory control software. IIE Solut. 1995, 27, 12–16. [Google Scholar]
- Liao, X.; Li, Y.; Lu, B. A model for selecting an ERP system based on linguistic information processing. Inf. Syst. 2007, 32, 1005–1017. [Google Scholar] [CrossRef]
- Huang, W.; Wang, S.; Kao, D. Fuzzy sets approach to ERP adoption. In Proceedings of the International Conference of Pacific Rim Management, Seattle, WA, USA, 31 July–2 August 2003; pp. 138–143. [Google Scholar]
- Cebeci, U. Fuzzy AHP-based decision support system for selecting ERP systems in textile industry by using balanced scorecard. Expert Syst. Appl. 2009, 36, 8900–8909. [Google Scholar] [CrossRef]
- Kahraman, C.; Beskese, A.; Kaya, I. Selection among ERP outsourcing alternatives using a fuzzy multi-criteria decision making methodology. Int. J. Prod. Res. 2010, 48, 547–566. [Google Scholar] [CrossRef]
- Tasnawijitwong, S.; Samanchuen, T. Open source ERP selection for small and medium enterprises by using analytic hierarchy process. In Proceedings of the 2018 5th International Conference on Business and Industrial Research (ICBIR), Bangkok, Thailand, 17–18 May 2018; pp. 382–386. [Google Scholar]
- Kilic, H.S.; Zaim, S.; Delen, D. Selecting “The Best” ERP system for SMEs using a combination of ANP and PROMETHEE methods. Expert Syst. Appl. 2015, 42, 2343–2352. [Google Scholar] [CrossRef]
- Chang, B.; Kuo, C.; Wu, C.-H.; Tzeng, G.-H. Using Fuzzy Analytic Network Process to assess the risks in enterprise resource planning system implementation. Appl. Soft Comput. 2015, 28, 196–207. [Google Scholar] [CrossRef]
- Si, S.-L.; You, X.-Y.; Liu, H.-C.; Zhang, P. DEMATEL Technique: A Systematic Review of the State-of-the-Art Literature on Methodologies and Applications. Math. Probl. Eng. 2018, 2018, 3696457. [Google Scholar] [CrossRef]
- Hou, Q.; Xie, L. Research on Supplier Evaluation in a Green Supply Chain. Discret. Dyn. Nat. Soc. 2019, 2019, 1–14. [Google Scholar] [CrossRef]
- Lee, A.H.I.; Chen, S.-C.; Kang, H.-Y. A decision-making framework for evaluating enterprise resource planning systems in a high-tech industry. Qual. Technol. Quant. Manag. 2019. [Google Scholar] [CrossRef]
- Lee, A.H.I.; Kang, H.-Y.; Lin, C.Y.; Chen, J.S. A novel fuzzy quality function deployment framework. Qual. Technol. Quant. Manag. 2017, 14, 44–73. [Google Scholar] [CrossRef]
- Kang, H.-Y.; Lee, A.H.I.; Yang, C.Y. A fuzzy ANP model for supplier selection as applied to IC packaging. J. Intell. Manuf. 2012, 23, 1477–1488. [Google Scholar] [CrossRef]
- Lee, A.H.I.; Kang, H.-Y.; Liou, Y.-J. A hybrid multiple-criteria decision-making approach for photovoltaic solar plant location selection. Sustainability 2017, 9, 184. [Google Scholar] [CrossRef]
- Tan, Z.; Tan, Q.; Ju, L.; Yang, S.; Cheng, H.; Ma, J. Trend Analysis and Comprehensive Evaluation of Green Production Principal Component of Thermal Power Unit Based on ANP-MEEM Model. Discret. Dyn. Nat. Soc. 2019, 2019, 4049151. [Google Scholar] [CrossRef]
- Yager, R.R. A procedure for ordering fuzzy subsets of the unit interval. Inf. Sci. 1981, 24, 143–161. [Google Scholar] [CrossRef]
- Saaty, T.L. The Analytic Hierarchy Process; McGraw-Hill: New York, NY, USA, 1980. [Google Scholar]
- Wang, C.-N.; Yang, C.-Y.; Cheng, H.-C. Fuzzy Multi-Criteria Decision-Making Model for Supplier Evaluation and Selection in a Wind Power Plant Project. Mathematics 2019, 7, 417. [Google Scholar] [CrossRef]
- Kang, H.-Y. A multi-criteria decision-making approach for capacity allocation problem in semiconductor fabrication. Int. J. Prod. Res. 2011, 49, 5893–5916. [Google Scholar] [CrossRef]
- Chang, Y. Applications of the extent analysis method on fuzzy AHP. Eur. J. Oper. Res. 1996, 95, 649–655. [Google Scholar] [CrossRef]
- Vinogradova, I.; Podvezko, V.; Zavadskas, E.K. The recalculation of the weights of criteria in MCDM methods using the Bayes approach. Symmetry 2018, 10, 205. [Google Scholar] [CrossRef]

© 2019 by the authors. Licensee MDPI, Basel, Switzerland. This article is an open access article distributed under the terms and conditions of the Creative Commons Attribution (CC BY) license (http://creativecommons.org/licenses/by/4.0/).