1. Introduction
Along with the strong development of science and technology and the trend of globalization, supply chain and logistics activities from production to consumption have played an increasingly important role in capacity competition of industries in general and plastics industry in particular. With a production growth rate of 16–18% per year, second only to telecommunications and textile industry, the plastic industry is considered a dynamic industry in Vietnam’s economy [
1]. Selection of suppliers, which is the first step in the product implementation process, starting from the purchase of raw materials to the end of product delivery, is considered to be a deciding factor for companies looking forward to success in today’s competitive conditions [
2]. The process of supplier selection can be considered as the multi criteria decision-making (MCDM) to find an optimal solution for supplier selection [
3].
The problem of decision-making becomes more complicated when there are many groups of people and experts involved in the decision-making process. In order to select suppliers with objectivity, avoiding subjective factors such as human factors, documents, relationships, etc., that is vague and incomplete in making decisions is crucial [
4]. Moreover, most previous studies have assumed that each criterion cluster in the method they use has equal weight to solve the problem with a weighted hyper matrix [
5,
6]. Therefore, previous studies have not exploited the advantages and disadvantages of the models or methods they have applied. With the development of the current information system, selection and evaluation have become important to achieve effective decision-making through optimal options [
7].
According to the Vietnam Plastics Association (VPA), each year, Vietnam’s plastic industry needs about 5 million tons of plastic materials and hundreds of additives, while domestic production can only supply about 900,000 tons of raw materials/year. According to the data from the General Department of Customs, Vietnam must import 4.54 million tons of plastic materials worth nearly $6.3 billion, up 15.7% over the same period.
The reliance on imported plastic materials not only causes businesses to stagnate capital because of stockpiling raw materials, but also has potential risks on exchange rates and world oil prices. Every time the VND/USD exchange rate increases, input costs of plastic businesses will increase accordingly.
The primary goal of this research is to propose a multi criteria decision-making model (MCDM) for raw material supplier selection in plastic industry and also provide a useful guideline for supplier selection in other industry.
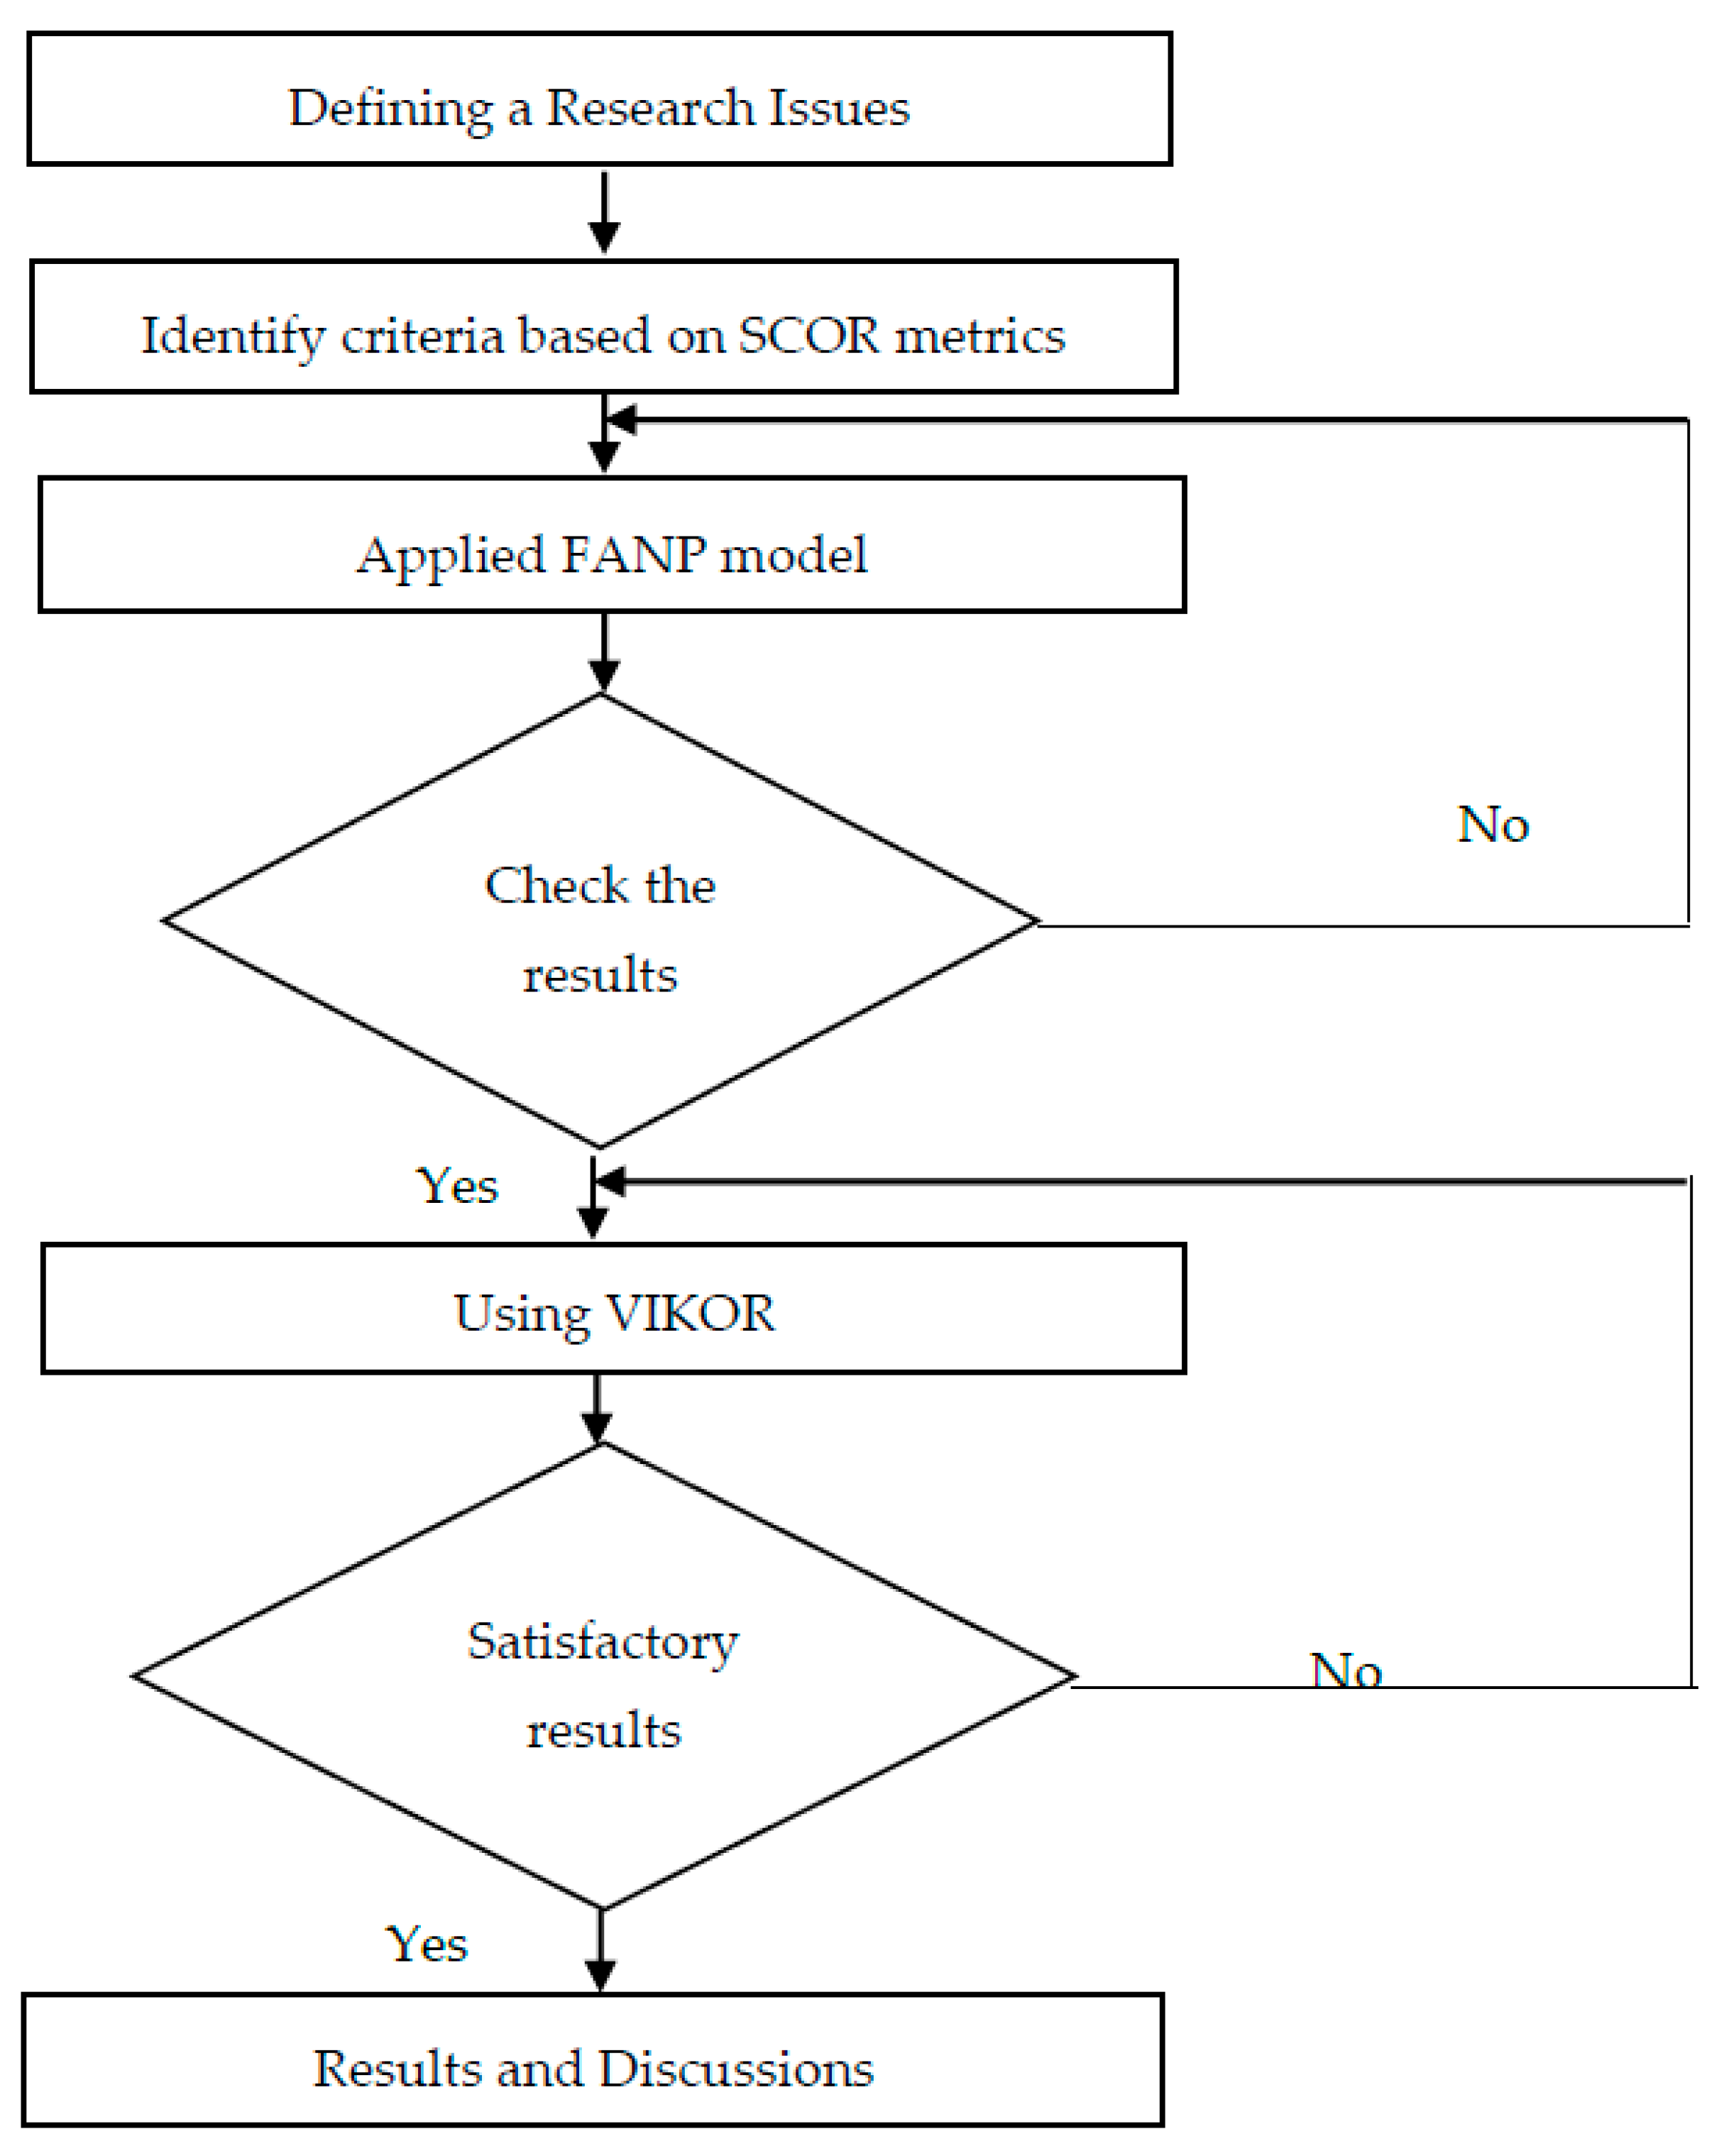
In this study, the proposed model provides a new approach for decision-makers in evaluating and selecting suppliers, which is formulated based on the supply chain operation reference (SCOR) model, fuzzy analytic network process (FANP), and VIseKriterijumska Optimizacija I Kompromisno Resenje (VIKOR).
This paper provides research background, motivation, goals to implement, a review of relevant published scientific articles, including proposed models of VIKOR, FANP, SCOR Metrics. In order to verify the research model, the content of case study presents the evaluation criteria, the application of SCOR Metric, FANP method, and VIKOR method, in model building and data processing. Discussion and results are presented in the end of this article.
2. Literature Review
Along with the performance attributes, the main criteria and the sub-criteria selected for the evaluation and supplier selection in this study are presented in
Table 1.
Supply chain operation reference was proposed in 1996 [
8,
9] by Theodore Pittiglio, Robert Rabin, Robert Todd, and Michael McGrath [
10]. Specifically, the SCOR model describes business activities related to meeting customer needs, including planning, sourcing, execution, delivery, and return. The use of models includes analyzing the current state of company processes and goals, quantifying performance, and comparing company performance with benchmarking data. SCOR is developed from a set of best practices data and information that companies can use in building and evaluating their supply chain performance [
8,
9]. This model allows companies to conduct comprehensive analysis based on practically all aspects of their supply chain by providing a complete set of process, performance, and real-life metrics best practices in the industry [
10]. The performance attributes of SCOR data are shown below [
11]. The SCOR’s process includes: definition of process components, input-output, process performance data, selected best supplier [
8,
12,
13,
14,
15]. SCOR uses historical supply chain data to see how it works and develops, which defines the five general performance attributes and three measurement levels that analysts offer [
13,
15].
The propositional logical reasoning, so-called primitive or basic logic with two values, true or false [1,0], did not solve all the problems of complex problems that arise in practice [
21]. In decisive situations with lots of choices with multiple criteria set out, such as supplier selection with a range of supplier lists and multiple factors to evaluate with small selection criteria subject to subjective factors by decision-makers [
21,
22].
Since the fuzzy theory was published, it has been developed and applied widely in all technical specialties. From 1980 onward fuzzy theory marked a new turning point, when applied by many researchers in data analysis and decision-making support in Europe [
4,
22]. In the mid-1980s, industrial engineering applied fuzzy theory to almost all fields related to industrial engineering such as fuzzy prediction, fuzzy decision-making, linear planning, fuzzy inventory management, fuzzy quality control, fuzzy data modulation, fuzzy engineering economics, fuzzy specialist systems, fuzzy learning factors [
21,
23]. Fuzzy theory is also applied by researchers in location planning. Evans et al. in 1987 introduced a layout plan based on fuzzy theory to solve the problem of position design of each item [
24]. Inputs for site design including distance and importance levels are modeled by linguistic variables [
24].
B. Song et al. (1996) applied fuzzy theory to the model of parameters and damage caused by earthquakes. Damage characteristics of buildings with different distances from epicenter were considered based on data obtained from nine earthquakes in China [
25]. J. Yang et al. in 2003 applied fuzzy theory to calculate the optimal operation of the excavator in order to accurately estimate the construction time [
26].
When considering
X in a set of
x elements, fuzzy sets are the sets represented by the member function
expressing the ability for
x to belong to the set
M. The values represent the membership level of an element
x in the range [0,1] [
4,
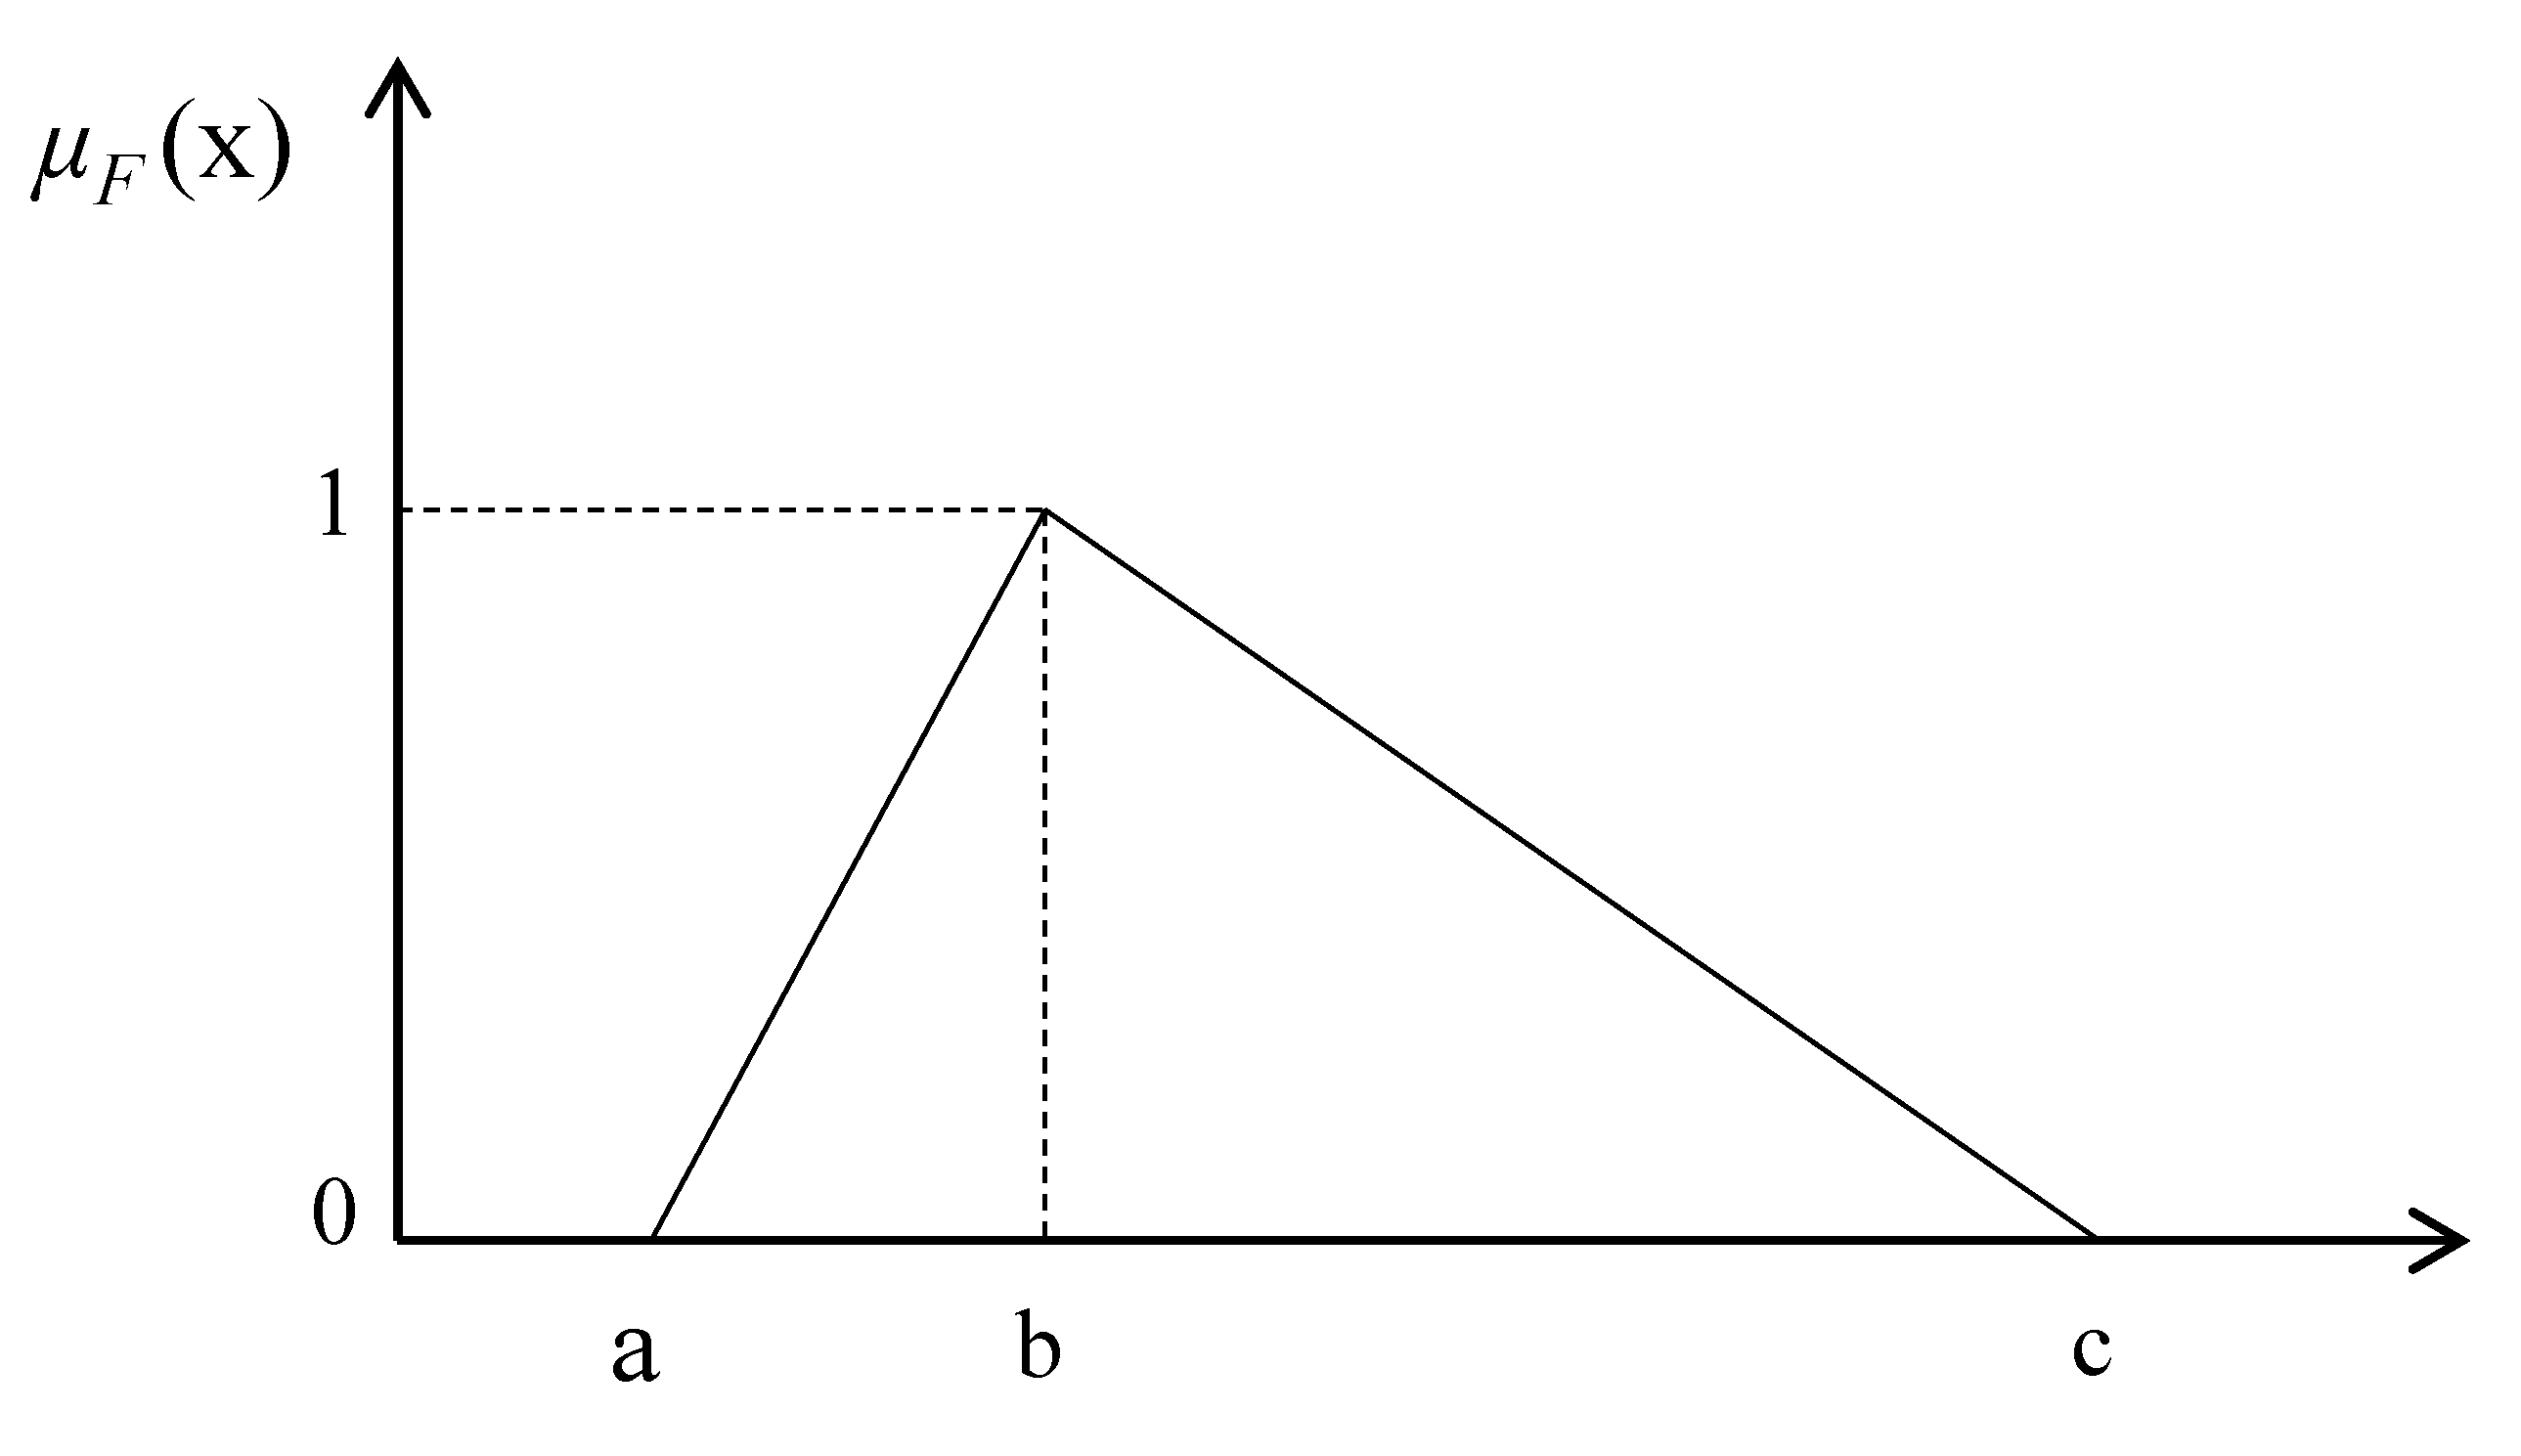
23]. The fuzzy number concept was proposed by Lotfi Zadeh to describe an amount whose value cannot be accurately measured [
4,
21,
24]. There are many types of fuzzy numbers like triangular fuzzy numbers, trapezoidal fuzzy numbers, L-R fuzzy numbers, Gaussian fuzzy numbers, and exponential fuzzy numbers, but triangular fuzzy number (TFN) is most commonly used [
21,
22,
23].
Analytic network process (ANP) was proposed by Saaty in 1996 [
27]. ANP is an improved version of the analytic hierarchy process (AHP). ANP helps to conduct analysis and evaluation of network effects or in other words, interconnection between criteria and criteria clusters [
27]. ANP overcomes the disadvantages when considering hierarchical relationship [
27,
28], namely, one-way rectification of the factors and not taking into account the relationships among the factors such as the AHP predecessor method [
28]. ANP has been applied in many specific fields, making it easier to solve decision-making problems by building relationships between different goals, criteria, options and establishing a comparison matrix of criteria for an optimal option [
28,
29]. However, there are still many shortcomings that ANP method has not solved, such as problems with uncertainty when performing matrix comparison matrix [
27,
29]. Dividing the decision problem into subproblems, the pairs of comparisons increase the number creating disadvantages in the evaluation process [
15]. The traditional ANP method is incomplete because it has not yet shown data clearly to produce accurate results [
27,
29,
30]. One way to overcome the shortcomings in ANP method is to integrate fuzzy set model into network analysis to support multi-criteria decisions in uncertain environments [
27,
28,
30].
VIseKriterijumska Optimizacija I Kompromisno Resenje (VIKOR) [
31] is a method of multi-criteria decision-making (MCDM) or a method of analyzing multi-criteria decisions. It was originally developed by Serafim Opricovic to address decisive issues with conflicting criteria, and it is impossible to resolve the assumption that compromise is acceptable for conflict resolution, the decision-maker wants the solution is closest to the ideal and the solution is evaluated according to the ideal so that all criteria are set [
32]. VIKOR ranks the alternatives and identifies the solution named as the closest compromise to the ideal. The VIKOR method provides a complete view of the suitability of any option and helps to bring subjective elements out of the equation [
7,
31,
32,
33]. VIKOR method has many variants such as: VIKOR multi-criteria compromise method, VIKOR comparative analysis method, fuzzy VIKOR method, theoretical value of regret based on VIKOR method, method VIKOR about [
33,
34].
In the VIKOR method, the ranking of alternatives performance relative to a set of criteria is quantified as a fairly clear value [
35,
36,
37,
38]. But in many cases, clear data is not enough to model real-world situations. In addition, in the event of conflicting situations or criteria, decision-makers must also consider inaccurate or ambiguous data [
35,
36,
37,
38]. To address the data inaccuracies or ambiguities, a combination of VIKOR with decision support methods are used in research papers [
35].
In an effort to continually refine production, companies are constantly looking for high-performance suppliers to keep their production constantly running. [
28] The selection of high-performance suppliers is difficult to evaluate [
13,
34,
36]. The assessment and selection of suppliers is a matter of multi-criteria decision-making (MCDM), in which decision-makers face both qualitative and quantitative factors [
13,
39]. The most prominent is the research, reviewing the multi-criteria decision-making approach to assessing and selecting green suppliers by Sarkis et al. [
40]. This shows that the problem of supplier selection becomes important and affects mathematicians through research and practical applications.
However, in the decision-making process, there are sometimes subjective factors, depending on decisions made by experts or management [
3,
6]. Mandatory selection and evaluation requires strong access and analysis with the best decision-support tools, capable of solving many criteria [
34]. In 1980, L. Pun and his colleagues conducted a survey to support computer systems in the field of high-tech manufacturing. The authors set out criteria for decentralization in buying and choosing houses [
41]. In the following years, the selection and evaluation of suppliers was of interest and development by many researchers; in particular, Weber and his colleagues gave a comprehensive view of the criteria of the researchers and participants purchase by making the level of decision-based importance to assess and select suppliers [
42].
Both FAHP and FANP methods are not just a simple mathematical method, the two above mathematical models are applied to analyze, evaluate, and select locations, suppliers, etc., provided based on FANP model of Ahmad Dargi et al. [
43]. The study of B. Edebilli and Turan Erman Erkan is based on FAHP methodology in ranking suppliers [
44]. However, FANP method still has many shortcomings [
28]. To increase decision accuracy researchers have combined FANP with other mathematical methods to make the decision-making process clear [
28,
45].
To evaluate suppliers such as using the VIKOR method to evaluate, rank, and select the optimal supplier [
45,
46] based on the satisfaction factor between supply and demand is essential to maximize the index when listing to choose [
46]. However, the VIKOR method also has its limitations, when expressing data is not clear in some real-life situations, resulting in low accuracy [
6]. Krzysztof PiaseckiE and Ewa Roszkowska applied ordered fuzzy numbers in ranking linguistically evaluated negotiation offers. The main purpose of this paper is to investigate the application potential of ordered fuzzy numbers (OFN) to support evaluation of negotiation offers. The simple additive weighting (SAW) and the technique for order of preference by similarity to ideal solution (TOPSIS) methods are extended to the case when linguistic evaluations are represented by OFN [
47]. Typically, the research combines FANP and VIKOR in the selection of sustainable transformation technology in the field of agriculture [
48]. In addition, the study combines an ANP model with VIKOR [
49,
50,
51] in the application of the selection of sustainable suppliers in the field of importation by M.Abdel-Baset and his colleagues [
49].
However, to assess objectively in the selection of suppliers, in addition to selection and evaluation based on supplier’s characteristics, it is also based on the supplier’s performance factor [
40]. To avoid the lack of evaluation, Francisco Rodrigues Lima-Junior and Luiz Cesar Ribeiro Carpinett combined SCOR and TOPSIS [
7,
13], in which SCOR provides a standard performance table and TOPSIS ranks and evaluates the supplier list [
13,
40]. In addition, the SCOR supply chain reference model is also applied in many supply chain-related fields, typically the selection of suppliers in the oil and gas sector based on a combination of three models, SCOR, AHP, TOPSIS [
27,
30,
40].
5. Conclusions
The cost of raw materials accounts for about 70–80% of the product cost, which makes it difficult for domestic businesses to compete with other similar export countries. Selection of plastics raw material suppliers, which is the first step in the product implementation process, starting from the purchase of raw materials to the end of product delivery, is considered to be a deciding factor for companies looking forward to success in today’s competitive conditions. The process of plastic raw material supplier selection can be considered as multicriteria decision-making (MCDM) to find an optimal solution for supplier selection.
Many studies have applied the MCDM approach to various fields of science and engineering and their number has been increasing over the past years. One of the fields that the fuzzy MCDM model save been applied to is supplier selection problem. Although some studies have considered a review of applications of MCDM approaches in this field, very few work has focused on this problem in a fuzzy environment. This is the reason why hybrid ANP with fuzzy logic and VIKOR is proposed in this study.
In this study, the proposed model provides a new approach for decision-makers in evaluating and selecting suppliers, which is formulated based on the supply chain operation reference (SCOR) model, fuzzy analytic network process (FANP), and VIseKriterijumska Optimizacija I Kompromisno Resenje (VIKOR).
The contribution of this research is to propose a multicriteria decision-making model (MCDM) for supplier selection in plastic industry. This research also provided a useful guideline for supplier selection in other industry.
For improving these MCDM model, outlier detection and the curse of dimensionality of DEA model will be considered in future research. Moreover, different methodologies, such like fuzzy data envelopment analysis (FDEA), FAHP…, can also been combined for different scenarios.


