1. Introduction
With the emerged competition in electric power systems due to the privatization and emphasis on economic planning and operation of the grid, allocation of system losses to its participants and loss contributors has yet remained a challenging concern. Studies on the US electricity markets in 2013 show that almost 6% of the total generated energy is lost in transmission and distribution networks—2% in transmission and 4% in distribution systems—equivalent to 69 trillion Btus [
1]. In India, for example, the overall power loss has been attributed as 32–46% in transmission, 15–18% in distribution, and 10–15% to electricity thieves [
2]. In particular, distribution systems account for a large percentage of overall system losses and, thus, loss allocation problem becomes a more critical challenge in recent years. The existing and ever-increasing trend in wide deployment of renewables and sheer number of distributed generations (DGs) in distribution systems, if efficiently planned and wisely operated, can play an important role in system loss reduction [
3,
4]. Hence, providing an appropriate and fair incentive to system participants and for the main sake of fair loss allocation is a valid, yet not efficiently solved, challenge to cope with.
The loss allocation problems in power distribution systems can be categorized into two main focus groups. (i) The first one addresses the loss allocation problem in distribution systems with radial structures [
5,
6,
7,
8,
9,
10,
11,
12]. Carpaneto et al. proposed a circuit-based loss allocation technique based on the branch currents decomposition (BCD), in which the loss allocated to each node is assessed based on the current flowing in its upward branches [
5]. The power summation algorithm proposed in [
6,
7] suggests a direct relationship between branch losses and the nodes’ injected power. In [
8], statistical representation of daily load and generation curves is utilized in a branch-oriented method to allocate the network losses. A three-step loss allocation approach applicable to radial distribution systems is proposed in [
9] which considers both active and reactive power flows and evaluates the loss allocated to each node based on that allocated to its adjacent nodes. Costa and Matos presented a tracing approach based on quadratic loss allocation [
10]. Savier and Das presented an exact method for real power loss allocation in radial distribution systems [
11]. A quadratic approach is applied in [
12] to allocate the network losses to the consumers in a radial distribution system based on both real and imaginary parts of the current flowing in each branch. (ii) In the second category, distribution systems with meshed structure and high deployment of DG are discussed. Such operating conditions result in a bidirectional flow of power, where the distribution system operation becomes more similar to the transmission section. Therefore, some of the loss allocation methods in transmission systems can be applied to such distribution systems.
Pro rata [
13] is a method which allocates the network losses based on the active power level of DGs and the loads. The method does not provide a fair solution, as it neglects the changing system topology over time. Z-bus method [
14] and a similar one in [
15] suggested based on a modified bus admittance matrix are two circuit-based techniques proposed for distribution network loss allocation. Z-bus method, however, cannot be applied to distribution systems for which the Y-bus matrix is singular. A succinct method proposed in [
16] considers the influence of both active and reactive power injected into the networks. Carpaneto et al. proved that this method is not generic to all conditions and fails under particular circumstances [
4]. In marginal loss allocation methods, marginal loss coefficients are employed to assess the share and contribution of each DG and load in the total network losses [
17,
18,
19]. The marginal loss coefficients are the changes in the total loss due to a change in active/reactive node injection.
Although numerous distribution loss allocation techniques have been proposed and are available in the literature, there are still several challenges to be responded and aspects that remain unaddressed.
The proposed methods in [
5,
6,
7,
8,
9,
10,
11,
12] have well addressed the allocation problem in radial distribution systems. The applicability of these methods, however, is questionable in non-radial and meshed distribution systems.
Unbalanced loads in distribution systems have not been considered in the previous loss allocation studies.
There is a lack of benchmark to come up with the fairest and fairest solution for loss allocation problem. Among various solutions, none has been proven to excel compared to other methods.
In response to the aforementioned challenges, this paper proposes a method which is applicable to both radial and meshed distribution systems, as well as balanced and unbalanced networks. The suggested approach offers a criterion to which the result of different loss allocation techniques can be compared. In the concept of resources allocation, various frameworks are proposed to find an optimal allocation among agents [
20,
21]. Embedded cost allocation in cooperative games based on Shapley Value method provides stable decisions [
22], where the resultant allocations are deemed to be the most equitable solution possible [
23]. Therefore, the proposed approach applies Shapley Value method to find the solutions to loss allocation problem. The method has already been applied to solve a number of cost allocation problems in power systems [
24,
25,
26,
27,
28,
29,
30,
31]. However, due to the computational challenges associated with the Shapley Value method, it cannot be practically applied to real-world real-sized power systems. Compared to the above advancements, the main contributions of this paper can be listed as follows:
Compared to [
5,
6,
7,
8,
9,
10,
11,
12], and in line with [
13,
14,
15,
16], this paper addresses both radial and meshed distribution systems with high penetration of DGs. Compared to [
13], and in line with [
14,
15,
16], a method is proposed that is adaptive to the changing topology and operating conditions in distribution systems, specifically tailored to the loss allocation problem.
Compared to [
13,
14,
15,
16], this paper considers both the balanced and unbalanced loads in distribution systems.
Compared to [
5,
6,
7,
8,
9,
10,
11,
12,
13,
14,
15,
16], this paper attempts to introduce a benchmark model which can be used to judge and compare the solutions by different conventional loss allocation methods, aiding a more cost-effective decision in practice.
The reminder of the paper is organized as follows.
Section 2 presents the fundamental concept of game theory and Shapley Value for allocation problems. Application of this method in loss allocation problem is presented in
Section 3.
Section 4 applies the suggested model as well as several other methods to two different distribution systems to compare the solutions.
Section 5 contains the concluding remarks.
2. Materials and Methods Allocation Issue in Game Theory
The electricity markets can be represented as a game with loads and generators as the players. This, in turn, induces the application of cooperative game theory for network loss allocation. In this section, the general concept of cooperative games is presented first, followed by an explanation on the well-known Shapley Value method and its characteristics.
2.1. Concepts of Cooperative Game Theory
A cooperative game is defined as a competition between coalitions of players, rather than between individual players, in which the decision makers make a coalition with the purpose of maximizing their profit. In game theory, the term “cooperation” is used to indicate that each participant tries to maximize its own interests [
32]. In some cases, the production cost is defined over a single product that is used by multiple users. The cost in such cases is called the “common cost” and cooperative game theory can be applied for common cost allocation. An example of such cases is the electricity markets as the participants share the distribution system resources and cooperate to obtain the best possible benefits. Therefore, distribution network losses can be defined as the common cost in a cooperative game. Cost allocation cooperative game is briefly described here.
Let a game consist of a finite set of players
N = {1,2, …,n}. A coalition
of players is defined as a subset of
, whose participants coordinate together. Null set is equivalent to an empty coalition; however, set
denotes the grand coalition. The number of possible coalitions on
is equal to
. The set of coalitions is mutually exclusive which makes each coalition independent. The value of game on
is a real function
that assigns a worth to each coalition and satisfies
. Characteristic value
gives the maximum cost incurred by cooperation between the members of coalition
, irrespective of what other players and coalitions do [
32].
A vital issue in cooperative games is to suggest an optimal and a fair allocation of cost among its players. Cost allocation can be represented in terms of a vector
C = {
c1,c2,…,
cn}
. The cost allocation of the grand coalition is
. For allocation to be optimal and fair to all the players, the following conditions namely, individual, group, and global rationalities, as well as fairness property for symmetric players, need to be satisfied [
22]:
Any cost allocation vector satisfying the individual and global rationality conditions is called an imputation. Any imputation that satisfies the global and group rationality also lies in the core of the game. Individual rationality (Equation (1)) necessitates that no player would pay more than the cost it had to pay if acting alone. Group rationality (Equation (2)) enforces that the cost paid by any group should be less than or equal to the cost for the group acting alone. Global rationality (Equation (3)) assumes that the sum of cost to all the
players will be equal to that for the grand coalition. This property also ensures efficiency. The last property (Equation (4)) states that if players
and
are added to a coalition
separately and change the value of game equally, then the pay-offs of players
and
will be the same. Any pay-off vector satisfying this property is considered fair [
33].
If the cost allocated to each coalition is less than the summation of the costs allocated to the players of that coalition, none of the players will be interested in leaving the coalition. Such a coalition is stable and the cost allocation is efficient. If these rationalities are satisfied, then the cost allocation to a player is proportional to its marginal cost; otherwise, it may create tendencies to secede the existing coalitions.
Utility is transferable if one player can transfer part of its utility to another one. Transferable utility is assumed in many cooperative games, where the costs are given for coalitions, not for individual players. There are numerous approaches for cost allocation among the players in transferable utility cooperative games, for which side payments is acceptable. The game-theoretic Shapley Value is known as a promising solution to common cost allocation problems [
33,
34].
2.2. Shapley Value
Let consider is a function which assigns the real vector φ(w) = (φ1(w), φ1(w), …, φn(w)) to each characteristic function of an n-player game. φi(w) depicts the value of player in a game with the characteristic function . The share of player in coalition is the value that player has added to the cost, by joining the coalition. For each coalition S which does not contain player (), is the probability of joining the player to coalition , and is the probability of making coalition . and can be considered as the marginal contribution of player in coalition .
To characterize the Shapley Value function, the value of characteristic function for all possible coalitions of 1, 2, …,
n players is calculated. Consequently, based on the formed characteristic function, the added value of player
is obtained and the cost allocated to each player is calculated using Equation (5):
Considering the probability of making all coalitions the same and equal to 1, then
, the probability of having coalition
at the time player
joins the coalition, is:
As a result, the share of each player in a non-probabilistic Shapley Value could be obtained as:
where
is the Coalition excluding player
;
is the Coalition obtained by including player
;
is the Number of entities in the coalition
;
is the Total number of players in the game; and
is the Characteristic function associated with coalition
.
It is known that the Shapley Value is characterized by several important properties of stability, efficiency, symmetry and additivity [
34,
35]. Symmetry means if
i, j are symmetric players in
, their assigned values must be the same, i.e.,
φi(w)=
φj(w). Additivity represents that for any pair of games
v and
w, where (
v + w) is defined by (
v + w)(
S) =
v(
S) +
w(
S) all
, then
φ(
v + w) =
φ(
v) +
φ(
w). It has been verified in [
33] that every cost allocation approach that satisfies the symmetry and additivity properties, also satisfies the fairness property. Thus, cost allocation using the Shapley Value meets the rational conditions and fairness property as well.
Shapley Value assigns an n-vector allocation for every n-player game. This value provides a suitable cost allocation wherein the property of an allocation is its stability, efficiency, and fairness.
3. The Proposed Game Theory-Based Loss Allocation
System cost allocation to the players in a fair manner is substantially important particularly due to privatization and competition among market participants. As the costs associated with network losses contributes to the system total cost, fair and effective loss allocation plays a major role in distribution systems. If considering the network loss cost as the common cost and the DG and loads as the players, cooperative game theory can be applied for network embedded loss allocation. The basic principle for the proposed loss allocation approach is that each load or DG is treated as a decision-maker, or so-called player which would act alone or in cooperation with other players for the purpose of maximizing their own profits. Furthermore, the entire distribution network is assumed to operate under a condition in which the loss cost would be recovered by a player or a coalition of players that are using the network facilities and infrastructure. In general, loss allocation in a distribution system can be modeled as follows:
Cooperative game: Power transfer in distribution system;
Players: Loads and DGs;
Characteristic function: Loss in distribution system; and
Value function: Loss allocation.
According to the number of participating loads and DGs, the Distribution System Operator (DSO) carries out an optimal power flow calculation to determine the distribution of power flow across the network for each coalition. It is further assumed that the network is used just for one coalition at a time. That is to say, when coalition
is analysed, all other coalitions are out of the system. From this analysis, the power flow distribution for each coalition is found and then used to evaluate the characteristic function of the given coalition. Characteristic function
of the proposed cooperative game is the network losses which are assessed from the power flow calculations. With the calculated losses for all possible coalitions
S, the distribution system operator (DSO) can accurately allocate the network losses to each load or DG unit in the distribution network using the Shapely Value and finally determine the loss allocation vector. For instance, in a distribution system where the total number of producers and consumers (members) is equal to
N, and in order to calculate the associated loss for each subset of
N (2
N), it is assumed that the distribution system only includes the members of the corresponding subset. The loss calculations will be done for all subsets, and the loss allocated to loads and DG units can be assessed based on the cooperative concept of game theory in Equation (9). Since the probability of each coalition is the same, we take it as 1 and non-probable Shapley Value can be applied.
where
L stands for the allocated loss and
i represents the DG or load players.
S is the set of different combinations of loads and DGs and
Loss(
s) refers to the amount of losses related to coalition
S when player
i is not participating.
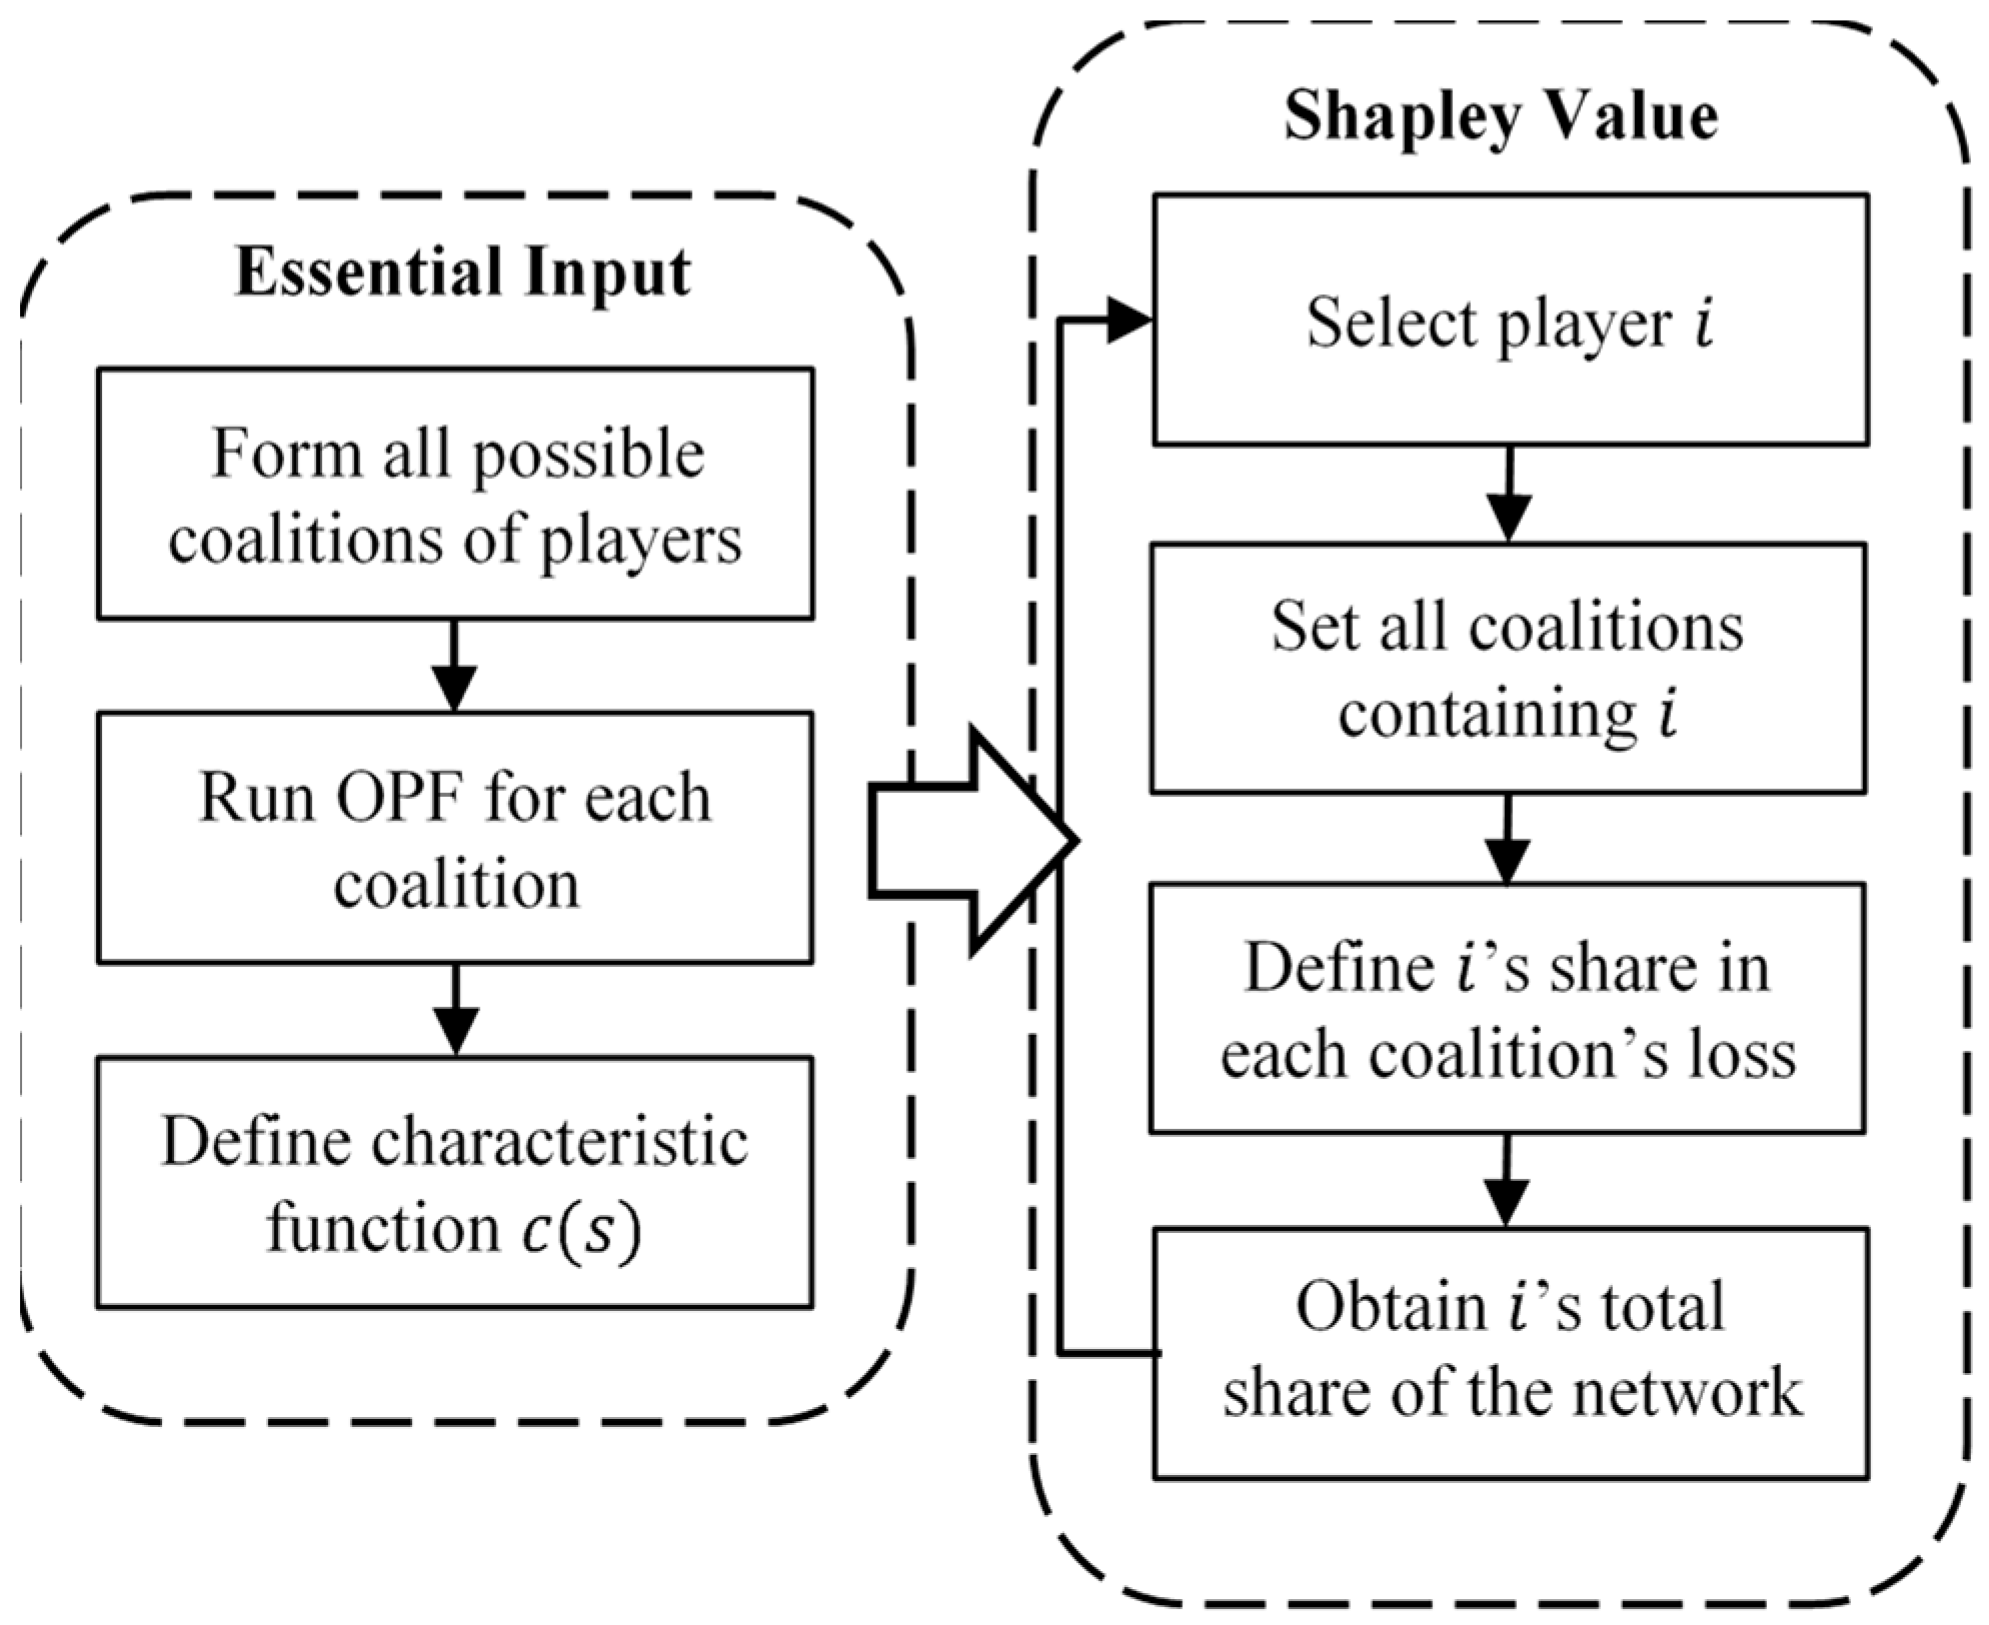
The algorithm for the proposed loss allocation approach is presented in
Figure 1. The proposed model can be employed in any type of distribution networks, unbalanced or meshed, since it just utilizes the power flow results. The computational burden of the Shapley loss allocation is not moderate enough to be applied to distribution systems as a routine loss allocation approach. Instead, the method can be considered as the comparison criterion for judging the accuracy and fairness of different loss allocation methods. In other words, the proposed model in this paper can be employed as a benchmark in rating other loss allocation methods.
4. Case Studies and Numerical Results
In this section, the characteristics of the proposed model are studied. The suggested technique is applied to two distinctive systems: (i) a radial and balanced distribution system; and (ii) a meshed and unbalanced distribution system.
4.1. Radial and Balanced Distribution Systems
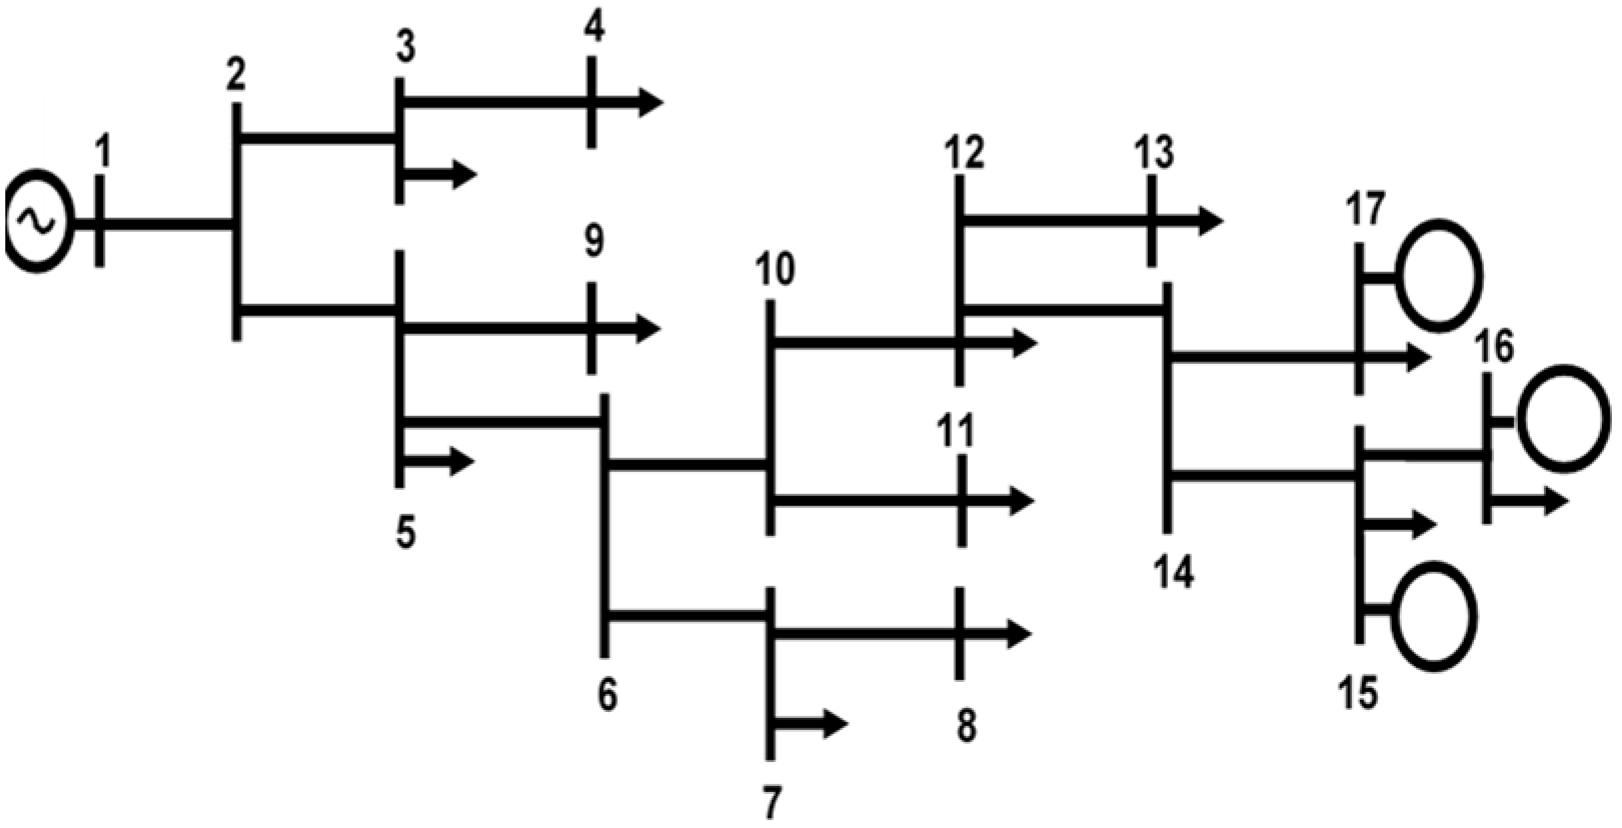
Initially, the proposed model is applied to a distribution system which is radial and the parallel admittance of its lines is non-zero. This system is selected as it is able to adopt a range of different loss allocation methods. Single-line diagram of this system is illustrated in
Figure 2.
The test system contains 17 nodes, 12 load pints, 16 distribution lines and 3 DG units. The DGs are modeled as negative loads for loss calculations. The line data including the line resistance, reactance and capacitance, taking 1 MVA and 20 kV as the base values, are tabulated in
Table 1. Node 1 is supplied by a 63/20 kV transformer which is the connection point between transmission and distribution systems. AC power flow is utilized to calculate the loss allocation. This is important in distribution networks where DC power flow models may not be adequate, mainly due to the reactive power flow and the influence on the network voltage profiles. In this paper, the Matpower operating toolset particularly the primal-dual interior point solver called MIPS is utilized for AC power flow calculations in the symmetrical and radial test system [
36]. All computations were performed on a 2.67 GHz Windows 10 server with 4 GB of RAM.
To demonstrate the efficiency of the proposed model particularly from the economic point of view, the system loss is distributed among loads and DG units using the proposed method and five other loss allocation techniques. The loss allocation results corresponding to the pro rata [
13], marginal [
19], Z-bus [
14], BCD [
5] and succinct [
16] methods, as well as that for the proposed Shapley Value approach are represented in
Table 2. Positive values for loss allocation represent a penalty for an increased network loss and negative loss allocation is an incentive for a reduced network loss.
According to
Table 2, the amount of loss allocated to loads and DGs are different when adopting different allocation models. Some techniques assign negative losses to loads and positive losses to DGs; however, this does not provide proper economic signals to network users in radial distribution systems and may lead to an overall un-optimized solution. The reason lies in the fact that the system loads contribute to an increase in network losses and the DG units reduces the losses due to the radial topology of the network. The proposed solution based on the Shapley Value approach assesses the losses for all possible coalitions, and the DSO can then accurately allocate them to each load or DG participant in the distribution network [see Equation (9)]. The loss allocation vector can be finally obtained using the presented algorithm in
Figure 1.
The proposed loss allocation method based on the Shapley Value can be analyzed from the physical perspective of the game participants; similar to other methods, the suggested Shapely Value approach allocates the network losses proportional to the power of each generating unit and load. For example, the allocated loss for load #7 with active power consumption of 141 kW is 0.94 kW, while this value for the neighboring load #8 with the consumption of 338 kW is 2.5 kW.
Furthermore, the suggested method considers the network topology in the loss allocation procedure. The loads located at the end of the long feeders are usually allocated a high proportions of the losses while those closer to high generation points in the network are assigned a lower loss value. To put a figure on this, see
Table 2 and compare the loads at nodes 17 and 15 (at the end of long feeders) compared to those at nodes 3 and 5 (near the high voltage points). Such observation is different from that using other loss allocation models (marginal, Z-bus and succinct methods) since the network topology is well considered. The allocated losses to loads 17 and 15 are found negative via marginal, Z-bus and succinct methods. Such observation confirms the fact that the proposed method in this paper considers the physical aspects of participants as well as the network topology.
Table 2 reveals that the sum of the allocated losses to “loads” and “DG units” using the proposed approach is equal to the total loss, which is 6.63 kW. A normalization (possibly through a reconciliation factor) is required in the case of other loss allocation techniques to have the sum of the losses allocated to the loads and DG units equal to the network total active loss. This highlights the efficiency property of the Shapley Value technique discussed earlier in
Section 2.
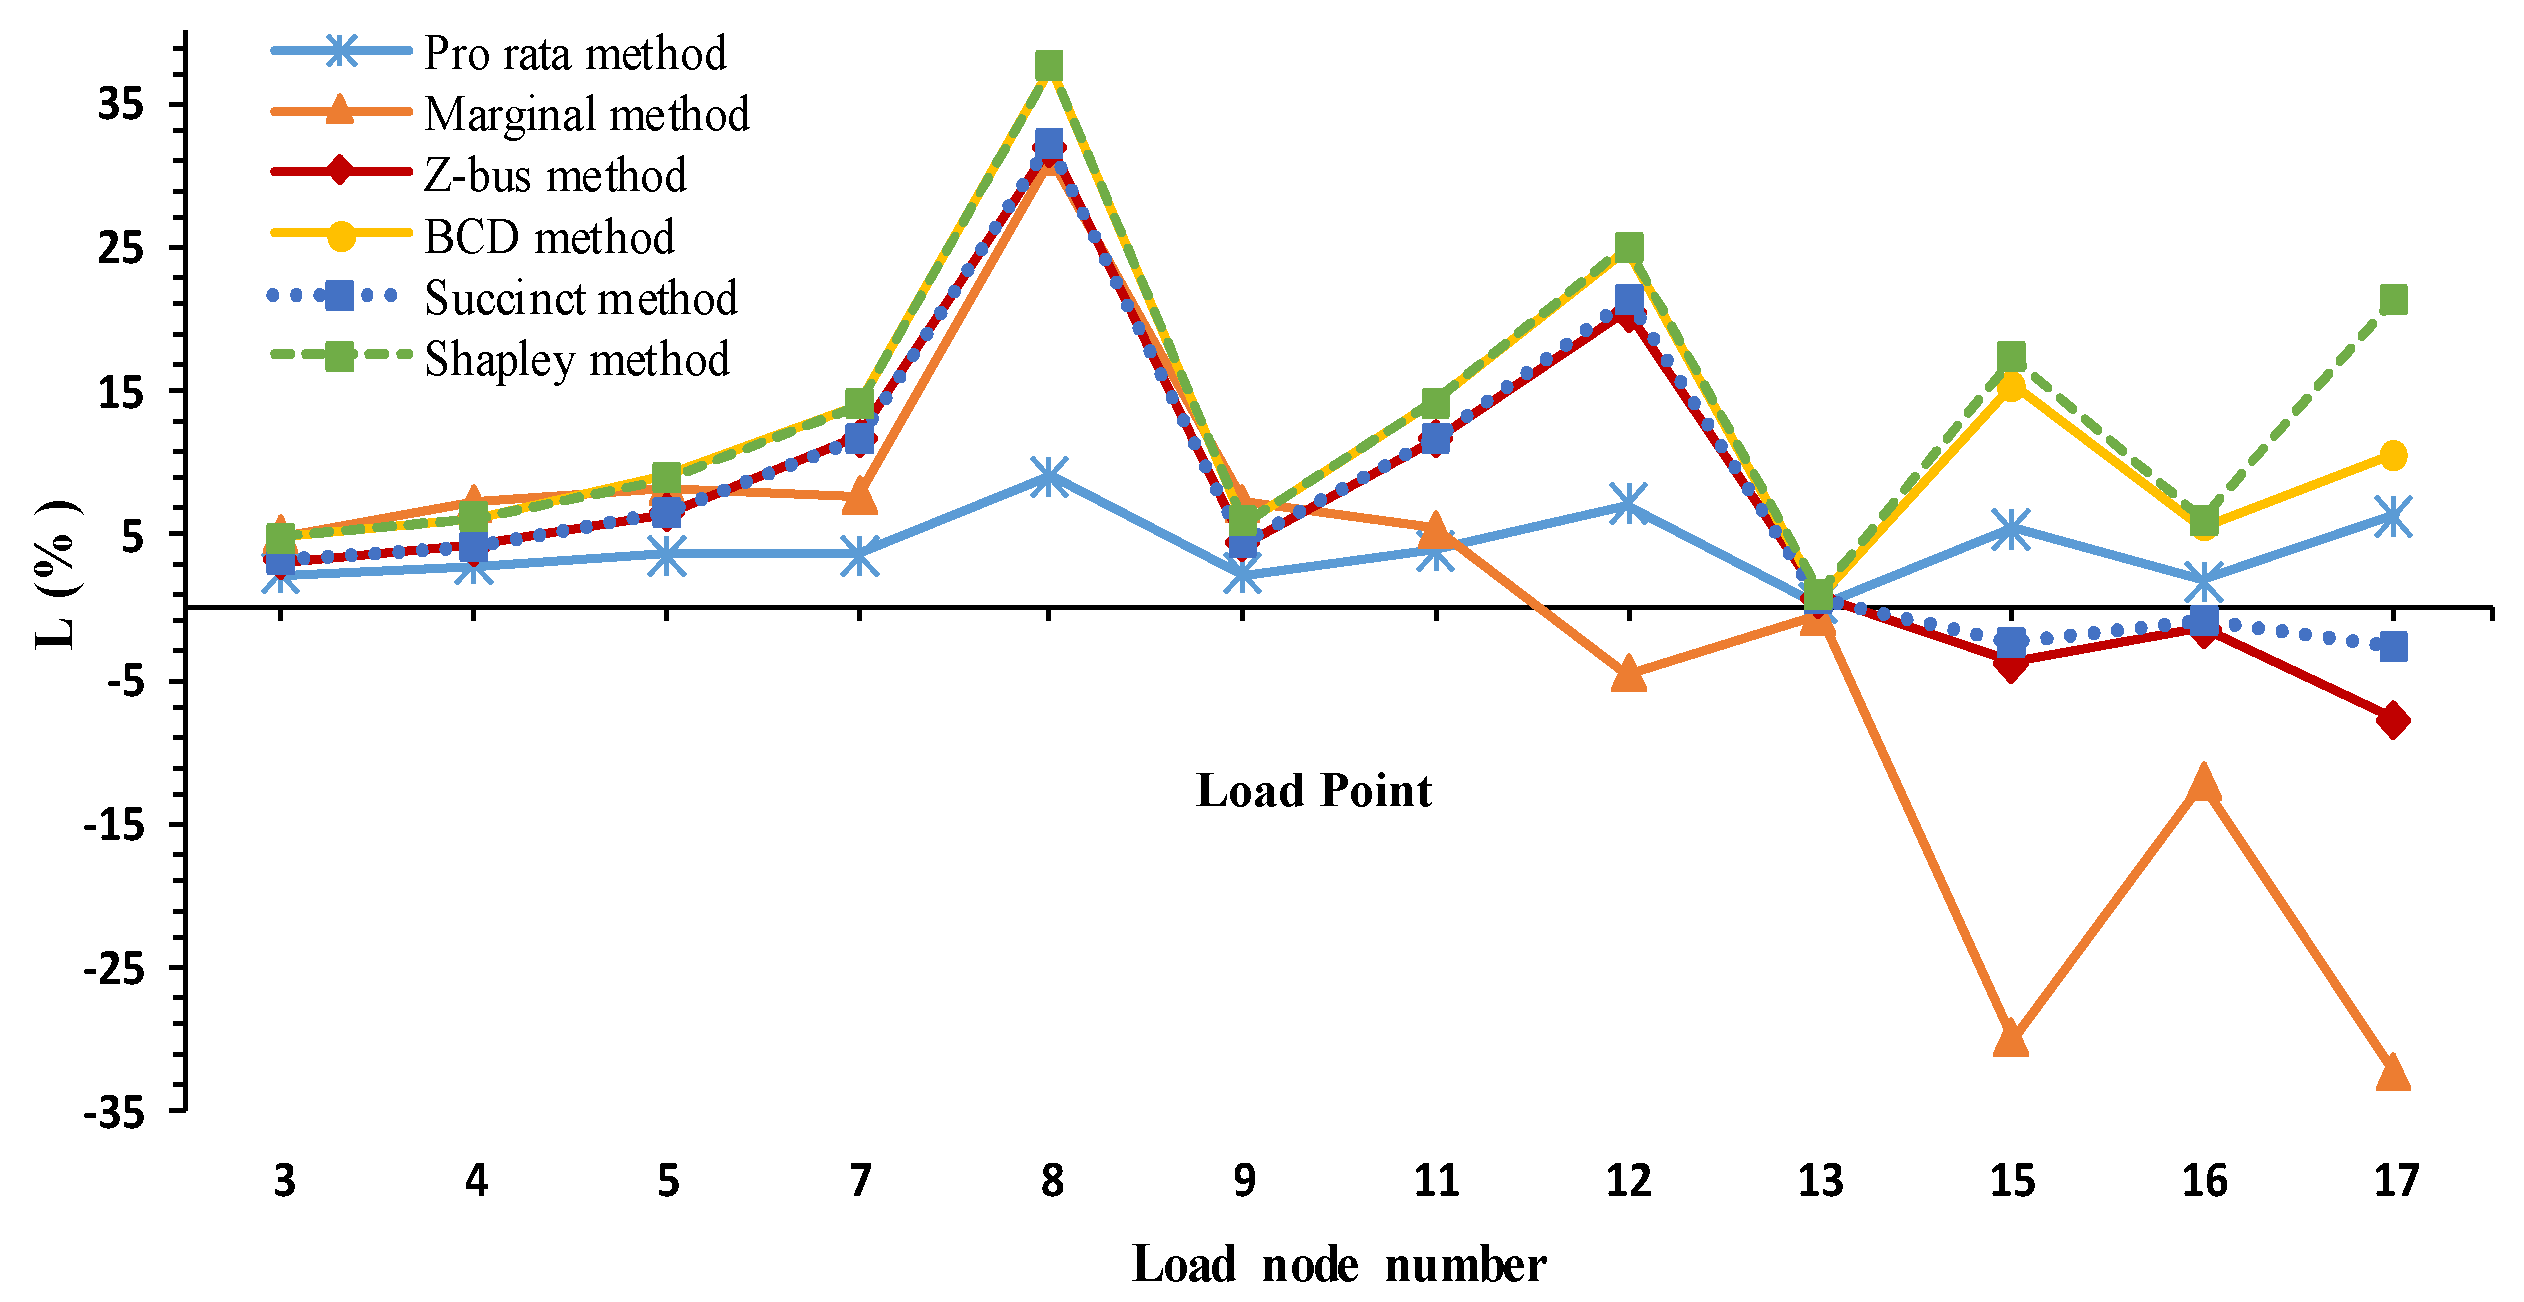
To better compare and interpret the results presented in
Table 2, the data are normalized with respect to their total loss allocation and demonstrated in percentages in
Figure 3 and
Figure 4. Comparing the results, the following observations are made.
The BCD method has the most conformity with the Shapley Value. Thus, BCD method’s allocations can be considered the fairest and most efficient and the corresponding results would be acceptable.
Pro rata method allocates the losses to system loads and DGs equally (50% each) and does not consider the physical location of system participants for loss allocation. Comparison of the results obtained via pro rata approach and the other techniques reveals that the loss allocated to node 8 and the other nodes is not much different in pro rata method.
Numerical results corresponding to the Z-bus and succinct methods, which are typically used for transmission system loss allocation, are almost the same. A fraction of the total losses is allocated to the slack bus, while no loss should be assigned to the slack node in distribution loss allocation process. Note that the Y-bus matrix is usually singular for distribution systems; hence, to apply the Z-bus method, the shunt parameter of lines is not neglected in the studied test system.
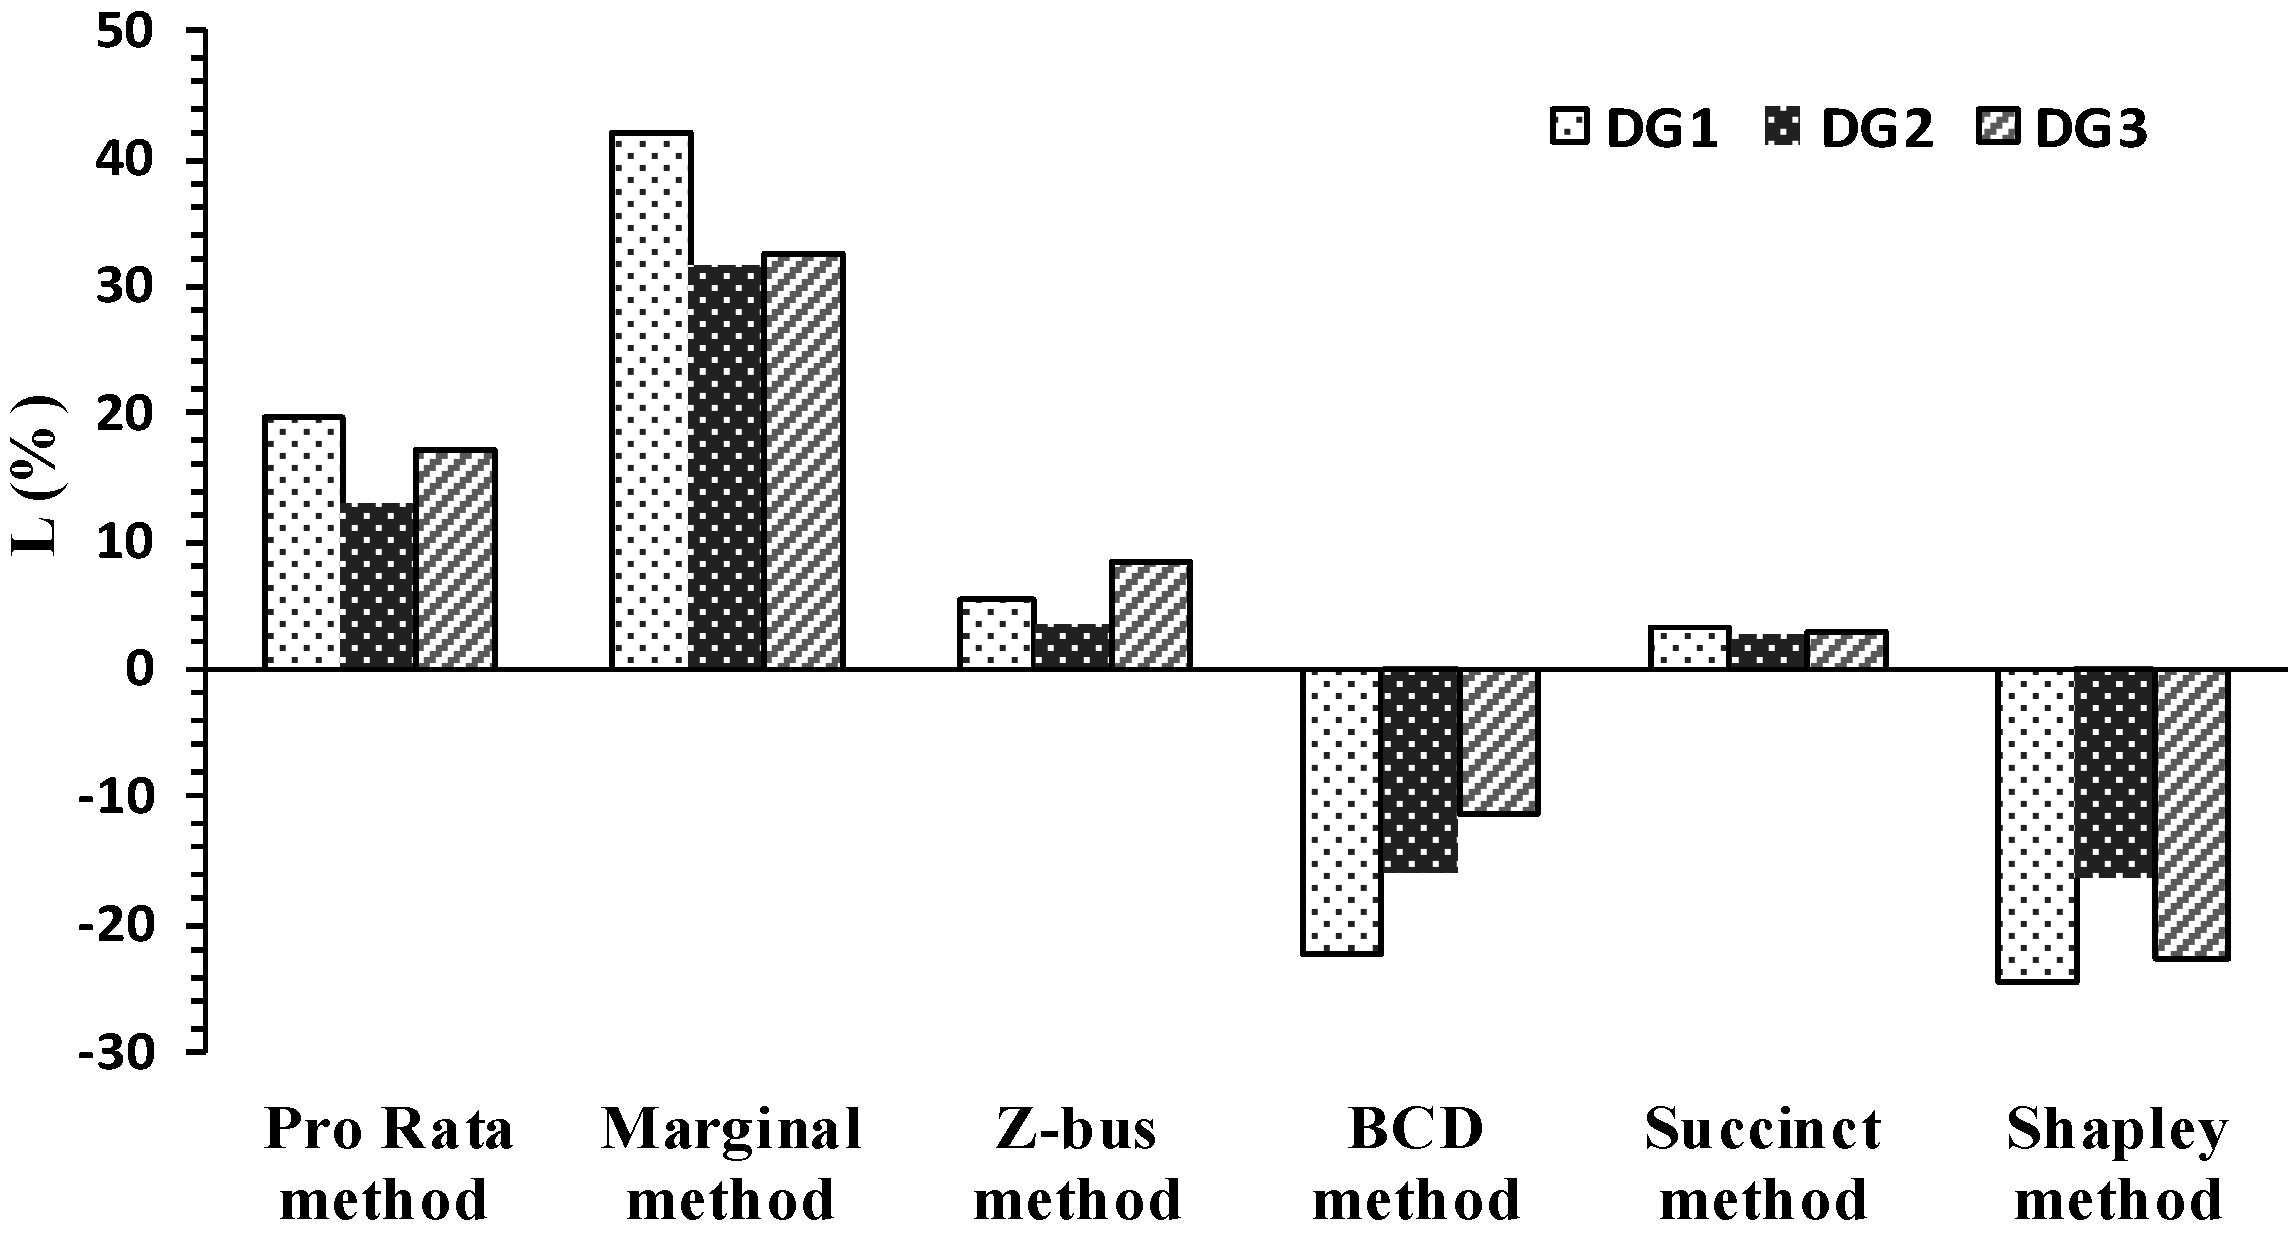
The presence of DGs has reduced the network losses from 21.89 kW to 6.63 kW. Therefore, allocating negative losses to DGs is a clear message on their effectiveness in loss reduction. As
Figure 4 demonstrates, the BCD and Shapley Value techniques have assigned negative losses to the DGs.
According to
Table 2 and
Figure 3 and
Figure 4, the Shapley Value approach provides the fairest solution to loss allocation problem in distribution systems with the results that are economically more acceptable. The results associated with the BCD method are most similar to those of the proposed method and could be considered as the most equitable solution to loss allocation. However, this method is developed only for radial and balanced distribution systems and cannot be applied to asymmetrical meshed distribution networks. Thus, the BCD method can be employed in large-scale radial systems as the Shapley value loss allocation is computationally burdensome. Noteworthy is that the run time of the pro rata, marginal, Z-bus, BCD and succinct methods is less than 0.2 s, while 2
15 number of power flows are executed in the Shapley method that each takes about 0.2 s to run. However, loss calculation for coalitions can be executed independently, thus it can benefit from the advantages of parallel processing and other sampling techniques [
37].
One of the major advantages of the Shapley Value method is that there is no need for structure adjustments when the network is reconfigured. The Shapley Value-based allocation method can be directly implemented in various operating conditions such as unbalanced loads and different loop systems. The following section confirms the performance of the Shapley Value method in loss allocation of an unbalanced and meshed distribution test cases.
4.2. Unsymmetrical Meshed Distribution Systems
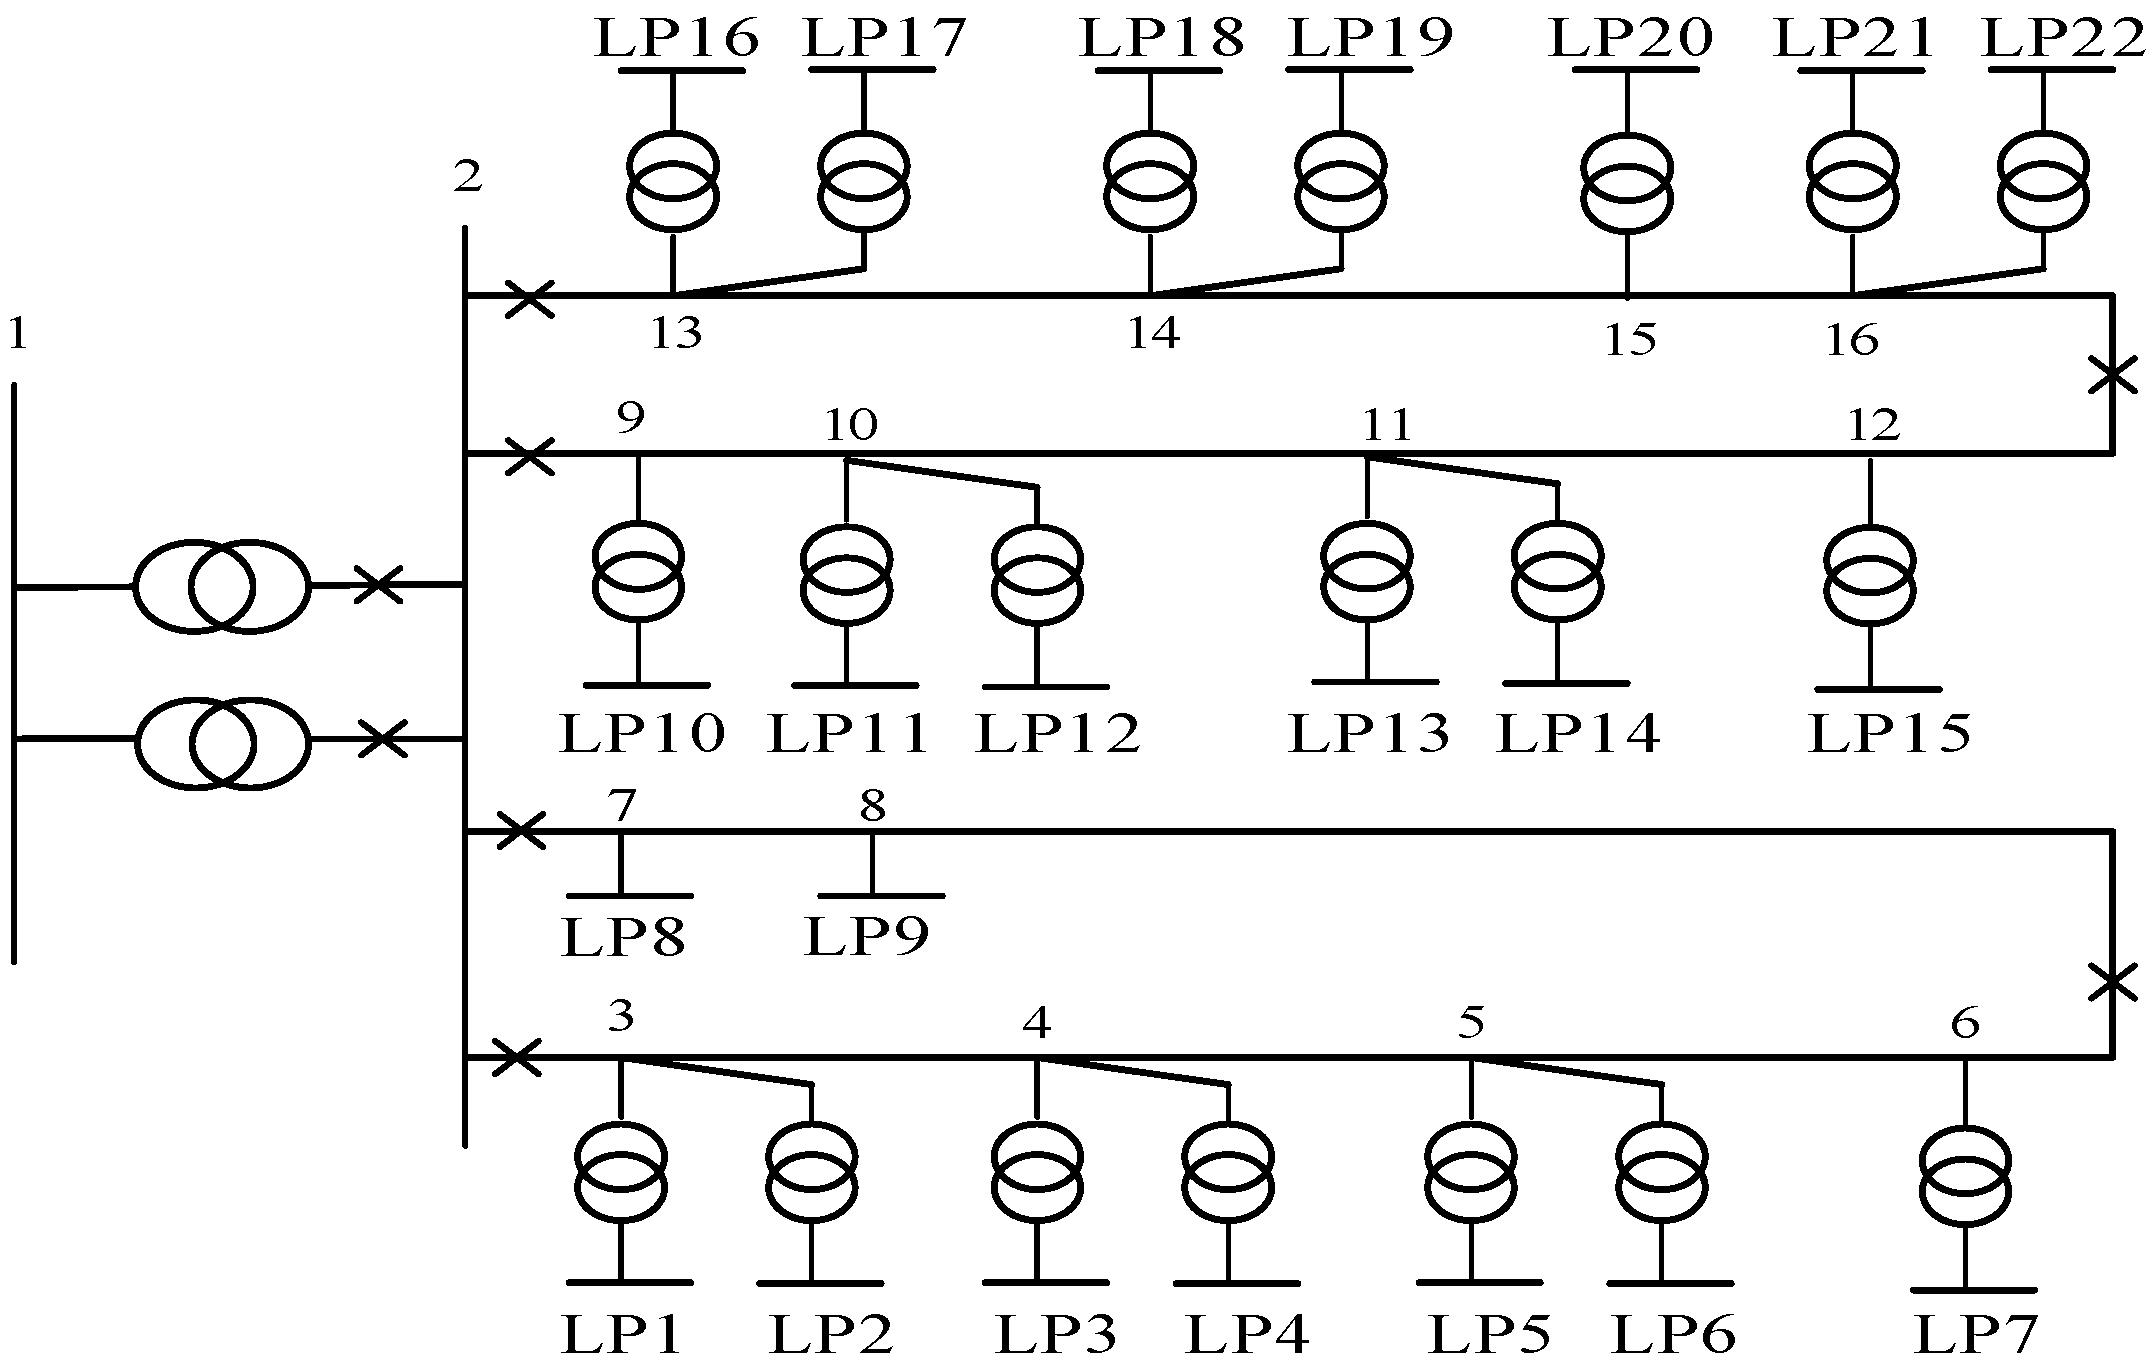
To evaluate the capability of the Shapley Value method in non-radial and unbalanced distribution systems, it was further applied to the distribution system at the second bus of the IEEE-RBTS [
38]. This system, whose single-line diagram is illustrated in
Figure 5, is composed of 5 three-phase loads and 21 single-phase loads. To handle the unsymmetrical nature of this distribution test system, the OpenDSS analysis is utilized to perform the distribution-style power flow [
39].
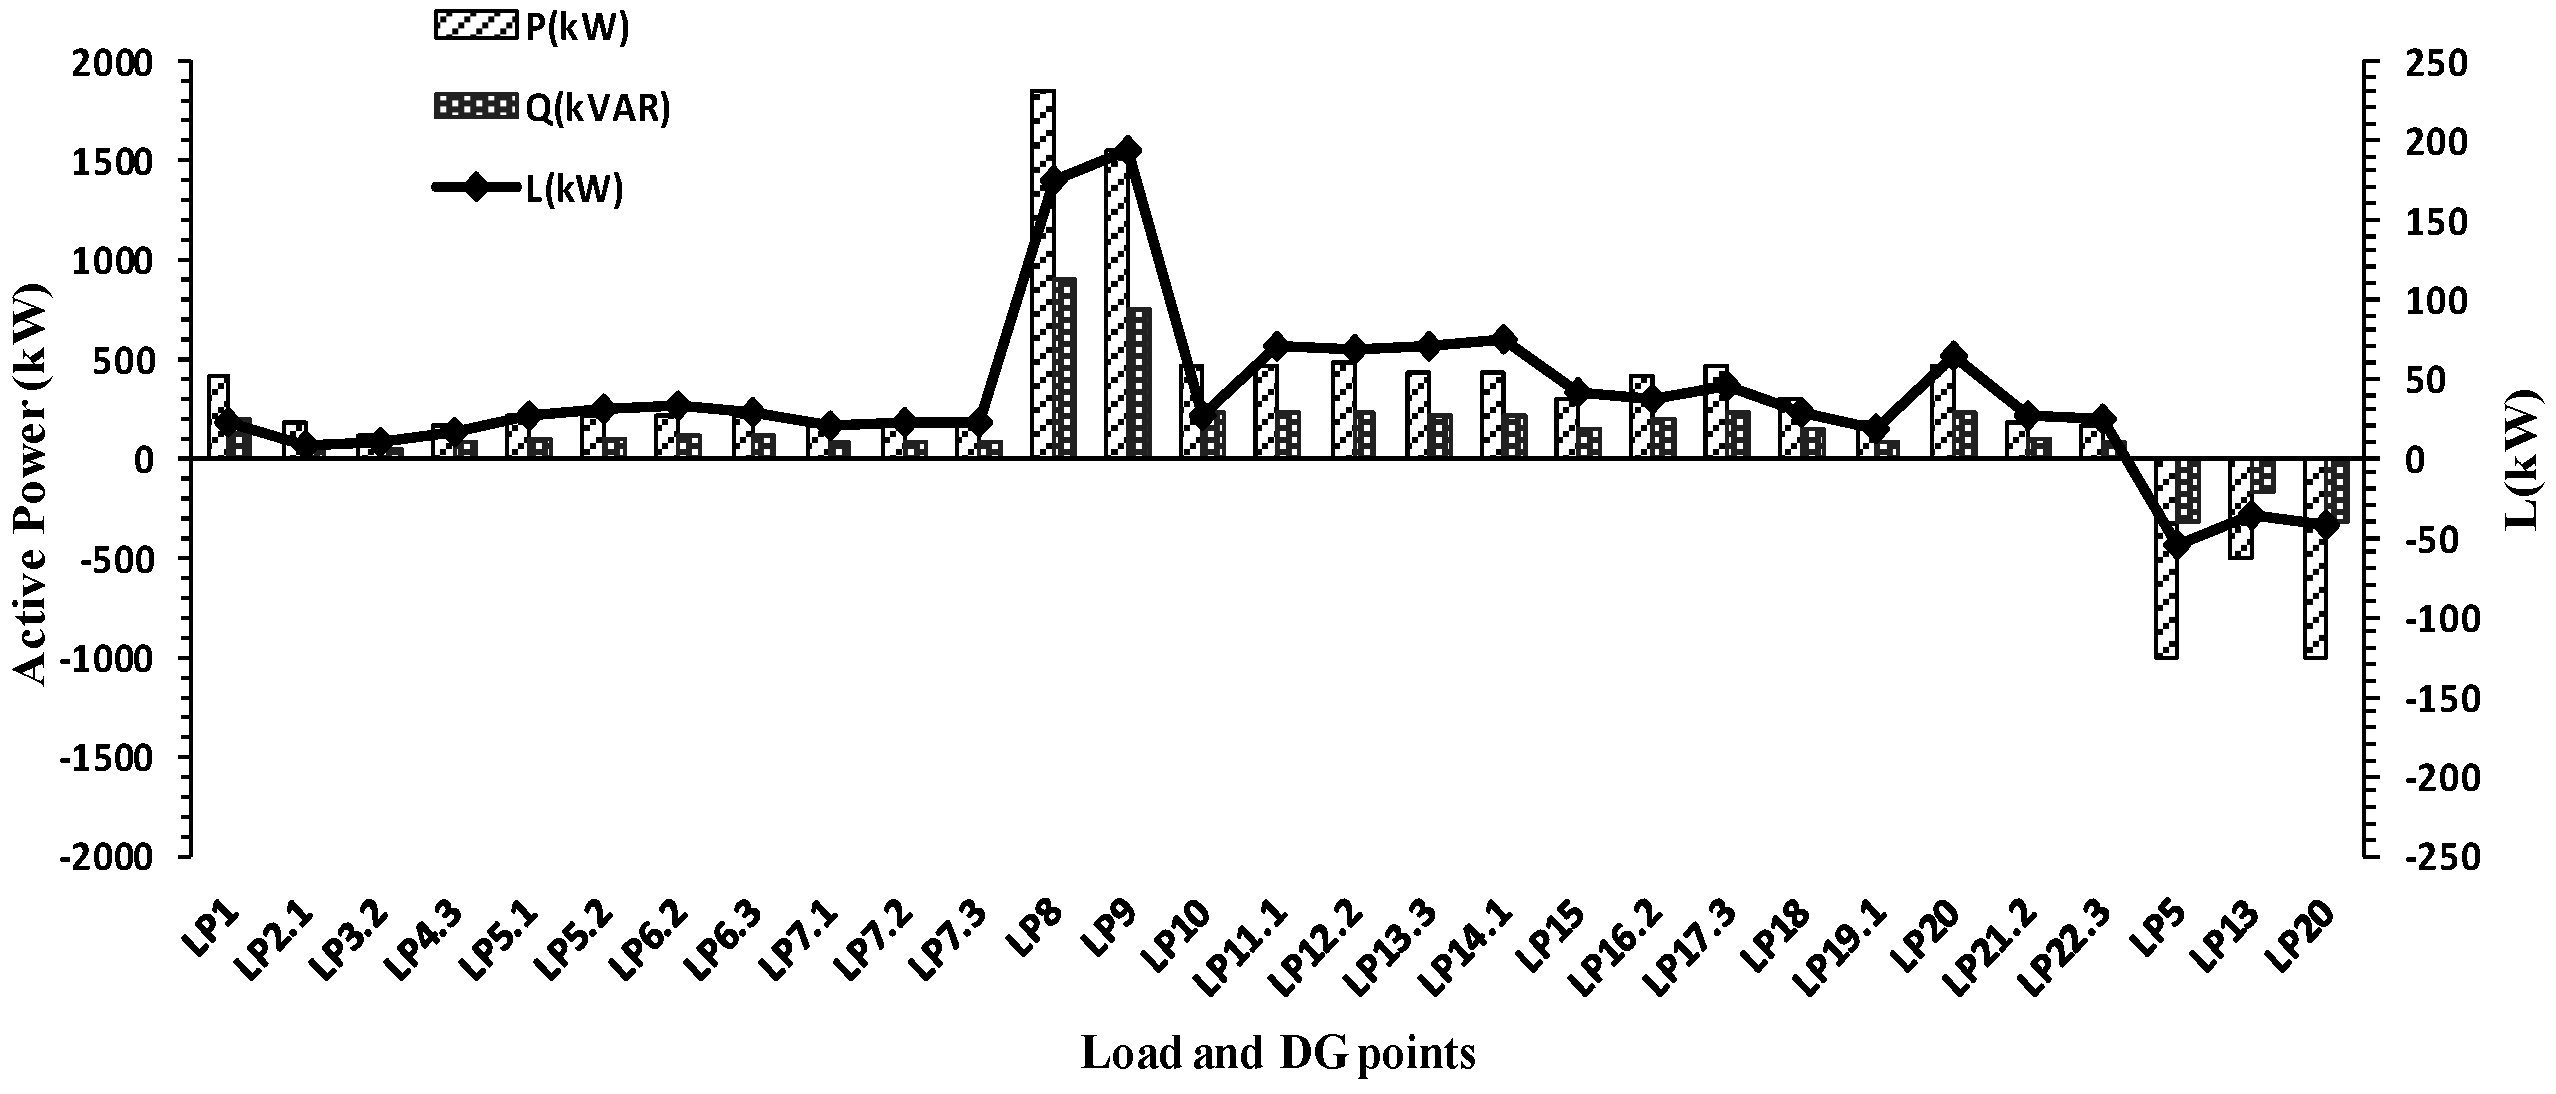
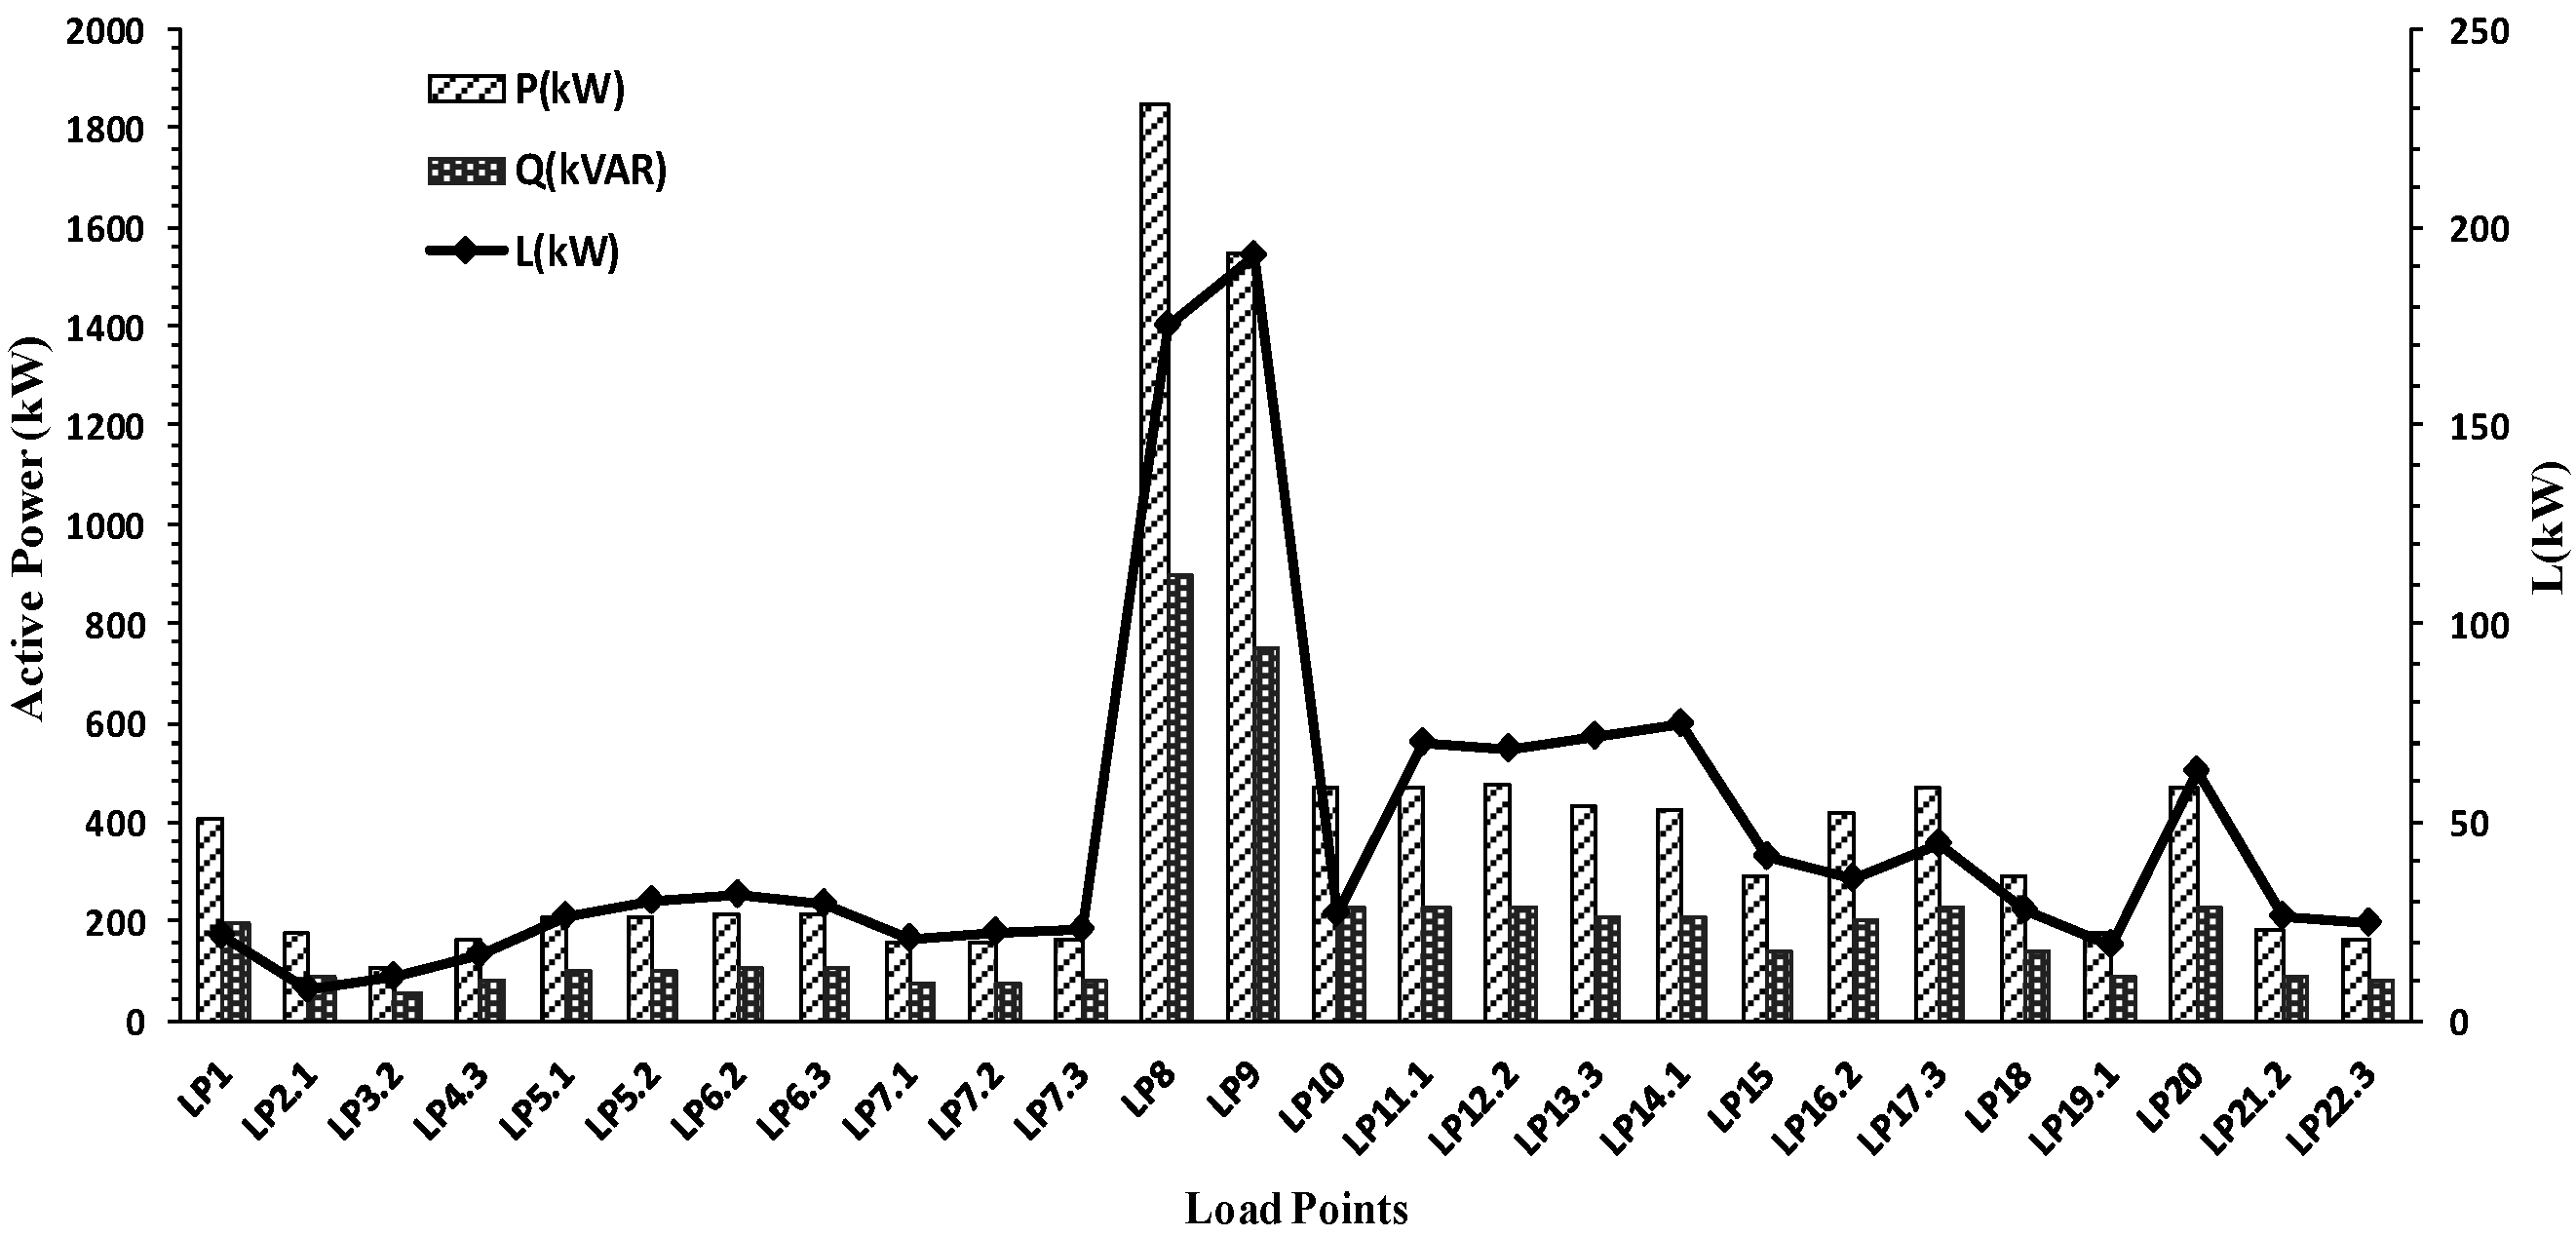
The active and reactive power and the loss allocated to each single-phase load as well as each phase of the three-phase loads are demonstrated in
Figure 6. Similar to the physical analysis of the Shapely Value method on radial-structure systems in the previous subsection, the loss allocation with Shapley Value method in this meshed-structure system is also proportional to the active power level of the loads. For example, the loss allocated to LP5.2 (phase 2 of LP5) and LP6.2, which are located at the same place and phase, are exactly proportional to their power. The allocated losses are also dependent on the system topology. As an example, consider the two three-phase loads at buses LP15 and LP18. Although the loads have the same capacity, their allocated loss is different, as they are placed in different locations. According to
Figure 6, the loss allocated to load at bus LP15 is larger as it is located farther from the source.
To demonstrate the efficiency of the proposed approach in handling the unbalanced cases, two phases of load LP5, i.e., LP5.1 and LP5.2, are compared. Although LP5.1 and LP5.2 are located at the same node and have equal capacity, their allocated loss (by Shapley Value method) is different. The reason is that the total loss of phase 2 is equal to 407,587.4 W, while the network loss at phase 1 is 400,765.4 W. Consequently, the loss allocated to the load at phase 2 is greater.
To analyze the performance of the proposed solution when loss allocation is pursued in the presence of DGs, three DG units are added to buses LP5, LP13 and LP20. The total loss is decreased from 1200 kW to 1068 kW in this scenario.
Figure 7 demonstrates the loss allocation results for this system in the presence of DGs. The loss allocated to DGs is negative (−12.4%) representing their positive impact on the network loss reduction. This will be an incentive for investments in DG deployment in distribution systems.
4.3. Performance Evaluation of the Proposed Loss Allocation Approach
To evaluate the performance of the proposed model, sensitivity analyses are performed in this section. The rational expectation from the loss allocation method in a non-radial distribution system is that if conditions of system participants change in a same manner, the allocated losses to these participants will vary in the same or similar trend. In contrast, by changing the capacity and location of the participants differently, the allocated losses can follow a completely different trend such that the role of DG units in loss reduction can change. To this end, two scenarios are considered: (i) the same changes in the load and generation levels; and (ii) changes in the capacity and location of DG units.
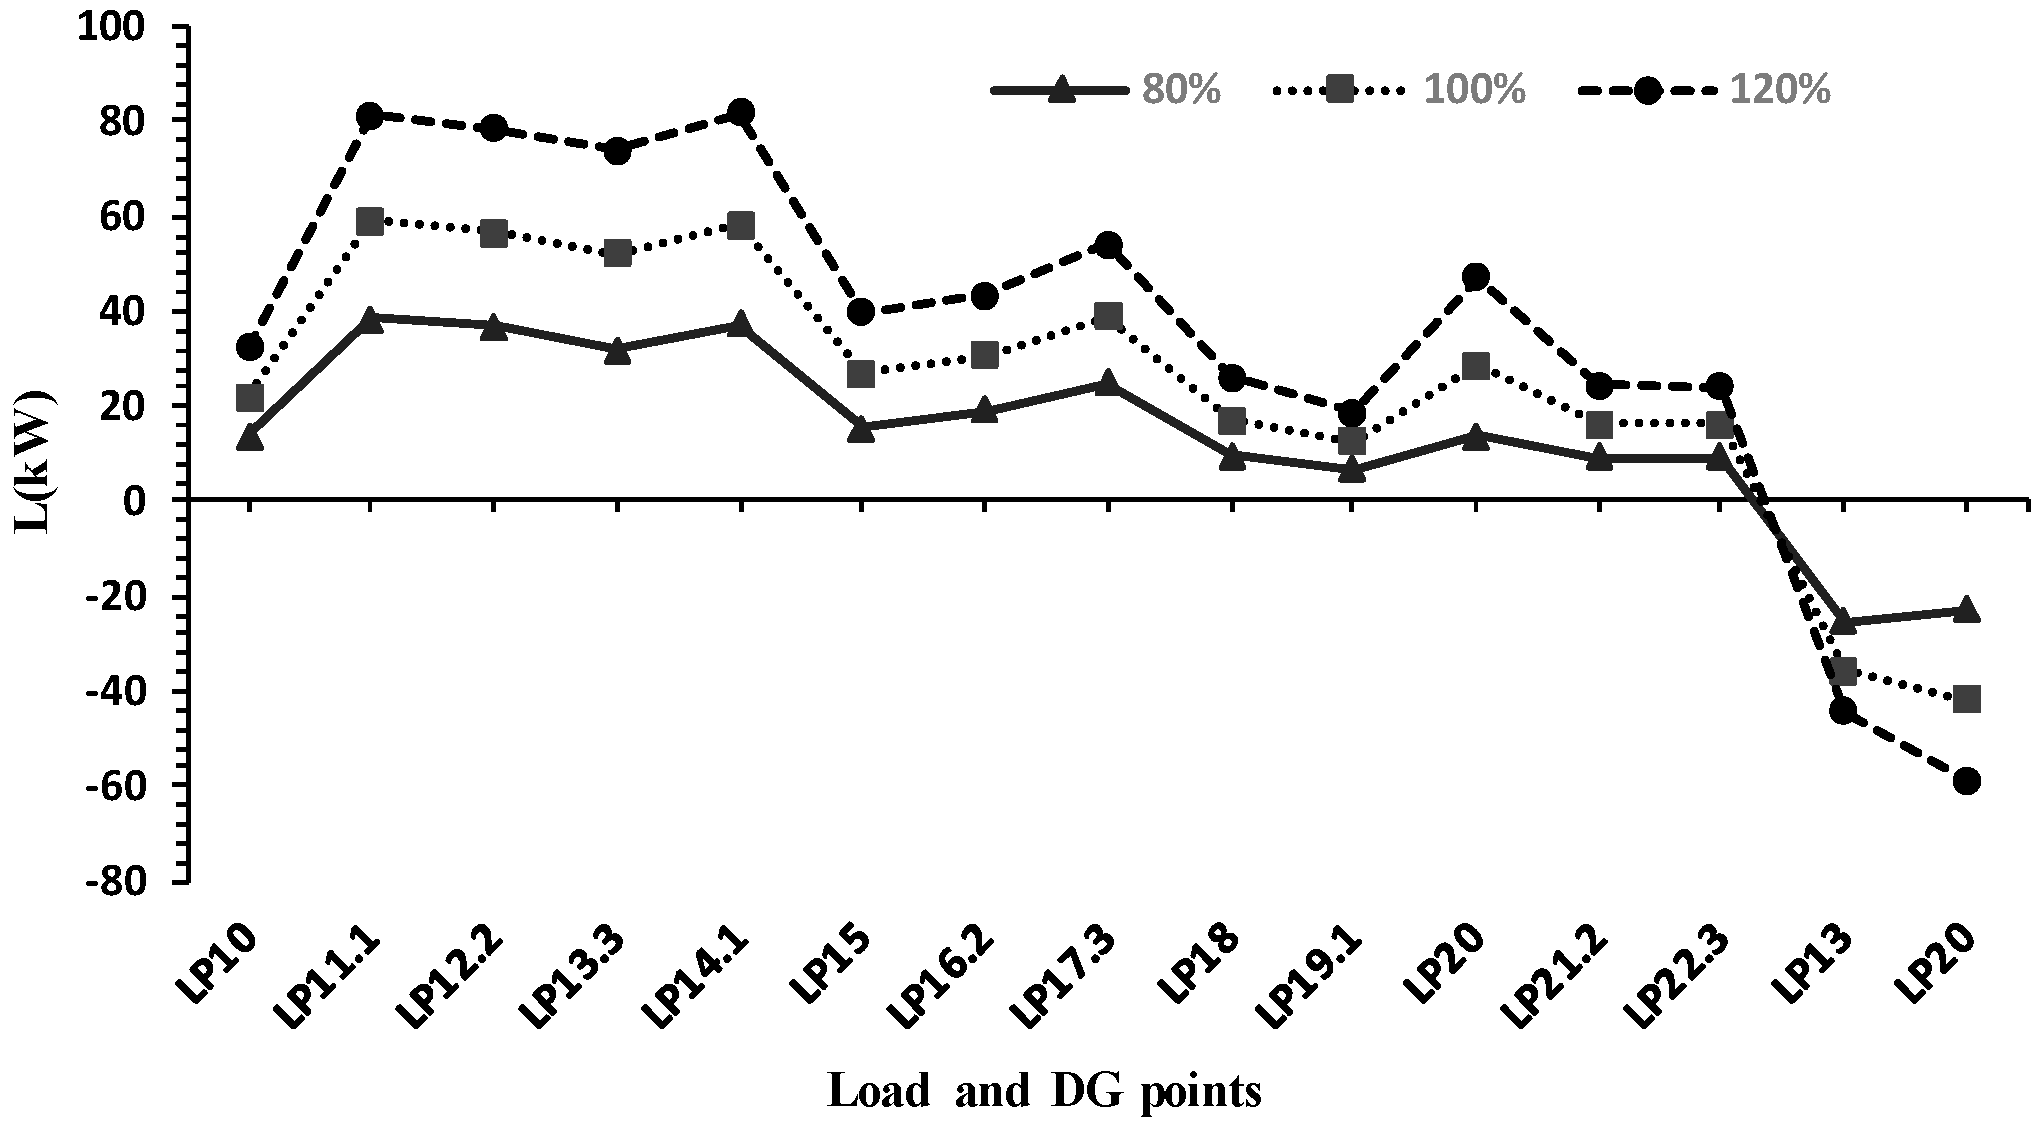
4.3.1. Sensitivity Analysis 1: Consistent Changes in Load and Generation
With the change in the conditions of the system participants in the same way, the allocated losses should also follow the same trend. To examine this feature for the proposed approach, two different cases are compared with the base case system in
Figure 5. In the first case, the level of generations and demands are normalized by 0.8, while in the second case, 1.2 is used as the normalization factor. The allocated losses for these test cases are compared with the base case scenario in
Figure 8. In this figure, as the level of load and generation increases, i.e., the second case, the amount of allocated losses is scaled. In a same way, its decrement leads to almost the same decrease in the allocated loss for all participants. Therefore, the accuracy of the Shapley Value method in closely following the simultaneous changes in generation and demand can be concluded from this sensitivity analysis.
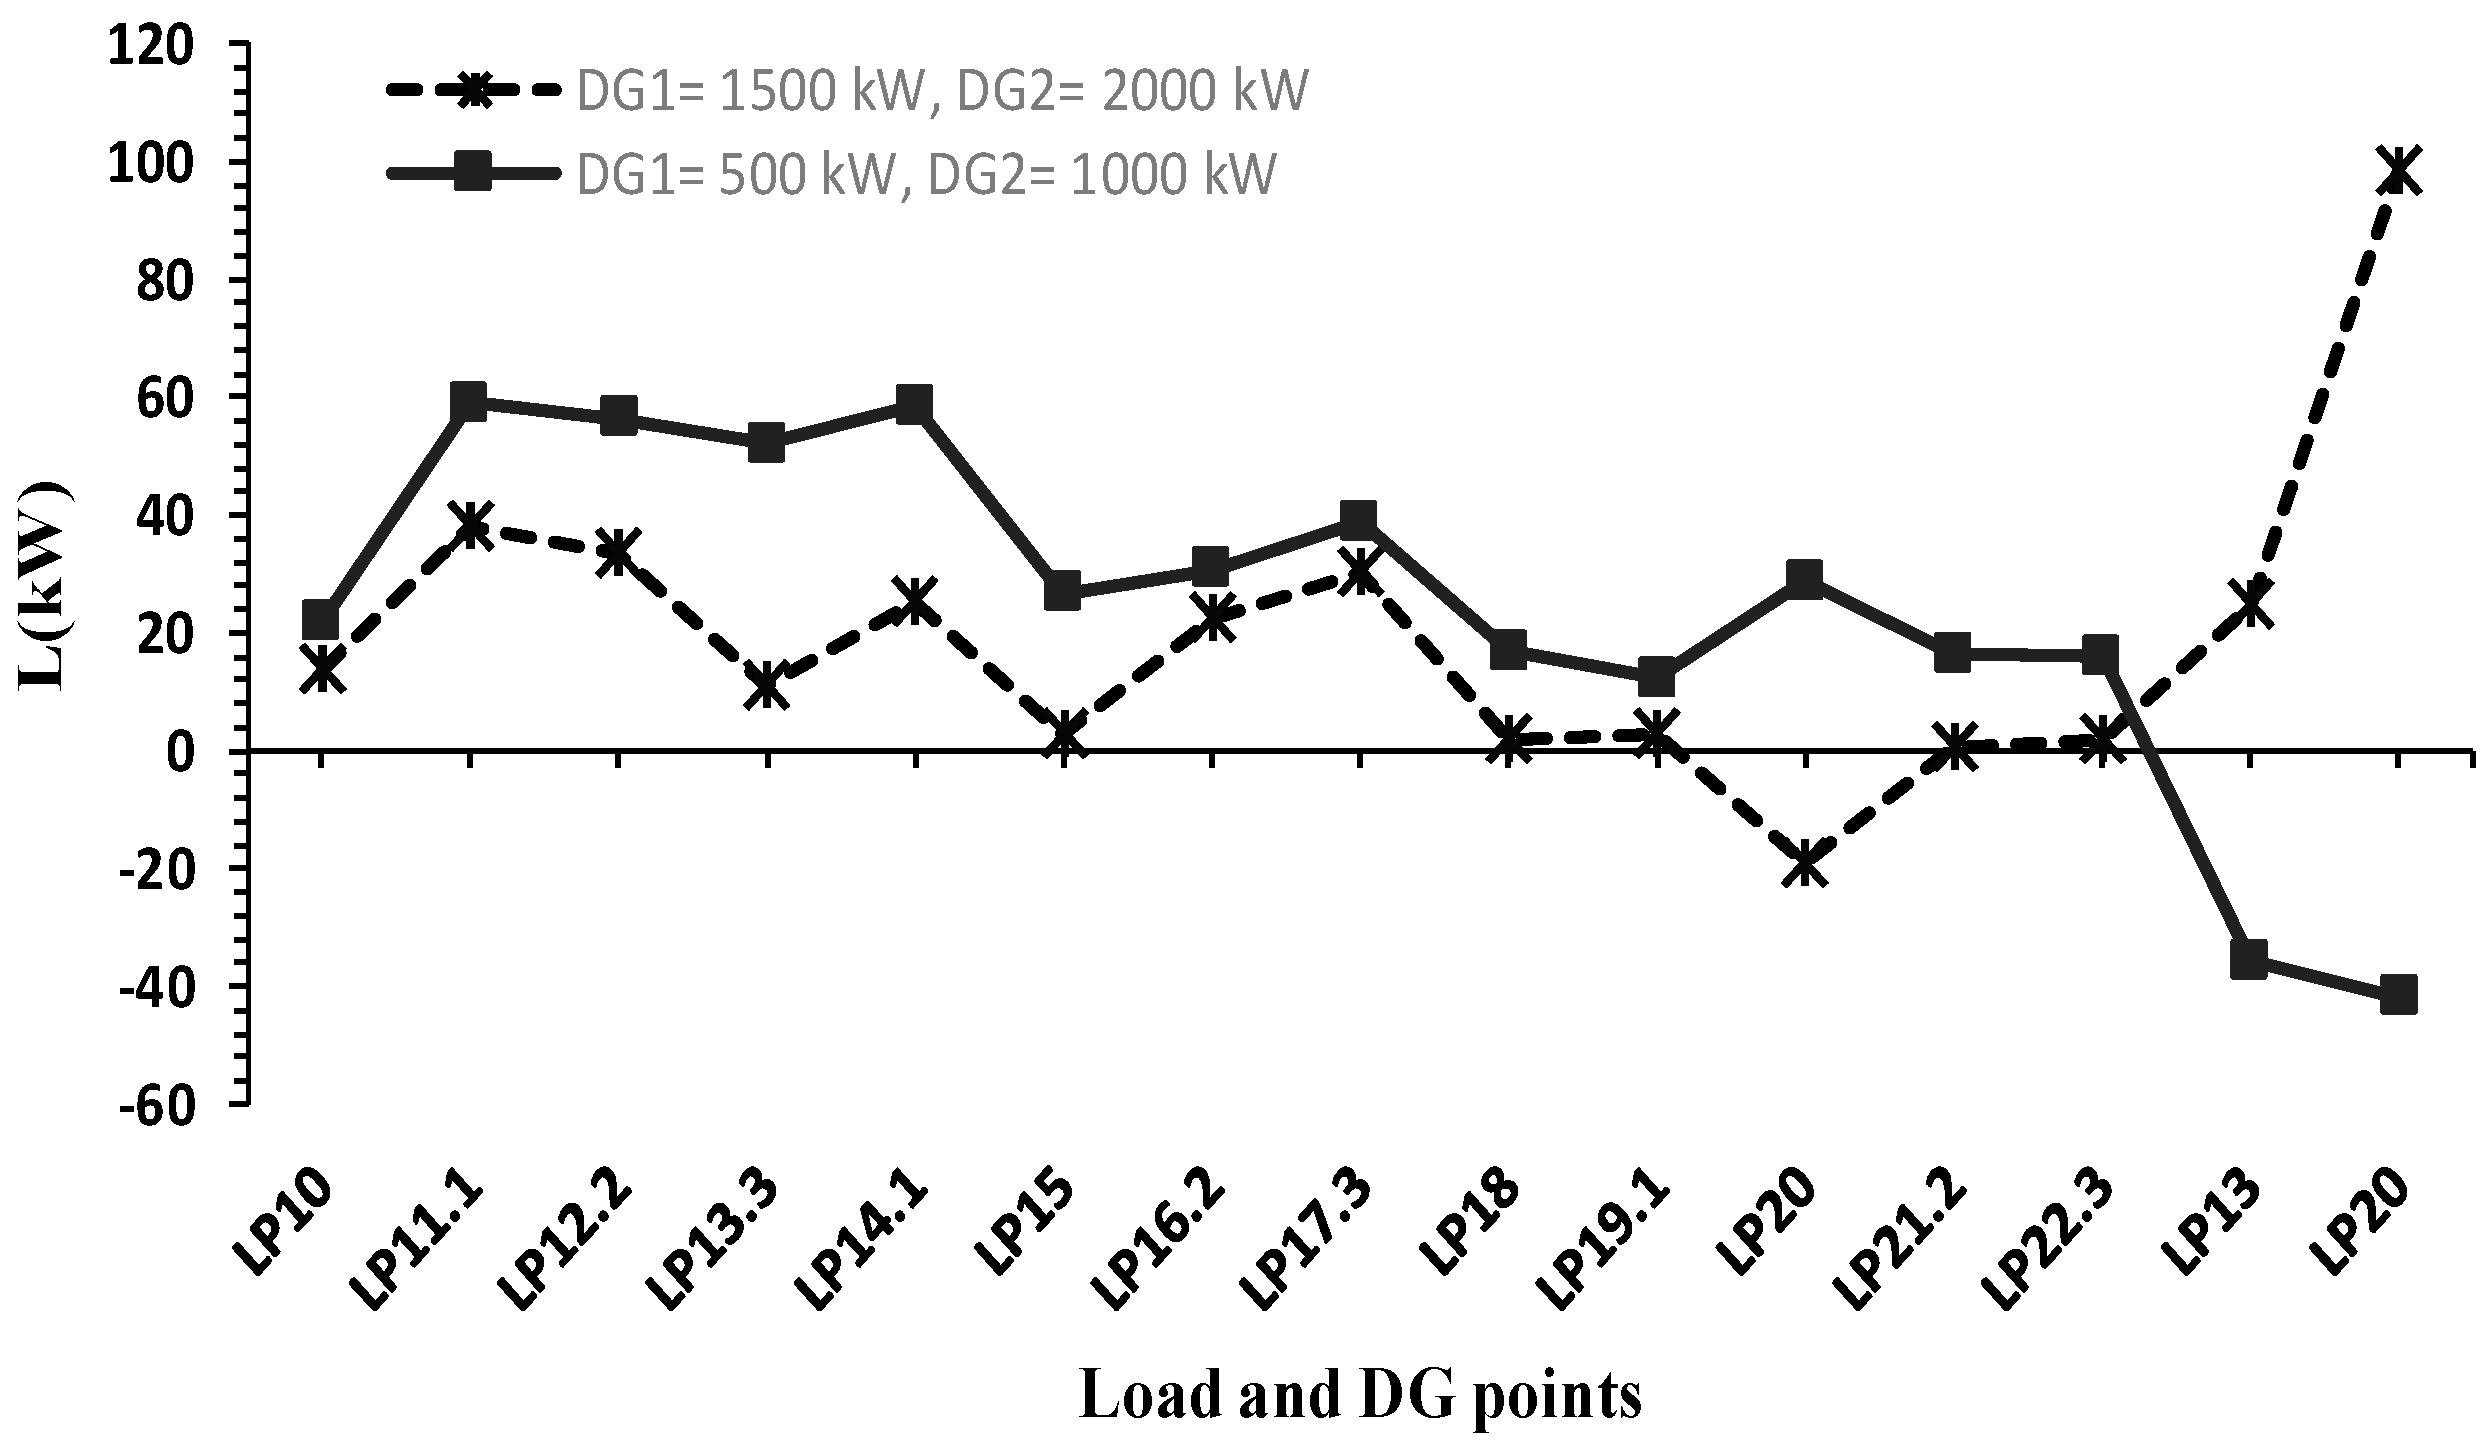
4.3.2. Sensitivity Analysis 2: Modified Capacity and Location of DG Units
The performance of the proposed solution is evaluated when the main coalition faces various changes. The effect of capacity and location of DGs on the network total losses and the allocated losses to participants is investigated. For example, increasing the capacity of DG1 from 500 kW to 1500 kW and DG2 from 1000 kW to 2000 kW results in the network total losses decreasing from 358 kW to 289 kW. As demonstrated in
Figure 9, however, the allocated losses to each participant is completely different from the previous one. In this scenario, DG units have negative role in system losses, while the load located at bus LP20 has considerable share and contribution in the total loss reduction.
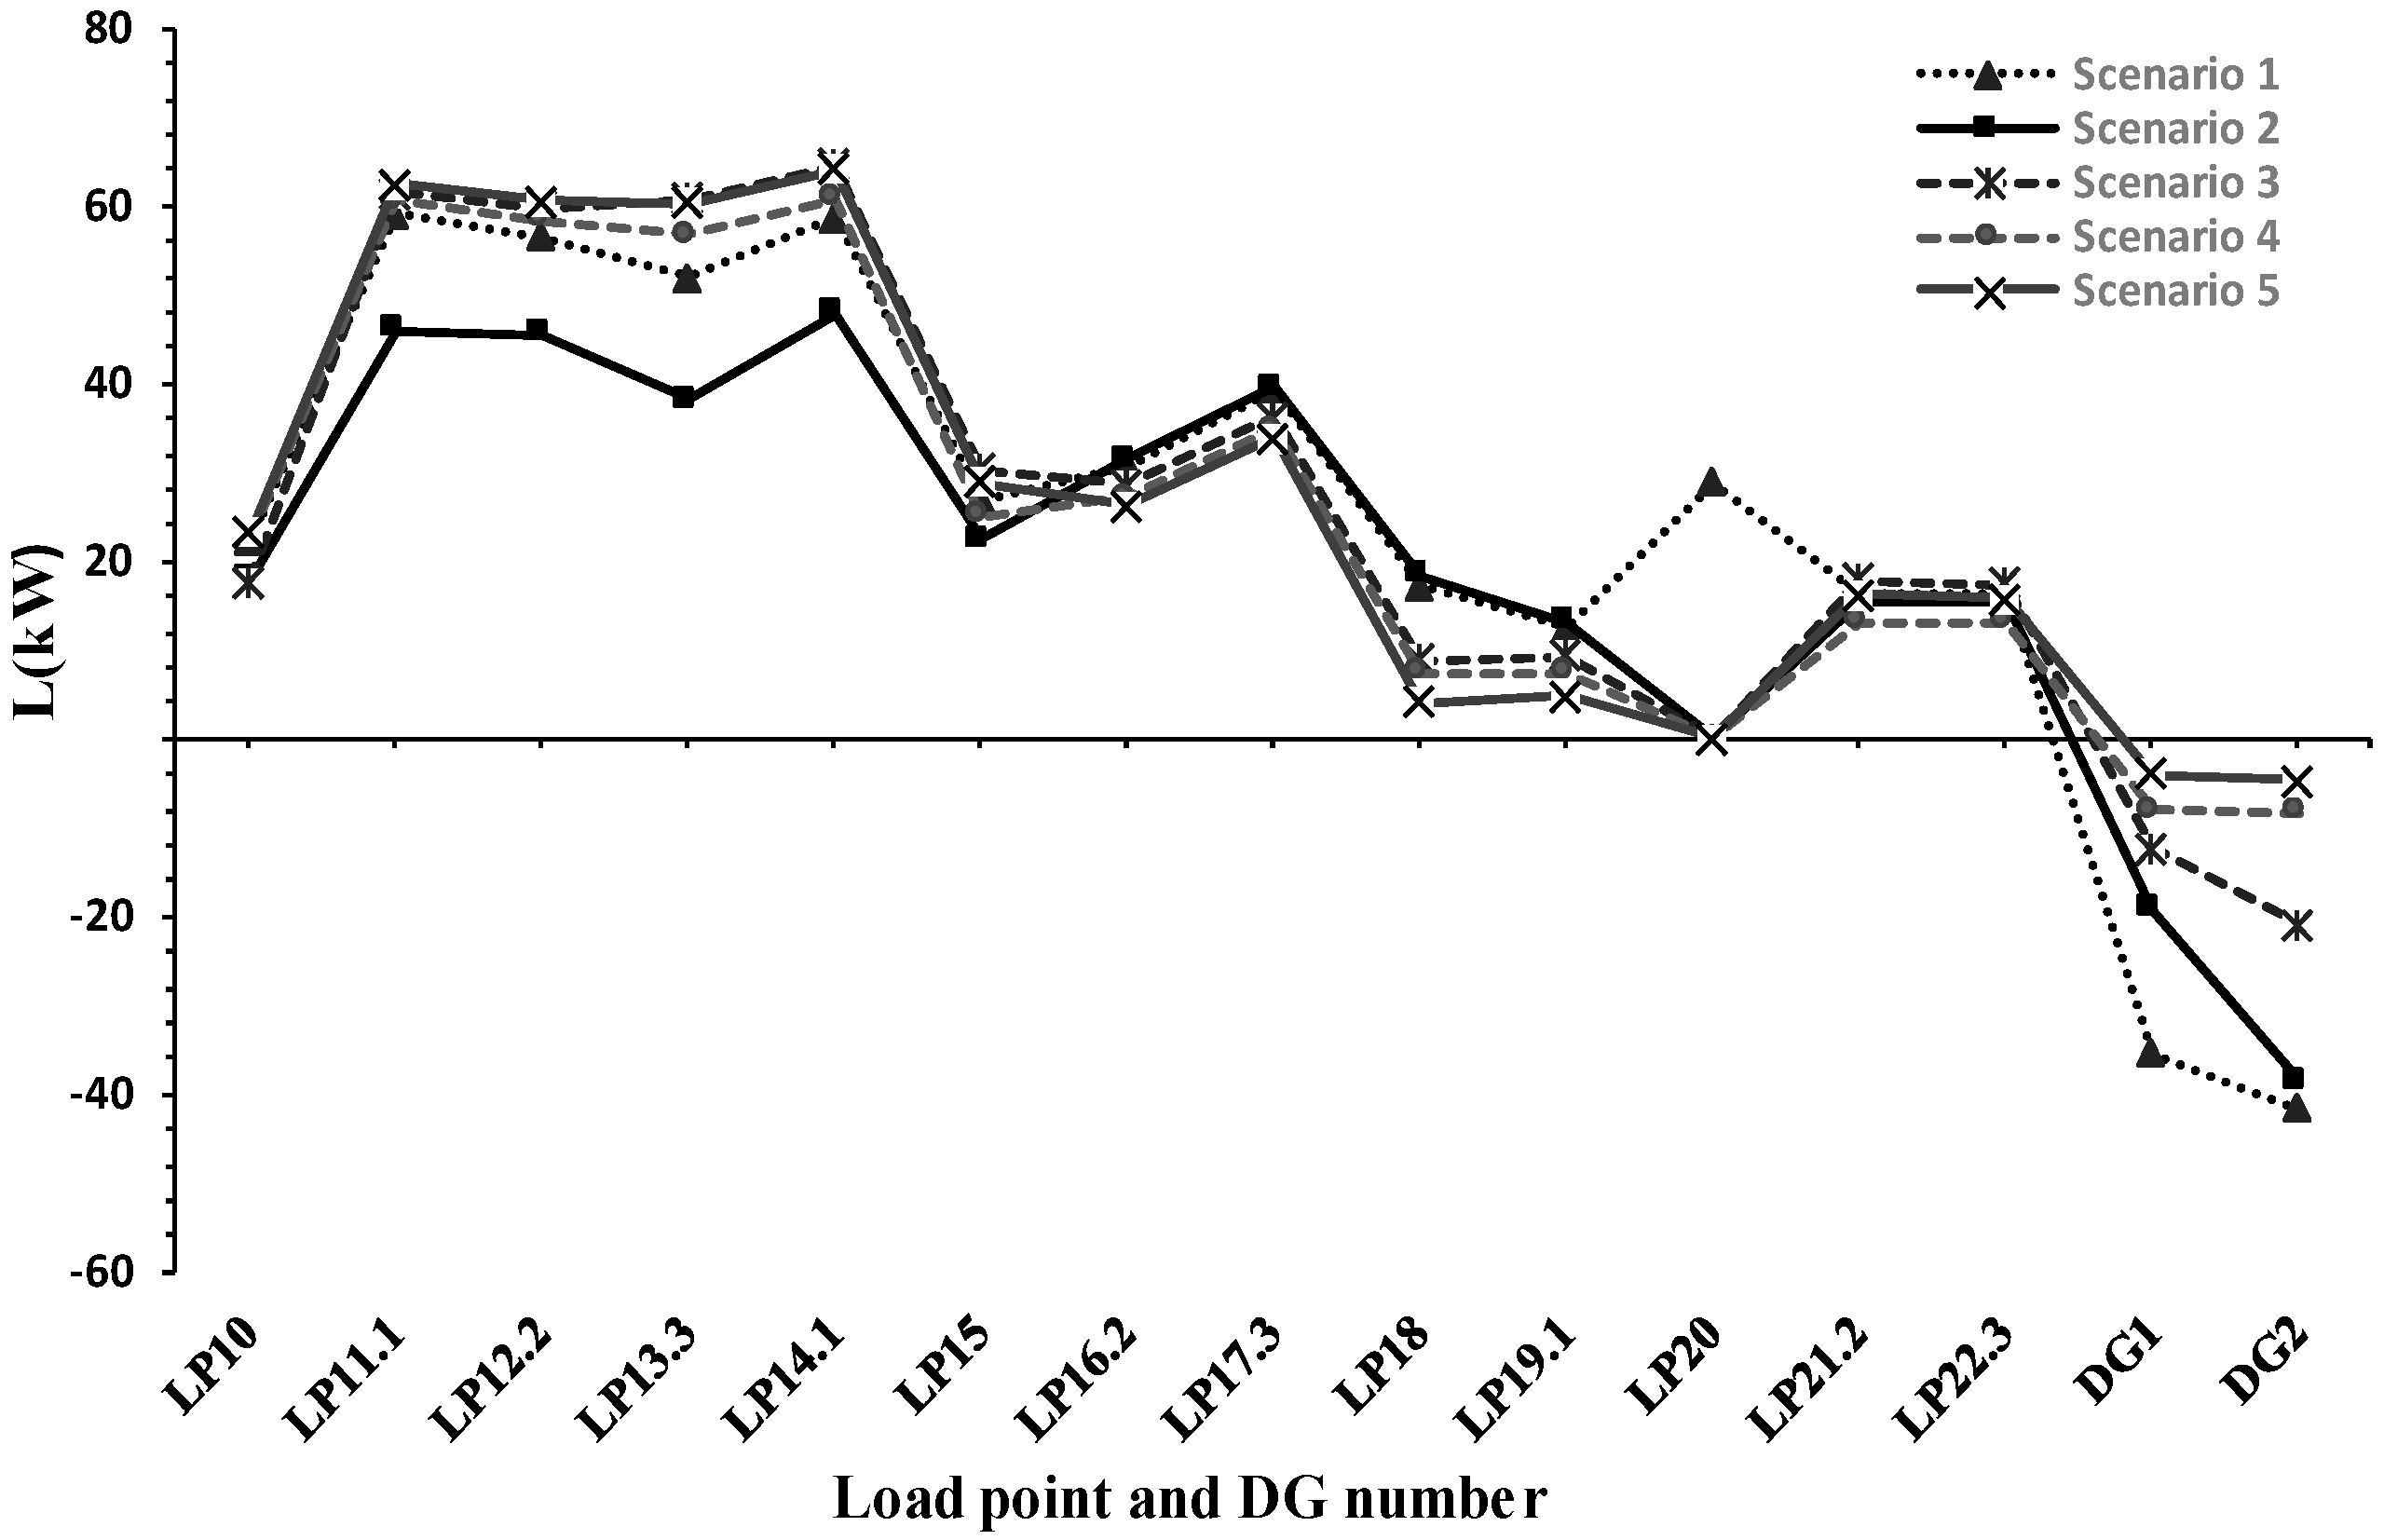
To investigate the effect of DG location on the total and the allocated losses,
Figure 10 presents the results of five different scenarios on DG locations. In all the studied scenarios, the capacities of DG1 and DG2 are 500 kW and 1500 kW, respectively. In
Table 3, although one can see both a decrease and increase in total losses in different scenarios, the role of DGs is assessed positive. However, the allocated loss to DG2 varies from 41.69 kW to 4.77 kW for Scenarios 1 and 5, respectively.
Therefore, in meshed distribution systems, the impact of DG capacity and location on their allocated losses is much more significant compared to that in radial distribution systems.


