Article

V2G System Optimization for Photovoltaic and Wind Energy Utilization: Bilevel Programming with Dual Incentives of Real-Time Pricing and Carbon Quotas

1
Faculty of Mathematics and Physics, Huaiyin Institute of Technology, Huai’an 223003, China
2
Department of Mathematics, Aviation University of Air Force, Changchun 130022, China
*
Author to whom correspondence should be addressed.
Mathematics 2026, 14(1), 114; https://doi.org/10.3390/math14010114
Submission received: 30 November 2025 / Revised: 20 December 2025 / Accepted: 27 December 2025 / Published: 28 December 2025
(This article belongs to the Special Issue Applied Machine Learning and Soft Computing)

Abstract

Considering the global objective of carbon emission reduction, this paper focuses on optimizing the operational efficiency of grid-connected electric vehicles (EVs) and promoting sustainable energy integration and thus proposes a novel dual-incentive mechanism combining real-time pricing (RTP) and carbon quotas. A core of this study is the development of a bilevel programming model that effectively captures the strategic interaction between power suppliers (PS) and microgrid (MG) users. At the upper level, the model enables the PS to optimize electricity prices, achieving both revenue maximization and grid balance maintenance; at the lower level, it supports MGs in rational scheduling of EV charging/discharging, photovoltaic and wind energy (PWE) utilization, and load consumption, ensuring the fulfillment of user demands while maximizing MG profits. To address the non-convex factors in the model that hinder an efficient solution, another key is the design of a bilevel distributed genetic algorithm, which realizes efficient decentralized decision making and provides technical support for the practical application of the model. Through comprehensive simulations, the study verifies significant quantitative outcomes. The proposed algorithm converges after only 61 iterations, ensuring efficient solution performance. The average purchase price of electricity from the PS for the MG is USD 1.1, while the selling price of PWE sources from MG for the PS is USD 0.6. This effectively promotes the MG to prioritize the consumption of PWE sources and encourages the PS to repurchase the electricity generated by PWE sources. On average, carbon emissions decreased by approximately 300 g each time slot, and the average amount of carbon trading was around USD 8. Ultimately, this research delivers a practical and impactful solution for the development of MGs and the advancement of carbon reduction goals.

1. Introduction

As global climate governance advances, low-carbon development has become the key to sustainable development. Achieving the target for carbon emission reduction will require enormous costs and price hikes; it will also require systemic changes in the economy and society, with different industries and enterprises facing significant difficulties and challenges [1,2]. As major energy consumption and greenhouse gas emission sectors, China’s power and transportation industries account for more than 60% of the total carbon emissions, shouldering huge pressure to reduce emissions [3]. This background forces the power system to prioritize photovoltaic and wind energy (PWE) and gradually replace fuel vehicles with electric vehicles (EVs) driven by energy conservation and emission reduction [4,5]. Although the marginal cost of power generation after complete construction of wind power, photovoltaic and other new energy sources is almost zero with no carbon dioxide and pollutant emissions, due to their randomness and volatility, they are inconsistent with the requirements of real-time accurate balance between power generation and consumption in the system. This means that the adoption of clean energy will increase the cost of power system transmission, regulation, and other aspects [6,7].
Moreover, EVs possess undergo charging and discharging, meaning they serve as good mobile energy storage units [8,9]. However, large-scale integration of EVs into the power grid in a random manner and their disorderly charge and discharge behavior may have an unforeseeable negative impact on the operation of the power system. A data-driven model guided by an energy consumption framework is proposed in [10]; this approach addresses the problem of inaccurate remaining range prediction, improving drivers’ travel planning and vehicle efficiency. In [11], a cost minimization model is presented that addresses transportation, energy, and carbon trade costs within a cap-and-trade framework. Therefore, utilizing economic and technical means to optimize clean energy consumption and improve power system dispatch is of great significance in stimulating the emission reduction potential of the transportation and power sectors [12].
Demand response (DR) functions to manage consumers’ electricity consumption behavior based on the power supply or power price [13,14,15]. Its core principle is the price response. By establishing an effective price mechanism, it can mobilize users’ enthusiasm to participate in power grid operation, rationally arrange electricity consumption time, and coordinate power load to achieve peak cutting and valley filling [16]. Among various price-based DR mechanisms, the most effective is real-time pricing (RTP) [17]. Reference [18] presents a comprehensive survey of recent advancements to EV energy storage systems, including lithium-ion batteries, supercapacitors, and fuel cells, as well as their integration within energy management systems. In [19], Erdinc took EVs and energy storage systems as research objects and implemented a DR strategy based on RTP and peak power limit. In [20], Rahbari-Asr proposed a one-way V2G optimization management method that considered multiple energy suppliers.
The price-based DR mechanism can effectively guide the charging and discharging operation of EVs connected to the grid. However, from the perspective of the whole life cycle, the carbon emission reduction of EVs relying on thermal power generation is limited. The power consumption of EVs per kilometer is about 0.15 KWH. If thermal power generation is mainly used for charging, the carbon emission intensity of the EV generator set is about 0.96 kg/KWH, and the carbon emission is about 0.144 kg/km, while the carbon emission of traditional fuel vehicles is about 0.197 kg/km. The advantages of EVs are not obvious [21]. Therefore, scholars consider the adoption of effective mechanisms to encourage EVs to use clean energy to charge. This will significantly reduce carbon emissions. Based on the carbon trading mechanism, a low-carbon scheduling model considering carbon emissions is proposed in [22], and the impact of grid integration of EVs and wind power on the balance of economy and environment is expounded. Starting from the interests of both EV aggregators and thermal power companies, in [23], Meng aimed to balance the interests of both parties in the carbon trading market, provided a calculation method for carbon quotas for EVs, and explored the incentivizing effect of the carbon quota mechanism on users. Based on the view of game theory, in [24], Ma comprehensively discussed the incentivizing and guiding roles of electricity price and carbon quota on the charging and discharging behavior of EVs. Considering the balance of interests of both sides, an MG optimization scheduling model was built, with EVs as the main body and EV owners as the slave. In [25], a real-time pricing strategy considering carbon emissions and time coupling in the smart grid is proposed, and a binary integer bilevel optimization model with decision making is established. Considering multi-source energy generation on the supply side, the distributed energy generation and load transfer on the demand side, a bilevel stochastic model for real-time demand response is formulated to maximize the benefits [26].
Existing research has shown the potential of RTP in guiding EV charging behavior and that of carbon quotas in promoting low-carbon energy use, but few studies integrate these two incentives to address grid efficiency and transportation decarbonization synergistically. Most of the literature focuses on price-driven demand response or carbon constraints in isolation, lacking systematic analysis of their combined effects on MG and V2G operations. This gap underscores the need to explore how RTP–carbon quota integration can incentivize MGs to optimize EV scheduling, prioritize renewables, and deepen carbon reduction objectives, which are central to China’s dual carbon goals. Table 1 compares the research presented in this paper with current research, and highlights the unique aspects of this paper.
In this paper, we harness the bidirectional influence between the power supplier (PS) and MGs to develop a bilevel programming model that operates under a dual-incentive mechanism incorporating RTP and carbon quota constraints. At the upper level of planning, the PS sets electricity prices with the aim of achieving a balance between supply and demand while maximizing its own benefits. At the lower level, the MG system, which includes PWE sources and EVs, optimizes its benefits while ensuring the driving requirements of EVs are met. The carbon quota mechanism thereby facilitates the consumption of clean energy by EVs, while the RTP-based DR encourages MGs to strategically schedule EVs for grid integration, thereby reducing carbon emissions within the transportation sector and promoting efficient energy utilization in the power industry. The innovations and contributions of this paper are as follows:
Based on the dual-incentive mechanism of RTP and carbon quota, a bilevel programming model that makes full use of the bidirectional influence between PS and MGs is built;
Fully considering the charging and discharging characteristics and driving needs of EVs, the MG integrates PWE to maximize its benefits;
An RTP mechanism based on DR is established, which effectively arouses the enthusiasm of MGs to participate in the operation of the power grid;
Considering the non-convex factors in the model, a bilevel distributed genetic algorithm is designed to solve the bilevel programming problem, which not only protects the privacy of both the supply side and demand side but also improves the operation speed.
The remainder of this paper is organized as follows: The system framework with the PS and multiple MGs (which include EVs and PWE) is presented in Section 2. In Section 3, we introduce the modeling of carbon emissions for the connection of EVs to the power grid. In Section 4, the process of integrating PWE into the grid is described.
The bilevel programming problem of the constructed model is given in Section 5. In Section 6, the algorithm combining the RTP information and the distributed genetic algorithm is designed. In Section 7, numerical simulation experiments are carried out to verify the advantages of the model and algorithm through comparative analysis. Section 8 presents the Conclusions of the study.

2. System Framework

We introduce a smart grid system with one PS and multiple MGs. Each MG is equipped with PWE sources, EVs and a variety of electrical equipment, which can achieve the integration of power resource production and consumption. The EVs have charge and discharge functions; charging can meet driving needs, and discharging can help the power grid’s operation. In order to meet the operational needs of electrical equipment and EVs, the MG can purchase electricity from the PS and can also consume PWE. During peak power consumption, to relieve the pressure of power production on the PS, the MG can collect the discharge power of EVs and the production power of PWE and sell it to the PS. The smart meter embedded with power consumers can realize real-time information exchange between the PS side and the MG side, control the power consumption of the MG, and ensure the safe and effective operation of the grid.
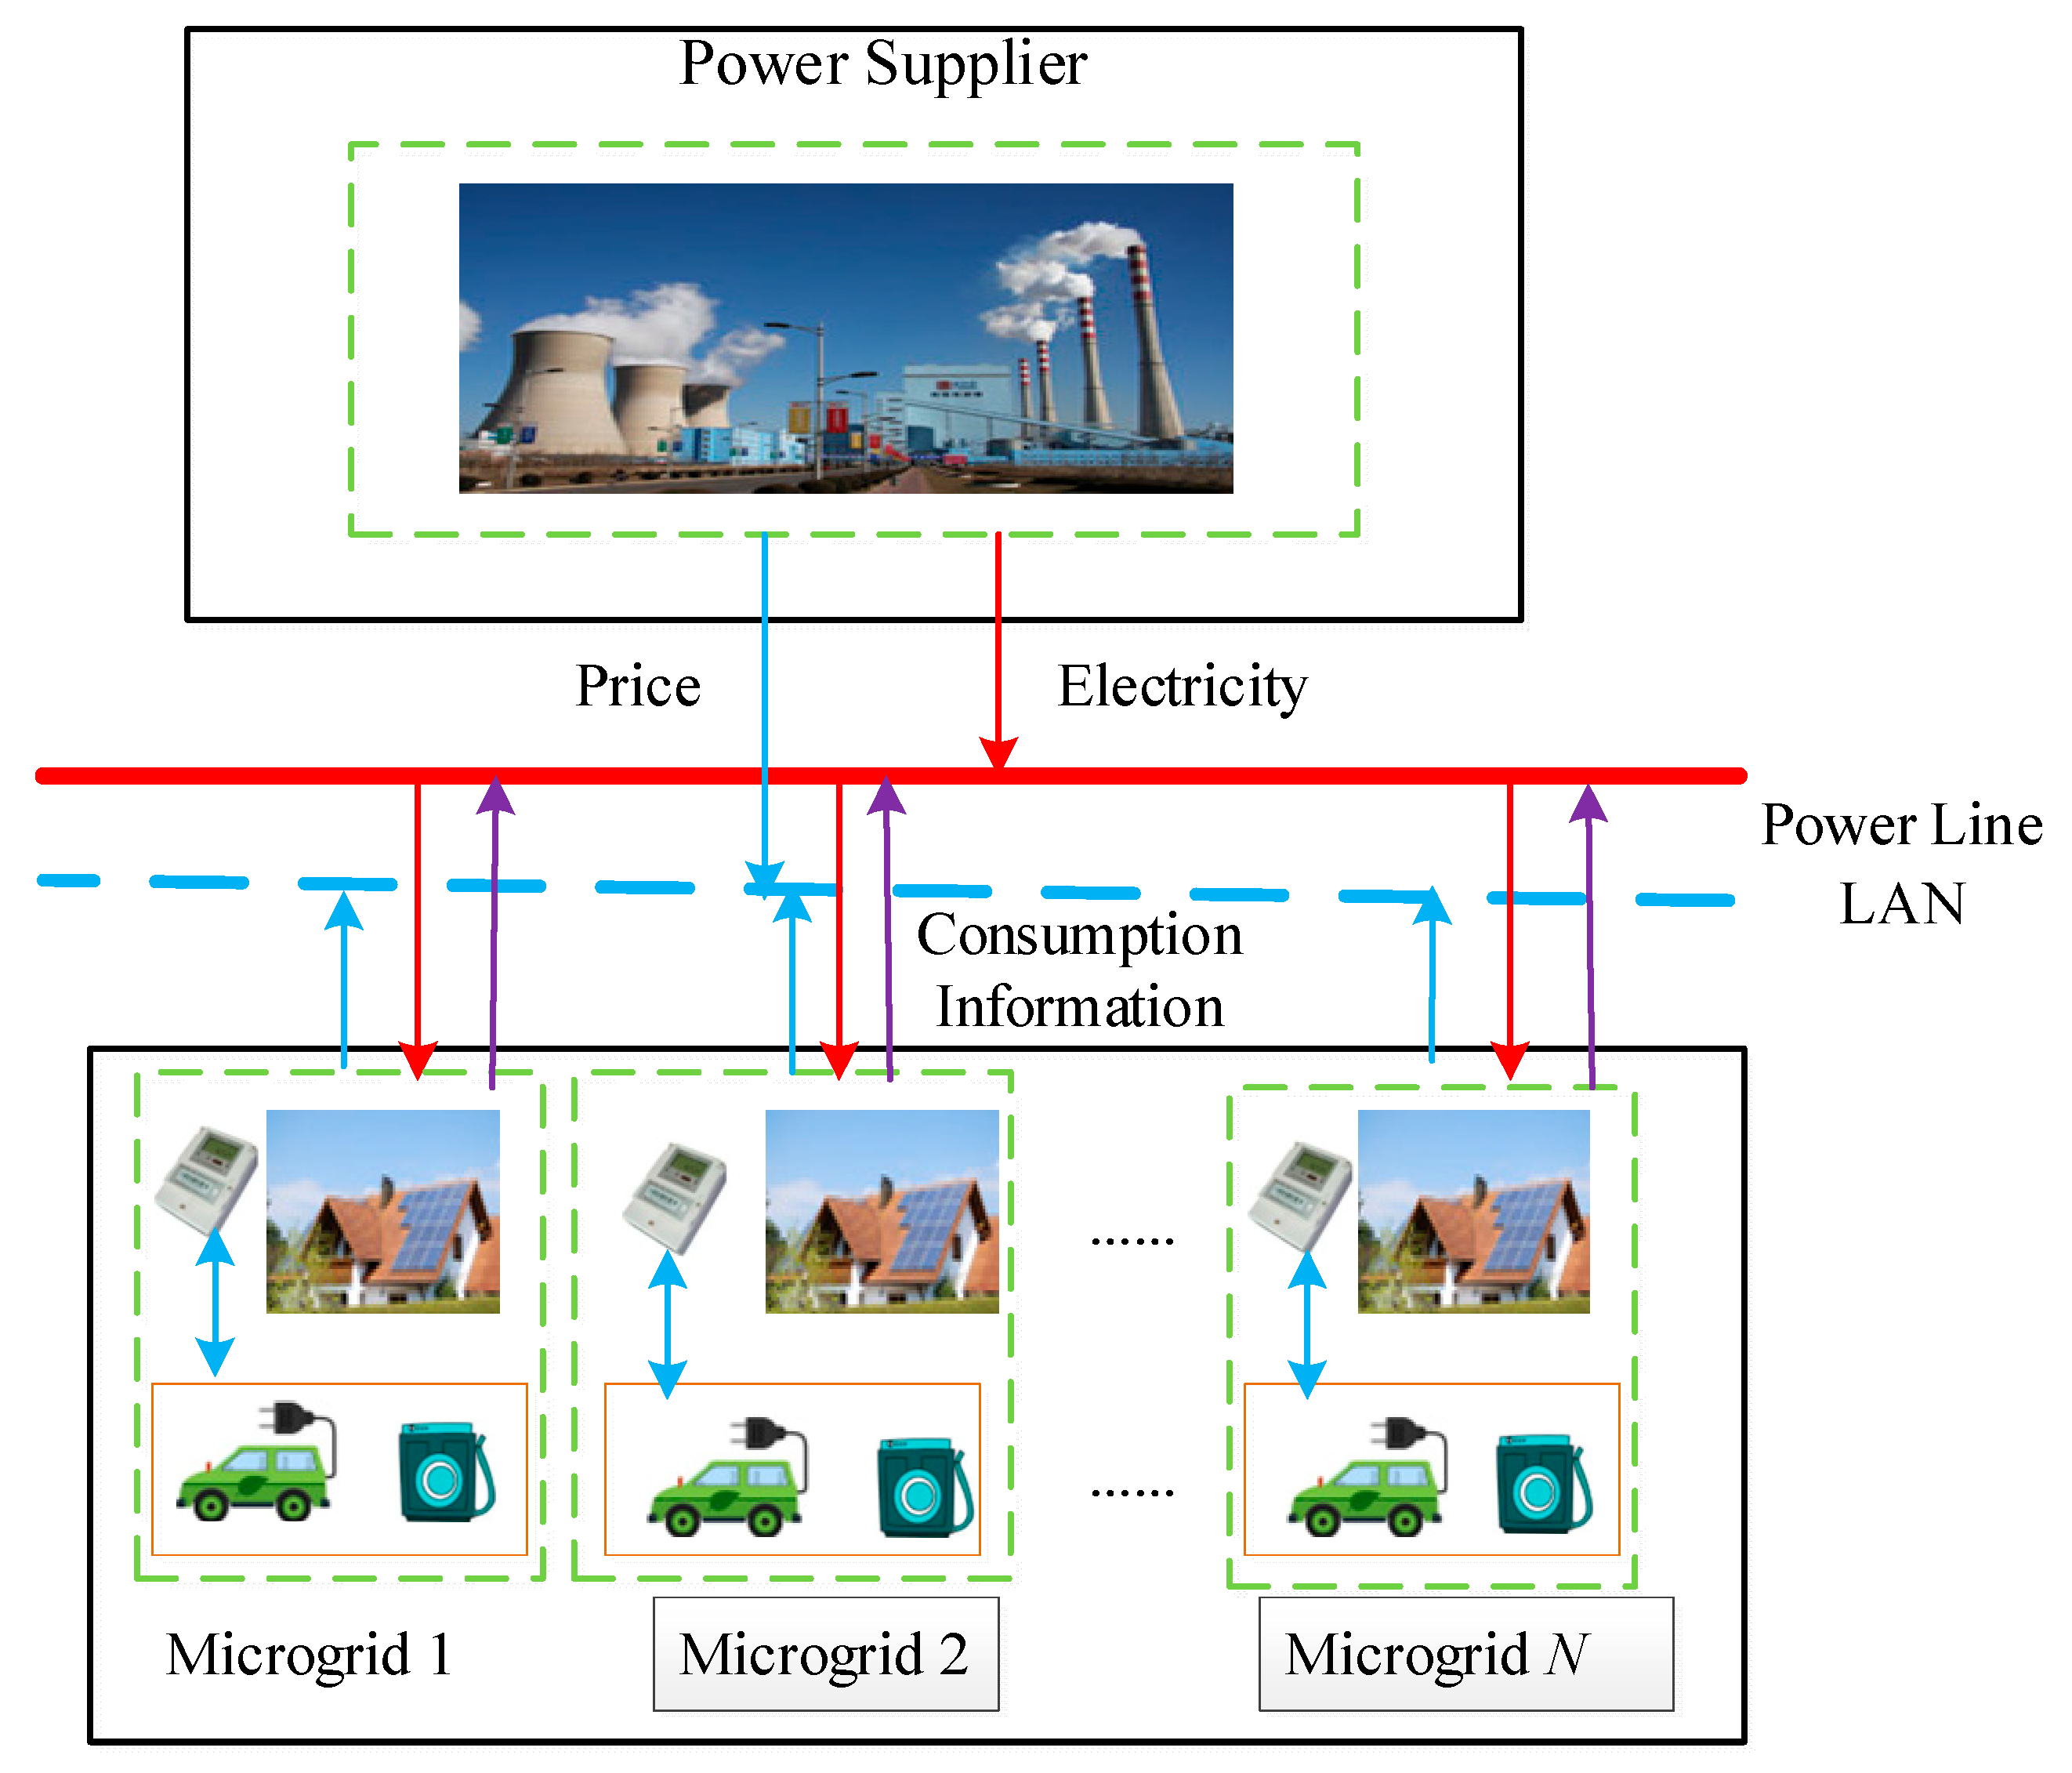
We denote the MG set N = { 1 , 2 , , N } , and each MG i N has Q i EVs, EV q Q i = { 1 , 2 , , Q i } . Suppose one day is taken as a time cycle which is divided into K time slots, in each one, k K = { 1 , 2 , , K } . As illustrated in Figure 1, at the beginning of each time slot, the PS first announces the electricity price to all MGs, and each MG plans the specific amount of PWE, EVs and electrical equipment according to the provided electricity price, with the goal of maximizing its own interests. The PS receives the electricity consumption information of all MGs and updates the electricity price with the goal of maximizing its own interests. This process continues several times until it stops when equilibrium is achieved. In the end, not only can the real-time electricity price be determined; the PS also determines its optimal production power, and the MG defines its optimal power consumption strategy.

3. EVs Connected to the Grid with Carbon Quotas

3.1. EVs’ Charging Requirements

In this paper, the EV is considered an electrical device which is charged to meet the driving demand and a power storage device that can be discharged to relieve power grid pressure when the power supply is insufficient. We let E i , q max and E i , q m i n denote the maximum and minimum storage capacity of EV q of MG i, respectively. The electricity consumption of EV q during time slot k is denoted x E V , i k , q . When x E V , i k , q = x c h , i k , q > 0 , it charges; otherwise, it discharges. When x E V , i k , q = 0 , this means that the EV q is not connected to the grid or is idle.
We let E i , k q denote the amount of electricity stored by the EV q during time slot k; E i , 0 q is the initial storage capacity. Then, we have
E i , k q = E i , 0 q + τ = 1 k x E V , i τ , q ,   i N ,   k K ,   q Q i ,
and
E i , q min E i , k q E i , q max ,   i N ,   k K ,   q Q i .  
The primary task of EVs is to meet driving needs, so the power storage E i , k q of EV q should satisfy
E i , k q = E i , 0 q + τ = 1 k x E V , i τ , q E d r , i q ,   i N ,   k K ,   q Q i ,
where E d r , i q is the amount of electricity required to meet driving needs.

3.2. Carbon Emissions from EV Charging

EVs consume electric energy to meet driving needs, which fully reflect the characteristics of clean and efficient driving, so their carbon emissions can be ignored. However, from the perspective of the whole life cycle, their carbon emissions cannot be ignored. It is worth noting that under the carbon quota mechanism of this study, EVs exhibit significantly higher carbon footprints in the early stages of use compared to internal combustion engine vehicles (ICEVs), mainly due to the high carbon emissions from battery production, including mineral extraction, energy-intensive material refining, and cell assembly, which alone accounts for 20–30% of EVs’ total life cycle’s carbon output. Nevertheless, as usage time increases, EVs’ carbon reduction advantage—driven by clean energy charging—gradually becomes prominent, allowing the carbon emissions from their full life cycle to drop below those of ICEVs. If an MG chooses PWE sources during the charging process, its full cycle’s carbon emissions can be significantly reduced, that is,
x E V , i k , q = x T H , i k , q + x P W E , i k , q .
Here, x T H , i k , q is the active output of the thermal power units, and x P W E , i k , q is the PWE output. The carbon emission of EV q in time slot k of MG i can be expressed as C c h , i k , q , that is,
C c h , i k , q = x T H , i k , q E T H .
Parameter E T H in Formula (5) is the marginal carbon emission factor of EVs, which is the same as the carbon emission factor of thermal power per unit of electricity.
In order to encourage MGs to choose to consume PWE sources, reduce carbon emissions, and promote the orderly operation of EVs, we introduce carbon quotas to reduce the whole life cycle’s carbon emissions.

3.3. Carbon Quota for EVs

The concept of carbon quotas was initially mentioned in the United Nations Framework Convention on Climate Change, which was adopted in 1992, as well as in the subsequent first additional protocol to the Convention, known as the Kyoto Protocol. This introduced market mechanisms as a novel approach through which to address greenhouse gas emissions, with carbon dioxide representing the main target. It proposed carbon dioxide emission allowances as a tradable commodity, which gave rise to what is now known as carbon trading. In the context of EVs, carbon quotas refer to the allocated reduction quotas for carbon dioxide emissions, reflecting the amount by which EVs decrease carbon dioxide emissions compared to traditional fuel-powered vehicles during their usage.
Suppose C d r , i k , q is the amount of carbon emissions reduced by EV q during driving compared to fuel cars, excluding charging-related carbon emissions [22].
C d r , i k , q = x E V , i k , q L E V , i q E f .
Here, L E V , i q is the number of miles traveled per unit of electricity of the q EV in MG i, and E f is the marginal carbon emission factor of a fuel vehicle. The carbon quota obtained by the q EV in MG i during time slot k is M E V , i k , q :
M E V , i k , q = C d r , i k , q C c h , i k , q .
The revenue from carbon credits for the EV q is U C , i k , q ( x E V , i k , q ) :
U C , i k , q ( x E V , i k , q ) = P C k M E V , i k , q ,
where P C k is the unit price of EV carbon allowances during time slot k.

3.4. Utility and Cost Functions of EVs

The operation of EVs can meet the needs of MGs and achieve a certain degree of satisfaction, which is described by a utility function in economics. In this paper, a logarithmic function with monotonically increasing and diminishing marginal utility is introduced as follows:
U E V , i k , q ( x E V , i k , q , ω E V , i k , q ) = β E V , i k , q ln ( ω E V , i k , q x E V , i k , q + 1 ) ,   i N ,   k K ,   q Q i ,
where β E V , i k , q and ω E V , i k , q are positive real numbers.
In order not to damage the service life of the battery, the stored energy should not be lower than the specified threshold, that is, E i , q t h : = ( 1 D O D i , q t h ) E i , q min , and D O D i . q t h is the ideal maximum discharge depth for EV q. Therefore, the cost of energy storage during time slot k can be expressed as
C E V , i k , q = a E V , i k , q E i , q max + b E V , i k , q ( E i , q t h E i , q k ) .
Here, the first item is the investment cost, and the second one is the operating cost, which is proportional to the change in the energy storage level (i.e., the charge and discharge rate) of the EV.

4. Photovoltaic and Wind Energy

The photovoltaic system in each MG absorbs solar energy and converts it into electricity by connecting multiple photovoltaic panels. The actual output power of the photovoltaic system is related to solar radiation intensity, ambient temperature, and the rated power of the photovoltaic panel. Here, the relationship between photovoltaic power output and these factors is given as follows [27]:
x P V , i k = [ P P V , i r a t e d ( G c / G P V , i ) ( 1 η P V , i ( T c T P V , k ) ) ] ( N P V s N P V p ) ,
where P P V , i r a t e d is the actual output power of the photovoltaic system, and G c and G P V , i are the solar radiation intensity and photovoltaic panel reference radiation intensity, respectively. The temperature parameter is η P V , i , and the temperatures of the photovoltaic system and photovoltaic panels during time slot k are T c and T P V , k , respectively. The rated power and actual power of the photovoltaic panel are N P V s and N P V p , respectively.
Due to the inherent randomness of wind energy, the output of wind turbines always exhibits significant volatility. In general, the actual wind speed characteristics follow the Rayleigh distribution [28], which is described below:
f W T ( v k ) = ( μ / γ ) ( v k / γ ) μ 1 exp [ ( v k / γ ) μ ] ,
Here, v k represents the actual wind speed during time slot k, and γ and μ are the scale factor and shape factor, respectively. Therefore, the output power of the wind turbine is given as follows [29]:
x W T , i k ( v k ) = 0 , v k < v i n , v k > v o u t v k v i n v r a t e d v i n P W T , i r a t e d , v i n v k v r a t e d , P W T , i r a t e d , v r a t e d < v k < v o u t
where P W T , i r a t e d is the rated power, and v r a t e d , v i n and v o u t are the rated wind speed, minimum and maximum input wind speed, respectively.
The PWE considered in this paper mainly includes photovoltaic power generation and wind power generation:
x P W E , i k = x P V , i k + x W T , i k .
Although they incur almost no cost for electricity generation, there are still certain installation costs and maintenance costs incurred during operation. The corresponding quadratic cost function is expressed as follows [30]:
C ( x P W E , i k ) = δ P W E , i ( x P W E , i k ) 2 + σ P W E , i x P W E , i k ,
0 x P V , i k P P V , i r a t e d ,
0 x W T , i k P W T , i r a t e d .

5. Bilevel Programming Problem

A bilevel programming model is constructed to characterize the objective function of both the PS side and the MG side. In the upper-level program, the PS adjusts the electricity prices on the premise of ensuring its revenue; in the lower-level program, each MG optimizes its electricity consumption strategies for PWE sources, EVs, and electrical equipment at the given prices to maximize its own benefits.

5.1. Upper-Level Programming Problem

In the grid system, the PS determines the power supply for the MGs and acts as the dominant player. Furthermore, when the MGs have power surplus, the main grid purchases the excess power to avoid waste, reduce power generation costs, and maximize overall benefits. The formulation of the upper-level program is given as follows:
max k = 1 K p 1 k i = 1 N x B , i k p 2 k i = 1 N x S , i k C ( G k ) ,
s . t .   G k min G k G k max ,
p 1 min p 1 k p 1 max ,
p 2 min p 2 k p 1 k ,
G k + i = 1 N x P W E , i k + q = 1 Q x d i s c h , i k , q = i = 1 N x L o a d , i k + q = 1 Q x c h , i k , q ,
where x B , i k and x S , i k are the electricity purchased and sold by the MG i from the main grid during time slot k, respectively. The corresponding purchase and sale prices are p 1 k and p 2 k , respectively. The power load consumed by the MG i is denoted as x L o a d , i k , and the charging and discharging capacities of EV q are x c h , i k , q and x d i s c h , i k , q , respectively.
The first item of the objective function represents the profit of the PS from selling power to MGs, the second term denotes the subsidy revenue gained by the PS for absorbing the surplus power of MGs, and the third term corresponds to the power generation cost. Let G k represent the power supplied by the PS during time slot k; then, G k [ G k min , G k max ] . The cost function C k ( G k ) for generating G k should be monotonically increasing and convex. In power systems, a quadratic function is generally adopted as follows [14]:
C k ( G k ) = a k G k 2 + b k G k + c k ,
where the parameters a k > 0 , b k , c k 0 are known.

5.2. Lower-Level Programming Problem

Each MG in the power system operates independently, and its electricity demand is determined by the MG type, which is described by distinct parameters. Factors including time of day, climate conditions and electricity prices all have an impact on electricity demand. This means that for the same electricity price, different types of MGs will exhibit heterogeneous responses, which can be depicted by a utility function. The utility function should align with the actual utility of the MG, while satisfying two basic assumptions: (1) it is a non-decreasing function, and (2) it satisfies diminishing marginal utility, i.e., the utility function is concave. A piecewise linear function is a technique that approximates a complex function by simulating the original function curve with a broken line connecting a series of points on the original function curve. The main advantage is that its form can be arbitrarily synthesized, has high flexibility and good general performance, and can be approximated to any curve. Based on these characteristics, we choose the piecewise linear utility function as the utility function of EVs [9] in the following form:
U i ( x L o a d , i k ) = c 1 x L o a d , i k ,   x L o a d , i k [ 0 , d 1 ] , c 2 x L o a d , i k + ( c 1 c 2 ) d 1 ,   x L o a d , i k ( d 1 , d 2 ] , c n x L o a d , i k + ( c 1 c 2 ) d 1 + + ( c n 1 c n ) d n 1 , x L o a d , i k ( d n 1 , d n ] ,
where x L o a d , i k is the power load of MG i. The parameters d f ,   f = 1 , , n , are the interval division points, which satisfy d 1 < d 2 < < d n ,   d n = M i ( k ) . In order to ensure the utility function U i ( x L o a d , i k ) is monotonically increasing and concave, the elasticity coefficients c e satisfy c e > c e + 1 > 0 , e = 1 , , n 1 . The utility of each MG using different power consumption is also different, which is reflected by the division points d f , the number of division points n , the maximum power consumption d n , and the elastic coefficient c e , which themselves are distinguished by different values. The piecewise linear utility function can thus approximate the actual utility of each MG to the greatest extent.
In the lower-level program, each MG achieves optimal energy dispatch management based on the price given by the main grid. In fact, changes in energy strategies will directly affect MG satisfaction, so it is more reasonable to consider the utility of MGs. To maximize the benefits of each MG, we construct the following model:
max k = 1 K U i ( x L o a d , i k ) + q = 1 Q U E V , i k , q ( x E V , i k , q , ω E V , i k , q ) + q = 1 Q U C , i k , q ( x E V , i k , q ) q = 1 Q C E V , i k , q C ( x P W E , i k ) p 1 k x B , i k + p 2 k x S , i k
x E V , i k , q = x T H , i k , q + x P W E , i k , q ,
x E V , i k , q = x c h , i k , q , or   x E V , i k , q = x d i s c h , i k , q ,
x L o a d , i k = x L o a d , i T H , k + x L o a d , i R E , k ,
x B , i k = x L o a d , i T H , k + q Q x T H , i k , q ,
x S , i k = x P W E , i k x L o a d , i P W E , k q Q x P W E , i k , q ,
x L o a d , i k + q Q x c h , i k , q u c h , i k , q + x S , i k v S , i k x P W E , i k q Q x d i s c h , i k , q u d i s c h , i k , q x B , i k v B , i k = 0 ,
u c h , i k , q + u d i s c h , i k , q 1 ,
v S , i k + v B , i k 1 ,
u c h , i k , q , u d i s c h , i k , q , v S , i k , v B , i k { 0 , 1 } .
The first term of the objective function is the sum of three utility functions: the utility of function loads, the utility of EVs in meeting driving demands, and the revenue from carbon quotas. The second term is the sum of two types of costs, namely the operating costs of EVs and PWE. The last term is the difference between the revenue from electricity sales and the cost of electricity purchases.
Here, constraints (26) and (28) specify that the electricity consumption of EV charging and functional loads can be supplied by two sources: thermal power generation and PWE generation. An EV q can be in either a charging or discharging state, and constraint (27) enforces this requirement. The purchased electricity is primarily used to satisfy functional load demands and EV charging needs, and constraint (29) reflects this relationship. Constraint (30) points out that PWE can be sold to the grid only after meeting functional load demands and EV charging requirements. The equivalence relation between electric quantities is defined by constraint condition (31). As considered in this paper, EVs cannot charge and discharge simultaneously, and each MG can only engage in either electricity purchase or sale at any given time. These requirements are guaranteed by the remaining constraints.

6. Distributed Real-Time Pricing Genetic Algorithm

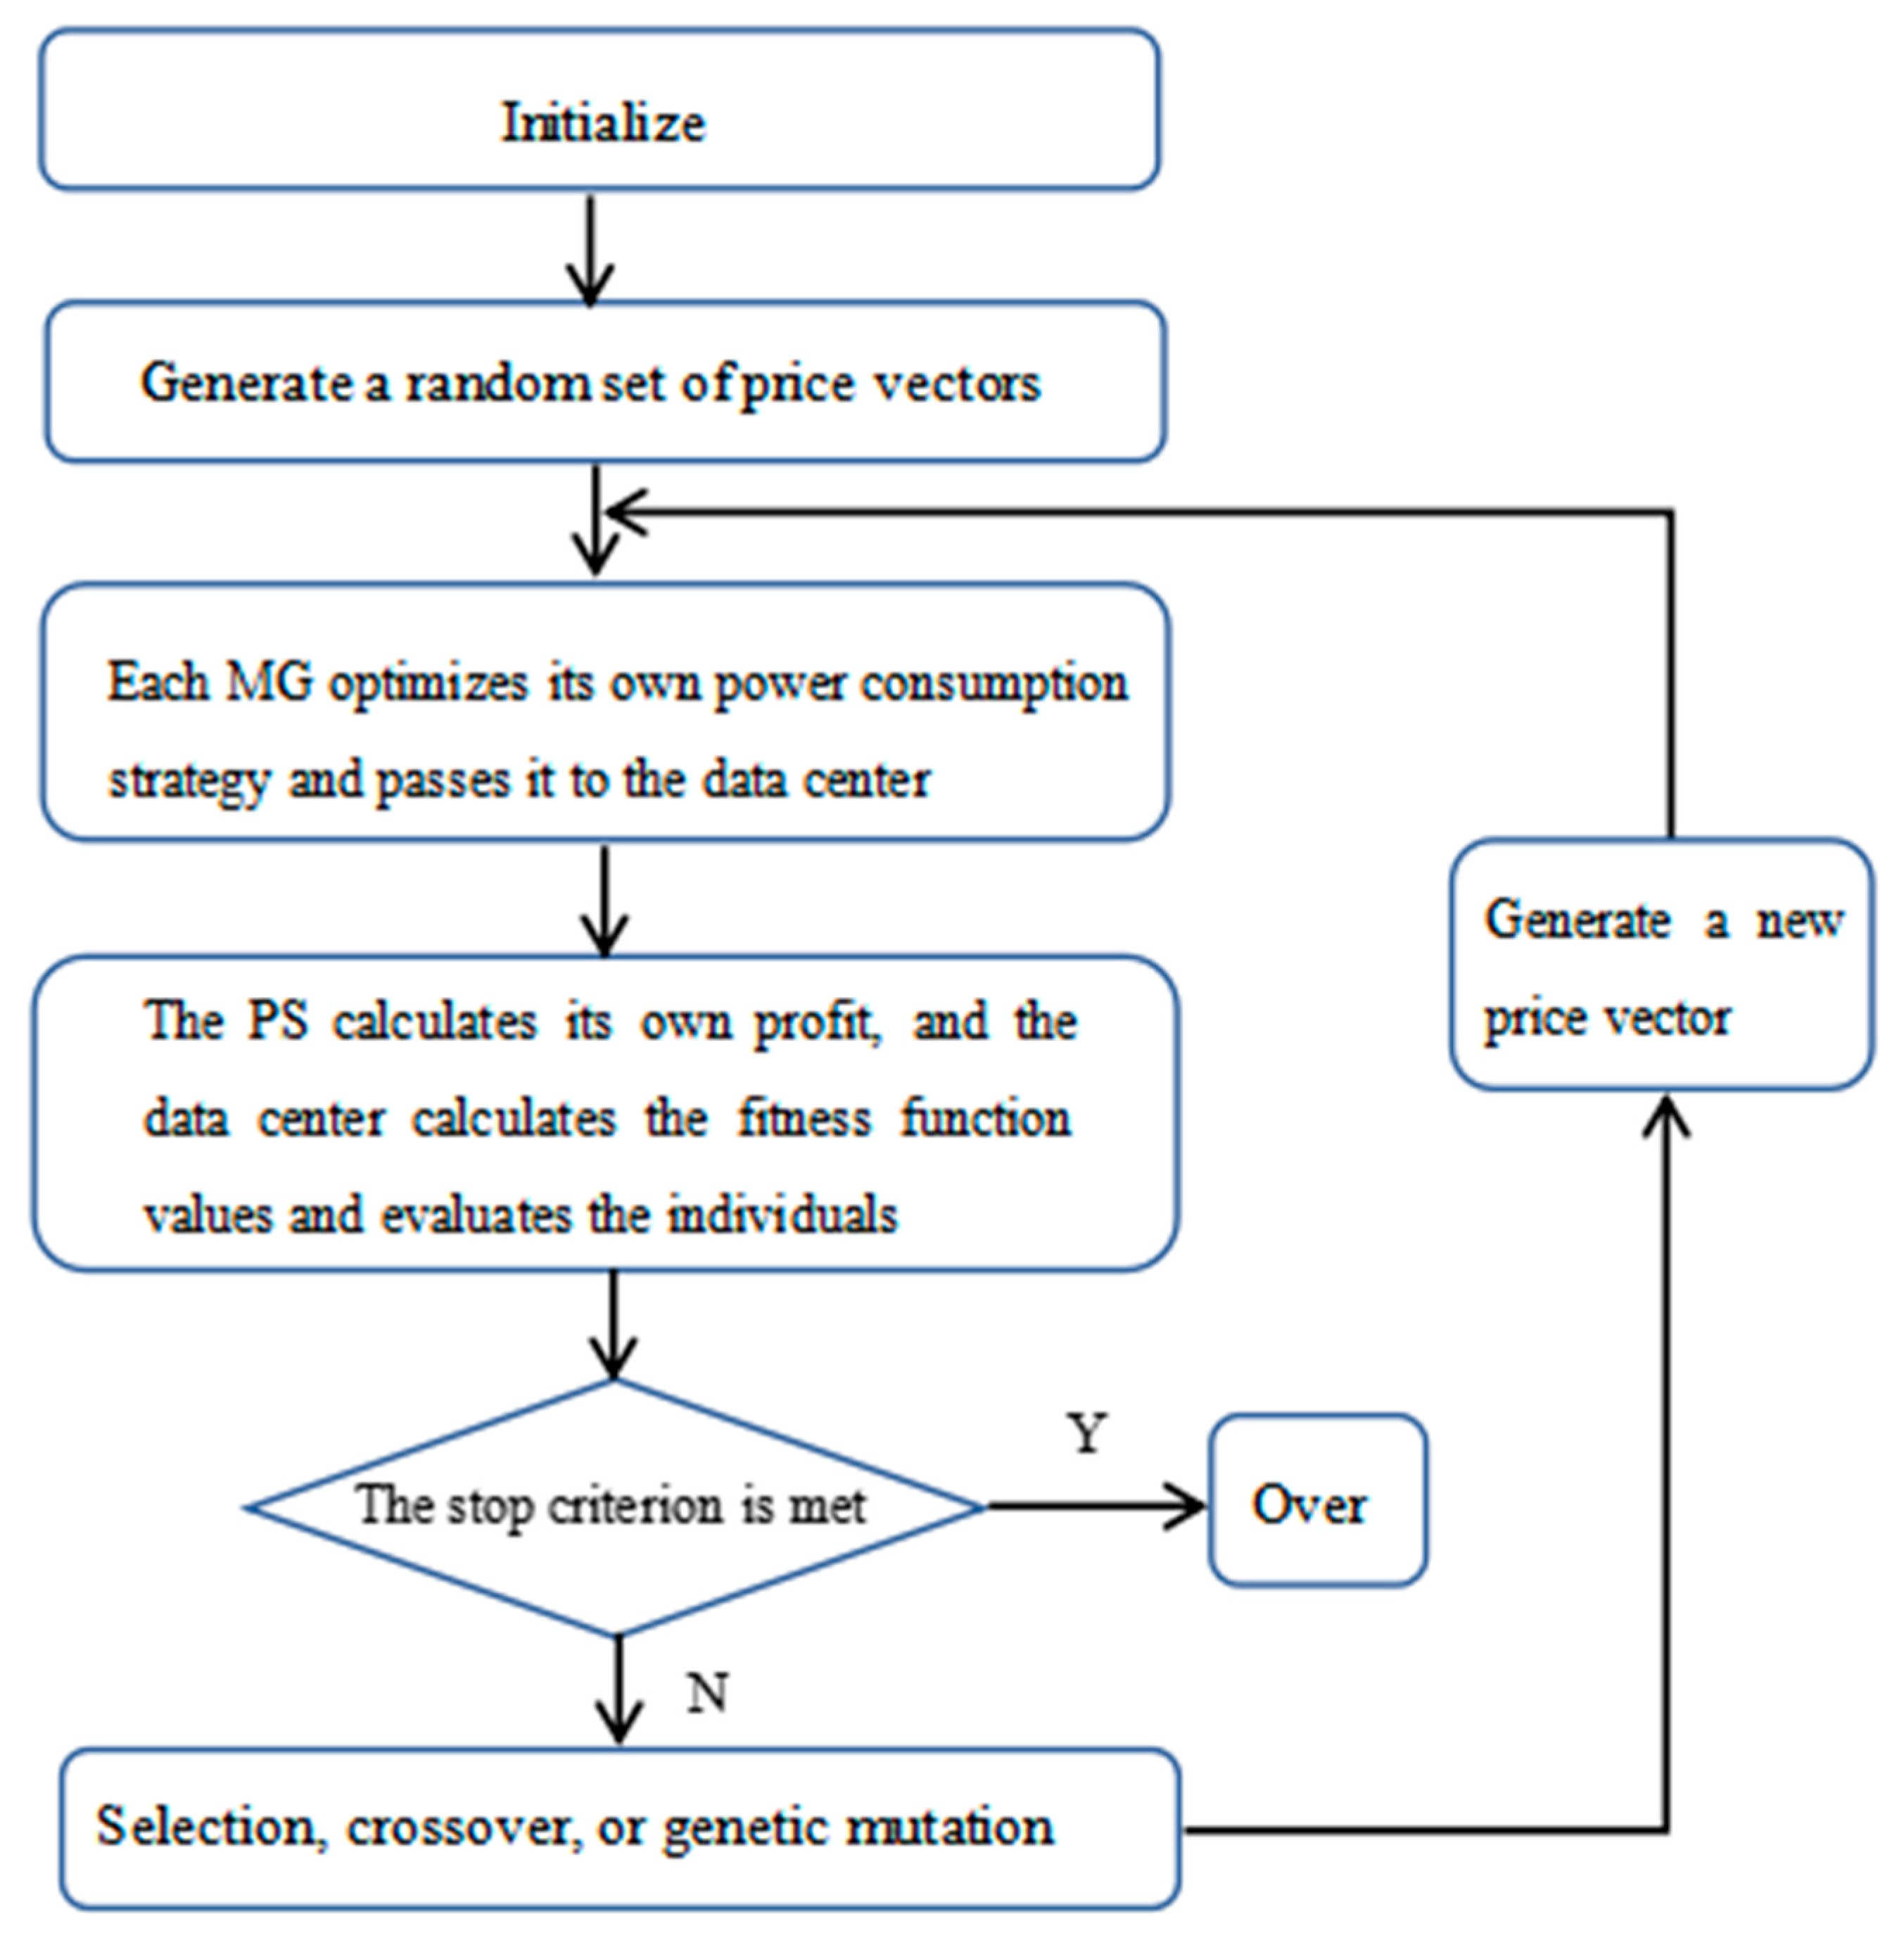
Here, we design a distributed real-time electricity price genetic algorithm to solve the model, where the Algorithm 1 is first applied to solve the lower-level program and then Algorithm 2 is used to solve the entire bilevel programming model. Using the distributed RTP genetic algorithm proposed in this paper, the optimization problem of each MG in the lower level can be solved independently in each price iteration. This approach not only preserves the privacy of individual MGs but also reduces the computational complexity. Through the implementation of this distributed genetic algorithm, the PS’s optimal electricity pricing scheme and the optimal energy scheduling strategy of each MG can be derived. The algorithm is divided into two modules, i.e., the MG module and the overall model module, with the specific algorithm flow illustrated in Figure 2.
Algorithm 1: Genetic algorithm of MG i.
Step 1: Set the maximum number of evolutions for the lower-level program to T1 and the size of the initial solutions to n1, { x j , 0 } j = 1 , 2 , , n 1 as the initial solutions. The individual gene length and the predefined maximum satisfaction are l1 and F1, respectively. The probability of gene crossover and mutation are denoted pm and um, respectively. The termination condition is λ τ + 1 λ τ < ε , where τ is the number of iterations;
Step 2: The MG receives the electricity price p = { p 1 , p 2 } provided by the PS then calculates its corresponding satisfaction value, which is defined as the objective function of (18), and each MG is evaluated according to it;
Step 3: Selection, crossover, and mutational genetic manipulation produce new generations of MGs { x j , k } j = 1 , 2 , , n 1 . The optimal MG is selected, and if the maximum satisfaction is achieved, the optimal solution of the lower-level planning is obtained. Otherwise, repeat the above steps until the maximum number of iterations T1 is reached or satisfaction exceeds the predetermined maximum F1.
Algorithm 2: Genetic algorithm for the whole grid.
Step 1: Set the maximum number of evolutions for the genetic algorithm to T2 and the number of initial solutions to n2, p 1 0 , p 2 0 as the initial solutions. The individual gene length and maximum satisfaction are l2 and F2, respectively. The probability of gene crossover and mutation are denoted pm and um. The termination condition is λ τ + 1 λ τ < ε . Here, the initial solution is the vector composed of the price of each time slot. Set the number of initial iterations to 1;
Step 2: Send all the price vectors p 1 τ , p 2 τ to each MG. Each MG employs the genetic algorithm to calculate its optimal power consumption strategy { x j , * } j = 1 , 2 , , n 1 under different prices and transmits it on to the data center;
Step 3: The data center calculates the upper-level optimization objective function k = 1 K p 1 k i = 1 N x B , i k p 2 k i = 1 N x S , i k C ( G k ) and takes it as the satisfaction function. Compare the corresponding satisfaction of different MGs, and evaluate every one accordingly;
Step 4: Selection, crossover, and mutational genetic manipulation produce new generations of prices p 1 τ + 1 , p 2 τ + 1 . The optimal MG is selected, and if the maximum satisfaction is achieved, the optimal solution p 1 * , p 2 * of the whole model is obtained. Otherwise, repeat the above steps until the maximum number of iterations T2 is reached or satisfaction exceeds the predetermined maximum F2.

7. Numerical Simulation

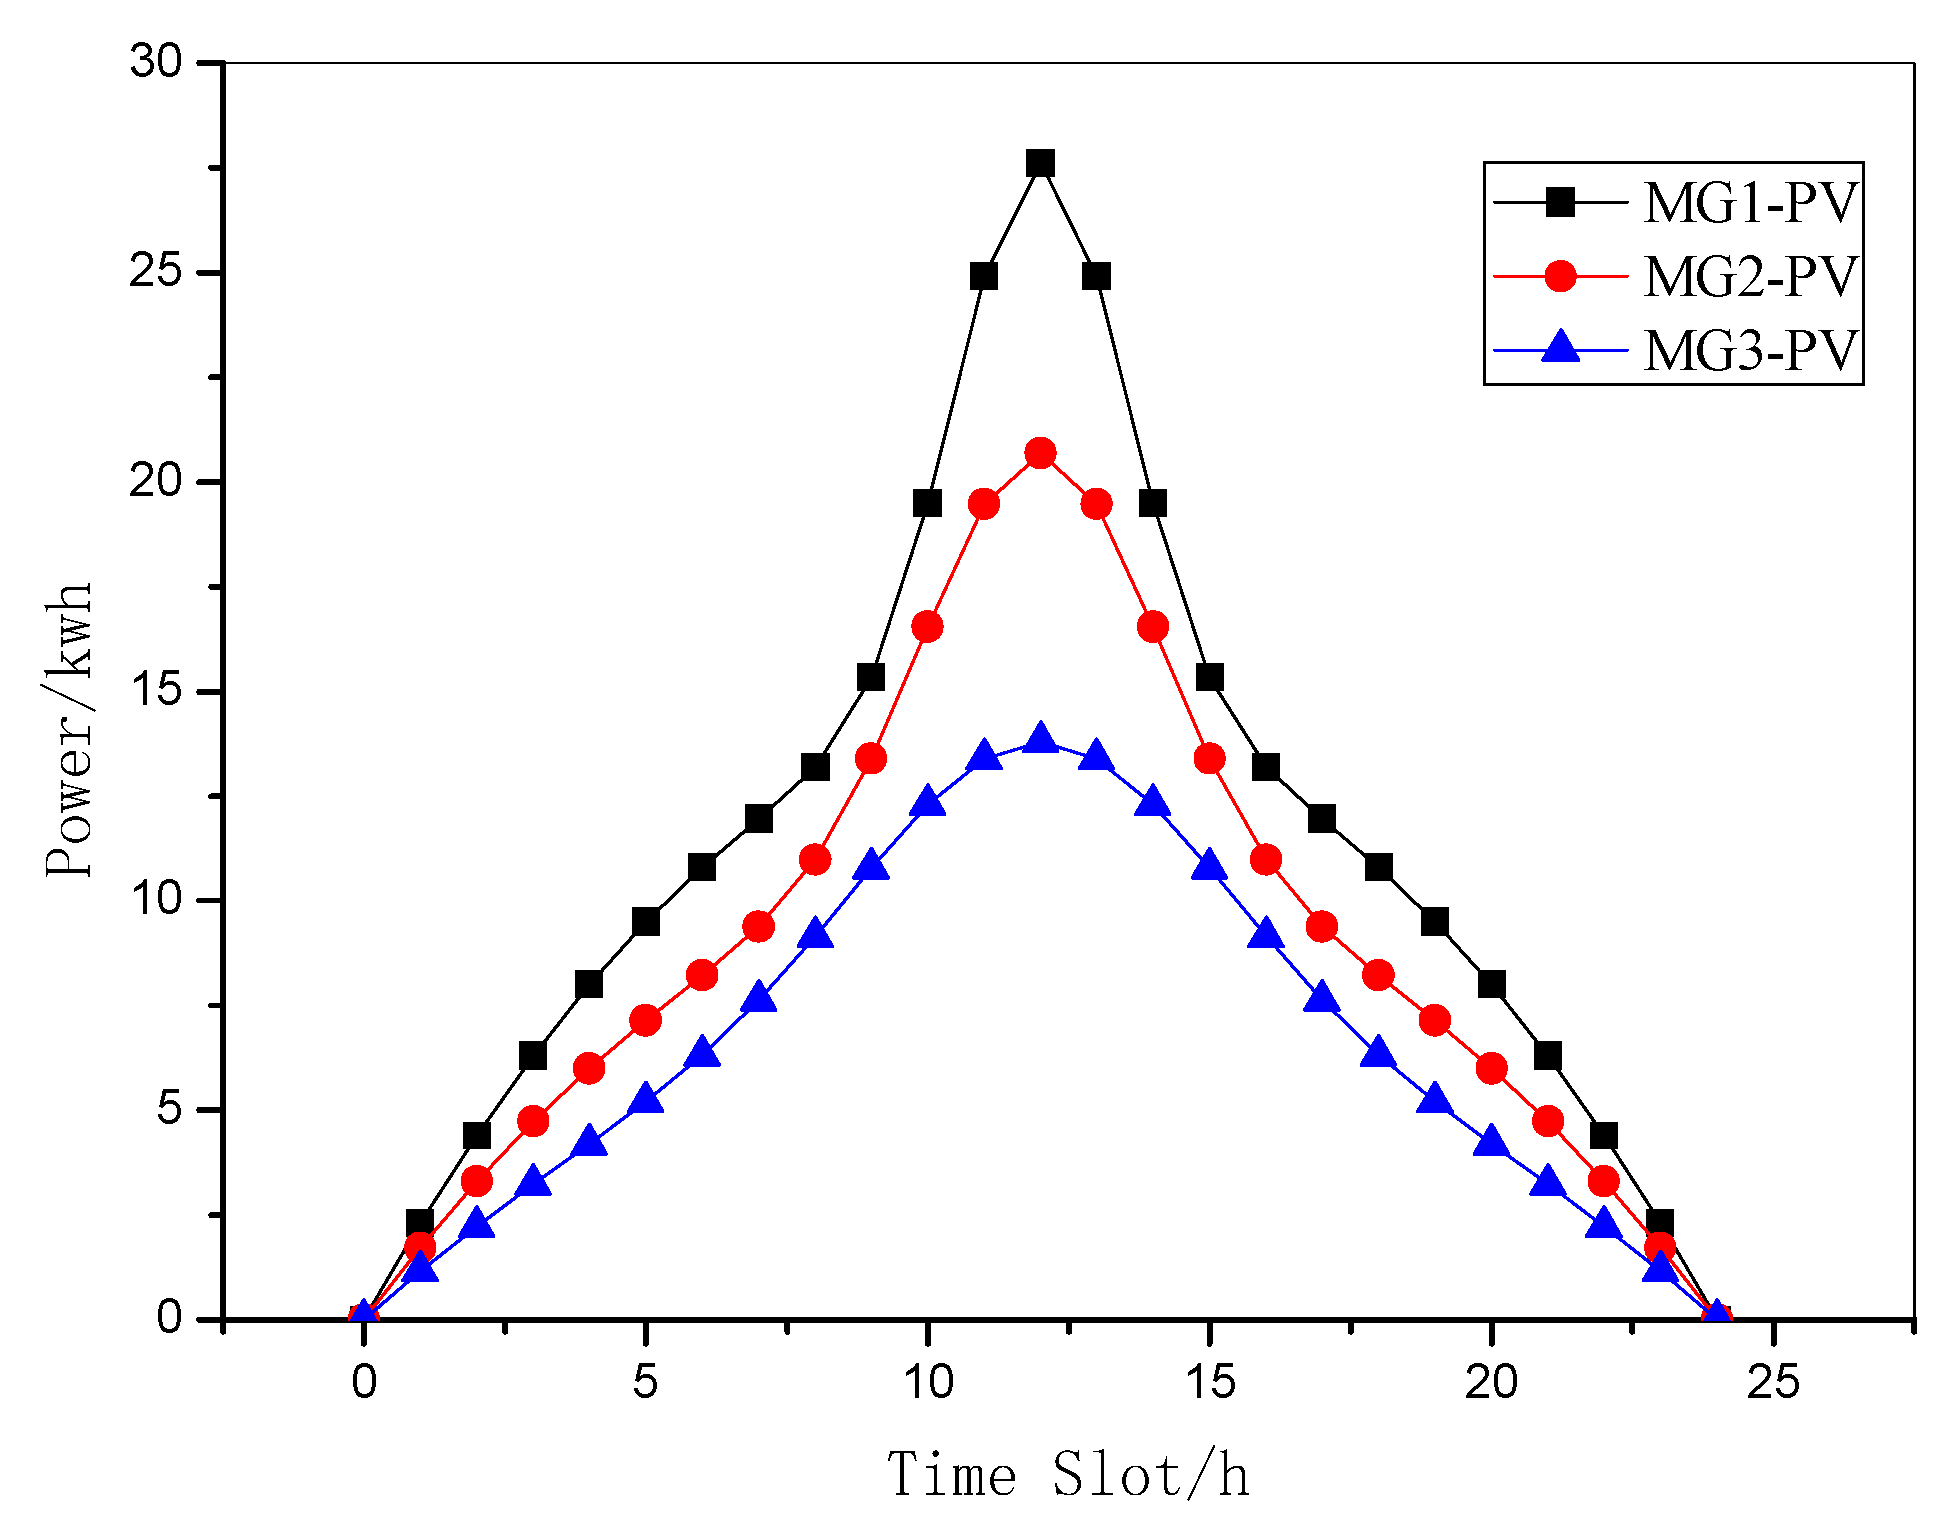
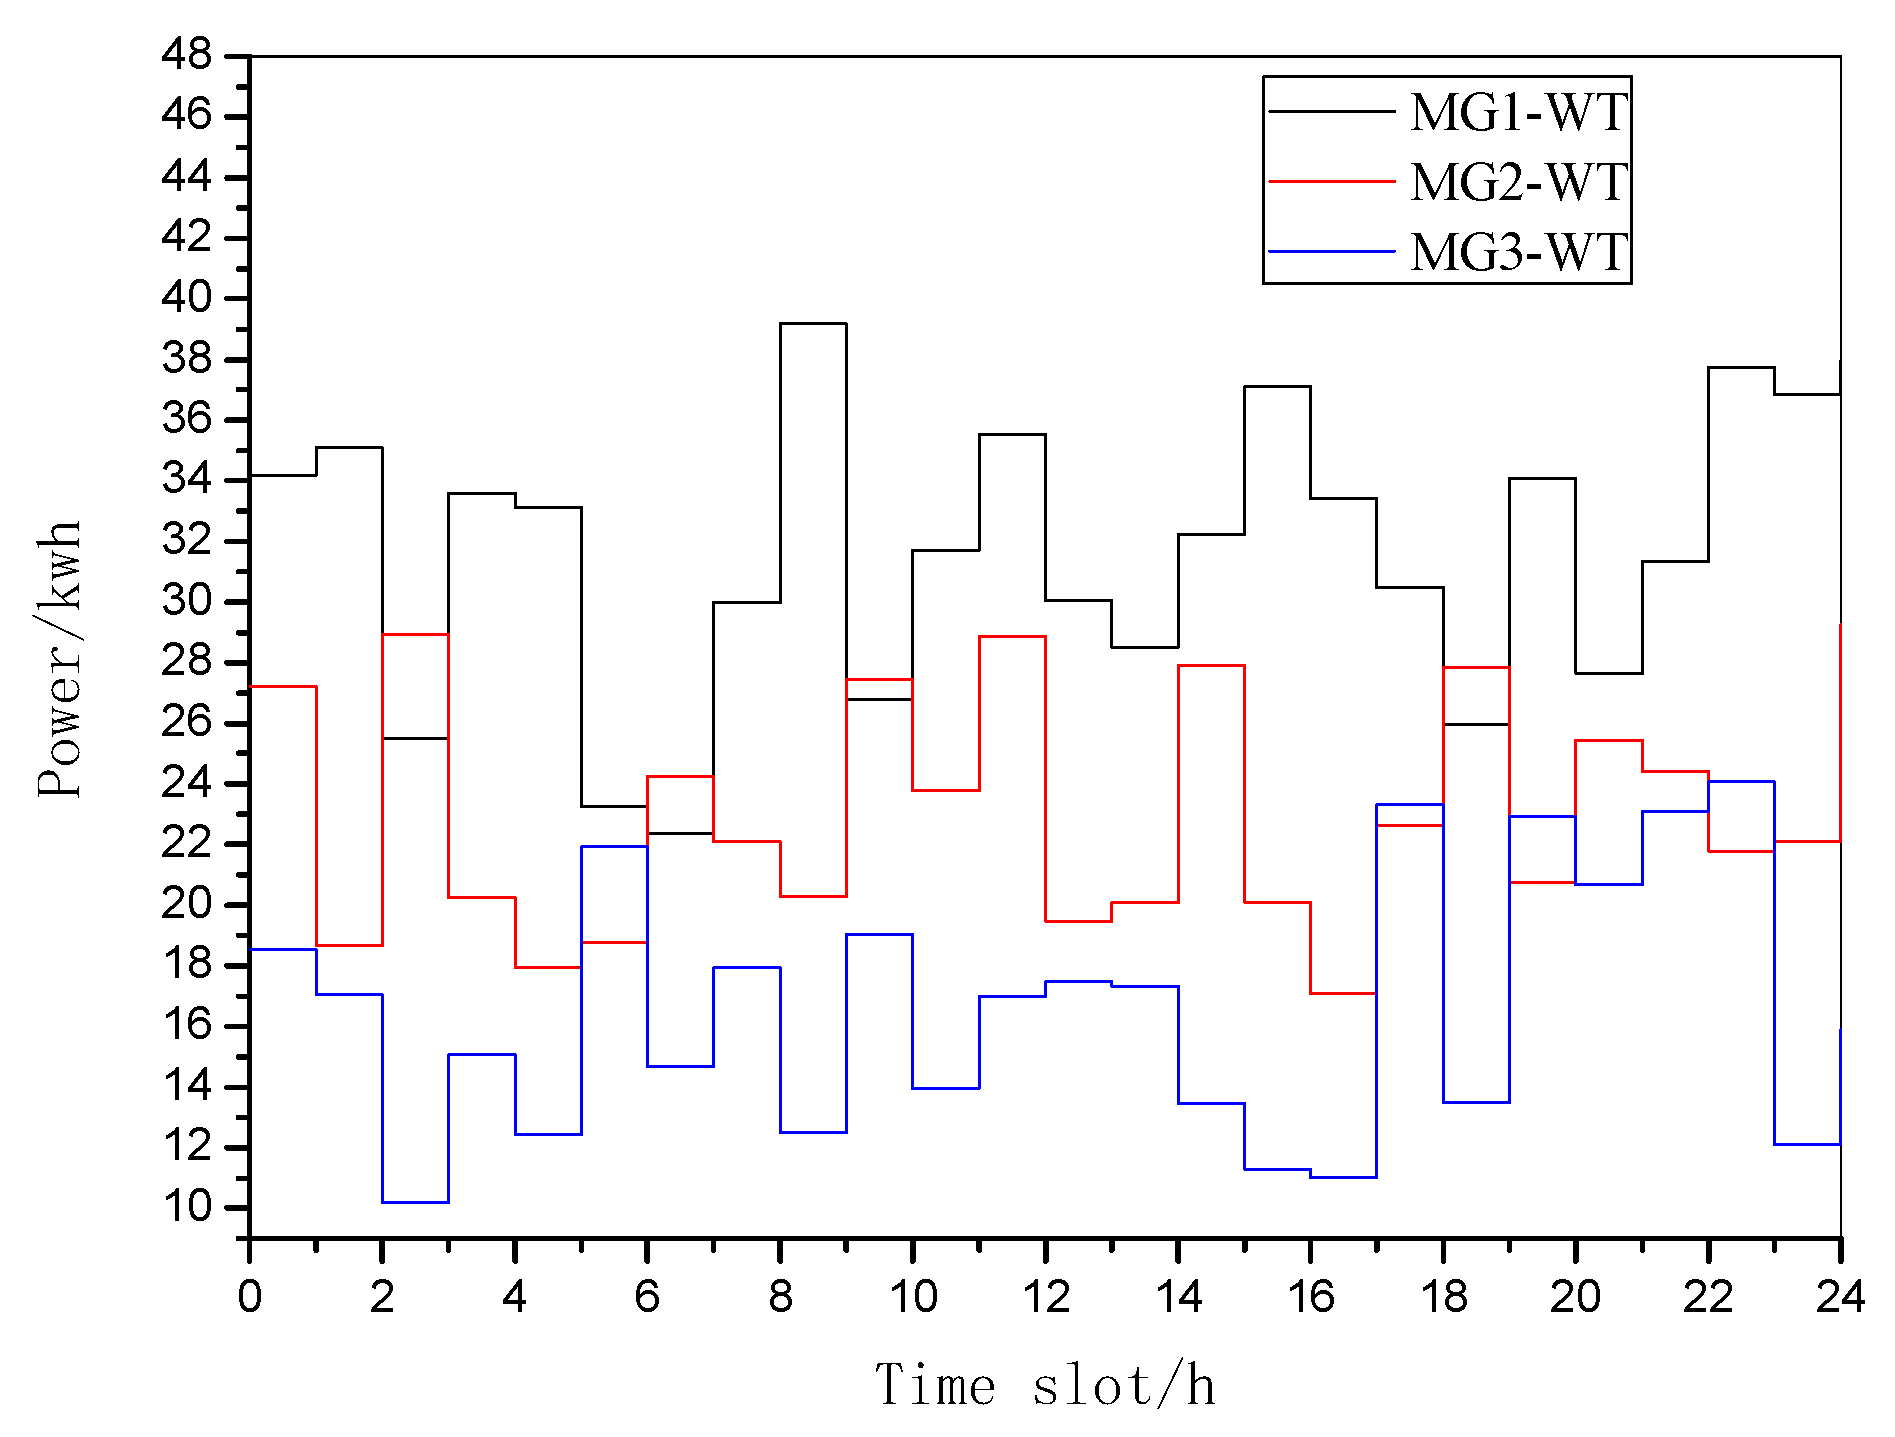
In this section, the feasibility of the proposed bilevel programming model and the effectiveness of the V2G scheme are verified through numerical simulation. We consider a grid system consisting of one PS and three MGs. The 24 h in a day is divided into 24 periods with an interval of one hour. In this paper, we consider wind power and photovoltaic power generation. The specific parameters describing wind energy and photovoltaic power generation are shown in Table 2. Wind power and photovoltaic power generation 24 h a day are shown in Figure 3 and Figure 4.
It is assumed that each MG is equipped with 10 EVs. The carbon emission per unit mileage of fuel vehicles is 1.6 L, and EVs can travel 5 km by consuming 1 kW h . The EV is charged with a fixed power, and the battery has a constant charging power of 2.5 kW.
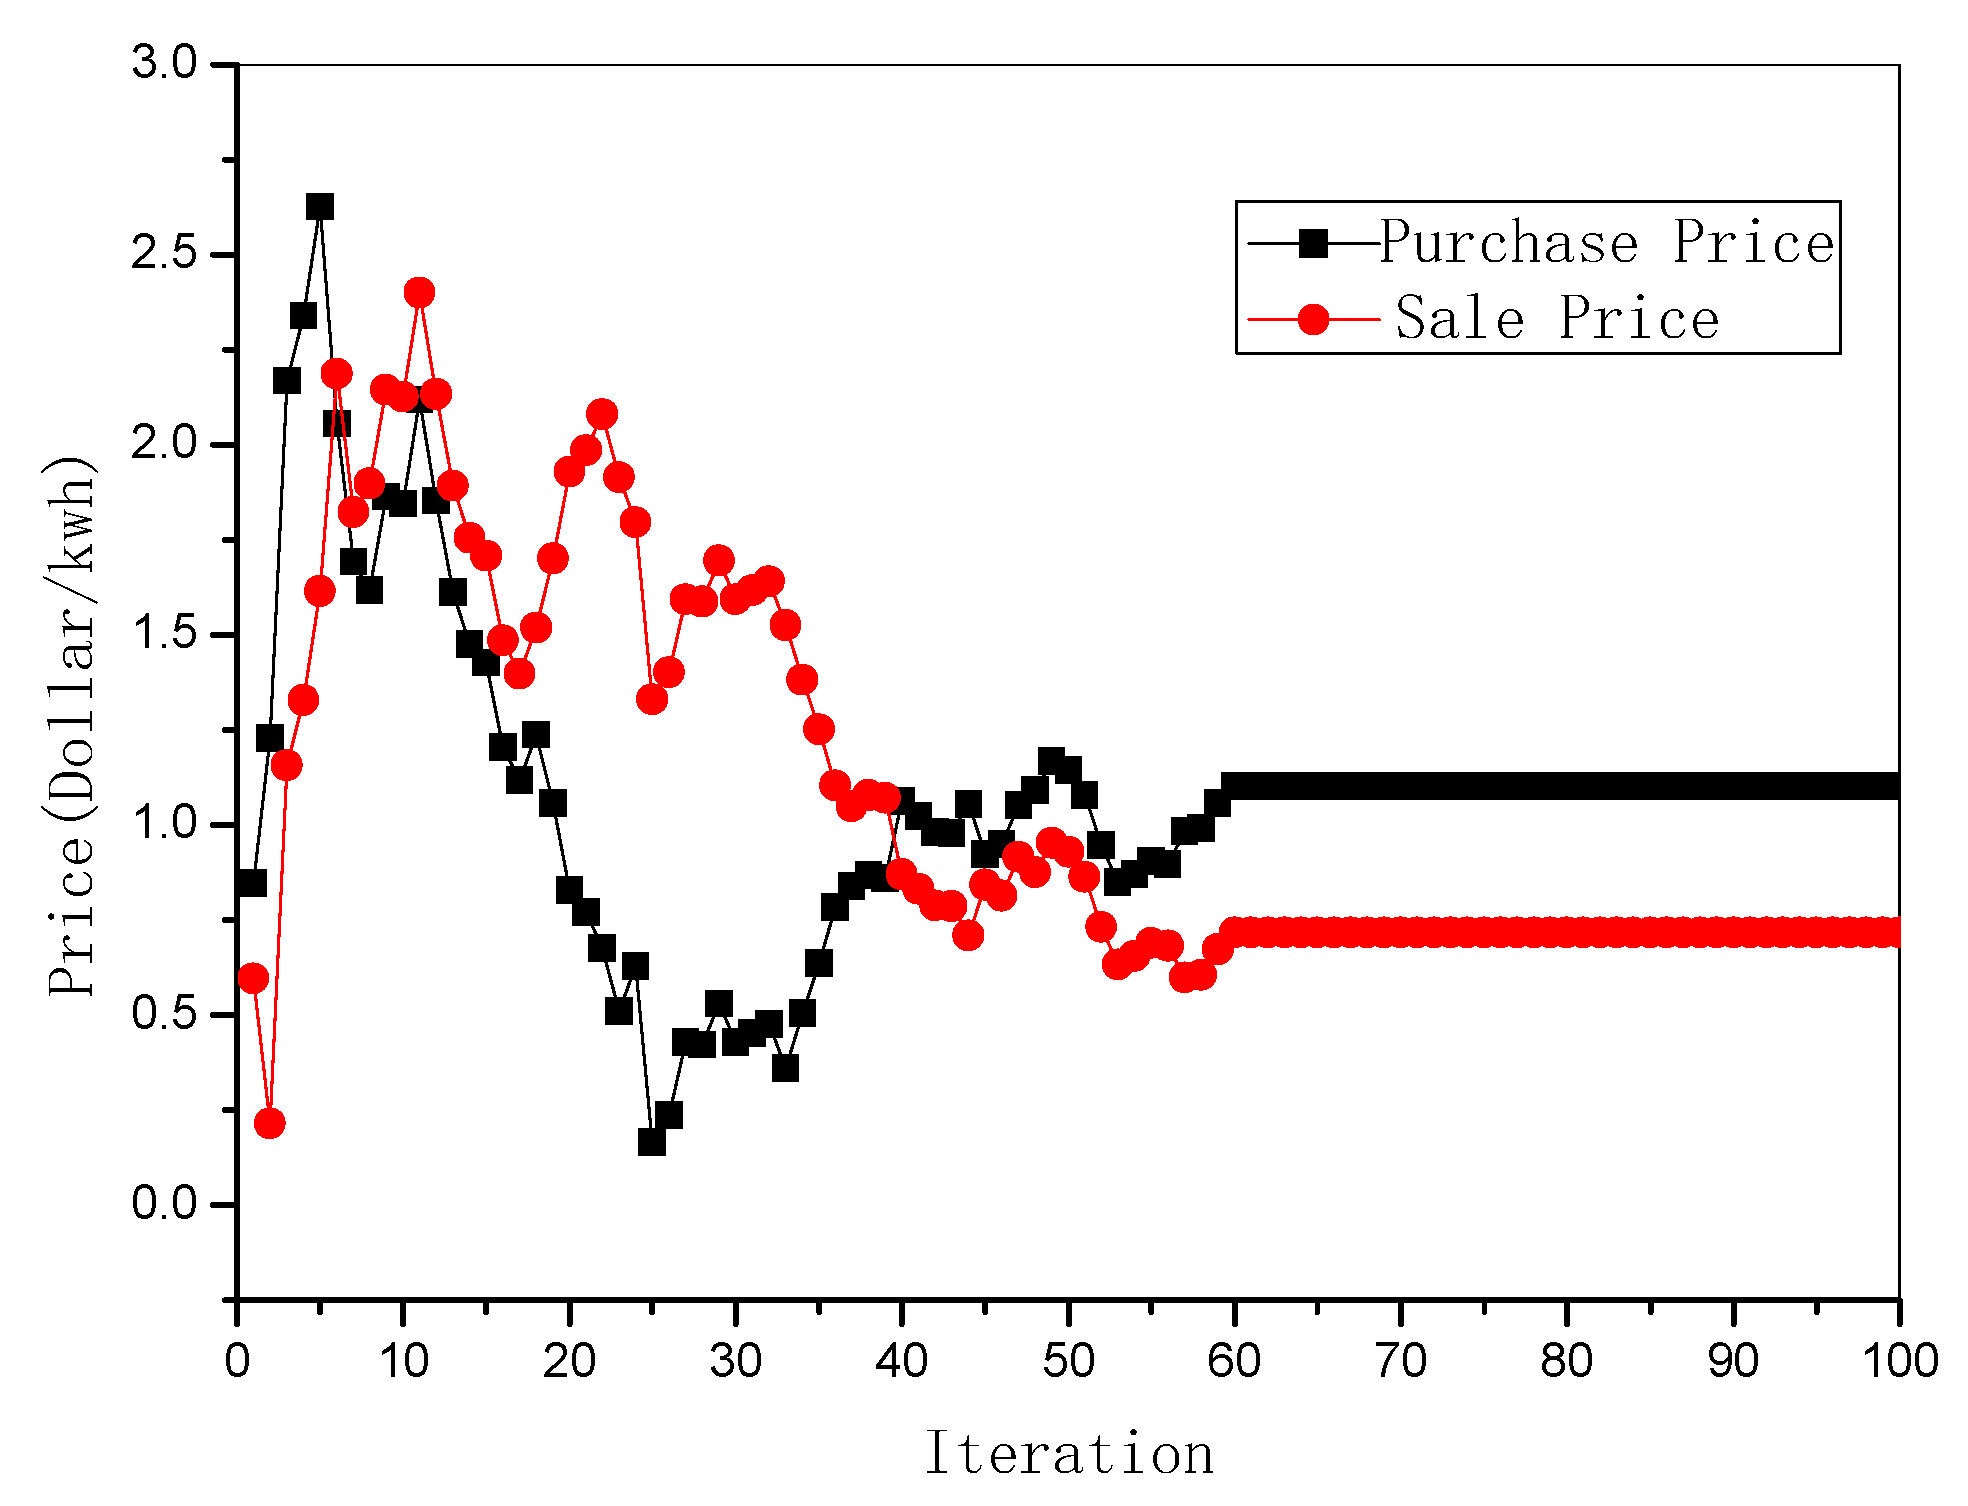
Figure 5 shows the convergence of the electricity purchase and sale prices. At the start of each time slot k, each MG receives the electricity price provided by the PS, optimizes its own power consumption strategy based on the price vector, and transmits the optimized strategy to the data center. The PS then calculates its own profit and sends the result to the data center, which further computes the fitness function value and conducts a global evaluation. Subsequently, genetic manipulations, selection, crossover, and mutation are performed, and convergence conditions are finally met. It can be seen in Figure 4 that the algorithm converges after 61 iterations, with a relatively fast convergence rate. On the MG side, the purchased electricity is supplied by the thermal power owned by the PS, while the sold electricity corresponds to the surplus power generated by PWE sources. When the electricity price of PWE is lower than that of thermal power generation, the MG side will prioritize the consumption of electricity produced by PWE. Meanwhile, the PS side will actively purchase the electricity produced by PWE when there is a shortage of power supply. This process demonstrates the low-cost nature of PWE, facilitating its integration into the grid and achieving the goal of reducing carbon emissions.
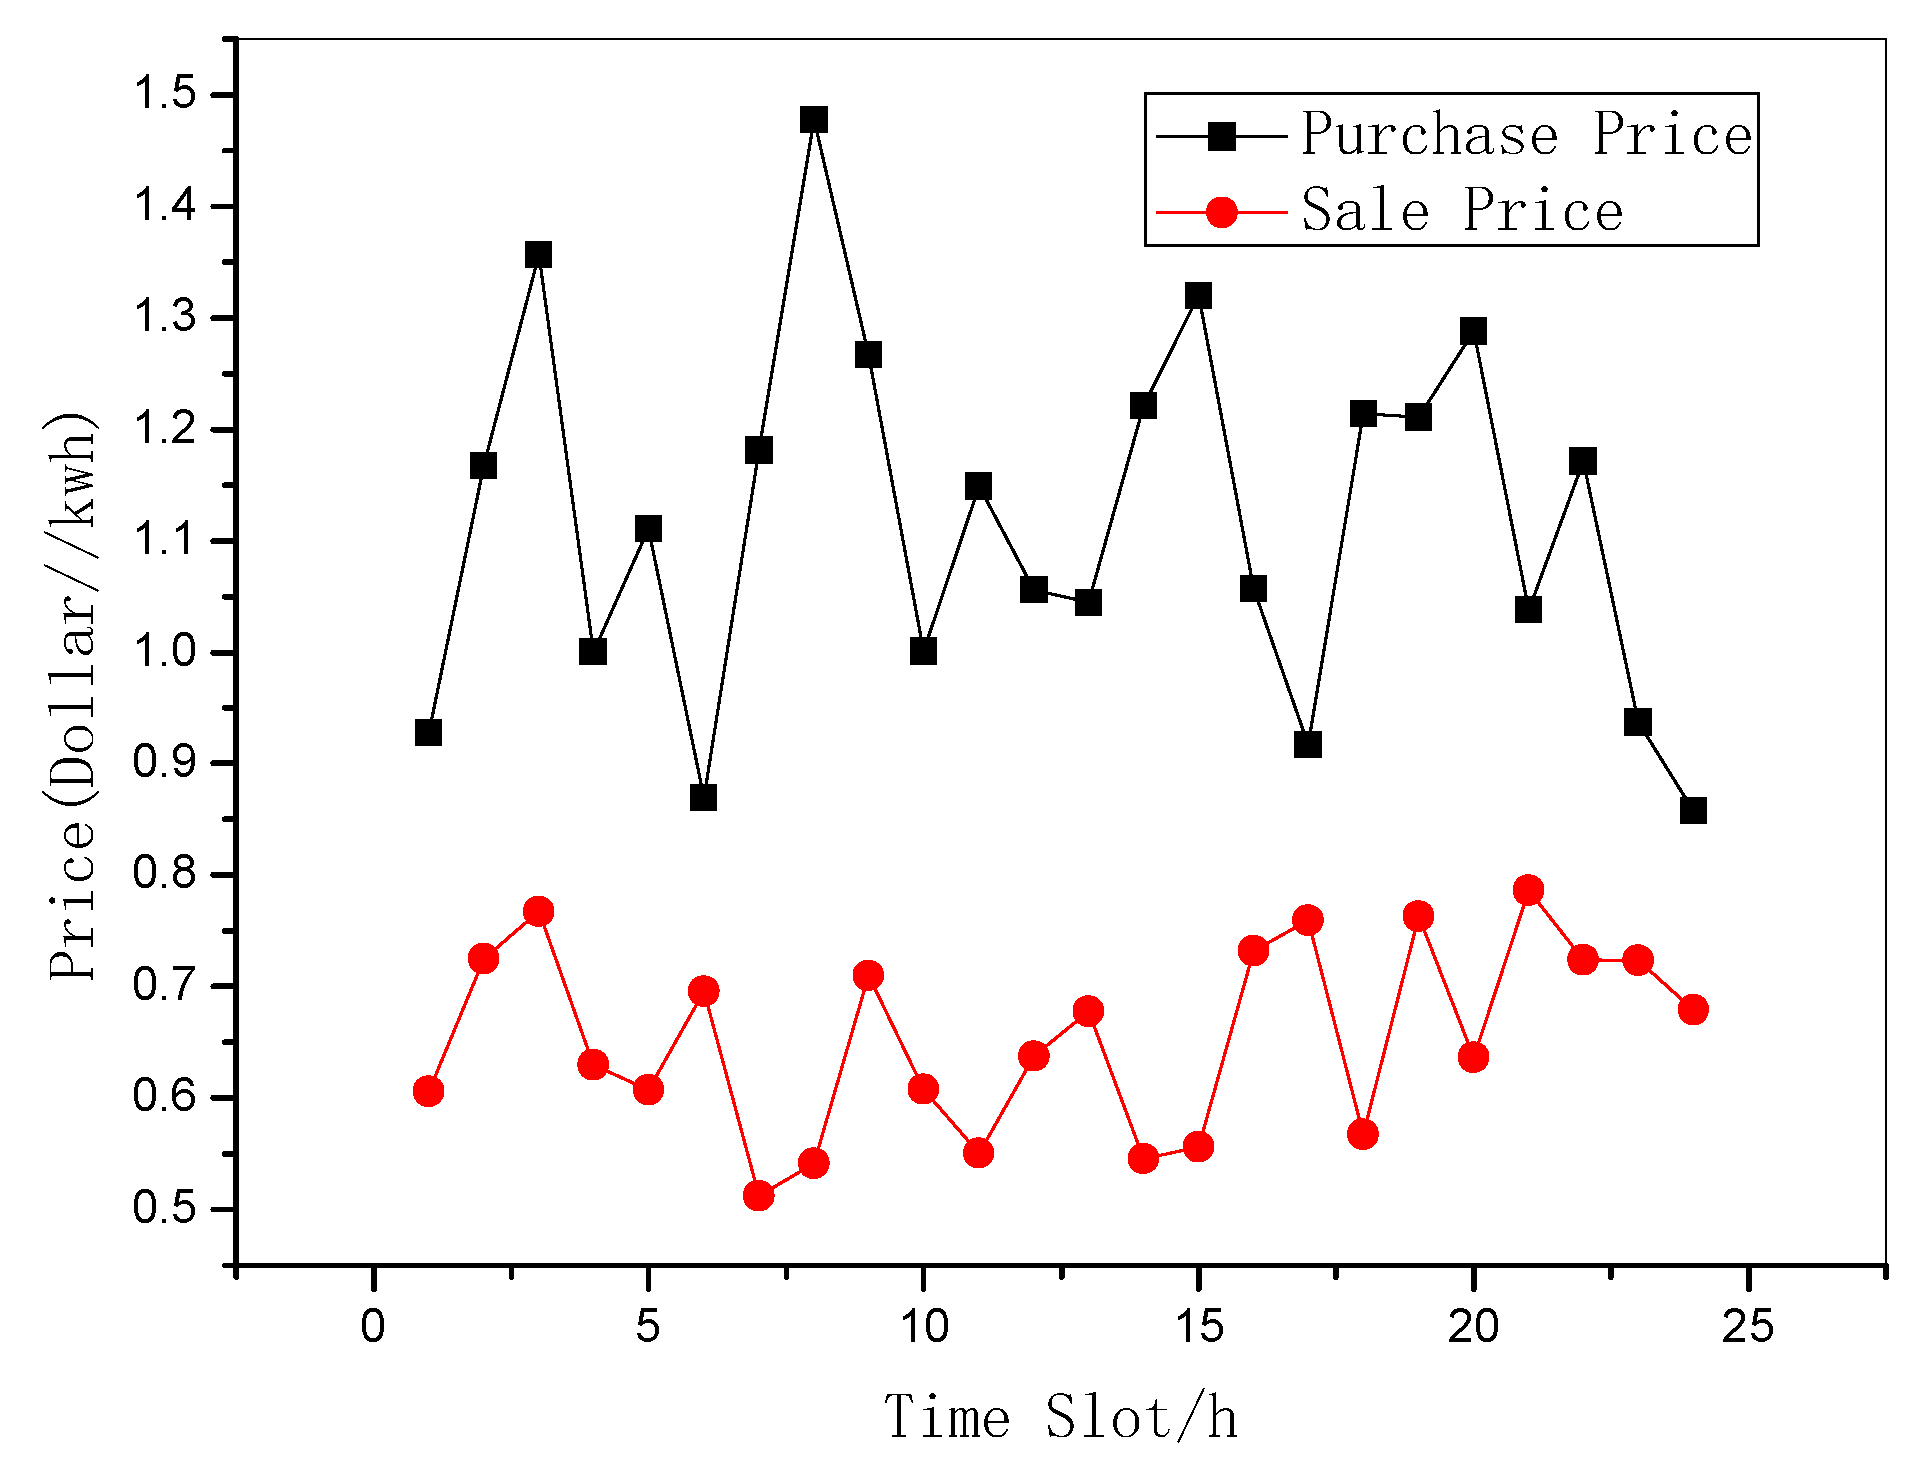
Figure 6 shows the comparison between the purchase price and the sale price of the MG in a 24 h time slot. On the one hand, the RTP over the 24 h can serve as a decision making reference for MGs to formulate electricity consumption strategies, while the PS side can formulate electricity production plans according to the sold price. On the other hand, it can be seen that the purchase price of MGs is higher than the sale price, and MGs will try their best to choose their own PWE to reduce the cost of electricity. Correspondingly, the purchase price of the PS is lower than their own sales price, and the PS is encouraged to buy excess power from MGs. This will help society to achieve the goal of energy conservation and carbon emission reduction.
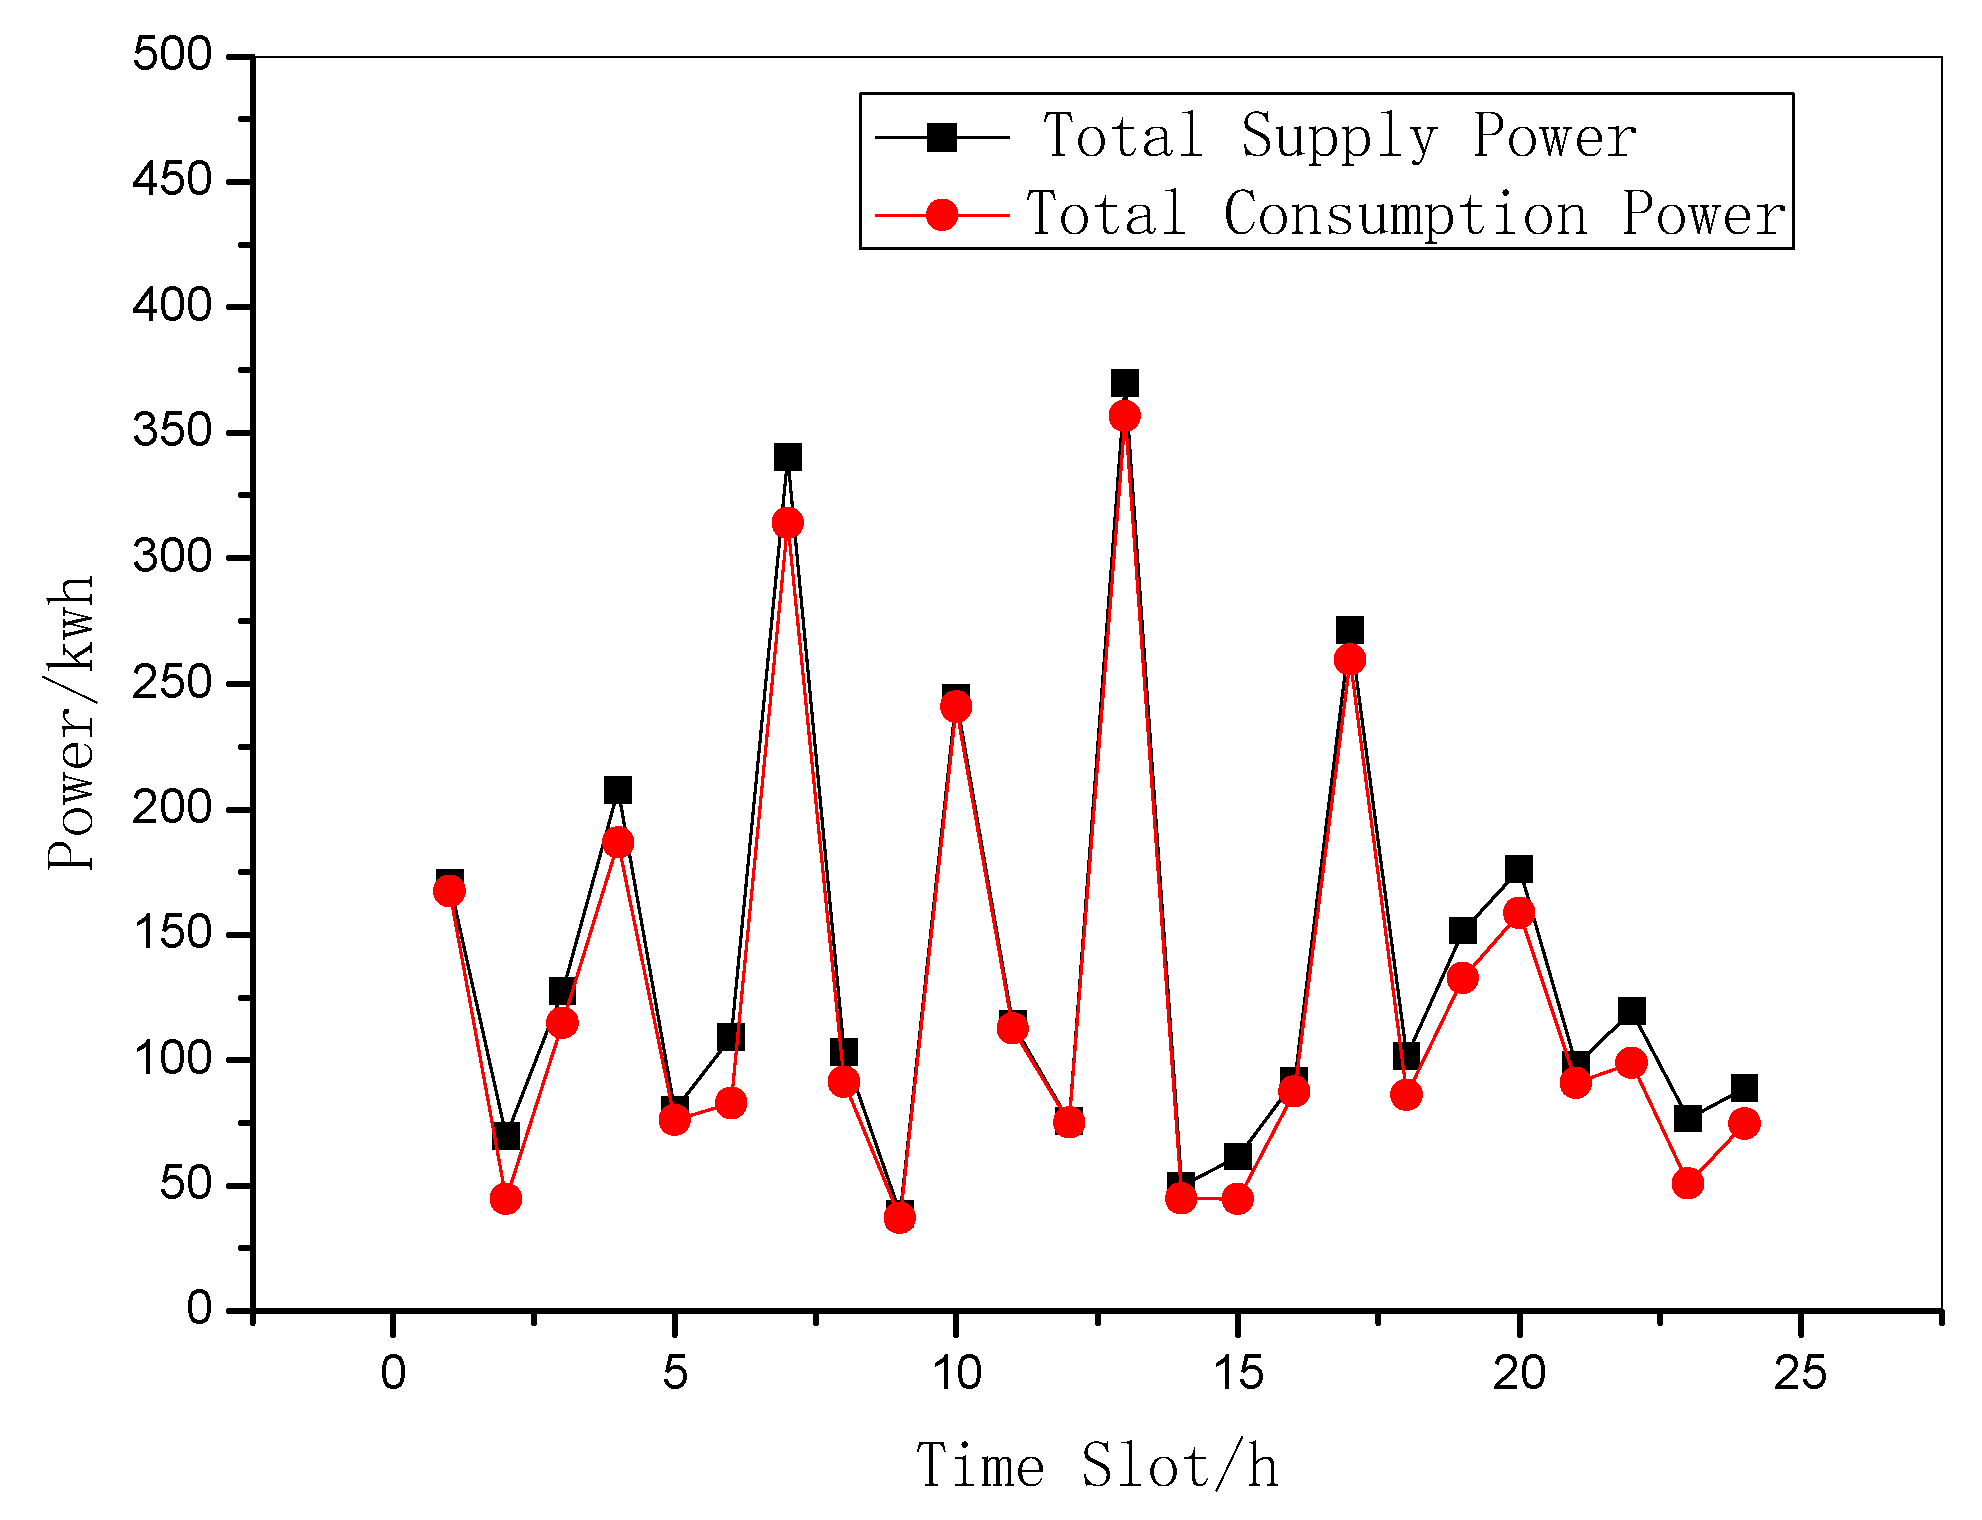
Figure 7 shows the comparison between the total 24 h electricity supply of the PS and total electricity consumption of all MGs. The total power supply includes the sum of the electricity produced by the PS itself and the electricity purchased from the MGs. As can be seen in the figure, the total power supply in every time slot exceeds the total power consumption of the MGs, ensuring that the supply exceeds the demand, the normal operation of the grid is constantly powered, and no large economic losses are incurred.
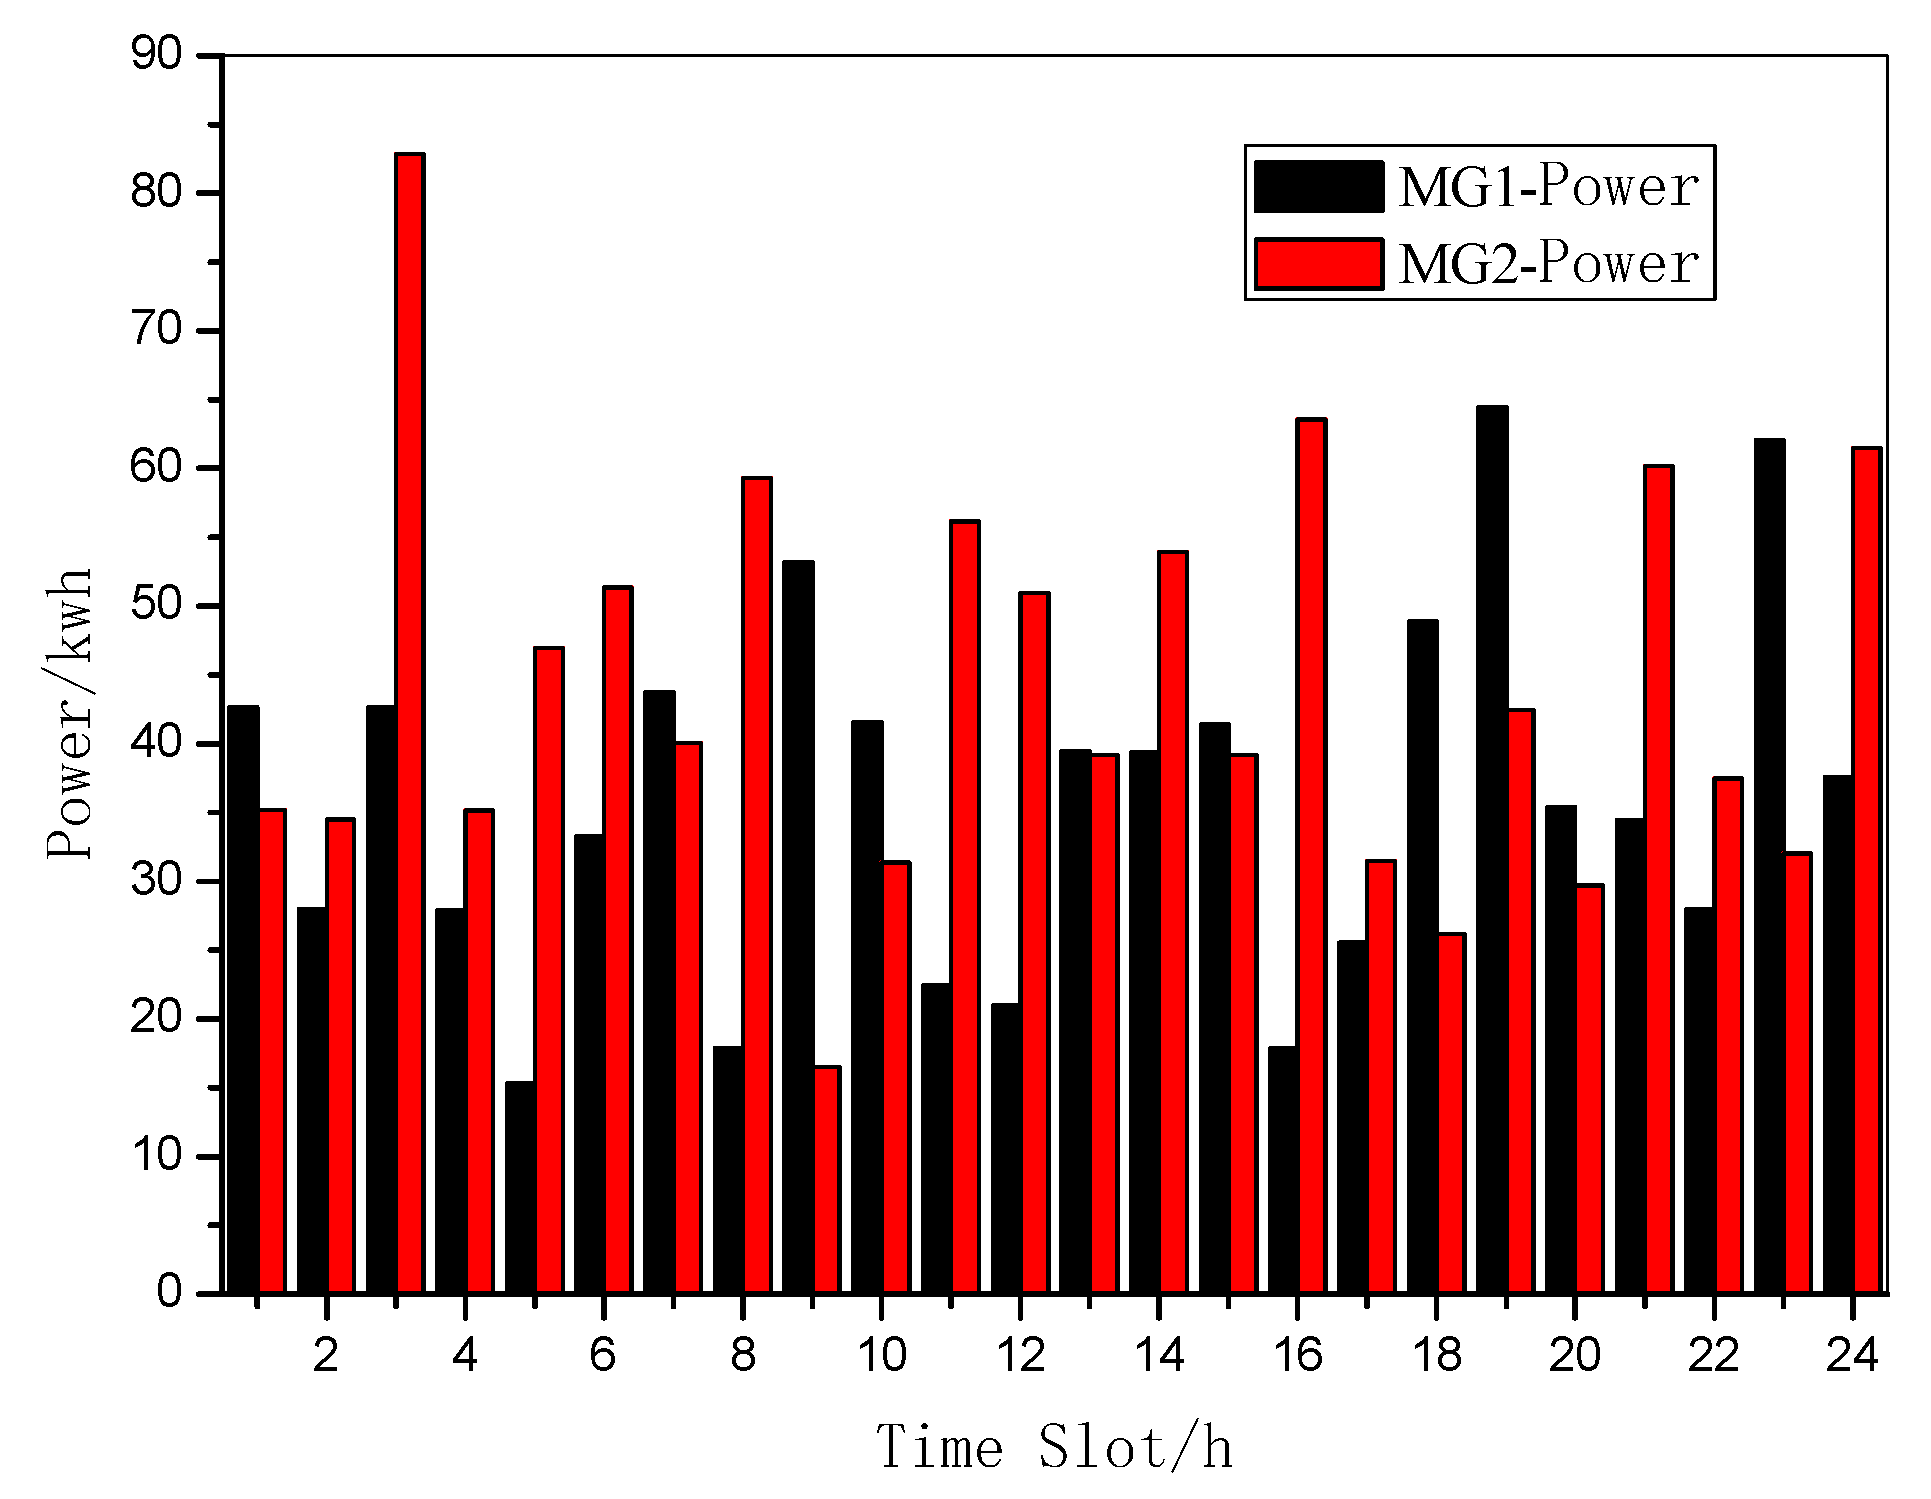
Figure 8 illustrates the power consumption of two MGs. During each time slot, the MGs can choose to purchase electricity from the grid, which provides a stable supply of energy and satisfies the needs of functional loads. Meanwhile, PWE generation is prioritized to satisfy the electricity demand of adjustable loads and EVs. Any surplus electricity produced by PWE can be fed back and sold to the main grid.
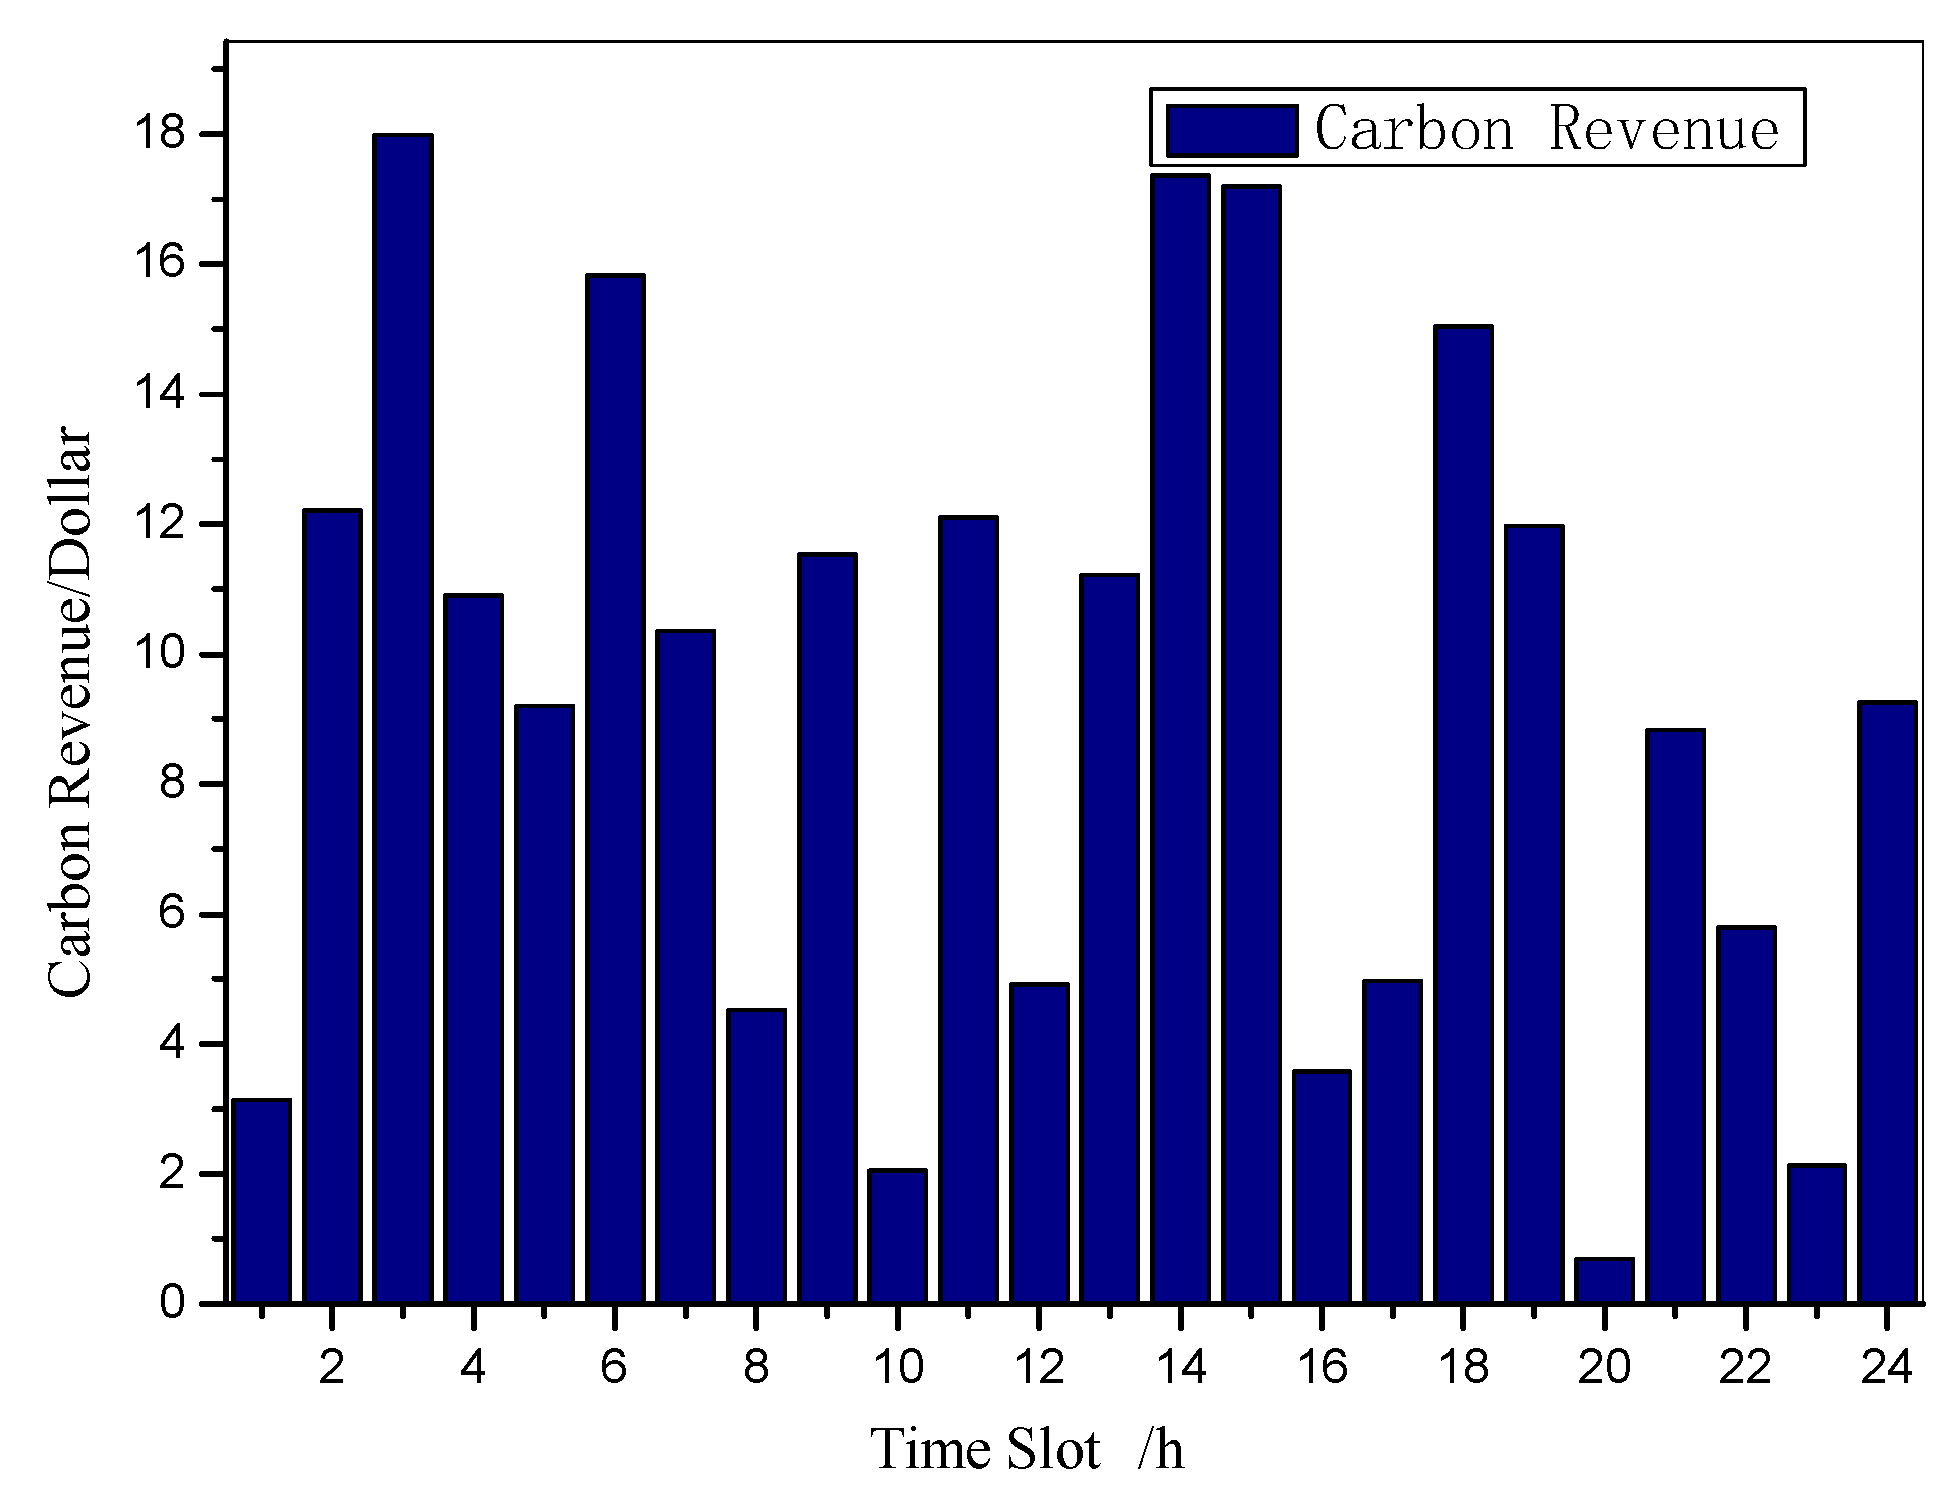
Figure 9 depicts the carbon trading revenue of each MG. The carbon quota mechanism promotes the consumption of clean energy by EVs, and the RTP demand response encourages MGs to rationally arrange EVs to be connected to the grid, thus reducing carbon emissions in the transportation industry and promoting the efficient use of energy in the power sector.
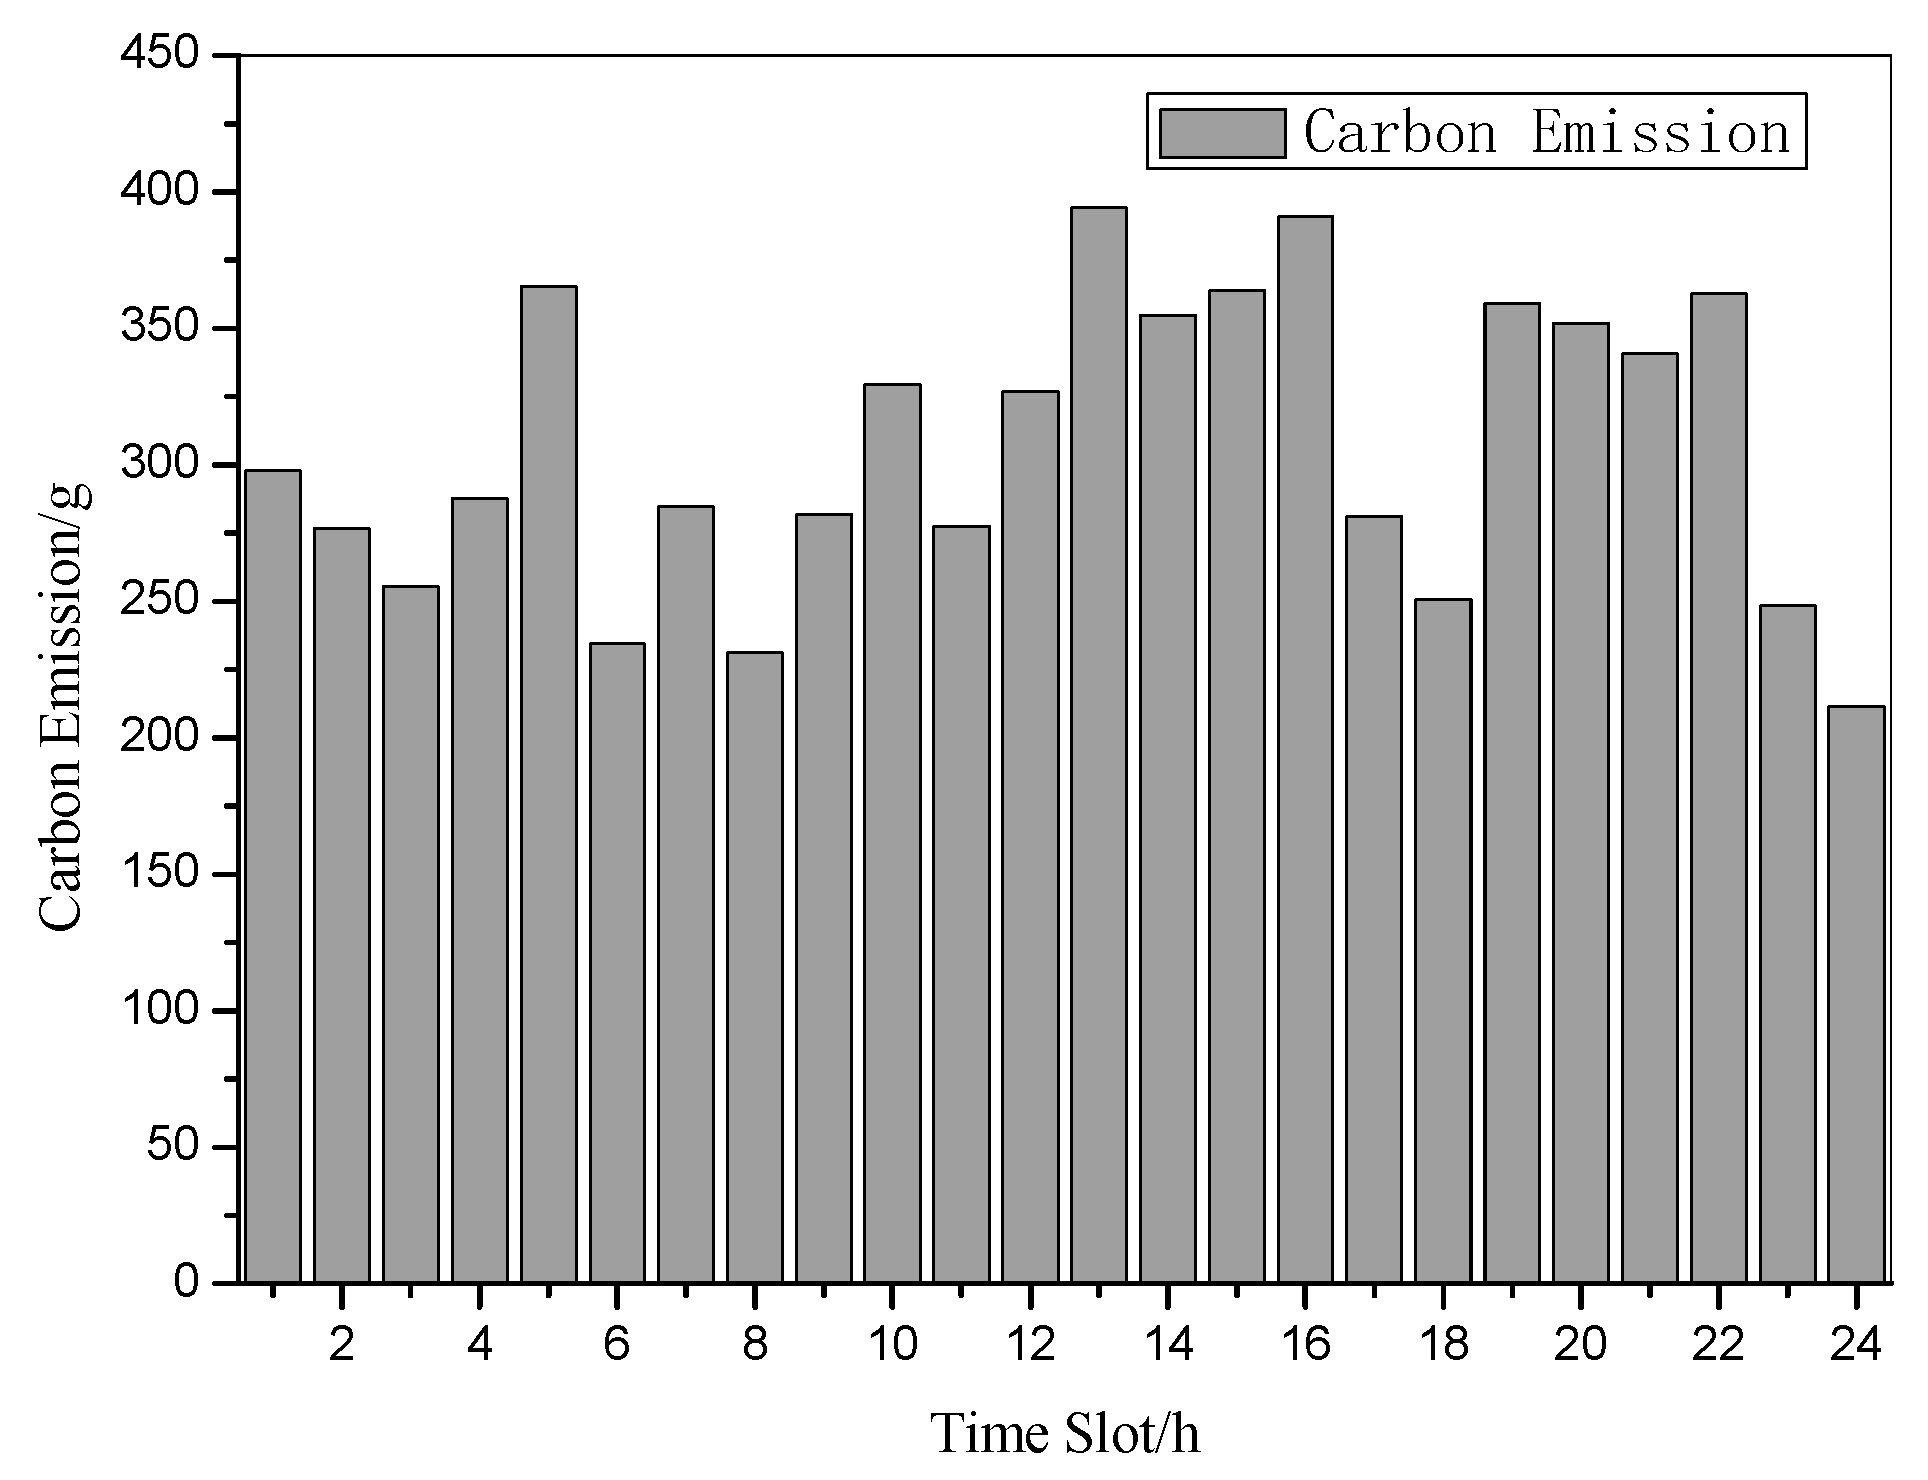
Figure 10 illustrates the hourly CO2 emission reduction from EVs over a 24 h period. It reflects that V2G makes full use of PWE sources, thereby reducing the scale of generation and the cost of the thermal power and further reducing the carbon emissions caused by thermal power generation. At the same time, using EVs instead of traditional fuel vehicles can effectively reduce carbon emissions during the driving process and effectively promote the realization of low-carbon goals.

8. Conclusions

To address PWE integration and the decarbonization of transportation in pursuit of global carbon reduction goals, this study constructs a bilevel programming model for V2G system optimization. The upper level enables the PS to set RTP for revenue maximization while maintaining grid supply–demand balance; the lower level supports MGs in integrating PWE and EVs to optimize energy scheduling for social welfare maximization. A bilevel distributed genetic algorithm is designed to tackle non-convex factors in the model. It enables decentralized decision making, protects supply–demand side privacy, enhances computational efficiency, and verifies the model’s rationality and algorithm’s feasibility. Through comprehensive simulations, this study verifies significant quantitative outcomes; the proposed algorithm converges after only 61 iterations, ensuring efficient solution performance. The selling price of the electricity generated by the PWE sources in the MG is USD 0.5 lower than the electricity price of thermal power generation provided by the PS. This effectively encourages the MG to prioritize the consumption of PWE sources and encourages the PS to repurchase the electricity generated by PWE sources. On average, carbon emissions decreased by approximately 300 g during each time slot, and the average value of carbon traded was around USD 8. Numerical simulations confirm three key outcomes: First, the dual-incentive mechanism of RTP and carbon quotas boosts MGs’ participation in grid operations, driving optimal EV charging/discharging and PWE utilization. Second, V2G optimization is achieved. MGs prioritize PWE consumption, surplus PWE is sold to the grid, and reliance on thermal power is reduced, thus improving PWE absorption. Third, carbon emissions are significantly cut, as EVs replace fuel vehicles to lower transportation emissions, and reduced thermal power generation curbs power sector emissions, thereby saving thermal power resources. In the future, we will focus on expanding the energy mix to diverse renewable energy forms, integrating stochastic factors from renewable energy output and EV grid connection to enhance model adaptability. Additionally, our research will be extended to scenarios involving multiple power suppliers, exploring their strategic game interactions under the dual incentives of RTP and carbon quotas to develop a more comprehensive and scalable V2G system optimization framework.

Author Contributions

Methodology, J.C. and H.Z.; Software, X.F. and Z.W.; Validation, J.C. and X.F.; Formal analysis, H.Z. and Z.W.; Investigation, H.Z. and J.C.; Resources, X.F.; Writing—original draft preparation, J.C. and H.Z.; Writing—review and editing, Z.W. and X.F.; Funding acquisition, H.Z. All authors have read and agreed to the published version of the manuscript.

Funding

This research was funded by the Social Science Foundation Project of Jiangsu (No. 19GLB022) and the MOE (Ministry of Education in China) Project of Humanities and Social Sciences (No. 16YJA630032) for their support. This work was also financially supported by the open fund of the Jiangsu Smart Factory Engineering Research Center (Huaiyin Institute of Technology).

Data Availability Statement

The data presented in this study are available on request from the corresponding author, as the data in the manuscript were generated through simulation, and the specific details of the data are explained in the manuscript.

Conflicts of Interest

The authors have no conflicts of interest to disclose.

Nomenclature

Nomenclature Parameters
Abbreviations x L o a d , i k power consumption of essential appliance (except EVs) of MG i in time slot k
RTPreal-time pricing x L o a d , i k , min ,
x L o a d , i k , max
minimum and maximum power consumption of essential appliance of MG i in time slot k
PSpower supplier G k power generation capacity of PS in time slot k
EVelectric vehicle G k min ,
G k max
minimum and maximum power generation of PS in time slot k
MGmicrogrid E i , k q amount of electricity stored by EV q
V2Gvehicle-to-grid x E V , i k , q charging, discharging, or idle capacity of EV q
DRdemand response E d r , i q target level to be met or exceeded
PWEphotovoltaic and wind energy M E V , i k , q carbon quota obtained by the EV q in MG i during time slot k
Sets and indices x T H , i k , q active output of thermal power units
N set of microgrid x P W E , i k , q PWE sources’ output
K set of time slots x P V , i k photovoltaic power output
Q i set of electric vehicles of MG i x W T , i k output of wind energy
iindex for MG C c h , i k , q carbon emissions of EV q in time slot k
kindex for time slot C d r , i k , q carbon emission reduction of EV q
qindex for electric vehicle λ k electricity price in time slot k

References

  1. Schumm, L.; Haas, J.; Peer, R.; Sterner, M. The role of hydrogen offtaker regulation in highly renewable electricity systems. Energy 2026, 342, 139513. [Google Scholar] [CrossRef]
  2. Dahash, A.; Bott, C.; Giordano, F.; Serageldin, A. Simulation-based planning for cost-effective and energy-efficient large-scale seasonal thermal energy storage systems. Renew. Energy 2026, 258, 124813. [Google Scholar] [CrossRef]
  3. Zeng, I.Y.; Du, C.; Xiong, J.; Gong, T.; Wu, T. Tax policy or carbon emission quota: A theory on traditional ICEV transportation regulation. Energy 2024, 289, 129848. [Google Scholar] [CrossRef]
  4. Thomas, B.; Costoya, X.; Decastro, M.; Iglesias, G.; Gómez-Gesteira, M. Forecasting offshore wind energy in Atlantic Europe using CMIP6 dynamically downscaled data. Energy 2026, 342, 139595. [Google Scholar] [CrossRef]
  5. Tran, H.G.; Ton-That, L.; Thao, N.G.M. Lagrange multiplier-based optimization for hybrid energy management system with renewable energy sources and electric vehicles. Electronics 2023, 12, 4513. [Google Scholar] [CrossRef]
  6. Liu, W.J.; Chiu, W.Y.; Hua, W.Q. Blockchain-enabled renewable energy certificate trading: A secure and privacy-preserving approach. Energy 2024, 290, 130110. [Google Scholar] [CrossRef]
  7. Giourka, P.; Petridis, S.; Seitaridis, A.; Angelakoglou, K.; Martinopoulos, G.; Kosmatopoulos, E.; Nikolopoulos, N. Operational smart charging and its environmental impacts: Evidence from three EU use cases with an innovative LCA tool, VERIFY-EV. Energies 2025, 18, 6215. [Google Scholar] [CrossRef]
  8. Sun, L.; Xie, C.; Zhang, G.; Ding, Y.; Gao, Y.; Liu, J. Dual-layer real-time scheduling strategy for electric vehicle charging and discharging in a microgrid park based on the “Dual electricity price reservation-surplus refund without additional charges mechanism”. Electronics 2025, 14, 249. [Google Scholar] [CrossRef]
  9. Ru, J.; Gillott, M.; Shipman, R. Vehicle-to-grid (V2G) research: A decade of progress, achievements, and future directions. Energies 2025, 18, 6148. [Google Scholar] [CrossRef]
  10. Wei, M.; Liu, Y.; Wang, H.; Yuan, S.; Hu, J. State of charge prediction for electric vehicles based on integrated model architecture. Mathematics 2025, 13, 2197. [Google Scholar] [CrossRef]
  11. Peng, Y.; Zhang, Y.; Yu, D.Z.; Liu, S.; Zhang, Y.; Shi, Y. Optimizing multi-depot mixed fleet vehicle-drone routing under a carbon trading mechanism. Mathematics 2024, 12, 4023. [Google Scholar] [CrossRef]
  12. Eti, S.; Yüksel, S.; Dinçer, H.; Kalkavan, H.; Hacioglu, U.; Mikhaylov, A.; Danish, M.S.S.; Pinter, G. Assessment of technical and financial challenges for renewable energy project alternatives. Clean. Eng. Technol. 2024, 18, 100719. [Google Scholar] [CrossRef]
  13. Wang, L.; Jiao, S.; Xie, Y.; Xia, S.; Zhang, D.; Zhang, Y.; Li, M. Two-way dynamic pricing mechanism of hydrogen filling stations in electric-hydrogen coupling system enhanced by blockchain. Energy 2022, 239, 122194. [Google Scholar] [CrossRef]
  14. Tao, L.; Gao, Y.; Cao, L.; Zhu, H. Distributed real-time pricing for smart grid considering sparse constraints and integration of distributed energy and storage devices. COMPEL Int. J. Comput. Math. Electr. 2021, 40, 978–996. [Google Scholar] [CrossRef]
  15. Yu, Z.-X.; Li, M.-S.; Xu, Y.-P.; Aslam, S.; Li, Y.-K. Techno-economic planning and operation of the microgrid considering real-time pricing demand response program. Energies 2021, 14, 14154597. [Google Scholar] [CrossRef]
  16. Cong, L.; Jørgensen, B.N.; Ma, Z.G. Integrated multi-timescale battery dispatch and overload mitigation: An agent-based optimization framework for high EV penetration in danish distribution networks. Electronics 2025, 14, 1612. [Google Scholar] [CrossRef]
  17. Zhu, H.B.; Liu, C.P.; Feng, X.; Liu, S.T.; Wang, Z.Y. Real-time demand response and energy scheduling with power storage devices. Chin. J. Manag. Sci. 2021, 29, 102–110. Available online: https://www.sciengine.com/doi/pdf/9303598A123944FC8477C91643879DB6 (accessed on 27 September 2021).
  18. Borja-Jaimes, V.; Valdez-Martínez, J.S.; Beltrán-Escobar, M.; Cruz-Rojas, A.; Gil-Velasco, A.; Coronel-Escamilla, A. A review of fractional order calculus applications in electric vehicle energy storage and management systems. Mathematics 2025, 13, 2920. [Google Scholar] [CrossRef]
  19. Erdinc, O.; Paterakis, N.G.; Mendes, T.D.P.; Bakirtzis, A.G.; Catalao, J.P.S. Smart household operation considering bi-directional EV and ESS utilization by real-time pricing based DR. IEEE Trans. Smart Grid 2015, 6, 1281–1291. [Google Scholar] [CrossRef]
  20. Rahbari-Asr, N.; Chow, M.-Y.; Chen, J.; Deng, R. Distributed real-time pricing control for large-scale unidirectional V2G with multiple energy suppliers. IEEE Trans. Ind. Inform. 2017, 12, 1953–1962. [Google Scholar] [CrossRef]
  21. Zheng, C.; Huang, W.; Zhai, S.; Pan, K.; He, X.; Liu, X.; Su, S.; Shen, C.; Ai, Q. Blockchain-enabled cross-chain coordinated trading strategy for electricity-carbon-green certificate in virtual power plants: Multi-market coupling and low-carbon operation optimization. Energies 2025, 18, 3443. [Google Scholar] [CrossRef]
  22. Tian, N.; Shao, B.; Zeng, H.; Zhao, X.; Zhao, W. Low-carbon economic operation of natural gas demand side integrating dynamic pricing signals and user behavior modeling. Entropy 2025, 27, 1120. [Google Scholar] [CrossRef]
  23. Meng, W.; Yang, Z.; Yu, J.; Lin, X.; Yu, M.; Zhu, Y. Multi-market coupling mechanism of offshore wind power with energy storage participating in electricity, carbon, and green certificates. Energies 2025, 18, 4086. [Google Scholar] [CrossRef]
  24. Ma, J.; Dong, W.; Shen, B.; Zhang, J. Two-stage energy dispatch for microgrids based on CVar-dynamic cooperative game theory considering EV dispatch potential and travel risks. Energies 2025, 18, 6105. [Google Scholar] [CrossRef]
  25. Luo, Y.; Gao, Y. Real-time pricing strategy considering carbon emissions and time coupling in smart grid: A binary integer bilevel optimization model with decision-making. Eng. Appl. Artif. Intell. 2025, 141, 109858. [Google Scholar] [CrossRef]
  26. He, Y.; Gu, C.; Gao, Y. Bi-level day-ahead and real-time hybrid pricing model and its reinforcement learning method. Energy 2025, 322, 135316. [Google Scholar] [CrossRef]
  27. Asgher, U.; Rasheed, M.B.; Al-Sumaiti, A.S.; Ur-Rahman, A.; Ali, I.; Alzaidi, A.; Alamri, A. Smart energy optimization using heuristic algorithm in smart grid with integration of solar energy sources. Energies 2018, 11, 3494. [Google Scholar] [CrossRef]
  28. Li, Y.; Yang, Z.; Li, G.; Mu, Y.; Zhao, D.; Chen, C.; Shen, B. Optimal scheduling of isolated microgrid with an electric vehicle battery swapping station in multistakeholder scenarios: A bi-level programming approach via real-time pricing. Appl. Energy 2018, 232, 54–68. [Google Scholar] [CrossRef]
  29. Grimm, V.; Orlinskaya, G.; Schewe, L.; Schmidt, M.; Zöttl, G. Optimal design of retailer-prosumer electricity tariffs using bilevel optimization. Omega 2020, 102, 102327. [Google Scholar] [CrossRef]
  30. Chiu, T.-C.; Shih, Y.-Y.; Pang, A.-C.; Pai, C.-W. Optimized day-ahead pricing with renewable energy demand-side management for smart grids. IEEE Internet Things J. 2016, 4, 374–383. [Google Scholar] [CrossRef]
Figure 1. Information exchange between the PS and multiple MGs (red indicates electricity resources, blue price information, and purple electricity consumption information.).
Mathematics 14 00114 g001
Figure 2. Flow chart of distributed real-time pricing genetic algorithm.
Mathematics 14 00114 g002
Figure 3. Photovoltaic power generation in MGs.
Mathematics 14 00114 g003
Figure 4. Wind power in MGs.
Mathematics 14 00114 g004
Figure 5. Convergence of buying and selling prices.
Mathematics 14 00114 g005
Figure 6. Twenty-four-hour prices of purchase and sale.
Mathematics 14 00114 g006
Figure 7. Total electricity supply and electricity consumption.
Mathematics 14 00114 g007
Figure 8. Electricity consumption of MGs.
Mathematics 14 00114 g008
Figure 9. Carbon trading revenue.
Mathematics 14 00114 g009
Figure 10. CO2 emission reduction of 24 h.
Mathematics 14 00114 g010
Table 1. Summary of some studies on energy scheduling problems in MG.
ReferencesRTPWelfareEVCharging and Discharging of EVsCarbon QuotasMulti-Time SlotsDRPWE
[13]----
[14]---
[15]--
[16]---
[17]-
[18]----
[19]--
[20]--
[21]---
[22]---
[23]---
[24]----
[25]---
[26]--
This article
Table 2. Parameter settings.
MG δ P W E γ P W E P P V r a t e d η P V G c T c P W T r a t e d v i n v o u t v r a t e d λ γ
10.010300.09365254032520145
20.010200.09565253532520145
30.010100.09365253032520145
Disclaimer/Publisher’s Note: The statements, opinions and data contained in all publications are solely those of the individual author(s) and contributor(s) and not of MDPI and/or the editor(s). MDPI and/or the editor(s) disclaim responsibility for any injury to people or property resulting from any ideas, methods, instructions or products referred to in the content.