Abstract
Adverse drug–drug interactions (DDIs) often arise from cytochrome P450 (CYP450) enzyme inhibition, which is vital for metabolism. The accurate identification of CYP450 inhibitors is crucial, but current machine learning models struggle to assess the importance of key inputs like ligand SMILES and protein sequences, limiting their biological insights. The proposed study developed LiSENCE, an artificial intelligence (AI) framework to identify CYP450 inhibitors. It aimed to enhance prediction accuracy and provide biological insights, improving drug development and patient safety regarding drug–drug interactions: The innovative LiSENCE AI framework comprised four modules: the Ligand Encoder Network (LEN), Sequence Encoder Network (SEN), classification module, and explainability (XAI) module. The LEN and SEN, as deep learning pipelines, extract high-level features from drug ligand strings and CYP protein target sequences, respectively. These features are combined to improve prediction performance, with the XAI module providing biological interpretations. Data were outsourced from three databases: ligand/compound SMILES strings from the PubChem and ChEMBL databases and protein target sequences from the Protein Data Bank (PDB) for five CYP isoforms: 1A2, 2C9, 2C19, 2D6, and 3A4. The model attains an average accuracy of 89.2%, with the LEN and SEN contributing 70.1% and 63.3%, respectively. The evaluation performance records 97.0% AUC, 97.3% specificity, 92.2% sensitivity, 93.8% precision, 83.3% F1-score, and 87.8% MCC. LiSENCE outperforms baseline models in identifying inhibitors, offering valuable interpretability through heatmap analysis, which aids in advancing drug development research.
Keywords:
inhibitor; cytochrome P450; joint-localized attention (JoLA); attentive graph isomorphism network (AGIN); self-attention; explainable artificial intelligence (XAI) MSC:
92B20
1. Introduction
The metabolism of both exogenous and endogenous compounds, including toxins, cellular metabolites, and drugs, as well as the synthesis of cholesterol, steroids, and other lipids, is highly dependent on human cytochrome P450 (CYP450) enzymes [1]. Among these, several isoforms play significant roles in drug–drug interactions (DDIs), impacting the pharmacokinetics, efficacy, and safety profiles of medications. This makes their study crucial for drug development and therapeutic management. Some key CYP450 isoforms, including CYP3A4, CYP2D6, CYP2C9, CYP2C19, and CYP1A2, are responsible for the metabolism of a significant proportion of clinically used drugs [2]. CYP3A4 is predominantly found in the gut and liver and is involved in the metabolism of approximately 50% of all marketed drugs [3]. CYP2D6, although present in lower quantities, metabolizes about 25% of regularly prescribed medications, including antidepressants, antipsychotics, beta-blockers, and opioids [4]. CYP2C9 is estimated to metabolize about 15–20% of drugs [5]. CYP1A2 is in charge of metabolizing about 9–15% of clinically used drugs [6], including theophylline (a bronchodilator), caffeine, clozapine (an antipsychotic), and certain antidepressants like fluvoxamine. CYP2C19 is involved in the metabolism of about 8–10% of clinically used drugs. Genetic polymorphisms in CYP2C19 can significantly affect the enzyme’s activity, leading to variations in drug efficacy and safety among individuals [7].
CYP450 inhibitors are substances that inhibit the human cytochrome P450 enzymes, playing a vital role in pharmacology and medicine by affecting drug metabolism. These enzymes, part of the hemoprotein superfamily, consist of 57 isoforms located in hepatic cells, and their metabolic interference often results in adverse drug reactions, such as acute side effects and metabolic malfunctions, including drug–food and drug–drug interactions. Drugs that inhibit CYP450 isoforms can raise the plasma levels of other drugs metabolized by the same isoform [8]. For example, the strong CYP3A4 inhibitor Ketoconazole can significantly increase the levels of CYP3A4 substrates, potentially leading to toxicity. On the other hand, enzyme inducers enhance the expression and activity of CYP450 enzymes, lowering the plasma concentration of drugs metabolized by the induced enzyme [9]. For instance, rifampicin, an inducer of CYP3A4, can diminish the effectiveness of drugs like oral contraceptives and immunosuppressants. Figure 1 illustrates the cycle of drug–drug interactions (DDIs) that occur when drugs are taken concurrently, highlighting the indispensability of CYP450 isoforms in drug metabolism.
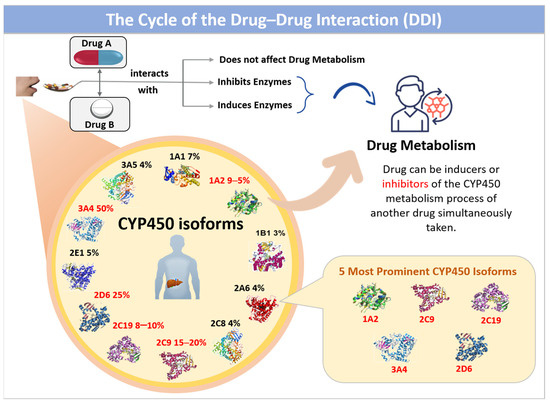
Figure 1.
The cycle of drug-drug interaction (DDI) when taken simultaneously. CYP450 is responsible for drug metabolism.
When Drug A and Drug B are administered together, there may be no effect on the metabolism of each drug. Suppose the metabolism of Drug A is affected; this indicates that Drug B is either an inducer or an inhibitor of the CYP450 isoforms responsible for Drug A’s metabolic process, and vice versa. Knowledge of a patient’s CYP450 genotype can guide personalized medicine by informing drug selection and dosing to avoid adverse effects and optimize efficacy; for example, genotyping for CYP2D6 can help tailor antidepressant therapy.
Despite recent advances, current black-box architectures like deep neural networks lack interpretability when it comes to understanding the contribution of specific input features, such as ligand SMILES strings and protein sequences. These models often treat inputs as undifferentiated vectors or tokens, making it difficult to ascertain which molecular substructures of the ligand or which amino acid residues of the protein are most critical for determining their interaction. In a ligand SMILES string, some atomic subgroups (like functional groups or rings) may be essential for binding affinity, but standard models rarely highlight their individual influence. Similarly, within a protein sequence, certain domains or conserved motifs might play a crucial role in drug binding, yet these regions often receive no special attention in conventional models. This lack of interpretability limits the model’s ability to provide mechanistic or biologically meaningful insights, which are critical for rational drug design and understanding off-target effects. Incorporating attention mechanisms, feature attribution methods (like SHAP or integrated gradients) or graph-based interpretability frameworks could enhance our ability to pinpoint influential regions within both compounds and targets, thus bridging the gap between prediction performance and biological understanding. Thus, we examine the problem of predicting the class of ligands, whether they are inhibitors of the CYP450 isoform, given the ligand compound and the CYP protein target. In this paper, we identify the SMILES of a compound and the target sequence as the “primary” structures of these entities. These primary forms of the compounds and targets cannot be used for virtual screening (VS) experiments until they are quantized to mirror their intrinsic structural or physicochemical components. To reduce the generalization loss of deep learning models, these properties must be properly represented. In this work, we will sometimes refer to the molecular graph as ligand graphs since it is a more relatable term when it comes to compound and protein target interactions. Mapping atoms and bonds into sets of nodes and edges is the fundamental step in graph representation. It is also important to note which features of the graph had the most influence on the results. This approach enables the identification of the molecules’ inhibitory states while also providing in-depth insights into the specific atoms that contribute most to the predicted outcomes. In our prospective study, this task is achieved using the proposed two-stage attention mechanism. The first stage of attention, comprising the Joint Local Attention Module (JoLA) and the Attentive GIN module, processes the nodes and edges of the ligand graphs collected from the PubChem database. The second stage of attention uses the Self-Attention module applied to process the protein sequences obtained from the Protein Data Bank (PDB) Database. The major contributions presented in this study include.
- (1)
- A novel LiSENCE hybrid AI model is proposed to predict the CYP450 inhibitors by combining and assembling features from two pipelines: the Ligand Encoder Network (LEN) and the Sequence Encoder Network (SEN). Both pipelines incorporated various attention modules to enhance the feature extraction of ligands and protein target sequences.
- (2)
- To extract important node information from the ligand graph, a novel two-stage attention mechanism is proposed utilizing Joint-localized Attention (JoLA) and Self-Attention modules.
- (3)
- The innovative Attentive-GIN (AGIN) module is designed to enhance the extraction of the compound features.
2. Related Work
Recently, artificial intelligence (AI) models have enhanced prediction accuracy and efficiency in drug discovery, leveraging extensive chemogenomic and pharmacological datasets like DrugBank [10], KEGG [11], STITCH [12], ChEMBL [13], and Davis [14]. Concerning in silico approaches, there have been some proposals to predict the inhibition of CYP isoforms. In 2024, Njimbouom et al. [15] introduced MumCypNet, a multimodal neural network for predicting CYP450 inhibitors. MumCypNet integrated various feature descriptors, such as Morgan fingerprints, MACCS fingerprints, and RDKit descriptors, to enhance prediction accuracy. However, their study lacked biological interpretability. Chang et al. [16] presented the DeepP450 framework to predict the activities of small molecules on human P450 enzymes. A pre-trained language model (like those used in natural language processing) was used to encode protein sequences of P450 enzymes. This helped to capture complex relationships and patterns in enzyme activities. The pre-trained protein language model used in DeepP450 might not generalize well across all types of P450 enzymes or different organisms. It could be biased towards the specific training data or may not capture all relevant features for diverse enzyme–substrate interactions. In 2023, Chen et al. [17] utilized compounds from the PubChem database [18] to train their models and achieved (AUC) values between 0.94 and 0.96 for different CYP isoforms (CYP1A2, CYP2C9, CYP2C19, CYP2D6, and CYP3A4). While their study provides structural alerts (SAs) for inhibition, deep learning models, particularly neural networks, often act as “black boxes”, making it daunting to fully understand the decision-making process and how different structural features contribute to predictions. Also in 2023, Da et al. [19] proposed DeepCYPs for encoding molecular structures, using graph-based representations and molecular descriptors to capture the relevant features of compounds. While DEEPCYPs performed well on the data it was trained on, it struggled to generalize its performance to different types of CYP enzymes or novel compounds. Such a concept raises concerns about the model’s applicability across various contexts. They employed single-task models for each CYP isoform in their study, whereas multitask models, which predict multiple isoforms simultaneously, could potentially improve predictive performance and provide a more holistic understanding of inhibition across different CYP enzymes. Another AI model aimed at predicting inhibitors and substrates of the cytochrome P450 2B6 enzyme was proposed by [20] in 2023. This study addresses the challenge of identifying these compounds, as improper predictions can lead to adverse drug reactions and ineffective therapies. The researchers compiled a dataset of known inhibitors and substrates of CYP2B6 from the existing literature and databases. Various molecular descriptors were calculated to represent chemical compounds, including structural, electronic, and physicochemical properties. Several ML algorithms were employed, such as Random Forest, Support Vector Machines (SVMs), Gradient Boosting Machines, and neural networks. These models, when trained on a subset of the data and validated using cross-validation techniques to assess their predictive performance produced varying degrees of accuracy, sensitivity, and specificity in identifying inhibitors and substrates. The effectiveness of the ML models is influenced by the choice of features. Poor feature selection can hinder model performance, as not all molecular descriptors adopted by the authors may be relevant for predicting CYP2B6 interactions. The ML models used may not account for the complex and dynamic nature of biological systems, where interactions between drugs and enzymes can vary based on multiple factors (e.g., concentration and the presence of other drugs). Ouzounis et al. [21] also designed an AI framework in 2023 to facilitate drug repurposing by identifying existing drugs that may inhibit CYP450 enzymes, potentially reducing the costs and duration associated with drug development. They employed various AI algorithms, including ensemble methods. They validated their approach using benchmark datasets, showing significant improvements in prediction accuracy compared to existing models. The choice of molecular representation can significantly impact model performance. This study may not have explored all potential representations, and suboptimal feature selection could limit predictive accuracy. Weiser, B et al. [22], in a quest to improve the accuracy of predicting how various compounds interact with CYP enzymes, sought to augment traditional docking approaches with machine learning models to analyze docking results. This suggests training models on a dataset of known CYP inhibitors and non-inhibitors to predict the likelihood of new compounds being inhibitors. The success of the integrated approach depends on the quality of the features derived from docking. Poor feature selection or representation could impair the model’s predictive power.
In 2022, Qiu et al. [23] presented an approach for predicting cytochrome P450 (CYP450) inhibitors using Graph Convolutional Neural Networks (GCNNs) enhanced with an attention mechanism. Unlike [17], the authors proposed a unified architecture, which relegates the approach of designing separate models for each isoform. While their unified model proved efficient for multiple tasks, scaling it for large datasets or complex molecular structures may introduce computational challenges. Although the proposed attention mechanism enhances performance, it adds complexity to the model, making it harder to tune and optimize. Predictions based on in vitro data might not always translate effectively to in vivo scenarios, limiting the practical applicability of their model’s predictions. In the same year, a Multitask Learning and Molecular Fingerprint-Embedded Encoding method was proposed by [24] to predict inhibitors of the human cytochrome P450 enzymes. The proposed iCYP-MFE model can be utilized in drug discovery to screen for potential CYP inhibitors early in the development process, thereby reducing the risk of adverse drug interactions. The effectiveness of molecular fingerprints can differ based on the specific chemical features that are relevant for CYP inhibition. Some relevant interactions might not be captured by the chosen fingerprint. Cyplebrity was presented in 2021 by Plonka, W et al. [25] to improve drug design and safety. The authors asserted that ML approaches, specifically ensemble methods with robust feature sets, are effective tools for predicting CYP inhibition. These models have potential applications in drug discovery, toxicity prediction, and pharmacokinetic studies. Nevertheless, their technique provides accurate predictions but offers limited insights into the underlying molecular mechanisms driving CYP inhibition. These models have potential applications in drug discovery, toxicity prediction, and pharmacokinetic studies. Their technique provides accurate predictions but offers limited insights into the underlying molecular mechanisms driving CYP inhibition. This lack of interpretability can hinder understanding of the biological relevance of predicted outcomes. Park et al. also presented their work in 2021 with the primary objective of creating a predictive model that can correctly identify whether a small molecule inhibits specific human CYP enzymes, which are critical for drug metabolism [26]. Their method may vary across different datasets or when applied to new chemical compounds not properly represented in the training set. It may struggle with generalizing to unseen molecules or scenarios, particularly if they differ significantly from those encountered during training.
In 2020, Banerjee et al. [27] designed a web server based on Random Forest (RF) for the prediction of cytochrome activity. They evaluated the predictive performance of SuperCYPsPred using metrics like accuracy, precision, recall, and area under the receiver operating characteristic curve (AUC-ROC). SuperCYPsPred performance heavily relies on the quality and how varied the dataset used for training is. If the dataset is biased towards specific types of substrates or enzymes, the predictions may not generalize well to novel compounds. Figure 2 shows the existing article distribution of the AI methods discussed in terms of deep learning (DL), machine learning (ML), and a hybrid of both ML and DL models. About 60% of these methods fall under the DL techniques, while approximately 30% are under the umbrella of ML techniques. The hybrid models show only rare results, about 10%. Figure 2 also shows the existing AI models from 2020 to 2024 according to the Google Scholar database. Most of these methods can be classified as feature-based ML approaches, representing data (ligands or proteins) as numerical vectors. These vectors depict the distinct physicochemical composition of the data used in training the ML model [28,29,30]. Table 1 summarizes the recent research works for CYP450 inhibitors using the AI concept.
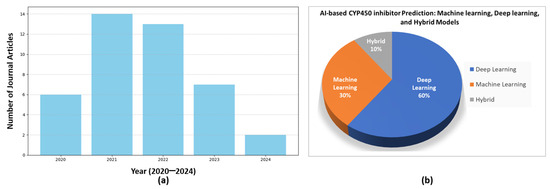
Figure 2.
A recent literature survey examined published research on AI-based predictions of CYP450 inhibitors. Part (a) presents an annual summary of the articles, while part (b) displays the distribution of articles based on the AI approach used for prediction, categorized into machine learning, deep learning, and hybrid AI models. These data were collected from the Google Scholar database from 2020 to 2024.

Table 1.
Recent AI research works for predicting the CYP450 inhibitors.
3. Methods
Figure 3 illustrates the end-to-end framework of LiSENCE, which is designed with two parallel pipelines: (1) the Ligand Encoder Network (LEN) and (2) the Sequence Encoder Network (SEN). Both pipelines incorporate various attention modules to enhance feature extraction from ligands and protein target sequences.
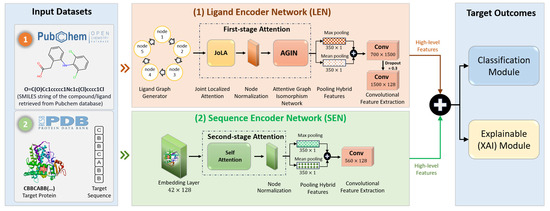
Figure 3.
End-to-end AI-based CYP450 inhibitors prediction framework of the proposed LiSENCE.
The LEN was designed to process the ligands, generating high-level deep features, while the SEN supported these high-level features by providing detailed information about the protein target sequences. The deep features extracted from both pipelines were then fused using a feature space ensemble technique, enhancing the overall prediction performance. In addition, explainable heatmaps were generated using the RDKit tool [31] to visually interpret the decision-making for the CYP450 inhibitors. The subsequent sections explain components of the proposed model in detail.
3.1. Dataset
We utilized two different types of datasets from three distinct databases in accomplishing the objective of the proposed framework. The first type of dataset is the “Drug/Ligand/Compound SMILEs String Dataset” compiled from the PubChem database [18] and the ChEMBL CYP450 BioAssay [13]. The second dataset is a Protein Sequence dataset retrieved from the Protein Data Bank (PDB) database [32]. A detailed explanation of each dataset is provided in the following sections.
3.1.1. Drug/Ligand/Compound SMILEs String Dataset
By entering queries like CYP450 inhibitors and non-inhibitors and CYP450 IC50 in the PubChem and ChEMBL databases, we were able to retrieve the two distinct SMILES string datasets used. Overlapping compounds were removed from the ChEMBL dataset. The PubChem dataset is used to train all AI models in the experimental study and used for the first testing. The same train/test splitting configuration by Qiu et al. [23] was used on the PubChem dataset, while the ChEMBL dataset serves as an unseen dataset, used solely for validation/external/second testing to assess the reliability and capability of the proposed AI approach in handling diverse datasets without prior training. This experiment aims to demonstrate the generalizability of AI-based smart solutions.
PubChem Database
The SMILES string dataset was obtained from the PubChem database, consisting of chemical structures represented as SMILES (Simplified Molecular Input Line Entry System) strings [33]. SMILES strings are text-based notations that encode molecular structures in a brief and human-readable format. They consist of alphanumeric characters and symbols that specify atoms, bonds, and connectivity in a molecule. Each entry in the SMILES dataset corresponds to a unique chemical compound and is represented by its SMILES string. PubChem provides free access to millions of SMILES strings, covering a vast array of organic and inorganic compounds, widely used in cheminformatics for tasks such as compound identification, similarity searching, and structure–activity relationship analysis. From the PubChem database [18], compound or ligand datasets describing the inhibitory actions of the five CYP isoforms were obtained, which are CYP1A2, CYP2C9, CYP2C19, CYP2D6, and CYP3A4. We chose datasets with sample sizes larger than 100 samples to fulfill the objective of the suggested AI prediction framework. Table 2 shows the dataset distribution over the five CYP450 inhibitors. A compound was classified as an inhibitor when its activity score exceeded 40 and its curve class was assigned to 1.1, 1.2, or 2.1, while a compound with 0 activity score and a curve class assignment of 4 was classified as a non-inhibitor. Compounds that satisfied both criteria at the same time were retained. The remaining compounds recorded as inconclusive samples were eliminated.

Table 2.
Dataset distribution for training, validation, and testing across five CYP450 inhibitors.
ChEMBL CYP450 BioAssay Data
The verification and validation phase was conducted using data on the inhibition of human CYP450 isozymes 1A2, 2C9, 2C19, 2D6, and 3A4 collected from the ChEMBL database. The half-maximal inhibitory concentration (IC50) values, “standard relation”, and “percentage of inhibition” were used to categorize ChEMBL substances as inhibitors or non-inhibitors. Each compound’s chemical structures, mostly the SMILES, were extracted. To achieve data consistency and correctness, different processes were carried out. First, the SMILES notation was checked for syntactic and semantic problems. Following that, Canonical SMILES were produced for every molecule. Using the RDKIT Python (v2024) library [31], we then carried out a similar filtering process as mentioned by Plonka et al. [25]. The datasets obtained from ChEMBL were combined uniquely for each of the five CYP450 (1A2, 2D6, 2C9, 2C19, and 3A4). Due to their tendency to have similar molecular descriptor values, compounds with identical SMILES were regarded as duplicates and deleted. By following these procedures, a precise and dependable dataset was produced, offering a strong basis for further study and investigation. Table 3 presents an elaborate synopsis of the data split. Compounds that were present in the PubChem dataset were removed to ensure that all drugs used for the validation and verification phase were not part of the training set. As a result, the size of the dataset used for this case study was 8752.

Table 3.
Compounds derived from the ChEMBL database.
3.1.2. CYP Target Protein Sequence Dataset
PDB contains structures for proteins from a wide range of organisms, including humans, model organisms (e.g., mice, yeast), bacteria, viruses, and plants. Each PDB entry provides detailed information about the sequence, including the chain identifier(s) corresponding to the protein(s) in the structure, sequence length, and sometimes annotations regarding domains, functional sites, and mutations. The sequence diversity among CYP450 enzymes is considerable, reflecting their adaptation to metabolize a wide range of substrates. We obtained the protein sequences for CYP1A2 (PDB ID: 2HI4), CYP2C9 (PDB ID: 6VLT), CYP2C19 (PDB ID: 4GQS), CYP2D6 (PDB ID: 4WNW), and CYP3A4 (PDB ID: 4D7D) from the PDB database, as illustrated in Figure 4. Simulations were conducted using the BIOVIA Discovery Tool (v2024) [34] and PyMol software (v3.0.3) [35]. Distances within 5 angstroms of the CYP450 protein targets are indicated with dashed lines (second row). The sequences of each isoform were derived from the chain A sequence of each CYP450 protein. The second row of Figure 4 depicts the key binding residues for each of these 5 isoforms labeled using the IUPAC’s [36] (amino acids or protein codes used in bioinformatics) three-letter notation of the protein residue name. For example, Leucine and Alanine are represented as LEU and ALA, respectively. Following [23], we adopted IUPAC’s one-letter representation of these protein residue names in our experimentation. For Leucine and Alanine, their one-letter notation is represented as L and A, respectively. Each of the 42 binding residues for each isoform is provided in the third row beneath its respective protein target.
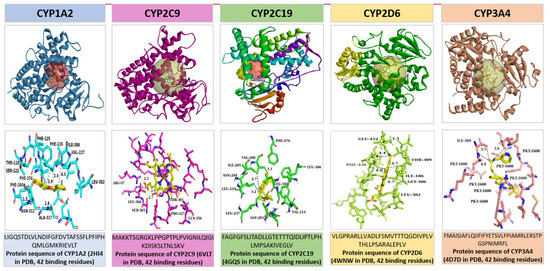
Figure 4.
Visualization of the CYP target protein sequences retrieved from the Protein Data Bank (PDB) database [22]. The first row shows the 3D structures of each of the 5 CYP450 isoforms with their respective ligand inhibitors covered in a ball. The second row shows the important binding residues of each of the 5 CYP450 isoforms within a radius of 5 angstroms from their respective ligand. The ligand inhibitors are displayed in yellow bindings in the second row.
3.2. Preprocessing
The SMILES strings were converted into molecular objects using the RDkit library [31] to check their validity. After giving each atom in the molecule a number, the molecular graph was traversed to create a graph representation. Each edge represents a bond, with characteristics including all the bond features. In handling missing values, we used the similarity of molecular structures (e.g., Tanimoto coefficient) to impute missing values for ligand data. If a ligand’s feature is missing, it is replaced with values from similar compounds. In addition, SMILES string augmentation was sometimes used, where incomplete strings are reconstructed based on known patterns. In standardizing the ligand graph, we used the Z-score normalization.
For the protein sequences, we were able to obtain exactly what we needed (42 binding residues) from the Protein Data Bank. However, in a few instances where some data were missing, sequence motifs (i.e., binding sites as shown in Figure 4) and biological knowledge were used to infer missing data based on the sequence context. For the protein sequences that were still not up to par, we masked the missing data during training to ignore the masked portions. Normalization of the protein sequences was not needed since the embedding layer was used. The embedding layer transformed the sequences into dense vector representations, which captured meaningful patterns from the raw sequence data.
3.3. The Proposed LiSENCE Framework for CYP450 Inhibitors Prediction
As shown in Figure 3, the proposed LiSENCE framework comprises four integrated modules: (1) the Ligand Encoder Network (LEN), (2) Sequence Encoder (SEN), (3) classifier module, and (4) explainable module. The classifier module was used for predictions, and the explainability module interprets these prediction results. LiSENCE is formulated as
where are the respective inputs of the LEN (takes ligand graph data) and SEN (takes sequence data), is a concatenation operation, is the classifier, and are the output features of the LEN and SEN, respectively.
3.3.1. Ligand Encoder Network (LEN)
As shown in Figure 5, the Ligand Encoder Network (LEN) was processed using the Joint-localized Attention (JoLA) module to obtain the most relevant node features. These features were then standardized using a normalization technique before being processed by the Attentive Graph Isomorphism Network (AGIN). This was followed by a hybrid pooling layer (i.e., parallel max and mean pooling) to capture the salient high-level features from the ligand graph input dataset. The concatenated output was then processed with two convolution layers to produce the final output for the LEN. A dropout rate of 0.3 was empirically used in both convolutional layers to reduce trainable parameters, regularize the model, and make the AI model more efficient. The output feature of the LEN is derived as
where is the output derived from the LEN, LEN is the Ligand Encoder Network, and is the ligand graph input. The intricate details of each component within the LEN pipeline are outlined in the following paragraphs.
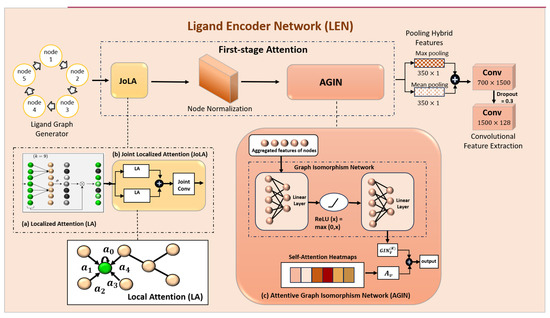
Figure 5.
Representation of the detailed LEN module: (a) Localized Attention, (b) Joint-localized Attention (JoLA), and (c) Attentive Graph Isomorphism Network (AGIN).
Joint-Localized Attention (JoLA)
The Joint-localized Attention (JoLA) module contains two Localized Attention (LA) modules initialized with different receptive fields. The receptive field (r) extracts unique feature scales from each input feature. Using multiple kernel sizes indicates multiple receptive fields, thereby increasing the size of the aggregation. Figure 5 also illustrates the detailed JoLA module.
Given the output feature, X ∈ R, from the former layer, we formulate LA as
where σ represents the sigmoid function, and fw () denotes the attention function with the kernel weight of the form:
The i-th weight of Xi can be calculated as
where Ωr denotes a set of r features that are neighbors of Xi. We implement this with a 1D convolution expressed as = σ(C1Dr(X)) ∗ X, where CID represents the function of 1D convolution. By using different receptive fields, JoLA can be formulated as
and , where Conv Merge represents the 1D convolution function, which has a learnable weight .
Attentive Graph Isomorphism Network (AGIN)
The concept of Attentive Graph Isomorphism Network (AGIN) is presented as a hybrid model consisting of the Graph Isomorphism Network (GIN) and the self-attention mechanism. GINs belong to the larger family of Graph Neural Networks (GNNs), which perform message aggregation and create a new feature vector in each iteration. The iteration process is performed k times, and then the k-hops structure information is obtained. The GIN algorithm checks the Weisfeiler–Lehman graph isomorphism test. GINs depict complex interactions between atoms and bonds, enabling the learning of more intricate representations of the ligand graph structure. The attention mechanism was fused into the GIN model to learn the structural information of nodes and edges. The three components of the attention mechanism are as follows.
Step 1: Graph Isomorphism Network (GIN) Layer
The GIN update for each node at layer is given by
where is the feature vector of node from the previous layer. is a learnable parameter. is a multi-layer perception at layer
Step 2: Attentive Graph Isomorphism Network—AGIN
To fuse GIN and self-attention, we can combine the outputs of both mechanisms. Let be the attention output; then, the combined node representation can be formulated as
where is the output of the GIN layer for the node . is the attention output for node is a learnable parameter controlling the balance between GIN and self-attention contributions. A molecule is expressed as a graph where nodes are atoms and edges are chemical bonds. For node , the updated feature representation after the fused layer would be
This equation captures the essence of fusing GIN with self-attention, resulting in the proposed AGIN module for ligand or compound data. The GIN component preserves local structural information, while the self-attention component captures long-range dependencies and complex interactions, leading to a more comprehensive representation of the molecule.
Hybrid Pooling Layer
Max pooling captures key atoms and bonds, while mean pooling summarizes the overall molecular structure. This combination allows for a comprehensive representation of both local and global features. It also creates a robust representation, less sensitive to variations in the graph, enhancing generalization performance. Given a graph, , consisting of nodes (atoms in a molecule) and edges (bonds between atoms). Let be the feature vector of node .
The attention mechanism is applied, which assigns a weight to each node when aggregating information for node The updated feature for node can be written as
where is the neighborhood of node , is a learnable weight matrix, and is an activation function. The mean pooling computes the average of the node features across the graph:
Max pooling computes the maximum value for each feature dimension across all nodes in the graph:
The hybrid pooling feature’s final representation is the concatenation of the mean and max pooled features
Multiple Convolution Layers
A max and mean pooling model can learn intricate correlations and patterns in the ligand graph by utilizing two convolution layers, which facilitate non-linear transformation. To effectively describe molecular structures, this aids in capturing higher-order dependencies and non-linear interactions between atoms and bonds. By adding a second convolution layer, the model can capture more intricate characteristics, which could improve performance on tasks like activity classification or chemical attribute prediction.
3.3.2. Sequence Encoder (SEN)
An encoder is proposed to process the protein target sequences. As illustrated in Figure 3 and Figure 6. The CYP pseudo-sequence was first projected via an embedding layer onto a 128-dimensional feature space. Using an embedding layer on protein sequences is like using word embeddings in natural language processing. It helps represent the amino acids/protein targets in a continuous vector space, capturing their semantic relationships. Next, we applied the self-attention mechanism to obtain the most relevant protein sequence features. Then, a normalization technique was applied to standardize the retrieved features. A convolution layer () was then employed to obtain the final output for the Sequence Encoder.
where is the output derived from the SEN, SEN is the Sequence Encoder Network and is the sequence input. Normalization helped to prevent information loss during the self-attention process. By applying a convolution on self-attention output, the model can further extract local features from the protein sequence, complementing the global information captured by self-attention.
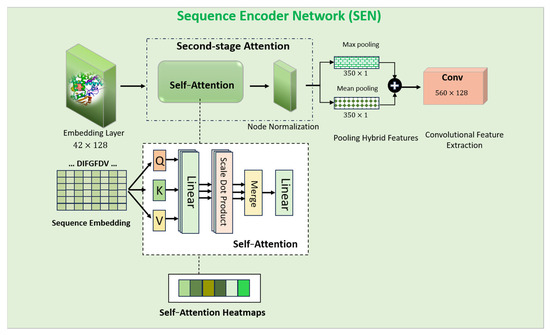
Figure 6.
AI modeling structure of the individual SEN module.
3.3.3. Classification Module
The classification module receives the concatenated output from the LEN and SEN as input. Figure 7 shows the classification module and its corresponding explainable module. We elaborate on the explainable module in subsequent sections. Using multi-layer perception (MLP), non-linear activation, dropout, and a sigmoid-transformed linear layer output, the classifier module makes predictions to distinguish ligands that are inhibitors and those that are not. By using both ligand and protein data, the classification module captured the interaction, specifically how a particular ligand interacts with a specific protein target. This specificity is crucial because inhibitory activity is not just a property of the ligand alone but is highly dependent on the protein target.
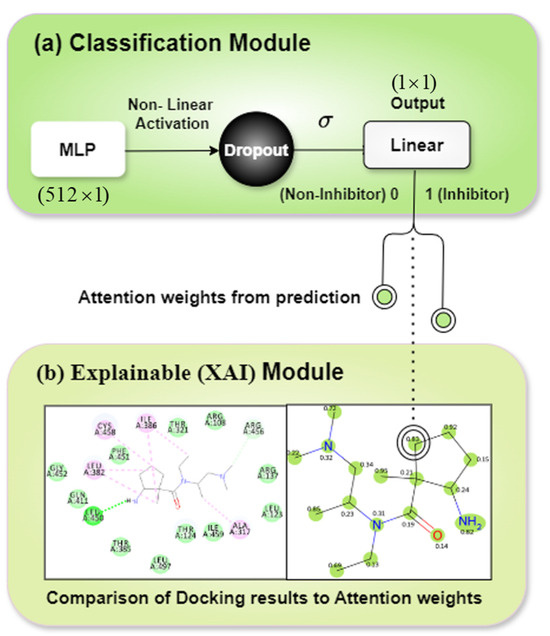
Figure 7.
Representation of (a) classification module and (b) explainable module features.
3.3.4. Explainable (XAI) Module
The explainable module as shown in Figure 7b contains two diagrams placed side by side. The left diagram depicts the docking simulation of a sample ligand with its interactions. The docking simulation was performed using the BIOVIA Discovery Studio software (v2024) [34]. The right diagram presents the attention weights given to the node/atomic features of the ligand/chemical compound by LiSENCE. These weights vary in intensity depending on the degree of influence on the general prediction. We explored some of the many functionalities of the RDKit tool [31] in visualizing these attention weights instead of using the popular Grad-CAM [37] to visualize attention weights. We chose the RDKit tool because of its unique bias in representing chemical compounds. The intention is to compare these two diagrams to identify how well LiSENCE, using the attention weights, could depict the atoms or portions of the ligand with greater inhibitory potential.
3.4. Evaluation Strategy
Accuracy (Acc), specificity (Spe), precision (Pre), the area under the ROC curve (AUC), F1-score, and Matthew’s correlation coefficient (MCC) were the evaluation metrics used in evaluating the proposed modules.
3.5. Training and Inference Settings
For training, we used a batch size of 128 and optimized with Adam using a learning rate of 0.0005. The early stopping and dropout regularization techniques were used to regulate overfitting. The Python programming language and Pytorch 2.1.2 were used in this study to train the proposed LiSENCE AI components on an RTX 2070 GPU. Dataset imbalance was addressed with random weight sampling. For testing, the same learning rate and optimizer used for training were used.
4. Experimental Results
4.1. Convergence of the Proposed AI Framework
Figure 8 shows the convergence of the proposed LEN against its individual components over 100 training epochs. Meanwhile, Figure 9 shows the convergence of the proposed LiSENCE against the individual network LEN and SEN. The training performance is presented as line plots, and the shaded region around the line plots indicates the standard deviation, which provides a thorough understanding of the variability of each plot.
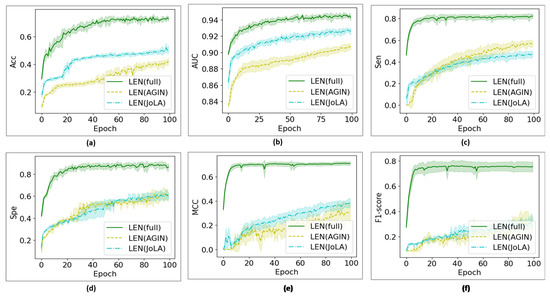
Figure 8.
Training convergence curves for all AI configurations of the individual LEN model. Figure (a) Accuracy (b) AUC, (c) Sen, (d) Specificity, (e) MCC and (f) F1-score.
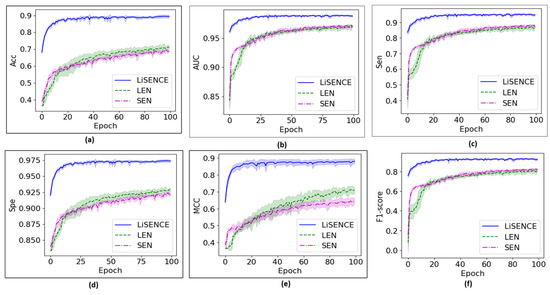
Figure 9.
Convergence curves for the proposed LiSENCE against the individual LEN and SEN. Figure (a) Accuracy (b) AUC, (c) Sen, (d) Specificity, (e) MCC and (f) F1-score.
4.2. LEN Evaluation Results
The detailed performances of the various components of LEN are discussed in the following sections to show the contribution of each component.
4.2.1. Examining JoLA
The JoLA module was examined to check the impact of the different Localized Attention modules on the output of LEN. The results of the receptive fields and are presented in Table 4 and Table 5, respectively. The AGIN component of LEN was omitted when JoLA was being examined. CI is the confidence interval, which is presented below each score in brackets.

Table 4.
Evaluation performance (%) of the proposed JoLA at

Table 5.
Evaluation performance (%) of the proposed JoLA at
Moreover, we examined the performance of the proposed JoLA module when the combined receptive fields of and were used. Table 6 summarizes the evaluation results for this case.

Table 6.
Evaluation performance (%) of the proposed JoLA at and ).
4.2.2. Examining AGIN
The results for when LEN is run with the AGIN module are summarized in Table 7 For this evaluation, the JoLA module is not included.

Table 7.
Evaluation performance (%) of the proposed AGIN without involving the module of JoLA.
4.2.3. Examining LEN (End-to-End)
This section presents the evaluation results when all components of the LEN are executed simultaneously. Table 8 provides the classification evaluation results for each class. It is evident that the complete LEN structure enhances prediction performance, achieving an average accuracy of 83.3% and an F1-score of 76.7%, which is at least 10% higher than the performance of individual modules.

Table 8.
Evaluation performance (%) of the proposed full LEN module.
4.3. SEN Evaluation Results
The prediction performance of the proposed SEN module is also evaluated separately to assess its effectiveness. Table 9 summarizes the evaluation results for each class based on the testing sets.

Table 9.
Evaluation performance (%) of the proposed SEN module.
4.4. Evaluation Comparison Results of LiSENCE to Other State-of-the-Art Methods
The results of LiSENCE and SOTA models are presented in Table 10. The CI for LiSENCE is presented in Table 10.

Table 10.
Comparison results (%) against the state-of-the-art (SOTA) for each CYP isoform.
Figure 10 displays the prediction performance of LiSENCE compared to the individual components of SEN and LEN for all five CYP isoforms.
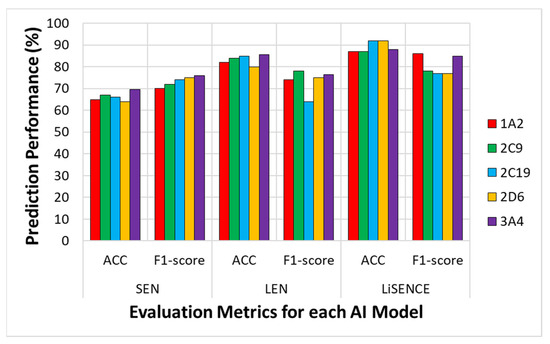
Figure 10.
Comparison evaluation performance of the proposed LISENCE against the individual LEN and SEN AI models in terms of overall accuracy (Acc) and F1-score.
Figure 11a presents the confusion matrix of the individual LEN model. Out of 8000 ligand inhibitors, 6018 cases were correctly predicted as inhibitors, and 2360 non-inhibitor cases were accurately classified out of 3211. From Figure 11a, we observe that approximately 15.2% of inhibitors were misclassified as non-inhibitors, and 26.5% of the non-inhibitor class were incorrectly predicted as inhibitors. The SEN Figure 11b correctly predicted 5720 out of 8000 samples as inhibitors and accurately identified 2128 non-inhibitors out of 3211, while LiSENCE Figure 11c achieved the most accurate prediction matrix, with less than 5% of inhibitors incorrectly classified as non-inhibitors and fewer than 7% misclassified as inhibitors.
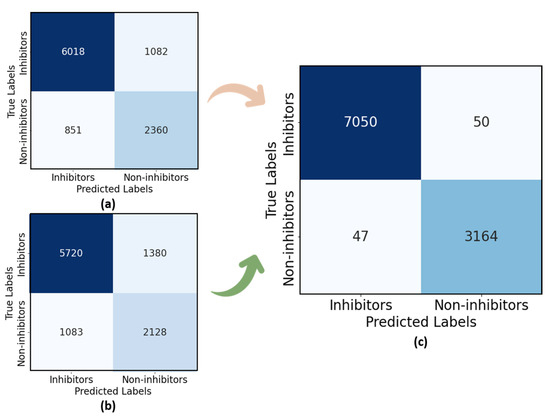
Figure 11.
Confusion matrices for (a) LEN, (b) SEN, and (c) LiSENCE.
4.5. Visualizing Results with XAI Module and Re-Scoring LiSENCE
To explore inhibitory activity, five CYP inhibitors with the highest predicted value in the test set were selected for a case study. The atoms with the highest attention weight highlight the parts of the molecule contributing most to inhibitory activity. To further analyze these interactions, molecular docking simulations were performed using PyMol (v 2024) [35], AUTODOCK (v 2024) [38], and BIOVIA Discovery Studio software (v 2024) [34]. PyMol was used to prepare the ligand and protein, AUTODOCK was used for docking, and BIOVIA was used for visualizing the results. Figure 12 shows heatmaps and interaction modes for each CYP isoform, with light green circles marking the degree of attention weights on the atoms of the ligand. For each ligand, the molecular docking simulation result is presented on the left, and the attention weights are provided on the right. Biological deductions are presented for Figure 12 in Section 5.5.
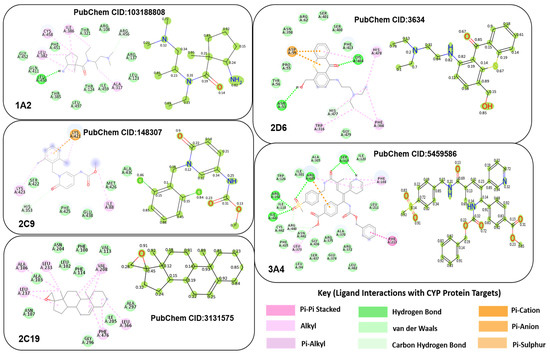
Figure 12.
Examples of explanation XAI evaluation and visual results for each CYP isoform.
Re-Scoring LiSENCE After Explainability
In proving the versatility of LiSENCE, we re-scored the model by incorporating new features related to interaction types, as shown in Figure 12, which were identified through the XAI module. This approach demonstrates LiSENCE’s ability to predict and mimic the interaction patterns observed during docking experiments, as explained in Supplementary S1 in the Supplementary File. Using the RDKit library [31], we calculated the degree and type of interactions (e.g., Van der Waals, alkyl, anion) between atoms in the compounds, and these were added as features for re-scoring LiSENCE on the five CYP450 isoform test datasets. In Table 11, we juxtapose the results obtained after re-scoring LiSENCE with its initial results.

Table 11.
Result comparison (%) obtained via the proposed LiSENCE before and after re-scoring.
4.6. Ablation Study Using ChEMBL External Dataset: Verification and Validation (V&V)
We evaluated the performance of LiSENCE against six ML models across five isoform test datasets using the unseen dataset of the ChEMBL dataset [13]. In achieving this, we tested the proposed LiSENCE against six ML models with 10-fold cross-validation tests: LightGBM (LGBM) [39], Support Vector Machine (SVM) [40], Random Forest (RF) [41], Extreme Gradient Boosting (XGB) [42], Gaussian Naïve Bayes (GNB) [43], and K-Nearest Neighbor (K-NN) [44]. Supplementary S2 in the Supplementary File presents the comparison results in detail. LiSENCE, LGBM, and SVM models consistently generated the greatest accuracy scores for each of the five isoforms through 10-fold cross-validation. These three top models also achieved AUC values ranging from 88% to 94%, signifying good performance. Figure 13 shows the calibration curves for these top three models.
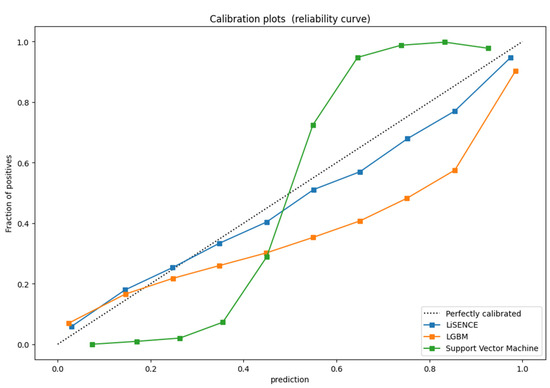
Figure 13.
Calibration plots for the best 3 models on the ChEMBL dataset.
Statistical Testing of 10-Fold CV
We performed six separate paired t-tests—one for each of the six ML model comparisons. The t-statistic and p-value are derived for each of the 10-fold tests. This was to verify if LiSENCE is significantly better than each of the six models. A paired t-test on the accuracy values for both LiSENCE and one of the six models is performed at a time across 10 test folds. The same is replicated for the other five ML models. In calculating the paired t-test, we first find the differences in accuracies between LiSENCE and the selected ML model, such as LGBM. We then find the mean and standard deviation of the differences. The t-statistic value is computed afterwards using the mean and standard deviation. We find the p-value using the t-statistic and degrees of freedom results.
Taking a significance level of 0.05, we would initially reject the null hypothesis (the assumption that there is no effect or difference between LiSENCE and the other models) if the obtained p-value is less. However, since we are performing multiple paired t-tests, the chance of Type I error (incorrectly rejecting the null hypothesis) increases with each test. In remedying this, we apply the Bonferroni Correction to derive the new significance (Snew)
Thus, if the p-value from a paired t-test is less than this new significance (0.005), the null hypothesis is rejected. Supplementary S3 in the Supplementary File presents the statistical results in detail.
4.7. Clinical Verification, Validation, and Application
In asessing the practicality of LiSENCE, we chose 20 drugs (Fluvoxamine, Lithium, Digoxin, Theophylline, Warfarin, Erythromycin, Phenytoin, Ritonavir, Voriconazole, Vancomycin, Imipenem, Amiodarone, Fluconazole, Carbamazepine, Valproic Acid, Amiodarone, Clarithromycin, Cimetidine, Ketoconazole, and Tacrolimus) that require therapeutic drug monitoring (TDM) mostly administered to patients in the Shangjin Nandi Hospital. None of these drugs were part of the training or validation sets. Out of these 20 drugs, LiSENCE was able to correctly identify the drugs in Table 12 as CYP450 inhibitors with about 68–85% accuracy. The rest of the drugs received very low percentages, between 20 and 40%, and five of these were later confirmed to be potent substrates (non-inhibitors) of the CYP450 isoforms. Digoxin and Lithium were discovered later not to be associated with CYP450 metabolism.

Table 12.
Drugs (requires TDM) predicted by LiSENCE as inhibitors from 20 drugs selected (Shangjin Nandi Hospital).
5. Discussion
5.1. The Effectiveness of Various AI Configurations: Individual LEN Ablation Study
In this section, we delve into the evaluation prediction results obtained for the LEN. Different AI configurations have been tested and investigated, as presented in Table 4, Table 5, Table 6, Table 7 and Table 8. It is observed that the LEN’s output across all metrics for surpasses the results achieved for the LEN when . A combination of the two receptive fields () yields better results than JoLA with single receptive fields across all metrics. This enabled the model to capture fine-grained local details and broader global structures, both of which are essential for understanding the ligand’s chemical properties and biological functions. Upon exploring the proposed JoLA module, we found that the performance of LEN without JoLA (i.e., using combined receptive fields) decreased by approximately 35.1% in terms of accuracy. When the LEN is executed without the AGIN (i.e., excluding only JoLA), the accuracy decreases by approximately 45.5%. This performance drop can be attributed to the complementary benefits of combining the Graph Isomorphism Network (GIN) and the self-attention mechanism. The GIN provided a robust representation of ligand graph data by focusing on structural features and local patterns. This focus helped to identify important substructures characteristic of inhibitors, leading to a higher true positive rate and a reduction in false negatives (FN). The attention mechanisms captured interactions that might not be evident when considering the entire graph. When the LEN is executed alone on the test sets, it achieves an accuracy of approximately 70.1%. This underscores the importance of integrating JoLA and the AGIN with other sub-modules to enhance the model’s overall effectiveness. Figure 8 shows the convergence curves for all LEN configurations. The LEN’s lower standard deviation suggests that the LEN’s performance is more consistent across different runs, proving that the full LEN is less sensitive to variations in the data, leading to more reliable predictions compared to the other models.
5.2. The Effectiveness of Various AI Configurations: Individual SEN Ablation Study
When the Sequence Encoder (SEN) is used independently, it achieves moderate performance across all metrics, yielding an accuracy of 66.3% as seen in Table 9. In contrast, the LEN demonstrates improved performance, achieving approximately 3.8% higher precision compared to the SEN. This enhancement can be attributed to the inclusion of more ligand information in the LEN model than in the SEN model. Figure 9 illustrates that the SEN maintains a convergence pattern like that of the LEN, although the LEN converges slightly faster for most metrics. The key component of the SEN, the Self-Attention module, allowed SEN to assign varying weights to different parts of the protein sequence, identifying the most relevant amino acids or motifs for the classification task. By modeling interactions across protein sequences, the Self-Attention module enhanced the representation of complex relationships, thus reflecting on the false negatives (FN). The self-attention mechanism diminished the influence of unimportant residues, thereby lowering the false positive rate (FP) and resulting in a clearer distinction between inhibitors and non-inhibitors.
5.3. The Proposed LiSENCE Against Its Individual Sub-Models (LEN and SEN)
The convergence curves presented in Figure 9, indicate that LiSENCE converges more quickly than both the LEN and SEN, while achieving the highest across all metrics. Additionally, LiSENCE exhibits the lowest standard deviation among the three models, signifying stable performance across different runs or data subsets. This consistency suggests that LiSENCE is likely to produce similar results across various scenarios, which is crucial for reliability. The lower variability in performance indicates that LEN is less sensitive to fluctuations in the data, suggesting its robustness and ability to generalize well to unseen data. In Figure 10, LiSENCE consistently demonstrates higher accuracy across all enzymes, remaining above 60%. Notably, it shows a significant increase in accuracy for 2C19 compared to the individual SEN and LEN models. The F1-score for the LiSENCE model improves over that of LEN, though it still trails SEN for certain enzymes. Again, 2D6 displays a lower F1-score than the others, indicating persistent challenges for this enzyme across all models. Overall, LiSENCE exhibits the best performance in both accuracy and F1-score, suggesting that the integration of ligand (LEN) and protein sequence (SEN) data enhances predictions across all enzymes. The models perform consistently across most enzymes, with minor variations for enzymes like 2D6, which consistently lags in performance metrics. While the LEN outperforms the SEN in both accuracy and F1-score overall, the LiSENCE model generally surpasses both individual models in accuracy, providing a balanced improvement in F1-score as well.
From the confusion matrix of the SEN, shown in Figure 11a, several misclassifications are evident. The SEN achieved the lowest scores in comparison to the LEN and LiSENCE. These misclassifications may stem from the SEN’s bias towards protein sequences, with less focus on ligands. The few misclassifications of LiSENCE arose from the close similarity of features among samples from different classes, which may interfere with the model’s ability to discern subtle feature differences accurately. LiSENCE capitalizes on the combined features from both the LEN and SEN, leveraging each model’s strengths to improve classification accuracy. This multimodal approach helps reduce both FP and FN to 50 and 47 cases, respectively. The synergy between insights from both modules captures complex patterns and relationships that may be overlooked by either model alone, resulting in enhanced overall predictions. Figure 14 shows the cause-and-effect summary of the performance of LiSENCE and its sub-models.
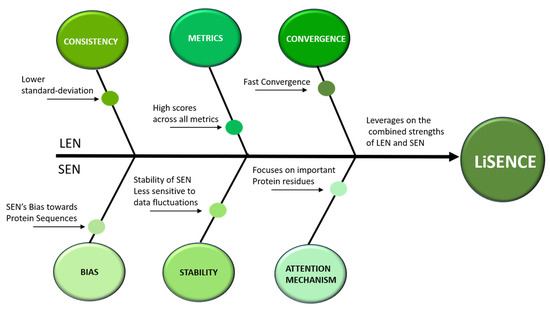
Figure 14.
Cause-and-effect diagram of the proposed model—LiSENCE.
5.4. LiSENCE vs. the State-of-the-Art AI Models
LiSENCE’s preferable results are because it leverages multiple self-attention mechanisms, which enhance feature extraction and improve generalization to diverse datasets, addressing data quality limitations. This is not the case with MumCypNet, which is limited by the availability of high-quality training data, which can affect its generalization ability. DeepCYPs struggle with scalability to large datasets and may be sensitive to noise in input data, impacting predictive accuracy. Additionally, its architecture can be difficult to modify for specific use cases. LiSENCE’s architecture allows for more flexible adjustments and better handling of noisy data, potentially increasing robustness and scalability. The GCNN often requires extensive computational resources, making it less accessible for smaller labs. Its performance can degrade with irregular graph structures, and it may face challenges in capturing long-range dependencies effectively. By integrating local attention modules, LiSENCE can better capture both local and global structural information, improving performance on irregular graph structures. iCYP-MFE can be limited by its reliance on predefined molecular features, which might not capture all relevant information. The interpretability of the results can also be a concern. LiSENCE performed well in determining the inhibitory potencies of unknown ligands for all five CYP isoforms, with AUCs exceeding 86% and 89%, respectively, as seen in Figure 10 LiSENCE’s ability to focus on relevant features improved its classification accuracy. The combination of local attention modules and Graph Isomorphism Networks (GINs) allowed LiSENCE to effectively distinguish between classes, which enhanced the AUC by better capturing the trade-off between sensitivity and specificity across different thresholds. The enhanced feature representation through self-attention helped LiSENCE identify positive instances more effectively, leading to a higher sensitivity. LiSENCE’s design achieved a better balance between precision and recall, which directly contributed to a higher F1-score. This is particularly beneficial in scenarios where both false positives and false negatives are critical to minimize. From Table 10, it can be observed that the prediction accuracy for some isoforms is lower than for others. This could be because some isoforms (e.g., 2D6, 2C19) may have more high-quality and balanced datasets, leading to better training and generalization. Isoforms like 1A2 and 3A4 may have class imbalance (e.g., more inhibitors than non-inhibitors), which can impact learning. Also, CYP3A4 and CYP1A2 are known to have broader substrate ranges, which increases chemical diversity and makes prediction harder. Isoforms like CYP2D6 and CYP2C19 might have more consistent binding patterns, helping models generalize better. Moreover, for some isoforms, the features extracted (e.g., ligand properties, protein sequences, graph structures) may not capture the key determinants of interaction clearly. Models might struggle to differentiate between actives and inactives due to overlapping or subtle differences in features.
Overall, LiSENCE’s architecture, combining the strengths of multiple attention modules and graph isomorphism, enabled it to effectively learn and generalize from complex data structures, potentially leading to superior performance across these metrics.
5.5. Biological Deductions from XAI Module
In Figure 12, the attention weights produced by LiSENCE aligned closely with those from the docking simulations in terms of determining which areas or atoms of the ligand possess the highest inhibitory strength. For CYP1A2, most interactions occurred around carbon atoms, primarily Van der Waals and alkyl interactions, indicating good ligand fit in hydrophobic receptor pockets. When a drug inhibits a CYP450 isoform, it prevents substrate binding or disrupts the enzyme’s catalytic activity. Van der Waals interactions support this inhibition by stabilizing the binding of the drug in the enzyme’s active site. For example, caffeine and theophylline, both CYP1A2 inhibitors, contain hydrophobic groups that can engage in Van der Waals interactions with the hydrophobic residues in the CYP1A2 active site, stabilizing the binding. Similarly, CYP2C9′s inhibitor had a strong alkyl interaction between a carbon atom and the ILE88 residue, reflected by its high attention weight (0.97). Inhibitors of the CYP450 enzymes work by binding to the active site and preventing the enzyme from metabolizing its substrates. Alkyl interactions contribute to this by stabilizing the binding of the inhibitor in the enzyme’s active site, preventing the substrate from fitting properly or undergoing metabolism. Inhibitors that interact through alkyl groups can block the enzyme’s ability to metabolize other drugs, leading to increased plasma concentrations of other drugs that are metabolized by the same enzyme. Drugs that contain alkyl substituents in their structure, such as methyl, ethyl, or propyl groups, can increase the hydrophobic contact between the drug and CYP2C9.
The CYP2C19 inhibitor showed Van der Waals and alkyl interactions, involving most inhibitor atoms. By interacting with hydrophobic amino acids in the enzyme’s active site, these interactions ensure that the inhibitor preferentially binds to CYP2C19 over other CYP450 isoforms, such as CYP3A4 or CYP2D6. Omeprazole, a CYP2C19 inhibitor, is used to treat gastric ulcers. It contains an aromatic ring and alkyl groups that interact with hydrophobic residues in the CYP2C19 active site. The alkyl interactions stabilize the binding of omeprazole, leading to its inhibition of CYP2C19. In the same vein, CYP2D6′s inhibitor exhibited significant Pi–Sulfur and Pi–anion interactions. Drugs that form Pi–Sulfur and Pi–anion interactions with CYP2D6 are often highly selective for this isoform due to the presence of Sulfur and anionic residues in the active site, which are not as prevalent in other CYP450 isoforms. Paroxetine contains an aromatic ring that can form Pi–Sulfur interactions with methionine residues in the CYP2D6 active site, contributing to its potent inhibition of the enzyme. Lastly, CYP3A4′s inhibitor displayed numerous interactions, mostly involving oxygen atoms, as confirmed by both the docking simulation and attention weights. Ketoconazole, itraconazole, and Fluconazole are antifungal drugs that inhibit CYP3A4 and contain oxygen-containing functional groups (e.g., hydroxyl, ether) that interact with the enzyme. These interactions can cause increased plasma levels of drugs metabolized by CYP3A4, such as statins (e.g., simvastatin) and benzodiazepines (e.g., midazolam). By comparing LiSENCE’s performance before and after resorting, the added interaction features improved prediction accuracy, as shown in Table 11, confirming the importance of the explainability module.
5.6. Ablation Study: Biological Inference of Clinical Verification and Validation
In this section, we make biological inferences on five drugs out of the twenty drugs used for clinical verification. These drugs are Ritonavir, Voriconazole, Fluconazole, Amiodarone, and Ketoconazole. One reliable resource from which DDI information about Ritonavir was obtained was Drugs.com https://www.drugs.com/drug_interactions.html (accessed on 5 February 2025), which contains vast drug interactions (major, moderate, minor). Major interactions are important from a clinical standpoint, and their combination should be avoided. Moderate interactions are clinically significant to a moderate extent. Combinations are generally avoided and should only be used in exceptional situations. Minor interactions have very little clinical significance and have minimal risk. The risk should be assessed, and other drugs should be considered. To avoid the interaction risk, a monitoring schedule should be set.
Ritonavir is an antiretroviral drug that inhibits CYP3A4 and CYP2D6. Ritonavir may cause apixaban levels in the blood to rise noticeably. This may raise the possibility of severe or fatal bleeding problems. It was also discovered that health professionals should generally avoid co-administering Voriconazole (inhibits CYP2C19, CYP2C9, and CYP3A4) and apixaban, which is one of the major drug interactions of Voriconazole for similar reasons [45]. Co-administering Fluconazole and hydrocodone should be closely monitored since hydrocodone is heavily metabolized by the CYP3A4, and coadministration with CYP450 3A4 inhibitors may raise plasma concentrations of the drug. It is possible that high hydrocodone concentrations could exacerbate or prolong negative drug effects and result in possibly lethal respiratory depression [46]. For Amiodarone (inhibits CYP450 2C9, 2D6, and 3A4), when taken simultaneously with Warfarin, it prevents CYP450 2C9 from metabolizing S-Warfarin in the liver. The effects of other oral anticoagulants can be similar, leading to bleeding and severe hypoprothrombinemia. Individuals with impaired CYP450 2C9 metabolism may be more susceptible to bleeding and experience the interaction more quickly [47]. One major drug interaction of Ketoconazole is with fluticasone. Fluticasone is extensively metabolized by CYP450 3A4 both first-pass and systemically; thus, inhibiting the CYP3A4 isoenzyme may greatly improve the drug’s systemic bioavailability. However, the way fluticasone is administered and the formulation may determine how much interaction occurs. In a study, it was discovered that a single dosage of oral inhalation fluticasone propionate (1000 mcg) combined with 200 mg of Ketoconazole once daily increased plasma fluticasone exposure by 1.9 times and decreased plasma cortisol AUC by 45%. However, there was no change in cortisol excretion in the urine [48]. In another study that used intranasal fluticasone furoate, 6 out of 20 participants who also received Ketoconazole (200 mg once a day for 7 days) exhibited detectable but low levels of fluticasone furoate, while only 1 participant received a placebo. Ketoconazole was projected to lower 24 h serum cortisol levels by 5% when compared to a placebo [48].
6. Limitations
LiSENCE did not incorporate multiple featurization schemes for both compounds and protein targets, suggesting potential for future studies to explore diverse data representations and capitalize on their complementary advantages. For example, compounds can be represented using SMILES-based sequence embeddings or molecular fingerprints (e.g., ECFP). Each of these feature representations emphasizes a different aspect: fingerprints encode the presence of substructures, graphs capture topological relationships, and SMILES encodes sequential structure. Similarly, protein targets can be featurized through amino acid sequences using one-hot encoding, physicochemical properties, or pre-trained embeddings from models such as ProtBERT or ESM. Moreover, the performance of LiSENCE can be highly sensitive to hyperparameter choices, requiring careful tuning to achieve optimal results, i.e., LiSENCE, like most deep learning models, especially multi-branch architectures with components like self-attention and graph isomorphism networks (GIN), has a large hyperparameter space. The performance (e.g., accuracy, AUC, F1-score) can vary significantly depending on how those hyperparameters are set.
7. Future Works
Multiple data featurization schemes of both compounds and proteins exist, which could be investigated to check their impact on the output of the model. For compounds, some known descriptors not used in this work include molecular fingerprints (Extended Connectivity Fingerprints and MACCS Keys), molecular descriptors combining multiple properties like LogP, topological polar surface area (TPSA), etc. For proteins, future works can explore some descriptors like sequence-based descriptors (amino acid composition, dipeptide composition, and sequence length), and physicochemical descriptors (molecular weight, isoelectric point, hydrophobicity, etc.).
8. Conclusions
In this study, we developed the LiSENCE model to predict potential inhibitors of five CYP450 isoforms. LiSENCE consists of two sub-models: the LEN, which processes ligand compounds, and the SEN, which analyzes the protein sequences of the CYP450 isoforms. The isoforms are encoded using sequences of 42 key substrate-binding residues, and both sub-models were rigorously trained through ablation studies. The effectiveness of LiSENCE was confirmed by comparing its performance to that of the sub-models, showcasing the benefits of their integration. LiSENCE utilized ligand/molecular graph featurization with a two-stage attention mechanism to identify critical structural information linked to inhibitory potency. The Joint Local Attention (JoLA) approach prioritized significant local interactions, while the AGIN proposal combined self-attention and Graph Isomorphism Networks (GIN) to enhance molecular graph representations. Our extensive datasets are used for training, testing, and verification, with the different ChEMBL BioAssay data outsourced; this validated LiSENCE’s generalizability even to new data, and its explainability sets it apart from existing ML methods, making it accessible to bioinformatics stakeholders. This study also established a clear connection between the classification and explainability modules, using RDKit’s heatmap function for interpretability. Notably, LiSENCE is unique in integrating insights from all sub-modules to refine its predictions, supported by molecular docking experiments that validated its findings. LiSENCE can be easily updated, and this was proven through the re-scoring strategy implemented by including new interaction features, such as van der Waals and alkyl interactions, which improved LiSENCE’s accuracy by nearly 2% across all CYP450 isoforms. Overall, LiSENCE outperformed state-of-the-art models and traditional ML techniques (e.g., LGBM, SVM, RF) across various metrics, including accuracy and AUC, confirming its strong predictive capability for CYP inhibitory potential.
Supplementary Materials
The following supporting information can be downloaded at https://www.mdpi.com/article/10.3390/math13091376/s1, Figure S1: Types and Degrees of Interactions; Figure S2: Confusion matrices for each of the 10-fold Cross validation; Table S1: Classification evaluation results per class using six machine learning classifiers over 10-fold cross-validation; Table S2: 10-fold Cross-validation Accuracy Results (%) for different mode; Table S3: p-value results for each of the 6 ML models.
Author Contributions
A.A.A.: Conceptualization; Investigation; Methodology; Writing—original draft; Formal Analysis; and Visualization. W.-P.W.: Supervision; Project Administration; Writing—review & editing; and Formal Analysis. S.B.Y.: Formal Analysis; Investigation; and Methodology. M.A.A.: Formal Analysis and Data Curation. E.K.T.: Software; Visualization; and Validation. C.C.U.: Visualization and Data Curation. Y.H.G.: Resources; Writing—review and editing; and Funding Acquisition. M.A.A.-a.: Supervision; Writing—review and editing; and Funding Acquisition. All authors have read and agreed to the published version of the manuscript.
Funding
This research was supported by the MSIT (Ministry of Science and ICT), Republic of Korea, under the ITRC (Information Technology Research Center) support program (IITP-2024-RS-2024-00437191) supervised by the IITP (Institute for Information & Communications Technology Planning & Evaluation.
Data Availability Statement
All data and code are available at https://github.com/GracedAbena/LiSENCE/tree/main (accessed on 18 April 2025).
Acknowledgments
This research was supported by the MSIT (Ministry of Science and ICT), Republic of Korea, under the ITRC (Information Technology Research Center) support program (IITP-2024-RS-2024-00437191) supervised by the IITP (Institute for Information & Communications Technology Planning & Evaluation. This work was supported by the National Research Foundation of Korea (NRF) grant funded by the Korean government (MSIT) (No. RS-2023-00256517).
Conflicts of Interest
Authors Abena Achiaa Atwereboannah and Wei-Ping Wu were employed by the SipingSoft Co., Ltd. The remaining authors declare that the research was conducted in the absence of any commercial or financial relationships that could be construed as a potential conflict of interest.
Abbreviations
| AI | Artificial Intelligence |
| XAI | Explainable Artificial Intelligence |
| LEN | Ligand Encoder Network |
| DDI | Drug–Drug Interactions |
| SEN | Sequence Encoder Network |
| LiSENCE | Ligand and Sequence Encoder Networks for Predicting CYP450 Inhibitors |
| GIN | Graph Isomorphism Network |
| AGIN | Attentive Graph Isomorphism Network |
| LA | Local Attention |
| JoLA | Joint-localized Attention |
| ML | Machine Learning |
| CV | Cross-validation |
| DL | Deep Learning |
| BR | Before Re-scoring |
| AR | After Re-scoring |
| SMILES | Simplified Molecular Input Line Entry System |
| PDB | Protein Data Bank |
| CYP450 | Cytochrome P450 |
References
- Li, X.; Xu, Y.; Lai, L.; Pei, J. Prediction of Human Cytochrome P450 Inhibition Using a Multitask Deep Autoencoder Neural Network. Mol. Pharm. 2018, 15, 4336–4345. [Google Scholar] [CrossRef] [PubMed]
- Arimoto, R. Computational models for predicting interactions with cytochrome p450 enzyme. Curr. Top. Med. Chem. 2006, 6, 1609–1618. [Google Scholar] [CrossRef]
- Guengerich, F.P. Cytochrome P450s and other enzymes in drug metabolism and toxicity. AAPS J. 2006, 8, E101–E111. [Google Scholar] [CrossRef]
- Ingelman-Sundberg, M. Pharmacogenetics of cytochrome P450 and its applications in drug therapy: The past, present and future. Trends Pharmacol. Sci. 2004, 25, 193–200. [Google Scholar] [CrossRef] [PubMed]
- Zhou, S.-F.; Liu, J.-P.; Chowbay, B. Polymorphism of human cytochrome P450 enzymes and its clinical impact. Drug Metab. Rev. 2009, 41, 89–295. [Google Scholar] [CrossRef] [PubMed]
- Zhou, S.-F.; Wang, B.; Yang, L.-P.; Liu, J.-P. Structure, function, regulation and polymorphism and the clinical significance of human cytochrome P450 1A2. Drug Metab. Rev. 2010, 42, 268–354. [Google Scholar] [CrossRef]
- Zhou, Y.; Ingelman-Sundberg, M.; Lauschke, V.M. Worldwide Distribution of Cytochrome P450 Alleles: A Meta-analysis of Population-scale Sequencing Projects. Clin. Pharmacol. Ther. 2017, 102, 688–700. [Google Scholar] [CrossRef]
- Deodhar, M.; Al Rihani, S.B.; Arwood, M.J.; Darakjian, L.; Dow, P.; Turgeon, J.; Michaud, V. Mechanisms of CYP450 Inhibition: Understanding Drug-Drug Interactions Due to Mechanism-Based Inhibition in Clinical Practice. Pharmaceutics 2020, 12, 846. [Google Scholar] [CrossRef]
- Cassagnol, B.G.M. Biochemistry, Cytochrome P450. In StatPearls [Internet]; Statpearls Publishing: Treasure Island, FL, USA, 2023. [Google Scholar]
- Knox, C.; Law, V.; Jewison, T.; Liu, P.; Ly, S.; Frolkis, A.; Pon, A.; Banco, K.; Mak, C.; Neveu, V.; et al. DrugBank 3.0: A comprehensive resource for ‘omics’ research on drugs. Nucleic Acids Res. 2011, 39, D1035–D1041. [Google Scholar] [CrossRef]
- Kanehisa, M.; Goto, S.; Sato, Y.; Furumichi, M.; Tanabe, M. KEGG for integration and interpretation of large-scale molecular data sets. Nucleic Acids Res. 2012, 40, D109–D114. [Google Scholar] [CrossRef]
- Szklarczyk, D.; Santos, A.; Von Mering, C.; Jensen, L.J.; Bork, P.; Kuhn, M. STITCH 5: Augmenting protein–chemical interaction networks with tissue and affinity data. Nucleic Acids Res. 2016, 44, D380–D384. [Google Scholar] [CrossRef] [PubMed]
- Zdrazil, B.; Felix, E.; Hunter, F.; Manners, E.J.; Blackshaw, J.; Corbett, S.; de Veij, M.; Ioannidis, H.; Lopez, D.M.; Mosquera, J.F.; et al. The ChEMBL Database in 2023: A drug discovery platform spanning multiple bioactivity data types and time periods. Nucleic Acids Res. 2024, 52, D1180–D1192. [Google Scholar] [CrossRef] [PubMed]
- Davis, M.I.; Hunt, J.P.; Herrgard, S.; Ciceri, P.; Wodicka, L.M.; Pallares, G.; Hocker, M.; Treiber, D.K.; Zarrinkar, P.P. Comprehensive analysis of kinase inhibitor selectivity. Nat. Biotechnol. 2011, 29, 1046–1051. [Google Scholar] [CrossRef]
- Njimbouom, S.N.; Kim, J.-D. MuMCyp_Net: A multimodal neural network for the prediction of Cyp450. Expert Syst. Appl. 2024, 255, 124703. [Google Scholar] [CrossRef]
- Chang, J.; Fan, X.; Tian, B. DeepP450: Predicting Human P450 Activities of Small Molecules by Integrating Pretrained Protein Language Model and Molecular Representation. J. Chem. Inf. Model. 2024, 64, 3149–3160. [Google Scholar] [CrossRef] [PubMed]
- Chen, Z.; Zhang, L.; Zhang, P.; Guo, H.; Zhang, R.; Li, L.; Li, X. Prediction of Cytochrome P450 Inhibition Using a Deep Learning Approach and Substructure Pattern Recognition. J. Chem. Inf. Model. 2024, 64, 2528–2538. [Google Scholar] [CrossRef]
- Kim, S.; Chen, J.; Cheng, T.; Gindulyte, A.; He, J.; He, S.; Li, Q.; Shoemaker, B.A.; Thiessen, P.A.; Yu, B.; et al. PubChem 2023 update. Nucleic Acids Res. 2023, 51, D1373–D1380. [Google Scholar] [CrossRef]
- Ai, D.; Cai, H.; Wei, J.; Zhao, D.; Chen, Y.; Wang, L. DEEPCYPs: A deep learning platform for enhanced cytochrome P450 activity prediction. Front. Pharmacol. 2023, 14, 1099093. [Google Scholar] [CrossRef]
- Li, L.; Lu, Z.; Liu, G.; Tang, Y.; Li, W. Machine Learning Models to Predict Cytochrome P450 2B6 Inhibitors and Substrates. Chem. Res. Toxicol. 2023, 36, 1332–1344. [Google Scholar] [CrossRef]
- Ouzounis, S.; Panagiotopoulos, V.; Bafiti, V.; Zoumpoulakis, P.; Cavouras DKalatzis, I.; Matsoukas, M.T.; Katsila, T. A Robust Machine Learning Framework Built Upon Molecular Representations Predicts CYP450 Inhibition: Toward Precision in Drug Repurposing. OMICS A J. Integr. Biol. 2023, 27, 305–314. [Google Scholar] [CrossRef] [PubMed]
- Weiser, B.; Genzling, J.; Burai-Patrascu, M.; Rostaing, O.; Moitessier, N. Machine learning-augmented docking. 1. CYP inhibition prediction. Digit. Discov. 2023, 2, 1841–1849. [Google Scholar] [CrossRef]
- Qiu, M.; Liang, X.; Deng, S.; Li, Y.; Ke, Y.; Wang, P.; Mei, H. A unified GCNN model for predicting CYP450 inhibitors by using graph convolutional neural networks with attention mechanism. Comput. Biol. Med. 2022, 150, 106177. [Google Scholar] [CrossRef]
- Nguyen-Vo, T.-H.; Trinh, Q.H.; Nguyen, L.; Nguyen-Hoang, P.-U.; Nguyen, T.-N.; Nguyen, D.T.; Nguyen, B.P.; Le, L. iCYP-MFE: Identifying Human Cytochrome P450 Inhibitors Using Multitask Learning and Molecular Fingerprint-Embedded Encoding. J. Chem. Inf. Model. 2022, 62, 5059–5068. [Google Scholar] [CrossRef]
- Plonka, W.; Stork, C.; Šícho, M.; Kirchmair, J. CYPlebrity: Machine learning models for the prediction of inhibitors of cytochrome P450 enzymes. Bioorganic Med. Chem. 2021, 46, 116388. [Google Scholar] [CrossRef] [PubMed]
- Park, H.; Brahma, R.; Shin, J.M.; Cho, K.H. Prediction of human cytochrome P450 inhibition using bio-selectivity induced deep neural network. Bull. Korean Chem. Soc. 2022, 43, 261–269. [Google Scholar] [CrossRef]
- Banerjee, P.; Dunkel, M.; Kemmler, E.; Preissner, R. SuperCYPsPred-a web server for the prediction of cytochrome activity. Nucleic Acids Res. 2021, 48, W580–W585. [Google Scholar] [CrossRef]
- Atwereboannah, A.A.; Wu, W.-P.; Nanor, E. Prediction of Drug Permeability to the Blood-Brain Barrier using Deep Learning. In Proceedings of the 4th International Conference on Biometric Engineering and Applications, ICBEA ’21, Taiyuan, China, 25–27 May 2021. [Google Scholar]
- Atwereboannah, A.A.; Wu, W.-P.; Ding, L.; Yussif, S.B.; Tenagyei, E.K. Protein-Ligand Binding Affinity Prediction Using Deep Learning. In Proceedings of the 18th International Computer Conference on Wavelet Active Media Technology and Information Processing (ICCWAMTIP), Chengdu, China, 17–19 December 2021; pp. 208–212. [Google Scholar]
- Agyemang, B.; Wu, W.-P.; Kpiebaareh, M.Y.; Lei, Z.; Nanor, E.; Chen, L. Multi-view self-attention for interpretable drug-target interaction prediction. J. Biomed. Inform. 2020, 110, 103547. [Google Scholar] [CrossRef] [PubMed]
- Landrum, G.A. RDKit: Open-Source Cheminformatics. Release 2014.03.1; Zenodo: Munich, Germany, 2014. [Google Scholar]
- Berman, H.M.; Westbrook, J.; Feng, Z.; Gilliland, G.; Bhat, T.N.; Weissig, H.; Shindyalov, I.N.; Bourne, P.E. The Protein Data Bank. Nucleic Acids Res. 2000, 28, 235–242. [Google Scholar] [CrossRef]
- Weininger, D. SMILES, a chemical language and information system. 1. Introduction to methodology and encoding rules. J. Chem. Inf. Comput. Sci. 1988, 28, 31–36. [Google Scholar] [CrossRef]
- Pawar, S.S.; Rohane, S.H. Review on Discovery Studio: An important Tool for Molecular Docking. Asian J. Res. Chem. 2021, 14, 1–3. [Google Scholar] [CrossRef]
- Yuan, S.; Chan, H.; Hu, Z. Using PyMOL as a platform for computational drug design. WIREs Comput. Mol. Sci. 2017, 7, e1298. [Google Scholar] [CrossRef]
- Bielka, H.; Sharon, N.; Australia, E.W. Nomenclature and symbolism for amino acids and peptides (Recommendations 1983). Pure Appl. Chem. 1984, 56, 595–624. [Google Scholar] [CrossRef]
- Selvaraju, R.R.; Cogswell, M.; Das, A.; Vedantam, R.; Parikh, D.; Batra, D. Grad-CAM: Visual Explanations from Deep Networks via Gradient-Based Localization. Int. J. Comput. Vis. 2020, 128, 336–359. [Google Scholar] [CrossRef]
- Morris, G.M.; Huey, R.; Lindstrom, W.; Sanner, M.F.; Belew, R.K.; Goodsell, D.S.; Olson, A.J. AutoDock4 and AutoDockTools4: Automated docking with selective receptor flexibility. J. Comput. Chem. 2009, 30, 2785–2791. [Google Scholar] [CrossRef] [PubMed]
- Ke, G.; Meng, Q.; Finley, T.; Wang, T.; Chen, W.; Ma, W.; Ye, Q.; Liu, T.-Y. Lightgbm: A highly efficient gradient-boosting decision tree. Adv. Neural Inf. Process. Syst. 2017, 30, 3146–3154. [Google Scholar]
- Pisner, D.A.; Schnyer, D.M. Support vector machine. In Methods and Applications to Brain Disorders; Academic Press: New York, NY, USA, 2020; pp. 101–121. Available online: https://www.sciencedirect.com/science/article/pii/B9780128157398000067 (accessed on 18 April 2025).
- Ho, T.K. Random decision forests. In Proceedings of the 3rd International Conference on Document Analysis and Recognition, Montreal, QC, Canada, 14–16 August 1995; pp. 278–282. [Google Scholar]
- Malik, S.; Harode, R.; Kunwar, A. XGBoost: A Deep Dive into Boosting. (Introduction Documentation); Simon Fraser University: Burnaby, BC, Canada, 2020; pp. 1–21. [Google Scholar]
- Yang, F.-J. An Implementation of Naive Bayes Classifier. In Proceedings of the 2018 International Conference on Computational Science and Computational Intelligence (CSCI), Las Vegas, NV, USA, 12–14 December 2018; pp. 301–306. [Google Scholar]
- Laaksonen, J.; Oja, E. Classification with learning k-nearest neighbors. In Proceedings of the International Conference on Neural Networks (ICNN’96), Washington, DC, USA, 3–6 June 1996. [Google Scholar]
- Igho-Osagie, E.; Puenpatom, A.; Williams, M.G.; Song, Y.; Yi, D.; Wang, J.; Berman, R.; Gu, M.; He, C. Prevalence of potential drug-drug interactions with ritonavir-containing COVID-19 therapy. J. Manag. Care Spéc. Pharm. 2023, 29, 509–518. [Google Scholar] [CrossRef] [PubMed]
- Lazar, J.D.; Wilner, K.D. Drug Interactions with Fluconazole. Clin. Infect. Dis. 1990, 12, S327–S333. [Google Scholar] [CrossRef]
- Marcus, F.I. Drug interactions with amiodarone. Am. Heart J. 1983, 106, 924–930. [Google Scholar] [CrossRef]
- Kaeser, B.; Zandt, H.; Bour, F.; Zwanziger, E.; Schmitt, C.; Zhang, X. Drug-Drug Interaction Study of Ketoconazole and Ritonavir-Boosted Saquinavir. Antimicrob. Agents Chemother. 2009, 53, 609–614. [Google Scholar] [CrossRef]
Disclaimer/Publisher’s Note: The statements, opinions and data contained in all publications are solely those of the individual author(s) and contributor(s) and not of MDPI and/or the editor(s). MDPI and/or the editor(s) disclaim responsibility for any injury to people or property resulting from any ideas, methods, instructions or products referred to in the content. |
© 2025 by the authors. Licensee MDPI, Basel, Switzerland. This article is an open access article distributed under the terms and conditions of the Creative Commons Attribution (CC BY) license (https://creativecommons.org/licenses/by/4.0/).