Abstract
This article presents a methodology of the decision-making process using mathematical tools, which can become a practical tool for decision-makers on the functioning and strategic development of business ecosystems and their components depending on changes in the internal, micro- and macroenvironment. An algorithm for finding linearly independent elements of digital business ecosystems and a new option for interpreting their results are developed. It is proposed that this impact be determined by calculating the eigenvectors of the matrix and identifying the dependence through the contribution of the eigenvectors to the overall mechanism of the system. A system analysis of the properties of business ecosystems is carried out with a subsequent description of the methodology for studying the impact of financial indicators on it. As an example of data for calculation, the article uses Yandex data for 2023, as the most indicative business ecosystem with all the necessary properties. The results of the study allow formulating recommendations for top management on making management decisions and points of application of efforts. Combining the developed methodology with promising technologies for automated calculation of big data and AI will provide a flexible management tool with the possibility of its further development.
Keywords:
matrices of unlimited size; linearly independent elements; vector analysis; business ecosystem; ecosystem properties; decision-making; financial indicators of a business ecosystem MSC:
65F15
1. Introduction
This article raises research questions about the application of mathematical tools of matrices of unlimited size for modeling the decision-making process of business ecosystems.
In recent years, the phenomenon of business ecosystems has received more and more attention in scientific and practice-oriented areas. Nowadays, many manufacturers of technically sophisticated devices apply an ecosystem approach throughout the lifecycle of their products from development to replication. The most globally known examples of business ecosystems are companies such as Apple, Amazon and a number of others, which build their connections based on the needs of the end customers, thereby providing them with cross-compatible products and services at highly competitive prices and with the most convenient sales technologies for the consumer. For example, Siemens applies the capabilities of the ecosystem approach in various areas of its interests: the Signaling X system is for signaling systems, and the Desigo CC system is for software development. Other remarkable examples are some of the most dynamically developing digital ecosystems on the Russian market, such as the Yandex and Mail.ru Group IT-holdings, as well as the largest Russian bank “Sber” that since its creation has had a huge database formed from an array of data of the bank services users and supplemented by their behavioral characteristics that allows identifying trends for making management decisions. In the current period of rapid development of information technology, and the provision of services and products that meet the needs and desires of customers, the presented research can be used to build and manage a new, higher form of organizational integration—a business ecosystem.
The relevance of this research is confirmed by the rapid development of these business ecosystems due to the reduction in transaction costs by the development of internal connections on the existing customer base, thereby reorienting customers’ needs to the supplier of services or goods. Such new integration forms of business demonstrate higher stability of functioning and efficiency due to the synergetic effect: the components of the business ecosystem create joint effects that none of them could create acting outside the system, and by building a business ecosystem, they gain competitive advantages. This leads researchers to think about the issue of finding the optimal point for the appropriate inclusion of a particular organization in the business ecosystem. The ability to identify this point in the organization’s life cycle significantly expands the horizons of planning its activities, avoiding crises of stagnation and bankruptcy, and equips the corporate center and management with tools for flexible strategic decision-making.
The importance of considering synthetic disciplines and the development of nature-like technologies integrated into all areas of science, not excluding mathematical and economic spheres, should be noted. Therefore, starting to model the decision-making process based on an assessment of the impact of financial indicators on the properties of a business ecosystem, a number of economic mechanisms of functioning of organizations that have analogies with biological processes occurring in ecosystems were analyzed. The observed patterns have proved the fact that the moment of the life cycle, which is optimally positioned for integration into the business ecosystem, can be described mathematically, through indicators that most accurately characterize the ecosystem properties of the object under study. Such an analysis can serve as a basis for making a decision to integrate a business into a higher-order business system—the business ecosystem. In this formulation, this issue is being considered in science for the first time.
This article presents the development of a methodology using mathematical modeling of the decision-making process, which can become a practical tool for those making decisions on the functioning and strategic development of business ecosystems and their components, depending on changes in the internal, micro- and macroenvironment.
The article consists of five sections. Section 1 contains an introduction. Section 2 examines the theoretical foundations of the research and the review of approaches to studying business ecosystems. Section 3 describes the research methodology and data and substantiates the indicators. Section 4 presents the results obtained. Finally, Section 5 discusses the findings and offers concluding considerations and suggestions for future research.
2. Theoretical Background
Business ecosystems, the category that will be explored in this research further, are ecosystems in business of all types and areas of activity. The history of the development of the concept of “ecosystem” in economics determines its semantic load. In the 1920s, the Russian scientist A. Bogdanov in his work “Tectology: The Universal Organizational Science” [1] proposed a new approach to the consideration of organizational systems and their research according to the principles of organization or disorganization, as well as the mutual influence of internal and external objects of the system on each other. In 1935, A. Tansley [2] first used this term. In 1999, J. Moore [3] used biosimilars in the description of enterprise management, becoming the first researcher of business ecosystems in the modern sense. By the concept of a business ecosystem, he means a network consisting of organizations and individual representatives of the business community, which together not only form a system of mutual support but also evolve.
Modern studies present the theory of the foundation [4,5,6], construction and development of business ecosystems [7,8,9]. Issues of the competitive advantages and cooperation in business ecosystems and various aspects of the functioning of business systems were considered in the studies [10,11,12]. Business ecosystems from the point of view of the entrepreneurial model are considered in publications [13,14,15,16,17]. A very detailed study of entrepreneurial ecosystems in advanced and emerging economies was performed in a systematic literature review in [18]. Some researchers have studied business ecosystems in the context of innovation [19,20,21,22]. Sustainability as a property of business ecosystems is reflected in [23,24,25,26,27,28]. And studies [29,30] are devoted to the strategic management of business ecosystems. A number of studies have already raised issues of terminology, classification, composition and individual components of business ecosystems, but the properties of ecosystems are currently, as well as their behavioral responses to management influences, not fully studied [31,32]. The issues of overcoming the transition point from an upward to downward wave on the organization’s life cycle graph are studied in sufficient detail within the framework of the theory of crisis management and the life cycle of organizations [33,34,35,36,37,38], approaches to assessing the probability of bankruptcy [39,40].
However, despite the high development rates of business ecosystems in the global economy, the issues of patterns of their creation, functioning and development remain poorly studied. The indicators used for the decision-making process are based on expert assessments, use average coefficients formed on the basis of certain sample populations of the surveyed companies, are not devoid of subjectivity in assessments, and most importantly do not help managers make reasoned decisions on strategic planning. Also, the capabilities of big data and mathematical modeling tools for business ecosystems still leave many issues open to discussion.
Existing research on this topic is purely theoretical in nature and essentially describes the processes taking place in time coordinates within an ecosystem. The definition of parameters and their modification, in our opinion, can clarify and provide recommendations on the choice of points of application of managerial efforts to manage the business ecosystem, as well as the choice of meters in terms of the strength of ecosystem properties and their dependence on the results of the entire system as a whole.
The purpose of the research is to develop a new algorithm for consistently calculating the impact of economic indicators of a business ecosystem on its properties, which makes it possible to identify points of application of managerial efforts in its lifecycle to increase the sustainability of the entire system and create the possibility of its effective development through the inclusion of a single organization in the business ecosystem.
For this purpose, this research proposes to develop an algorithm using the mathematical tools of automated calculation of matrices of unlimited size, formed as a result of the expansion of possible indicators and combinations of properties of the business ecosystem. This allows the use of big data calculations and, subsequently, self-learning algorithms using neural networks. This approach to managing organizational units of any order is being used for the first time.
The present study is a pilot study, and currently no work has been carried out to consider the impact on ecosystem properties, especially in the field of biosimilars. Calculations using big data allow you to expand the influence matrix to the required size, adding an unlimited array of properties decomposed to various levels, as well as to make a variant calculation for making managerial decisions. With a multiple increase in the data set, the use of a trained neural network will be necessary for calculation, and data processing will lead to the search and development of non-trivial solutions. The principles of the neural network are based on the numerical representation of queries and their processing by passing through an array of neural layers, learning by adjusting the weights and parameters of the set values.
If we talk about the practical side of using the considered methodology, then when managing a business ecosystem, an unlimited number of internal and external relationships arise between participants who dynamically rebuild, thereby changing the set of beneficiaries of the ecosystem. The considered methodology will make it possible to take into account such diverse interests as much as possible and find the optimal balance between the implementation of ecosystem properties and financial performance indicators that determine the ability of the system to be in balance and have the opportunity for further development.
The objectives of this research are the following:
- -
- Development of mathematical tools for making management decisions;
- -
- Selection and verification of indicators characterizing the basic properties of ecosystems for calculation in the model;
- -
- Ranking the impact of indicators on the properties of the business ecosystem;
- -
- Calculation of the proposed model using indicators of the business ecosystem (for the example of the IT company “Yandex”;
- -
- Determining the impact vectors of indicators on the properties of the business ecosystem and their contribution to the system mechanism.
The hypothesis of this research was the assumption that identifying the point of optimal transition of an organization into the business ecosystem will have a significant impact on the effectiveness of planning its activities in the area of the nearest strategic development.
3. Materials and Methods
The largest Russian business ecosystems were considered as the object of research: Sberbank, Yandex, T-Bank, MTS and others. Based on the results of the review, Yandex was selected as an ecosystem with pronounced ecosystem properties and components. A group of services is constantly developing as cenoses in the Yandex ecosystem, from blogs and multimedia libraries to an electronic trading platform and a vehicle-sharing service. As a biotope, the ecosystem in question uses the Runet space—the Russian-speaking part of the Internet with its huge number of users, united not only by language, but also by preferences for services and goods, seasonal changes, etc. Yandex’s communications are built taking into account all modern requirements in terms of high-speed communication services and powerful data centers that allow you to accumulate data on all user actions for further analysis and improvement of the quality and range of services provided. The data from the largest digital business ecosystems of the modern IT sector in Russia, Yandex N.V, and its official reporting [41] will be used as a practical object for considering the properties of the ecosystem and as the most indicative and having all the properties of ecosystems, namely integrity, self-reproduction, sustainability, self-regulation and emergence.
All the data for analysis in this research were obtained from open sources [41] according to annual reports for 2023. Matrix calculations were performed using the service [42].
In order to obtain reliable data, when using the methodology, official retrospective reports of companies should be used, taking into account the full availability of the necessary indicators characterizing the properties of the business ecosystem.
Both general scientific methods, such as factor analysis and the expert method, and special methods for constructing analogies, in particular, the second similarity theorem that allows bringing ecosystem properties to economic indicators, were used to search for and process information.
In practice, the application of eigenvalues and eigenvectors of a matrix is used to solve various technical applications in the field of building various communication systems, calculating the rigidity of engineering structures and designing various machines and mechanisms. In essence, eigenvalues and eigenvectors allow the decomposition of a process into smaller components, thereby making the process of managing the entire system more transparent and finding suitable tools. The theoretical foundations of such techniques were considered by A. Kotelkin and M. Musin in their monograph “Influence Matrices” [43]. It should be noted that the application of such mathematical methods to the field of management decision-making is being performed for the first time.
Taking into account the description of the properties of the business ecosystem, a set of performance indicators that affect the achievement of a specific property was identified. In this research, the following hypothesis is used: each of the ecosystem properties is determined by a set of characteristics, the positive dynamics of which indicate the strengthening of the property.
It is advisable to determine the set of ecosystem characteristics by the following performance indicators [44]:
- -
- Total revenue (revenue is the main income that a business receives from its main, core activities, such as selling products, performing work or providing services);
- -
- Profitability calculated on the basis of adjusted EBITDA (the calculation of EBITDA margin allows for assessing the effectiveness of a company’s cost-cutting efforts: the higher the EBITDA margin, the lower its operating costs relative to total revenue, and the higher the company’s efficiency);
- -
- Net profit (net profit reflects the company’s profit before interest on borrowed funds and taxes; it takes into account only the company’s operating activities, excluding financial and tax expenses);
- -
- Share of the core company (Yandex search company) in the Russian market [41];
- -
- Number of all users;
- -
- Core revenue;
- -
- Revenue from services (excluding core);
- -
- Intra-segment revenue.
A core company is a company designated by the terms “bandmaster” or “orchestrator” in international business ecosystem management practice.
Let us determine the most important indicators from the set presented above for each of the five ecosystem properties and justify the choice for each property.
Integrity is a property of a system that shows that each element contributes to the realization of its objective function [45]. At the same time, the objective function for business ecosystems is the function of maximizing revenue while minimizing costs. Each element of the ecosystem occupies a certain place and has a certain number of connections, both with the core and with other business organizations within the ecosystem. Integrity is characterized by the harmonious unity of the interrelationships of the elements, ensuring the achievement of the goal in the most coordinated way, and in case of integration of entrepreneurial organizations and the business ecosystem, in the most economically efficient way. The most indicative of the set of indicators in this case is profitability (based on EBITDA), which shows a reduction in operating costs relative to total revenue and thus determines the effectiveness of links within the ecosystem.
The property of self-reproduction is characterized by the stable growth of the entire business ecosystem, and its individual components can be fueled by adjacent components. In this case, it is possible to point out that the system produces components for its growth, and the essence of business ecosystems is characterized by the expansion of the entire system, both through the core and through the growth of the constituent components. The most indicative indicator for this property is the total revenue, which shows the scale of growth of the ecosystem as a whole.
The sustainability of a system is its ability to return to an equilibrium state after it has been brought out of this state by external influences. If ecosystems are considered, their sustainability is characterized by the ability to develop and function in conditions of disturbing influences, both external and internal. The sustainability of an organizational system is its ability to keep moving along the intended trajectory (in the case of a business ecosystem, this is its ability to follow its development strategy). Within the framework of this ecosystem research, it is proposed to consider the change in the net profit of the system (the ratio of the net profit of the current year to the past) as an indicator characterizing this property, showing the system’s resistance to external and internal influences.
The self-regulation function is characterized by the redistribution of necessary resources between ecosystem components. In the case of the business ecosystems under consideration, self-regulation is determined by market processes occurring in the ecosystem functioning environment. The redistribution of resources occurs in order to sell the services and goods of the system participants in the most rational and efficient way. The self-regulation function is proposed to be characterized by intra-segment calculations showing the movement of resources within the segment, thereby ensuring the process of regulating resources within the system.
The emergence property of an ecosystem in the classical interpretation is characterized by the appearance of new properties in the growth and change processes. When ecosystem components interact, new properties or behaviors arise that are not typical for simpler organizations. Weak emergence occurs when complex phenomena are transformed from simple processes, while strong emergence is characteristic of fundamentally new phenomena that cannot be predicted.
It is worth characterizing the emergence property by the ratio of core revenue to service revenue.
In order to determine the impact of each indicator on individual ecosystem properties, it is proposed to use the law of self-preservation. For its development, the system as a whole should acquire a stable property of self-preservation, combining the five previously mentioned properties. This is what will allow it to maximize the realization of these properties, thereby creating a solid foundation for survival and further development.
Structural stability is important for the business ecosystem that does not restrain its active development. Here, Le Chatelier’s law of equilibrium should be used: if a system in equilibrium is exposed to an effect that changes any of its conditions, then processes arise in it aimed at counteracting these changes with a subsequent transition to a new state of equilibrium, thereby passing through certain stages of development. This development model meets the requirements of our ecosystem behavior model.
To quantify the sustainability, the indicative indicators shown in Table 1 are used.

Table 1.
Defining indicative indicators for business ecosystem properties.
The mechanism of self–preservation consists in the continuous maintenance of a given level of disorganization (entropy (chaos)), constant counteraction to destructive factors that violate the order in it, determined by the properties under consideration.
In this state of the business ecosystem, it is proposed to consider the following relationship:
where the following definitions hold:
are destabilizing factors of the internal environment (changes in the general behavior strategy, rules for building connections, changes in the bandwidth of communication channels, management errors, increase or decrease in the number of ecosystem participants, changes in the properties of the ecosystem core, etc.);
are destabilizing factors of the external environment (inflation, fluctuations in demand for various types of products and services, changes in the structure of the customer base and their preferences, user loyalty, political and geopolitical situation, economic crises, etc.);
are internal resources for sustainability (management decision-making, reconfiguration of links between ecosystem participants and the core, growth of management competencies, internal regulatory measures, etc.);
are external resources (political lobbying, attracting investors, expanding the circle of beneficiaries, etc.) [45].
Let us assume that the property of self-preservation is maximally realized at the point of necessary equilibrium, taking into account the possibility of development and the synergetic effect from the implementation of the previously indicated ecosystem properties. The synergetic effect of the maximum possible achievement of these five properties is reflected in the magnitude of the entire system’s potential, as well as in the possibility of its further development. It should be noted that an ecosystem cannot be in complete equilibrium and should constantly evolve, thereby fully realizing the properties of self-reproduction and emergence.
The general algorithm of the calculation part is shown in the next figure (Figure 1).
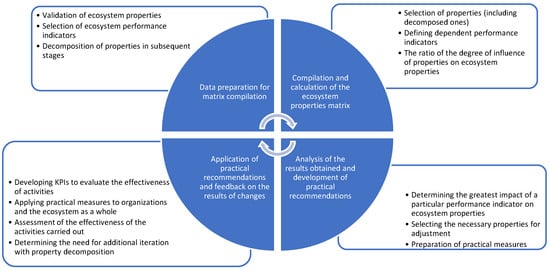
Figure 1.
The general algorithm of the calculation.
4. Results
In order to apply the above concept in practice, the authors proposed a methodology for determining the point of maximum concentration of ecosystem properties as the point of the most effective state for the preservation of properties and further development [46,47].
Each of the ecosystem properties (integrity, self-reproduction, sustainability, self-regulation and emergence) is assigned one indicative indicator (Table 1) that most fully characterizes it.
In the authors’ model, the first iteration suggests the following dependency. Each selected property is directly influenced by both the indicative indicator and the remaining others, but with less force. To determine the degree of influence of each of the indicators on the property of the business ecosystem, the authors used the ranking method of indicators with justification of their significance. Table 2 shows the results. When the rank is higher, the influence of the indicator on the property is lower.
Table 2.
Ranking the impact of indicators on the properties of the business ecosystem.
After that, the authors ranked the indicators to distribute their impact on each of the properties. Taking into account the definitions of the above properties, they justified their effects on each.
Integrity, as mentioned earlier, is determined by the contribution of each element to the final result of the ecosystem. Taking into account the unity of the ecosystem and the set of its properties with the definition of each of the related properties, it is possible to determine their ranked influence on the property of integrity. In this case, the most influential property, according to the authors, is the property of ecosystem sustainability, followed by the properties of self-reproduction, sustainability, self-regulation and emergence, in that order.
The authors similarly determined the influence on the remaining properties.
To distribute the influence, the authors used an estimate of the probability of influence that is distributed linearly. So, with a linear probability distribution of dependence, the indicative indicator for the probability of influence is equal to 1 for the first rank of influence, 0.8 for the second rank, and so on up to 0.2.
The linear model requires adaptation to the realities of a market economy, and to transform the simplified linear distribution, the authors used the gamma probability distribution, which is universal and is used to model various phenomena. It is determined by two parameters: the shape and the scale, and has a probability density function that can be used to calculate the probability of any event, for example, in the financial sector, for insurance, for determining the reliability parameters of technology and for modeling biological processes.
For the selected array of probabilities, the authors determined the necessary parameters of the distribution of the random variables α and β. With an array of linearly distributed probabilities (x = 0.2; 0.4; 0.6; 0.8; 1) the parameters are the following: α = 3.60 and β = 0.17 (the parameters were calculated for the gamma distribution). With these parameters, the authors calculated the distribution function and the probability density for the gamma distribution (Table 3).
Table 3.
Calculation of the gamma distribution.
Further, using the law of the normal gamma probability distribution, the authors determined the effect of the indicator on the remaining four properties, thereby taking into account the synergetic effect of the influence of all ecosystem properties and the probabilistic component.
The distribution graph is shown in Figure 2.

Figure 2.
Gamma distribution indicators.
Let us make the transition from the influence rank to the linear probability.
As an influence distribution tool, the authors used the probability parameter of the influence of each of the indicators presented in Table 2 with the values of the coefficients , thereby determining the numerical value of each of the values. Taking into account the law of the normal gamma distribution and the influence ranks shown in Table 2, the authors calculated the variables and presented the results in Table 3.
After that using the law of the normal gamma probability distribution, the authors determined the effect of the indicator on the remaining four properties, thereby taking into account the synergetic effect of the influence of all ecosystem properties and the probabilistic component.
The matrix is compiled for the indicators for the period of one specific year. To understand the process, the authors presented the matrix template in Table 4 with an indicative indicator for each of the ecosystem properties.
Table 4.
Template for the matrix of the impact of indicators on the properties of the business ecosystem.
After that, the authors determined the coefficients of the impact of indicators on the ecosystem property using the data on determining the rank from Table 2 and the probability distribution from Table 3 and summarized the results in Table 5.
Table 5.
Determining the coefficients of ecosystem indicators.
It is necessary to define a management model for the business ecosystem in order to determine the necessary impacts (which are expressed, among other things, in managerial actions) on it in the process of its progress toward the goal. It should be noted that the business ecosystem, having the properties of self-regulation, does not exclude control impact, thereby ensuring a faster return to the moment of its equilibrium in the most efficient and least energy-consuming way. Thus, the authors noted the minimization of control impact that fully corresponds to the above-mentioned properties of the business ecosystem. At the same time, the control impact on the business ecosystem is not completely excluded; it is necessary to adjust its behavior. Taking this into account, this research created a practical mechanism for managing the business ecosystem for both management personnel and beneficiaries directly.
Let us describe the business ecosystem management model as a process with a control impact.
The control process in the system is expressed by the following equation [46]:
where the following definitions hold:
is the initial state of the control object;
is the control impact on the control object;
is the result of the control (the power of the control impact).
In this case, the state of the control object is the following:
where the following definitions hold:
is the eigenvector: the coefficient of the synergetic effect of the control impact.
In accordance with the developed methodology, a synergetic effect appears when various parameters of the business ecosystem are affected; thereby, there is a nonlinear effect from management decisions and their application.
In this research, the authors propose to use the concept of “system energy”, which is described by analogy with physical processes, since the authors used the analog similarity of the biological world when describing the properties of a business ecosystem. In the authors’ opinion, the principle of analog similarity can also be applied to the above model [45]. The idea of the concept of “system energy” is that the authors make an analogy between the system’s internal energy and the body’s internal energy, which is the sum of the kinetic energy of all its molecules and the potential energy of their interaction. It should be clarified that the equilibrium of the business ecosystem is a state in which the maximum realization of its properties is ensured, assuming not only a stable existence, but also dynamic development to maximize the satisfaction of the needs for the provision of services and goods to users of the system.
Further, using the properties of integrity, self-reproduction, sustainability and self-regulation, the authors applied the law of conservation and distribution of energy that was discussed earlier in the research. It is these three properties of the business ecosystem that ensure its sustainability. At the same time, the system remains in equilibrium, and there is a possibility of further development provided by the emergence property.
Let us apply these properties of the business ecosystem to the matrix of the impact of indicators on the properties of the business ecosystem. The sum of the eigenvalues () and the sum of the diagonal elements of the original matrix are identical and characterize the law of conservation of the “system energy”.
The distribution of eigenvalues () over the factor vectors of the system characterizes the share of contribution of each of them to the total potential of the entire system.
The structure of each vector of eigenvalues () characterizes the law of conservation of the structure of the distributed “system energy” within the vectors.
To analyze the sustainability and prepare the defining vectors of the matrix, the authors summarized the data in Table 6. For further calculations, the authors transposed the matrix and rounded the values for convenience of calculations and determination of the indicators’ impact (vertically in the table) on the properties of the business ecosystem (horizontally). The results of transformations are presented in Table 7.
Table 6.
Matrix of the impact of indicators on the properties of the Yandex business ecosystem based on the results of work in 2023.
Table 7.
Transposed influence matrix (with rounded values).
Further, the matrix presented in Table 7 in terms of finding eigenvalues and eigenvectors was calculated. The calculation was performed using an online service [42]. The calculation results are presented below.
The sum of the spectrum of the matrix is 821,929 and is calculated as the sum of the elements of the main diagonal:
where the following definition holds:
is the value of the matrix cell of column m of row n.
The eigenvectors of the matrix A are as follows:
In the case of determining the impact of indicators on the set of properties of the business ecosystem, the authors used the obtained eigenvectors of the previously prepared matrix presented in Table 7. In the case of determining the impact, the calculation of eigenvectors and their values allows the authors to determine the key indicators, the changes in which have the greatest impact on the set of properties of the business ecosystem and ensure the maximum conservation of its “energy”.
For the ease of understanding of the research, here and further, the authors present calculations using matrices in the form of corresponding tables.
The found eigenvectors of the impact of indicators on the properties of the business ecosystem will form the matrix , the values of which are summarized in Table 8 for further calculations.
Table 8.
Eigenvectors of the impact of indicators on the properties of the business ecosystem and their contribution to the mechanism of the system.
Based on the data obtained, the authors determined the contribution of the eigenvectors to the mechanism of the system using the following formula:
where the following definitions hold:
is the value of the eigenvector of the indicator in column m;
is the spectrum of the matrix .
The data in Table 8 allow the authors to conclude that the “intra-segment calculations” and “the ratio of core revenue to service revenue” indicators have the greatest impact on the system mechanism, and the contribution of the second indicator is the most significant and takes the leading place in terms of influence.
In Table 9, the authors determine the sum of the values of the eigenvectors of the impact of indicators on the properties of the business ecosystem, using the sum of the horizontal columns of the resulting matrix:
Table 9.
The sum of the values of the eigenvectors of the impact of indicators on the properties of the business ecosystem.
Table 9 shows that the largest sum of the values of the eigenvectors is formed by the indicators “intra-segment calculations” and “the ratio of core revenue to service revenue”. Thus, these are the indicators that have the greatest impact on the five ecosystem properties in general.
To determine the degree of impact of indicators on the properties of the business ecosystem, it is necessary to determine the structure of its eigenvectors. To do this, the authors divided each value by columns from Table 9 by the sum of its eigenvectors. To exclude negative values, the authors squared the values of the columns with negative values. As a result, they obtained the resulting table, on the basis of which it is possible to draw conclusions from the calculations (Table 10). The table checks the calculation for the sum of shares that should be equal to 1.
Table 10.
Structure of eigenvectors of influence of indicators on the properties of a business ecosystem.
For visual clarity, the cells with values from lower (0) to higher (0.72284) were painted in certain colors. Taking into account the results shown in Table 8, let us consider columns 4 and 5 of the table. By searching for the maximum value in these columns, the largest value of the share of influence was found, thereby diagnosing the impact on the considered property of the business ecosystem. In the presented calculation using the developed methodology, it can be concluded that the most influential indicator “intra-segment calculations” has a great impact on sustainability property, and the indicator “ratio of core revenue to service revenue” has the most significant impact on the self-reproduction property.
By obtaining numerical values of the degree of influence and evaluating them within the framework of the methodology, we identify the most influential financial indicators for certain ecosystem properties. Thus, it can be seen from the calculations performed that changing intra-segment calculations, for example, by reducing the activity of organizations’ connections in segments by type of activity, weakens or strengthens the stability property of the entire business ecosystem. Speaking of stability, its adjustment makes it possible to strengthen the equilibrium of the system by strengthening, thereby distributing forces to its static state without subsequent development.
The results obtained are consistent with the initial hypotheses, including those put forward within the framework of A.A. Bogdanov’s theory, and correspond to trends in the influence of financial indicators on the overall development or stagnation of the business ecosystem.
As model validation, the calculation of the sum of the spectrum of the original matrix from the sum of the eigenvalues is performed. As it was calculated before, the sum of the spectrum of the matrix is equal to 821,929; let us calculate the sum of the eigenvalues of the found vectors from Table 8. The sum of the eigenvalues is also equal to 821,929; therefore, with this equality, the model can be considered valid.
5. Discussion
The results obtained in mathematical calculations have theoretical and practical applications, revealing the essence of the mechanism of functioning of business ecosystems under the influence of certain economic factors and the control impact on them.
In general, the hypothesis put forward in the framework of this study is confirmed by the very fact of the existence of the gravity matrix and the results obtained, which are confirmed by retrospective data.
The calculations presented in the research according to the developed methodology are an example of working with business ecosystem indicators and can be used by management and business ecosystem participants to enhance and regulate the necessary properties at various points in time, depending on the external and internal environment of the system, and represent a practical tool.
As we noted earlier, the calculation of results can be performed with different variants of a set of decomposed properties, and as part of the calculation using this methodology, users can consider linking these properties with various indicators of business ecosystem activity available in selected sources, thereby making the proposed methodology adaptive. But in this case, one should not forget about the correctness of the choice of indicators and available data, since incorrect alignment of indicators and properties of the business ecosystem will inevitably lead to an incorrect calculation of gravity; thereby, in its practical application, it may disrupt the strategic development of the ecosystem due to incorrect decisions.
During the research, restrictions on the choice of business ecosystems were used by checking the existence of their properties and ecosystem components, including the internal and external connections of the system and the presence of a pronounced core.
This method can be used as a component of a machine learning system based on the use of big data and as an ever-expanding matrix of diagnostic parameters, thereby increasing the accuracy of recommendations on control impact. The developed method involves the use of a mathematical tool that simplifies the transition to the development of a technical specification for automation of the developed algorithm for assessing the impact of various indicators on the properties of the business ecosystem. This allows for finding certain areas in the organization’s lifecycle that are favorable for various changes.
At the same time, it should be clearly understood that large amounts of data for subsequent calculation using neural network tools must be verified and represent data for determining the decomposed properties of a business ecosystem. Otherwise, we may obtain a large error that increases with each iteration of the calculation in the layers of the neural network, thereby increasing the risk of making an incorrect management decision, exacerbating the ecosystem situation in the market, which will lead to enormous energy costs to restore equilibrium and the possibility of subsequent development.
As a result of the research, for the first time, we received a tool for digitizing the business ecosystem and its properties, which plays an important role in finding mechanisms for managing business ecosystems in real conditions [48,49].
It should be noted that the developed method is applicable to business ecosystems that include all five of the above properties and have a typical composition of elements (a core organization and sets of ecosystem participants in various fields), thereby providing all the necessary internal and external links. The number of indicators under consideration should be equal to the selected properties, but, in essence, the method can also be applied to an expanded set of indicators with a ranking of each property (Table 5).
Further studies will be in the field of strategic planning of the organization’s activities based on the proposed computational model that allows for determining the optimal starting point for the prolongation of its life cycle. The model proposed by the authors improves the accuracy of planning based on the application of the original author’s algorithm and objective performance indicators of the organization.
Author Contributions
Conceptualization, O.Y.K., A.V. and L.A.Z.; methodology, O.Y.K., A.V. and L.A.Z.; software, L.A.Z.; validation, V.V.K., O.Y.K. and A.V.; formal analysis, V.V.K.; investigation, V.V.K.; resources, A.V.; data curation, V.V.K. and O.Y.K.; writing—original draft preparation, V.V.K., O.Y.K., L.A.Z. and A.V.; writing—review and editing, V.V.K., O.Y.K., L.A.Z. and A.V.; visualization, V.V.K.; supervision, O.Y.K.; project administration, O.Y.K.; funding acquisition, A.V. All authors have read and agreed to the published version of the manuscript.
Funding
This research was supported by Plekhanov Russian University of Economics, Moscow in the framework “Development of an intelligent system for supporting management decision-making to improve enterprise efficiency in the conditions of the data economy”.
Data Availability Statement
Publicly available datasets were analyzed in this study.
Conflicts of Interest
The authors declare no conflicts of interest. The funders had no role in the design of the study; in the collection, analyses or interpretation of data; in the writing of the manuscript; or in the decision to publish the results.
References
- Bogdanov, A.A. Tectology: General Organizational Science, 3rd ed.; Economics: Moscow, Russia, 1989; 309p. [Google Scholar]
- Tansley, A.G. The Use and Abuse of Vegetational Concepts and Terms. Ecology 1935, 16, 284–307. [Google Scholar] [CrossRef]
- Moore, J.F. The Death of Competition: Leadership and Strategy in the Age of Business Ecosystems; Harper Business: New York, NY, USA, 1999; 324p. [Google Scholar]
- Basole, R.C.; Park, H.; Seuss, C.D. Complex business ecosystem intelligence using AI-powered visual analytics. Decis. Support Syst. 2024, 178, 114133. [Google Scholar] [CrossRef]
- Jacobides, M.; Carmelo, C.; Gawer, A. Towards a Theory of Ecosystems. Strateg. Manag. J. 2018, 39, 2255–2276. [Google Scholar] [CrossRef]
- Thomas, L.D.W.; Autio, E.; Gann, D.M. Processes of ecosystem emergence. Technovation 2022, 115, 102441. [Google Scholar] [CrossRef]
- Kirillova, O.Y.; Kuzin, V.V. Methodological Foundation of Searching for Optimal Point in the Life Cycle of Entrepreneurial Organization to Pass on to Self-Regulating Ecosystem. Vestn. Plekhanov Russ. Univ. Econ. 2023, 6, 156–173. [Google Scholar] [CrossRef]
- Tolstykh, T.; Gamidullaeva, L.; Shmeleva, N. Elaboration of a Mechanism for Sustainable Enterprise Development in Innovation Ecosystems. J. Open Innov. Technol. Mark. Complex. 2020, 6, 95. [Google Scholar] [CrossRef]
- Mishacheva, E. Business Ecosystem. Bull. Sci. Pract. 2022, 8, 414–418. [Google Scholar] [CrossRef]
- Yang, M.; Wang, J.; Zhang, X. Boundary-spanning search and sustainable competitive advantage: The mediating roles of exploratory and exploitative innovations. J. Bus. Res. 2021, 127, 290–299. [Google Scholar] [CrossRef]
- Hong, Z.; Zhang, Q.; Xu, X.; Lyu, Z. Competition and cooperation in a platform-based business ecosystem within complementary partners. Int. J. Prod. Econ. 2024, 275, 109337. [Google Scholar] [CrossRef]
- Lafuente, E.; Alonso-Ubieta, S.; Leiva, J.C.; Mora-Esquivel, R. Strategic priorities and competitiveness of businesses operating in different entrepreneurial ecosystems: A benefit of the doubt (BOD) analysis. Int. J. Entrep. Behav. Res. 2021, 27, 1351–1377. [Google Scholar] [CrossRef]
- Culot, G.; Battistella, C. Future ecosystem business model tool: Design science and field test in the efuel ecosystem towards the sustainability transition. Technol. Forecast. Soc. Change 2024, 208, 123682. [Google Scholar] [CrossRef]
- Gasparin, M.; Green, W.; Lilley, S.; Quinn, M.; Schinckus, C. Business as unusual: A business model for social innovation. J. Bus. Res. 2020, 6, 698–709. [Google Scholar] [CrossRef]
- Sharma, A.; Das, N.; Singh, S.P. Causal association of entrepreneurship ecosystem and financial inclusion. Heliyon 2023, 9, e14596. [Google Scholar] [CrossRef] [PubMed]
- Kalenov, O.E. Business-Model Transformation: From Classical Organization to Ecosystem. Vestn. Plekhanov Russ. Univ. Econ. 2020, 3, 124–131. [Google Scholar] [CrossRef]
- Statsenko, V.V.; Bychkova, I.I. Ecosystem approach in building modern business models. Ind. Econ. 2021, 1, 45–61. [Google Scholar] [CrossRef]
- Cao, Z.; Shi, X. A systematic literature review of entrepreneurial ecosystems in advanced and emerging economies. Small Bus. Econ. 2020, 57, 75–110. [Google Scholar] [CrossRef]
- Costa, J.; Moreira, A.C. Public policies, open innovation ecosystems and innovation performance. Analysis of the impact of funding and regulations. J. Open Innov. Technol. Mark. Complex. 2022, 8, 210. [Google Scholar] [CrossRef]
- Markova, B.; Kuznecova, C. Ecosystems As a Modern Tool for Business Growth. ECO J. 2021, 8, 151–168. [Google Scholar] [CrossRef]
- Tolstykh, T.; Gamidullaeva, L.; Shmeleva, N. Approach to the Formation of an Innovation Portfolio in Industrial Ecosystems Based on the Life Cycle Concept. J. Open Innov. Technol. Mark. Complex. 2020, 6, 151. [Google Scholar] [CrossRef]
- Torres de Oliveira, R.; Verreynne, M.-L.; Steen, J.; Indulska, M. Creating value by giving away: A typology of different innovation revealing strategies. J. Bus. Res. 2021, 127, 137–150. [Google Scholar] [CrossRef]
- Rosinskaya, N.Y. Trends of development of the financial sector, indicators of sustainability of business ecosystems and new requirements to management. Mosc. Econ. J. 2019, 3, 301–320. [Google Scholar] [CrossRef]
- Kachalov, R.M.; Sleptsova, Y.A. Risk Management in Business Ecosystems During Crises. J. Volgogr. State University. Econ. 2022, 24, 146–159. [Google Scholar] [CrossRef]
- Karpinskaya, V.A. Ecosystem as a unit of economic analysis. In System Problems of the Domestic Mesoeconomics, Microeconomics, and Economics of Enterprises; Kleiner, G.B., Ed.; CEMI RAS: Moscow, Russia, 2018; pp. 125–141. [Google Scholar] [CrossRef]
- Stepnov, I.M.; Kovalchuk, J.A. Business Ecosystem Finance: Modern Agenda and Challenges. Financ. Theory Pract. 2023, 7, 89–100. [Google Scholar] [CrossRef]
- Tolstykh, T.; Gamidullaeva, L.; Shmeleva, N.; Woźniak, M.; Vasin, S. An Assessment of Regional Sustainability via the Maturity Level of Entrepreneurial Ecosystems. J. Open Innov. Technol. Mark. Complex. 2021, 7, 5. [Google Scholar] [CrossRef]
- Tolstykh, T.; Shmeleva, N.; Vertakova, Y.; Plotnikov, V. The Entropy Model for Sustainability Assessment in Industrial Ecosystems. Inventions 2020, 5, 54. [Google Scholar] [CrossRef]
- Vasyukov, O.N.; Masyuk, N.N.; Vasyukova, L.K.; Bushueva, M.A. Strategic management of business ecosystems: Using TRIZ tools. Azimuth Sci. Res. Econ. Adm. 2022, 2, 21–25. [Google Scholar] [CrossRef]
- Zheleznova, T.Y.; Vaisman, E.D. Methods of industrial enterprise strategic management: Integration of approaches. Upr./Manag. 2022, 13, 2–19. [Google Scholar] [CrossRef]
- Kulapov, M.N.; Pereverzeva, E.I.; Kirillova, O.Y. Business ecosystems: Definitions, typologies, development practice. Russ. J. Innov. Econ. 2022, 12, 1597–1612. [Google Scholar] [CrossRef]
- Doroshenko, S.V.; Shelomentsev, A.G. Entrepreneurial Ecosystem in Contemporary Socioeconomic Research. J. Econ. Theory 2017, 4, 212–221. [Google Scholar]
- Adizes, I. Managing Corporate Lifecycles; Adizes Institute Publications: Santa Barbara, CA, USA, 2004; 460p. [Google Scholar]
- Bornovalova, T.I. Methods of Managing Business Organizations at Different Stages of the Life Cycle. Ph.D. Thesis, State University of Management, Moscow, Russia, 2008; 196p. [Google Scholar]
- Adner, R. Ecosystem as Structure: An Actionable Construct for Strategy. J. Manag. 2017, 43, 39–58. [Google Scholar] [CrossRef]
- Kukushkin, S.N. Business-Ecosystem Determinants. Vestn. Plekhanov Russ. Univ. Econ. 2021, 3, 76–81. [Google Scholar] [CrossRef]
- Nagy, M.; Valaskova, K. An Analysis of the Financial Health of Companies Concerning the Business Environment of the V4 Countries. Folia Oeconomica Stetin. 2023, 23, 170–193. [Google Scholar] [CrossRef]
- Ukko, J.; Nasiri, M.; Saunila, M.; Rantala, T. Sustainability Strategy as a Moderator in the Relationship between Digital Business Strategy and Financial Performance. J. Clean. Prod. 2019, 236, 117626. [Google Scholar] [CrossRef]
- Kryukov, A.F.; Egorychev, I.G. Analysis of methods for forecasting the crisis situation of commercial organizations using financial indicators. Manag. Russ. Abroad 2001, 2, 91–98. [Google Scholar]
- Postyushkov, A.V. Forecasting bankruptcy risk. Arbitr. Manag. 2007, 6, 11–16. [Google Scholar]
- Yandex, N.V. Financials Press Releases. Available online: https://ir.yandex/financial-releases (accessed on 17 October 2024).
- Matrix Calculator. Available online: https://matrixcalc.org/ (accessed on 17 October 2024).
- Kotelkin, A.I.; Musin, M.M. Matritsy vliyaniya: Teoriya i praktika ekonomicheskogo upravleniya [Matrices of Influence: Theory and Practice of Economic Management]; Leto: Moscow, Russia, 2003; 236р. [Google Scholar]
- Kuzmin, D.; Mitrakov, A. What Is Revenue and How to Calculate It. JSC Rosbusinessconsulting. Available online: https://quote.rbc.ru/news/article/6655eeef9a79470fd61c5d0e (accessed on 17 October 2024).
- Zhigun, L.A. Theory of Organization and Organizational Activity: Thesaurus Monograph: Dictionary, 2nd ed.; INFRA-M: Moscow, Russia, 2019; 240p. [Google Scholar] [CrossRef]
- Shirokova, G.V.; Serova, O.Y. Models of Organizational Life Cycles: Theoretical Analysis and Empirical Research. Bull. St. Petersburg University. Ser. 8 Gen. Strateg. Manag. 2006, 1, 3–27. [Google Scholar]
- Basole, R.C.; Huhtamäki, J.; Still, K.; Russell, M.G. Visual decision support for business ecosystem analysis. Expert Syst. Appl. 2016, 65, 271–282. [Google Scholar] [CrossRef]
- Basole, R.C.; Russell, M.G.; Huhtamäki, J.; Rubens, N.; Still, K.; Park, H. Understanding business ecosystem dynamics: A data-driven approach. ACM Trans. Manag. Inf. Syst. (TMIS) 2015, 6, 1–32. [Google Scholar] [CrossRef]
- Tsujimoto, M.; Kajikawa, Y.; Tomita, J.; Matsumoto, Y. A review of the ecosystem concept—Towards coherent ecosystem design. Technol. Forecast. Soc. Change 2018, 136, 49–58. [Google Scholar] [CrossRef]
Disclaimer/Publisher’s Note: The statements, opinions and data contained in all publications are solely those of the individual author(s) and contributor(s) and not of MDPI and/or the editor(s). MDPI and/or the editor(s) disclaim responsibility for any injury to people or property resulting from any ideas, methods, instructions or products referred to in the content. |
© 2025 by the authors. Licensee MDPI, Basel, Switzerland. This article is an open access article distributed under the terms and conditions of the Creative Commons Attribution (CC BY) license (https://creativecommons.org/licenses/by/4.0/).