Abstract
Anomaly detection in structured data presents significant challenges, particularly in scenarios with extreme class imbalance. The Siamese Neural Network (SNN) is traditionally recognized for its ability to measure pairwise similarities, rather than being utilized as a feature extractor. However, in this study, we introduce a novel approach by leveraging the feature extraction capabilities of SNN, inspired by the powerful representation learning ability of neural networks. We integrate SNN with four different classifiers and the Synthetic Minority Over-sampling Technique (SMOTE) for supervised anomaly detection and evaluate its performance across five structured datasets under varying anomaly ratios. Our findings reveal that, when used as a feature extractor, SNN significantly enhances classification performance and demonstrates superior robustness compared to traditional anomaly detection methods, particularly under extreme class imbalance. These results highlight the potential of repurposing SNN beyond similarity learning, offering a scalable and effective feature extraction framework for anomaly detection in structured data applications.
MSC:
62P99
1. Introduction
Anomaly detection, also known as novelty or outlier detection, is a technique used to identify data points that significantly deviate from other data points. It is a widely discussed topic with growing applications in various domains, including anti-money laundering, health monitoring, fault detection, and spam filtering.
In the financial sector, anomaly detection is crucial for identifying fraudulent credit card transactions. The rise of cashless transactions, such as mobile payments and online credit card purchases, has led to an increase in fraud cases. Cyberattacks that compromise personal and financial data can result in significant economic losses, which can reach millions of dollars annually [1]. Therefore, accurately and efficiently detecting fraudulent transactions is a critical application of anomaly detection.
Similarly, in the manufacturing industry, anomaly detection is essential to ensure production line quality, particularly with the advent of Industry 4.0 and automation. For example, in the semiconductor industry, automated production systems rely on numerous sensors to monitor operational status and maintain product quality. If system failures go undetected, they can cause substantial financial losses. However, sensor data are often highly complex, with numerous variables and limited anomalous instances, making traditional detection methods ineffective [2]. Machine learning approaches have been explored to address this issue.
Anomaly detection also plays an important role in bioinformatics, where identifying rare, unusual, or unexpected patterns in complex biological data can lead to significant scientific and clinical discoveries. In biomedical research, anomalies often represent critical biological variations, such as genetic mutations linked to diseases, abnormal cellular behaviors, or irregular physiological signals that may indicate early-stage medical conditions. Effective anomaly detection methods are essential for enhancing disease diagnosis, patient monitoring, and personalized medicine, as they allow researchers and clinicians to distinguish between normal and pathological states with greater accuracy.
In genomic data analysis, anomaly detection aids in the identification of rare genetic mutations and structural variations that contribute to hereditary diseases and cancer development. Traditional statistical methods often struggle with the high dimensionality and inherent noise in genomic sequences, making machine learning-based anomaly detection techniques an increasingly popular alternative. By leveraging data-driven models, researchers can detect mutations and gene expression anomalies that would otherwise go unnoticed with conventional approaches.
Similarly, in proteomics and metabolomics, anomaly detection is instrumental in identifying biomarkers associated with specific diseases. The complexity of biological systems, coupled with the variability of experimental conditions, makes distinguishing meaningful patterns from noise a significant challenge. Anomaly detection models enable the discovery of unexpected molecular interactions and metabolic shifts that could provide insights into disease mechanisms and potential therapeutic targets.
Beyond molecular biology, anomaly detection is also widely used in medical imaging and physiological signal analysis. In radiology, the detection of abnormal patterns in medical images such as magnetic resonance imaging or computed tomography is vital for early detection of cancer and the diagnosis of neurological disorders. Machine learning-based anomaly detection methods improve diagnostic accuracy by identifying subtle abnormalities that may be overlooked by traditional imaging techniques. Likewise, in wearable health monitoring devices, real-time anomaly detection algorithms help identify irregular heart rhythms, respiratory anomalies, and other fluctuations in vital signs, facilitating timely medical interventions.
Various anomaly detection techniques have been applied to domain-specific problems, including statistical methods, classification-based approaches, nearest-neighbor algorithms, information theory, and spectral theorem-based methods. These techniques can be broadly classified into supervised, unsupervised, and semi-supervised anomaly detection methods [3].
Despite its importance, anomaly detection presents several challenges, including class imbalance, data heterogeneity, and high-dimensional feature spaces. In addition, defining normal samples is often difficult. Many biological datasets contain a disproportionately small number of anomalous cases, making it difficult for conventional classifiers to effectively learn from limited labeled samples. Furthermore, anomaly definitions vary across domains, labeled data may not fully capture all anomaly characteristics, and distinguishing noise from true anomalies remains complex. To address these challenges, researchers are increasingly adopting advanced machine learning approaches such as deep learning, generative models, and feature mapping techniques to enhance the robustness and generalizability of anomaly detection models.
Recent studies have explored advanced deep learning techniques for anomaly detection across various domains. GRU-MACGANS has been employed to address class imbalance in electricity consumption data, improving detection accuracy and interpretability in the presence of outliers and missing values [4]. In the IoT domain, autoencoder-based transfer learning has been utilized to enhance anomaly detection by learning detailed representations of normal operational data and transferring knowledge across data-rich and data-scarce environments, achieving high precision and recall [5]. Additionally, in maritime applications, trajectory clustering and prediction using ProbSparse Attention-based Transformers have been introduced to detect anomalous ship movements, providing insights for maritime risk management [6]. These studies demonstrate the effectiveness of deep learning approaches in handling data imbalance, high dimensionality, and dynamic patterns in anomaly detection tasks.
However, supervised anomaly detection faces a major challenge in acquiring labeled anomaly data. The cost of labeling all possible anomalies is often prohibitively high, resulting in a severe class imbalance where anomalous instances are significantly underrepresented. Conventional classifiers tend to be biased towards the majority class, reducing detection performance in such imbalanced settings [7]. Addressing this issue is a key focus of supervised anomaly detection research. Ref. [8] noted that no dedicated algorithms have been specifically designed for supervised anomaly detection. Instead, existing classifiers such as Random Forest (RF) [9] and neural networks [10] are commonly used.
Although big data has revolutionized various fields, data collection in domains such as medicine and healthcare remains a significant challenge due to cost constraints and the rarity of certain conditions. Acquiring high-quality medical imaging data or patient records for rare diseases often requires substantial financial investment and ethical considerations, making large-scale data collection impractical. As a result, Few-Shot Learning (FSL) has emerged as an essential technique in medical research and other data-scarce environments.
FSL is a subfield of machine learning that aims to train models using a relatively small amount of data. While traditional machine learning models typically require large-scale datasets for effective training, few-shot learning focuses on how to extract meaningful representations and learn useful patterns from limited labeled samples. FSL can be categorized into three main approaches: metric-based learning, model-based learning, and data augmentation-based enhancement techniques [11].
FSL aims to train models with a limited number of samples, making it particularly valuable when data acquisition is expensive or infeasible. Traditional machine learning methods often struggle in such scenarios due to their reliance on large labeled datasets. Therefore, deep learning-based approaches have been introduced as a solution. Deep learning models have demonstrated their ability to automatically learn complex feature representations, improving classification performance in low-resource settings. However, most deep learning-based anomaly detection approaches are designed for unstructured data, such as images and text, while their effectiveness in structured data remains underexplored.
Among these approaches, the Siamese Neural Network (SNN) [12] is a representative metric-based learning approach and a commonly used deep learning framework for few-shot learning. Originally developed for signature verification tasks, SNNs has been widely applied in computer vision and natural language processing for similarity learning, particularly in anomaly detection, facial recognition, and text matching. To further enhance its applicability, researchers have explored adaptations of SNNs to different types of data and tasks, optimizing its architecture for specific applications.
As a deep learning-based architecture, SNNs offer several advantages, particularly in handling complex, high-dimensional, and unstructured data. One of their primary strengths is their ability to automatically learn meaningful feature representations, which is crucial when working with intricate datasets such as medical images, genomic sequences, or multi-modal healthcare records. Furthermore, SNNs are highly effective for FSL, as they do not require an significant number of labeled data to achieve strong performance. By learning the similarity between sample pairs, where one instance serves as a reference (e.g., a normal case), and the other is an unknown test sample, SNNs can effectively generalize even with limited training data. This capability makes them particularly suitable for medical and biomedical applications, where labeled data are often scarce and achieving high-precision anomaly detection is critical. In recent years, several studies have applied SNNs to imbalanced data [13,14,15], primarily by modifying the network architecture, while other research focuses on balancing the two classes [16,17]. Most research applies SNNs to anomaly detection in domain-specific image data [18,19,20].
SNNs are widely recognized for their pairwise similarity learning capability but have rarely been utilized as a feature extractor. Most existing anomaly detection algorithms are designed for structured datasets [8], yet the effectiveness of SNNs in this context remains underexplored. Feature selection and extraction play a crucial role in anomaly detection, as highlighted in a systematic literature review by [21]. Additionally, ref. [22] emphasizes the need for data-efficient anomaly detection methods, including few-shot anomaly detection, to address challenges in scenarios with limited labeled data. Motivated by these insights, our study proposes a few-shot learning-based anomaly detection framework that leverages an SNN as a feature extractor.
In this study, we introduce a novel approach that repurposes an SNN for feature extraction in structured anomaly detection tasks, leveraging its ability to learn informative representations from limited data. By transforming structured data into a discriminative feature space, the SNN enhances the classification performance of conventional models in distinguishing anomalies from normal instances. By integrating metric-based learning and feature mapping, SNN learning provides a robust framework for improving anomaly detection in high-dimensional, imbalanced datasets. These findings contribute to the development of more accurate and efficient anomaly detection strategies, with promising applications in genomics, medical diagnostics, and computational biology.
2. Methods
2.1. Siamese Neural Network (SNN)
The original SNN consists of two identical convolutional neural networks (CNNs) that share the same architecture and weights. During training, these subnetworks update their parameters synchronously. Unlike traditional supervised learning models, which classify individual data points, the SNN learns to measure pairwise similarity between input samples. Instead of relying on explicit class labels, the SNN processes paired data samples and outputs a similarity score, determining whether the inputs belong to the same class. These input pairs can consist of images, word embeddings, or entire text sequences.
The strength of the SNN lies in its ability to learn from limited labeled data by leveraging pairwise comparisons rather than absolute class labels. Once trained, the network can generalize to unseen data by evaluating similarity scores, making it a powerful tool for various machine learning tasks. The model learns a feature representation that enables it to distinguish whether input pairs belong to the same category or not.
The following equations describe the mathematical formulation of the SNN. Given an input pair , the SNN processes each sample through a shared subnetwork , where represents the shared learnable parameters:
where are the feature embeddings of input samples and and the function can be implemented using a convolutional neural network (CNN) or a fully connected neural network (FCN). The two subnetworks share the same architecture and weights, ensuring identical feature transformation.
The similarity between the two feature embeddings is computed using a distance function. The most commonly used metric is the Euclidean distance Alternatively, the cosine similarity can be used , where represents how far apart the two embeddings are and ranges from −1 (completely dissimilar) to 1 (identical).
To optimize the Siamese network, the contrastive loss function is used, which ensures that the network minimizes the distance between similar pairs and maximizes the distance between dissimilar pairs. is the label, where 0 indicates similar pairs and 1 indicates dissimilar pairs. D is the Euclidean distance between embeddings. m is the margin parameter, ensuring that dissimilar pairs are separated by at least m.
At inference time, the sigmoid activation function usually is applied to scale the distance output into the range : . A threshold T is then applied to classify whether two samples are similar or dissimilar:
where T is a predefined hyperparameter that can be tuned on validation data.
2.2. Proposed Method
In this study, we focus on evaluating the effectiveness of the SNN as a feature extractor for anomaly detection in structured data. Instead of performing pairwise similarity comparisons as in the classic SNN approach, once the SNN is trained, the fully connected neural network functions serve as a feature extractor in our implementation. For a given input sample , we obtain the learned feature representation as .
This extracted feature representation is then integrated with subsequent classifiers for further analysis and prediction, , where is the chosen classifier, mapping feature embeddings to final class predictions.
In the architecture of the sub-network, each neural network layer is followed by a ReLU activation function to introduce non-linearity, and Batch Normalization and Dropout layers are applied to prevent overfitting. Batch Normalization standardizes the output of the previous layer before passing it to the next layer, while Dropout randomly deactivates a proportion of neurons during training to prevent co-adaptation of weights and enhance generalization. The structure of sub-networks are summarized in Table 1.

Table 1.
Subnetwork architecture.
2.3. Structured Dataset
Given the relatively limited research on the SNN’s application to structured data, this study seeks to investigate its performance and compare it with other widely used anomaly detection methods. Our goal is to determine whether the SNN can serve as an effective alternative for detecting anomalies in structured datasets, particularly in scenarios where labeled anomaly samples are scarce.
To ensure clarity and maintain focus on our core contribution, we chose structured datasets that exhibit high-dimensional features, imbalanced class distributions, and rare anomaly occurrences—key characteristics that are also commonly observed in biological datasets. While we did not include biological datasets in our experiments, our methodology is generalizable and can be extended to bioinformatics applications. Many biological datasets, such as genomic sequences, proteomics data, and medical imaging datasets, share similar challenges. Given these similarities, the proposed approach provides a promising foundation for future research in bioinformatics anomaly detection, where labeled anomaly cases are often scarce, and feature representation is critical for accurate classification.
2.4. Data Preprocessing: Pairwise Data Construction
Supervised anomaly detection methods typically classify data into normal and anomalous categories, making the problem a binary classification problem. Traditional classifiers require labeled training data, where each data point is assigned a class label. However, SNNs differ in that they learn from paired data samples, with each pair labeled as similar or dissimilar. Therefore, prior to training an SNN, it is essential to construct a dataset of paired samples. The process of constructing these pairs in our approach is as follows:
- 1.
- Define a random binary variable , where .
- 2.
- If , randomly select two samples from the normal class to form a pair and label them as similar. If , randomly select one sample from the normal class and one from the anomalous class to form a pair and label them as dissimilar.
Through this process, a balanced number of similar and dissimilar pairs are randomly selected. The dataset is constructed with a 1:1 ratio of similar to dissimilar pairs, which is then used to train the SNN model. During training, the output of the model is compared to a threshold value of 0.5:
- -
- If the predicted similarity score is greater than 0.5, the test sample is classified as normal.
- -
- Otherwise, it is classified as anomalous.
As training progresses, the model continuously refines its decision boundary, improving its accuracy. Each training batch maintains a controlled ratio of similar to dissimilar samples, ensuring the stability of the learning process. The number of sample pairs and feature dimensions is carefully set based on the characteristics of the original dataset, and multiple paired datasets are used for training, with the most accurate training dataset retained.
2.5. Siamese Neural Network Prediction Framework
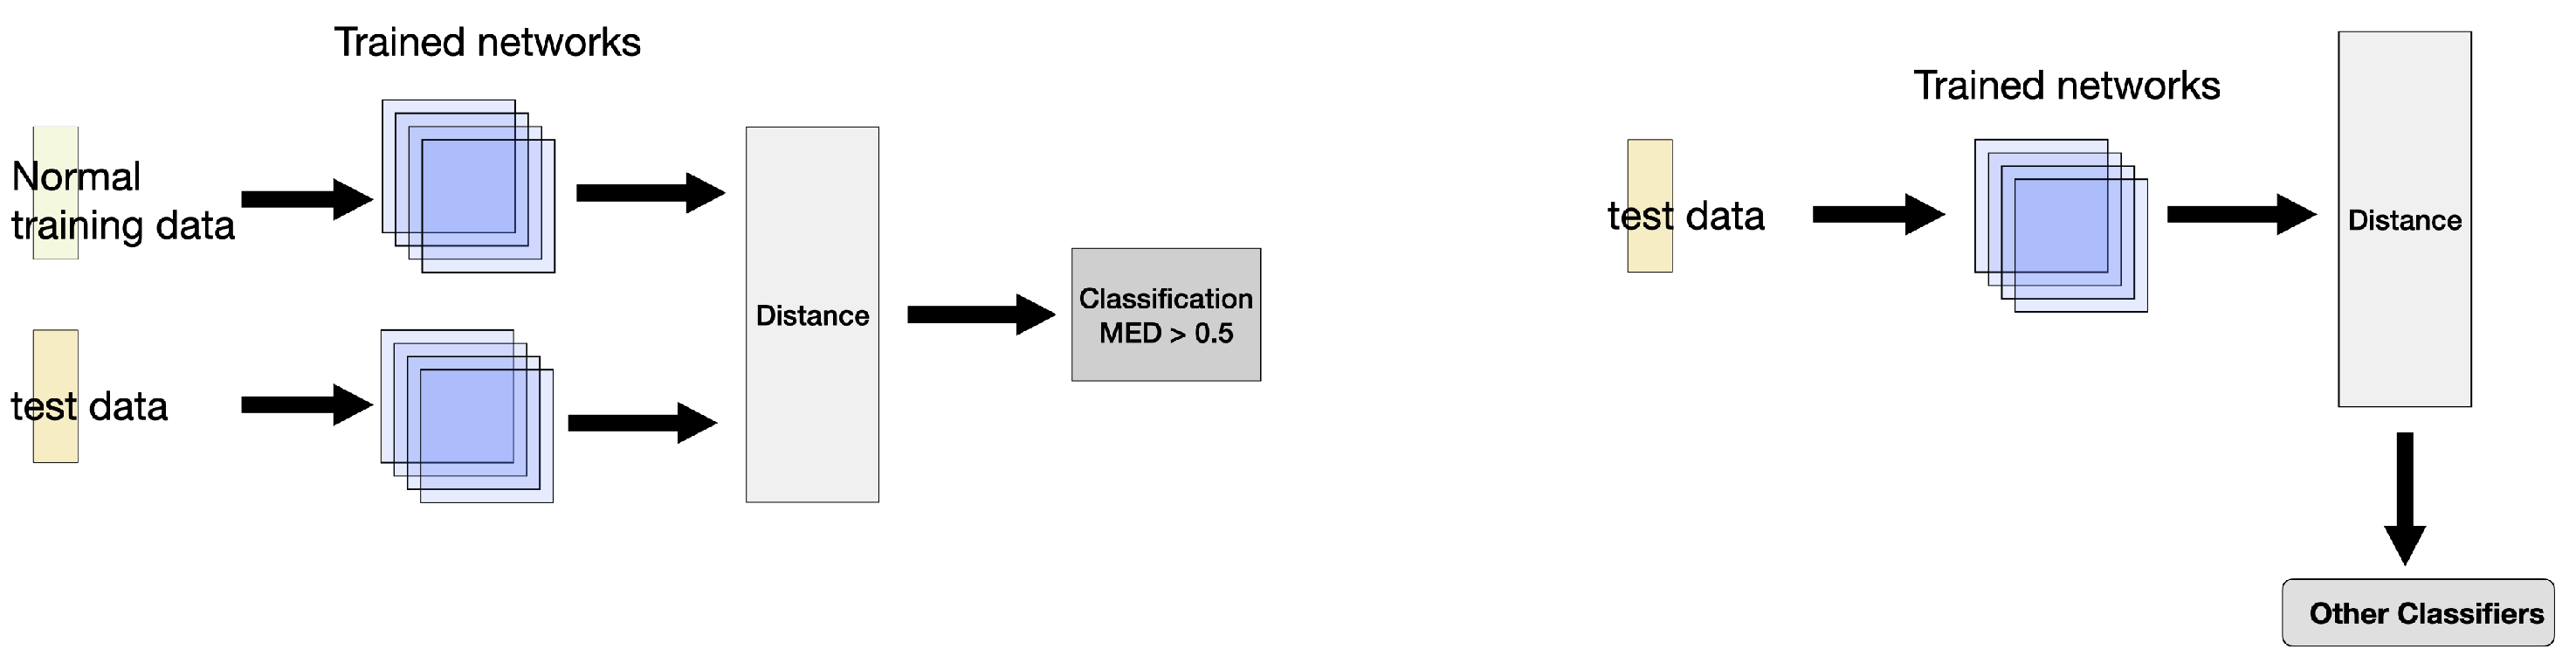
During evaluation, two prediction methods are used, as shown in Figure 1:
- 1.
- Distance-Based Prediction [23]: Each test sample is paired with all normal training samples, and the average pairwise Mean Euclidean Distance (MED) is computed. If the average distance exceeds 0.5, the test sample is classified as anomalous; otherwise, it is classified as normal.
- 2.
- Feature Extraction for Classification: Instead of using MED for direct classification, the output of the last hidden layer of the SNN is extracted as a feature representation. These feature-mapped data are then used as input for another classifier, such as Support Vector Machine (SVM) [24] or RF, to improve prediction performance.
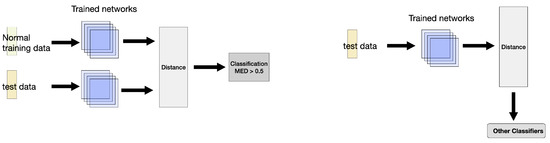
Figure 1.
Prediction framework using a Siamese Neural Network. The left plot represents using Mean Euclidean Distance (MED) as a classifier. The right plot shows using the Siamese Neural Network as a feature extractor.
Figure 1.
Prediction framework using a Siamese Neural Network. The left plot represents using Mean Euclidean Distance (MED) as a classifier. The right plot shows using the Siamese Neural Network as a feature extractor.
By leveraging these two approaches, the SNN can be effectively used both as an anomaly detector and as a feature extractor for downstream classification tasks.
2.6. Compared Algorithms and Oversampling Methods
To validate the performance of the proposed method, we evaluate it using three supervised learning models (SNN, Support Vector Machine (SVM) [24], and Random Forest (RF) [9]) and two anomaly detection algorithms (Isolation Forest (IF) [25] and One-Class Support Vector Machine (OCSVM) [26]). This study implements classifier algorithms using the Scikit-Learn 1.1.1 package [27] in Python 3.9.13, with all models trained using their default hyperparameters.
Additionally, we compare these models with the Synthetic Minority Over-sampling Technique (SMOTE) [28] to investigate its impact on anomaly detection performance. Proposed by Chawla et al. [28], SMOTE was designed to address the overfitting issues associated with traditional undersampling and oversampling methods. The algorithm generates synthetic samples by interpolating between existing minority class samples and their nearest neighbors, effectively balancing class distributions and enhancing model performance on imbalanced datasets.
The nine evaluated algorithmic combinations used in the study are as follows:
- 1.
- SNN (as feature extractor) + SVM;
- 2.
- SNN (as feature extractor) + RF;
- 3.
- Traditional SNN with MED for classification;
- 4.
- SMOTE + RF;
- 5.
- SMOTE + SVM;
- 6.
- RF;
- 7.
- SVM;
- 8.
- IF;
- 9.
- OCSVM.
By comparing these methods, we aim to assess the effectiveness of SNN-based anomaly detection and investigate the potential benefits of integrating oversampling techniques.
2.7. Evaluation Metrics
This section introduces the evaluation metrics used in this study. Since anomaly detection tasks inherently involve class imbalance, the selection of appropriate metrics is crucial. Standard accuracy is often insufficient for evaluating performance in imbalanced datasets, as it can favor the majority class while overlooking anomalies. Therefore, we employ Recall, Precision, F1-Score, G-Mean, and Balanced Accuracy as our primary evaluation metrics.
Before detailing these metrics, we first introduce the confusion matrix in Table 2.
Table 2.
Binary classification confusion matrix.
For instance, given the confusion matrix shown in Table 3, the model correctly classified 950 anomalous instances and 80 normal instances. However, it misclassified 50 anomalous instances as normal (false negatives) and 20 normal instances as anomalous (false positive).
Table 3.
Binary classification confusion matrix example.
Using the four values from the confusion matrix, we define the following performance metrics:
- 1.
- True Positive Rate (TPrate): Also known as Recall or Sensitivity, it measures the proportion of actual anomalous samples correctly classified as anomalies:
- 2.
- True Negative Rate (TNrate): Also referred to as Specificity, it represents the proportion of actual normal samples correctly classified as normal:
- 3.
- Precision: It quantifies how many of the samples predicted as anomalous are truly anomalous:
Building upon these three fundamental metrics, we further define F1-Score, G-Mean, and Balanced Accuracy, which offer more robust evaluation criteria for imbalanced classification tasks. As shown in Table 3, a Precision of 0.98 suggests that 98% of the instances predicted as anomalies are truly anomalous, minimizing false positives. A Recall of 0.95 means the model correctly identifies 95% of actual anomalies, demonstrating strong sensitivity. A Specificity of 0.80 shows that 80% of normal instances are correctly classified, reducing false alarms. The F1-Score of 0.96 balances Precision and Recall, reflecting overall accuracy in detecting anomalies. The G-Mean of 0.87 indicates the model’s ability to handle class imbalance by maintaining a balance between sensitivity and specificity. Lastly, the Balanced Accuracy of 0.88 suggests that the model performs well across both anomaly and normal classes, making it effective in imbalanced data scenarios. Table 4 summarizes the six performance metrics used in this study.
Table 4.
Evaluation metrics for anomaly detection models.
2.8. Scott–Knott Analysis
This study evaluates model performance using six different metrics and applies the Scott–Knott hierarchical clustering method [29] to rank and group models based on their F1-Score, G-Mean, and Balanced Accuracy. The Scott–Knott method partitions models into statistically distinct groups by performing one-way analysis of variance (ANOVA) to detect significant differences between groups. Models with statistically similar performance are clustered together to provide meaningful rankings.
For each dataset, we perform five independent random resampling procedures to obtain multiple prediction results for each model. The Scott–Knott statistical method is then applied to identify performance-based model clusters. The detailed steps of the Scott–Knott process are as follows:
- 1.
- Rank all models based on their performance across evaluation metrics, such as Recall and Precision.
- 2.
- After ranking, compute the average value of each model and group them into two clusters based on their mean performance (e.g., the average Recall of all models).
- 3.
- Perform one-way ANOVA to test for statistically significant differences between the two clusters. If a significant difference is detected, the clusters are further subdivided iteratively until no significant differences remain.
- 4.
- The final step assigns each model to a specific performance group, providing a ranking that reflects the statistical differences among models.
By using the Scott–Knott method, we can effectively rank and categorize models based on statistically meaningful performance differences, enabling a robust comparison of their effectiveness.
2.9. Datasets
Five popular anomaly datasets were used in this study. The Wafer dataset [30] originates from the UEA & UCR Time Series Classification Repository and represents semiconductor wafer data. The Credit Card Fraud dataset [31] contains credit card fraud transactions collected from European financial institutions. The Backdoor dataset [32] consists of network intrusion detection data related to backdoor cyberattacks. The Speech dataset [33] comprises speech recordings, representing voice-based demographic data collected from the U.S. population. Lastly, the Census dataset [31] is derived from the U.S. Census Bureau’s income survey, capturing demographic records of individuals with an annual income exceeding USD 50,000.
Due to computational constraints, a random subset of each dataset was sampled for analysis. The dataset characteristics are summarized in Table 5.
Table 5.
Dataset overview.
Anomaly Ratio Adjustment: Wafer Dataset
The Wafer dataset used in this study originates from the UEA & UCR Time Series Classification Repository and was introduced by Olszewski (2001) [30]. This dataset has been widely used for time-series feature extraction research and represents sensor measurements collected during semiconductor manufacturing processes. Each wafer contains 152 sensor features, capturing readings from multiple monitoring points throughout the production line. Based on these features, wafers are classified into normal and anomalous categories.
For this study, we extracted a subset of 5789 samples for training and 1000 samples for testing, maintaining the original 5.28% anomaly ratio in the training set. Table 6 summarizes the number of normal and anomalous samples in the training and testing sets.
Table 6.
Wafer dataset: distribution of normal and anomalous samples in training and testing sets.
To evaluate how class imbalance affects model performance, we systematically adjusted the anomaly ratio in the Wafer dataset. Anomaly ratios refer to the proportion of anomalous data within the entire dataset. It represents the percentage of data points classified as anomalies compared to the total number of samples. A lower anomaly ratio indicates a highly imbalanced dataset, where anomalies are rare, making detection more challenging. Conversely, a higher anomaly ratio suggests a more balanced distribution between normal and anomalous instances. Table 7 lists the different anomaly ratios tested in our study, along with the corresponding number of normal and anomalous samples.
Table 7.
Wafer dataset: anomaly ratio adjustments.
By systematically reducing the anomaly ratio, we aim to observe how different models adapt to varying degrees of class imbalance and evaluate their robustness in detecting rare anomalies.
2.10. Flowchart of the Proposed Methodology
In this subsection, we provide a flowchart of the proposed methodology to enhance clarity. The workflow consists of several key steps, including data preprocessing, feature extraction using a Siamese Neural Network (SNN), classification using various models, and performance evaluation. The flowchart in Figure 2 visually represents the overall process.
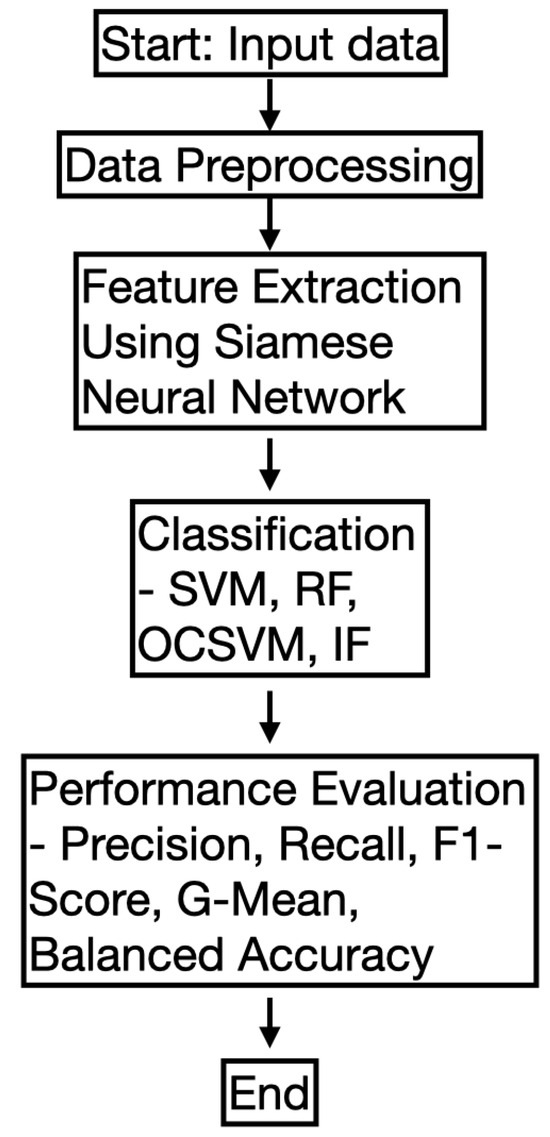
Figure 2.
Flowchart of the proposed anomaly detection methodology.
3. Results
3.1. Prediction Results of All Datasets
We evaluated the performance of the proposed method using five structured datasets, partitioning them into training and testing sets. Predictions were made on the test sets, and the average performance of each model combination was computed across multiple evaluation metrics.
3.2. Performance Comparison Across Different Models
Table 8 presents the overall performance of different models. Our proposed feature extraction methods, SNN + RF and SNN + SVM, consistently achieve high F1-Scores, G-Means, and Balanced Accuracy, outperforming other approaches. In contrast, traditional anomaly detection algorithms such as OCSVM and IF exhibit high Recall but suffer from low Precision and Specificity, leading to a higher false positive rate. These results indicate that while OCSVM and IF are effective in capturing anomalies, their trade-off in precision limits their practical use in applications where false alarms are costly.
Table 8.
Average performance of models across five datasets.
To further analyze the ranking and statistical significance of model performance, Scott–Knott clustering analysis was applied based on F1-Score, G-Mean, and Balanced Accuracy. Figure 3 shows that significant differences exist in F1-Score rankings, with SNN-based models forming the top-performing group, followed by SMOTE-based methods and finally traditional anomaly detection algorithms. For G-Mean and Balanced Accuracy, no statistically significant differences were observed across models, suggesting that while different algorithms exhibit varying strengths, the overall model ranking remains relatively stable across these metrics.
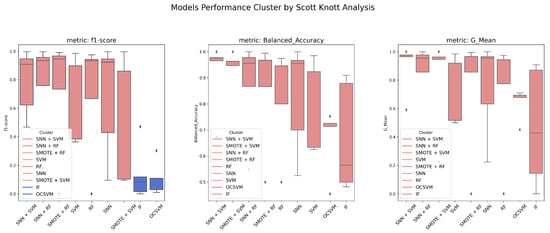
Figure 3.
Scott–Knott clustering results for F1-Score, Balanced Accuracy, and G-Mean across five datasets.
3.3. Impact of Feature Extraction Using SNN
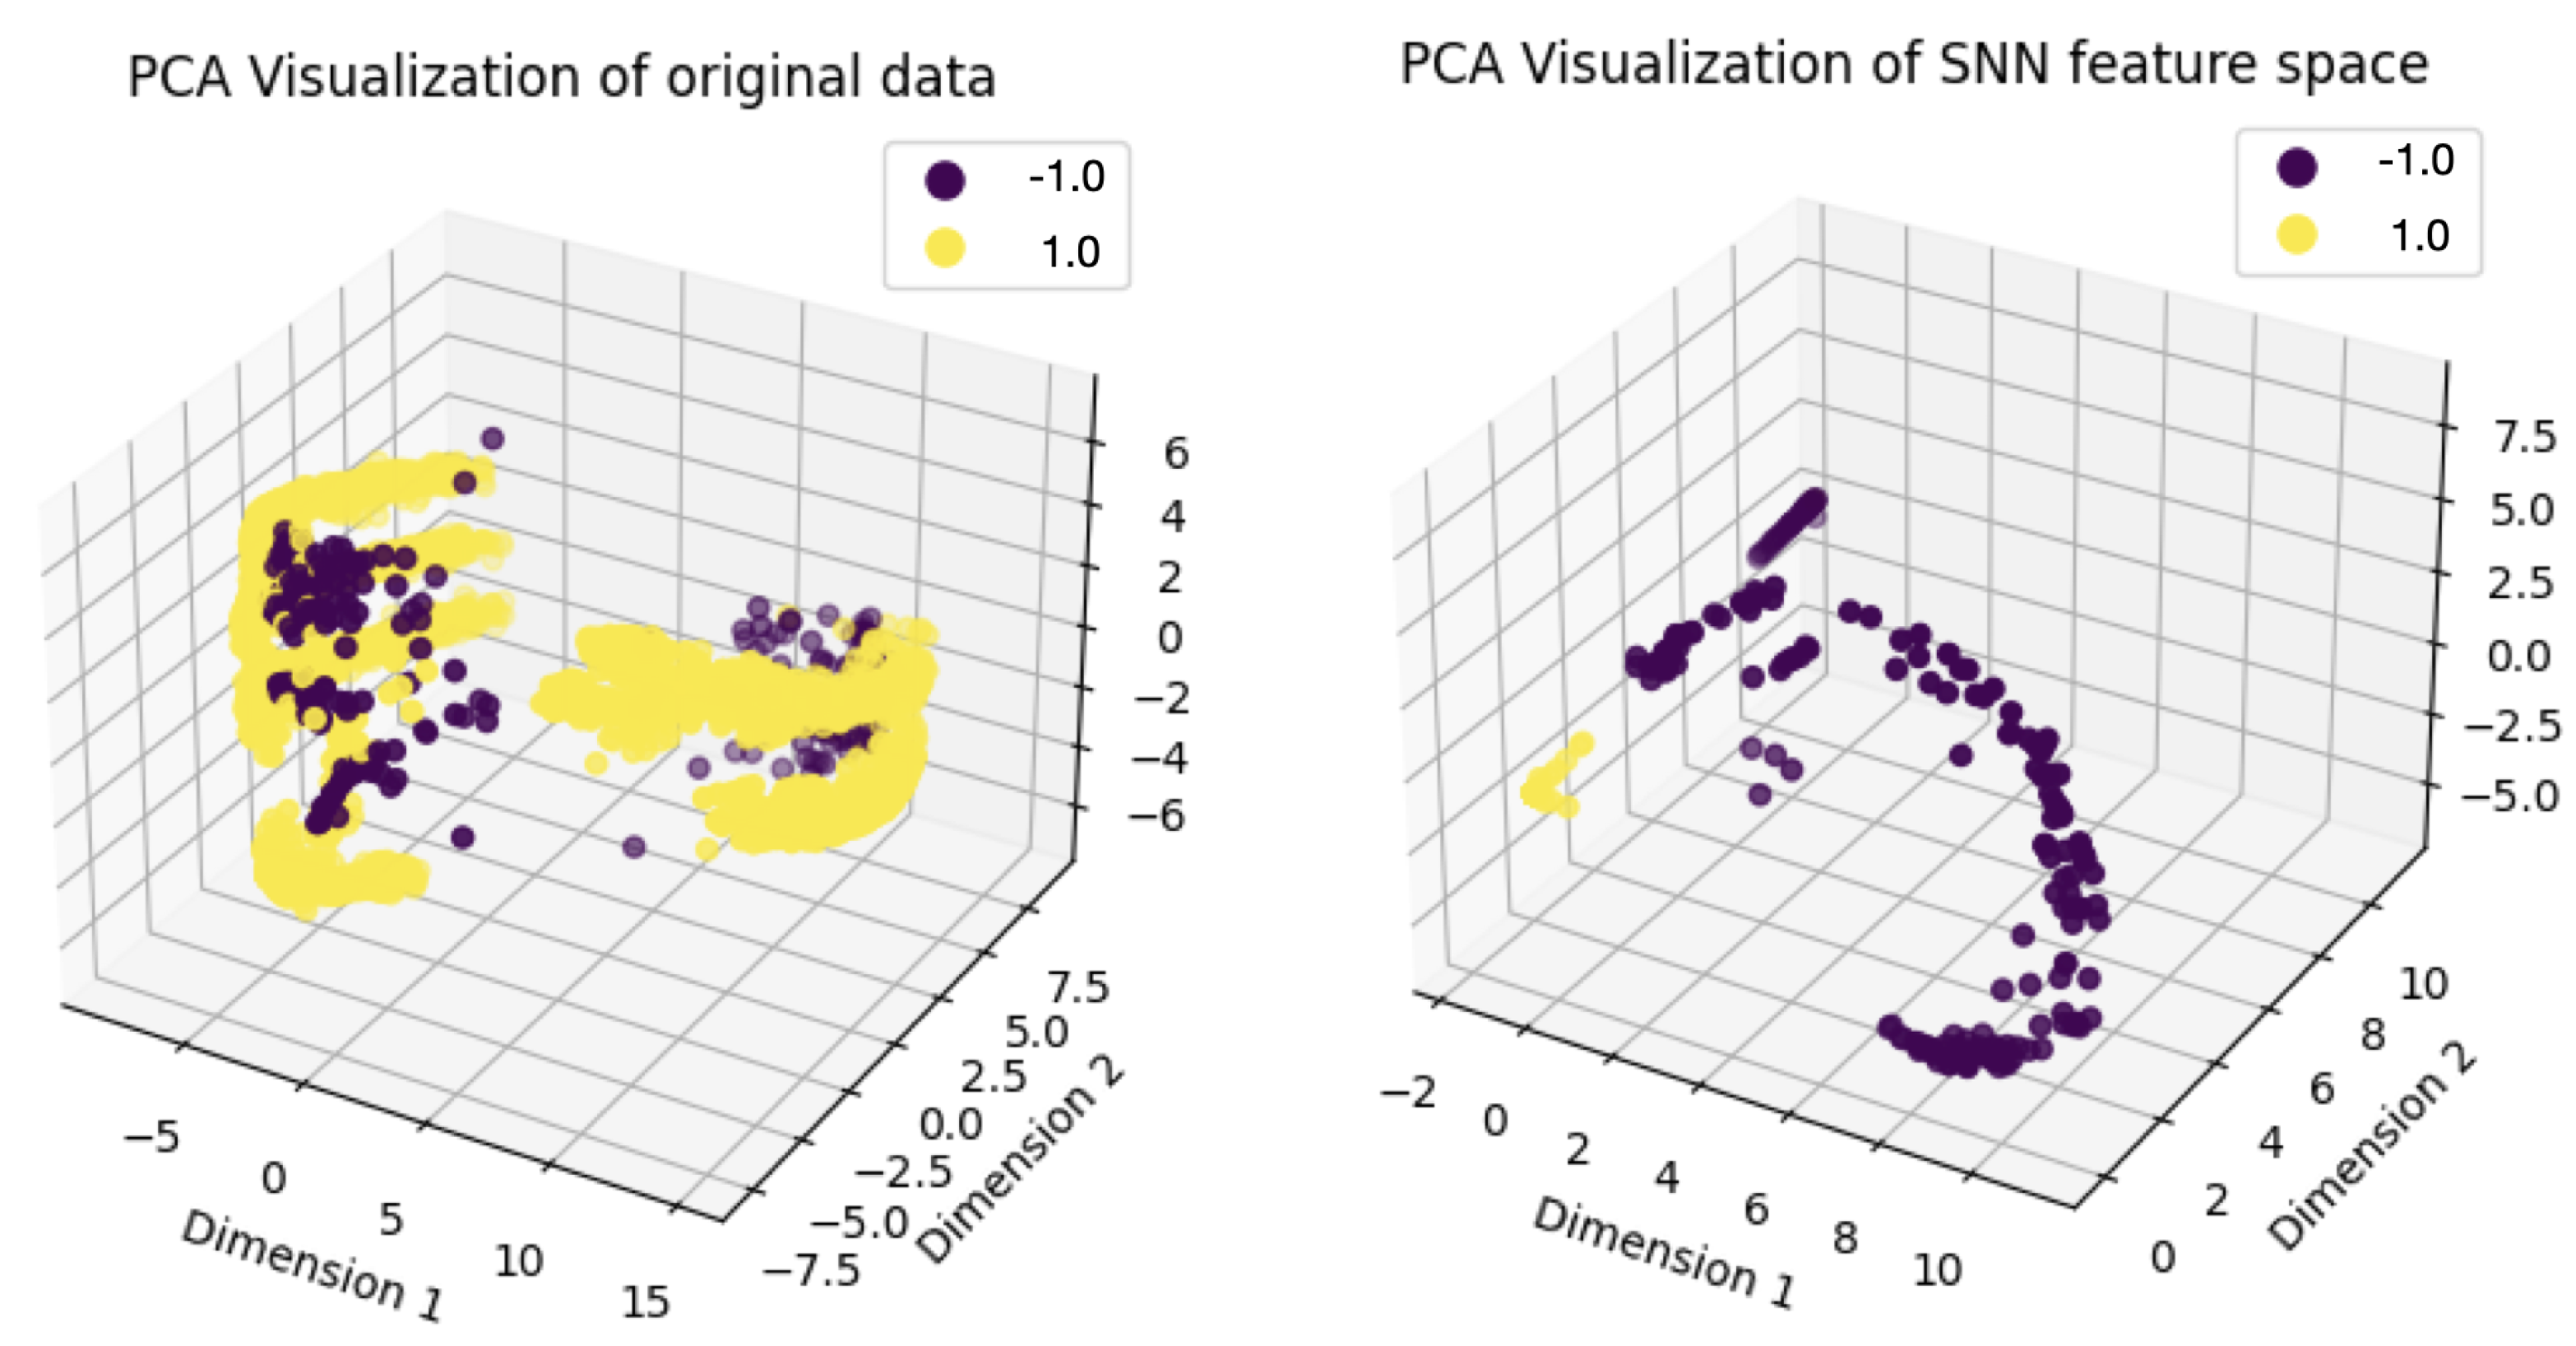
To demonstrate the effectiveness of the SNN as a feature extractor, we visualized the dimensionality reduction results for the silicon wafer dataset using Principal Component Analysis (PCA). Figure 4 compares the original 152-dimensional feature space (left) to the SNN-transformed feature space (right), reduced to 64 dimensions. The separation between normal and anomalous instances becomes more distinct after feature mapping through the SNN, increasing the cumulative explained variance from 78% to 82%. This result indicates that the SNN enhances class separability, leading to improved classification performance in high-dimensional structured data.
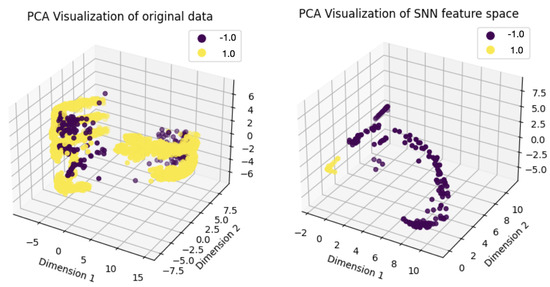
Figure 4.
PCA-based dimensionality reduction visualization results. The left plot represents the original data, while the right plot shows the feature space transformed by the Siamese Neural Network (SNN).
3.4. Effect of Varying Anomaly Ratios on Model Performance
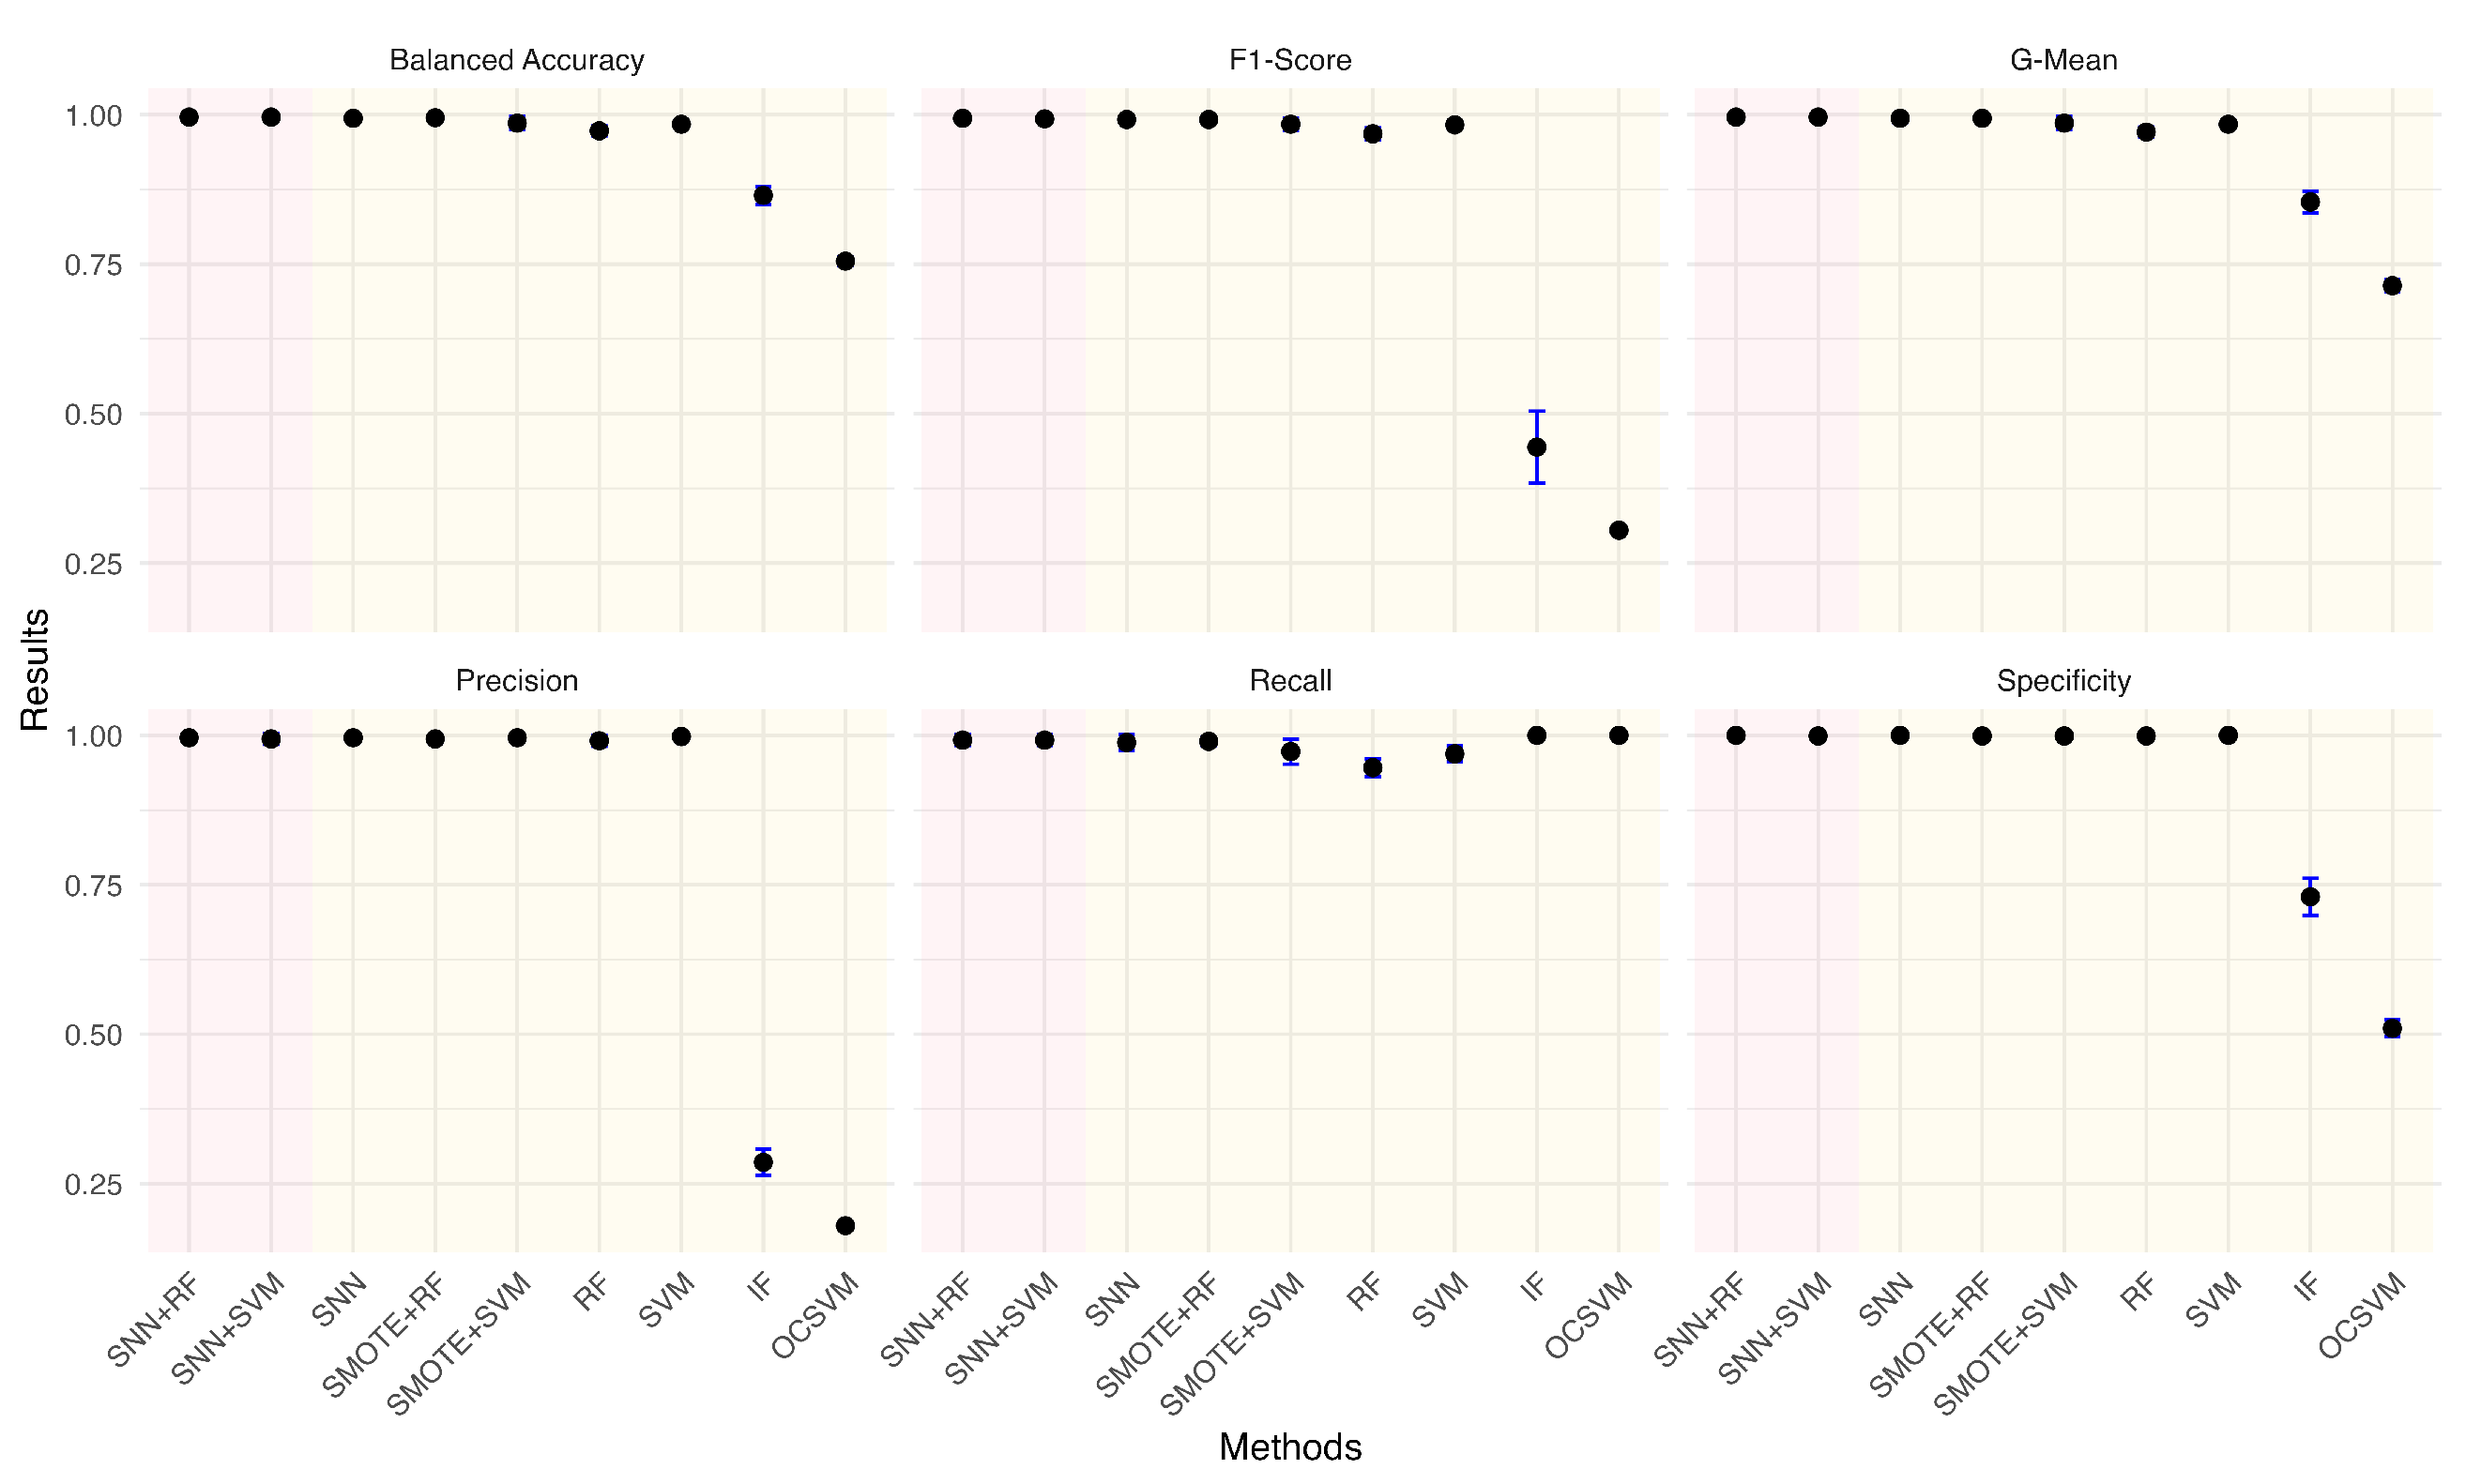
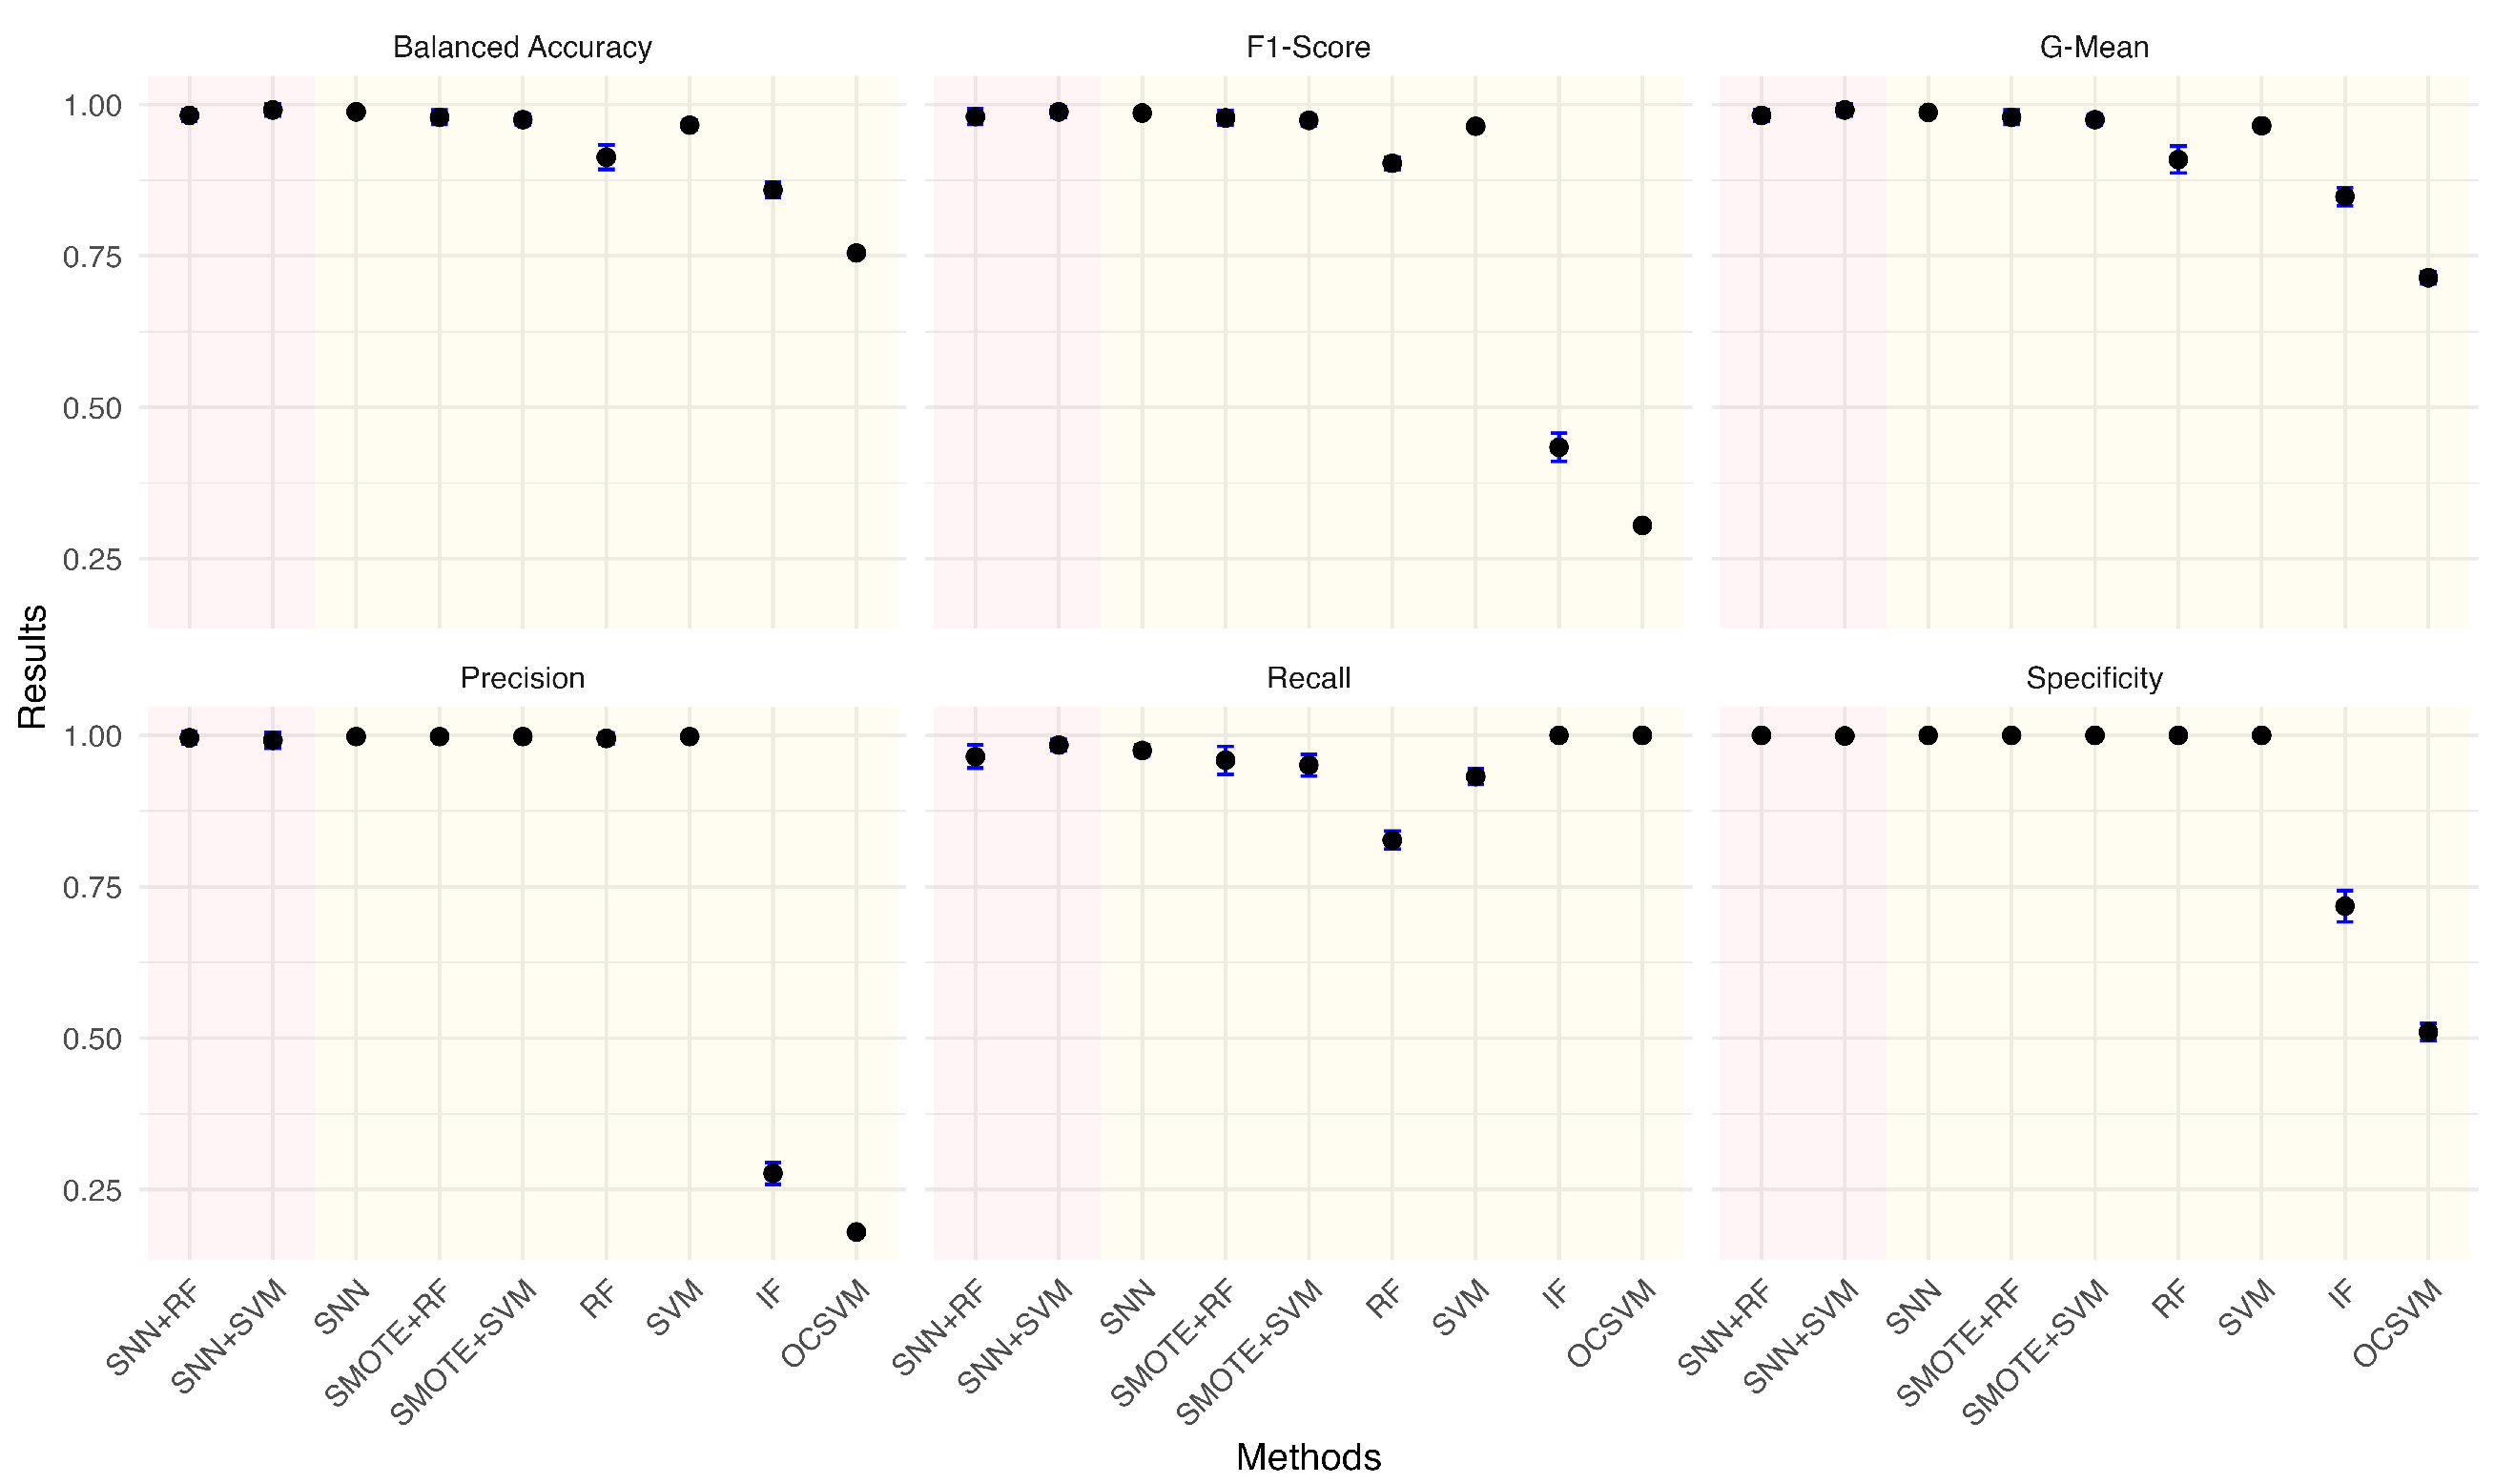
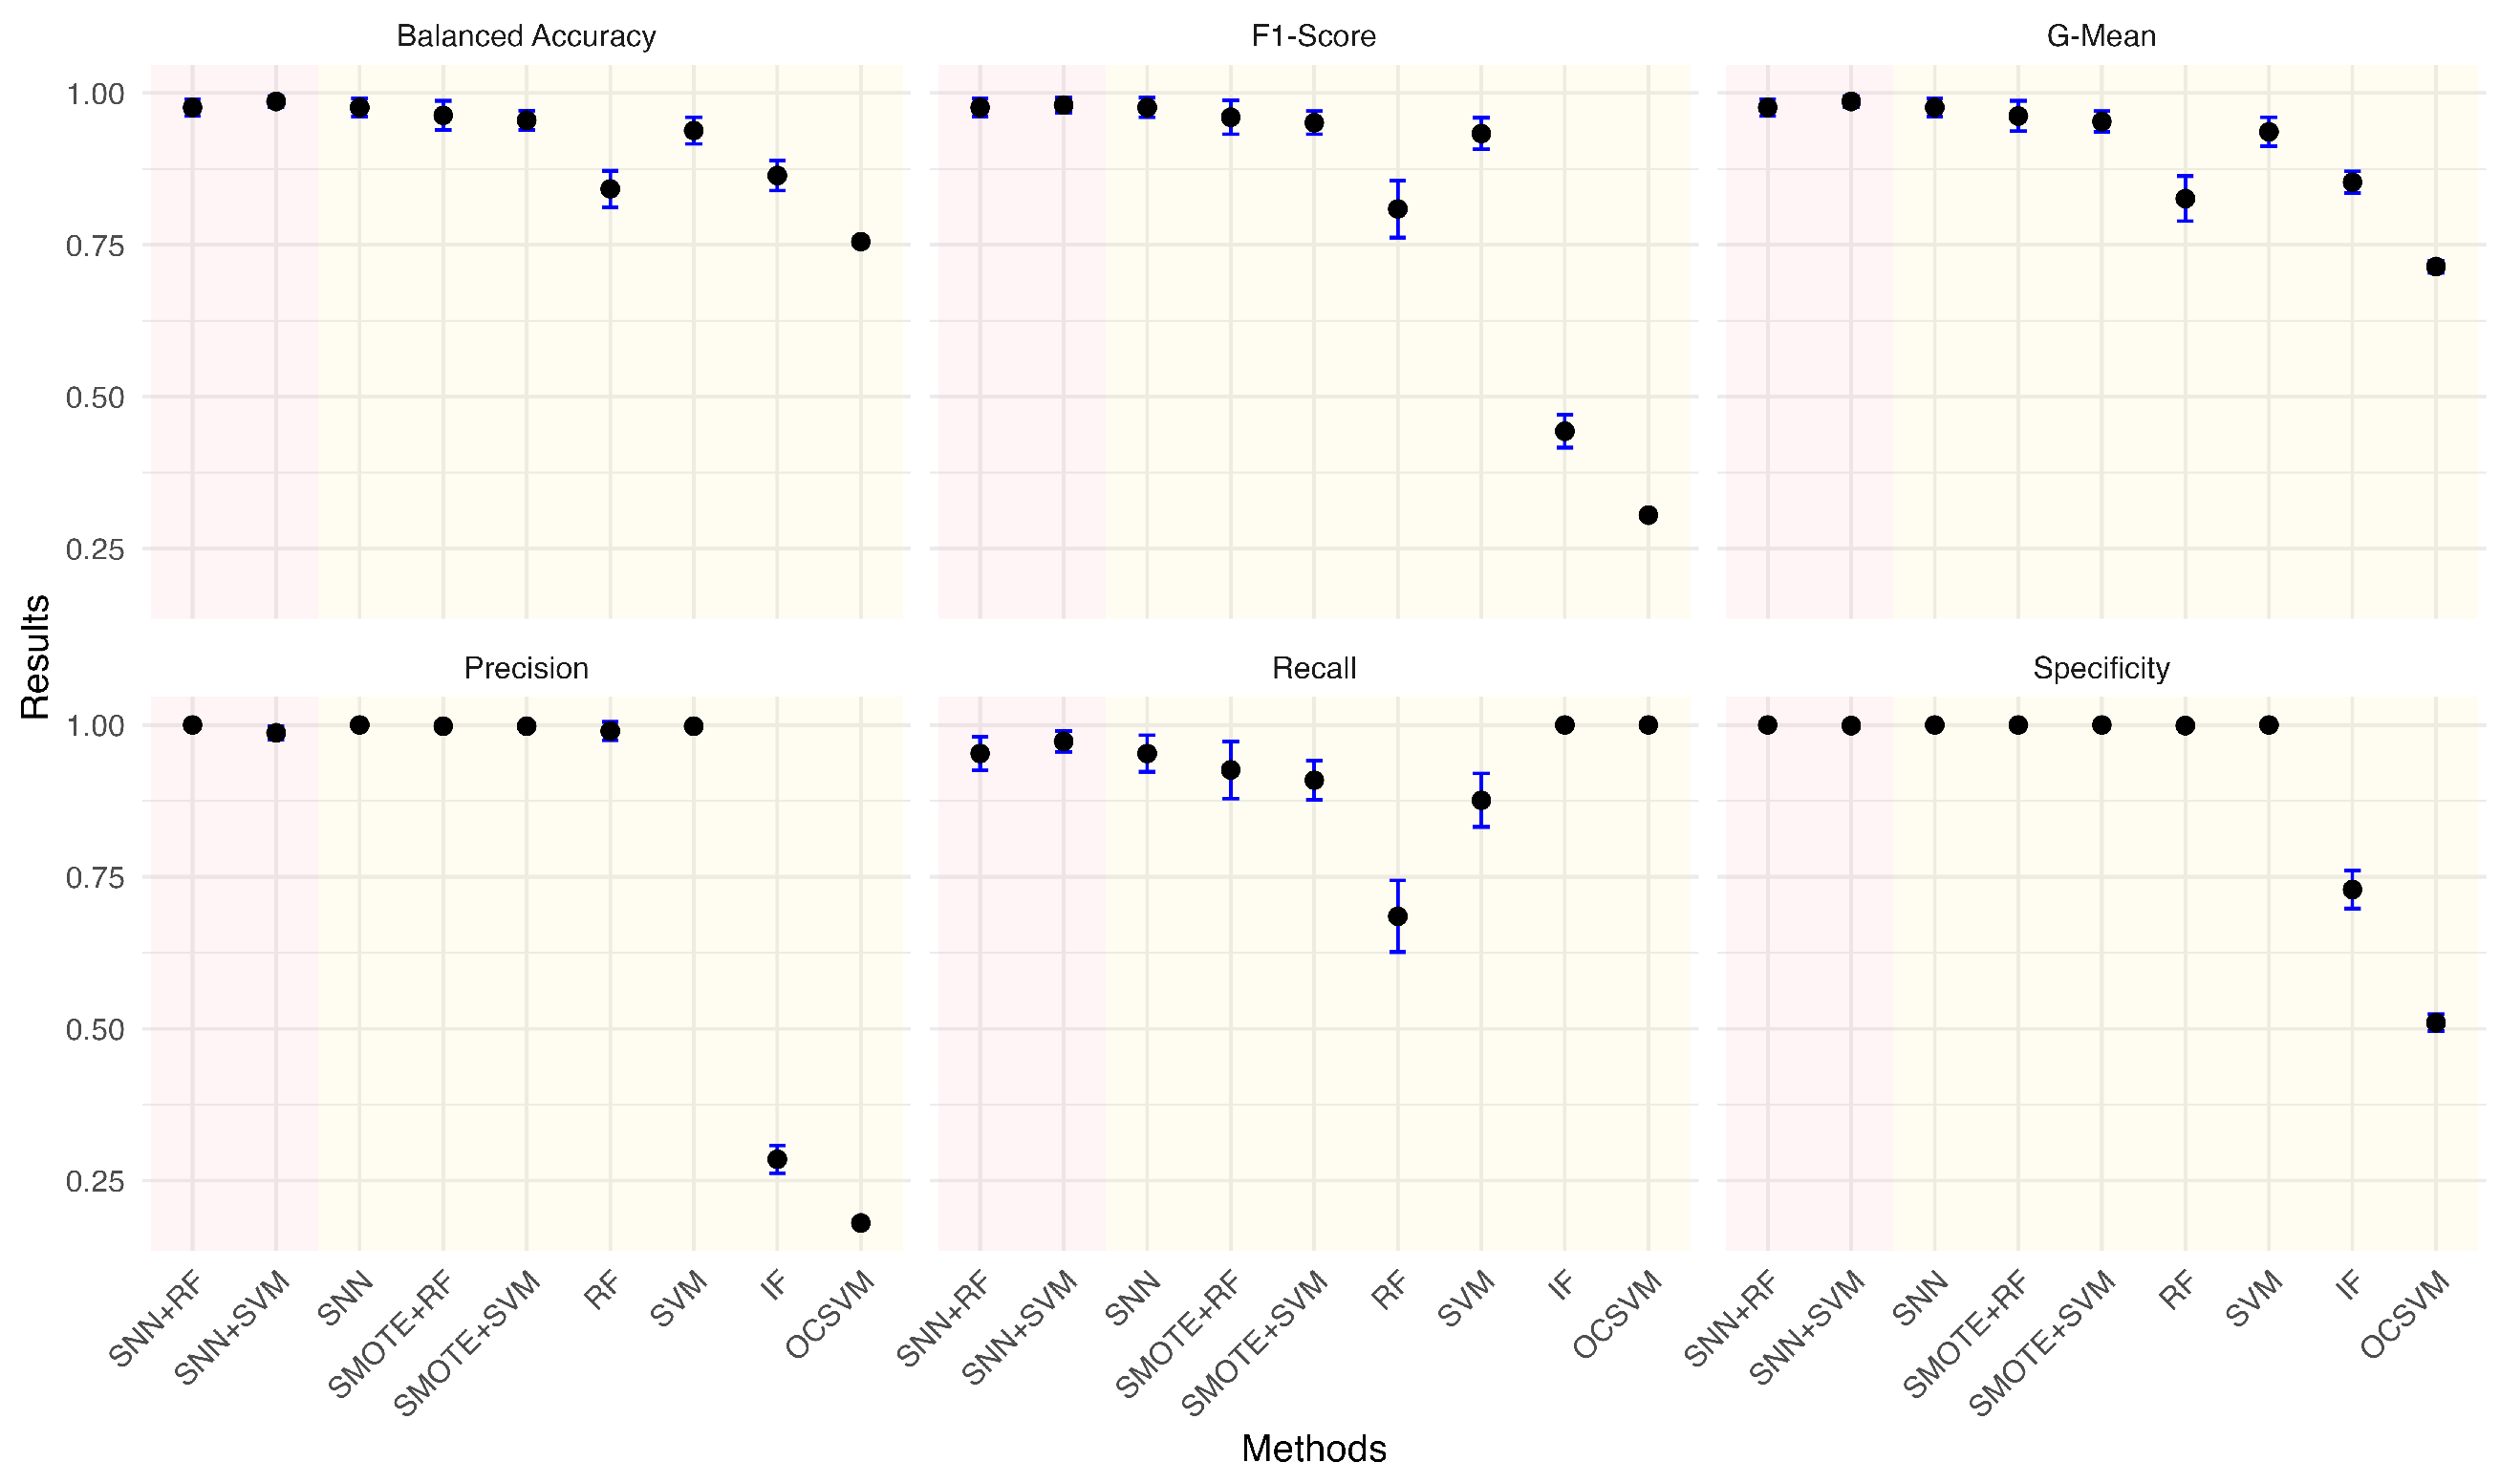
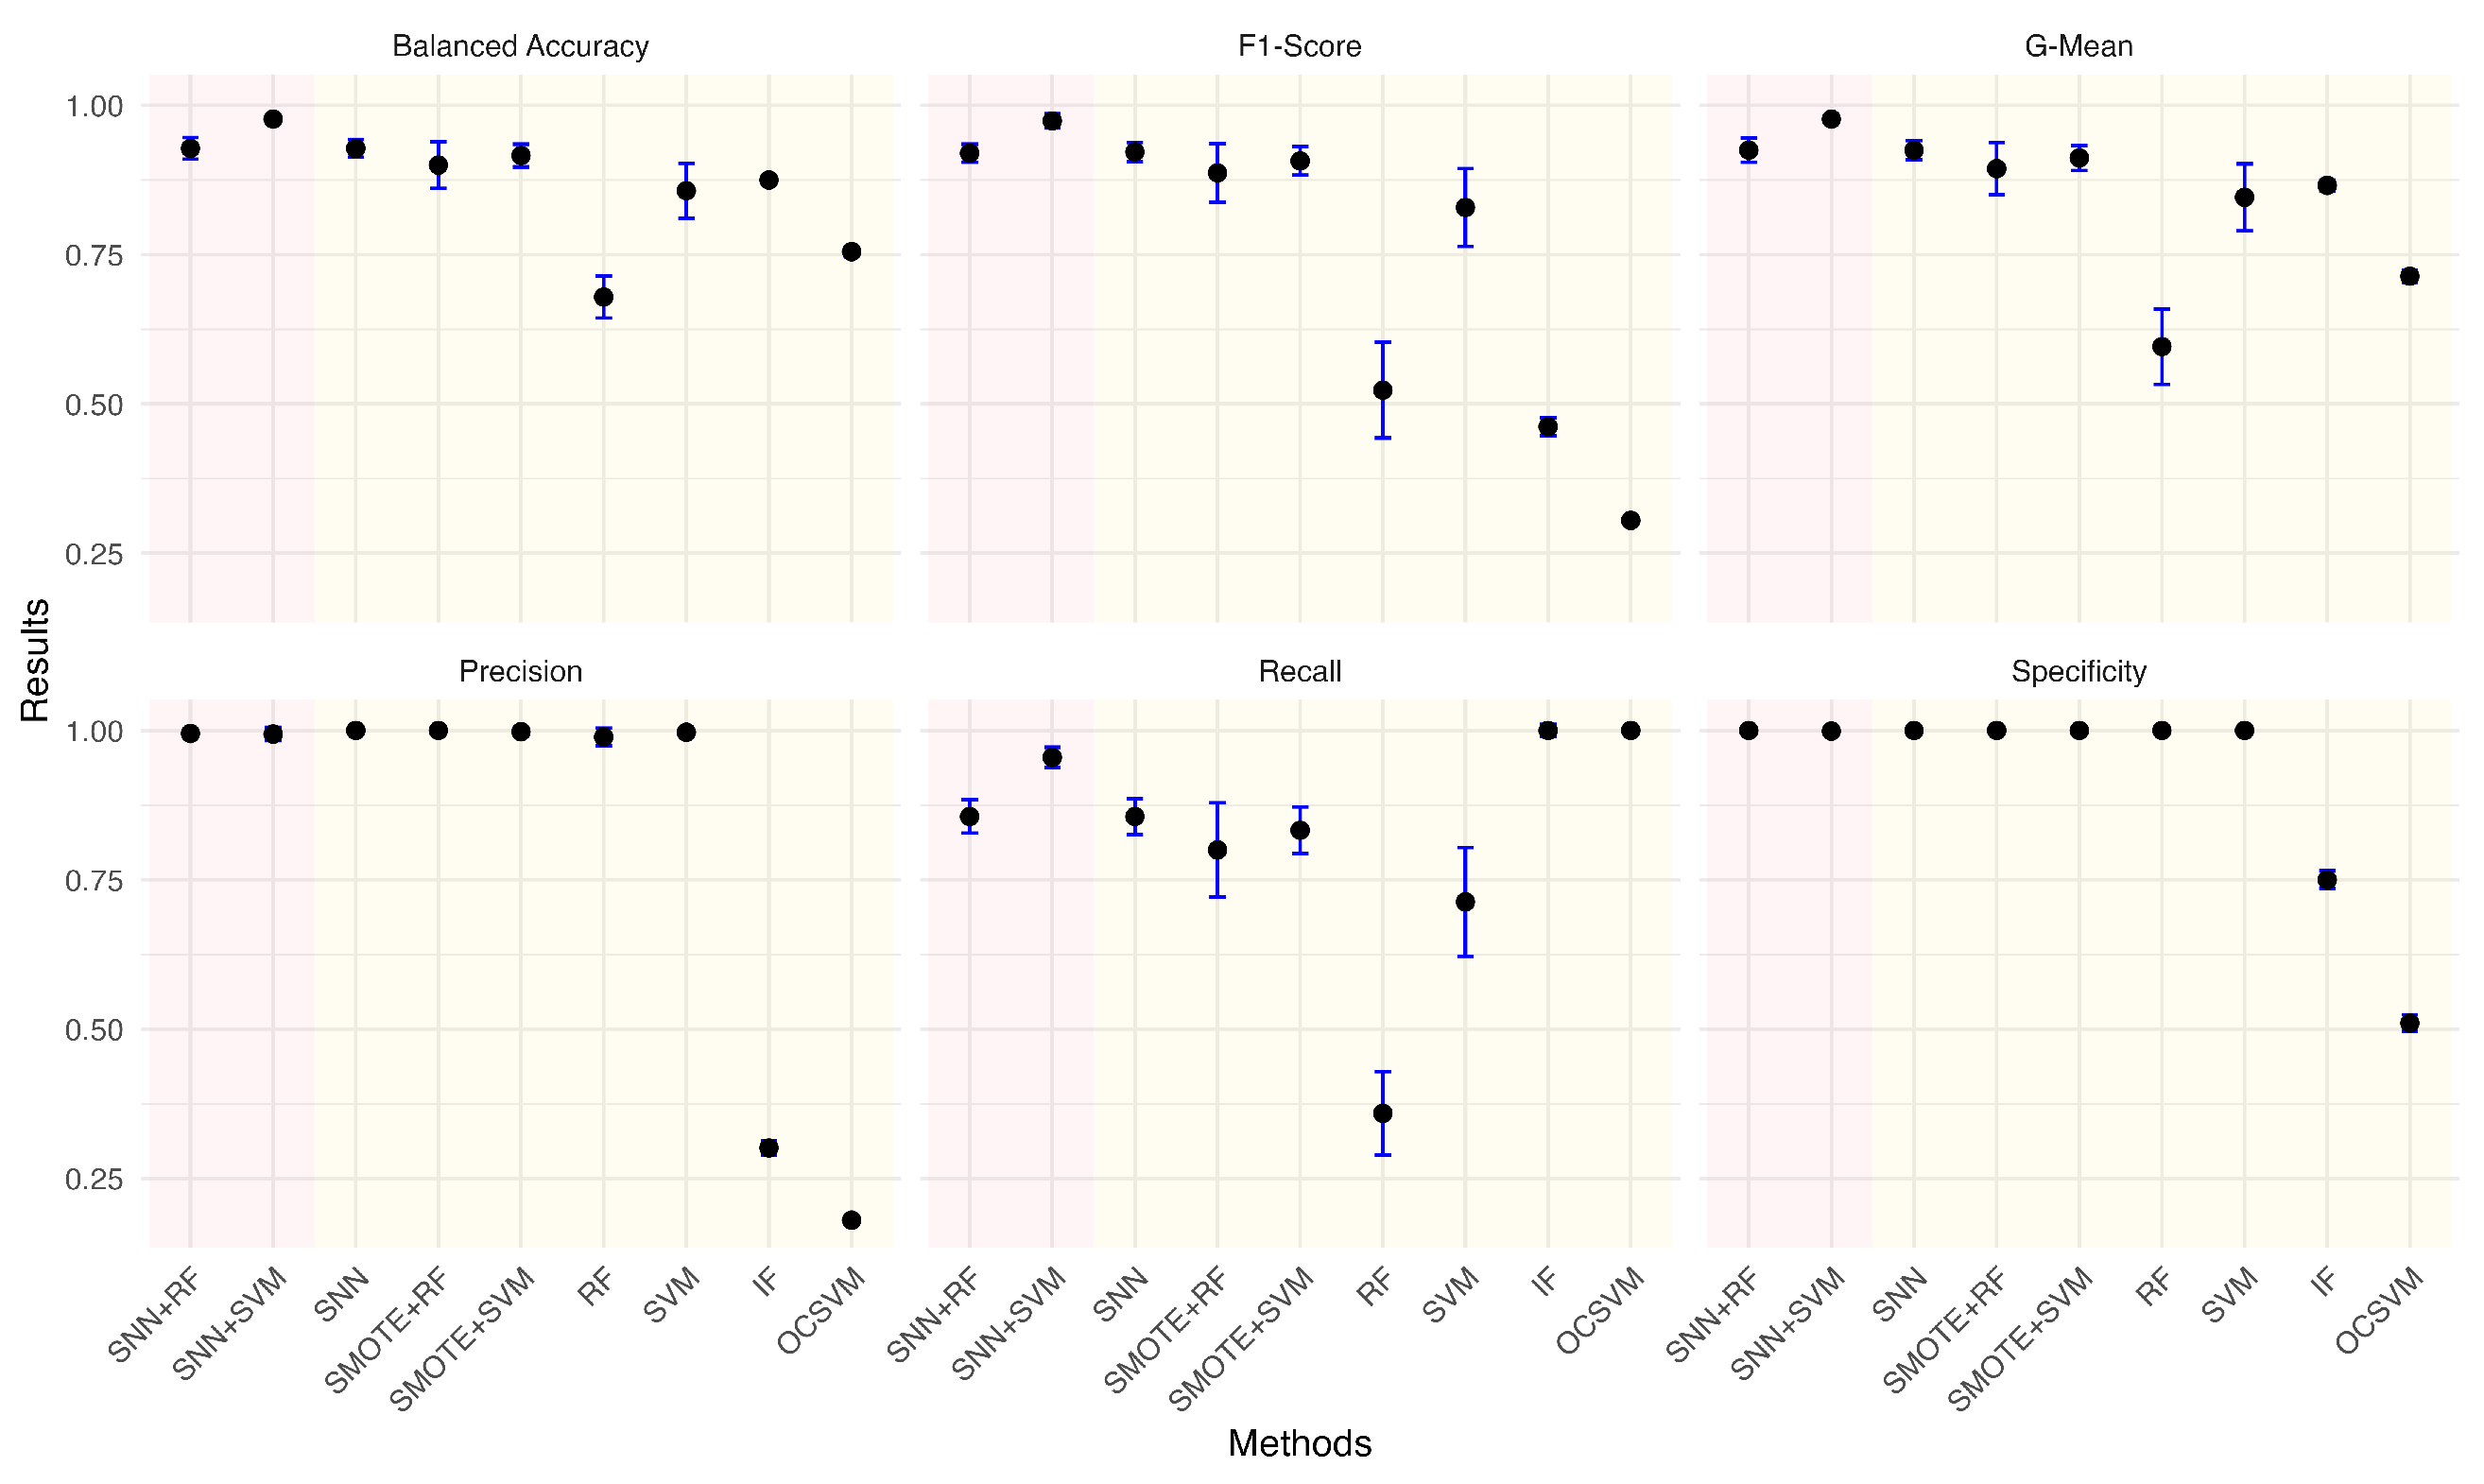
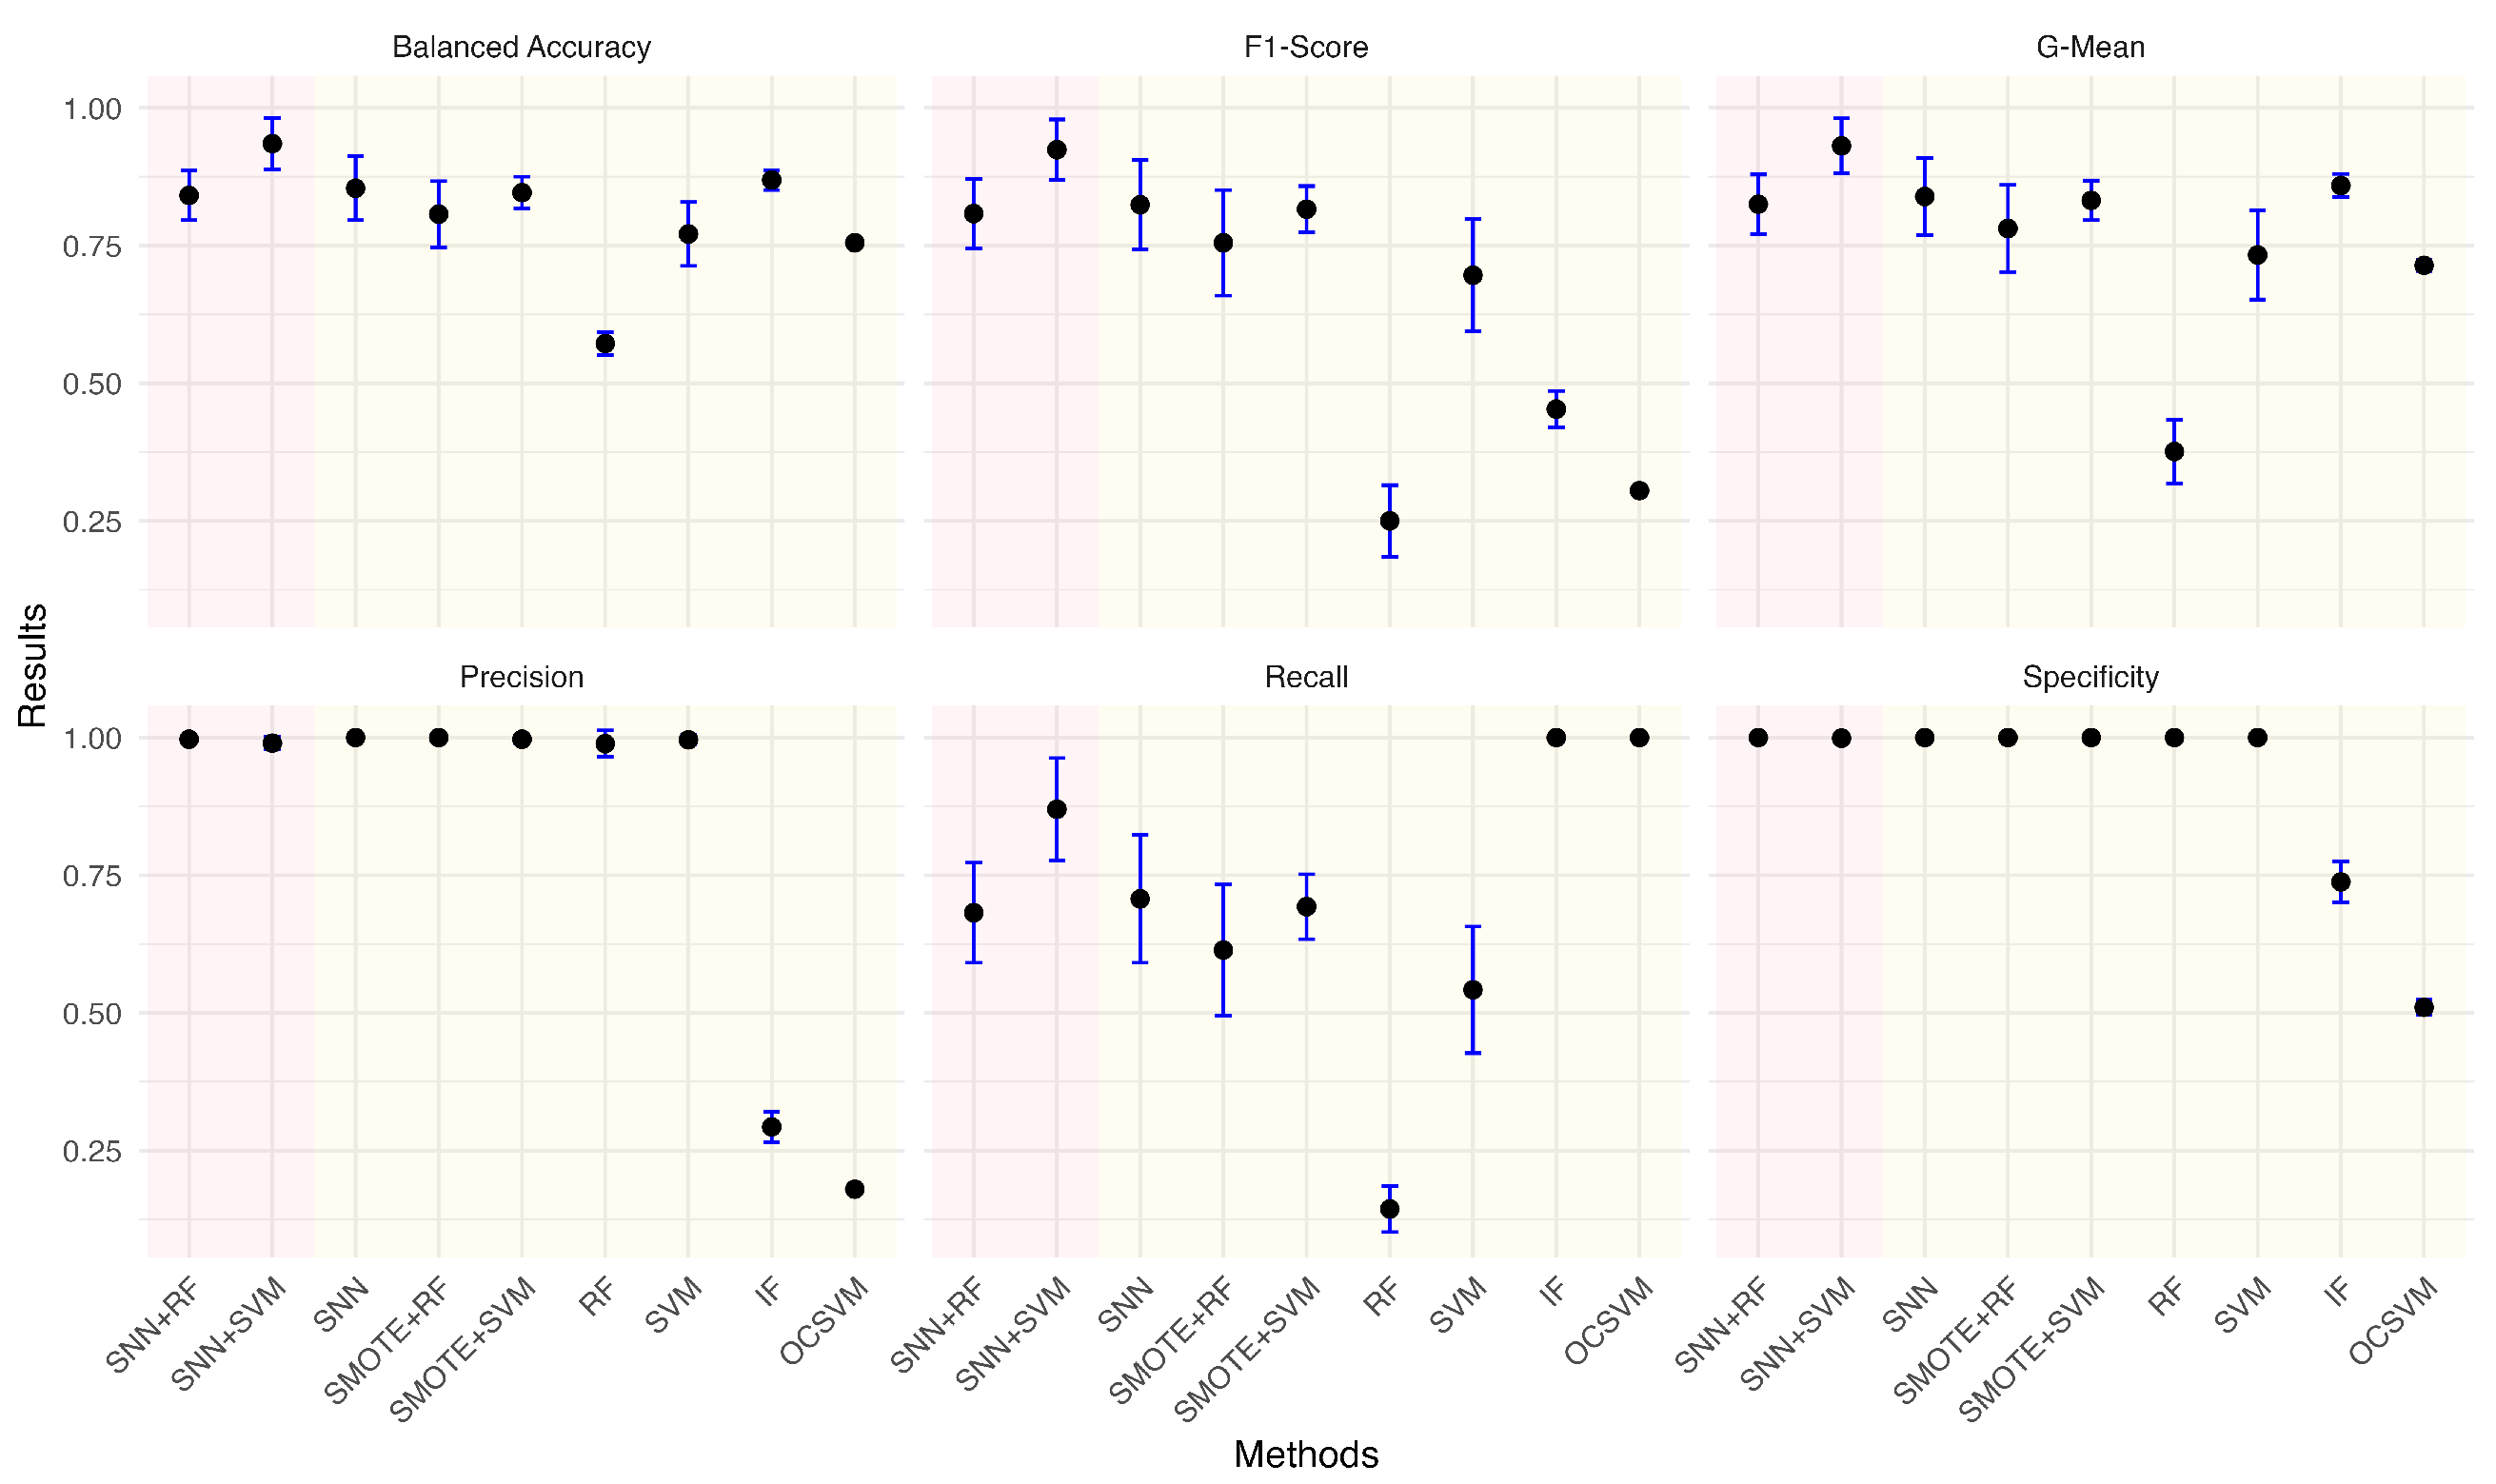
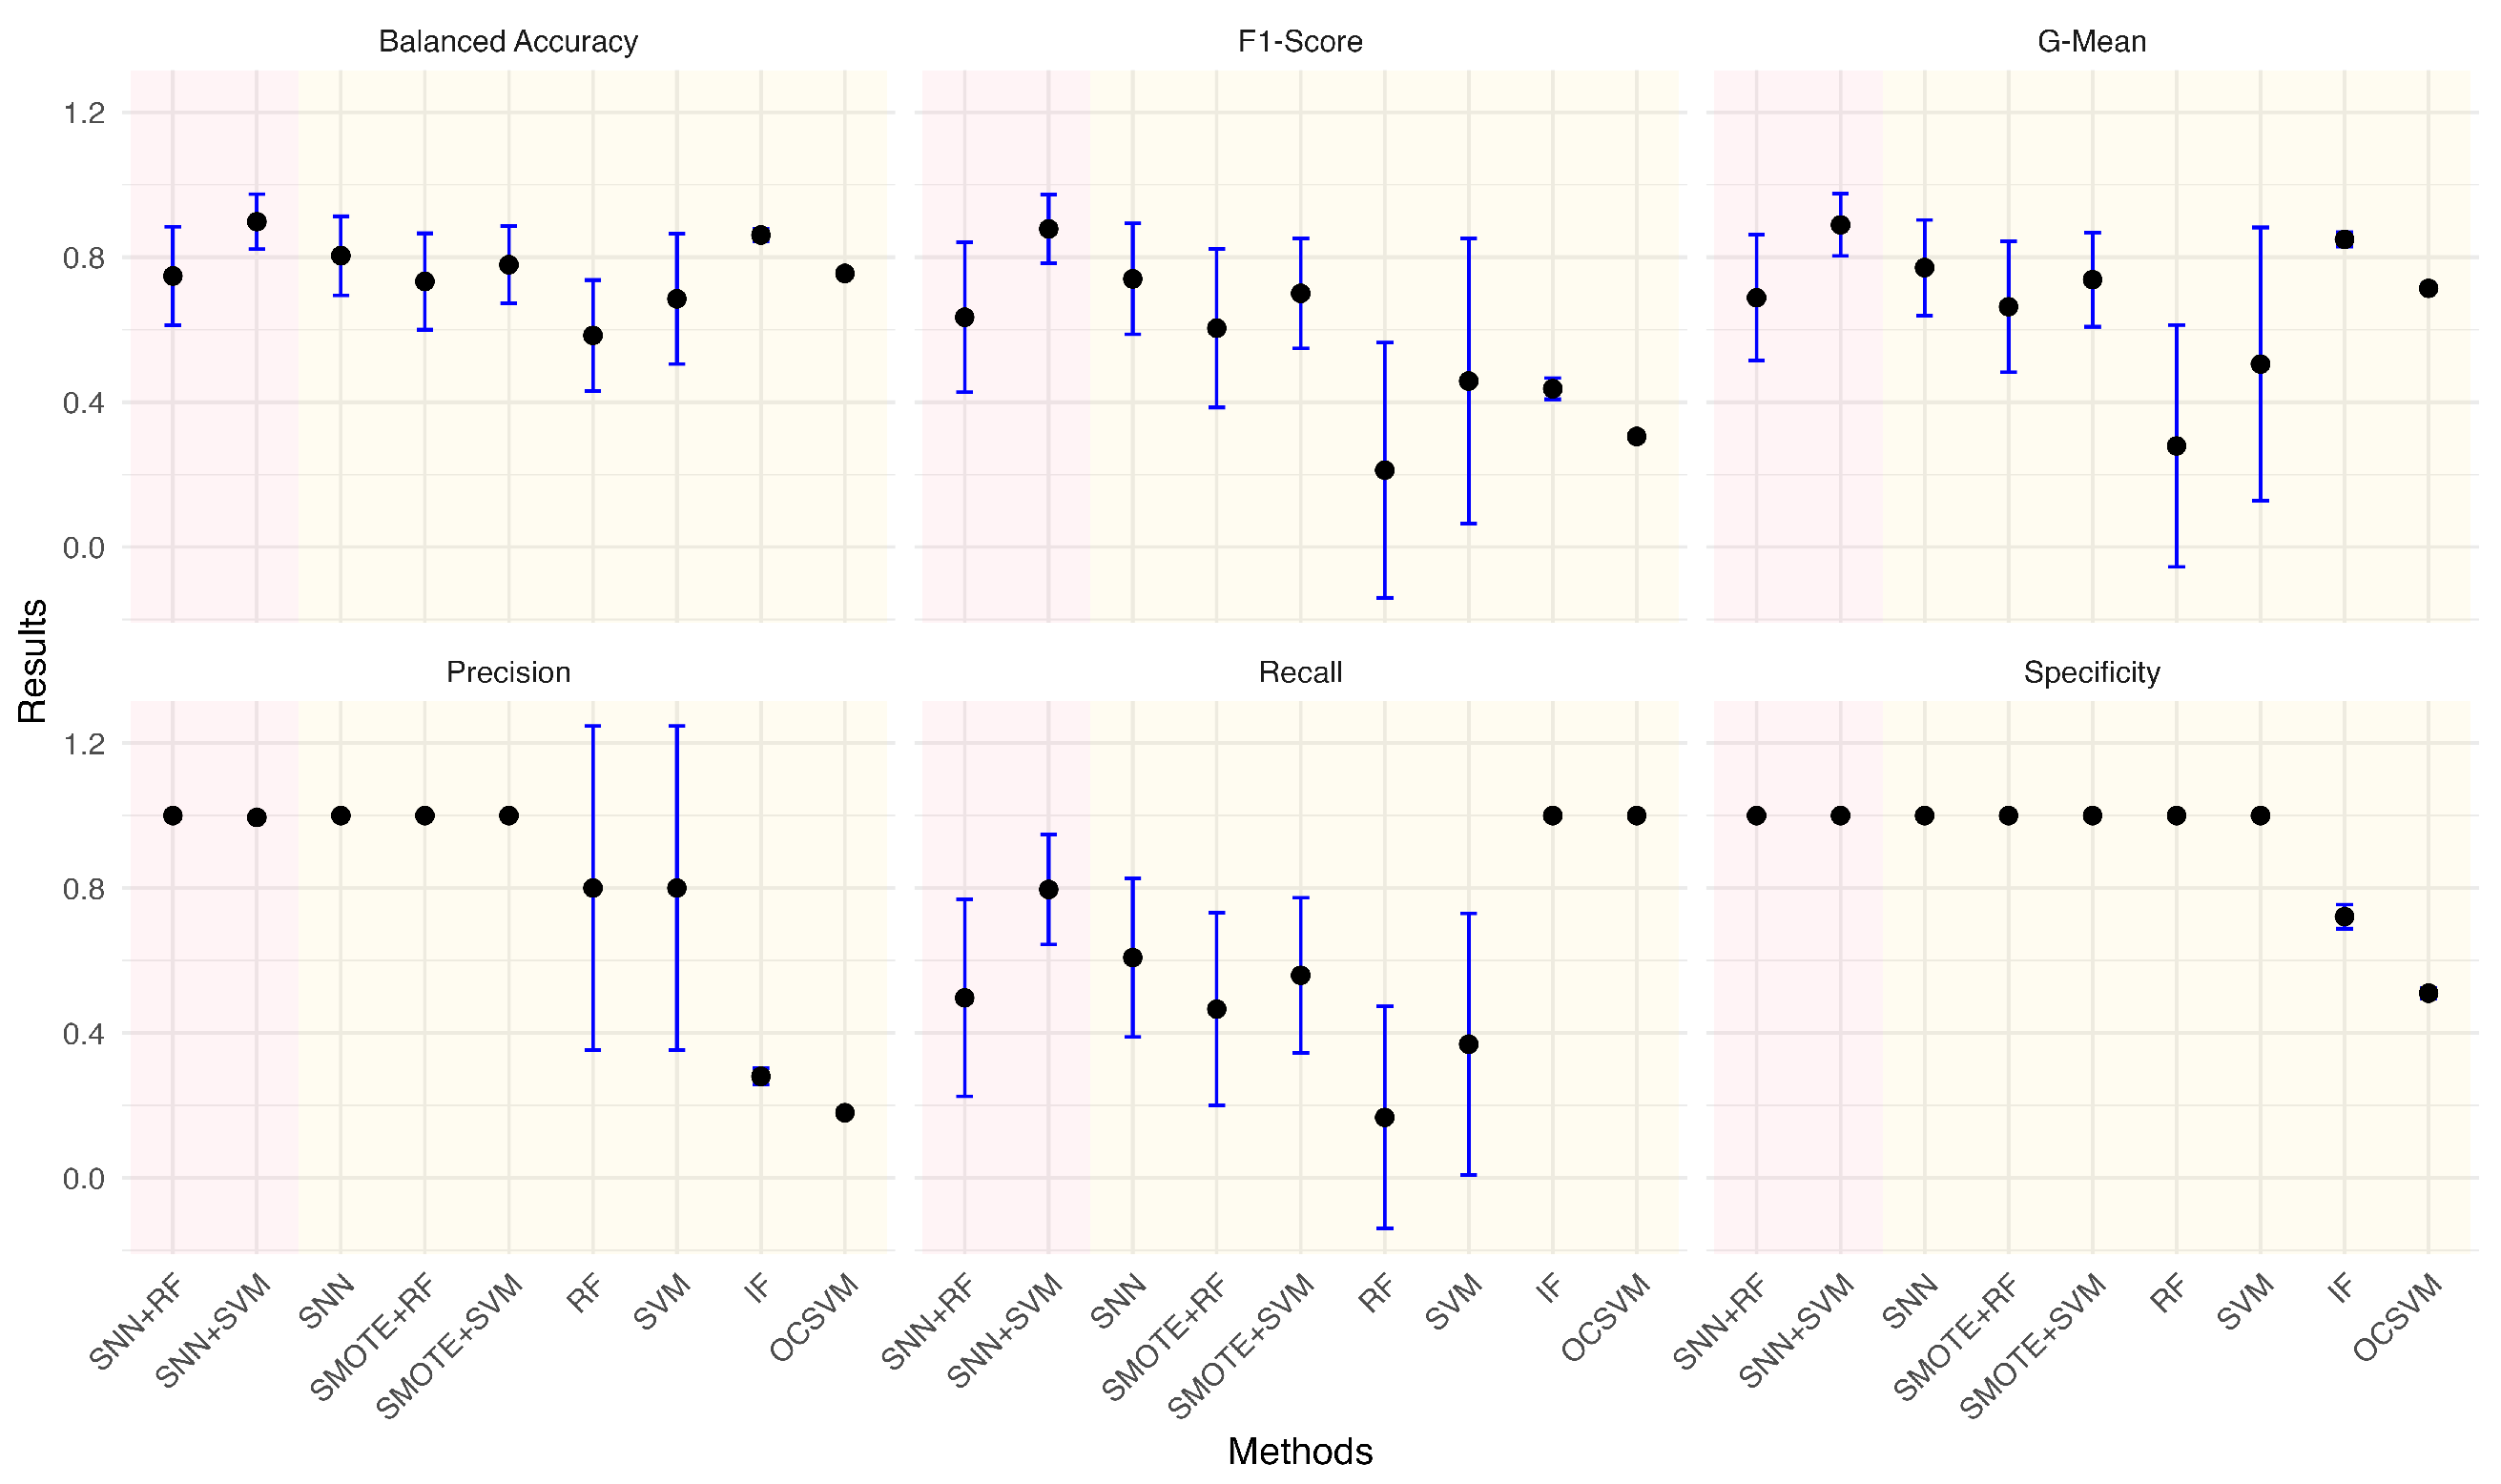
Given the practical significance of handling imbalanced datasets, we investigated the impact of different anomaly ratios on model performance. By systematically reducing the proportion of anomalies in the wafer dataset, we observed how models adapt to increasing class imbalance. Under each anomaly ratio, five sets of training and testing data were randomly sampled to ensure robust evaluation. Figure 5, Figure 6, Figure 7, Figure 8, Figure 9 and Figure 10 summarize the average performance and standard deviation of each model across six different anomaly ratios: 5.28%, 2.57%, 1.08%, 0.51%, 0.25%, and 0.11%. The proposed SNN + RF and SNN + SVM consistently achieve the highest F1-Score, G-Mean, and Balanced Accuracy across all anomaly ratios. Notably, as the anomaly ratio decreases, conventional supervised models such as SVM and RF suffer from performance degradation, whereas SNN-based models remain robust, maintaining high predictive accuracy even when anomalies represent just 0.11% of the dataset. This underscores the effectiveness of SNN feature transformation in addressing extreme class imbalance.
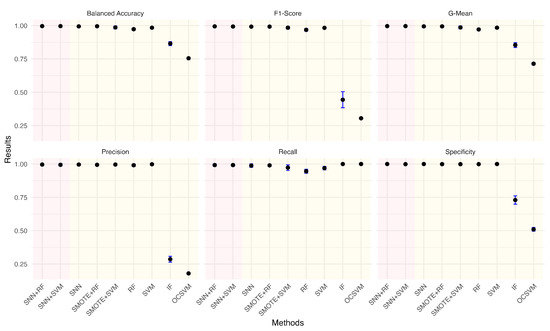
Figure 5.
Performance metrics comparison of different models for anomaly ratio of 5.28%.
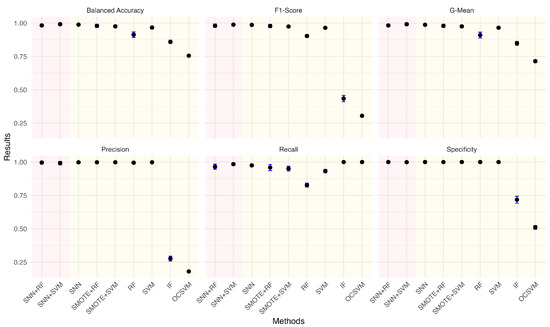
Figure 6.
Performance metrics comparison of different models for anomaly ratio of 2.57%.
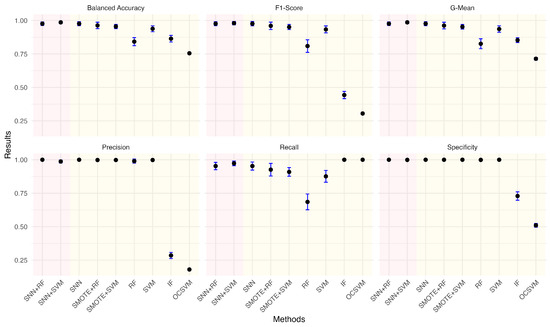
Figure 7.
Performance metrics comparison of different models for anomaly ratio of 1.08%.
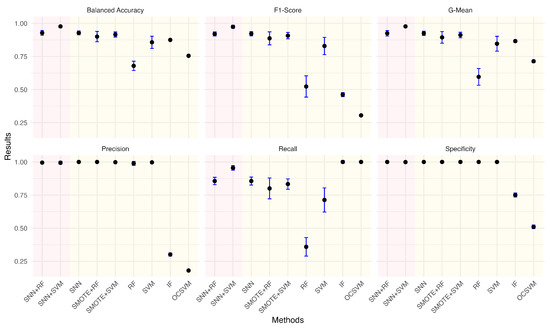
Figure 8.
Performance metrics comparison of different models for anomaly ratio of 0.51%.
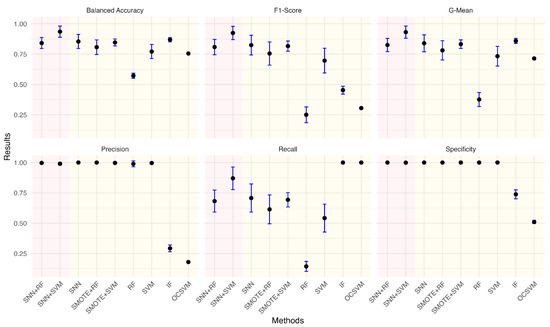
Figure 9.
Performance metrics comparison of different models for anomaly ratio of 0.25%.
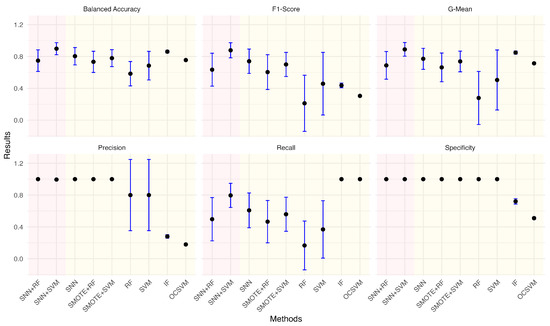
Figure 10.
Performance metrics comparison of different models for anomaly ratio of 0.11%.
Conversely, OCSVM and IF demonstrate strong Recall but at the expense of a high false positive rate, reinforcing that traditional anomaly detection models tend to prioritize Sensitivity over Precision. These findings suggest that for real-world applications where anomalies are rare and costly to misclassify, a feature extraction approach using SNN enhances stability and overall detection performance.
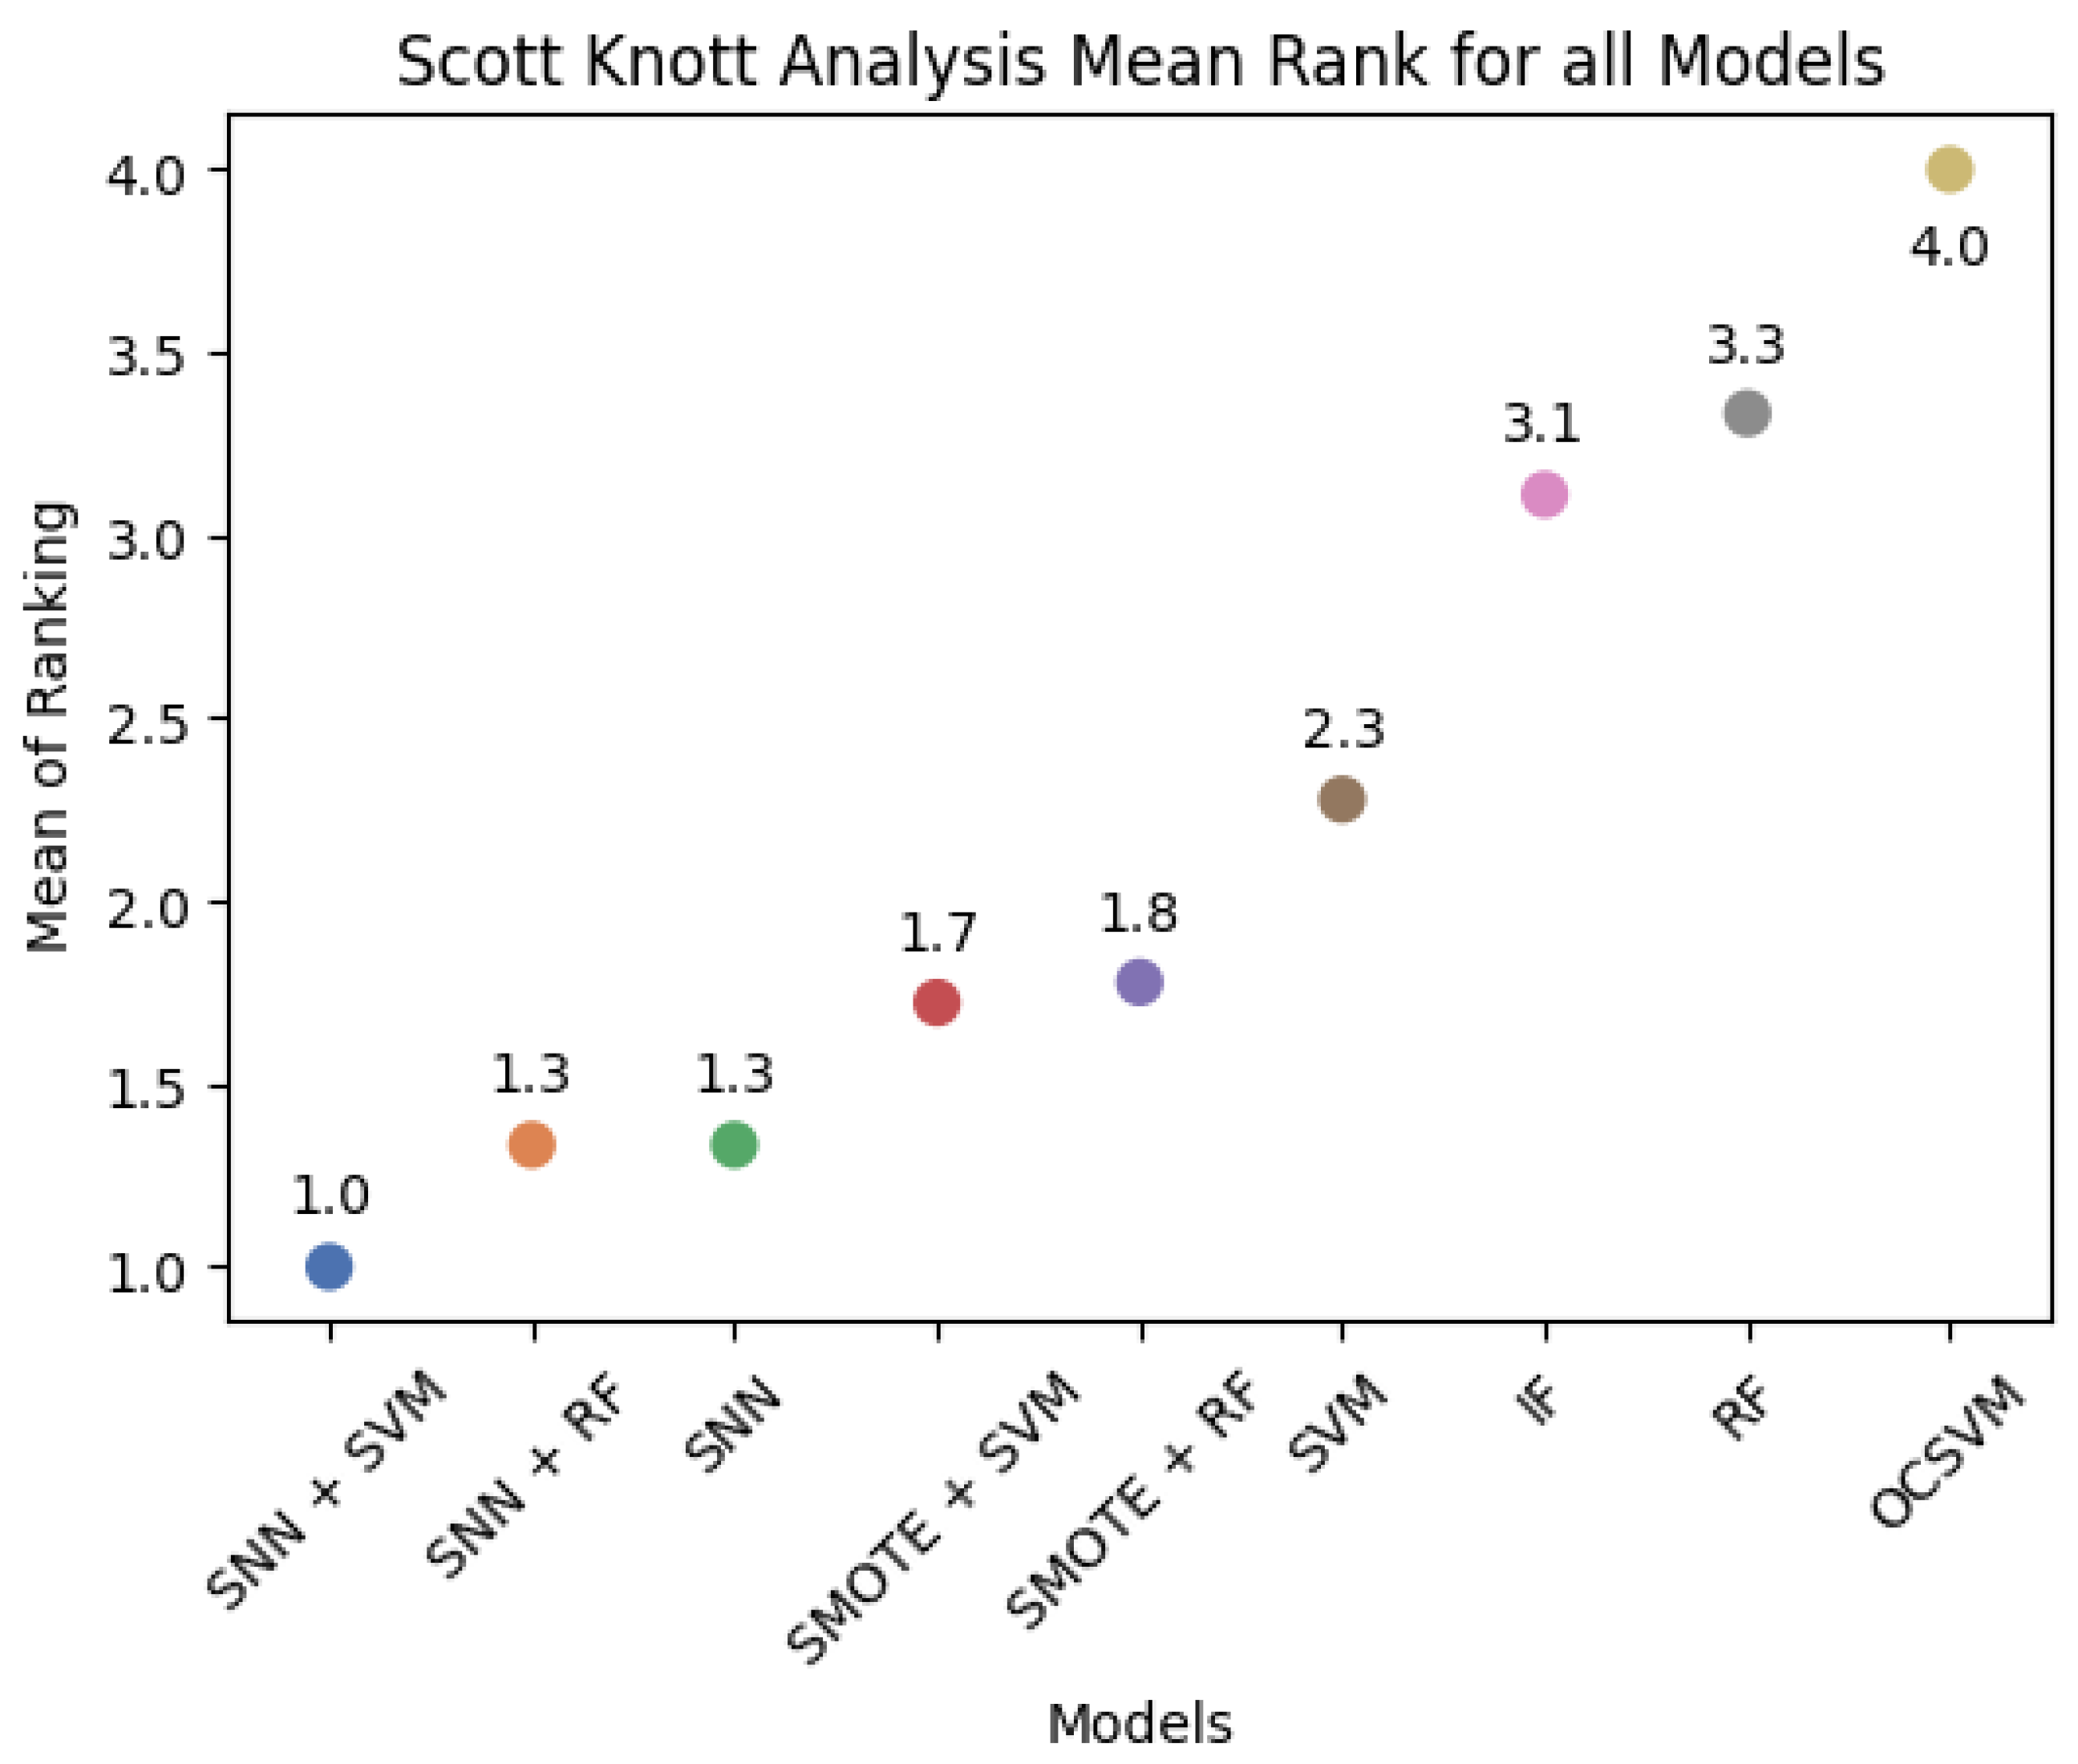
3.5. Scott–Knott Analysis for Model Ranking
To further validate model robustness, we applied Scott–Knott clustering analysis to group models based on their performance rankings across F1-Score, G-Mean, and Balanced Accuracy. This method identifies statistically distinct performance groups while minimizing within-group variation.
As illustrated in Figure 11, SNN + SVM ranks the highest, followed by SNN + RF, SNN, and SMOTE-based models. OCSVM exhibited the weakest overall performance, confirming the effectiveness of SNN-based feature mapping compared to both traditional classifiers and anomaly detection methods.
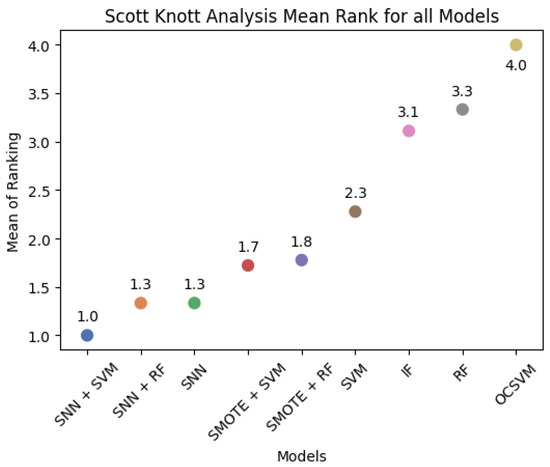
Figure 11.
Average rank plot of models based on Scott–Knott clustering.
3.6. Key Observations and Theoretical Implications
Based on the predictive results, we highlight the following key findings:
- 1.
- SNN enhances feature transformation: The use of the SNN as a feature extractor significantly improves classification performance in anomaly detection, particularly in structured datasets with high-dimensional features. Unlike traditional classifiers, which rely solely on raw feature spaces, the SNN maps data into a more discriminative representation, facilitating anomaly differentiation.
- 2.
- Robustness under extreme class imbalance: As the anomaly ratio decreases, SNN-based models maintain stability, whereas conventional classifiers degrade significantly. At an anomaly ratio of only 0.1%, SNN + SVM achieves the highest F1-Score of 0.878, highlighting its reliability in real-world scenarios with rare anomalies.
- 3.
- Effectiveness of oversampling techniques: SMOTE significantly enhances model performance in highly imbalanced datasets. For example, in the silicon wafer dataset with an anomaly ratio of 0.25%, SVM’s F1-Score improves from 0.696 to 0.816 after applying SMOTE, while the standard deviation decreases, demonstrating its ability to improve model stability.
- 4.
- Traditional anomaly detection models have high Recall but suffer from false positives: Algorithms such as OCSVM and IF are highly sensitive to anomalies, achieving high Recall but at the cost of low Precision and Specificity. This trade-off limits their practical applicability in scenarios where reducing false alarms is crucial.
- 5.
- Scott–Knott analysis confirms the superiority of SNN-based methods: Ranking analysis reveals that SNN + SVM and SNN + RF consistently outperform traditional models, validating the proposed approach as a data-efficient alternative for anomaly detection in structured datasets.
3.7. Practical and Theoretical Contributions
- Practical Implications: Our findings suggest that organizations dealing with highly imbalanced structured data can benefit from SNN-based feature extraction. Industries such as bioinformatics, medical diagnostics, and manufacturing defect detection can leverage this framework to improve anomaly detection with limited labeled data.
- Theoretical Contributions: This study provides empirical evidence supporting the effectiveness of SNNs for feature extraction in structured anomaly detection. By demonstrating how SNNs transform high-dimensional data into more discriminative representations, we contribute to the development of few-shot anomaly detection frameworks in structured domains.
4. Conclusions
This study investigated the use of Siamese Neural Networks (SNNs) for anomaly detection in structured datasets, demonstrating their effectiveness in learning meaningful feature representations and improving detection accuracy, particularly in imbalanced data scenarios. Our work contributes to the field by repurposing SNNs as feature extractors, an approach rarely explored in structured anomaly detection, and demonstrating their ability to transform raw data into a more discriminative feature space. By addressing challenges such as limited labeled anomalies and class imbalance, our study fulfills its objective of proposing a few-shot learning-based anomaly detection framework that enhances classification performance.
We systematically compared SNN-based feature extraction with conventional classifiers, anomaly detection models, and oversampling techniques. Our results indicate that SNNs outperform traditional methods, such as OCSVM and Isolation Forest, which, despite their high Recall, suffer from increased false positives. Additionally, SNNs maintain stability in highly imbalanced environments, unlike SVM and Random Forest, which are more susceptible to class distribution skew. The Scott–Knott analysis further revealed that model rankings vary across datasets, emphasizing the importance of pre-processing and feature selection in optimizing anomaly detection performance.
Despite these contributions, our study has certain limitations. First, while SNNs demonstrated strong predictive performance, overfitting remains a concern, particularly in smaller datasets. Optimizing neural network architectures, such as appropriate neuron allocation and gradual layer reduction, may mitigate this issue. Second, our study did not evaluate computational efficiency, which is crucial for real-time anomaly detection applications. Future work should include a runtime analysis to assess model scalability.
Future research should explore stochastic generative models, such as Generative Adversarial Networks (GANs) and Variational Autoencoders (VAEs), to further enhance anomaly detection in structured data for feature augmentation. Given the prevalence of time-series data in bioinformatics, integrating Recurrent Neural Networks (RNNs) or Long Short-Term Memory (LSTM) models could improve anomaly detection in sequential biomedical datasets, such as genomic data, biosensor readings, and medical signal processing.
In conclusion, SNNs provide a promising approach for anomaly detection in structured data by leveraging few-shot learning and feature transformation. This study contributes to the development of more robust and generalizable anomaly detection frameworks, with potential applications in bioinformatics, medical diagnostics, and computational biology. By addressing current limitations and integrating advanced deep learning techniques, future research can further refine SNN-based models for structured anomaly detection in complex, real-world environments.
Author Contributions
Conceptualization, E.P.C. and B.-C.H.; methodology, E.P.C.; software, B.-C.H.; validation, B.-C.H.; formal analysis, B.-C.H.; investigation, E.P.C.; resources, E.P.C.; data curation, B.-C.H.; writing—original draft preparation, E.P.C. and B.-C.H.; writing—review and editing, E.P.C.; visualization, E.P.C. and B.-C.H.; supervision, E.P.C.; project administration, E.P.C.; funding acquisition, E.P.C. All authors have read and agreed to the published version of the manuscript.
Funding
This research was funded by NSTC 111-2118-M-004-003 and the APC was funded by NSTC 113-2118-M-004-005.
Data Availability Statement
The data used in the research are from the UCR Time Series Classification Archive (https://archive.ics.uci.edu, accessed on 1 December 2022) and the UCI Machine Learning Repository (https://archive.ics.uci.edu, accessed on 1 December 2022).
Conflicts of Interest
The authors declare no conflicts of interest.
Abbreviations
The following abbreviations are used in this manuscript:
| SNN | Siamese neural network |
| SMOTE | Synthetic Minority Over-sampling Technique |
| SVM | Support Vector Machine |
| RF | Random Forest |
| IF | Isolation Forest |
| OCSVM | One-Class Support Vector Machine |
| FSL | Few-Shot Learning |
References
- Khatri, S.; Arora, A.; Agrawal, A.P. Supervised Machine Learning Algorithms for Credit Card Fraud Detection: A Comparison. In Proceedings of the 2020 10th International Conference on Cloud Computing, Data Science & Engineering (Confluence), Noida, India, 29–31 January 2020; pp. 680–683. [Google Scholar] [CrossRef]
- Song, S.; Baek, J.G. New Anomaly Detection in Semiconductor Manufacturing Process using Oversampling Method. In Proceedings of the ICAART (2), Valletta, Malta, 22–24 February 2020; pp. 926–932. [Google Scholar]
- Chandola, V.; Banerjee, A.; Kumar, V. Anomaly detection: A survey. ACM Comput. Surv. 2009, 41, 1–58. [Google Scholar] [CrossRef]
- Gao, B.; Kong, X.; Li, S.; Chen, Y.; Zhang, X.; Liu, Z.; Lv, W. Enhancing anomaly detection accuracy and interpretability in low-quality and class imbalanced data: A comprehensive approach. Appl. Energy 2024, 353, 122157. [Google Scholar] [CrossRef]
- Asghari, A.; Bergantin, F.; Forestiero, A.; Macrì, D. Anomalous behaviors detection of IoT devices through AI-based methodologies. In Proceedings of the 2024 7th International Conference of Computer and Informatics Engineering (IC2IE), Bali, Indonesia, 12–13 September 2024; pp. 1–8. [Google Scholar] [CrossRef]
- Xie, Z.; Bai, X.; Xu, X.; Xiao, Y. An anomaly detection method based on ship behavior trajectory. Ocean. Eng. 2024, 293, 116640. [Google Scholar] [CrossRef]
- Hilal, W.; Gadsden, S.A.; Yawney, J. Financial Fraud: A Review of Anomaly Detection Techniques and Recent Advances. Expert Syst. Appl. 2022, 193, 116429. [Google Scholar] [CrossRef]
- Han, S.; Hu, X.; Huang, H.; Jiang, M.; Zhao, Y. ADBench: Anomaly Detection Benchmark. In Proceedings of the Advances in Neural Information Processing Systems; Koyejo, S., Mohamed, S., Argarwal, A., Belgrave, D., Cho, K., Oh, A., Eds.; Curran Associates, Inc.: Red Hook, NY, USA, 2022; Volume 35, pp. 32142–32159. [Google Scholar]
- Breiman, L. Random forests. Mach. Learn. 2001, 45, 5–32. [Google Scholar]
- LeCun, Y.; Bengio, Y.; Hinton, G. Deep learning. Nature 2015, 521, 436–444. [Google Scholar] [CrossRef] [PubMed]
- Zhao, J.; Kong, L.; Lv, J. An Overview of Deep Neural Networks for Few-Shot Learning. Big Data Min. Anal. 2025, 8, 145–188. [Google Scholar] [CrossRef]
- Bromley, J.; Guyon, I.; LeCun, Y.; Säckinger, E.; Shah, R. Signature Verification using a “Siamese” Time Delay Neural Network. In Proceedings of the Advances in Neural Information Processing Systems; Cowan, J., Tesauro, G., Alspector, J., Eds.; Morgan-Kaufmann: Burlington, MA, USA, 1993; Volume 6. [Google Scholar]
- Bedi, P.; Gupta, N.; Jindal, V. Siam-IDS: Handling class imbalance problem in Intrusion Detection Systems using Siamese Neural Network. Procedia Comput. Sci. 2020, 171, 780–789. [Google Scholar] [CrossRef]
- Wang, Z.M.; Tian, J.Y.; Qin, J.; Fang, H.; Chen, L.M. A few-shot learning-based Siamese capsule network for intrusion detection with imbalanced training data. Comput. Intell. Neurosci. 2021, 2021, 7126913. [Google Scholar] [CrossRef] [PubMed]
- Zhao, L.; Shang, Z.; Tan, J.; Zhou, M.; Zhang, M.; Gu, D.; Zhang, T.; Tang, Y.Y. Siamese networks with an online reweighted example for imbalanced data learning. Pattern Recognit. 2022, 132, 108947. [Google Scholar] [CrossRef]
- Berlemont, S.; Lefebvre, G.; Duffner, S.; Garcia, C. Class-balanced siamese neural networks. Neurocomputing 2018, 273, 47–56. [Google Scholar] [CrossRef]
- Malialis, K.; Panayiotou, C.G.; Polycarpou, M.M. Data-efficient online classification with siamese networks and active learning. In Proceedings of the 2020 International Joint Conference on Neural Networks (IJCNN), Glasgow, UK, 19–24 July 2020; pp. 1–7. [Google Scholar]
- Pinon, N.; Trombetta, R.; Lartizien, C. One-Class SVM on siamese neural network latent space for Unsupervised Anomaly Detection on brain MRI White Matter Hyperintensities. In Proceedings of Machine Learning Research, Proceedings of the Medical Imaging with Deep Learning 2023, Nashville, TN, USA, 10–12 July 2023; Oguz, I., Noble, J., Li, X., Styner, M., Baumgartner, C., Rusu, M., Heinmann, T., Kontos, D., Landman, B., Dawant, B., Eds.; PMLR: Cambridge, MA, USA, 2024; Volume 227, pp. 1783–1797. [Google Scholar]
- Pokharkar, N.B. Improving Anomaly Detection in the Cognitive Test Scores Using Siamese Neural Network and Metric Learning as Ordinal Classification Task. Ph.D. Thesis, University of Michigan, Ann Arbor, MI, USA, 2024. [Google Scholar]
- Ghiasi, A.; Zhang, Z.; Zeng, Z.; Ng, C.T.; Sheikh, A.H.; Shi, J.Q. Generalization of anomaly detection in bridge structures using a vibration-based Siamese convolutional neural network. In Computer-Aided Civil Infrastructure Engineering; Wiley: Hoboken, NJ, USA, 2025. [Google Scholar] [CrossRef]
- Nassif, A.B.; Talib, M.A.; Nasir, Q.; Dakalbab, F.M. Machine Learning for Anomaly Detection: A Systematic Review. IEEE Access 2021, 9, 78658–78700. [Google Scholar] [CrossRef]
- Pang, G.; Shen, C.; Cao, L.; Hengel, A.V.D. Deep Learning for Anomaly Detection: A Review. ACM Comput. Surv. 2021, 54. [Google Scholar] [CrossRef]
- Belton, N.; Lawlor, A.; Curran, K.M. Semi-supervised siamese network for identifying bad data in medical imaging datasets. arXiv 2021, arXiv:2108.07130. [Google Scholar]
- Cortes, C.; Vapnik, V. Support-vector networks. Mach. Learn. 1995, 20, 273–297. [Google Scholar]
- Liu, F.T.; Ting, K.M.; Zhou, Z.H. Isolation forest. In Proceedings of the 2008 Eighth IEEE International Conference on Data Mining, Pisa, Italy, 15–19 December 2008; pp. 413–422. [Google Scholar]
- Schölkopf, B.; Williamson, R.C.; Smola, A.; Shawe-Taylor, J.; Platt, J. Support vector method for novelty detection. Adv. Neural Inf. Process. Syst. 1999, 12, 582–588. [Google Scholar]
- Pedregosa, F.; Varoquaux, G.; Gramfort, A.; Michel, V.; Thirion, B.; Grisel, O.; Blondel, M.; Prettenhofer, P.; Weiss, R.; Dubourg, V.; et al. Scikit-learn: Machine learning in Python. J. Mach. Learn. Res. 2011, 12, 2825–2830. [Google Scholar]
- Chawla, N.V.; Bowyer, K.W.; Hall, L.O.; Kegelmeyer, W.P. SMOTE: Synthetic minority over-sampling technique. J. Artif. Intell. Res. 2002, 16, 321–357. [Google Scholar] [CrossRef]
- Scott, A.J.; Knott, M. A Cluster Analysis Method for Grouping Means in the Analysis of Variance. Biometrics 1974, 30, 507–512. [Google Scholar] [CrossRef]
- Olszewski, R.T. Generalized Feature Extraction for Structural Pattern Recognition in Time-Series Data; Carnegie Mellon University: Pittsburgh, PA, USA, 2001. [Google Scholar]
- Pang, G.; Shen, C.; Van Den Hengel, A. Deep anomaly detection with deviation networks. In Proceedings of the 25th ACM SIGKDD International Conference on Knowledge Discovery & Data Mining, Anchorage, AK, USA, 4–8 August 2019; pp. 353–362. [Google Scholar]
- Moustafa, N.; Slay, J. UNSW-NB15: A comprehensive data set for network intrusion detection systems (UNSW-NB15 network data set). In Proceedings of the 2015 Military Communications and Information Systems Conference (MilCIS), Canberra, Australia, 10–12 November 2015; pp. 1–6. [Google Scholar]
- Brümmer, N.; Cumani, S.; Glembek, O.; Karafiát, M.; Matejka, P. Description and analysis of the Brno276 system for LRE2011. sign (ℓ i-ℓ j) 2012, 1000, 24. [Google Scholar]


Disclaimer/Publisher’s Note: The statements, opinions and data contained in all publications are solely those of the individual author(s) and contributor(s) and not of MDPI and/or the editor(s). MDPI and/or the editor(s) disclaim responsibility for any injury to people or property resulting from any ideas, methods, instructions or products referred to in the content. |
© 2025 by the authors. Licensee MDPI, Basel, Switzerland. This article is an open access article distributed under the terms and conditions of the Creative Commons Attribution (CC BY) license (https://creativecommons.org/licenses/by/4.0/).