Article

Open-Loop Wavefront Reconstruction with Pyramidal Sensors Using Convolutional Neural Networks

by
Saúl Pérez-Fernández
1,2,*,
Alejandro Buendía-Roca
1,3,
Carlos González-Gutiérrez
1,2,
Francisco García-Riesgo
1,
Javier Rodríguez-Rodríguez
1,
Santiago Iglesias-Alvarez
1,
Julia Fernández-Díaz
1 and
Francisco Javier Iglesias-Rodríguez
1,4
1
Instituto de Ciencias y Tecnologías Espaciales de Asturias (ICTEA), University of Oviedo, 33004 Oviedo, Spain
2
Department of Computer Science, University of Oviedo, 33007 Oviedo, Spain
3
Department of Mathematics, University of Oviedo, 33007 Oviedo, Spain
4
Business Department, University of Oviedo, 33004 Oviedo, Spain
*
Author to whom correspondence should be addressed.
Mathematics 2025, 13(7), 1028; https://doi.org/10.3390/math13071028
Submission received: 29 January 2025 / Revised: 24 February 2025 / Accepted: 18 March 2025 / Published: 21 March 2025

Abstract

:
Neural networks have significantly advanced adaptive optics systems for telescopes in recent years. Future adaptive optics systems, especially for extremely large telescopes, are expected to predominantly employ pyramid wavefront sensors, which offer good sensitivity but suffer from a non-linear response under certain conditions. This non-linearity limits the performance of traditional linear reconstruction methods, such as matrix–vector multiplication, leading to suboptimal performance. Convolutional Neural Networks offer a promising alternative, as they can model complex non-linear relationships and extract spatial patterns from sensor images. While CNN-based reconstruction has shown success in closed-loop systems, this study investigates their application in open-loop wavefront reconstruction. A custom network architecture and training strategy are developed, using realistic training data from end-to-end atmospheric turbulence simulations. CNNs are trained to reconstruct Zernike polynomial coefficients representing optical aberrations, enabling a tomographic estimation of turbulence. The proposed approach demonstrates significant improvements over conventional open-loop methods, underscoring the potential of CNNs to enhance wavefront reconstruction in next-generation AO systems.

1. Introduction

Despite significant advancements in space telescope technology, several challenges remain, including the significant financial and time investments, the difficulty of launching such technology, and the subsequent maintenance. For this reason, ground-based telescopes continue to be essential instruments for astronomical studies. In contrast to their space-based counterparts, they are significantly hampered by the effects of the atmosphere. Due to atmospheric turbulence causing the layers of the atmosphere to constantly vary their refractive index, the wavefront is distorted, which lowers the quality of the images that the telescopes can collect, making it harder to extract pertinent information and resulting in inaccurate descriptions of the objects being observed. Adaptive optics (AO) has proven to be one of the most effective tools to address this problem and has become essential for correction systems.
Adaptive optics integrates optics, mechanics, electronics, computer technology, and automation to correct time-varying optical aberrations. Originally proposed for astronomy, AO was first proposed in 1953 by the astronomer Babcock [1] to counteract atmospheric turbulence, though its implementation was limited by technology at the time. The first functional AO system was developed in 1977 by Hardy et al. [2]. Since then, driven by military and scientific demands, AO technology has advanced significantly, with the first civilian system, “Come-on”, deployed in 1989 [3].
Today, most large optical telescopes are equipped with AO systems to achieve high-resolution imaging. However, expanding AO capabilities to cover wider fields of view and broader spectral ranges presents significant challenges. To address these challenges, specialized AO systems like Multi-layer Conjugation AO (MCAO) [4] and Multi-object AO (MOAO) [5] have been developed, adapted to specific scientific goals. However, in this work, the focus will be exclusively on the Single Conjugated Adaptive Optics (SCAO) configuration [6].
Wavefront sensing provides a quantitative measure of wavefront aberrations, enabling accurate estimation of the wavefront’s shape. The most common wavefront sensors used in the different AO configurations are the Shack–Hartmann (SHWFS) sensor [7] and Pyramid sensor (PWFS) [8].
The PWFS is becoming increasingly important in the field, particularly for next-generation systems, such as those planned for extremely large telescopes. This sensor offers high sensitivity to wavefront errors, including critical aspects like the differential piston, which is essential for achieving precise measurements and corrections [9]. Unlike traditional Shack–Hartmann sensors, the PWFS, especially in its non-modulated configuration [10], provides greater sensitivity at the expense of reduced linearity in its response. This trade-off has driven interest in non-linear reconstruction methods, including those based on neural networks, to fully exploit the sensor’s capabilities [11,12,13,14].
In the last years, Neural networks (NNs) have been explored for wavefront prediction and reconstruction in AO, primarily focusing on working with simulated atmospheric turbulence or wavefront sensor data. In the context of wavefront reconstruction, NNs facilitate the learning of intricate relationships between wavefront sensors (WFSs) and deformable mirrors (DMs), thereby enabling more accurate corrections [15]. In closed-loop systems, the deployment of NN-based methodologies has resulted in notable performance enhancements.
In the present work, the study conducted in [16] is taken as a reference. That study compared a more traditional adaptive optics correction system, a linear matrix–vector multiplication reconstructor (MVM), with another system based on predictive neural network models. The data were obtained using the Subaru Coronagraphic Extreme Adaptive Optics (SCExAO) system in an open-loop configuration and employing a PWFS. In that study, various experiments were conducted to compare the results in terms of the accuracy of Zernike mode reconstruction.
The aim of this study is to explore predictive models capable of achieving greater accuracy under similar conditions to those described in the previously mentioned work. A more detailed analysis has been carried out on neural models based on convolutional layers (CNNs), which have shown high efficiency in previous studies when modelling non-linearities [17,18], either from the sensor images or directly from the phase. This feature extraction leads to results that outperform those reported in [16]. Such an advantage can be particularly valuable in open-loop configurations, where the lack of feedback complicates the process. This scenario has been widely studied for the commonly used Shack–Hartmann sensors but remains quite unexplored in the case of pyramidal sensors.
Additionally, increasing the complexity of the atmospheric turbulence parameters, expanding the range of Zernike modes used in phase reconstruction, and introducing the optical error of the system itself as a cost function in the model will be considered. Furthermore, the models will be evaluated under different characteristics to assess their stability and adaptability to changes in atmospheric turbulence parameters.
The article is structured as follows: Section 2 discusses the basis for experiments such as the atmospheric conditions used for the data generation as well as the theoretical foundation of neural network models and adaptive optics. Section 3 includes the experiments carried out, from the initial analysis of new models to the stability evaluation. Section 4 provides an analysis of the results. Finally, Section 5 presents the final conclusions of the study.

2. Materials and Methods

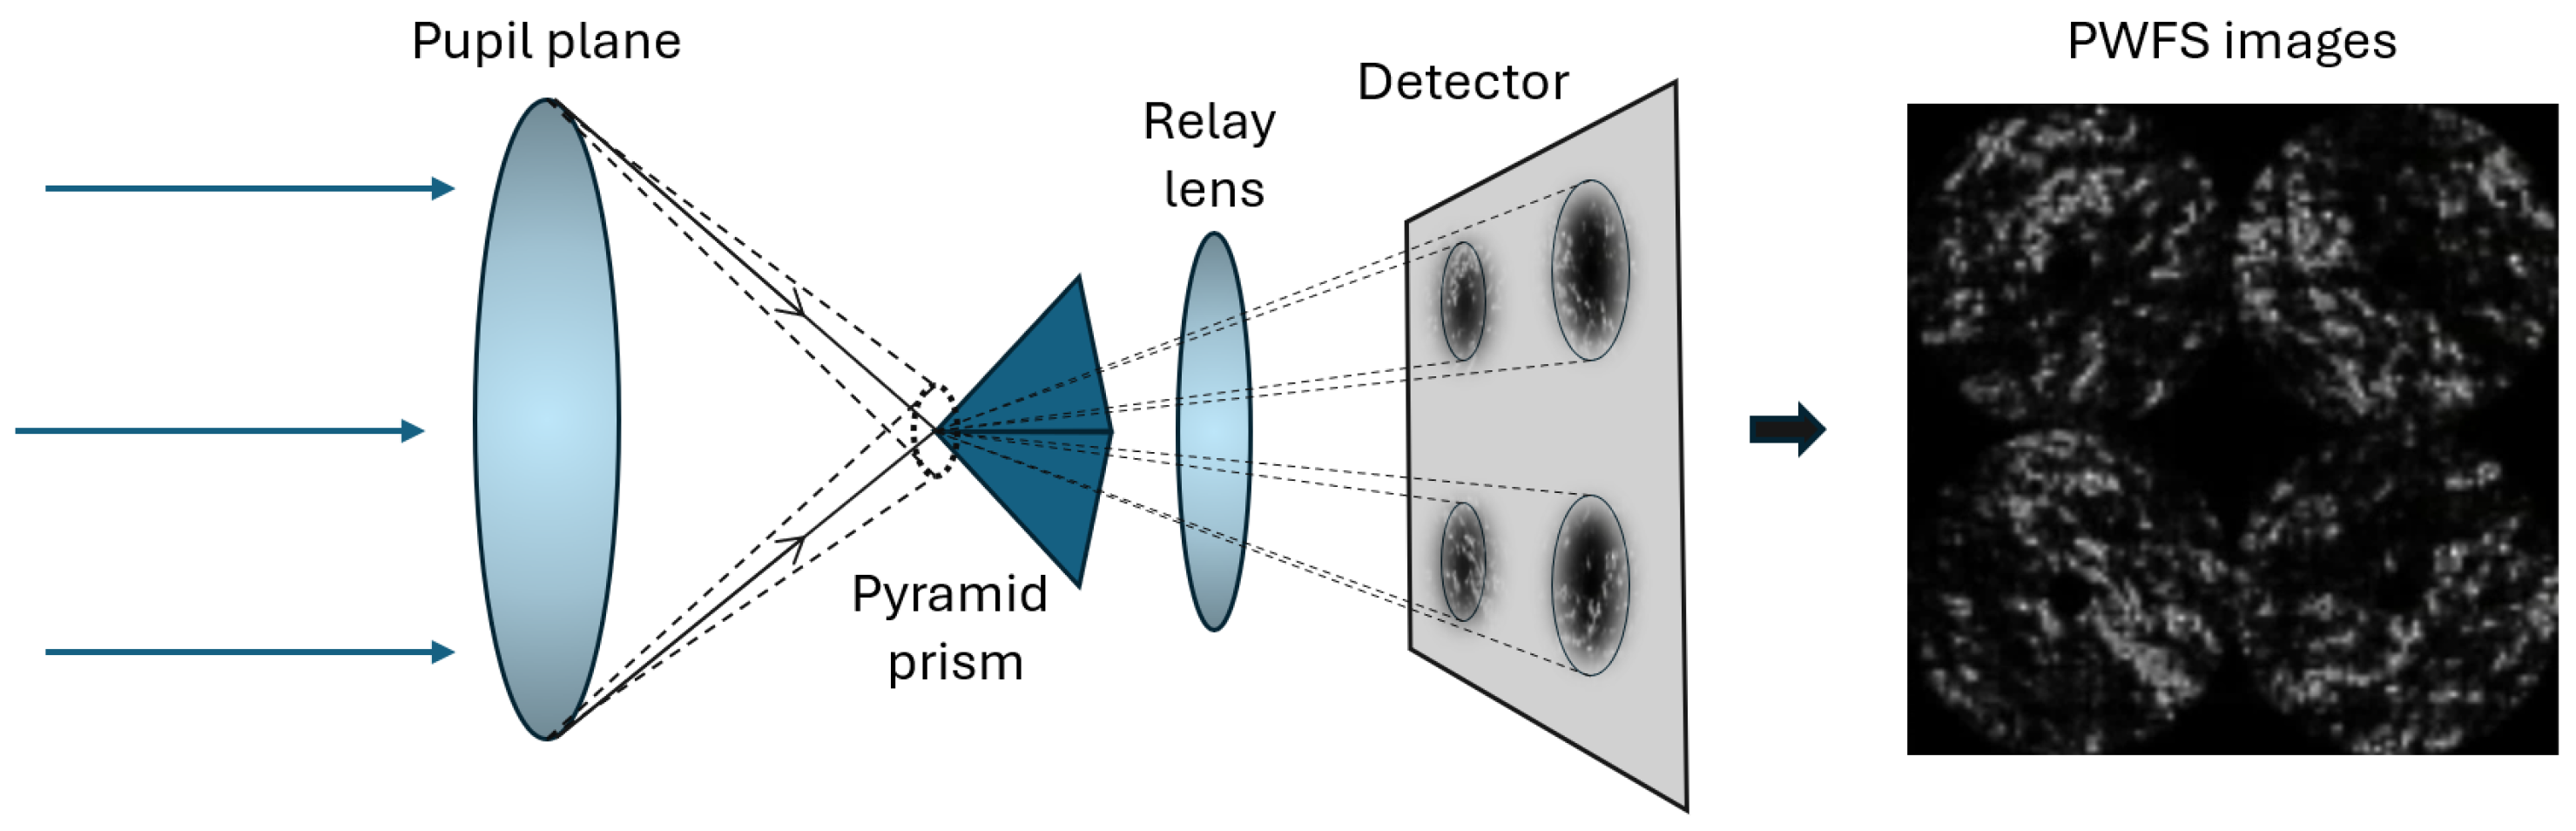
2.1. Adaptive Optics

As a consequence of wavefront aberrations that distort captured images, it is necessary to use an AO system to compensate for these atmospheric disturbances. Although the system configuration may involve one or more variations in the number of components, it is possible to identify some key elements common to most implementations. The operation of an AO system begins with the acquisition of the distorted wavefront by the wavefront sensor, which, in this case, will be a PWFS.
The pyramid sensor consists of a prism with four inclined faces positioned at the focal plane of the telescope (Figure 1), where the light rays from the source converge. When light passes through the prism, rays are deflected in different directions, generating a beam for each of the faces. The prism is followed by a relay lens that projects four images of the pupil onto a detector, corresponding to the light deflected by each of the prism’s faces. The detector captures the intensity of light in each of these four regions, denoted as a, b, c, and d. If the incoming wavefront is flat, the light will be divided symmetrically between the four faces. But if the wavefront is distorted, some faces will receive more light than others. In this way, the differences between the intensities can be seen, and the gradients of the wavefront can be determined.
In the work of [8], a normalized coordinate system ( ρ , ϕ ) is established by which it is possible to define the equations that describe the operation of the wavefront sensor. Here, ρ is the normalized radial distance from the centre of the pupil (with ρ = 1 at the edge) and ϕ is the azimuth angle. In this way, the relationships between the derivatives of the wavefront W and the coordinates in the plane are as follows:
ξ = F W ρ , η = F ρ W ϕ
where F represents the focal ratio of the telescope in the focus of the wavefront sensor.
The amount of light that arrives will depend on the transparency function T, which in turn will depend on the corresponding face of the prism. When considering the combination of some of the faces, the following equations can be obtained:
I a b ( ρ , ϕ ) = I o ( ρ , ϕ ) T F W ( ρ , ϕ ) ρ I c d ( ρ , ϕ ) = I o ( ρ , ϕ ) 1 T F W ( ρ , ϕ ) ρ
Assuming that the transparency function T is linear, the derivatives of the wavefront can be calculated from the intensities measured in the four pupil images:
W ( ρ , ϕ ) ρ = ( a + b ) ( c + d ) a + b + c + d × F δ V
1 ρ W ( ρ , ϕ ) ϕ = ( a + c ) ( b + d ) a + b + c + d × F δ V
where a, b, c, and d represent the light intensities for each of the pupil images, and δ V is the amplitude of the prism oscillation.
In the second subsystem, the estimated distortions are corrected using a deformable mirror (DM). This device adjusts its surface in real time according to the measurements provided by the wavefront sensor, compensating for the distortions introduced by atmospheric turbulence [19].
The stochastic nature of atmospheric turbulence is modelled using Kolmogorov turbulence theory [20]. The coherence of the wavefront over spatial scales is characterized by Fried’s parameter ( r 0 ), which represents the diameter of a hypothetical aperture in the atmosphere over which the wavefront distortion remains approximately constant. r 0 is defined as follows:
r 0 = 0.423 k 2 sec ( ζ ) C n 2 ( z ) d z 3 / 5
Here, ζ is the zenith angle, k is the wave number ( k = 2 π / λ ), and C n 2 ( z ) represents the refractive index structure parameter as a function of altitude z [21]. The refractive index structure can be described more explicitly with models like the Hufnagel–Valley model, incorporating parameters A and W to adapt to local atmospheric conditions.
C n 2 ( z ) = 5.94 × 10 23 z 10 W 27 2 exp ( z ) + 2.7 × 10 16 exp 2 z 3 + A exp ( 10 z )
The degree of turbulence directly affects the quality of the image. When r 0 is small, the turbulence is strong, causing significant distortions, while larger values of r 0 correspond to reduced distortion effects. This relationship underscores the importance of AO systems, as they enable ground-based telescopes to approach diffraction-limited performance, bridging the gap with space telescopes [22].

2.2. Wavefront Error

The Wavefront Error (WFE) can be defined as a measurement of the deviation of an aberrated wavefront from a reference one. For computing purposes, it is possible to consider a discrete phase, which is composed of a finite number of points and it can be represented as ϕ reference ( x , y ) for the reference phase and ϕ ( x , y ) as the actual phase. So, the residual wavefront is given by the following:
W F E ( x , y ) = ϕ ( x , y ) ϕ reference ( x , y )
Given a Zernike description of the wavefronts ϕ ( ρ , θ ) = n = 0 m = n n a n m Z n m ( ρ , θ ) , the WFE can also be quantified with Zernike coefficients ( a n m ) as described below:
W F E = n = 1 m = n n a n m a n , i d e a l m 2
where WFE is expressed in nanometers (nm), a n m are the Zernike coefficients that describe the phase shape, and a n , i d e a l m are the ones that describe the ideal phase. The summation starts at n = 1 as the piston mode (n = 0) is not considered due to the fact that it is corrected by an independent method.

2.3. Neural Networks

Neural networks can be defined as a set of neurons structured in layers, inspired by the cerebral cortex, capable of learning features and efficiently adapting to changes. Initially, they did not receive the recognition they deserved, as the first prototype, the perceptron, was developed in 1958 by Frank Rosenblatt [23]. However, in 2006, thanks to the work of Geoffrey Hinton et al. [24], the astounding learning capacity of these models was demonstrated. Subsequently, later studies [25,26,27] consolidated the key role of NNs and deep learning.
In their basic structure, NNs can be understood as a parameterized function f : R d R m . It is composed of an input layer, multiple hidden layers, and an output layer.
Once the information propagates forward through all layers, the NN produces an output y ^ . This result is compared against the target output y using a loss function L ( y ^ , y ) , which measures the discrepancy between the predicted and actual values. This difference is used to adjust the network parameters through an optimization algorithm, in this case, the gradient descent. By applying the backpropagation algorithm [25], the gradient of the loss function is calculated for each parameter, and errors are propagated backward through the network.
This iterative process continues until the network’s performance reaches a satisfactory level, allowing it to learn complex mappings and generalize effectively from data [26,27].
The work carried out in this paper is mainly focused in convolutional neural networks, which are capable of processing data with spatial structures, including images and multidimensional variables. Unlike fully connected networks, local patterns are extracted from images through the application of filters that involve shifting a set of learned kernels across the width and height of the image. The output at a specific location ( x , y ) is computed as a weighted sum of the local neighborhood values ( I ) with the kernel weights ( K ) , commonly expressed as follows:
O ( x , y ) = i j I ( x · S + i , y · S + j ) · K ( i , j )
Here, S is the stride or step with which the filter is moved. Through this operation, simple edges or textures are captured in the initial layers and more complex patterns in deeper layers.
Due to the non-linear nature of the atmospheric turbulence data, as well as the image-based input of the models, CNNs are more suitable than dense networks for this study. As previously demonstrated in [28,29], CNNs have achieved good results in the field of AO. However, this study addresses different conditions by employing a pyramid wavefront sensor and operating under an open-loop scenario.

3. Experiments

The simulation datasets were obtained using the Durham Adaptive Optics Simulation Platform (DASP) developed by Durham University [30], where the conditions described in [16] were considered, adopting the configuration corresponding to the SCExAO system at the Subaru Telescope. This instrument features a high number of actuators to perform highly precise corrections, and it is capable of operating at very high frequencies, dividing visible and infrared light [31].
DASP relies on Kolmogorov theory to simulate atmospheric turbulence. Phase screens are generated using zonal extrusion techniques to realistically represent variations in the atmospheric refractive index. This approach extends a computed phase screen over a finite domain to simulate an infinitely long screen without introducing discontinuities [32]. As a result, the output data reflect the non-stationary nature of atmospheric turbulence. Then, with the parameters shown in Table 1, similar conditions to those of this specific real telescope can be emulated, ensuring that the generated data accurately represent the behaviour of the atmosphere.
Since real telescope sensors typically provide data affected by imperfections and noise from various sources, a DASP simulator includes a series of modules designed to emulate the noise present in a real system [30]. Two of these components are particularly noteworthy. Firstly, there is the inherent noise from photon detection, modeled using Poisson statistics, which reflects the discrete nature of photons. This discreteness results in a variable number of light particles reaching the detector, introducing noise into the images. On the other hand, there is also a readout noise caused by the electronics of the detector itself. In CCD detectors, this noise can be introduced during the reading of pixel values, and then reduce the quality of the images.
Additionally, as CNNs excel at identifying important features in images, both locally and globally, even edges and textures, without being affected by small pixel variations, this allows them to focus on the most relevant details. Consequently, when trained with noisy data, they learn to distinguish useful information from disturbances such as Poisson noise or sensor-related electronic noise [33]. This makes them a strong choice for working with noisy simulated data, which is designed to reflect real-world conditions where noise is always present.
Two types of data were generated in the simulation. First, the pyramid sensor images containing the four representations of the wavefront, one for each face of the prism (see Figure 1), which were employed as input to the network. On the other hand, the target data consisted of the Zernike coefficients. To increase the complexity of the prediction, the number of considered Zernike polynomials was raised to 100. However, during the training and evaluation stages, the piston (the first coefficient) was removed, as it can be easily corrected by more direct means, thus allowing the predictive capabilities of the models to focus on the remaining, more relevant variables. Additionally, the frequency was set to 150 Hz to reduce the simulator’s computational time. However, each frame was reconstructed independently, and therefore, there was no temporal relationship, so frequency is not relevant.
During the model training process, 200,000 samples of sensor images were used along with their corresponding Zernike coefficients. This dataset size was chosen for two main reasons: to maintain consistency with the prior study, which serves as the baseline for this work, and because tests with larger datasets showed only minimal performance improvements, while significantly increasing computational costs and hindering the search for optimal parameters. Out of these, 70% were allocated for training, while the remaining 30% were reserved for validation. The parameters shown in Table 1 refer exclusively to the first experiment, as some parameters were adjusted in subsequent tests to expose the neural network (NN) to different conditions and evaluate its performance and adaptability. Additionally, for all evaluation phases of the models, 1000 independent samples were used.

3.1. Error Reduction Using Convolutional Neural Networks

A CNN-based model is proposed as an improvement to the fully connected neural network presented by [16]. This approach seeks to exploit the ability of these neural networks to analyze complex spatial structures in the data provided by the simulator. The objective of the experiment is to compare the performance of the new model with the original from the prior study under more demanding atmospheric conditions, working with 100 Zernike modes instead of the original 14, and increasing the complexity of the reconstruction. This explores the model’s capabilities to accurately represent wavefronts in more realistic scenarios. Since the previous study compares a model based on neural networks with the widely used matrix–vector multiplication (MVM) control for wavefront reconstruction as a reference, this work will consider both of them and will refer to these as “MVM” and “original model”.
The original model has been recreated as shown in Table 2. It consists of three hidden layers with 3000, 2000, and 1000 neurons, respectively, utilizing the ReLU activation function and batch normalization steps between layers. A Dense (fully connected) output layer with as many neurons as Zernike modes was added, corresponding to the number of coefficients to predict. An L1 regularization value of 10 9 and a learning rate of 10 5 were maintained with mse (mean square error) as the loss function.
Model convergence was achieved after 80 epochs by applying an early stopping approach, based on monitoring the loss on a validation set. Training was stopped when no significant improvement in validation loss was observed for five consecutive epochs compared to the training set. This approach made it possible to stop the training at an optimal point, preventing overfitting and improving the model’s generalisation capability.
The CNN model consists of five convolutional layers, progressively increasing the number of filters (32, 64, 128, 256, and 512), each with a 4 × 4 kernel. Despite the findings in studies such as [17,18], several tests have shown that better results are obtained with a 4 × 4 kernel. However, this is not a critical parameter, as it depends on the conditions set in the simulation, as well as the level of detail in the training images. On the other hand, the activation function ReLU, HeNormal initialization, and padding same have proven to be the parameters that yield the best results. Activation functions such as PReLU and Leaky ReLU and other initialization strategies have provided very similar results.
Increasing the number of filters allows the initial layers to capture simple details, while the deeper layers learn more abstract and complex representations. Regarding the number of layers, it was increased until no further improvement in efficiency was observed.
Each convolutional layer was followed by an AveragePooling2D layer, with sizes of 2 × 2 except for the last one, which used 3 × 3 , reducing the input dimensions from 120 × 120 to 5 × 5 . Subsequently, the features were reshaped into a 1D array using a Flatten layer and then processed by two Dense layers with 1024 neurons each and a ReLU activation function. Finally, a Dense layer with 99 neurons and linear activation was used to obtain Zernike modes as output. With a learning rate of 10 4 and L2 regularization value of 10 4 with mse as the cost function, the model reached convergence at 60 epochs, again by applying an early stopping approach, making it possible to stop the training at an optimal point, preventing overfitting. The distribution of the layers can be found in Table 3.
The second CNN model was considered with the same structure, although a different loss function based on the average wavefront error was defined, aiming to achieve a better fit in training. The equation is defined below:
AvgWFE = 1 M i = 1 M 1 N j = 1 N y pred , i , j y true , i , j 2 ,

3.2. Stability Experiments

A stability analysis was conducted for both the new models and those obtained from prior experiments. Through several evaluation tests, it was possible to assess how these models respond to fluctuations in the simulated turbulence data. This was possible by modifying the configuration parameters of the simulator, adapting them to each corresponding case. Three different scenarios were considered, as shown below:
  • Fried parameter r 0 : It represents the characteristic size of a circular aperture within which atmospheric turbulence causes phase fluctuations of less than one radian. It can also be interpreted as the intensity or strength of the turbulence, where a lower value corresponds to stronger turbulence (leading to a more complex profile) and a higher value corresponds to weaker turbulence. During the training phase, data was used over a range of 0.08 to 0.16 m @ 750 nm ; consequently, for this evaluation, the chosen values were 0.04, 0.08, 0.12, and 0.16.
  • Multi-layered turbulence: By overlaying multiple turbulence layers, each with specific parameters such as altitude, wind speed, the Fried parameter ( r 0 ), and a relative weight for each layer, an atmosphere with turbulent structures at different levels can be modeled. Each layer contributes differently to the resulting optical distortions. This approach allows for the analysis of more realistic scenarios and the evaluation of the performance of these models as atmospheric complexity increases. Although the training data only consider a single layer, previous studies such as [34,35] have demonstrated that good results can be achieved for multi-layer settings under these conditions. In this experiment, selected cases with one, two, four, and eight layers were compared.
  • Wind speed: In real-world environments, where atmospheric conditions can change rapidly, this parameter is critical, as wind speed directly affects the dynamics of optical aberrations by determining how turbulent structures move across the telescope aperture. The accuracy of reconstruction, especially under high wind conditions, where temporal aliasing and reconstruction errors can increase significantly, can be considerably degraded. This approach makes sure the system remains robust against variations in wind speed. During training, a fixed wind speed of 12.6 m/s was considered, while this test experiment involves turbulent profiles with wind speeds ranging from 5 to 17.5 m/s, in steps of 2.5 m/s.

3.3. Prediction Time Evaluation

The primary challenge in the process of integrating neural models into a real-world scenario is the time required to update the reconstruction values. The prediction time must be sufficiently low to ensure that the system operates at a frequency equal to or greater than Greenwood’s, which is generally considered to be 100 Hz. With that in mind, an analysis is proposed for each of the considered cases involving neural models to assess their viability. However, it should be noted that this experiment would only serve as an estimation to provide a general idea of the feasibility of the models. A more in-depth analysis of actual processing times would require a better understanding of the system in which they would be implemented, as well as a specific development for that system using more modern GPUs.
To conduct this preliminary study, optimisation methods provided by TensorFlow and GPU acceleration were employed to achieve optimal performance based on the available hardware, an RTX 2080Ti graphics card with 8GB of GDDR6 memory. Firstly, an integrated optimiser in TensorFlow (v2.11), known as XLA (Accelerated Linear Algebra), was employed. This optimiser accelerates the inference process by fusing operands, thereby reducing the memory utilised during computation. This method was initially adopted by Google in an attempt to mitigate bottleneck issues in their deep learning models [36].
On the other hand, a GPU warm-up phase was considered to ensure the reliability of prediction time measurements. When a model is executed on a GPU, the initial inference often involves overhead due to memory allocation and kernel loading, leading to an unrepresentative prediction time [37]. This warm-up process allows bypassing that initial preparation phase, providing a more accurate measurement of the inference time in a scenario where the model operates continuously over time.
Given that the available GPU is a first-generation model, featuring lower bandwidth, fewer and less advanced tensor cores, and reduced compatibility with current TensorFlow optimisers, the inference time could be expected to be lower when using more advanced graphics cards.

4. Results

The comparison of results from the various experiments will be based on the WFE value, expressed in radians, as previously defined in Equation (9). Additionally, in specific cases, the results may be represented as a percentage of reduced error relative to the total, indicating the degree of reduction achieved in the system’s residual error. These experiments are described below in the order in which they were presented in the previous section, Section 3.

4.1. Error Reduction Using Convolutional Neural Networks

The use of convolutional models instead of traditional approaches results in significant improvements in the quality of wavefront reconstruction. This is mainly due to the strong capacity of CNN models to extract information from 2D inputs and establish relationships between the local features. Figure 2 shows the reconstructed phase images for the different models. In particular, those labeled as “CNN” and “CNN & WFE”, shown on the right side, prove a higher fidelity to the original phase, located on the left. As mentioned in Section 3, the evaluation dataset consists of 1000 randomly generated samples, generated with parameters outlined in Table 1. Additionally, Figure 3 shows the residual error as the difference between the actual images and the reconstructed ones in each of the four cases considered.
In Figure 4, the y-axis represents the residual error in radians, while the x-axis shows the error reduction relative to the total. It can be clearly observed, as demonstrated in previous work, that the use of neural network models significantly improves the results compared to the MVM method. Additionally, the new models show a substantial improvement in reconstruction efficiency, achieving slightly better results in this case when the system’s optical error itself is used as the loss function.
To ensure the reliability of the results, the evaluation process was carried out with 20 independent sets for each of the four cases considered, along with the 95% confidence intervals presented in Table 4. As can be observed, the low variability of the intervals reinforces the statistical significance of the observed improvements.

4.2. Stability Experiments

Firstly, the efficiency of the reconstruction was analyzed by varying the magnitude of the Fried parameter r 0 , which represents the strength of the turbulence present in the atmosphere (Figure 5). The results are presented as a percentage of the residual error of the system. The traditional MVM method, and to a lesser degree, the original NN, show limited adaptability to changes in r 0 values, while the CNN-based models show a greater capacity to adapt to atmospheric conditions that are further away from the intermediate values (0.12 m). The “CNN (WFE loss)” model demonstrates better adaptation under conditions of higher r 0 . This not only proves its ability to capture the relevant information, but also that it is less affected by the noise present in the data. However, under very strong turbulence conditions, the performance of all four methods deteriorates significantly. Nevertheless, the new CNN models still maintain a better correction ratio compared to the others.
In the next scenario, the efficiency of different reconstruction methods was evaluated for multi-layered atmospheres, comparing them to a simpler atmosphere with a single turbulence layer. A more complex atmosphere was achieved by varying parameters within each layer, including wind speed, altitude, wind direction, r 0 value, and relative strength.
Figure 6 shows the evolution of the error as the reconstruction involves an increasing number of turbulence layers, from the initial case of one layer to scenarios with two, four, and eight layers. For the MVM method, a clear loss of efficiency is observed as atmospheric complexity increases, whereas neural network-based models remain much more stable, with the two new CNN-based models particularly standing out.
Finally, the stability of the models is evaluated under different wind speed values. In this case, higher wind speeds result in a more complex atmosphere, making the reconstruction process potentially more challenging. However, while the results again show the greater efficiency of the new models (Figure 7), there is little difference in the effect of varying this parameter. Therefore, both the previously studied cases and those proposed in this work exhibit similar stability in this scenario.

4.3. Prediction Time Evaluation

The three models involving the use of neural networks have been analysed, designated as “Original NN”, “CNN”, and “CNN (WFE loss)”. By employing the available TensorFlow optimisers, along with GPU acceleration where initialisations are preconfigured, the estimated prediction times for each model were obtained, as shown in Table 5.
Given that the Greenwood frequency considered is 100 Hz, the ideal inference times would fall below 10 ms. However, as the hardware used consisted of RTX 2080 Ti graphics cards, their performance is considerably lower than what could be achieved with more advanced GPUs. An approximate range of inference times with more advanced components is estimated in Table 6 for the best model “CNN (WFE Loss)”.
With a GPU such as the RTX 4090, lower inference times under 10 ms could be achieved. Although this does not guarantee the feasibility of implementing the models in a real-world scenario, it serves as an initial approximation.

4.4. Results Overview

The results obtained show a significant improvement through the use of neural models based on convolutional layers. This was achieved using as a reference the traditional method based on matrix–vector multiplication (MVM) and the model presented in the aforementioned previous work, the “Original model” based on neural networks with fully connected layers. Specifically, the “CNN (WFE Loss)” model, a version of the so-called “CNN” with a loss function dependent on the WFE value, achieved the greatest reduction in residual error, reaching 81.87%, compared to 54.60% obtained by the MVM method and 69.87% by the “Original model”.
Through several stability analyses, it was demonstrated that these models are also more robust to variations in turbulence parameters that define the atmosphere. This is particularly evident when varying the value of the parameter r 0 and increasing the number of turbulence layers. Specifically, for low r 0 values associated with extreme turbulence conditions, the CNN-based models still proved to be more efficient than the other approaches, maintaining a better correction ratio even in these challenging scenarios. However, in such unfavourable conditions, the model is not able to adapt as well as it would in normal turbulence ranges. In general, CNN-based models maintained greater stability and accuracy, whereas the traditional “MVM” method, and to a lesser extent the “original model”, showed a significant deterioration in performance.
Finally, several estimations were made to check the prediction times that these models might achieve in a real-world scenario. These results are not fully representative, and a more detailed understanding of the system is necessary.

5. Conclusions and Future Research Directions

This study demonstrates the advantages of opting for convolutional neural networks in an adaptive optics correction system with an open-loop configuration and a pyramid sensor. Due to the lack of feedback, more precise methods are required to handle the non-linear responses inherent to pyramid sensors, as their performance can be limited when choosing a method less adapted to this non-linearity, such as the MVM algorithm. Similarly, CNNs have been proven capable of better extracting spatial features and significantly improving wavefront reconstruction compared to the model presented in previous studies. Furthermore, the results clearly indicate that these models are more robust and adaptable to atmospheric conditions of greater complexity. Regarding their implementation in a real-world scenario, a more in-depth analysis of the system into which they might be integrated is be necessary. Nevertheless, based on the estimates obtained, good inference times can likely be achieved with more advanced GPUs.
In future studies, the objective is to achieve real-time prediction of Zernike coefficients using sensor images under conditions similar to those outlined in this work, employing an open-loop configuration and a pyramid sensor. In this context, LSTM networks are expected to play a key role, as their capacity to capture temporal dependencies could be particularly valuable under open-loop conditions, a scenario that remains largely unexplored with pyramid sensors and represents a topic of great scientific interest. Real-time prediction through neural network models has already been successfully implemented in previous studies, but not under the mentioned conditions, which would represent a significant advancement in this field. Additionally, multiple demonstrations of this and several future works are planned to be carried out by using an optical bench. This setup will allow for a more realistic simulation of atmospheric turbulence data. Finally, the exploration of more complex models is also proposed, considering the significant advancements that are currently taking place in neural network models.

Author Contributions

Conceptualization, S.P.-F.; data curation, S.P.-F. and F.G.-R.; formal analysis, S.P.-F. and J.R.-R.; funding acquisition, C.G.-G.; investigation, S.P.-F. and A.B.-R.; methodology, S.P.-F.; project administration, C.G.-G.; resources, S.P.-F., A.B.-R. and F.G.-R.; software, S.P.-F. and C.G.-G.; supervision, C.G.-G.; validation, S.P.-F. and S.I.-A.; visualization, S.P.-F.; writing—original draft, S.P.-F.; writing—review and editing, S.P.-F., C.G.-G., J.F.-D. and F.J.I.-R. All authors have read and agreed to the published version of the manuscript.

Funding

The authors wish to acknowledge the SPANISH STATE RESEARCH AGENCY (MINISTRY OF ECONOMY AND INDUSTRY) for the funding provided through the project under reference MCIU-22-PID2021-127331NB-I00.

Data Availability Statement

The data were obtained from simulations with the parameters described in Table 1.

Conflicts of Interest

The authors declare no conflicts of interest.

References

  1. Babcock, H.W. The possibility of compensating astronomical seeing. Publ. Astron. Soc. Pac. 1953, 65, 229. [Google Scholar] [CrossRef]
  2. Hardy, J.W.; Lefebvre, J.E.; Koliopoulos, C.L. Real-time atmospheric compensation. J. Opt. Soc. Am. 1977, 67, 360–369. [Google Scholar] [CrossRef]
  3. Kern, P.; Merkle, F.; Gaffard, J.P.; Rousset, G.; Fontanella, J.C.; Lena, P. Prototype Of An Adaptive Optical System For Astronomical Observation. In Proceedings of the Real-Time Image Processing: Concepts and Technologies, Cannes, France, 4–6 November 1988; Besson, J., Ed.; International Society for Optics and Photonics. SPIE: San Francisco, CA, USA, 1988; Volume 0860, pp. 9–15. [Google Scholar] [CrossRef]
  4. Beckers, J.M. Increasing the Size of the Isoplanatic Patch with Multiconjugate Adaptive Optics. In Proceedings of the Very Large Telescopes and their Instrumentation, Garching, Germany, 21–24 March 1988; European Southern Observatory Conference and Workshop Proceedings. Ulrich, M.H., Ed.; Volume 30, p. 693. [Google Scholar]
  5. Lamb, M.; Venn, K.; Andersen, D.; Oya, S.; Shetrone, M.; Fattahi, A.; Howes, L.; Asplund, M.; Lardière, O.; Akiyama, M.; et al. Using the multi-object adaptive optics demonstrator RAVEN to observe metal-poor stars in and towards the Galactic Centre. Mon. Not. R. Astron. Soc. 2016, 465, 3536–3557. [Google Scholar] [CrossRef]
  6. Hippler, S.; Feldt, M.; Bertram, T.; Brandner, W.; Cantalloube, F.; Carlomagno, B.; Absil, O.; Obereder, A.; Shatokhina, I.; Stuik, R. Single conjugate adaptive optics for the ELT instrument METIS. Exp. Astron. 2018, 47, 65–105. [Google Scholar] [CrossRef]
  7. Platt, B.C.; Shack, R. History and principles of Shack-Hartmann wavefront sensing. J. Refract. Surg. 2001, 17, S573–S577. [Google Scholar]
  8. Ragazzoni, R. Pupil plane wavefront sensing with an oscillating prism. J. Mod. Opt. 1996, 43, 289–293. [Google Scholar] [CrossRef]
  9. Arcidiacono, C.; Chen, X.; Yan, Z.; Zheng, L.; Agapito, G.; Wang, C.; Zhu, N.; Zhu, L.; Cai, J.; Tang, Z. Sparse aperture differential piston measurements using the pyramid wave-front sensor. In Proceedings of the Adaptive Optics Systems V, Edinburgh, UK, 26 June–1 July 2016; Marchetti, E., Close, L.M., Véran, J.P., Eds.; SPIE: San Francisco, CA, USA, 2016; Volume 9909, p. 99096K. [Google Scholar] [CrossRef]
  10. Agapito, G.; Pinna, E.; Esposito, S.; Heritier, C.T.; Oberti, S. Non-modulated pyramid wavefront sensor: Use in sensing and correcting atmospheric turbulence. Astron. Astrophys. 2023, 677, A168. [Google Scholar] [CrossRef]
  11. Archinuk, F.; Hafeez, R.; Fabbro, S.; Teimoorinia, H.; Véran, J.P. Mitigating the Non-Linearities in a Pyramid Wavefront Sensor. arXiv 2023, arXiv:2305.09805. [Google Scholar] [CrossRef]
  12. Hafeez, R.; Archinuk, F.; Fabbro, S.; Teimoorinia, H.; Véran, J.P. Forecasting Wavefront Corrections in an Adaptive Optics System. arXiv 2022, arXiv:2112.01437. [Google Scholar] [CrossRef]
  13. Landman, R.; Haffert, S.Y.; Radhakrishnan, V.M.; Keller, C.U. Self-optimizing adaptive optics control with Reinforcement Learning for high-contrast imaging. arXiv 2021, arXiv:2108.11332. [Google Scholar] [CrossRef]
  14. Nousiainen, J.; Rajani, C.; Kasper, M.; Helin, T.; Haffert, S.Y.; Vérinaud, C.; Males, J.R.; Van Gorkom, K.; Close, L.M.; Long, J.D.; et al. Toward on-sky adaptive optics control using reinforcement learning: Model-based policy optimization for adaptive optics. Astron. Astrophys. 2022, 664, A71. [Google Scholar] [CrossRef]
  15. Suárez Gómez, S.L.; García Riesgo, F.; González Gutiérrez, C.; Rodríguez Ramos, L.F.; Santos, J.D. Defocused Image Deep Learning Designed for Wavefront Reconstruction in Tomographic Pupil Image Sensors. Mathematics 2021, 9, 15. [Google Scholar] [CrossRef]
  16. Wong, A.P.; Norris, B.R.M.; Deo, V.; Tuthill, P.G.; Scalzo, R.; Sweeney, D.; Ahn, K.; Lozi, J.; Vievard, S.; Guyon, O. Nonlinear Wave Front Reconstruction from a Pyramid Sensor using Neural Networks. Publ. Astron. Soc. Pac. 2023, 135, 114501. [Google Scholar] [CrossRef]
  17. Ma, H.; Liu, H.; Qiao, Y.; Li, X.; Zhang, W. Numerical study of adaptive optics compensation based on Convolutional Neural Networks. Opt. Commun. 2019, 433, 283–289. [Google Scholar] [CrossRef]
  18. Swanson, R.; Lamb, M.; Correia, C.M.; Sivanandam, S.; Kutulakos, K. Closed loop predictive control of adaptive optics systems with convolutional neural networks. Mon. Not. R. Astron. Soc. 2021, 503, 2944–2954. [Google Scholar] [CrossRef]
  19. Freeman, R.H.; Pearson, J.E. Deformable mirrors for all seasons and reasons. Appl. Opt. 1982, 21, 580–588. [Google Scholar] [CrossRef]
  20. Zilberman, A.; Golbraikh, E.; Kopeika, N.; Virtser, A.; Kupershmidt, I.; Shtemler, Y. Lidar study of aerosol turbulence characteristics in the troposphere: Kolmogorov and non-Kolmogorov turbulence. Atmos. Res. 2008, 88, 66–77. [Google Scholar] [CrossRef]
  21. Hufnagel, R. Propagation through atmospheric turbulence. In The Infrared Handbook; USGPO: Washington, DC, USA, 1974; Chapter 6. [Google Scholar]
  22. Dutton, J.A. Dynamics of Atmospheric Motion: (Formerly the Ceaseless Wind); Dover: New York, NY, USA, 1995. [Google Scholar]
  23. Rosenblatt, F. The perceptron: A probabilistic model for information storage and organization in the brain. Psychol. Rev. 1958, 65, 386–408. [Google Scholar] [CrossRef]
  24. Hinton, G.; Osindero, S.; Teh, Y.W. A Fast Learning Algorithm for Deep Belief Nets. Neural Comput. 2006, 18, 1527–1554. [Google Scholar] [CrossRef]
  25. Rumelhart, D.E.; Hinton, G.E.; Williams, R.J. Learning representations by back-propagating errors. Nature 1986, 323, 533–536. [Google Scholar] [CrossRef]
  26. Goodfellow, I.; Bengio, Y.; Courville, A. Deep Learning; MIT Press: Cambridge, MA, USA, 2016; Available online: http://www.deeplearningbook.org (accessed on 15 September 2024).
  27. LeCun, Y.; Bengio, Y.; Hinton, G. Deep learning. Nature 2015, 521, 436–444. [Google Scholar] [CrossRef] [PubMed]
  28. Swanson, R.; Lamb, M.; Correia, C.; Sivanandam, S.; Kutulakos, K. Wavefront reconstruction and prediction with convolutional neural networks. In Proceedings of the Adaptive Optics Systems VI, Austin, TX, USA, 10–15 June 2018; Close, L.M., Schreiber, L., Schmidt, D., Eds.; International Society for Optics and Photonics. SPIE: San Francisco, CA, USA, 2018; Volume 10703, p. 107031F. [Google Scholar] [CrossRef]
  29. Landman, R.; Haffert, S.Y. Nonlinear wavefront reconstruction with convolutional neural networks for Fourier-based wavefront sensors. Opt. Express 2020, 28, 16644–16657. [Google Scholar] [CrossRef] [PubMed]
  30. Basden, A.; Bharmal, N.; Jenkins, D.; Morris, T.; Osborn, J.; Jia, P.; Staykov, L. The Durham Adaptive Optics Simulation Platform (DASP): Current status. arXiv 2018, arXiv:1802.08503. [Google Scholar] [CrossRef]
  31. Lozi, J.; Guyon, O.; Jovanovic, N.; Goebel, S.; Pathak, P.; Skaf, N.; Sahoo, A.; Norris, B.; Martinache, F.; M’Diaye, M.; et al. SCExAO, an instrument with a dual purpose: Perform cutting-edge science and develop new technologies. In Proceedings of the Adaptive Optics Systems VI, Austin, TX, USA, 10–15 June 2018; Schmidt, D., Schreiber, L., Close, L.M., Eds.; SPIE: San Francisco, CA, USA, 2018; p. 270. [Google Scholar] [CrossRef]
  32. Assémat, F.; Wilson, R.W.; Gendron, E. Method for simulating infinitely long and non stationary phase screens with optimized memory storage. Opt. Express 2006, 14, 988–999. [Google Scholar] [CrossRef] [PubMed]
  33. Momeny, M.; Latif, A.M.; Agha Sarram, M.; Sheikhpour, R.; Zhang, Y.D. A noise robust convolutional neural network for image classification. Results Eng. 2021, 10, 100225. [Google Scholar] [CrossRef]
  34. Pérez, S.; Buendía, A.; González, C.; Rodríguez, J.; Iglesias, S.; Fernández, J.; De Cos, F.J. Enhancing Open-Loop Wavefront Prediction in Adaptive Optics through 2D-LSTM Neural Network Implementation. Photonics 2024, 11, 240. [Google Scholar] [CrossRef]
  35. Liu, X.; Morris, T.; Saunter, C.; de Cos Juez, F.J.; González-Gutiérrez, C.; Bardou, L. Wavefront prediction using artificial neural networks for open-loop adaptive optics. Mon. Not. R. Astron. Soc. 2020, 496, 456–464. [Google Scholar] [CrossRef]
  36. Sabne, A. XLA: Compiling Machine Learning for Peak Performance. 2020. Available online: https://research.google/pubs/xla-compiling-machine-learning-for-peak-performance/ (accessed on 15 September 2024).
  37. Ash, J.T.; Adams, R.P. On Warm-Starting Neural Network Training. arXiv 2020, arXiv:1910.08475. [Google Scholar] [CrossRef]
Figure 1. Operational scheme of the pyramidal sensor. The system’s components are illustrated, along with sample images acquired by the sensor, displayed on the right.
Mathematics 13 01028 g001
Figure 2. A comparison between the original wavefront phase image on the left and the reconstructed phases of the respective models considered on the right.
Mathematics 13 01028 g002
Figure 3. Residual error between the original wavefront phase image and the reconstructed phases. Colour intensity represents the magnitude of the error.
Mathematics 13 01028 g003
Figure 4. Comparison of residual wavefront error in radians (gray bars) and the corresponding error reduction percentages (blue line) for different reconstruction methods: Matrix Vector Multiplication (MVM), Dense Neural Network (Original Model), Convolutional Neural Network (CNN), and the CNN with WFE loss function (CNN and WFE Loss). The dashed green line indicates the WFE without correction.
Mathematics 13 01028 g004
Figure 5. Residual error percentage as a function of the Fried parameter r 0 (in m) for different reconstruction methods. CNN models outperform MVM and the original model, with the best results achieved by the one with WFE as the loss function.
Mathematics 13 01028 g005
Figure 6. This Figure shows the different residual errors obtained in % when varying the number of turbulence layers for different reconstruction methods. The best results were achieved by CNN models.
Mathematics 13 01028 g006
Figure 7. Graphic representation of the results for the different cases considered when varying the wind speed value.
Mathematics 13 01028 g007
Table 1. Main set of parameters for simulation of PWFS images and Zernike coefficients.
ModuleParameterValue
SystemFrequency150 Hz
Gain1
AtmosphereNo. phase screens1
Wind speeds12.6 m/s
Wind direction0–360°
Screen heightSteps of 200 m up to 15,000 m
r 0 @ 750 nmSteps of 0.002 m, from 0.08 up to 0.16 m
L 0 20 m
TelescopeDiameter8.2 m
Central obscuration1.2 m
PWFSResolution 120 × 120 pixels
Readout noise1 e RMS
Photon noiseTrue
Wavelength750 nm
Table 2. Layers that compose the original model, along with the corresponding input and output dimensions, as well as the trainable parameters.
LayerInput ShapeOutput ShapeParameters
Dense (Input)(14,400)(3000)43,203,000
BatchNormalization(3000)(3000)12,000
Dense(3000)(2000)6,002,000
BatchNormalization(2000)(2000)8000
Dense(2000)(1000)2,001,000
BatchNormalization(1000)(1000)4000
Dense (Output)(1000)(99)99,099
Table 3. Layers that compose the CNN model, along with the corresponding input and output dimensions, as well as the trainable parameters.
LayerInput ShapeOutput ShapeParameters
Conv2D (Input)(120, 120, 1)(120, 120, 32)544
AveragePooling2D(120, 120, 32)(60, 60, 32)0
Conv2D(60, 60, 32)(60, 60, 64)32,832
AveragePooling2D(60, 60, 64)(30, 30, 64)0
Conv2D(30, 30, 64)(30, 30, 128)131,200
AveragePooling2D(60, 60, 128)(15, 15, 128)0
Conv2D(15, 15, 128)(15, 15, 256)524,544
AveragePooling2D(15, 15, 256)(5, 5, 256)0
Conv2D(5, 5, 256)(5, 5, 512)2,097,664
Flatten(5, 5, 12)(12,800)0
Dense(12,800)(1024)13,108,224
Dense(1024)(1024)1,049,600
Dense (Output)(1024)(99)99,099
Table 4. The 95% confidence intervals for the four considered cases, demonstrating low variability and reinforcing the statistical significance of the results.
MethodStd. Dev.95% CI Lower95% CI Upper
MVM0.00250.5220.526
Original NN0.00140.3460.350
CNN0.00050.2190.221
CNN (WFE Loss)0.00070.2080.210
Table 5. Estimated prediction times for evaluated neural network models. Final performance may vary depending on specific implementation context.
ModelPrediction Time
Original NN18.77 ms
CNN14.10 ms
CNN (WFE Loss)12.74 ms
Table 6. Estimated inference times obtained using different graphics cards. The most relevant specifications used for these estimations are also presented.
LayerInput ShapeOutput ShapeParameters
Graphic CardTFLOPSTensor Core GenerationTokens/sPrediction Time
RTX 2080 Ti26.902nd9612.74 ms
RTX 3080 Ti34.103rd1928–11 ms
RTX 409082.584th2263–6 ms
Disclaimer/Publisher’s Note: The statements, opinions and data contained in all publications are solely those of the individual author(s) and contributor(s) and not of MDPI and/or the editor(s). MDPI and/or the editor(s) disclaim responsibility for any injury to people or property resulting from any ideas, methods, instructions or products referred to in the content.

