Article

Simulating the Deterioration Behavior of Tunnel Elements Using Amalgamation of Regression Trees and State-of-the-Art Metaheuristics

by
Eslam Mohammed Abdelkader
1,*,
Abobakr Al-Sakkaf
2,
Moaaz Elkabalawy
2,
Abdelhady Omar
2 and
Ghasan Alfalah
3
1
Structural Engineering Department, Faculty of Engineering, Cairo University, Giza 12613, Egypt
2
Department of Building, Civil and Environmental Engineering, Concordia University, Montreal, QC H3G 1M8, Canada
3
Department of Architecture and Building Science, College of Architecture and Planning, King Saud University, Riyadh 11362, Saudi Arabia
*
Author to whom correspondence should be addressed.
Mathematics 2025, 13(7), 1021; https://doi.org/10.3390/math13071021
Submission received: 13 February 2025 / Revised: 11 March 2025 / Accepted: 18 March 2025 / Published: 21 March 2025

Abstract

:
Tunnel infrastructures worldwide face escalating deterioration challenges due to aging materials, increasing load demands, and exposure to harsh environmental conditions. Accurately predicting the onset and progression of deterioration is paramount for ensuring structural safety, optimizing maintenance interventions, and prolonging service life. However, the complex interplay of environmental, material, and operational factors poses significant challenges to current predictive deterioration models. Additionally, they are constrained by small datasets and a narrow range of tunnel elements that limit their generalizability. This paper presents a novel hybrid metaheuristic-based regression tree (REGT) model designed to enhance the accuracy and robustness of tunnel deterioration predictions. Leveraging metaheuristic algorithms’ strengths, the developed method jointly optimizes critical regression tree hyperparameters and identifies the most relevant features for deterioration prediction. A comprehensive dataset encompassing material properties, environmental stressors, traffic loads, and historical condition assessments was compiled for model development. Comparative analyses against conventional regression trees, artificial neural networks, and support vector machines demonstrated that the hybrid model consistently outperformed baseline techniques regarding predictive accuracy and generalizability. While metaheuristic-based regression trees outperformed classic machine learning models, no single metaheuristic variant dominated all tunnel elements. Furthermore, the metaheuristic optimization framework mitigated overfitting and provided interpretable insights into the primary factors driving tunnel deterioration. Finally, the findings of this research highlight the potential of hybrid metaheuristic models as powerful tools for infrastructure management, offering actionable predictions that enable proactive maintenance strategies and resource optimization. This study contributes to advancing the field of predictive modeling in civil engineering, with significant implications for the sustainable management of tunnel infrastructure.

1. Introduction

Tunnels are indispensable components of transportation networks, facilitating the movement of people, goods, and services across regions. As these structures age, they become increasingly susceptible to various deterioration mechanisms due to environmental exposure and intensified load demands ranging from corrosion and fatigue to concrete spalling [1,2]. The American Society of Civil Engineers has repeatedly highlighted the critical condition of tunnel infrastructure, warning that deferred maintenance can lead to substantial economic and safety risks [3]. The American Society of Civil Engineers recently rated U.S. transit infrastructure at “D-”, indicating severe deterioration and chronic underinvestment [3]. As of 2023, the rehabilitation backlog for transit systems has dramatically increased to approximately USD 176 billion, and projections suggest this figure may exceed USD 270 billion by 2029 without substantial intervention [3]. The Federal Transit Administration further highlighted that approximately 10% of transit assets, equivalent to roughly USD 140 billion in infrastructure value, are not in a state of good repair, emphasizing the urgent need for proactive maintenance and rehabilitation strategies [4].
The functional use of tunnels contributes to their wear and tear. Tunnels subjected to heavy traffic volumes, especially those accommodating freight transport, experience repetitive loading, which can induce stress and material fatigue [5,6]. Moreover, exposure to vehicular emissions introduces chemical agents that can react with tunnel materials, leading to corrosion and other forms of degradation [7,8]. A study highlighted that tunnels with higher traffic densities exhibited accelerated rates of deterioration, emphasizing the need for regular maintenance in such infrastructures [9]. In addition, tunnels are subjected to a variety of environmental, material, and operational factors that collectively influence their structural integrity. Water infiltration is a primary concern, as moisture can penetrate tunnel linings, leading to the corrosion of steel reinforcements and degradation of concrete [10,11]. Freeze–thaw cycles, prevalent in many North American regions, can cause concrete cracking and spalling, further compromising tunnel safety. Seismic activity, especially along tectonic plate boundaries, poses risks of structural deformation or collapse. For instance, the 1994 Northridge earthquake in California caused significant damage to several tunnels, underscoring the vulnerability of subterranean structures to seismic events [12]. In addition, the choice and quality of construction materials significantly impact a tunnel’s durability. Utilizing substandard materials or improper mix designs can accelerate deterioration. For example, inadequate concrete mixes may exhibit increased permeability, allowing harmful agents to penetrate and degrade the structure. Over time, even high-quality materials can experience fatigue, leading to micro-cracks and reduced load-bearing capacity [13,14].
In light of widespread aging tunnel systems, proactive asset management strategies are imperative for extending service life and safeguarding public welfare. Deterioration modeling plays a pivotal role in infrastructure asset management by capturing how an asset’s condition evolves and forecasting future performance [15]. Moreover, they stand as an important input and pillar of maintenance budget allocation models. With that in mind, accurately predicting tunnel deterioration is highly necessitated to guarantee timely, sustainable, and cost-effective predictive maintenance plans of tunnels [16]. Hence, capturing the temporal deterioration of tunnel elements is crucial to ensure their integrity, safety, and longevity [16]. In recent years, the world has witnessed a surge in data-driven methodologies to address the limitations of conventional approaches to structural deterioration analysis. Machine learning (ML) techniques have shown strong potential in handling high-dimensional data and unraveling intricate relationships [17]. Despite promising outcomes, many ML-based methods, such as artificial neural networks [18] and support vector machines [19,20], are susceptible to overfitting and limited generalizability, especially when faced with heterogeneous infrastructure datasets [21,22]. Furthermore, modeling tunnel deterioration requires a robust strategy to accommodate the inherent variability in environmental conditions, material properties, and traffic loads [23].
To overcome these challenges, hybrid models that merge ML algorithms with metaheuristic optimization techniques have gained traction in various civil engineering applications. Metaheuristics, including particle swarm optimization (PSO), genetic algorithm (GA), and artificial bee colony (ABC), have proven effective in refining hyperparameters and bolstering predictive accuracy [24,25,26,27]. Despite these benefits, metaheuristic approaches for tunnel deterioration prediction remain insufficiently explored. In response to these gaps, this research pursues two main objectives through the developed hybrid metaheuristic-based regression tree model. First, it seeks to leverage a large dataset encompassing multiple tunnel elements and operational contexts to capture interrelated deterioration factors comprehensively. Second, it aims to integrate metaheuristic optimization for hyperparameter tuning and feature selection, thereby promoting more interpretable, robust, and readily applicable models in real-world scenarios. The combination of metaheuristics and regression trees offers a promising yet underexplored avenue. This approach could enhance prediction accuracy by effectively handling complex, nonlinear interactions among deterioration factors. Addressing this gap could lead to more robust maintenance strategies and prolong the operational lifespan of tunnels. Following this introduction, Section 2 explores the literature on hybrid modeling strategies; Section 3 details the methodology, data collection, and model formulation; Section 4; enumerates and explains the used methods and performance indictors in this study; Section 5 presents model implementation and discusses the results and compares the proposed model with existing benchmarks; and Section 6 concludes the paper with a summary of key findings, practical implications, and directions for future research.

2. Literature Review

In the context of tunnel infrastructure, deterioration is influenced by myriad factors, including material properties, construction quality, environmental conditions, and maintenance practices. However, there remains a gap in integrating hybrid metaheuristic methods with regression tree models specifically for tunnel elements. This gap underscores the need for innovative approaches that can provide accurate and actionable insights for proactive maintenance and management strategies. Regression tree models, such as random forest (RF), have been widely used in predicting various aspects of infrastructure deterioration due to their ability to handle complex interactions between variables and manage large datasets. For instance, Zhang et al. [28] employed RF models to predict tunneling-induced settlement, demonstrating superior performance over other machine learning algorithms in capturing the evolution of settlement patterns. Furthermore, regression tree models are widely recognized for their capability to handle nonlinear data and interactions between variables [29]. However, standalone regression trees often suffer from overfitting and limited generalizability when applied to complex datasets. Hybrid metaheuristic techniques, such as shuffled frog leaping [30], moth flame optimization [31], and particle swarm optimization [32], offer robust solutions by optimizing model parameters and improving prediction accuracy. When combined with regression tree models, these techniques can effectively leverage their respective strengths to enhance predictive performance in deterioration modeling [33].
Metaheuristic algorithms are optimization techniques designed to find near-optimal solutions for complex problems. When integrated with regression tree models, they can optimize model parameters, thereby improving predictive performance. Commonly used metaheuristic algorithms include particle swarm optimization (PSO), genetic algorithms (GA), and grey wolf optimization (GWO).
The application of hybrid metaheuristic algorithms combined with regression tree models has gained significant attention in predicting the deterioration behavior of tunnel elements. This approach leverages the strengths of both metaheuristic optimization techniques and regression trees to enhance predictive accuracy and model robustness. Recent studies have explored various hybrid models to forecast tunnel-related parameters. For instance, Zhang et al. [28] developed a hybrid model integrating particle swarm optimization with machine learning algorithms to predict tunneling-induced settlement. Their findings indicated that the integration of PSO effectively optimized hyperparameters, thereby improving the model’s predictive performance. In another study, Mahmoodzadeh et al. [34] proposed six hybrid models combining Gaussian process regression (GPR) with different metaheuristic algorithms, including PSO and grey wolf optimization (GWO), to predict the duration and cost of road tunnel construction. The GPR-PSO model demonstrated superior accuracy in forecasting construction parameters, highlighting the efficacy of hybrid approaches in complex tunneling projects.
Focusing specifically on tunnel deterioration, a study by Hasan and Elwakil [35] introduced a stochastic cluster regression-based model to predict the condition rating of highway tunnels. This model utilized operational data and demonstrated improved prediction accuracy, underscoring the potential of combining regression techniques with clustering methods in infrastructure assessment. In another attempt, Zhao et al. [36] compared the performances of K-nearest neighbor, support vector machines, multi-layer perceptron, random forest, decision tree, and light gradient boosting machine in predicting service states of tunnels. Light gradient boosting machine was able to provide the highest performance with prediction accuracies of 77.3%, 96.4%, and 90.9% in non-structural, civil and structural sections, respectively. Furthermore, Gao et al. [37] presented a genetic programming-based model to estimate service life of tunnels exposed to chloride-induced corrosion. The average annual relative humidity, stray current intensity, lining thickness of tunnel, and design speed of a tunnel are amongst the factors used in their study. The presented model was able to surpass artificial neural network. In addition, it was shown that the optimal values of population size and sample size are 300 and 20, respectively.
In addition to predictive deterioration modeling, significant research has been devoted to inspecting tunnel surface defects through computer vision approaches. Wang et al. [38] proposed a U-net architecture for the detection of defects in subway tunnels. In this regard, all convolutional blocks are substituted with inception blocks, and the first convolutional layer is replaced with atrous spatial pyramid pooling. The proposed U-net model was able to provide recall, precision, F-measure, and intersection over union values of 0.66, 0.436, 0.525, and 0.356, respectively. Wu and Zhang [39] adopted an improved VGG19 network for the segmentation of cracks in subway tunnels. In their model, improved bilateral filtering was employed for Retinex decomposition, and Zhang–Suen fast parallel thinning was implemented to create a crack skeleton diagram. Their model accomplished an accuracy and loss rate of 95.93% and 8.7%, respectively. In another attempt, Huang et al. [40] created a mask region-based convolutional neural network (R-CNN) for the instance segmentation of cracks in tunnel linings. The developed R-CNN was composed of a backbone network, region proposal network, and head architecture. In addition, a morphological closing operation was executed to connect disjoined cracks. The model was trained using a multi-loss function that compiled mask loss, classification loss, and bounding-box regression. The introduced model attained an F1score, balanced accuracy, and intersection over union of 68.68%, 81.94% and 52.72%, respectively, for the testing images.
Xu et al. [41] boosted crack detection performance by combining dynamic snake convolution and large separable kernel attention with you only look once (YOLO) V8. In addition, the scale invariant feature transform (SIFT) algorithm was implemented for image stitching and creating panoramic tunnel lining representation. In their work, images were captured using mobile acquisition system equipped with are-scan and line-scan cameras. Liu et al. [42] introduced a transformer-based method that leverages a Swin Transformer architecture to capture both local and global features of cracks, resulting in improved segmentation performance even in complex tunnel environments. Additionally, Wang et al. [43] developed a watershed feature fusion network that integrates conventional convolutional neural network (CNN) for segmentation with watershed image processing techniques to effectively differentiate crack pixels from background noise, demonstrating significantly enhanced segmentation accuracy on challenging tunnel images. Feng et al. [44] introduced a two-stage model for defect recognition in a metro tunnel lining. In the first step, an image classification network was proposed by compiling a convolutional neural network with visual transformers-based blocks. The second step involved multiple detection heads and attention modules upon YOLO for differentiating between cracking, spalling, and water leakage.
Other studies exploited ground-penetrating radar (GPR) to analyze subsurface defects in tunnels. Xie et al. [45] employed a bi-frequency back projection radar method to assess grouting quality behind tunnel segments, providing the precise detection of voids and anomalies. In addition, GPRmax 3.0 was utilized to study the correlation between domain frequencies of the radar signal, generating profiles of tunnel segment, grouting and soil. Harseno et al. [46] explored GPR capabilities in identifying air-cavities behind concrete linings, using multi-frequency analysis for improved accuracy. Moreover, a cross-correlation analysis was leveraged to discriminate between defected regions from solid regions, and two-way travel time was used to cluster the severities of air cavities according to their thickness. Thirdly, Wu et al. [47] advanced GPR applications by employing simulation-supported radar data to detect tunnel lining void defects with high reliability. They used the GPRmax software program based on the finite-difference time-domain method to simulate and study the responses of voids behind tunnel linings under different working conditions.
In reviewing the existing work on tunnel infrastructure, it becomes evident that most research has focused primarily on identifying and categorizing defects such as cracks, spalling, and voids. However, there remains a notable shortage of predictive deterioration models capable of simulating and forecasting the long-term performance and condition of individual highway tunnel elements. Additionally, existing deterioration models often overlook critical tunnel components that influence the structural integrity of the tunnel system, such as interior walls, portals, gaskets, cross passageway, and slabs on grade. This oversight could lead to inaccurate estimations and impractical budget allocations for tunnel maintenance and rehabilitation. Furthermore, some approaches forecast a single and unified condition rating for the whole tunnel, which can be misleading since each component ages differently, and failure often arises when only one crucial element enters a critical state. Therefore, a detailed assessment of deterioration at the element level is necessary for accurate predictions. Moreover, current models have overlooked critical explanatory variables such as tunnel length, structural shape, lane count, and functional classification, which are necessary to understand their influence on the deterioration behavior of highway tunnels. Finally, regression-based deterioration models have significant limitations in accurately representing the intricate relationships between various factors that influence deterioration and the long-term condition ratings of tunnels. This challenge is particularly pronounced due to the complex and multifaceted nature of the structural mechanisms that drive tunnel deterioration [48]. In addition, it should be noted that some defect evaluation models rely on manual optimization to fine-tune the hyperparameters of the machine learning and deep learning models. Nonetheless, manual tuning is often tedious, computationally expensive, inaccurate and may lead to suboptimal solutions [49,50]. This study proposes a novel hybrid metaheuristic-based regression tree model to predict the deterioration behavior of tunnel elements. By leveraging the synergistic strengths of regression trees and metaheuristic optimization, the model aims to provide accurate, reliable, and scalable predictions that can support proactive asset management strategies. The framework is validated using extensive datasets from real-world tunnel projects, emphasizing its practical applicability and effectiveness.

3. Research Methodology

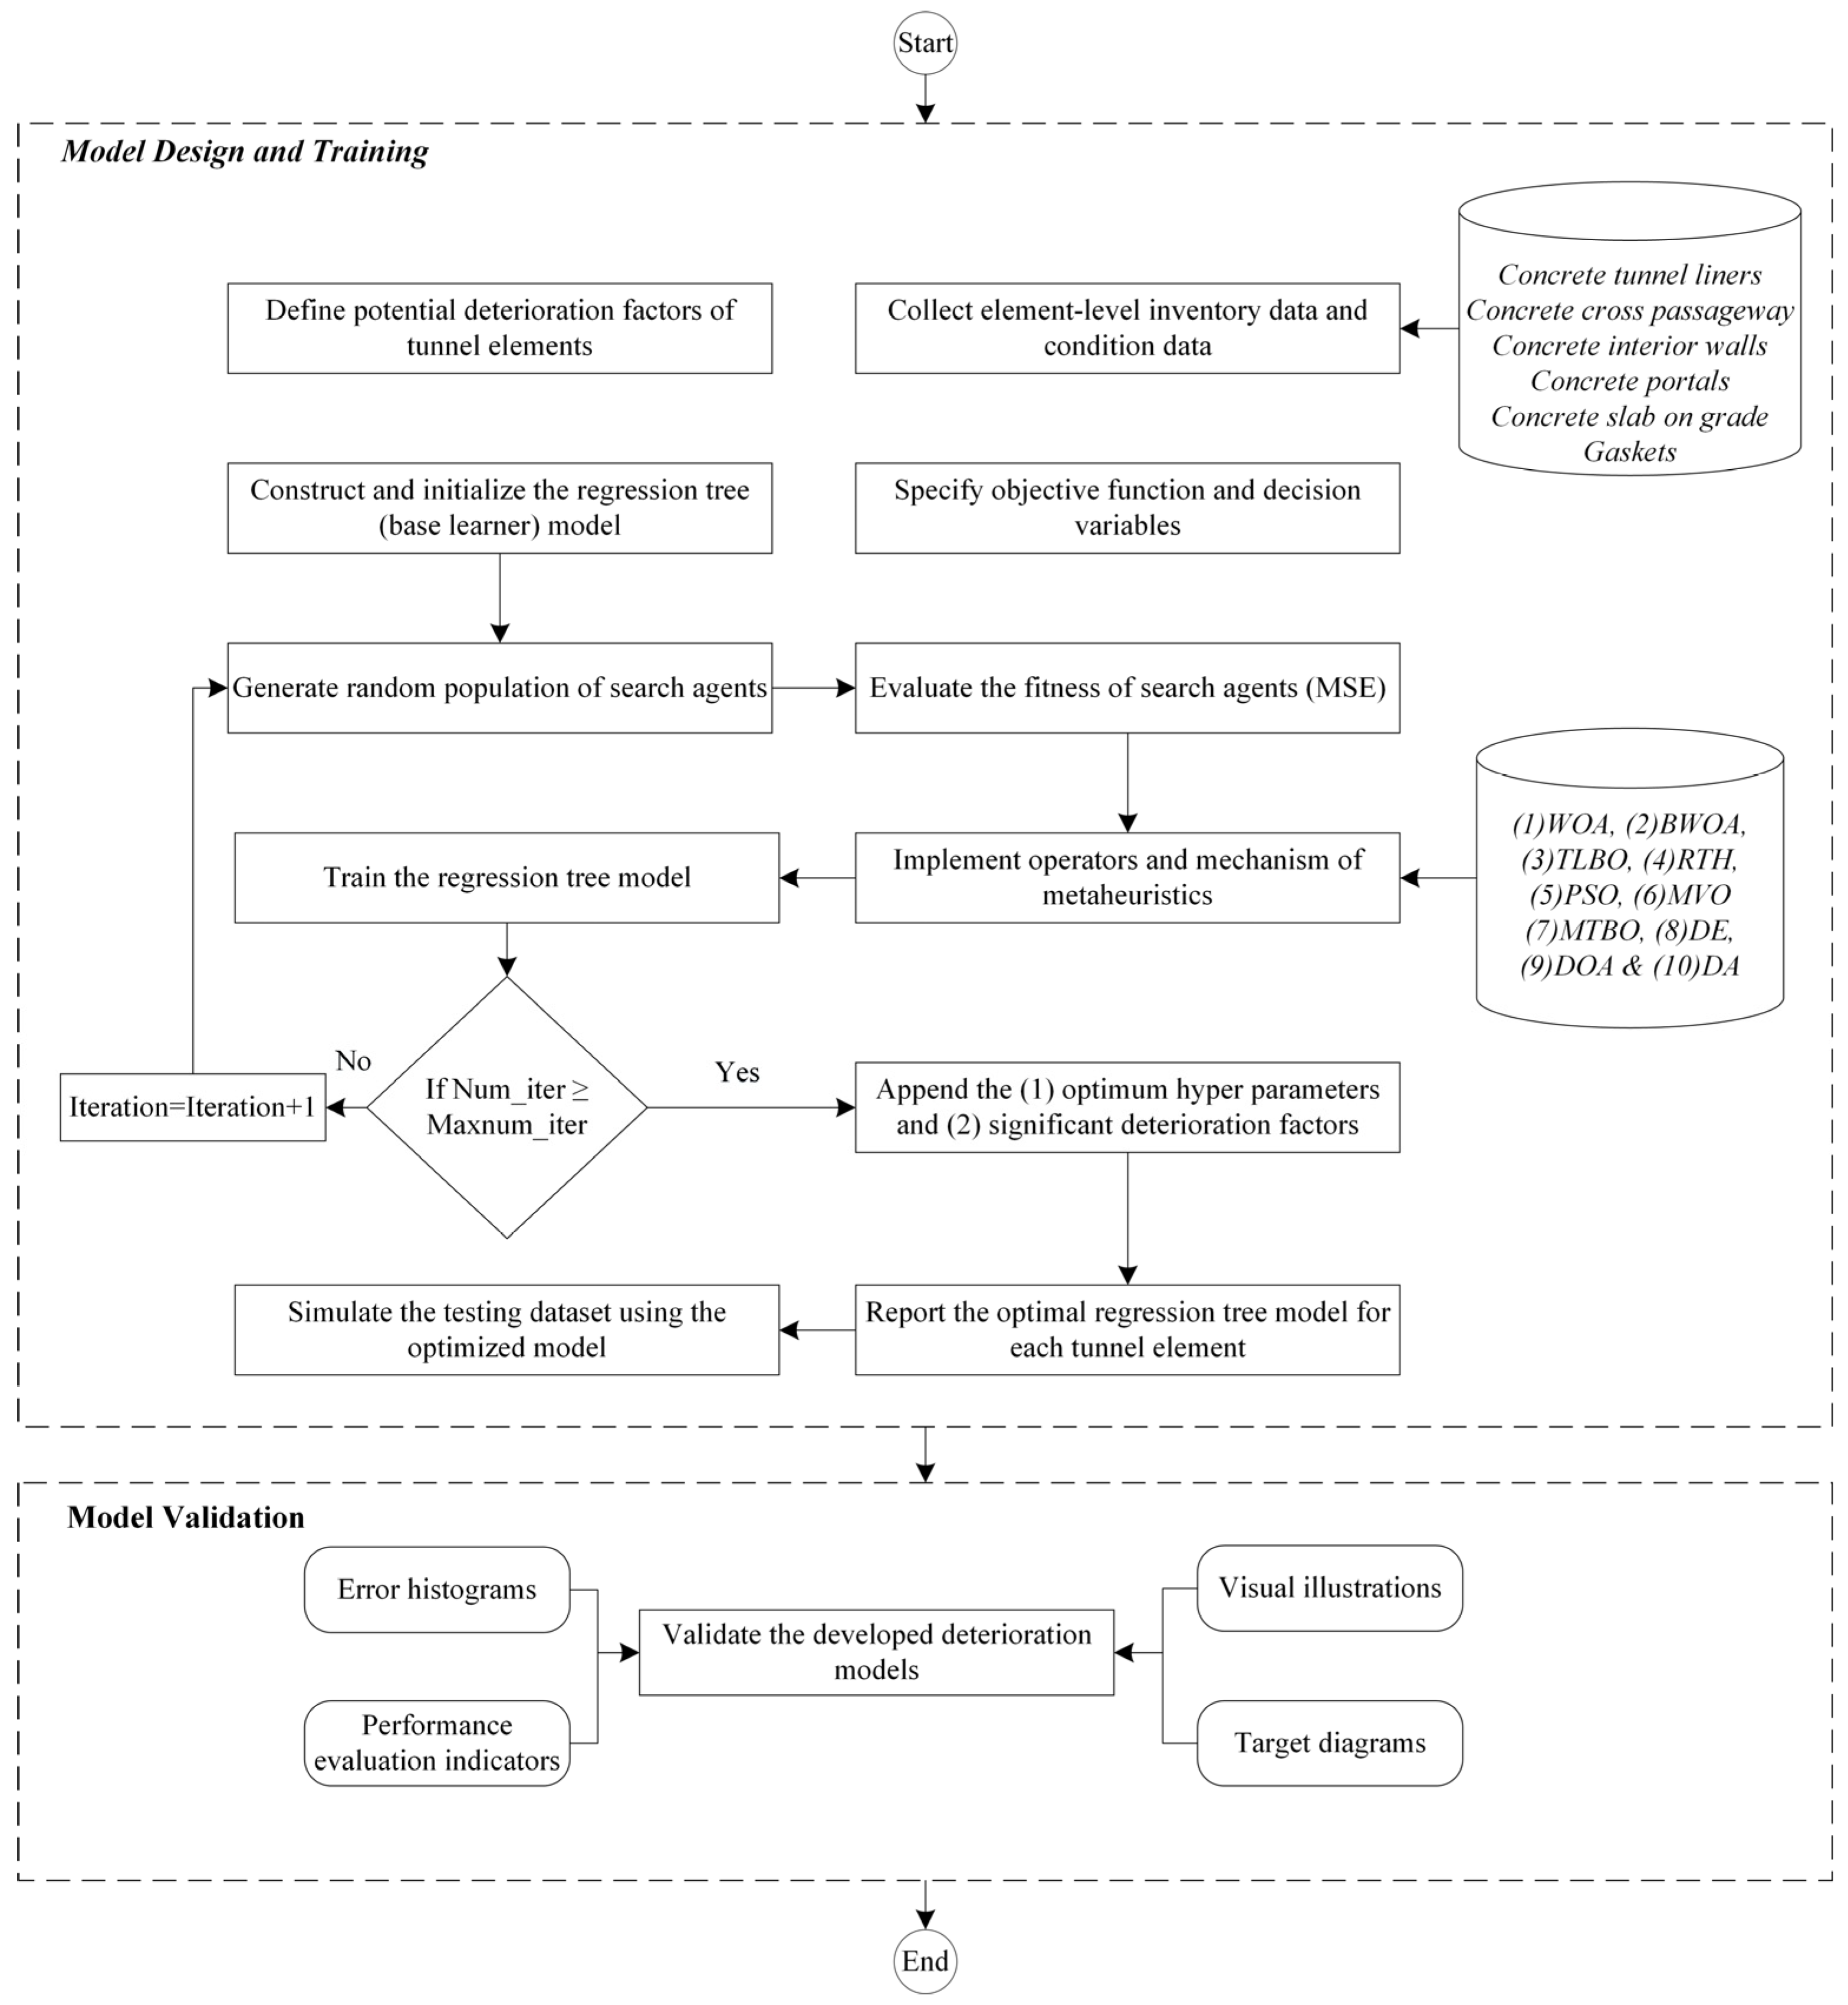
The foremost objective of this research study is to devise a data-driven model that is capable of mimicking the deterioration behavior of six key tunnel components, namely (1) cast-in-place concrete tunnel liners, (2) concrete cross passageways, (3) concrete interior walls, (4) concrete portals, (5) concrete slab on grade, and (6) gaskets. The framework of the developed deterioration prediction model is elucidated in Figure 1. It is envisioned based on two main modules, namely (1) model design and training, and (2) model validation. Hitherto, an individual deterioration model was designed and validated for each tunnel element. Several guidelines and manuals were subsequently studied and scrutinized to diagnose potential factors that influence the temporal deterioration of tunnels [51,52,53,54]. Table 1 summarizes descriptions of the possible deterioration factors on tunnels. The output variable is the condition state of tunnel element and prospective input deterioration factors comprise age (X1), age from rehabilitation (X2), total number of lanes (X3), annual average daily traffic (X4), annual average daily truck traffic (X5), detour length (X6), service in tunnel (X7), NHS designation (X8), STRAHNET designation (X9), functional classification (X10), tunnel length (X11), roadway width (X12), hazardous material selection (X13), number of bores (X14), tunnel shape (X15), portal shape (X16), ground conditions (X17), and complexity (X18). The developed deterioration model is trained, tested, and evaluated by consolidating the National Tunnel Inventory (NTI) dataset for 2020–2024. The NTI is a structured database of all tunnels in the United States, and it contains a complete registry of inventory, maintenance, and element level inspection data. This inventory database is maintained and updated annually by the Federal Highway Administration in the United States, and it is a publicly available at [55] in Excel format. The inspection of the tunnel components was performed according to the provisions and regulations of the tunnel inspection standards [56].
Over the past decade, artificial intelligence (AI) has received widespread and significant attention from the research community of civil engineering, including material properties [57,58], structural analysis [59,60], concrete design [61,62], steel design [63,64], and construction management [65,66]. Hitherto, the advent of bio-inspired metaheuristics has successfully been implemented to augment the search mechanism of AI data-driven models. Some recent attempts in this direction involve the uses of particle swarm optimization and artificial neural networks for the estimation of elastic modulus [67], support vector machines and artificial bee colony for pavement crack classification [68], and multi-layer perceptron and genetic algorithm for slope stability design [69].
With that in mind, the developed model herein is envisioned on the amalgamation of an ensemble of metaheuristics and regression trees to anticipate the future performance condition of tunnel components. Based on that premise, metaheuristics are leveraged for two fundamental purposes: (1) to autonomously optimize the hyperparameters of the regression tree model and (2) to simultaneously identify the most influential deterioration factor on each tunnel element. Regression trees are chosen in this research work owing to their low computational cost burden, simplicity, robustness against noise, high interpretability and predictive efficiency, and their ability to mimic complex nonlinear interactions in the dataset [70,71,72]. This research work considers and evaluates the performance of ten state-of-the-art metaheuristics from relevant research studies, including whale optimization (WOA) [73], black widow optimization (BWOA) [74], teaching–learning-based optimization (TLBO) [75], red-tailed hawk (RTH) [76], particle swarm optimization (PSO) [32], multi-verse optimization (MVO) [77], mountaineering team-based optimization (MTBO) [78], differential evolution (DE) [79], dandelion optimization (DOA) [80], and dragonfly optimization (DA) [81]. In this regard, WOA, TLBO, PSO, and DE are selected because they proved their efficaciousness in several asset management-related practices such as sewer pipeline inspection [82], bridge maintenance [83], building rehabilitation planning [84], and deterioration prediction of water pipes [85]. In addition, DA is selected because of its fast convergence speed, short running time, robustness, and wide suitability in many engineering applications [86]. As for MVO, it is able to render a proper balance between the exploration and exploitation of the search space [77]. In addition, BWOA, RTH, MTBO, and DOA are new metaheuristics that were developed within the last few years, received broad recognition, and yet to be experimented in deterioration anticipation of infrastructure assets [87,88].
The entire dataset is divided into training and testing subsets, and the developed deterioration model is learned using 10-fold cross-validation of the training partition. In this regard, the mean squared error is utilized as an objective function which needs to be minimized during the iterative process of training. The developed metaheuristic-based regression tree model is validated through comparison against some well-known machine learning models: support vector machine (SVM), cascade neural network (CNN), generalized regression neural network (GRNN), Elman neural network (ENN), and feed forward neural network (FFNN). The performance of each deterioration model is evaluated and analyzed based on the statistical metrics of mean absolute error, mean absolute percentage error, root mean squared percentage error, root mean squared error, normalized root mean squared error, uncertainty at 95%, objective function criterion, Akaike information criterion, and performance strength criterion. In addition, target diagrams [89] and error histograms [90] are leveraged to visually synthesize the precision of the investigated deterioration models. Using these graphical diagrams, the optimal machine learning model can be interpreted.

4. Materials and Methods

This section overviews some of the used algorithms and performance metrics in this research work.

4.1. Teaching–Learning Based Optimization (TLBO)

TLBO is a population-based metaheuristic that emulates the educational process in a classroom [75]. It consists of two basic modes, namely the teacher phase and learner phase. In the teaching phase, learners (students) first gain knowledge from the teacher (best solution) who strives to improve the mean results of the class. The difference between the existing mean and teacher’s results, is expressed using Equation (1).
D M k = r k ( M n e w T f M k )
where T f is a teaching factor that can be either one or two; r k is a uniform random number within the range [0, 1]; and M k and M n e w are the current and new means of learners, respectively.
As for the learner phase, students learn from each other through discussion and interaction. In this context, a learner shall acquire new information if other students have more knowledge. Assume student X i randomly interact with another student X j in order to boost his/her knowledge. The learner phase is formulated using Equations (2) and (3) (assume minimization functions).
X n e w = X i + r X j X i   i f   f x j < f ( X i )
X n e w = X i + r X i X j   i f   f x i < f ( X j )

4.2. Particle Swarm Optimization (PSO)

PSO is a swarm intelligence-based algorithm that mimics the choreography of bird flocks in nature [32]. In it, each particle in the swarm is analogous to a given solution in the search space, whereas these particles move with a certain direction and velocity. Each candidate solution or particle adapts its search pattern according to its own best flying experience and best experience of its companions. The positions and velocities of individuals are updated based on Equations (4) and (5).
x k t + 1 = x k t + v i t + 1
v k t + 1 = w × v k t + c 1 × r 1 × ( p b e s t k ( t ) x i ( t ) ) + c 2 × r 2 × ( g b e s t ( t ) x k ( t ) )
where v k t + 1 and x k t + 1 stand for the velocity and position of the k th particle at iteration t + 1 ; p b e s t k is the personal best position of the k th particle and g b e s t is the global best position among all particles; w stands for the inertia coefficient to manage the tradeoff between local and global exploration; c 1 and c 2 refer to the positive cognitive and social parameters, respectively; and r 1 and r 2 are two uniformly distributed numbers between 0 and 1.

4.3. Differential Evolution (DE)

DE is a population-based algorithm that was proposed to solve nonlinear, nondifferentiable, and multimodal optimization functions [79]. Mutation and crossover are two basic strategies in DE algorithm. In the mutation operation, a mutant vector is created for each target vector in the population. In this context, three different and random vectors ( x r A , x r B , x r C ) are selected from the initial population, and thereafter, the new mutant vector is generated by adding the weighted differences between the first two vectors to the third vector (see Equation (6)).
V i , G + 1 = X r A , G + F X r B , G X r C , G
where x r A , x r B , and x r C are three randomly selected vectors, and F is a scaling factor that guides the application of the DE algorithm.
Crossover comes after the mutation phase, and it aims to improve the diversity of the current population. The trial vector ( U j , i , G + 1 ) is obtained using Equation (7), such that a random number is created and compared against the crossover rate ( C R ). In this regard, if the crossover rate is less than the random number then the mutant vector is selected. Otherwise, the target vector is used.
U j , i , G + 1 = V j , i , G + 1   if   CR rand j   X j , i , G   otherwise  
where J denotes the index of the element in any of the vectors.

4.4. Multiverse Optimization (MVO)

MVO is a physics-based algorithm that draws inspiration from the cosmology concepts of worm holes, black holes, and white holes [91]. Physicists suggest that the big bang is regarded as a white hole, and possibly they are the main component for the birth of the universe. In addition, white holes have been never witnessed in our universe while the black holes are frequently observed, and act unlike the white holes. Wormholes act as time–space passages that link different corners of the universe together. MVO utilizes worm holes to exploit the search space. Conversely, the concepts of black holes and white holes usher in exploring the search space. An inflation rate is set to each candidate solution and it is analogous to the objective function. During the optimization process, the following rules are implemented in the MVO algorithm:
  • Higher inflation rates denote a high possibility of finding white holes and a low possibility of finding black holes.
  • Universes of high inflation rates opt to drive objects through white holes.
  • Universes of low inflation rates opt to sustain more objects through black holes.
  • Objects in all universes move randomly in the direction of the best universe through worm holes irrespective of inflation rates.
Wormhole tunnels are assumed to be formed between a universe and the best-created universe so far in order to sustain local changes in each universe and increase their inflation rates. This mechanism is mathematically expressed using Equation (8).
X i j = X j + TDR × u b j l b j × r 4 + l b j   r 3 < 0.5   X j TDR × u b j l b j × r 4 + l b j   r 3 0.5 r 2 < W E P X i j   r 2 WEP
where r 2 , r 3 , and r 4 are three random numbers within the range [0, 1]. X j refers to the j t h parameter of the best universe so far. u b j and l b j stand for the upper and lower bounds of the j t h parameter of the existing optimal universe. W E P is wormhole existence probability, and T D R is the traveling distance rate.

4.5. Dragonfly Algorithm (DA)

DA is a swarm intelligence algorithm that imitates the migration and feeding behaviors of dragonflies [81]. In other words, it is originated from the static and dynamic swarming behaviors of dragonflies, and it models the exploration and exploitation phases of the search space. Dragonfly insects exhibit five main processes in nature, namely separation, alignment, cohesion, foraging, and avoiding. The main goal of separation is to circumvent the collision between individuals in the neighborhood. The separation model is mathematically expressed using Equation (9).
S i = j = 1 N X X j
where X is the position of current dragonfly individual, X j is the position of the j th neighboring individual, and N is the number of neighbors.
Alignment refers to the velocity matching between dragonfly individuals in the neighborhood. Cohesion symbolizes the tendency of individuals towards the middle of the neighborhood, and foraging is the attraction of individuals toward the food source. Avoiding refers to distraction and escaping away from the enemy. The mathematical models of alignment, cohesion, foraging and avoiding are given in Equations (10)–(13), respectively.
A i = j = 1 N V j N
j = 1 N X j N X
F i = X + X
E i = X X
where V j is the velocity of the j th neighbor, X + is the location of food source, and X is the position of the enemy.

4.6. Whale Optimization Algorithm (WOA)

WOA is a nature inspired algorithm that mimics the predatory behavior of humpback whales [73]. It is based on three main principles, namely encircling prey, bubble-net attacking, and search for prey. In the encircle operator, the current best position is assumed to be the location of the target prey or near to it, and other whales tend to update their positions towards the optimal search agent (see Equations (14) and (15)).
D = [ C . X ( t ) X ( t ) ]
X ( t + 1 ) = [ X * ( t ) A . D ]
where X * is the position vector of the best solution so far, and A and C are two adjustable coefficient vectors.
The bubble-net attacking method of whales is modeled using the shrinking encircling mechanism and spiral updating position. The mathematical model of the bubble-net operator is given in Equations (16) and (17). The exploration phase involves random movement of whales in search for the prey, such that the positions of humpback whales are updated using Equations (18) and (19).
D = | X * ( t ) X ( t ) |
X t + 1 = D . e b l . cos 2 π l + X * ( t )
D = [ C . X r a n d ( t ) X ( t ) ]
X ( t + 1 ) = [ X r a n d ( t ) A . D ]
where b is a constant that specifies the shape of the logarithmic spiral, l is a random number within the range [−1, 1], D symbolizes the distance of the i th whale to the prey, and X r a n d is a random position vector of a whale from the current population.

4.7. Black Widow Optimization Algorithm (BWOA)

BWOA is a new metaheuristic that imitates the bizarre lifestyle and mating behavior of black widow spiders [74]. In it, a female black widow draws the attention of a male to mate. Then, she consumes the male and holds the carried sperms to be released to her egg sac. BWOA comprises four main phases, namely population initialization, procreation, cannibalism and mutation. In the procreation phase, pairs of spiders are assumed independent of each other, and they mate to reproduce spider babies. The reproduction process can be modeled using Equation (20).
y 1 = α × x 1 + 1 α × x 2 y 2 = α × x 2 + 1 α × x 1
where y 1 and y 2 are the young offsprings, x 1 and x 2 are the parents, and α is a random number between 0 and 1.
BWOA undergoes three types of cannibalism, the first involves the eating of the husband by his female partner during or after the mating. The second type is the sibling cannibalism, whereas strong spiderlings eat their weaker siblings. In this type, the number of survivors, is marked by a cannibalism rate ( C R ). The third type takes place when spiderlings eat their mother.

4.8. Training Function of Regression Trees

The developed integrated relies on the use of metaheuristics for two main tasks: (1) feature selection and (2) hyperparameter optimization. Feature selection is the process of identifying the most optimal/influential subset features that contribute mostly to the output variable (tunnel condition herein) through removing irrelevant/redundant ones [92]. In other words, feature selection is applied in this study to pick up the most affecting deterioration factors on each tunnel element. Usually, the discriminative features are evaluated and extracted based on a certain criteria that triggers the relevance of the investigated criteria. In this study, the criteria are reducing the difference between the actual and predicted tunnel element condition. In general, feature selection methods are broadly classified into filter and wrapper methods. Filter methods do not incorporate a regression or classification model, and they instead look into the intrinsic characteristics of the output and input variables in the training dataset [93,94]. They include information gain, F-score, ReliefF, and Pearson correlation. In contrast, wrapper methods are contingent on the prediction model, and they deal with feature selection as an iterative search problem [93]. Metaheuristics such as particle swarm, artificial bee colony, and genetic algorithm, are widely used wrapper feature selection methods in the literature [95,96]. In addition, wrapper methods are able to provide more powerful results than filter methods, but they are more computationally expensive because of their exhaustive learning processes [94,97]. In light of the above, this research paper capitalizes on the use of metaheuristics for feature selection. Moreover, regression trees are incorporated because they are fast learners that can circumvent the computationally demanding nature of wrapper methods. With the growing number of developed metaheuristics every year over the past decade, the challenge is to find an appropriate metaheuristic that can maintain a proper balance between exploration and exploitation search abilities.
As for hyperparameter optimization, metaheuristics are also adopted to address the impractical, inefficient, and high computational cost of manual tuning, especially in the presence of highly dimensional data (NTI). In this context, the hyperparameters optimized by a metaheuristic involve the (1) minimum parent size, (2) minimum leaf size, (3) maximum number of splits, and (4) type of predictor selection method. The designed optimization model considers four types of predictor selection methods, namely “curvature”, “interaction-curvature”, and “all splits”. Hence, the string length of any given candidate solution is 22, such that the first eighteen decision variables (deterioration factors) are binary-coded, and the remaining four are real-coded (hyperparameters). The lower bounds of minimum parent size, minimum leaf size, and maximum number of splits are set to 2. Furthermore, the upper bounds of minimum parent size, minimum leaf size, and maximum number of splits are set to 500, 1000, and 2000, respectively. The developed regression tree is trained using the 10-fold cross validation of MSE (see Equation (21)).
M S E T r = 1 K k = 1 K M S E k
where M S E k is the mean squared error of the K -th fold (10 folds).

4.9. Deterioration Models’ Assessment

This section elaborates on the multiple statistical metrics used to explore the predictive power of the investigated deterioration models. Nine key indicators are adopted to estimate the deterioration models’ performance: (1) mean absolute error, (2) mean absolute percentage error, (3) root mean squared percentage error, (4) root mean squared error, (5) normalized root mean squared error, (6) uncertainty at 95% “U95%”, (7) objective function “OBJ” criterion, (8) Akaike information criterion “AIC”, and (9) performance strength criterion “PSC”. Lower values of MAE, MAPE, RMSPE, RMSE, NRMSE, OBJ, U95, and AIC indicate a higher precision of the deterioration model. However, larger values of PSC depict a better level of performance of the model. OBJ value takes into consideration the statistical parameters of MAE and R2 for the training and testing subsets [98]. The ideal PSC value is 1, and the model with a PSC value closest to 1 is generally considered the best-performing model [99]. AIC is utilized to study the generalization capabilities of the suggested data-driven models, and it strives to find the optimal tradeoff between the model’s complexity and accuracy [100,101]. The following equations (Equations (22)–(30)) represent the formulas for computing these indicators [98,99,100,102,103,104,105,106].
M A E = 1 N i = 1 N | P i O i |
M A P E = 1 N i = 1 N | P i O i O i |
R M S P E = 1 N i = 1 N P i O i O i 2
R M S E = i = 1 N ( P i O i ) 2 N
N R M S E = R M S E O
U 95 = 1.96 ( S D 2 + R M S E 2 )
O B J = ( N t r N t s ) ( N t o t ) × ( M A E t r ) ( R t r 2 ) + ( 2 × N t s ) ( N t o t ) × ( M A E t s ) ( R t s 2 )
A I C = N × ln R M S E 2 + 2 K
P S C = A d j . R 2 T o t a l + 0.01 V A F T o t a l R M S E t o t a l A d j . R 2 R 2 t r + A d j . R 2 R 2 t s
where P i and O i refer to the predicted and actual condition of the i-th tunnel element; N is the number of inspection records in the dataset used either for training or testing; O is the mean value of the actual condition; S D is the standard deviation of the prediction error and 1.96 is the coverage factor at the 95% confidence level; N t r and N t s denote the numbers of inspection records in the training and testing phases, respectively; N t o t is the total number of inspection records in the entire dataset; M A E t r and M A E t s are the values of mean absolute error for the training and testing subsets, respectively; R t r 2 and R t s 2 are the values of coefficient of determination for the training and testing subsets, respectively; K is the counting of input fitting parameters; A d j . R 2 stands for the adjusted coefficient of determination; and V A F denotes variance account factor.

5. Model Implementation

The model implementation section is divided into eight main subsections, namely (1) data description and parameter setting, (2) convergence behaviors, (3) error histograms, (4) performance evaluation metrics, (5) visual illustrations, (6) target diagrams, (7) influential deterioration factors, and (8) analysis and discussion. In each subsection, the results of each subsection are presented in the following order: cast-in-place concrete tunnel liners, concrete cross passageways, concrete interior walls, concrete portals, concrete slab on grade, and gaskets. The first subsection describes the training and testing subsets of the used National Tunnel Inventory. It also reports the control parameters of metaheuristics. The convergence curves of the utilized metaheuristics are plotted in the second subsection. The third subsection displays the error histograms of deterioration models. The fourth subsection involves recording the performance scores of deterioration models, which are MAE, MAPE, RMSPE, RMSE, NRMSE, U95, and OBJ. The fourth subsection displays graphic illustrations of AIC values, PSC values, and agreement plots (actual vs. predicted curves). The sixth subsection elaborates on the target diagrams of deterioration models. The seventh subsection enumerates the most influential deterioration factors impacting tunnel element condition. The eighth subsection reports the main findings of this research work.

5.1. Data Description and Parameter Setting

An entire dataset is constructed based on compiling the National Tunnel Inventory spanning from 2020 to 2024. In this context, the tunnel inspection records with missing values (incomplete data) were removed from the analysis. The consolidated dataset comprises 2244, 383, 1151, 1900, 1509, and 348 inspection records for cast-in-place concrete tunnel liners, concrete cross passageways, concrete interior walls, concrete portals, concrete slab on grade, and gaskets, respectively. The tunnel condition dataset is partitioned into training and testing subsets, with 80% of the dataset utilized for training the deterioration models and the remaining 20% used for their testing. Several metaheuristics, including WOA, BWOA, TLBO, RTH, PSO, MVO, MTBO, DE, DOA, and DA, were deployed in this study to identify (1) the hyperparameters of regression tree and (2) optimal deterioration factors of each tunnel element. The values of control parameters were retrieved from the literature [32,73,74,75,76,77,78,79,80,81]. The control parameter settings of metaheuristics are recorded in Table 2. To maintain a fair comparison between metaheuristics, they were simulated using a population size and maximum number of iterations of 300 and 50, respectively. Each metaheuristic algorithm was independently run five times to address its stochastic nature and maintain reliability of the obtained results. Afterwards, the results of the best runs were used to predict the condition of tunnel elements.

5.2. Convergence Behaviors

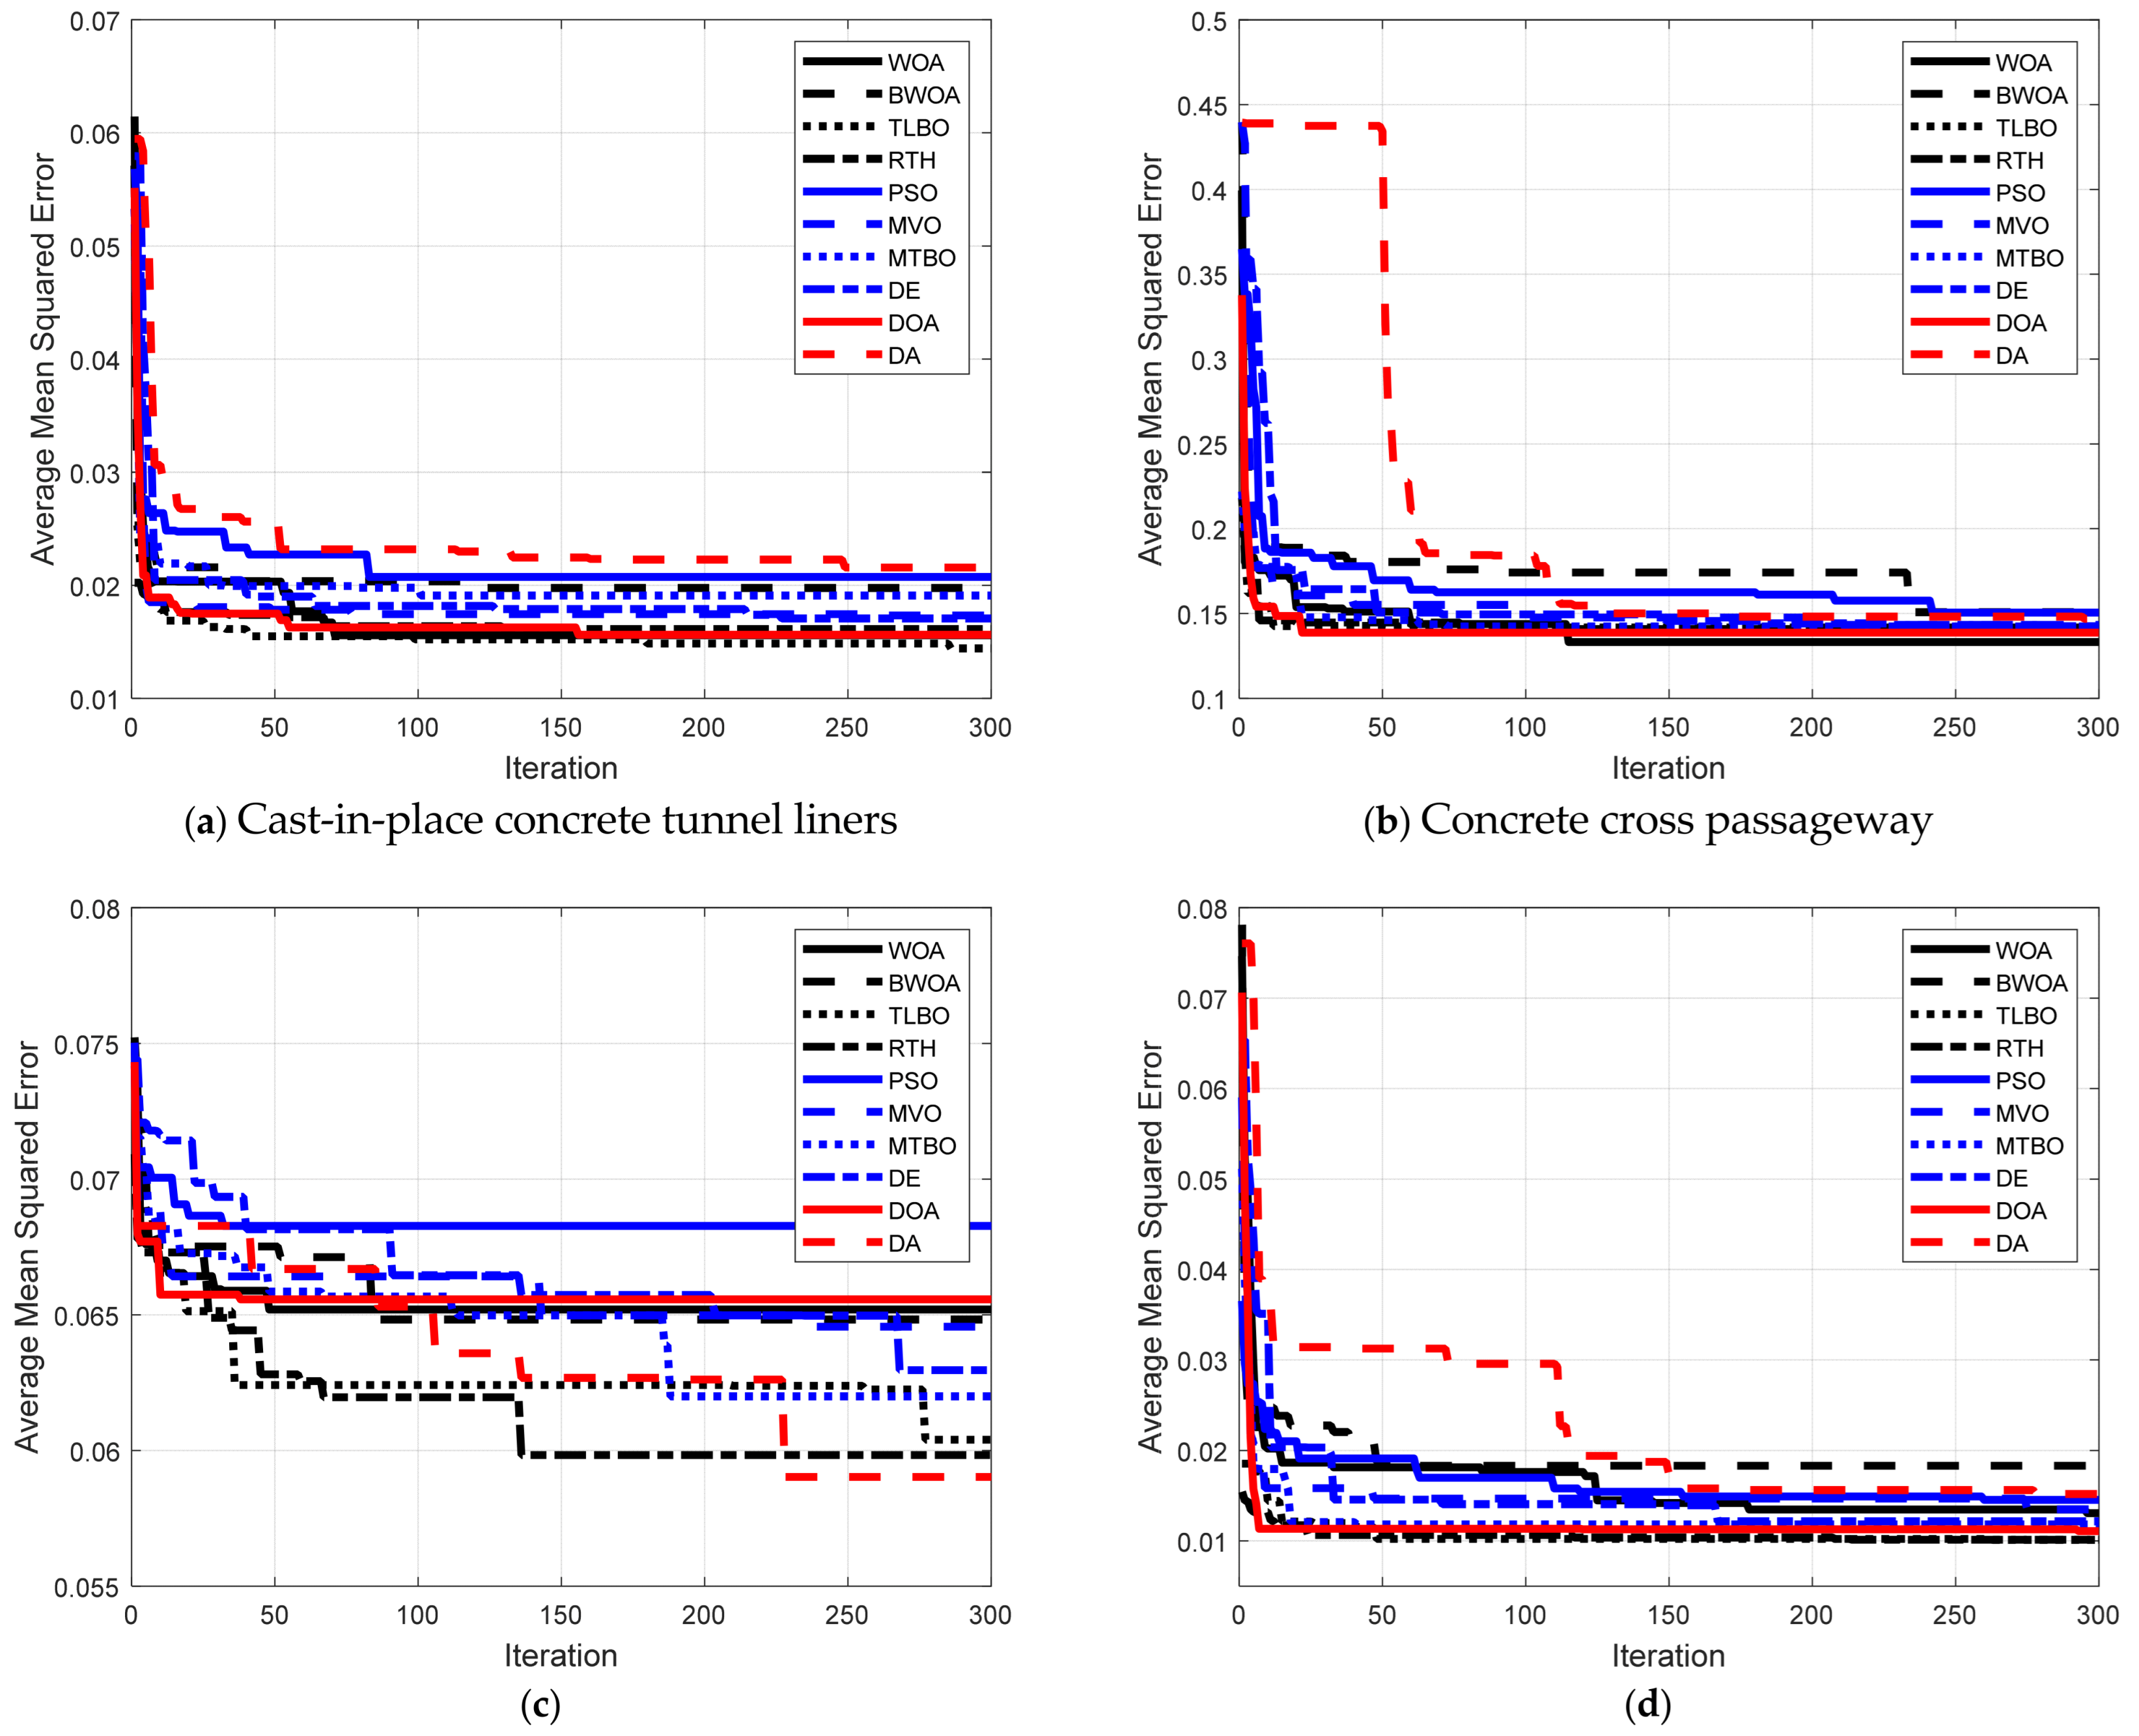
Figure 2a illustrates the convergence behaviors of the metaheuristic-based regression tree models of cast-in-place concrete tunnel liners. As can be seen, REGT-TLBO converged at iteration 287 with average MSE of 0.0144. In addition, REGT-WOA and REGT-DOA performed well such that they converged to average MSE 0.0156 at iterations 128 and 158, respectively. As for concrete cross passageways, the convergence behaviors of the metaheuristic-based regression models are presented in Figure 2b. It is revealed that REGT-WOA was able to swiftly converge at iteration 115 to average an MSE of 0.1332. On the other hand, the highest average MSE (0.1506) was linked with REGT-PSO at iteration 242. Figure 2c demonstrates the convergence details of deterioration models of concrete interior walls. It is evident that REGT-PSO and REGT-DOA suffered from premature convergence. Furthermore, the smallest values of average MSE were obtained by REGT-DA (0.059) and REGT-RTH (0.0598). As for concrete portals, the results are explicated in Figure 2d. It is evinced that REGT-RTH becomes well stabilized to average MSE of 0.0101 at iteration 214. Moreover, REGT-TLBO quickly converged to average MSE of 0.0102 at iteration 48. With respect to concrete slab on grade (see 
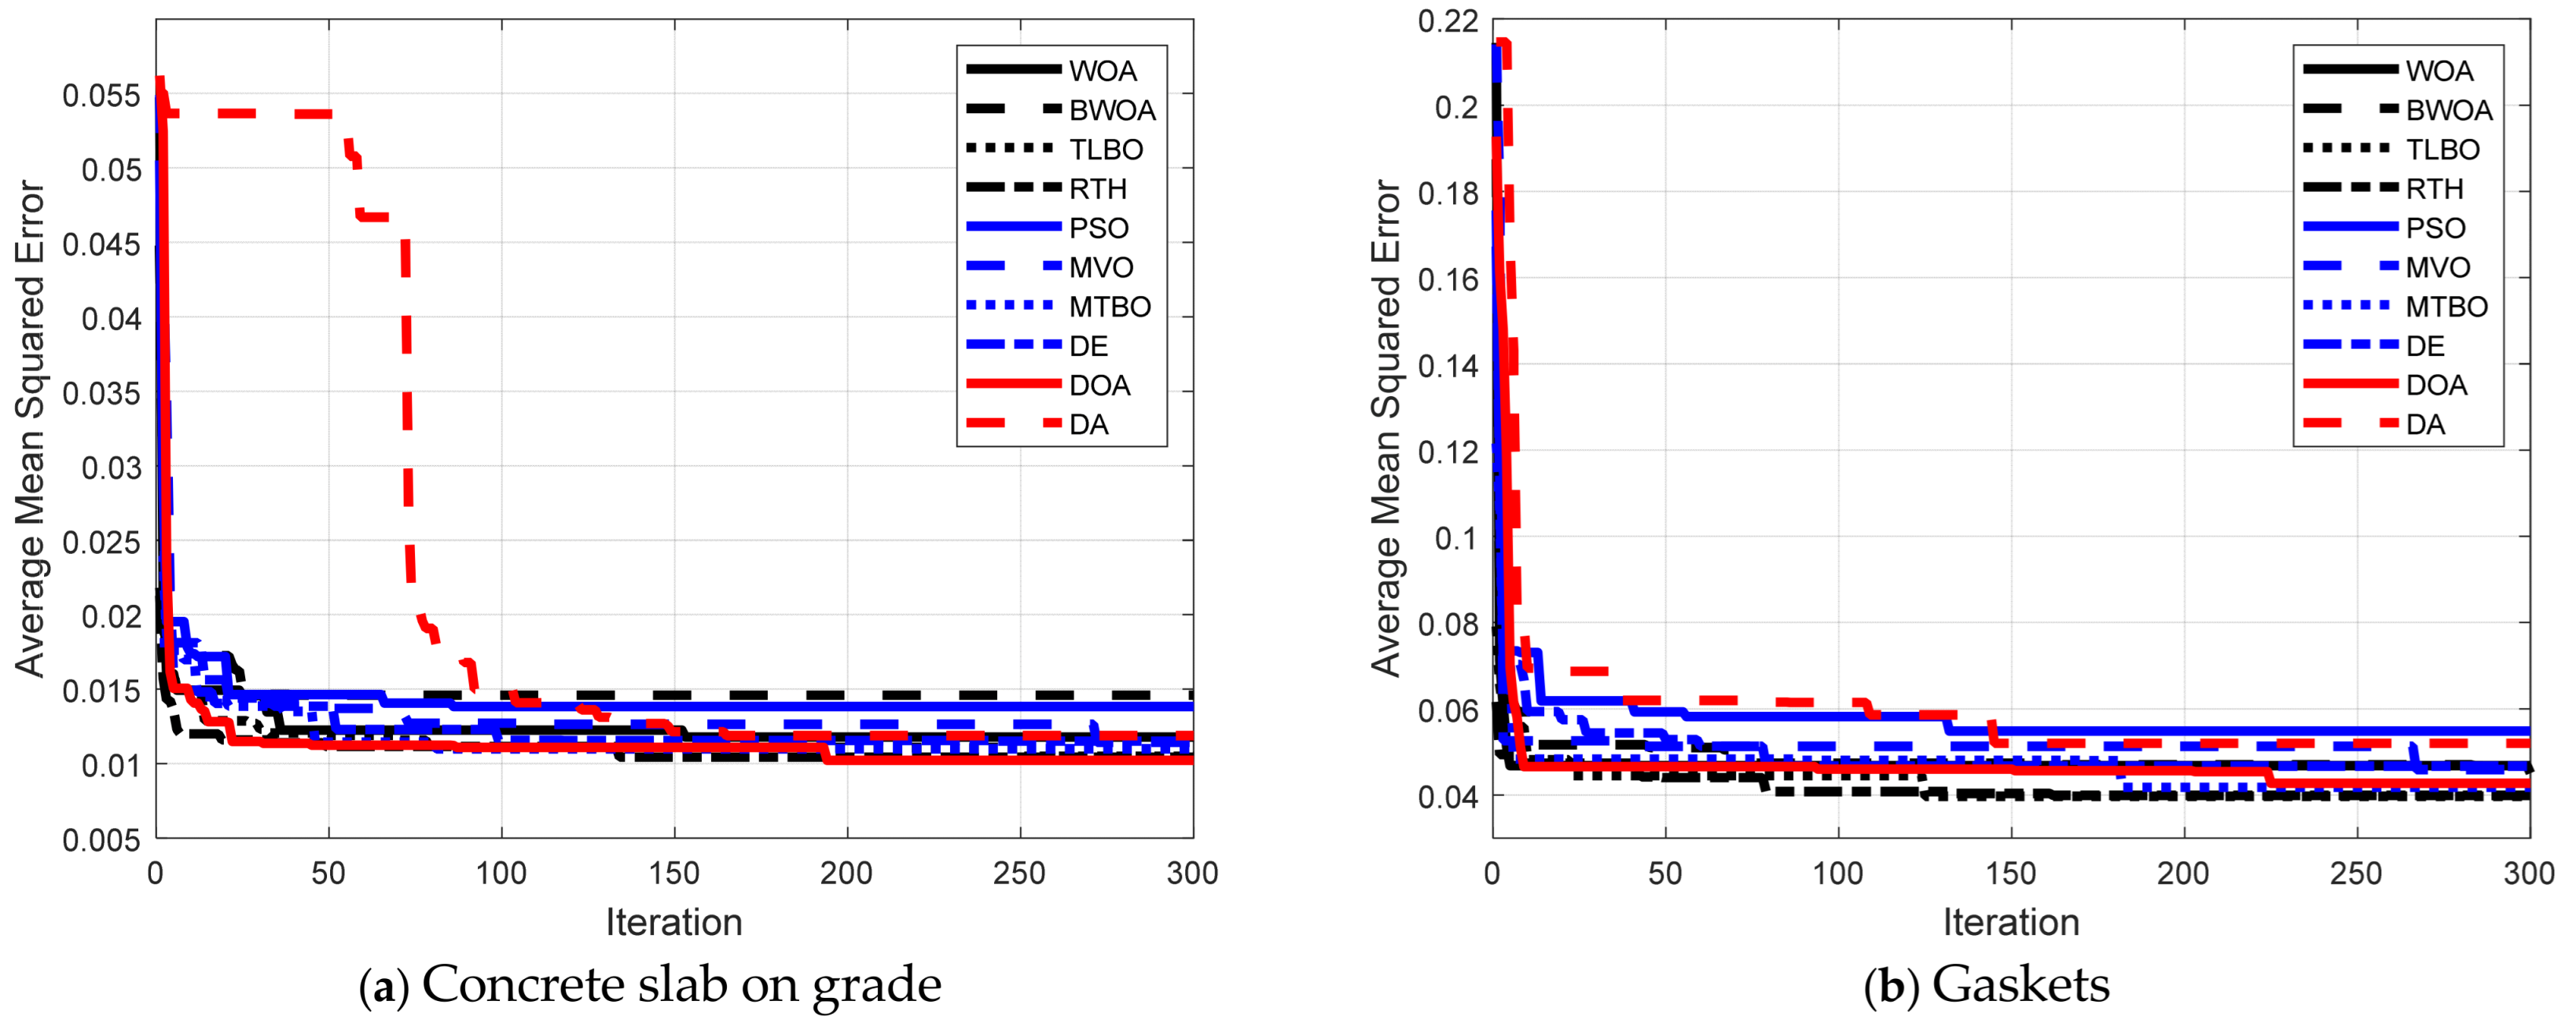
Figure 3a), it is indicated that the lowest training average MSE was produced by REGT-DOA (0.0102), REGT-RTH (0.0104), and REGT-TLBO (0.0105). Nonetheless, the highest training average MSE was yielded by REGT-BWOA (0.0146) and REGT-PSO (0.0138). The details of gaskets are presented in Figure 3b. As can be seen, it is manifested that REGT-TLBO, REGT-RTH, and REGT-MTBO achieved the best training performance such that their values of average MSE were equal to 0.0397, 0.0399, and 0.0418, respectively.

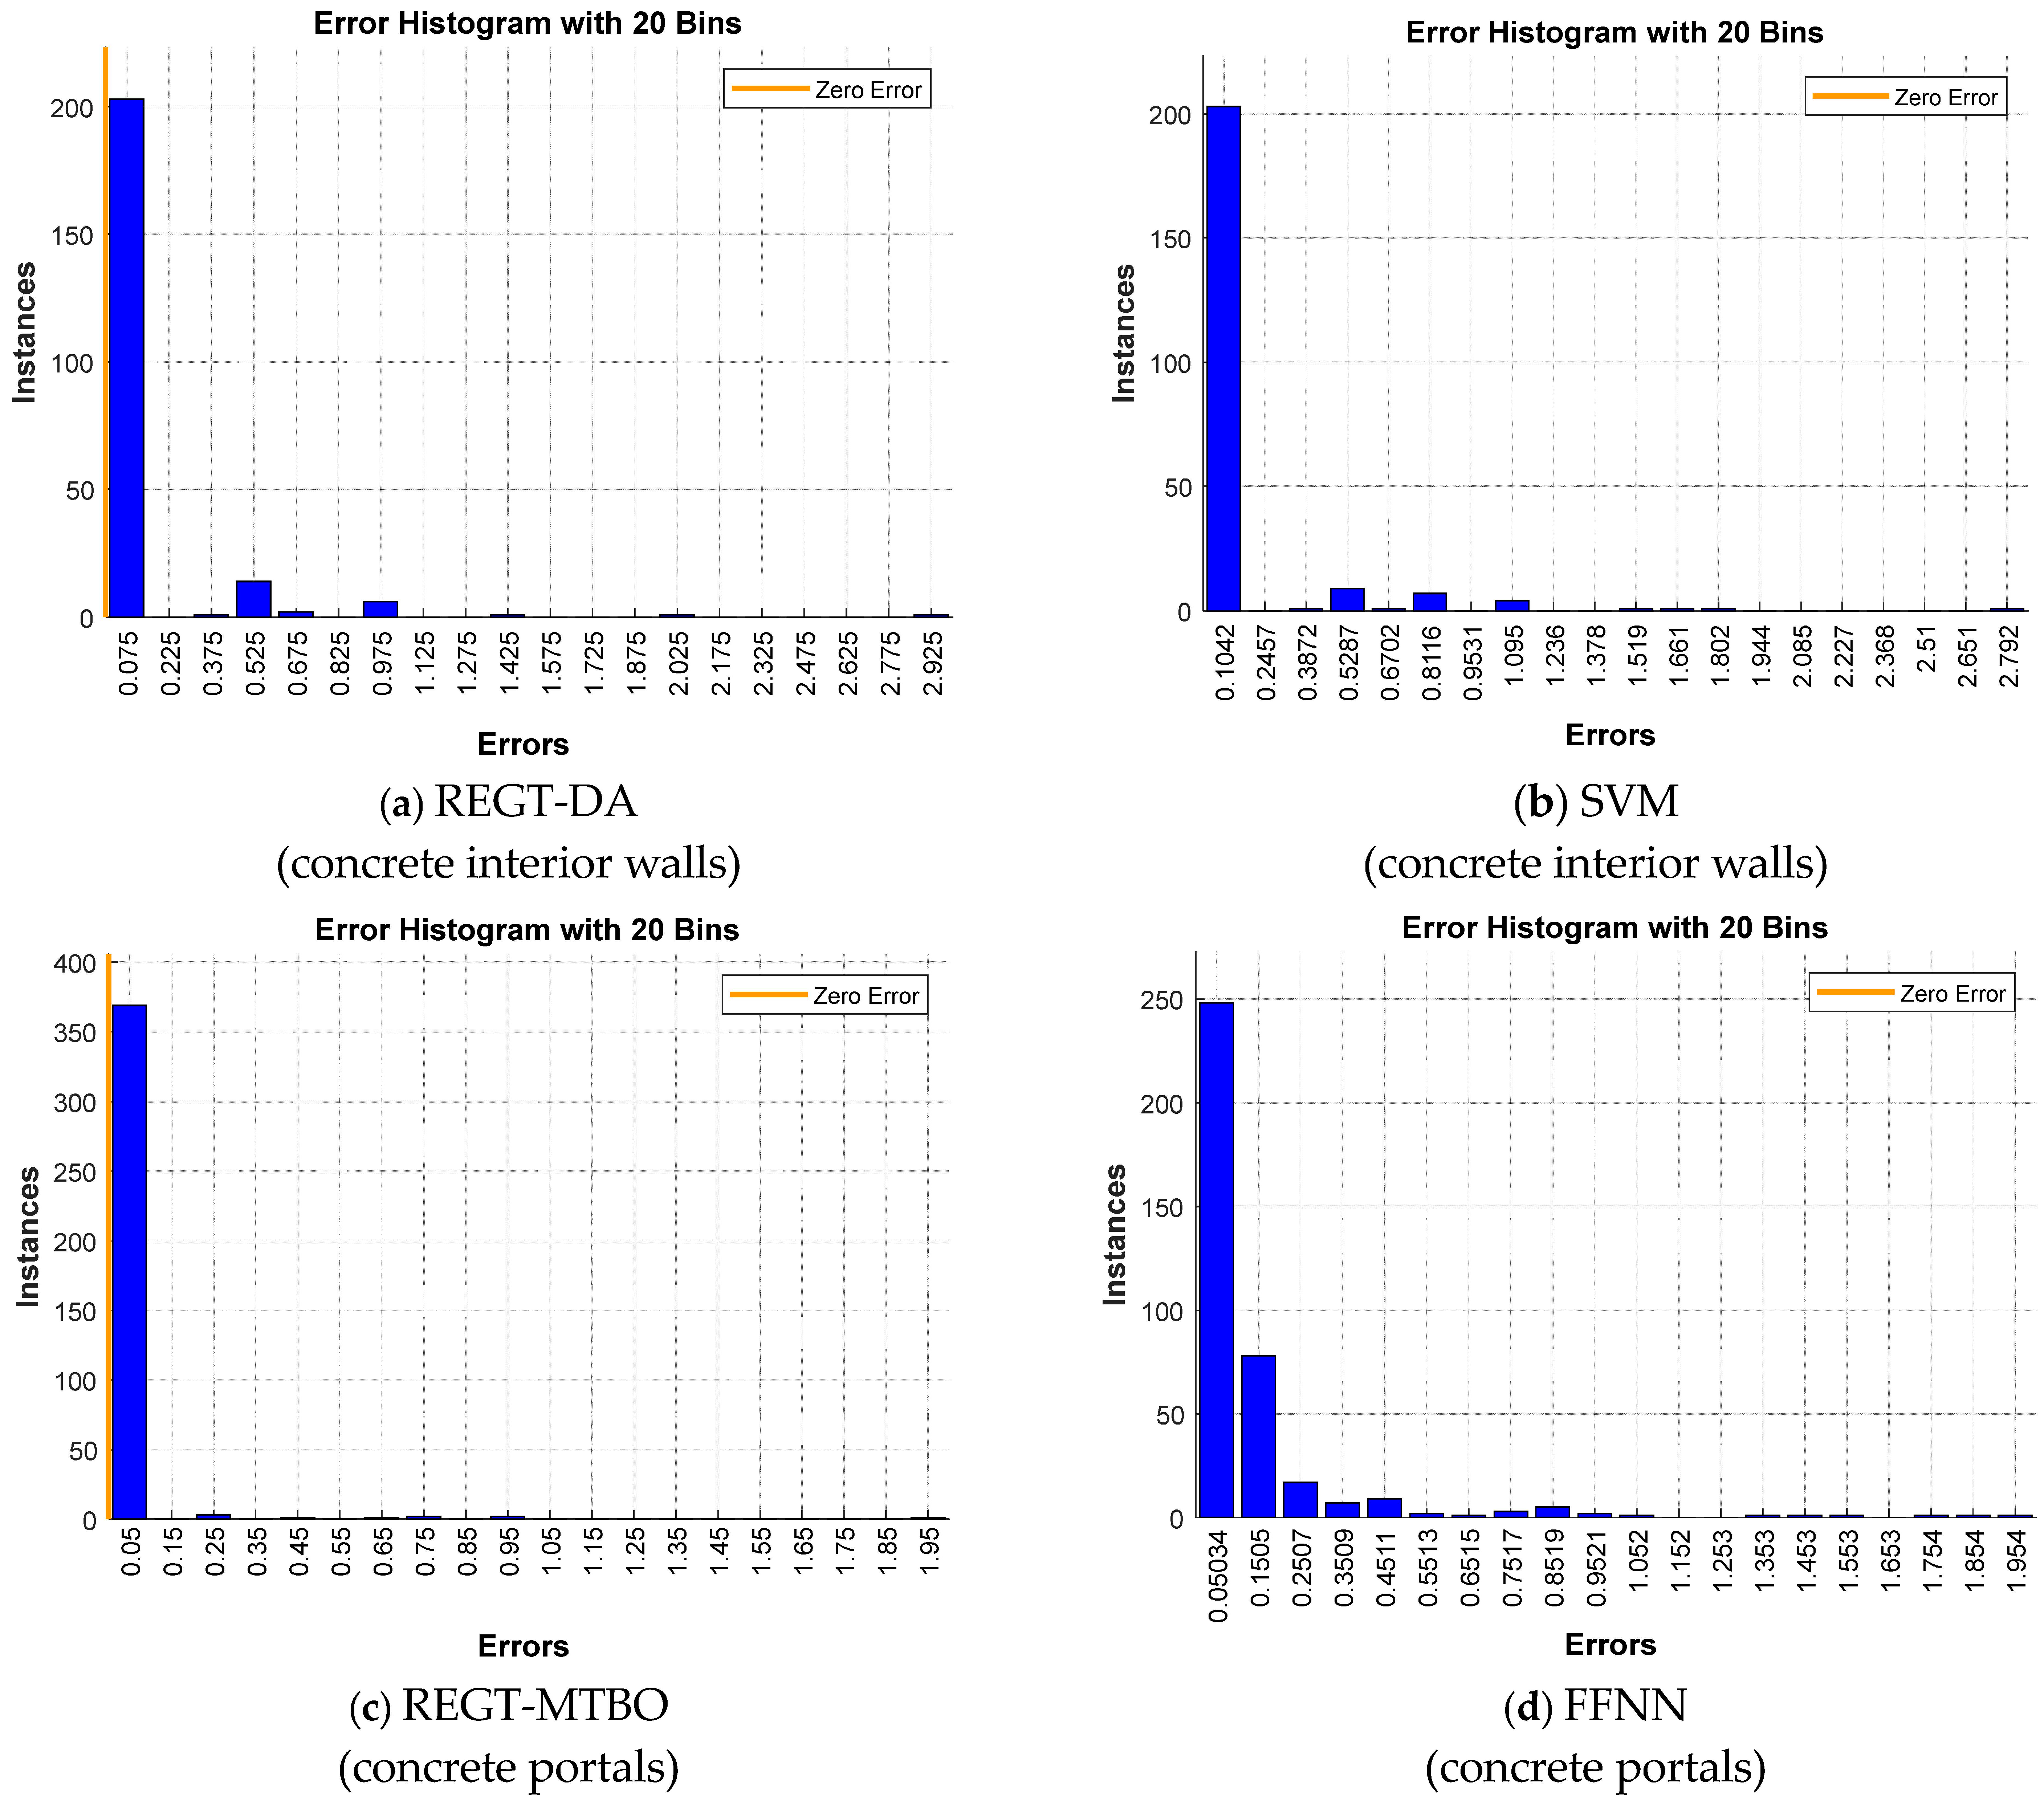
5.3. Error Histograms

Figure 4a,b show the error histograms for REGT-MTBO and SVM of cast-in-place concrete tunnel liners. It is worth mentioning that the error values are clustered into 20 bins and the orange line denotes zero error. As can be seen, the most frequent error of REGT-MTBO is 0.075, and it is 0.1691 for SVM. Similarly, the error histograms of deterioration models of the concrete cross passageway are displayed in Figure 4c,d. It is clear that the majority of the error values are close to 0 and 0.1174 for REGT-MVO and SVM, respectively. Figure 5a,b illustrate the error histograms of deterioration models of concrete interior walls. It is indicated that the most repeated error values of REGT-DA and SVM are 0.075 and 0.1042, respectively. Figure 5c,d reflect the resulting error histograms for concrete portals. It is manifested that almost 95% of the testing instances of REGT-MTBO accommodate errors less than 0.05. For the FFNN, the most frequent error values are 0.05034 and 0.1505. 
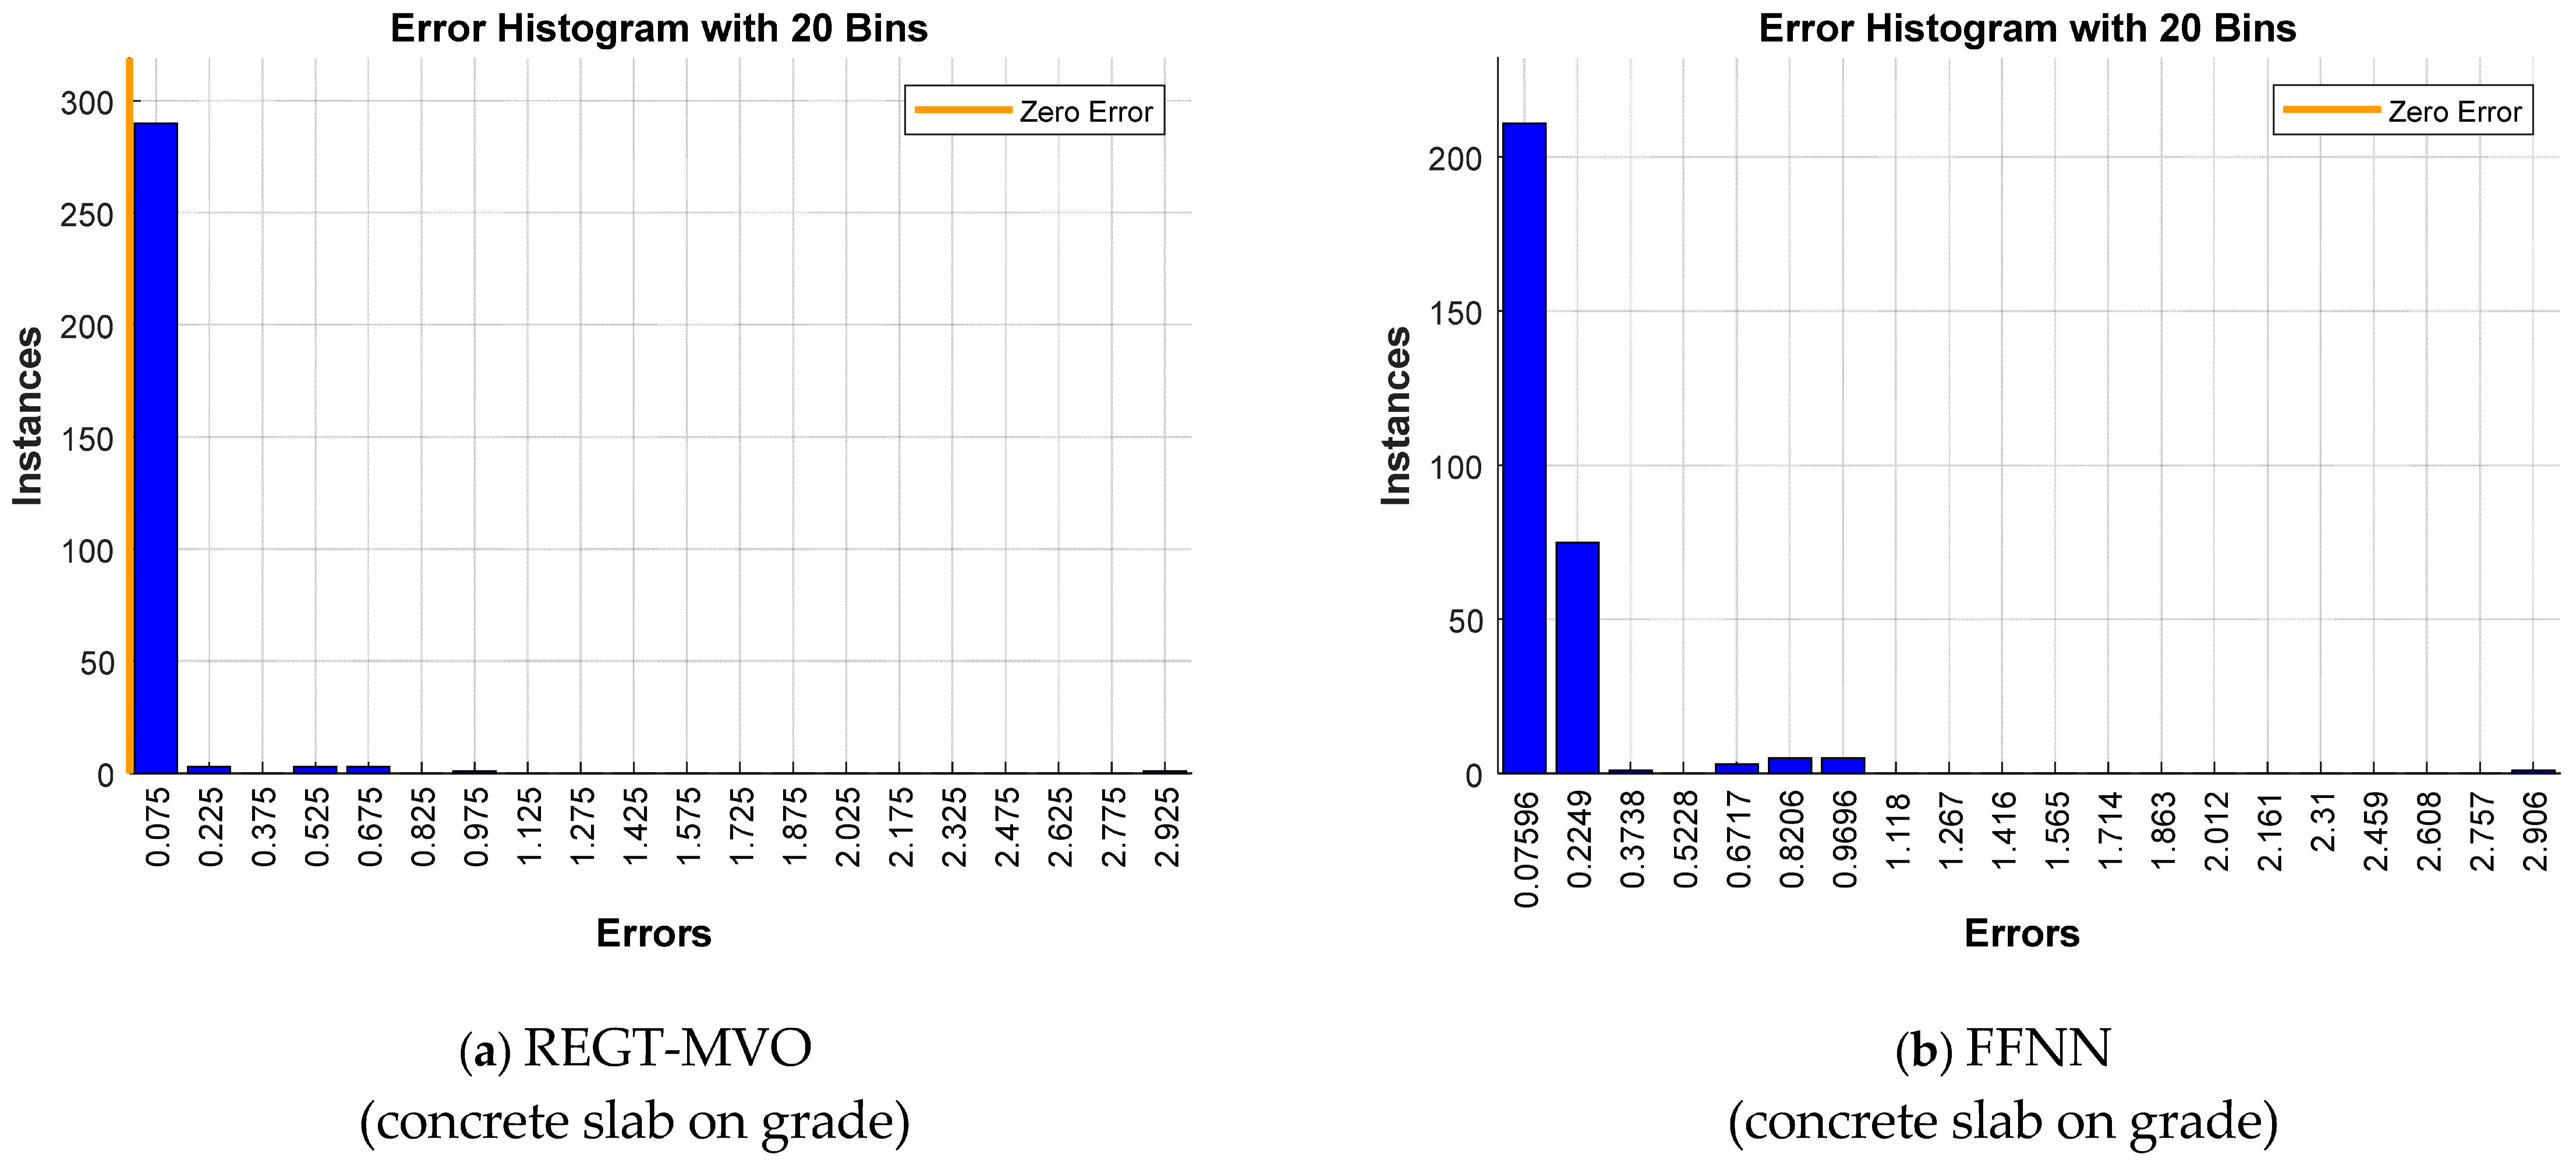
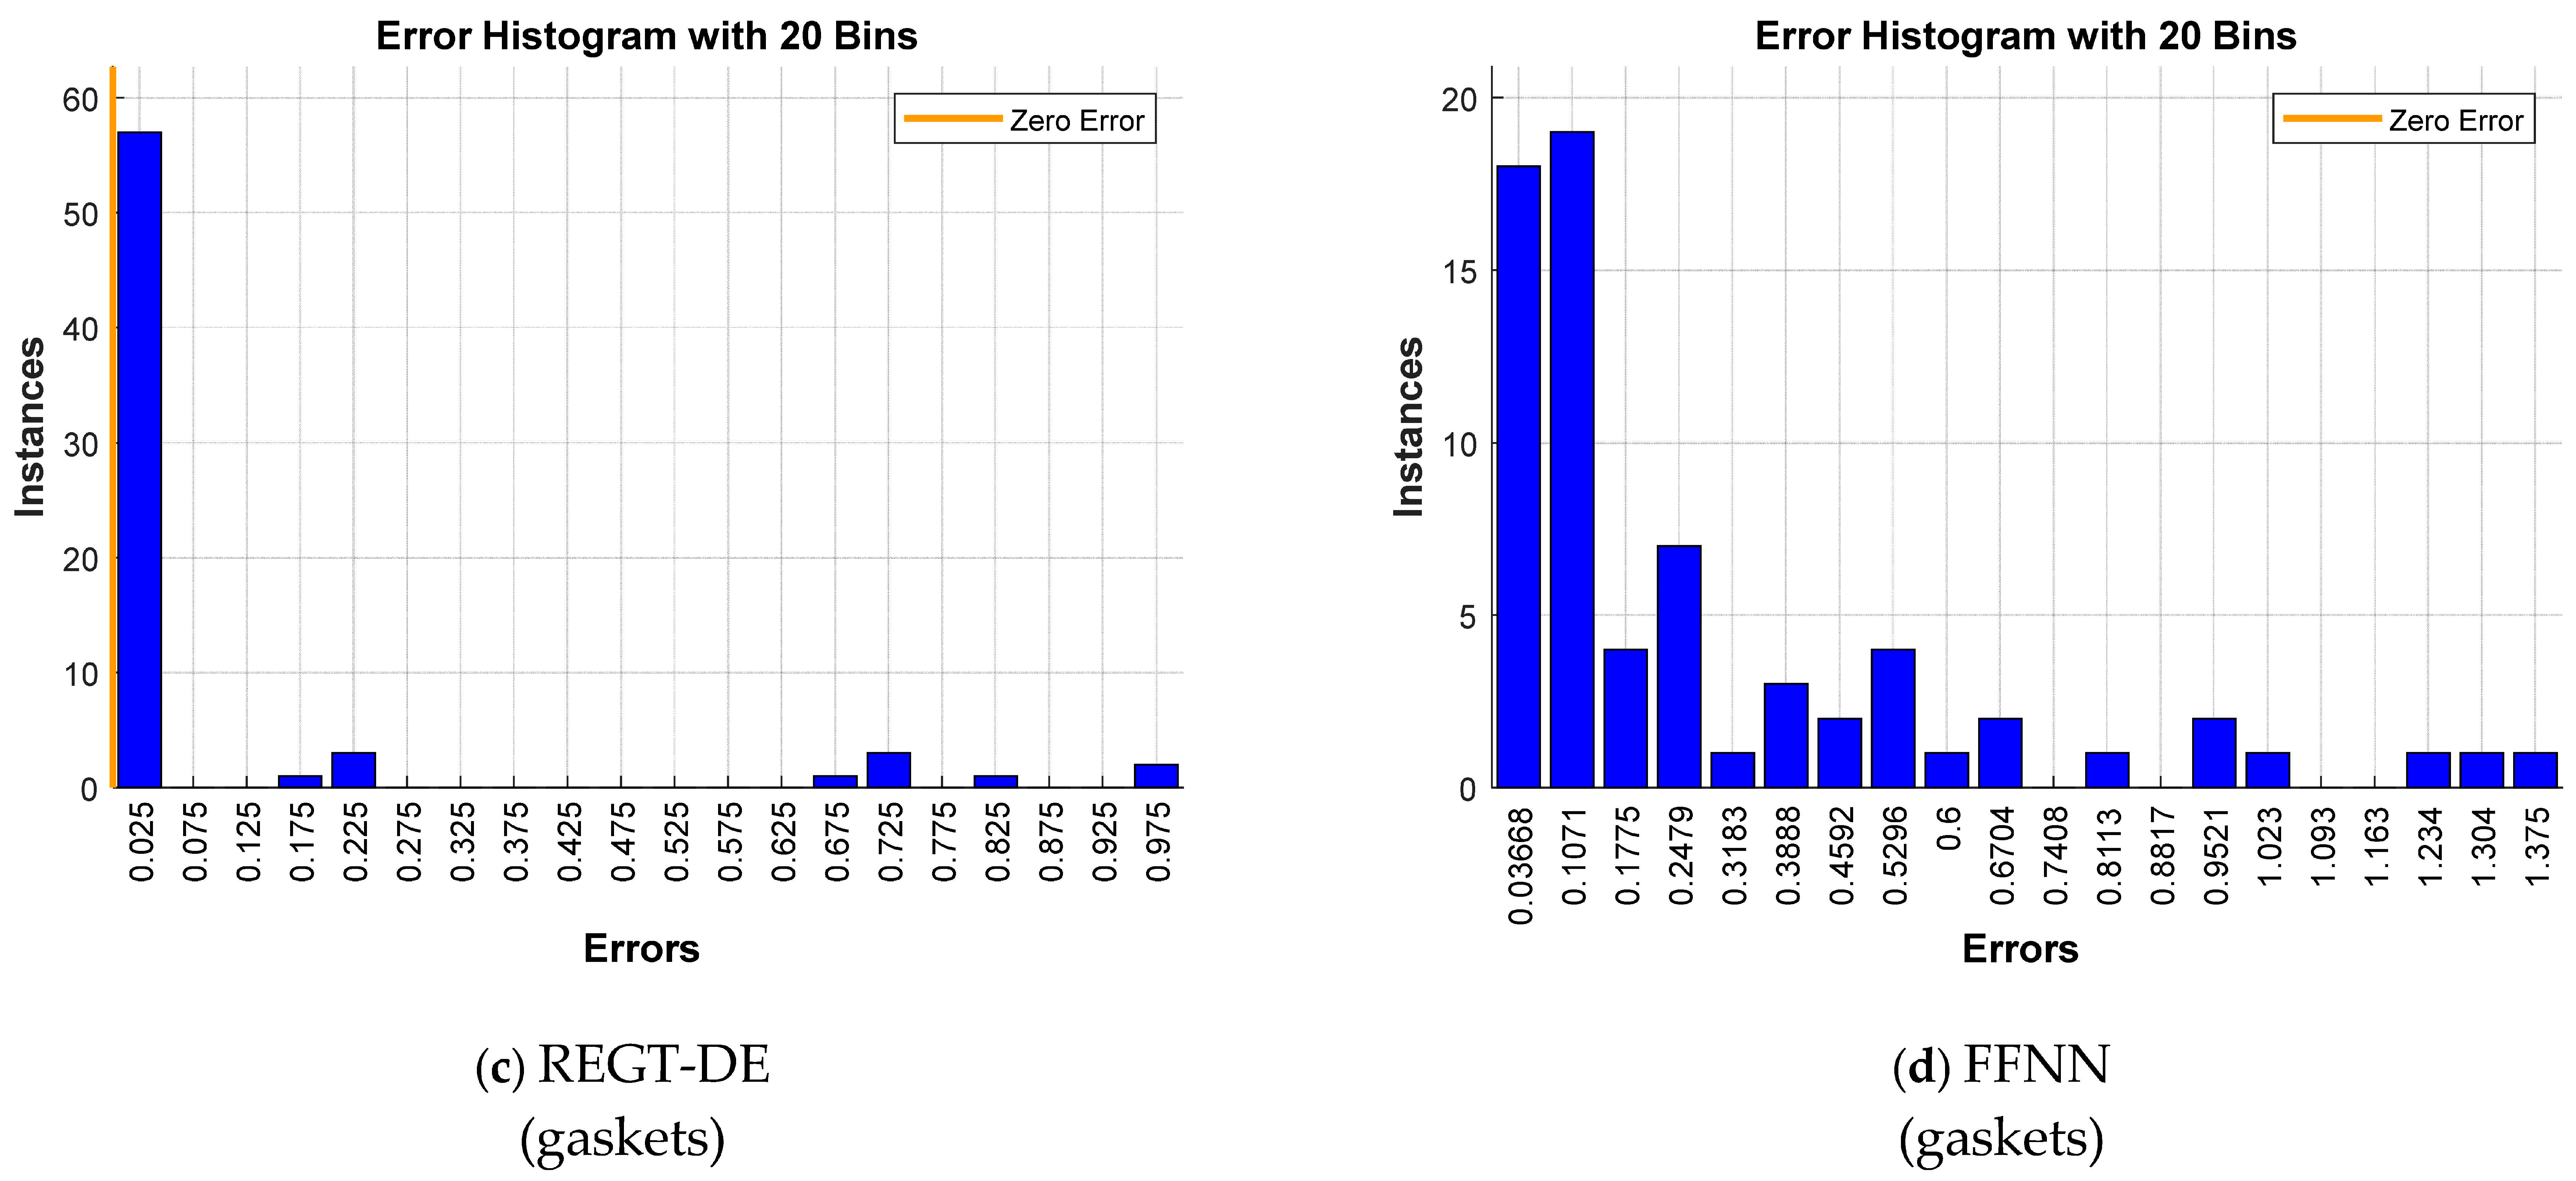
Figure 6a,b exemplify the error distributions of REGT-MVO and FFNN in concrete slab on grade. It is conceived that 91% of the error values of REGT-MVO are smaller than 0.075. Moreover, the most repeated error values of FFNN are 0.07596 and 0.2249. The error distributions of REGT-DE and FFNN can be seen in Figure 6c,d (gaskets). It can be viewed that the most common error value of REGT-DE is 0.025, while the error values of FFNN generally span from 0.03668 to 0.6704.

5.4. Performance Evaluation Metrics

Table 3 depicts the results of the deterioration models of cast-in-place concrete tunnel liners and concrete cross passageways. In cast-in-place concrete tunnel lines, it is shown that REGT-MTBO is the best predictive model (MAE = 0.037, MAPE = 1.893%, RMSPE = 10.027%, RMSE-0.192, NRMSE = 0.203, and U95 = 0.57). It is also shown that REGT-MVO has the second lowest MAE (0.038), MAPE (2.209%), and RMSE (0.195). In the same vein, REGT-WOA achieved the second lowest values of RSMPE (10.948%) and U95 (0.572). Out of all models, SVM produced the highest MAE (0.194), MAPE (15.763%), RMSE (0.44), and U95 (0.972). As for concrete cross passageways, it is observed that the REGT-MVO provides the best performance with MAE, MAPE, RMSPE, RMSE, NRMSE, and U95 of 0.149, 10.173%, 26.077%, 0.386, 0.268 and 1, respectively. In addition, REGT-TLBO comes in the second place attaining the second lowest values of MAE (0.189), MAPE (13.528%), and RMSE (0.435). On the other hand, CNN achieved the lowest accuracies with MAE, MAPE, RMSPE, RMSE, NRMSE and U95 values of 0.534, 43.865%, 52.017%, 0.731, 0.467, and 1.585, respectively.
The results of the deterioration models of concrete interior walls and concrete portals are summarized in Table 4. In concrete interior walls, it is noted that REGT-DA provides the highest prediction accuracies (MAE = 0.092, MAPE = 5.604%, RMSPE = 17.507%, RMSE = 0.303, NRMSE = 0.301, and U95 = 0.867). In contrast, SVM performed poorly with MAE, MAPE, RMSPE, RMSE, NRMSE and U95 values of 0.234, 18.495%, 23.923%, 0.484, 0.349, and 1.126, respectively. In relation to concrete portals, the results clarify that REGT-MVO and REGT-MTBO exhibit a better performance than the remaining models (MAE = 0.02, MAPE = 1.151%, RMSPE = 8.374%, RMSE = 0.14, NRMSE = 0.134, and U95 = 0.393). On the other hand, SVM is the least effective model such that it exhibited MAE, MAPE, RMPSE, RMSE, NRMSE, and U95 values of 0.196, 16.261%, 17.464%, 0.443, 0.264, and 0.96, respectively.
Table 5 reports the prediction results of the deterioration models of concrete slab on grade and gaskets. For concrete slab on grade, it is shown that REGT-MVO has the highest level of prediction accuracy (MAE = 0.028, MAPE = 1.587%, RMSPE = 9.308%, RMSE = 0.167, NRMSE = 0.193, and U95 = 0.513). Nonetheless, SVM results in the highest prediction error (MAE = 0.165, MAPE = 14.335%, RMSPE = 15.443%, RMSE = 0.406, NRMSE = 0.241, and U95 = 0.881). A similar evaluation was developed for the deterioration models of gaskets. It is revealed that the smallest values of MAE (0.097), MAPE (8.031%), RMSPE (23.361%), RMSE (0.311), NRMSE (0.225), and U95 (0.785) are associated with REGT-DE, thus signifying its high predictive capabilities. Conversely, SVM yields the weakest prediction performance such that it attains the highest MAE (0.353), highest MAPE (28.804%), second highest RMSPE (31.711%), highest RMSE (0.594), fifth highest NRMSE (0.343), and second highest U95 (1.238).
Table 6 records the OBJ values of the deterioration models of cast-in-place concrete tunnel liners and concrete cross passageways. For cast-in-place concrete tunnel liners, it is determined that REGT-MTBO is the best fitted model since it has the lowest OBJ value (0.0326). It is followed by REGT-MVO, REGT-WOA, and REGT-DE with OBJ values of 0.037, 0.0374, and 0.04, respectively. As for concrete cross passageways, it is manifested that REGT-MVO outclasses other deterioration models, whereas it achieves the smallest OBJ value (0.1264). In addition to that, REGT-PSO and REGT-TLBO induce the second (0.1872) and third (0.2001) highest values of OBJ. Table 7 illustrates the results of concrete interior wall and concrete portals. According to the OBJ values of concrete interior walls, REGT-MVO is deemed the best prediction model followed by REGT-RTH, REGT-TLBO, and REGT-WOA. Their respective OBJ values are 0.4105, 0.4226, 0.5621, and 0.573, respectively. With regard to concrete portals, it can be seen that REGT-MVO and REGT-MTBO have the smallest OBJ values (0.0154), and hence, they outperform the remainder of the deterioration models. Table 8 explicates the OBJ values of deterioration models of concrete slab on grade and gaskets. Concerning concrete slab on grade, it is found that REGT-PSO exhibits superior performance, whereas its OBJ value (0.0331) is the smallest among the investigated machine learning models. However, CNN (1.4635), GRNN (5.3867), and FFNN (7.7609) have the highest OBJ values, demonstrating their incapabilities of anticipating the condition of concrete slab on grade. With respect to gaskets, it is noticed that REGT-DE exhibits the smallest OBJ value (0.0899) and hence, it is the best model from this standpoint.

5.5. Visual Illustrations

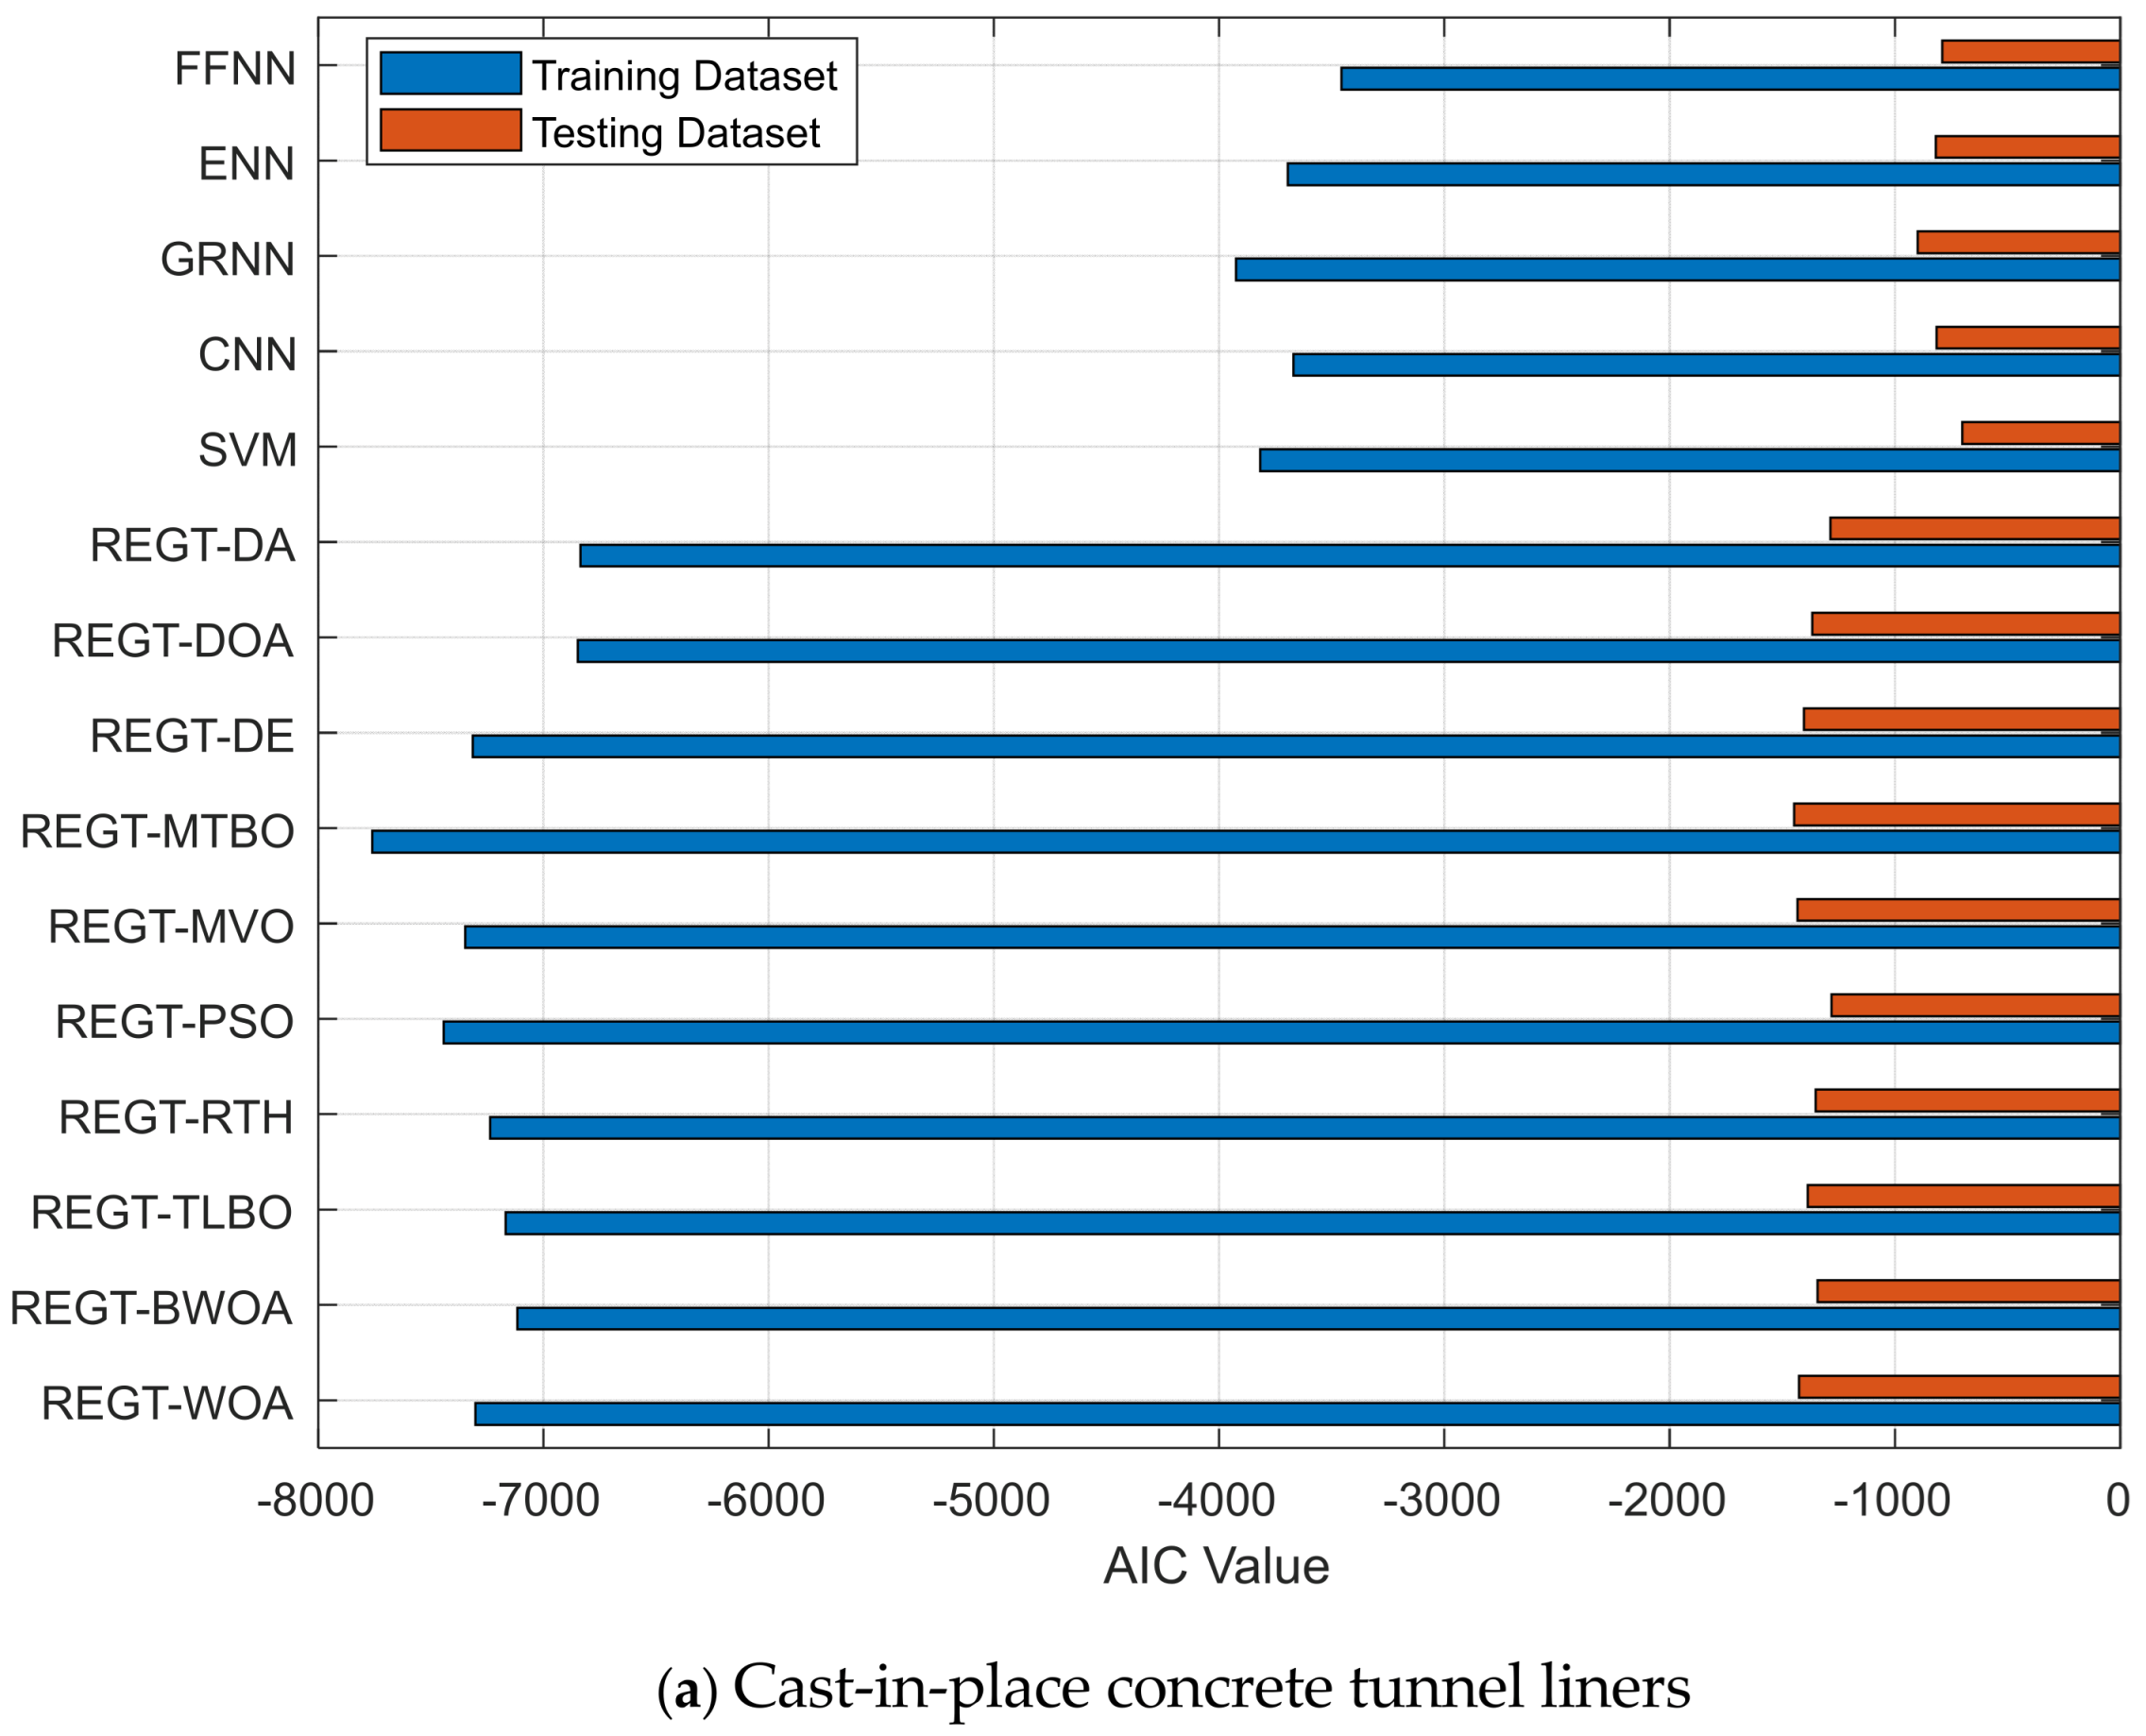
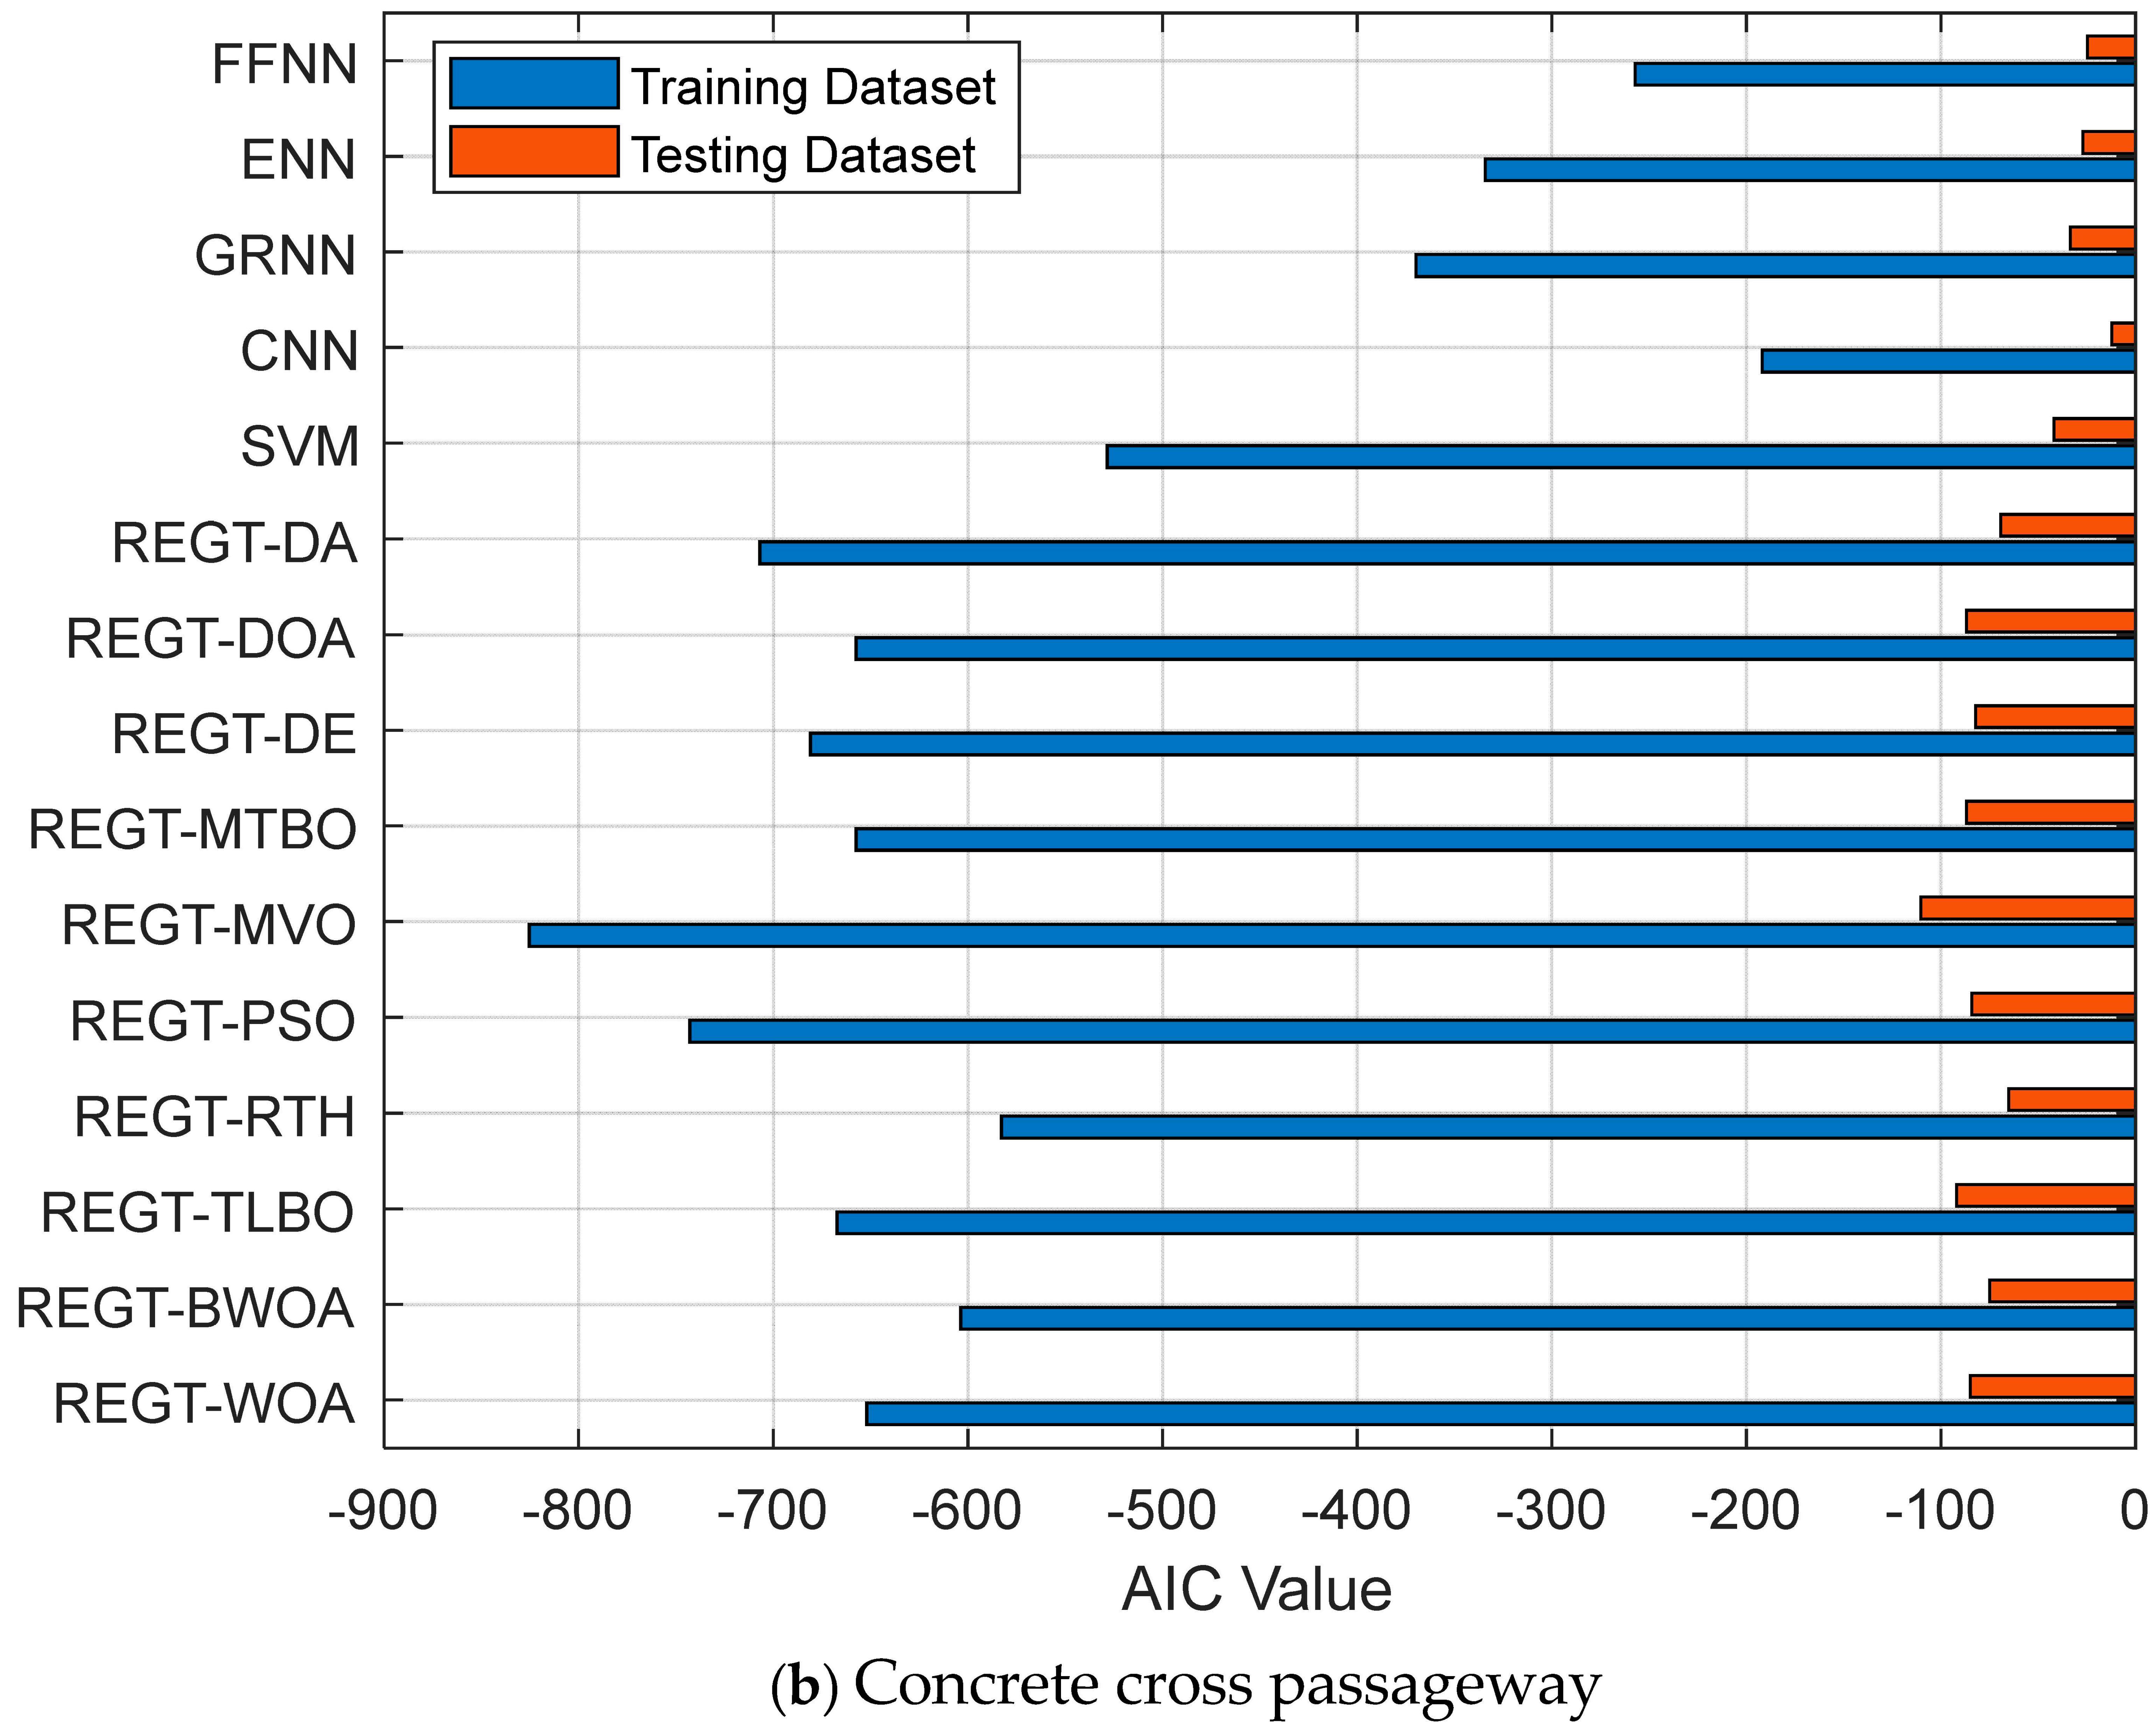
Figure 7a demonstrates the AIC values of the deterioration models of cast-in-place concrete tunnel liners. REGT-MTBO exhibits the smallest AIC values in the training (−7759.63) and testing phases (−1447.34). Subsequently, it has strong generalization abilities when compared against other deterioration models. In relation to concrete cross passageways, AIC values of training and testing phases are illustrated in 
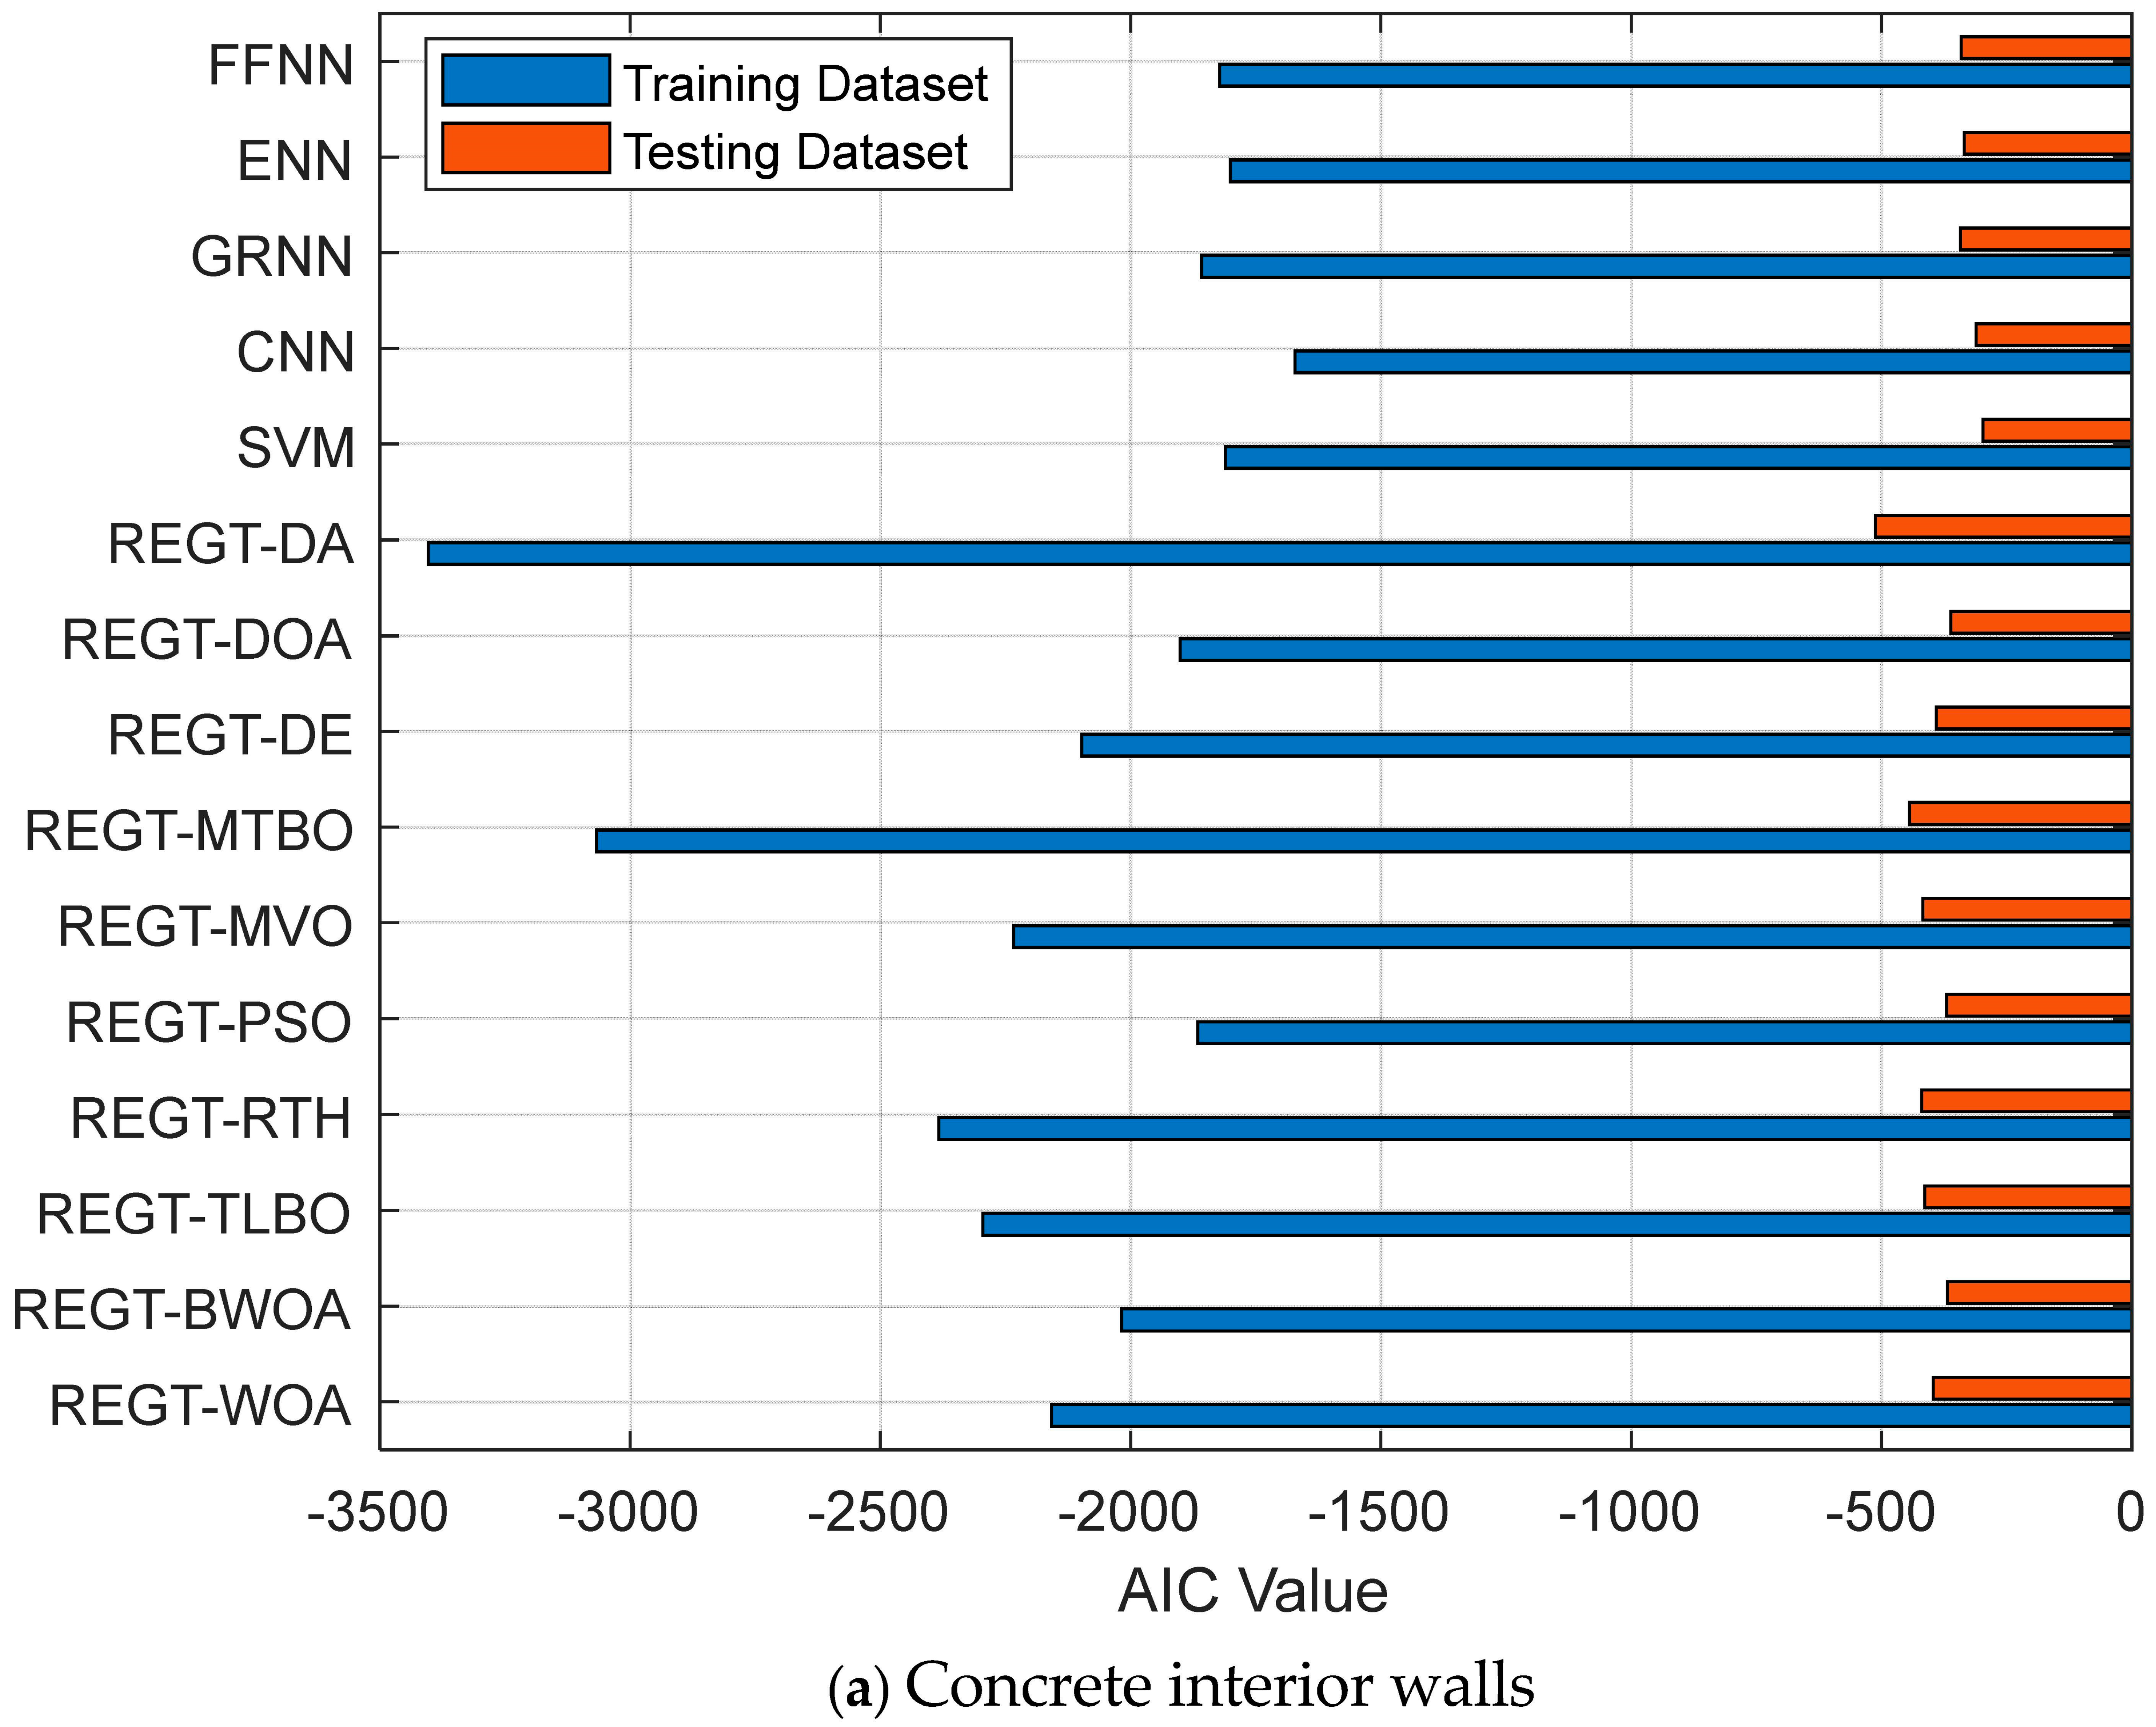
Figure 7b. It is inferred that REGT-MVO attains the lowest AIC values (−825.35 for training and −110.41 for testing) while CNN has the highest values (−191.94 for training and −12.23 for testing). With regard to concrete interior walls, REGT-MTBO (see Figure 8a) is deemed the optimal deterioration model (AIC = −3067.95 for training and AIC = −444.28 for testing) followed by REGT-RTH (AIC = −2383.37 for training and AIC = −420.29 for testing). As for concrete portals (see 
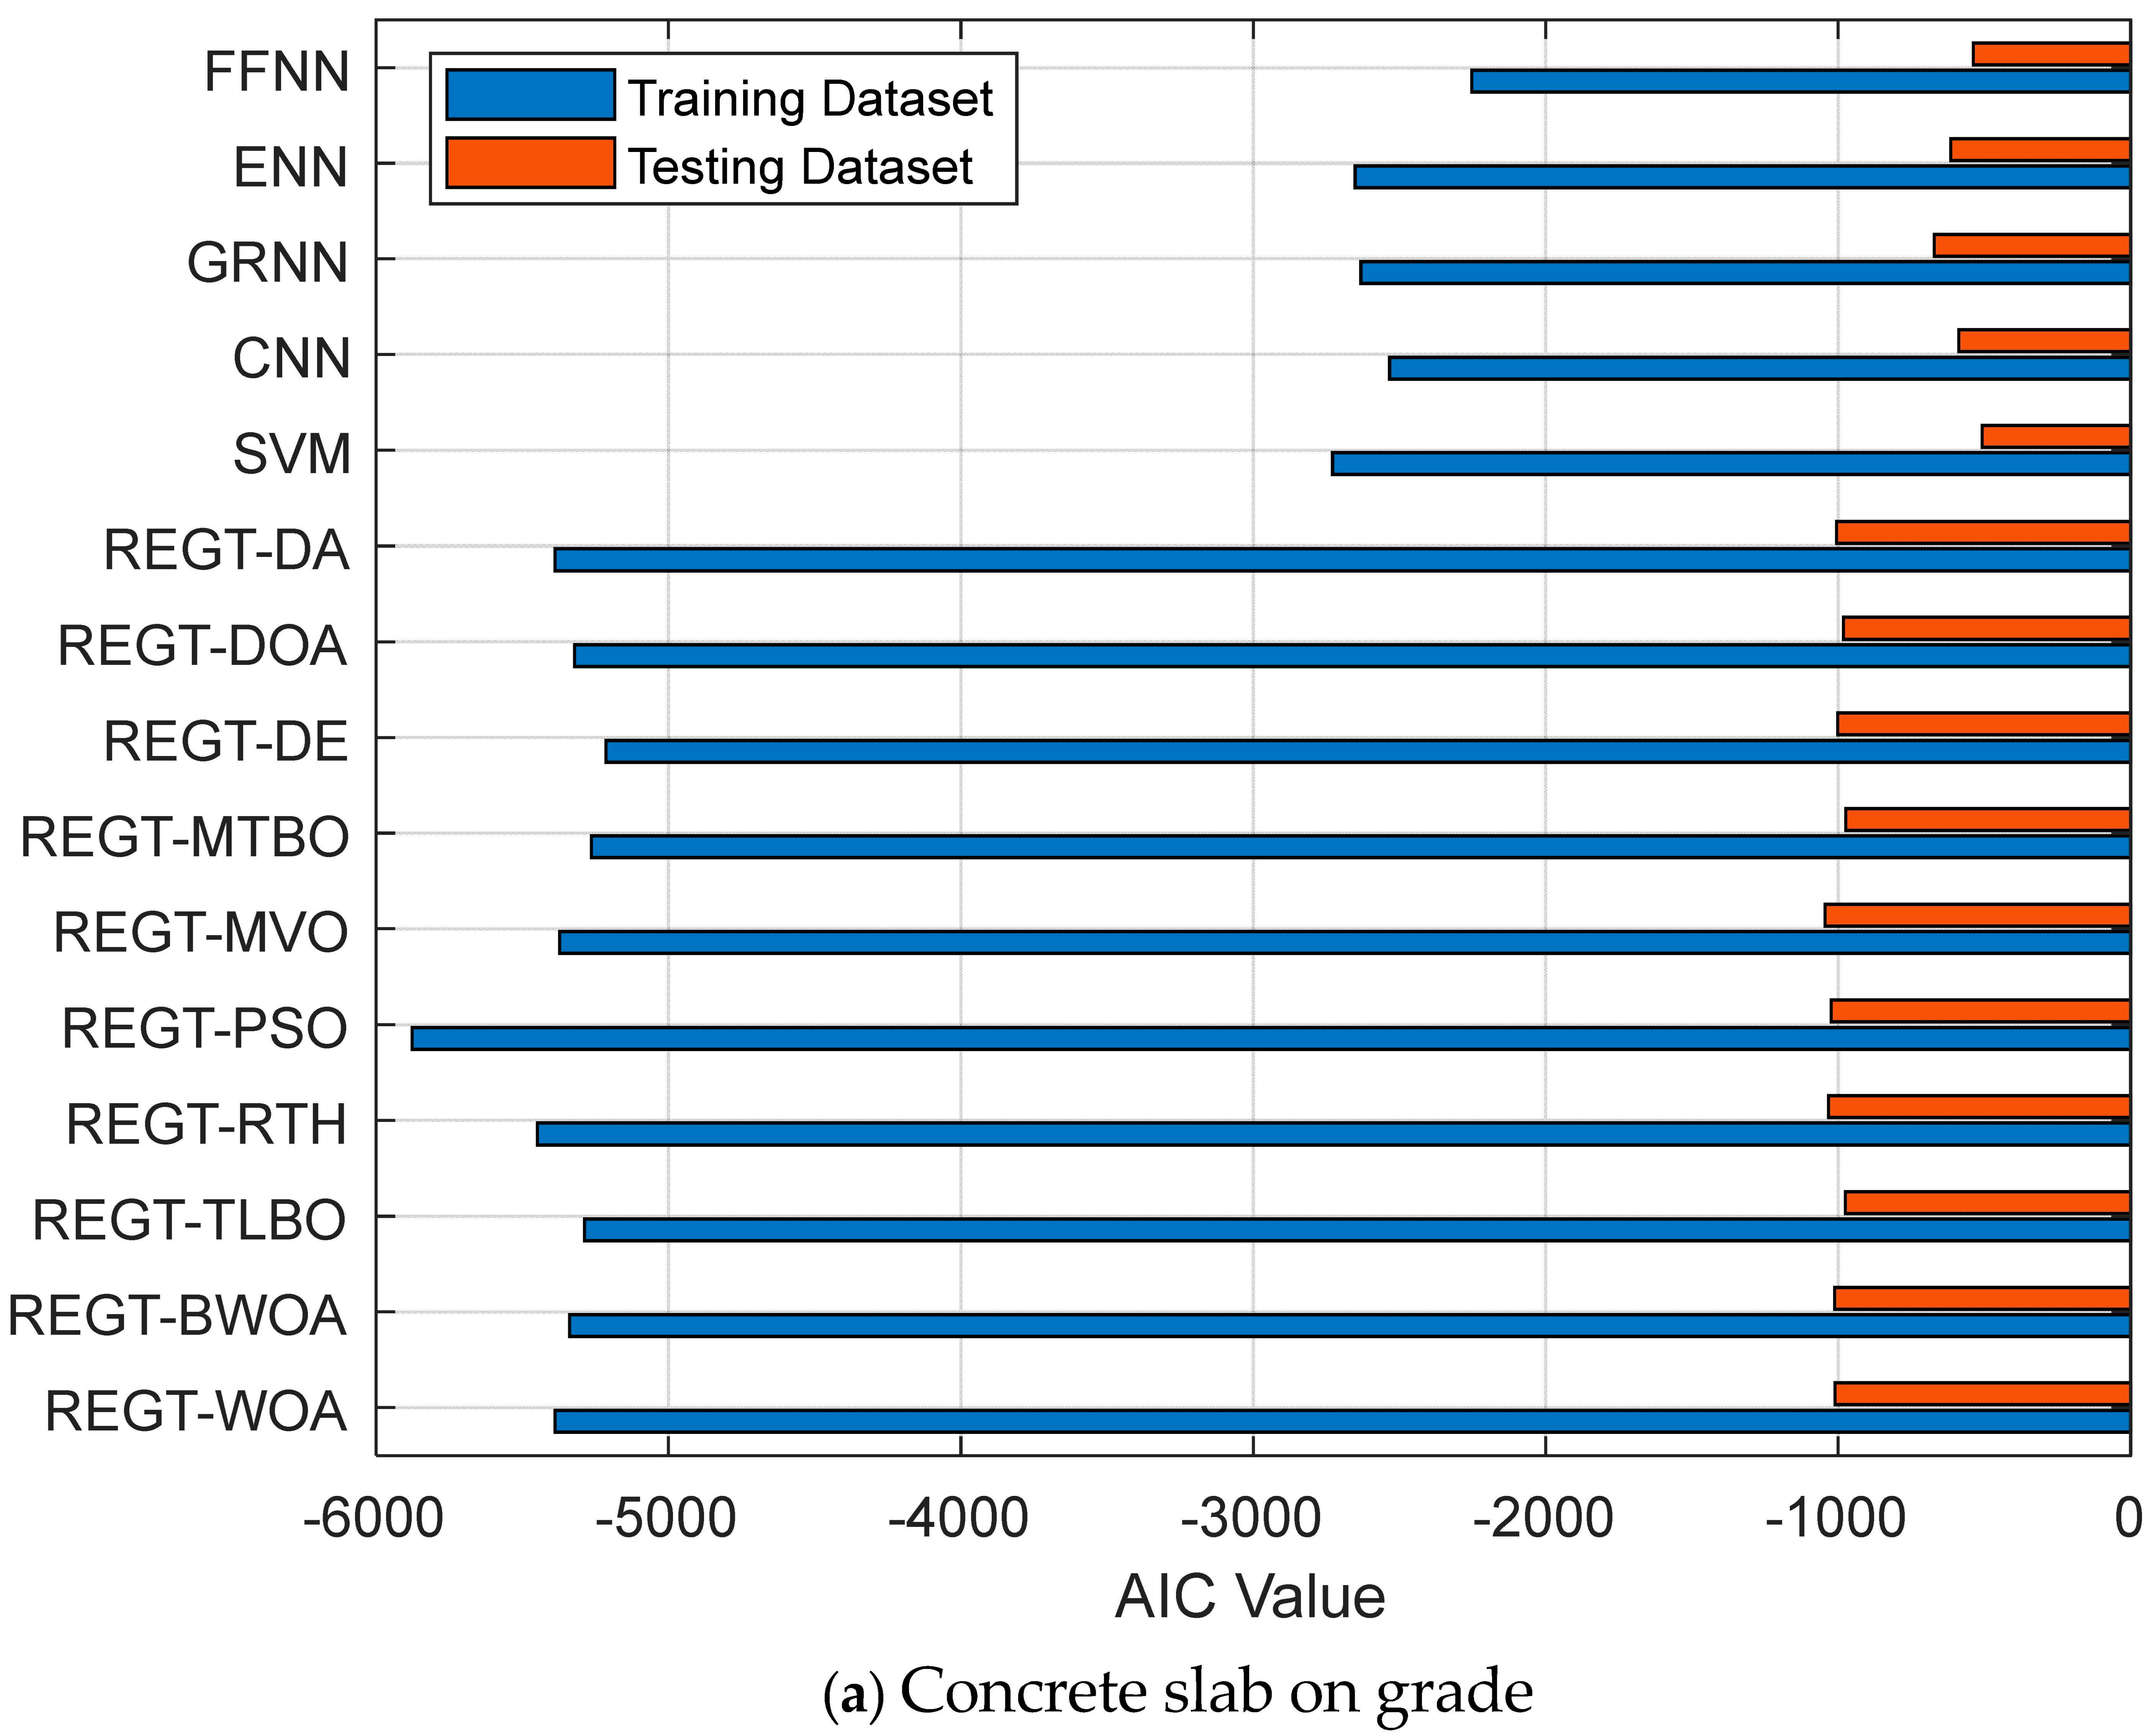
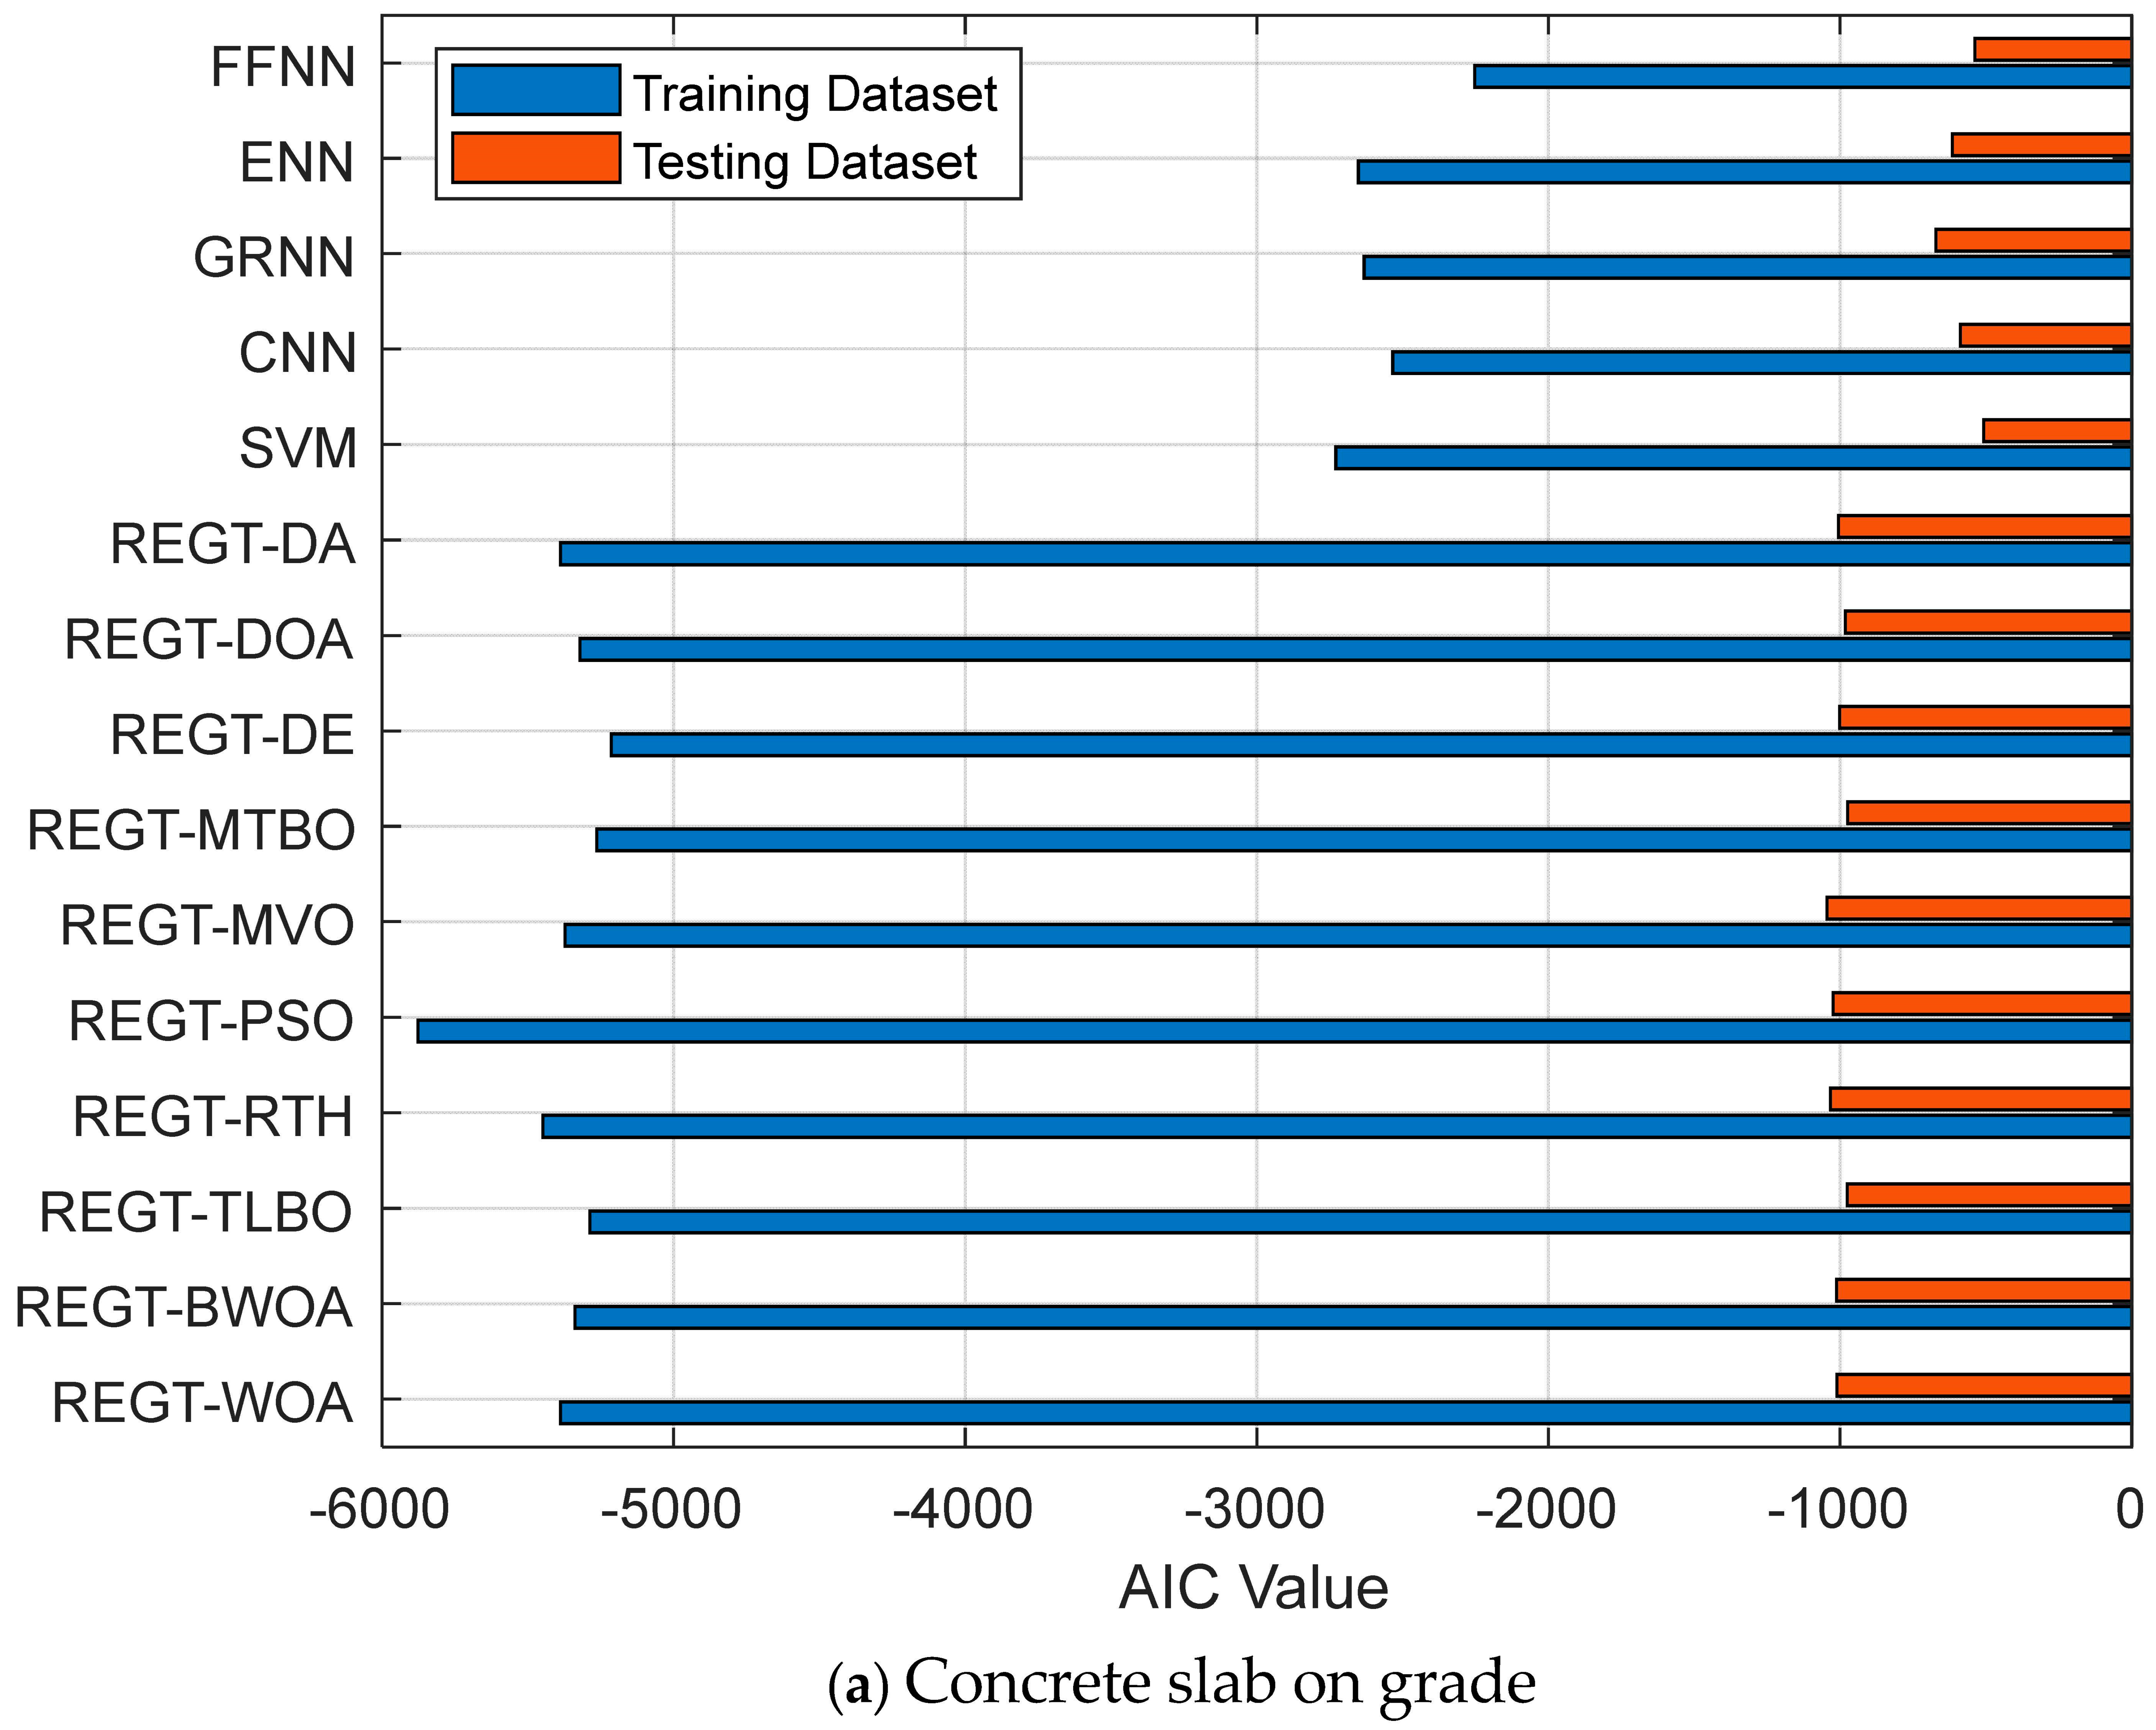
Figure 8b), REGT-WOA obtains the smallest AIC value (−7183.62) in the training phase, while REGT-MVO and REGT-MTBO obtains the smallest AIC value (−1459.85) in the testing phase. In concrete slab on grade (see 
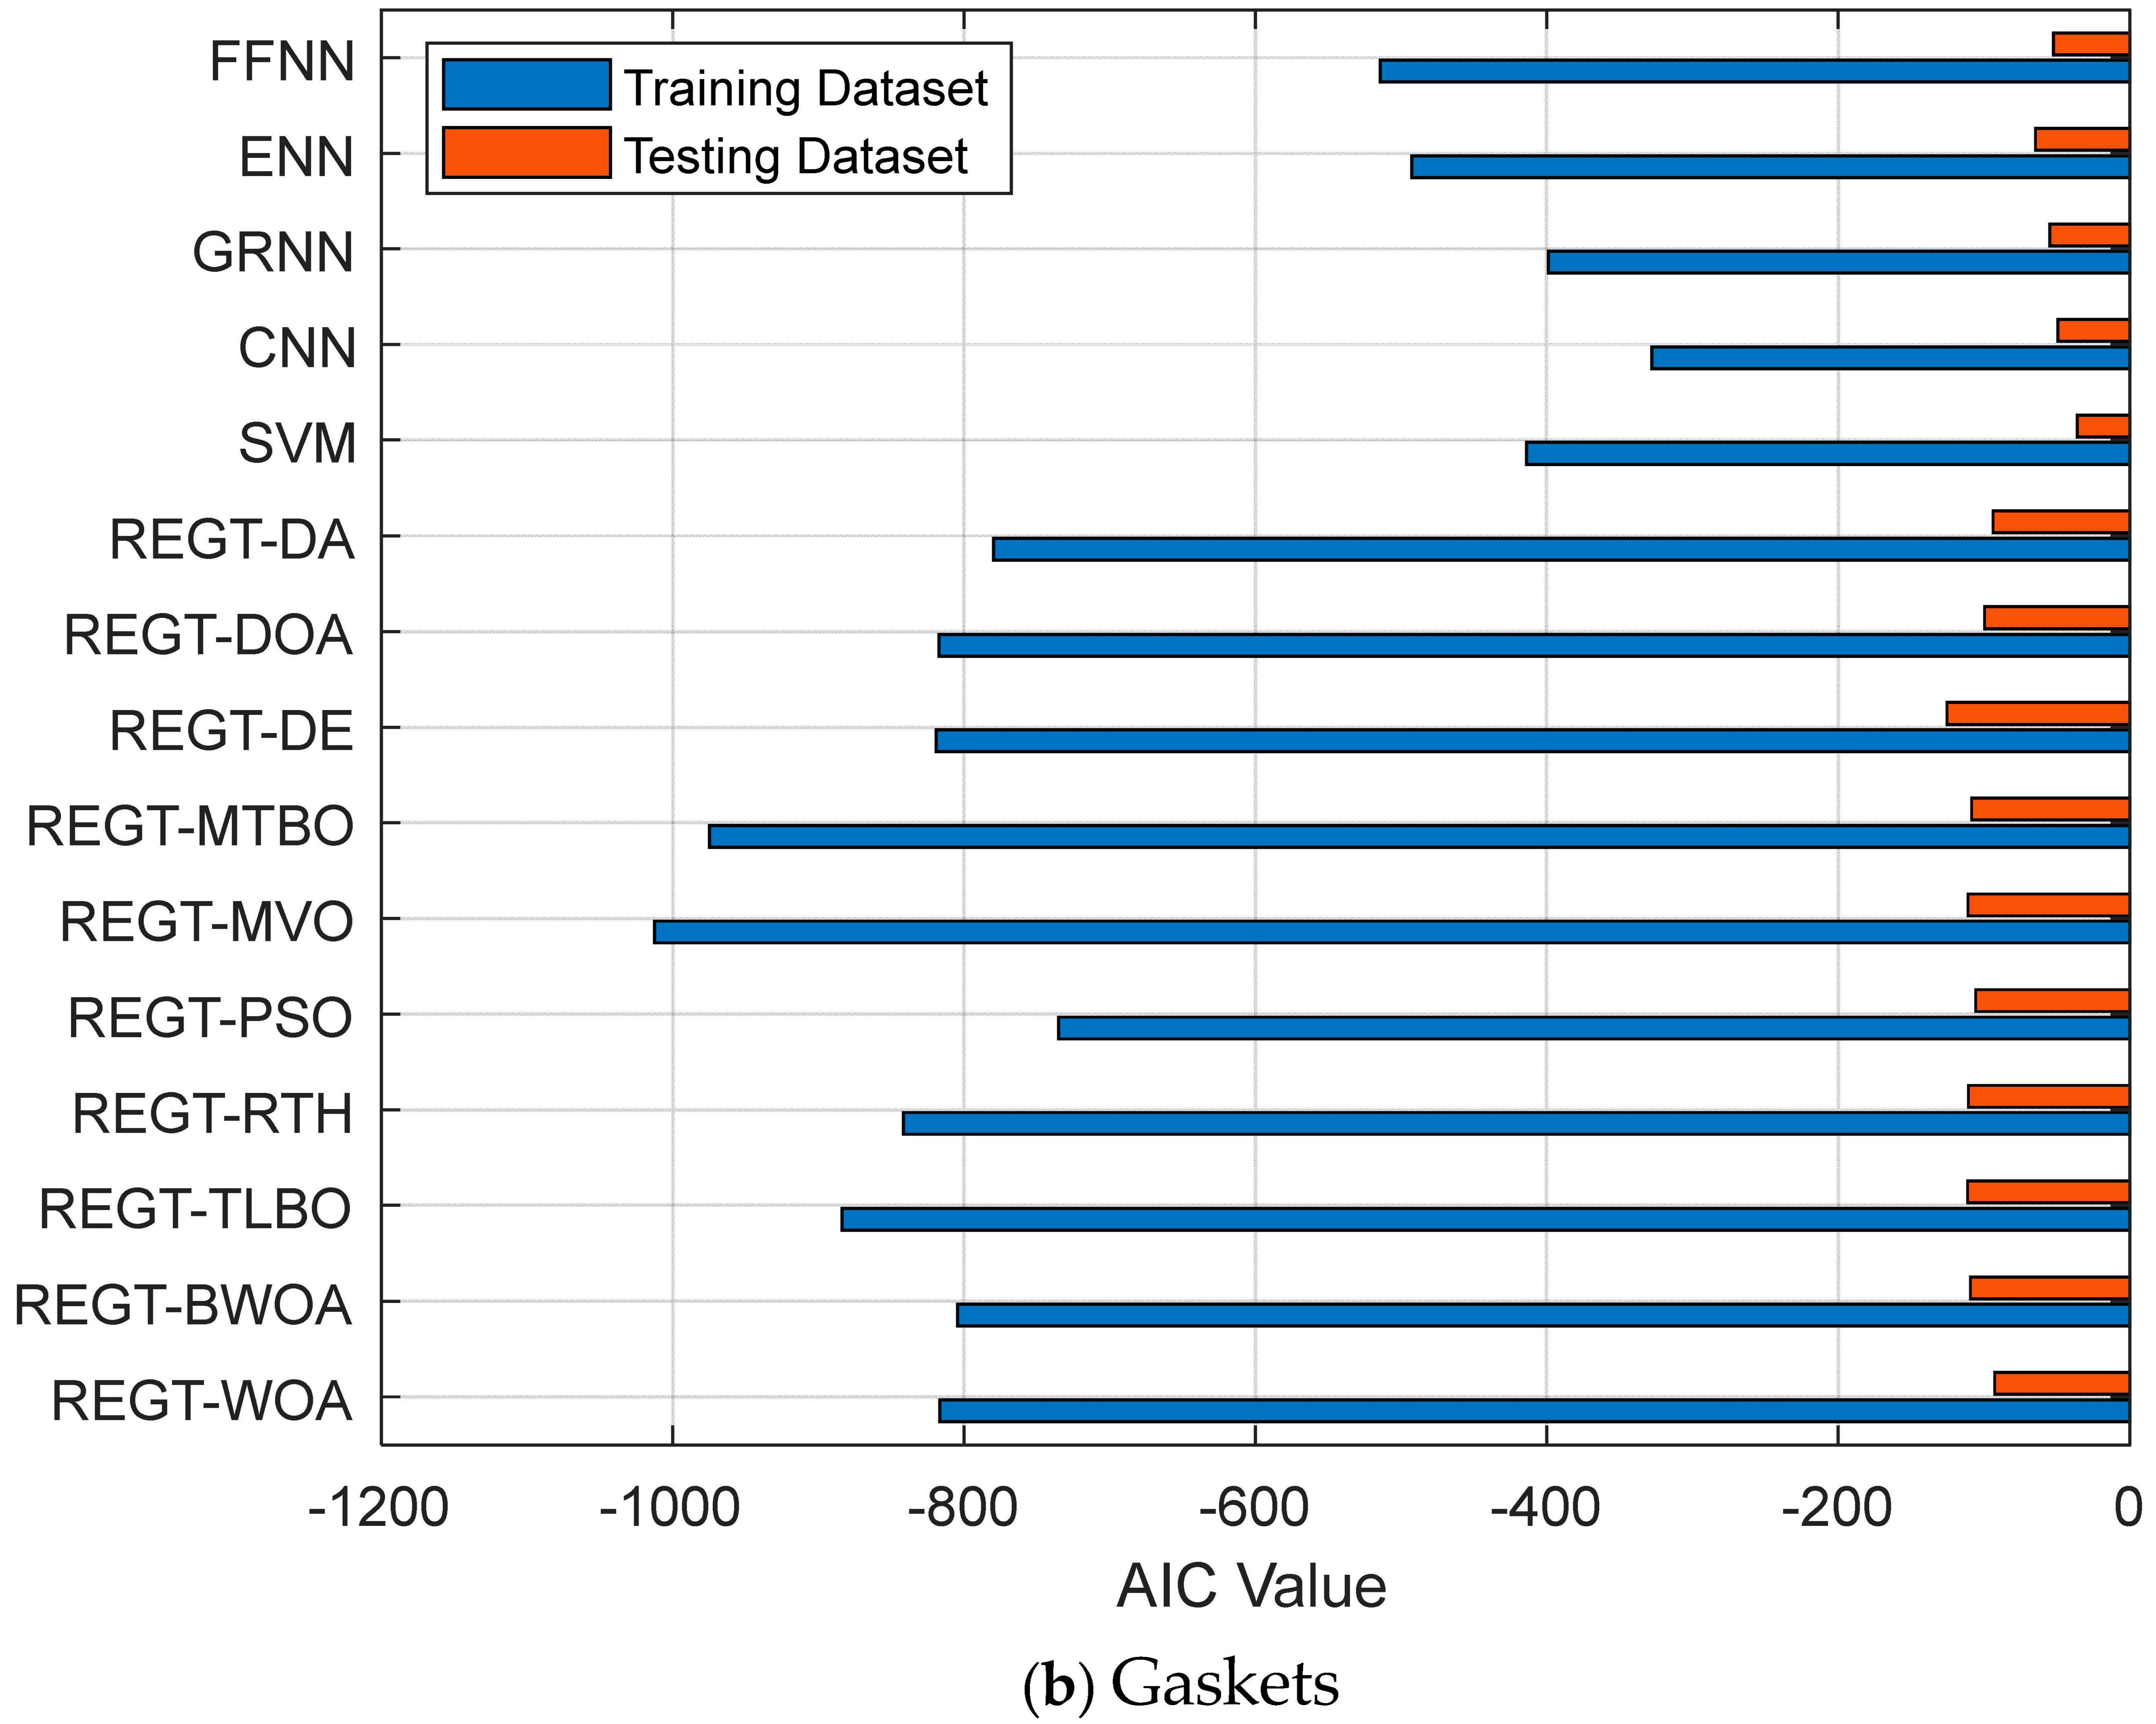
Figure 9a), REGT-PSO yields the lowest AIC value (−5876.69) in the training stage while REGT-MVO yields the smallest AIC value (−1045.22) in the testing stage. With respect to gaskets (see Figure 9b), it is derived that REGT-PSO accomplishes the smallest AIC value (−1012.43) in training, while REGT-TLBO sustains the smallest AIC value (−111.25) in testing.
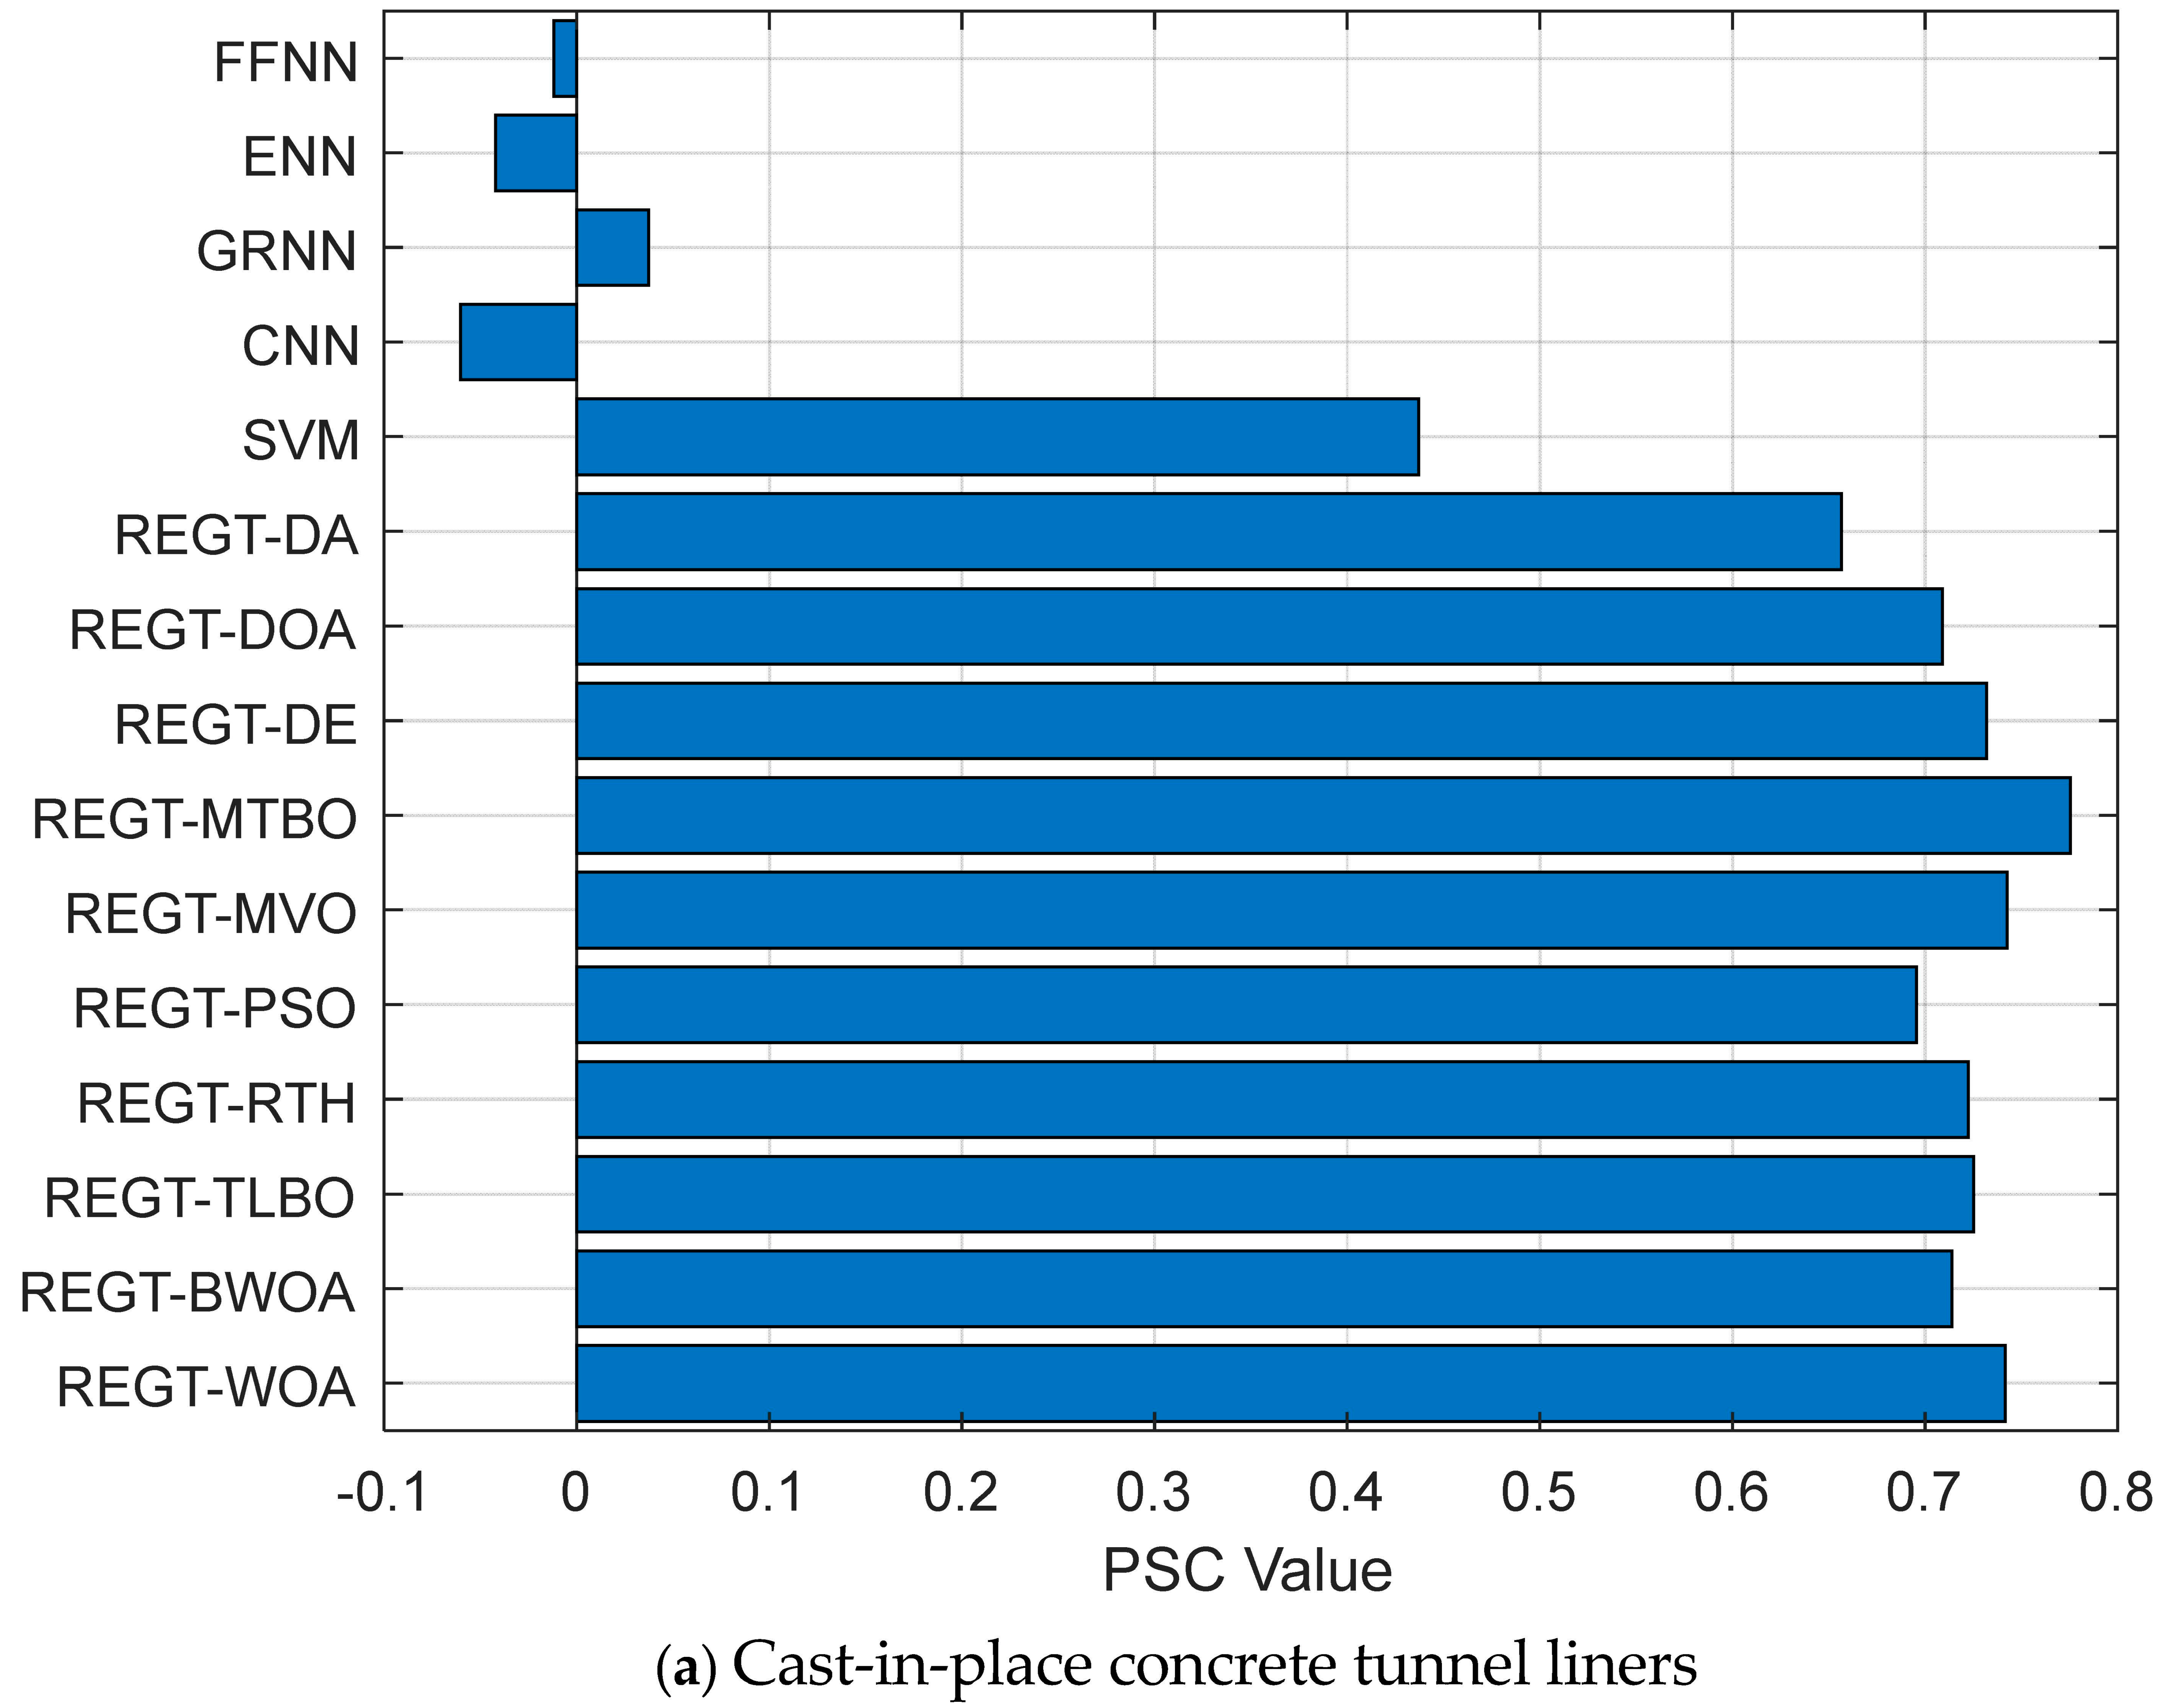
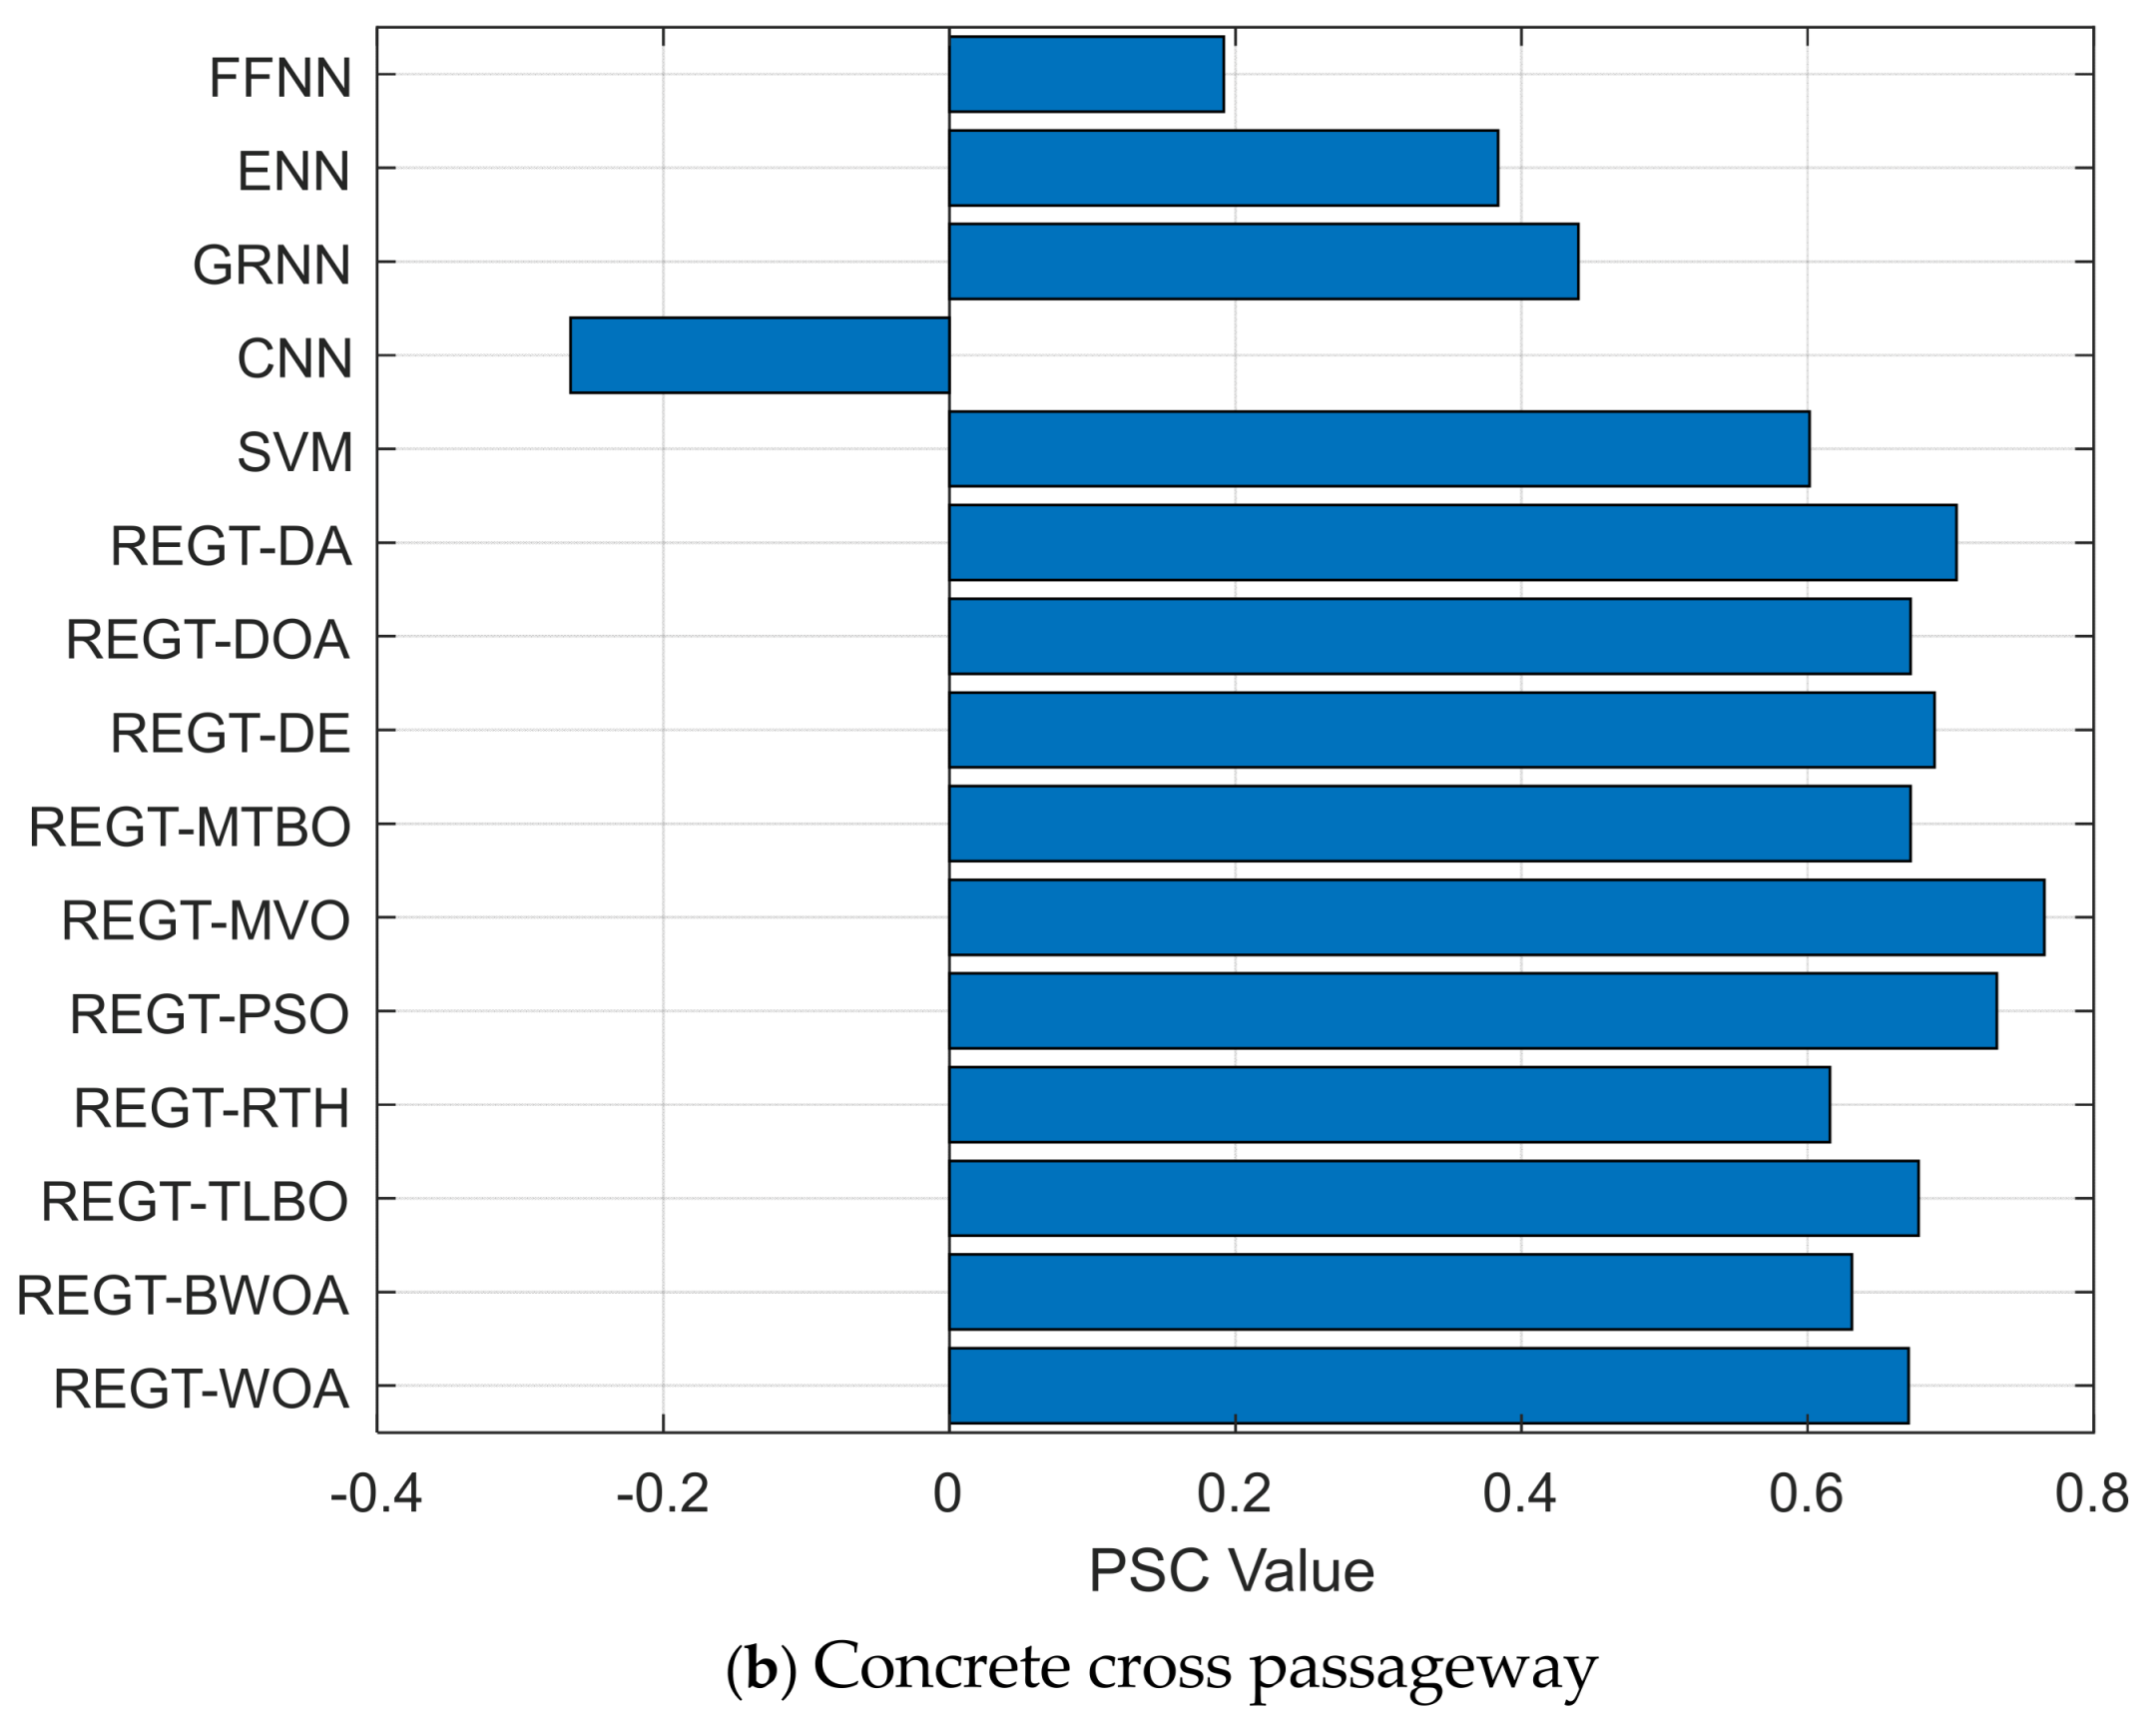
Figure 10a depicts the PSC values of the deterioration models of cast-in-place concrete tunnel liners. The results show that REGT-MTBO has the largest PSC value (0.776) followed by REGT-MVO (0.743) and REGT-WOA (0.742). Consequently, REGT-MTBO is ranked in first position, while REGT-MVO and REGT-WOA come in second and third position, respectively. The concrete cross passageway results can be viewed in 
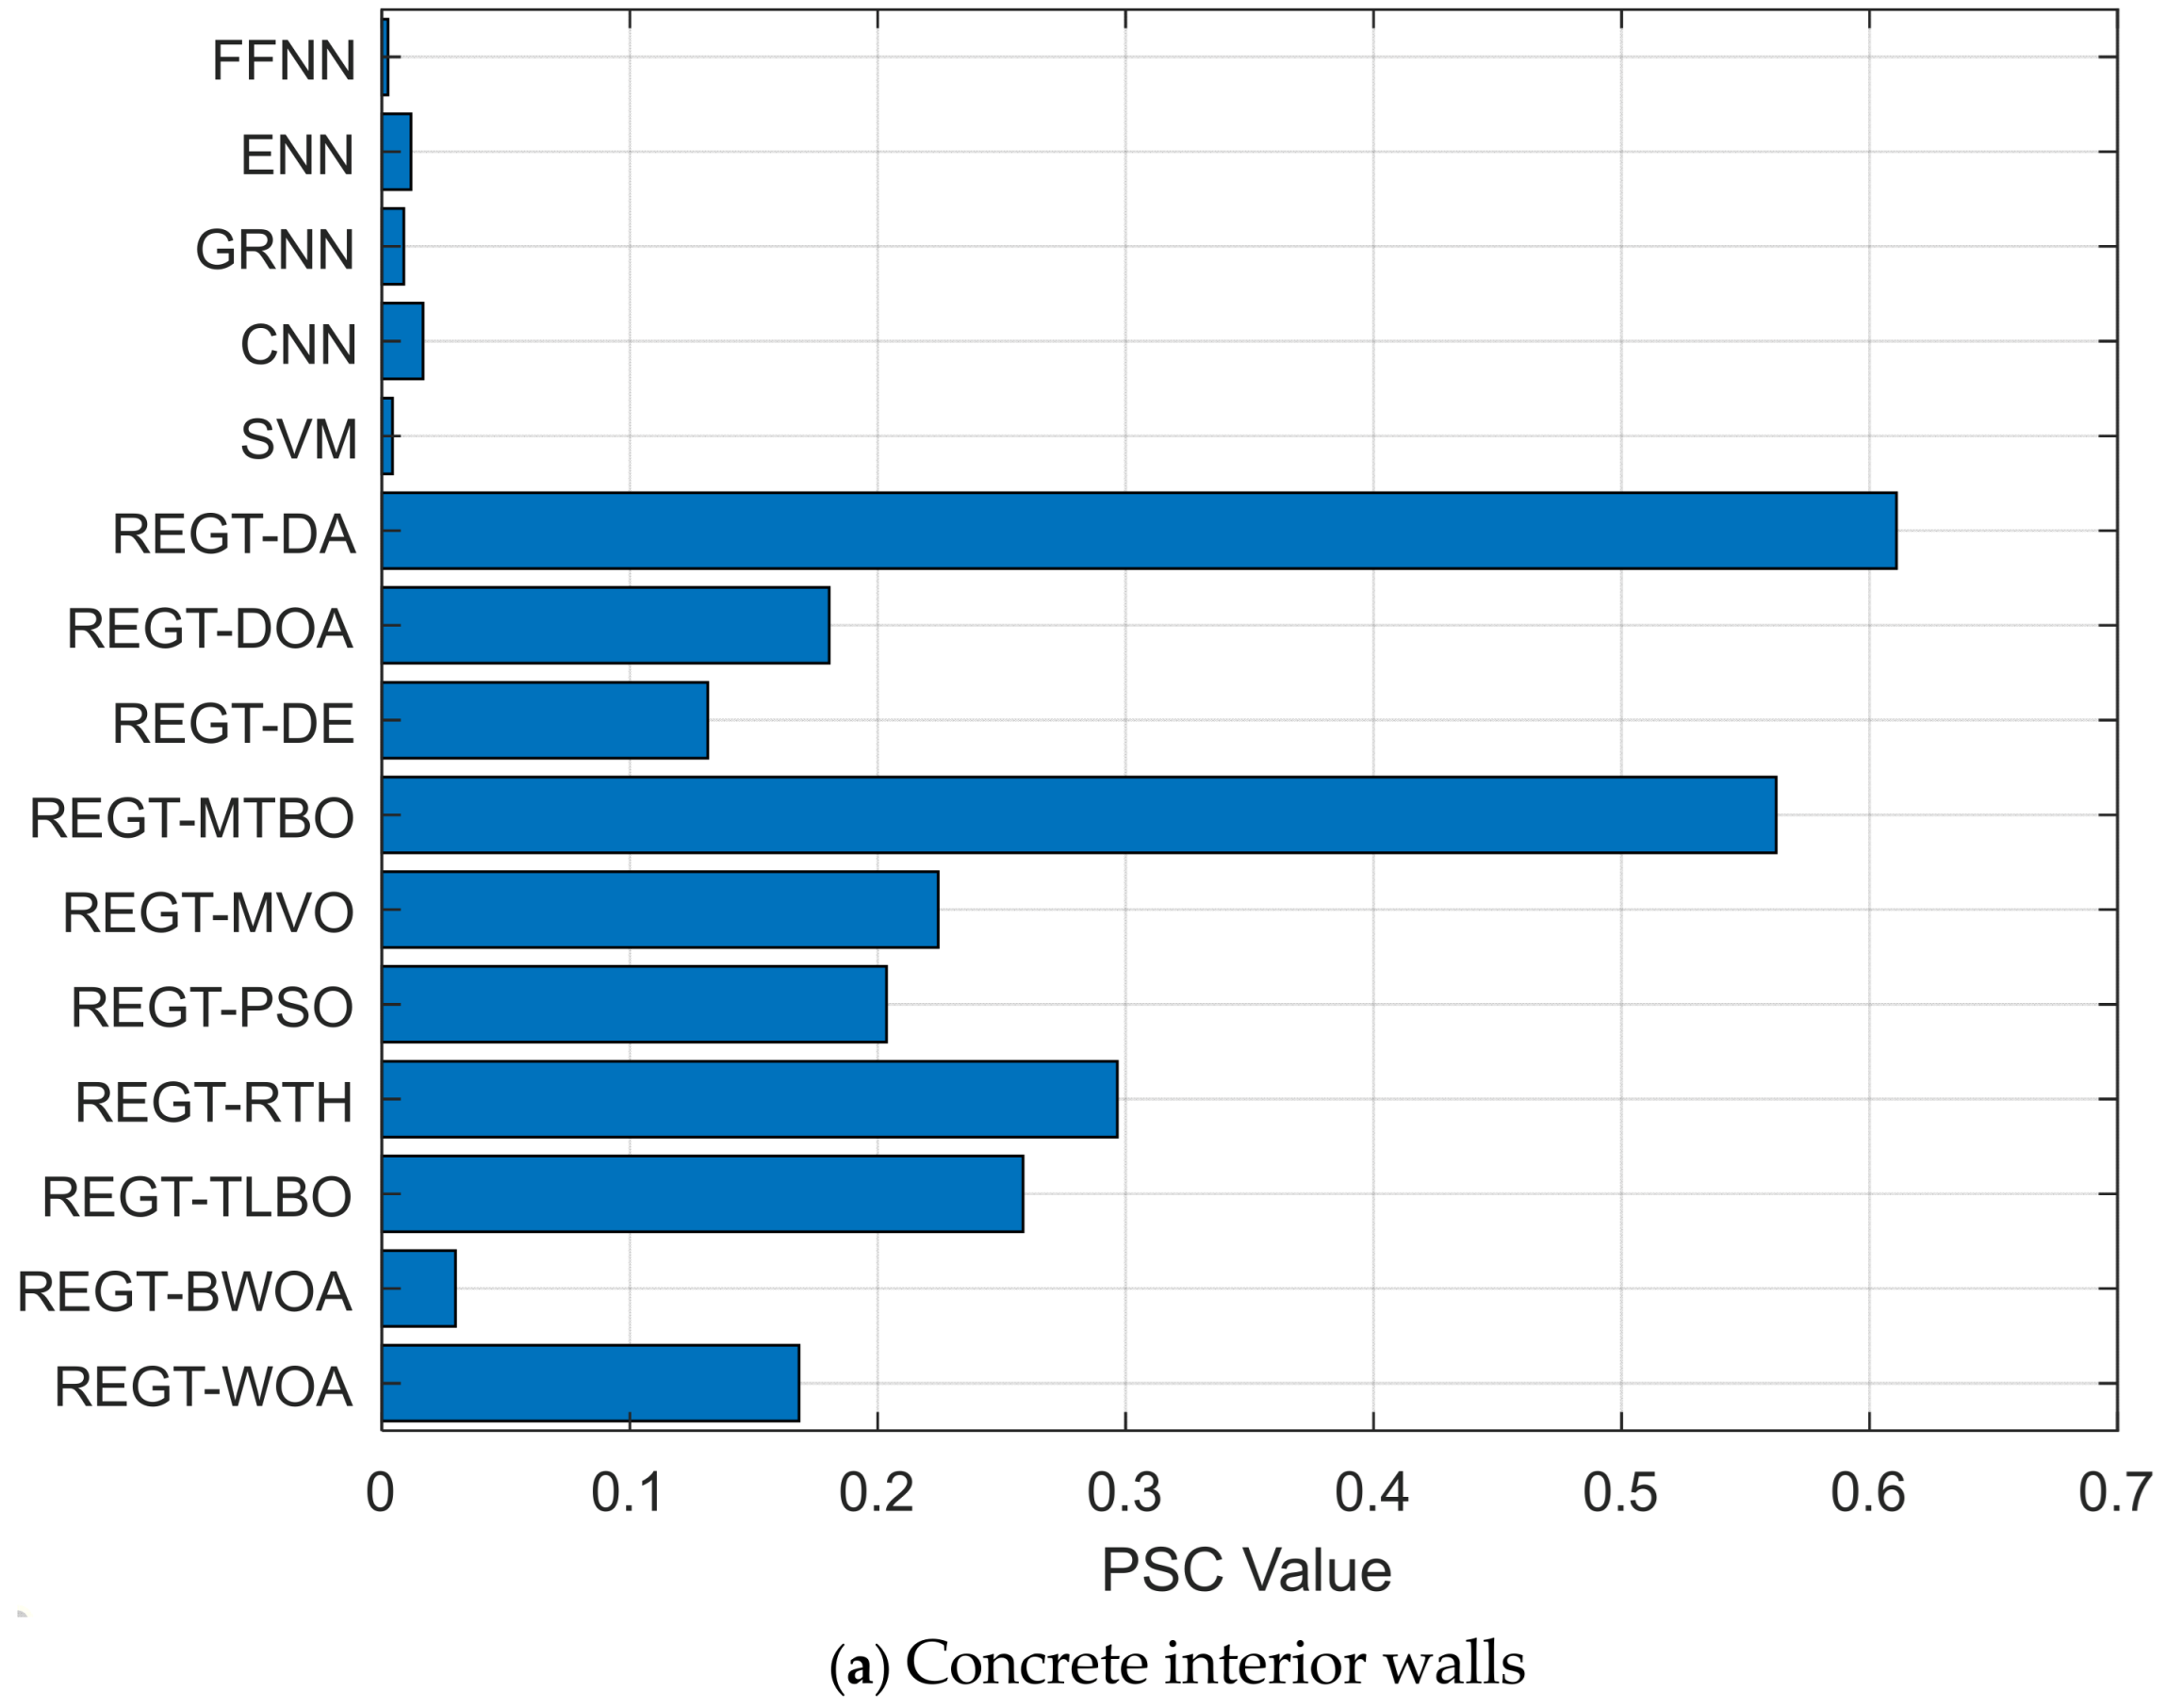
Figure 10b. It can be observed that REGT-MVO is the superior deterioration model with the highest PSC value (0.766). On the contrary, CNN (−0.265) and FFNN (0.192) produce the smallest PSC values. The details of the concrete interior walls are listed in 
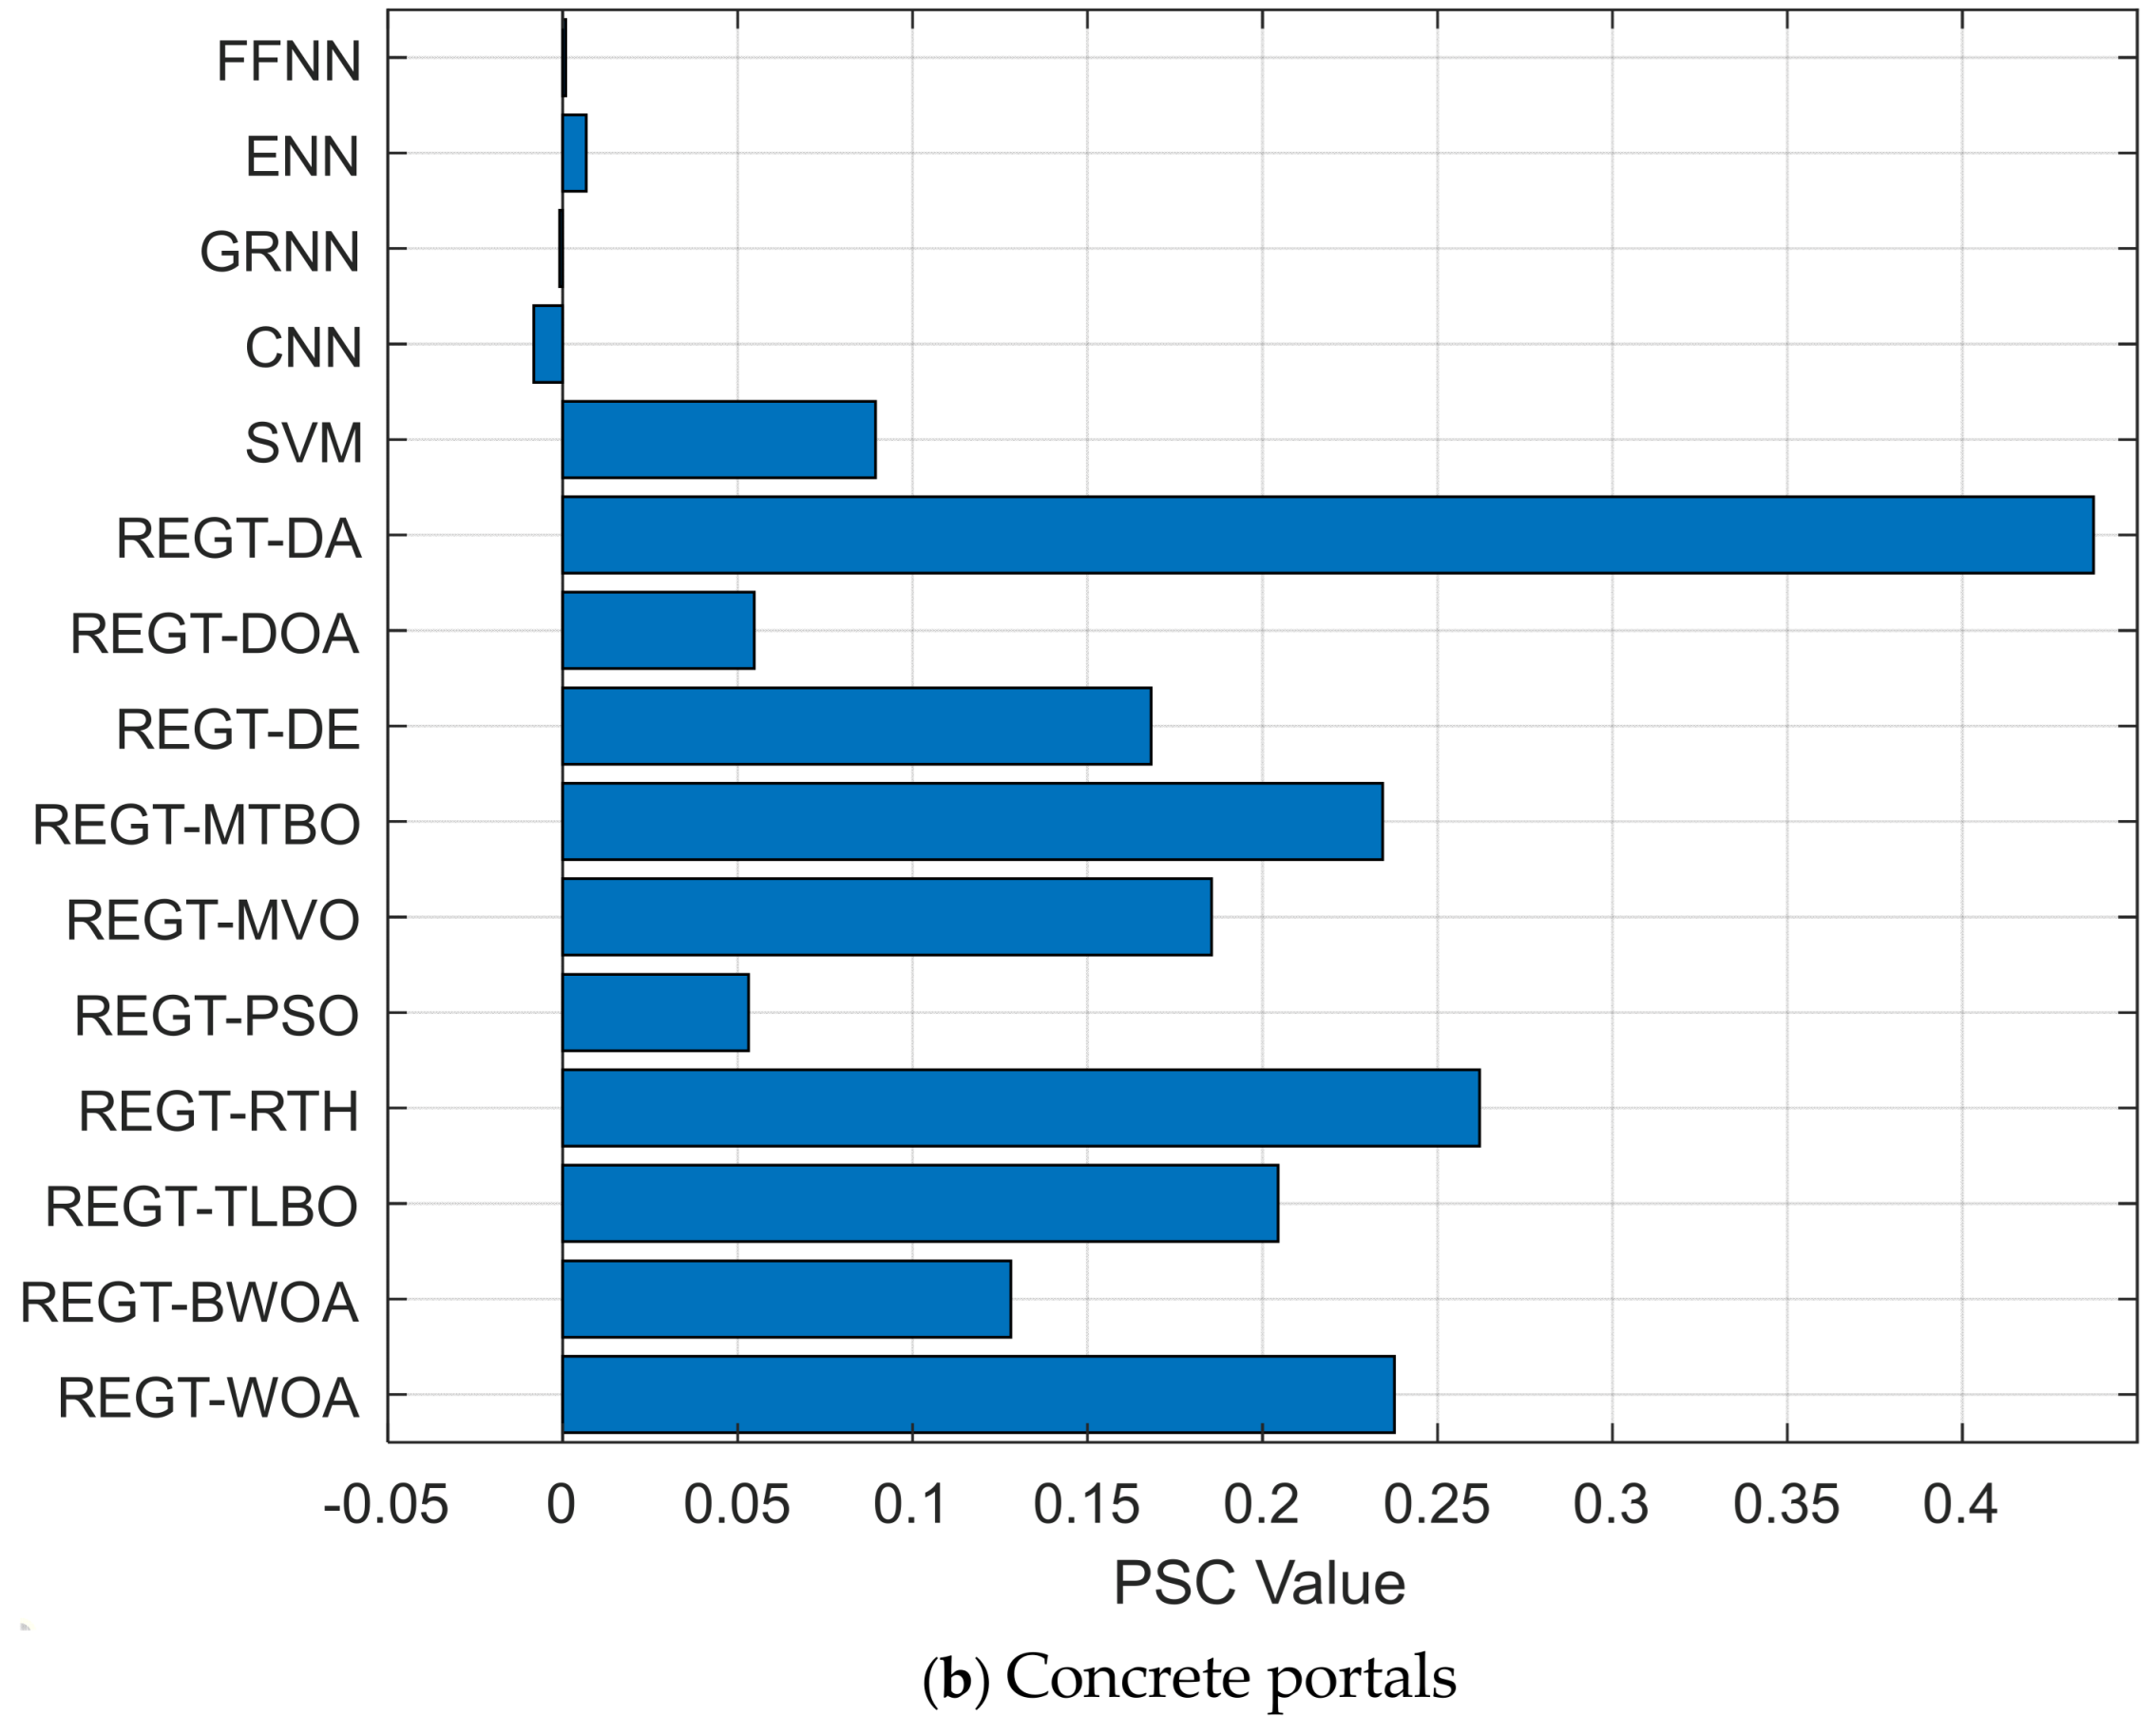
Figure 11a. REGT-MTBO achieves the highest PSC value (0.562), followed by REGT-RTH and REGT-TLBO with the second (0.297) and third (0.257) highest PSC values, respectively. As for concrete portals (see Figure 11b), the largest PSC value (0.262) is associated with REGT-RTH model and the second highest PSC value is attributed to REGT-WOA (0.238). In the concrete slab on grade (see 
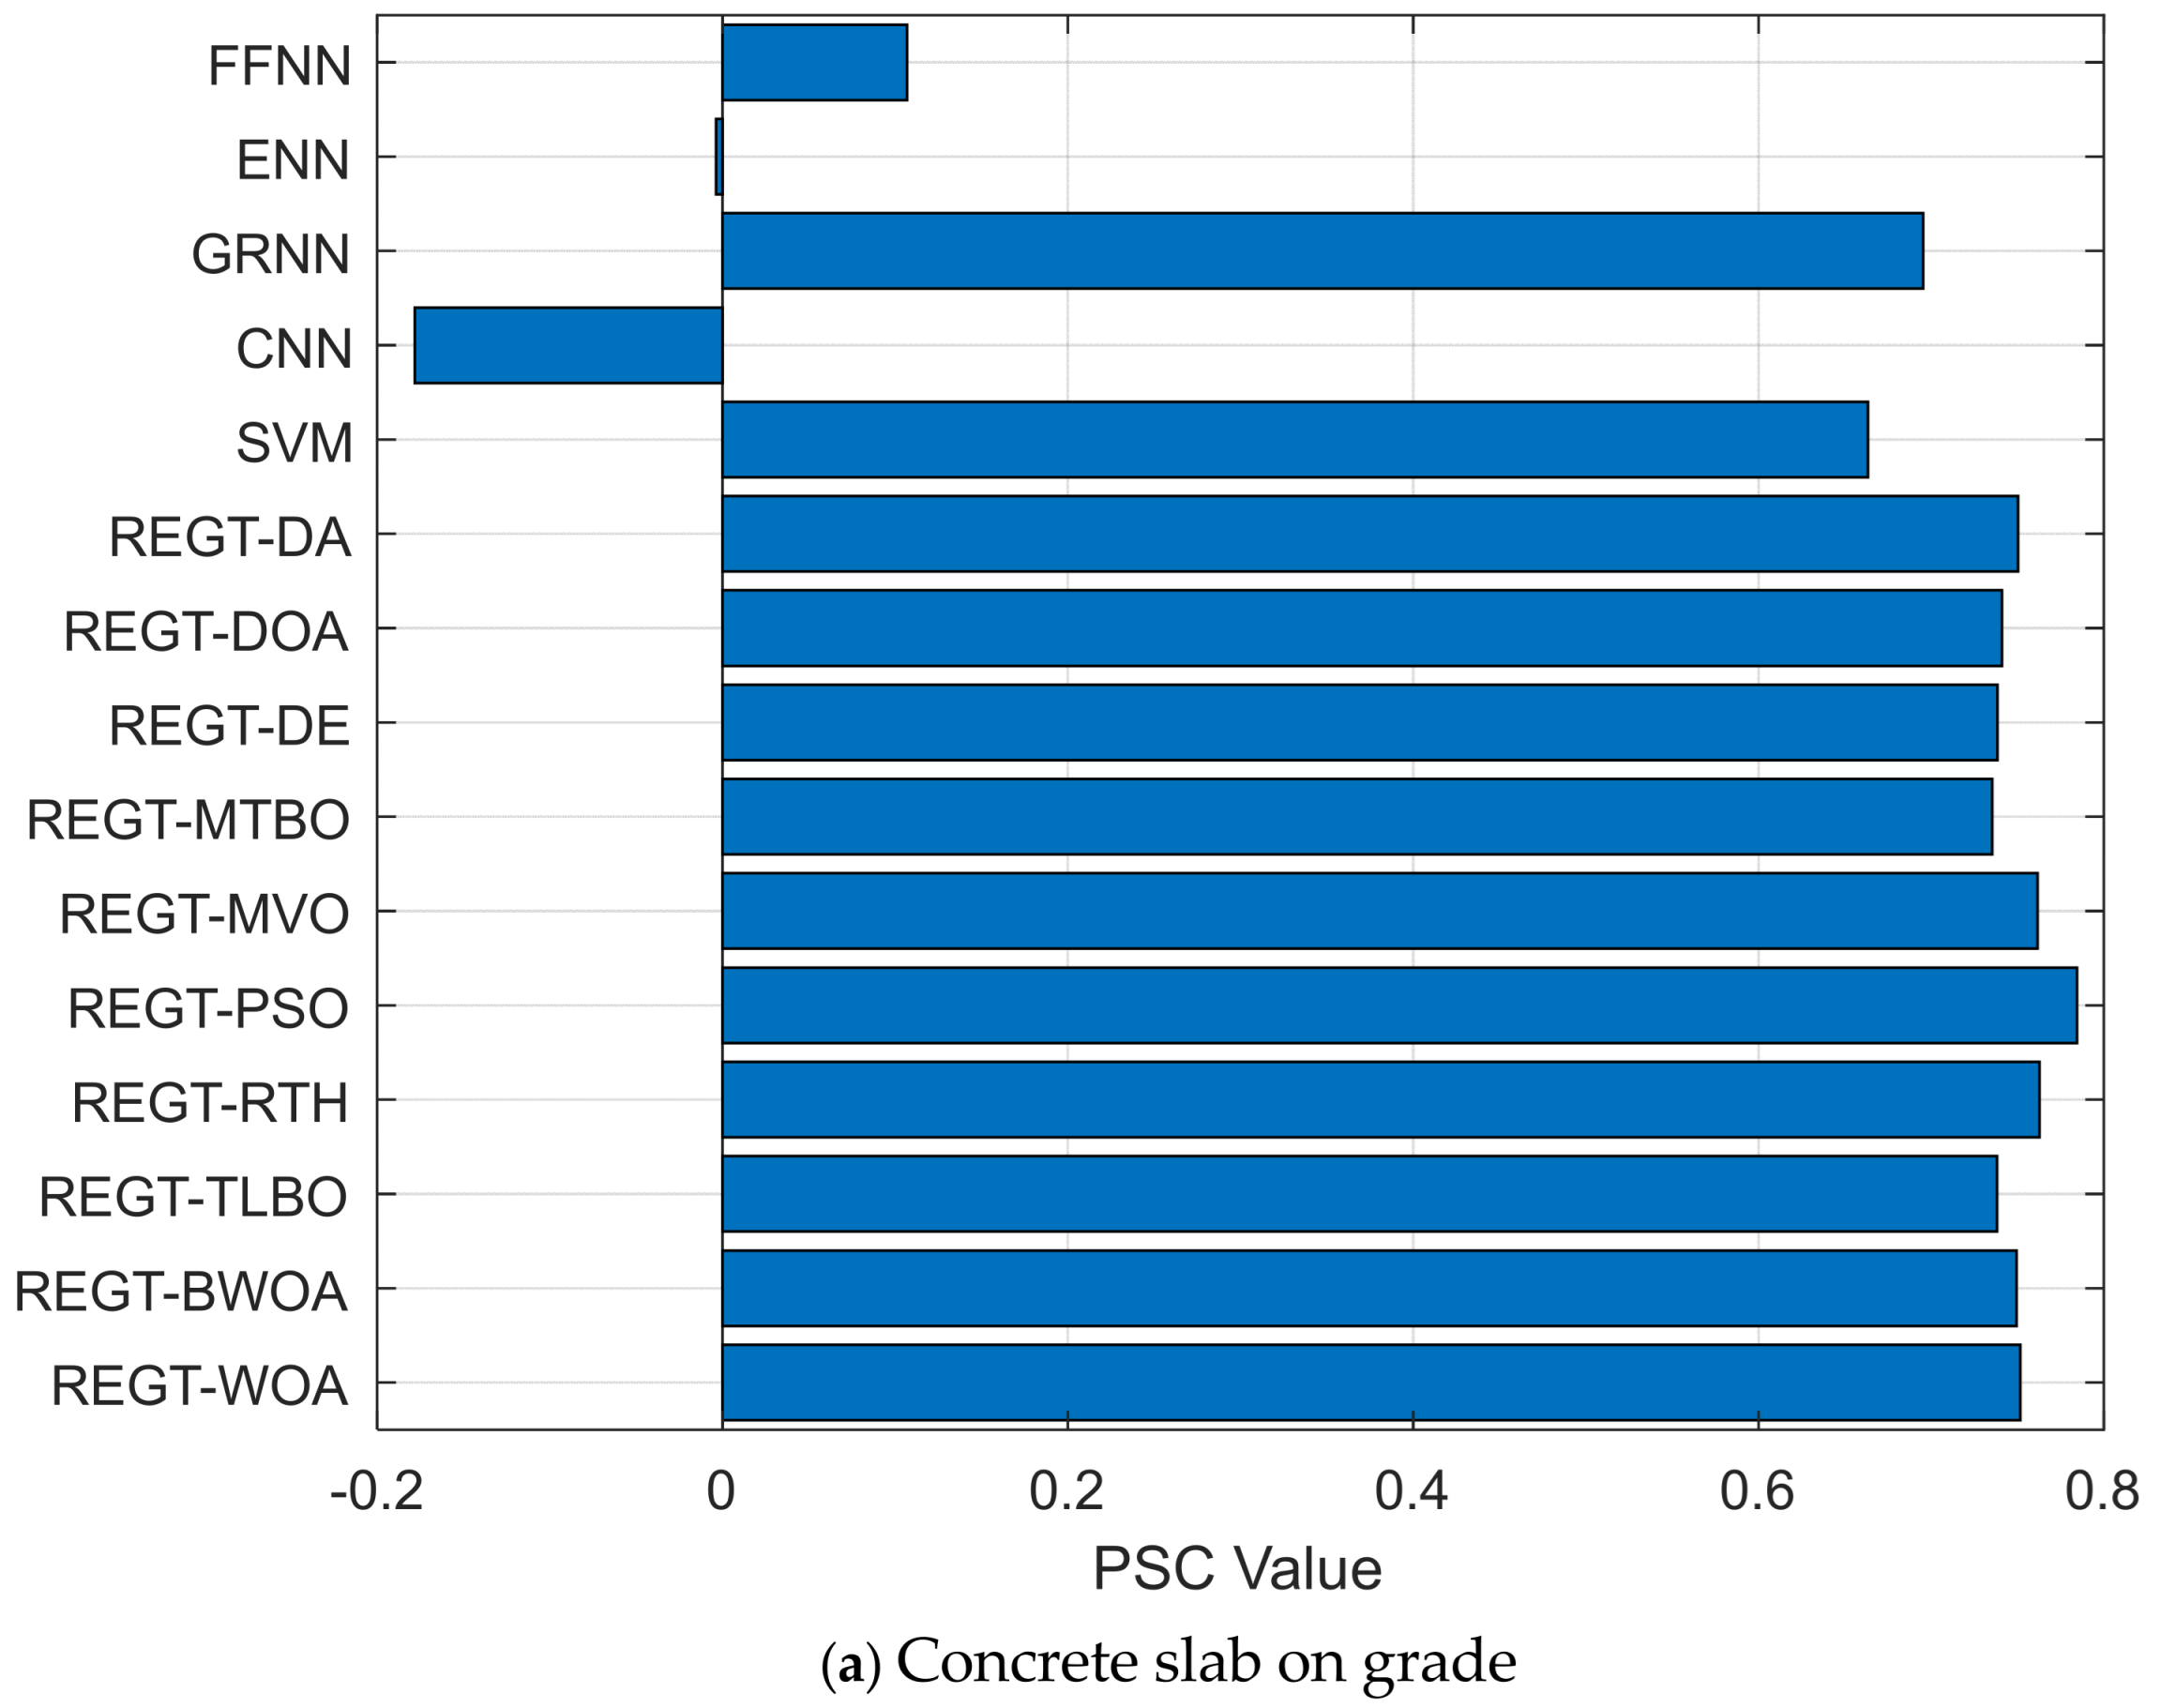
Figure 12a), it is observed that REGT-PSO sustains the highest value of PSC (0.784) as compared to the remaining deterioration models. With respect to gaskets (see 
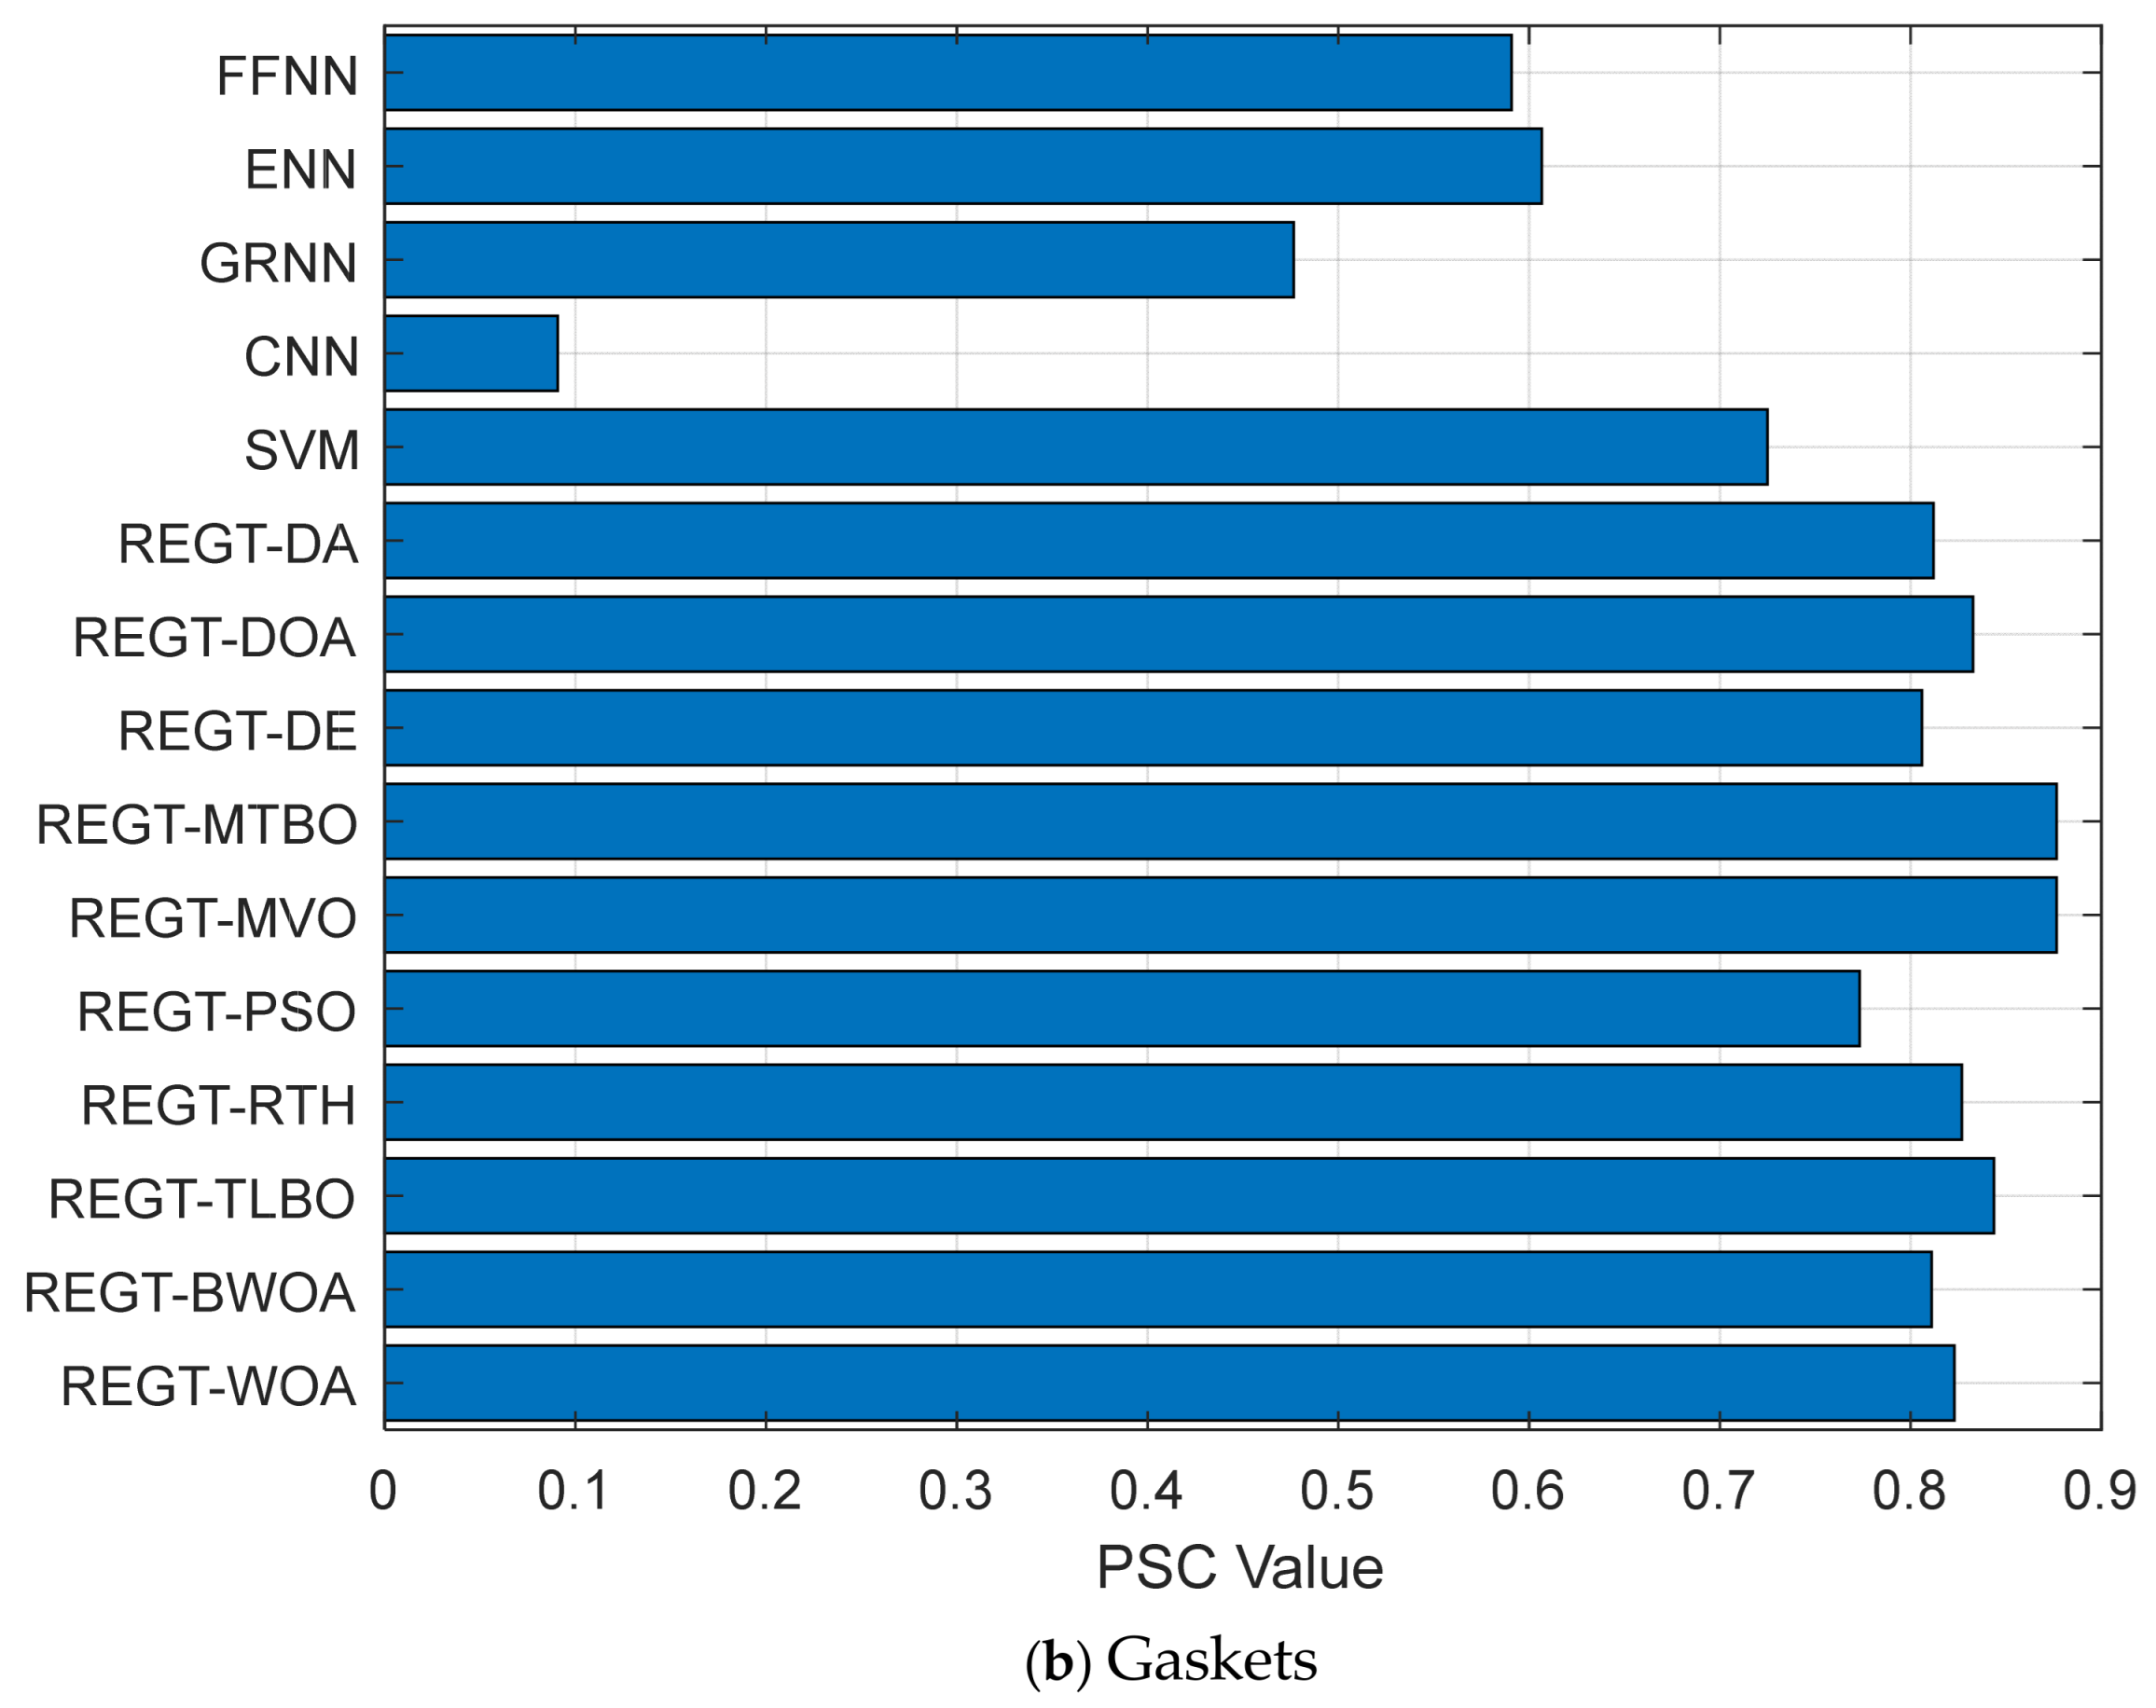
Figure 12b), REGT-MTBO produces the largest PSC value (0.877), and then REGT-PSO comes in second by a slight margin (0.876).
Figure 13, Figure 14 and 
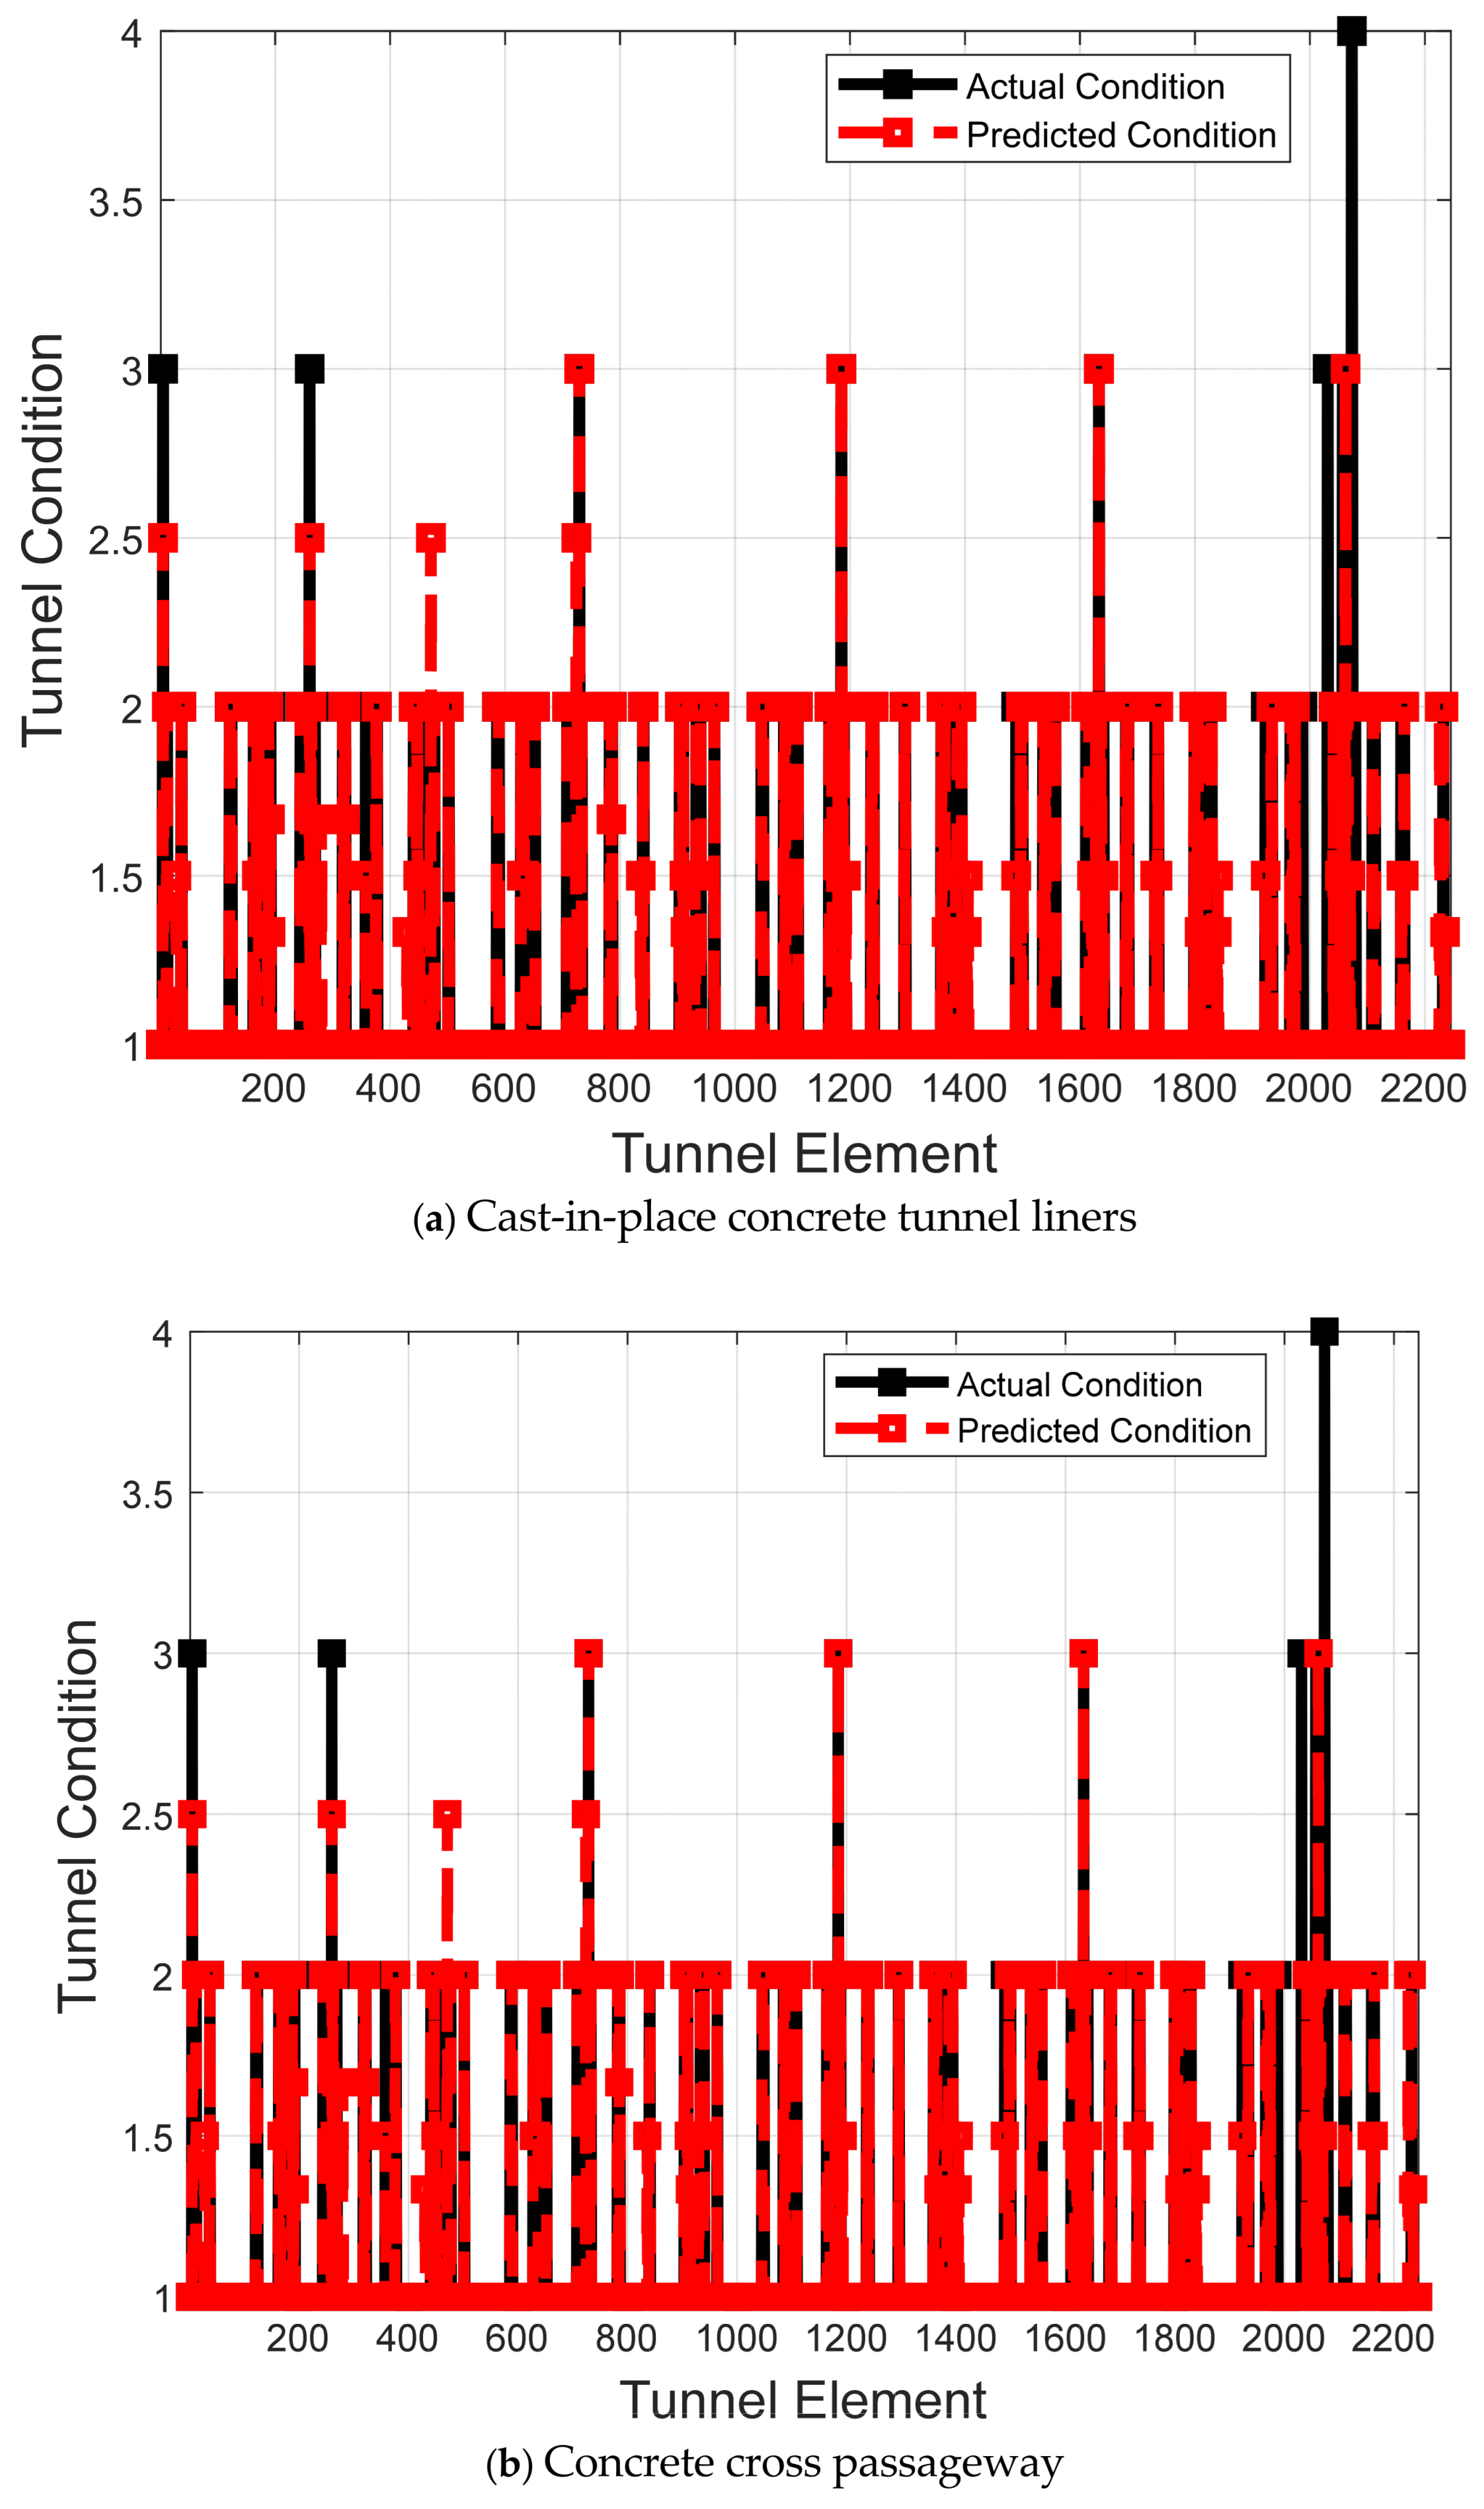
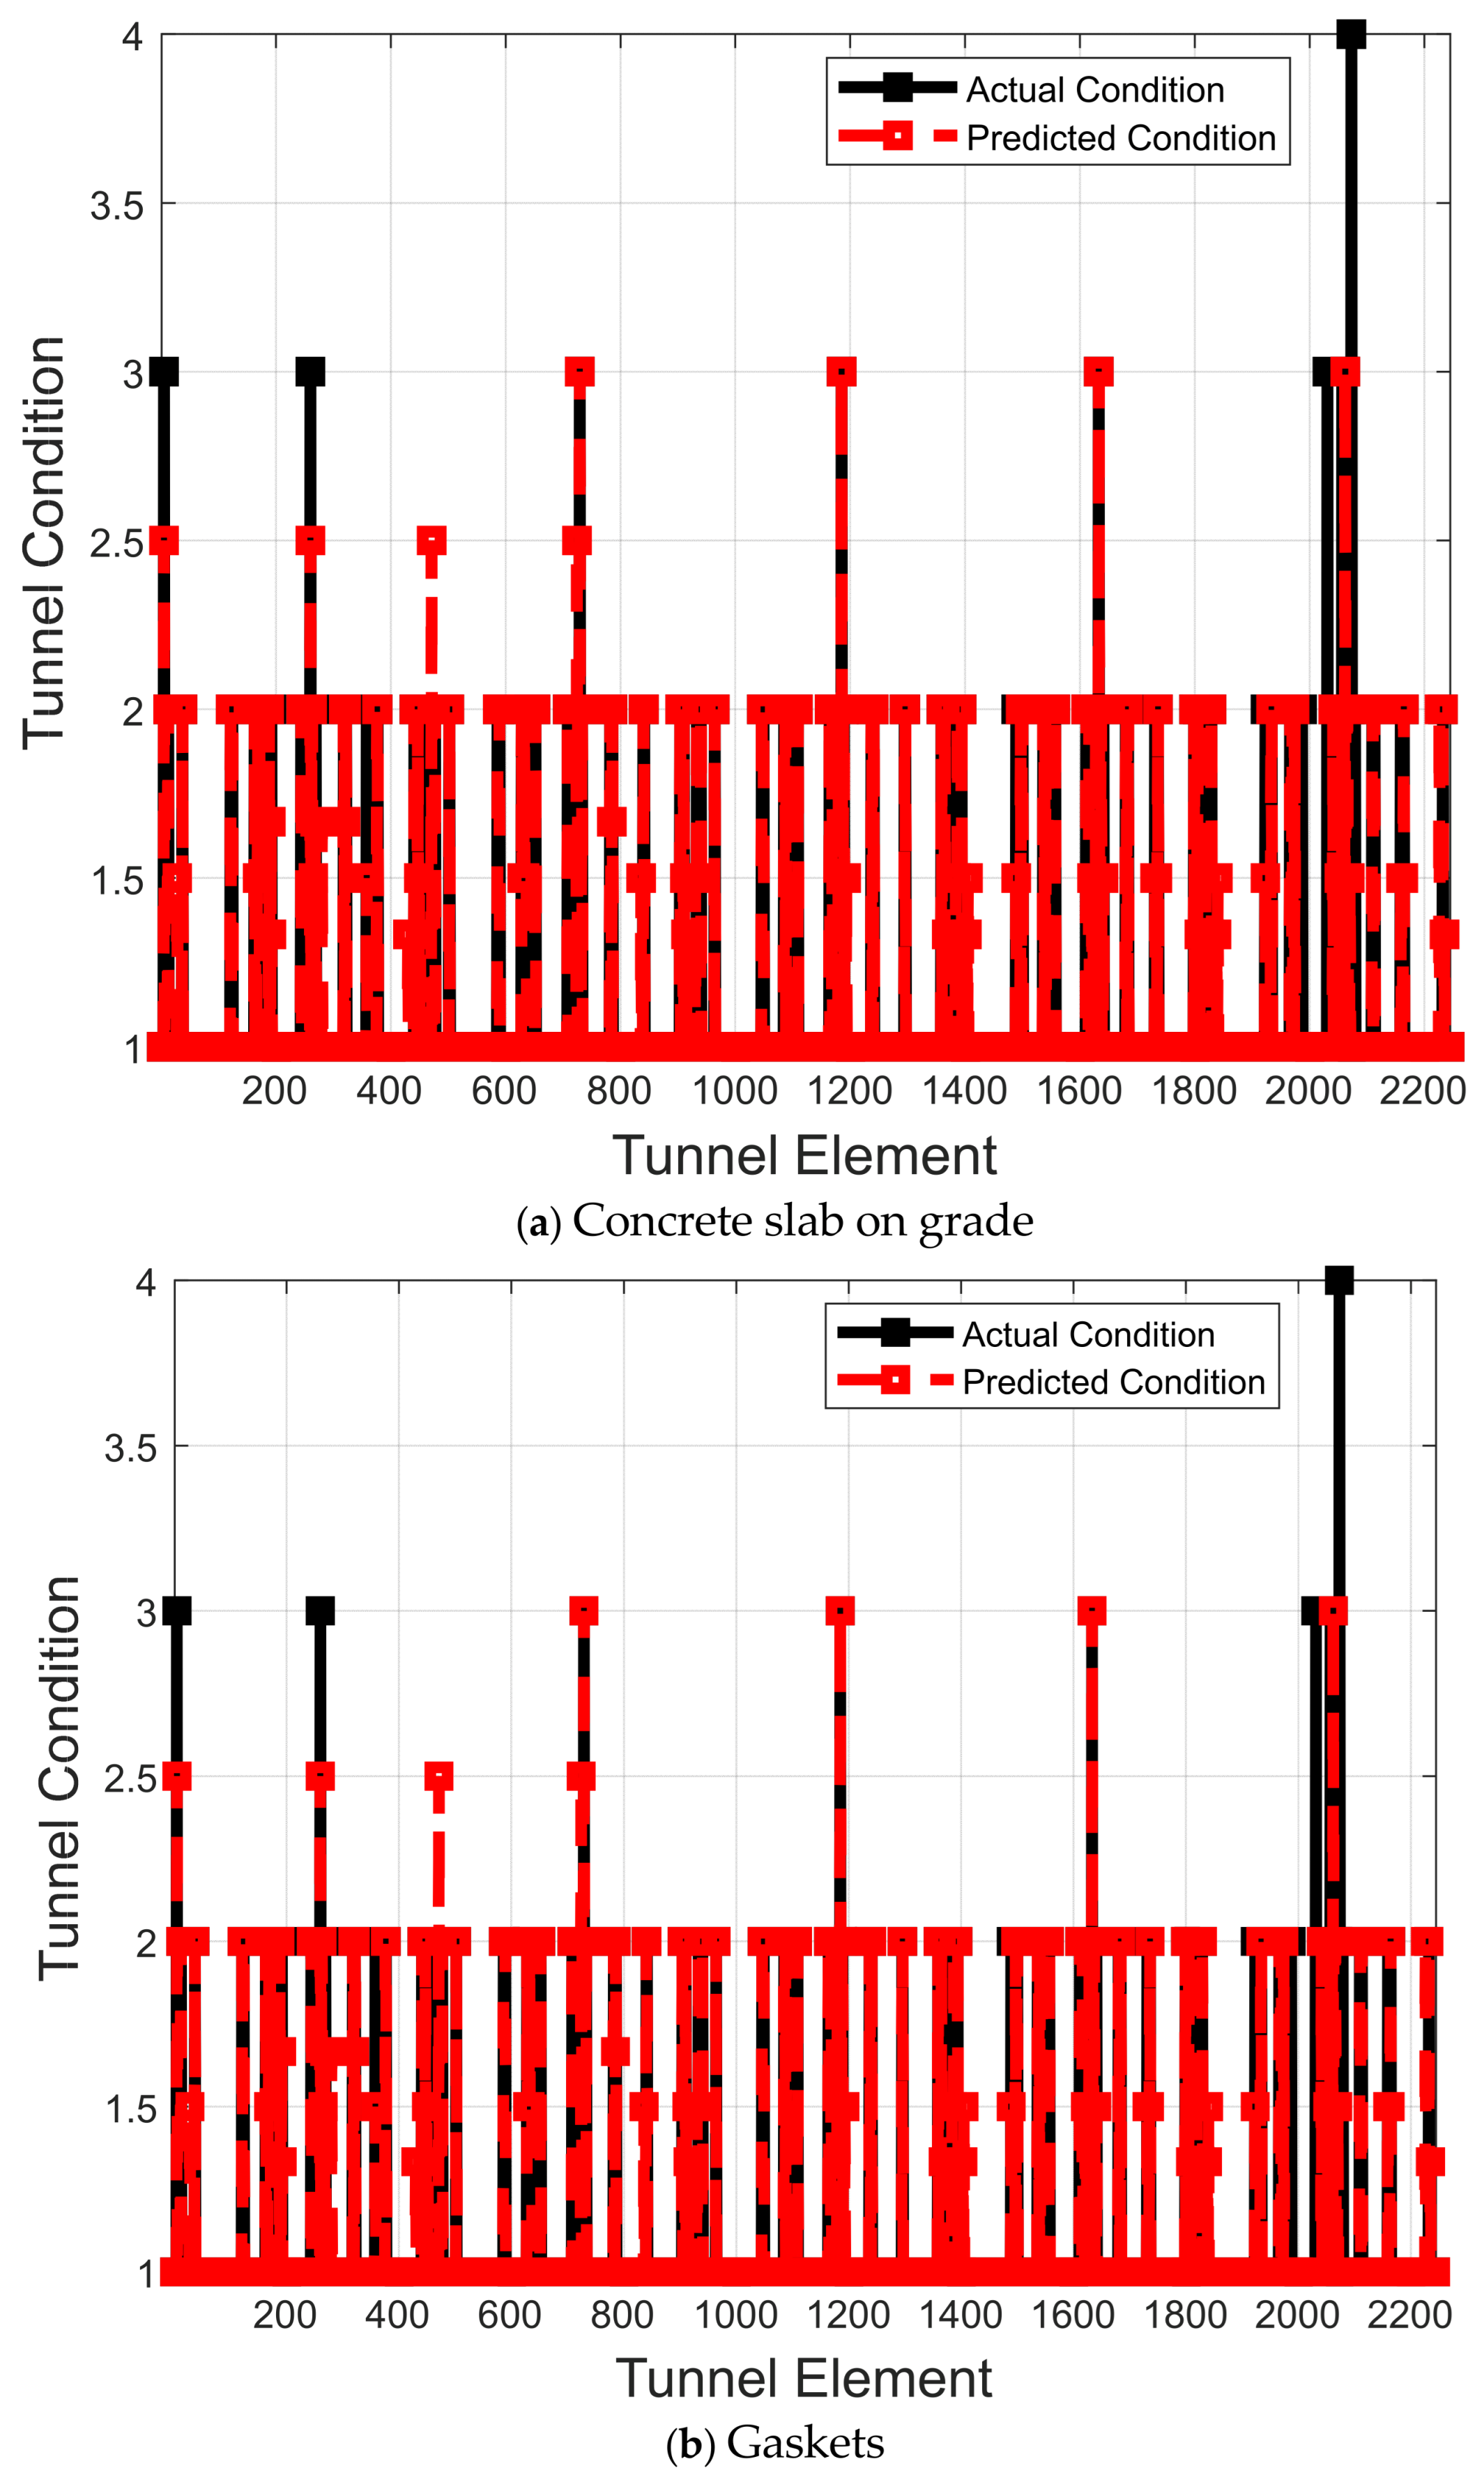
Figure 15 show graphic depictions of the level of performance of some deterioration models across tunnel elements plotted against the actual data. The X-axis reflects the tunnel elements, and the Y-axis is the tunnel condition, either predicted or actual. The black line is the actual tunnel condition and the red line is the predicted tunnel condition by the deterioration model. Figure 13a depicts visual representation of accuracies of REGT-MTBO in cast-in-place concrete tunnel liners. It is shown that REGT-MTBO could give closer values to the actual condition of cast-in-place concrete tunnel liners indicating its high predictive abilities. Figure 13b shows the condition of concrete cross passageways as forecasted by REGT-MVO. It expounds that closer distributions are experienced between the observed and predicted values demonstrating the high predictive accuracy of REGT-MVO. 
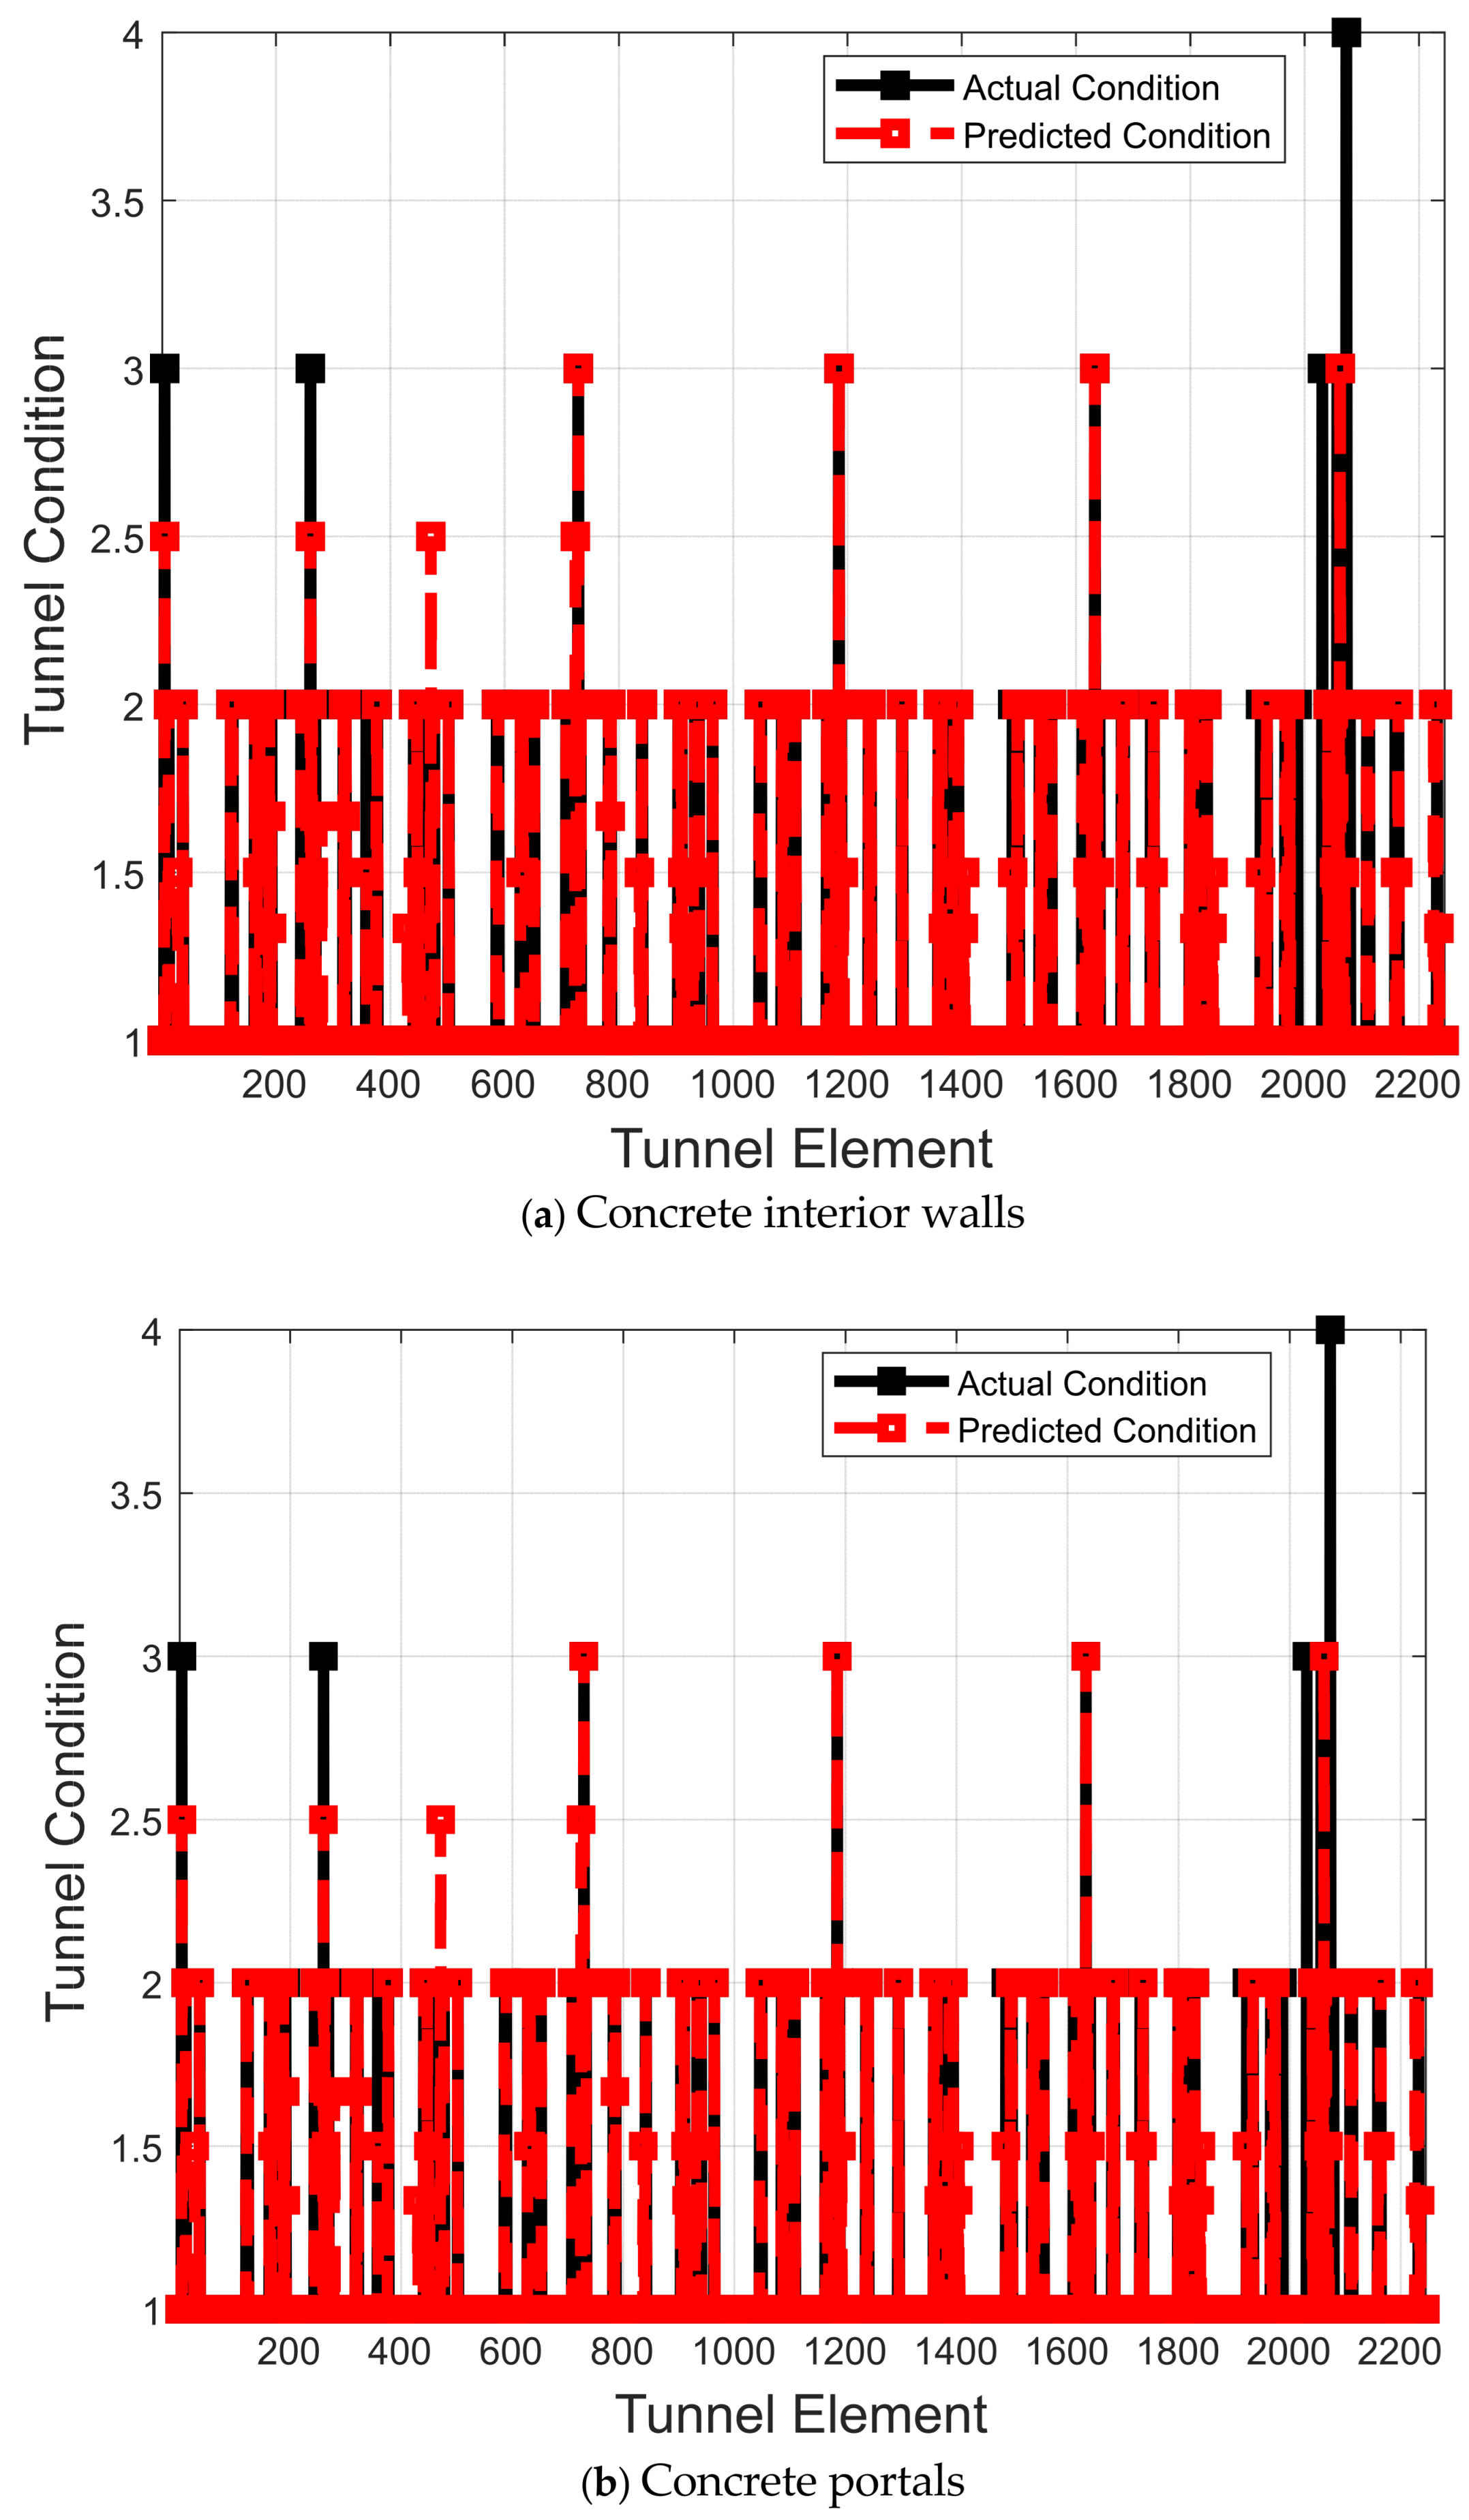
Figure 14a displays graphical illustrations of projected tunnel condition by REGT-DA. Results corroborate the accurate estimations rendered by REGT-DA. Figure 14b depicts the predicted outcomes of concrete portals for REGT-MTBO. It is clearly seen that the values of predicted condition are pretty similar to the actual ones signifying REGT-MTBO as an efficacious deterioration model of concrete portals. Figure 15a demonstrates the differences between actual and estimated condition by REGT-MVO. A notable agreement is attained between the observed and estimated condition of concrete slab on grade, affirming the superior predictive abilities of REGT-MVO. Figure 15b exemplifies the predictive capabilities of REGT-DE for gaskets. A close relationship is shown between the observed and anticipated condition over the different data instances, showing that the performance of REGT-DE is very near to the actual condition.

5.6. Target Diagrams

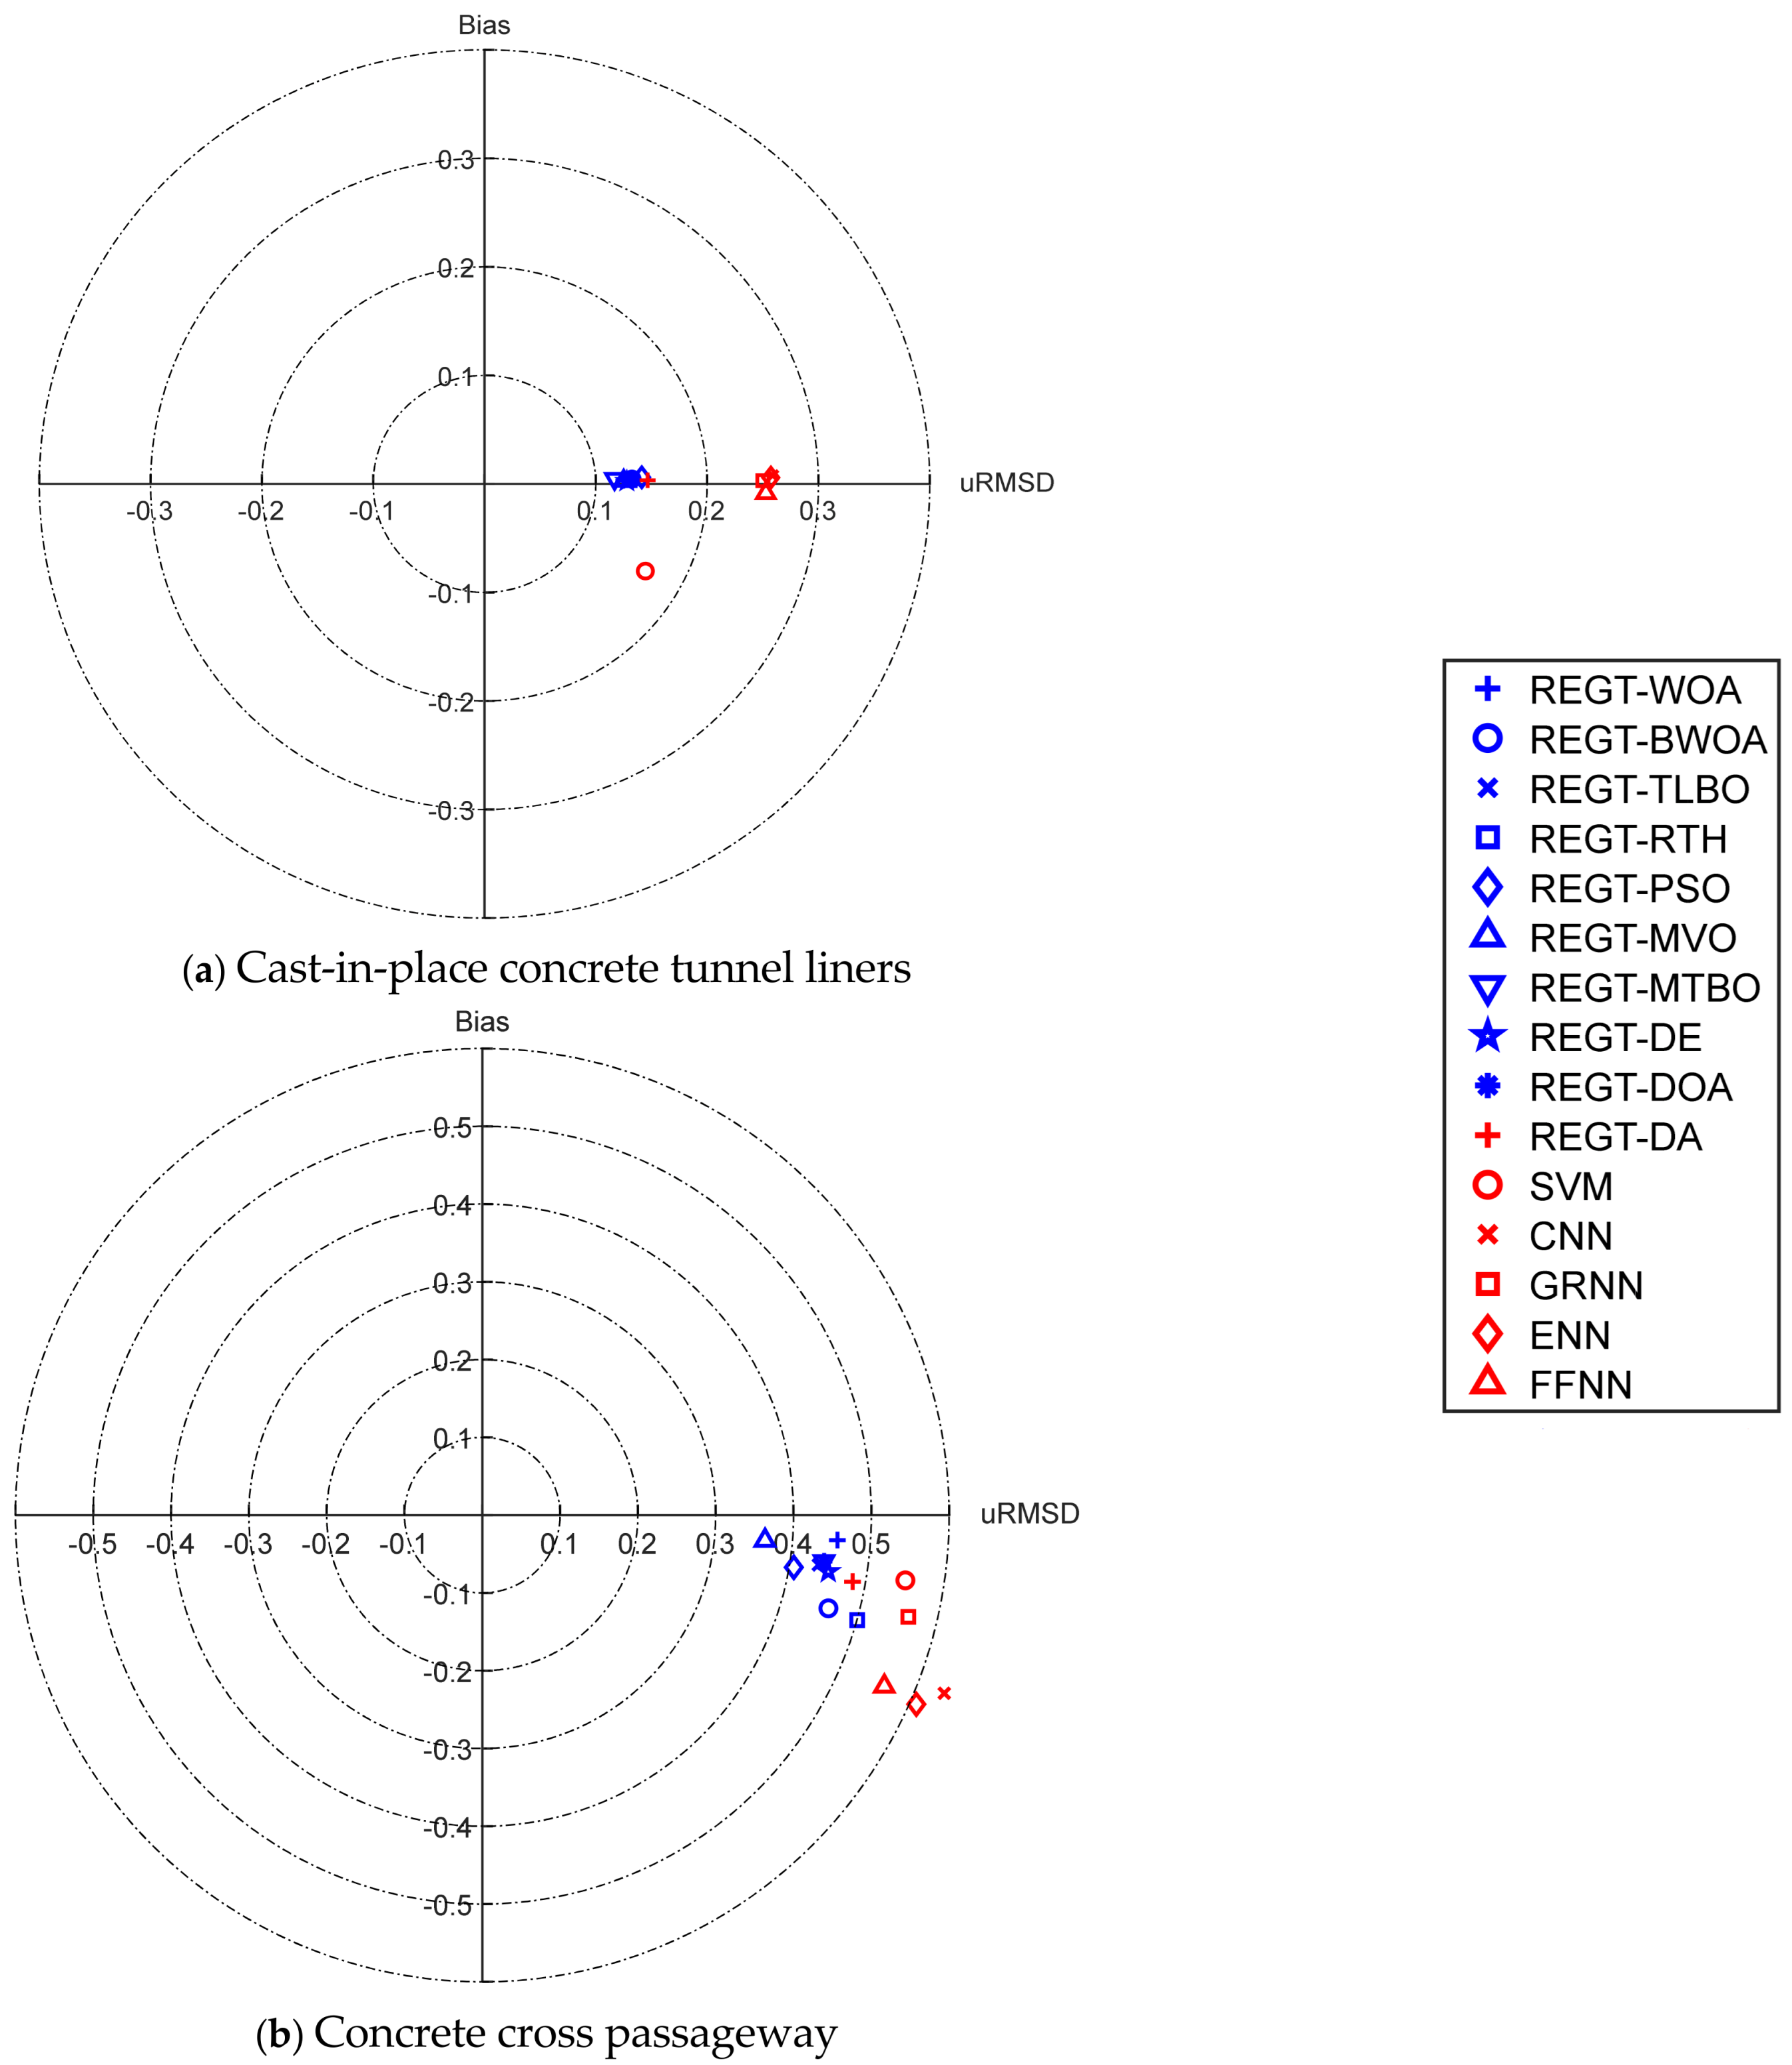
Target diagrams are harnessed herein to characterize a visual representation of the unbiased root mean square difference (uRMSD) and bias of the deterioration models (see Figure 16, Figure 17 and Figure 18). In this respect, the nearest deterioration model to the origin is regarded as the best fitted. From the resulting diagrams, it can be conferred that REGT-MTBO (urmsd = 0.1171, bias = 0.0047) is the most efficacious model in predicting the condition of cast-in-place concrete tunnel liners (Figure 16a). Looking into the target diagrams of the concrete cross passageway (
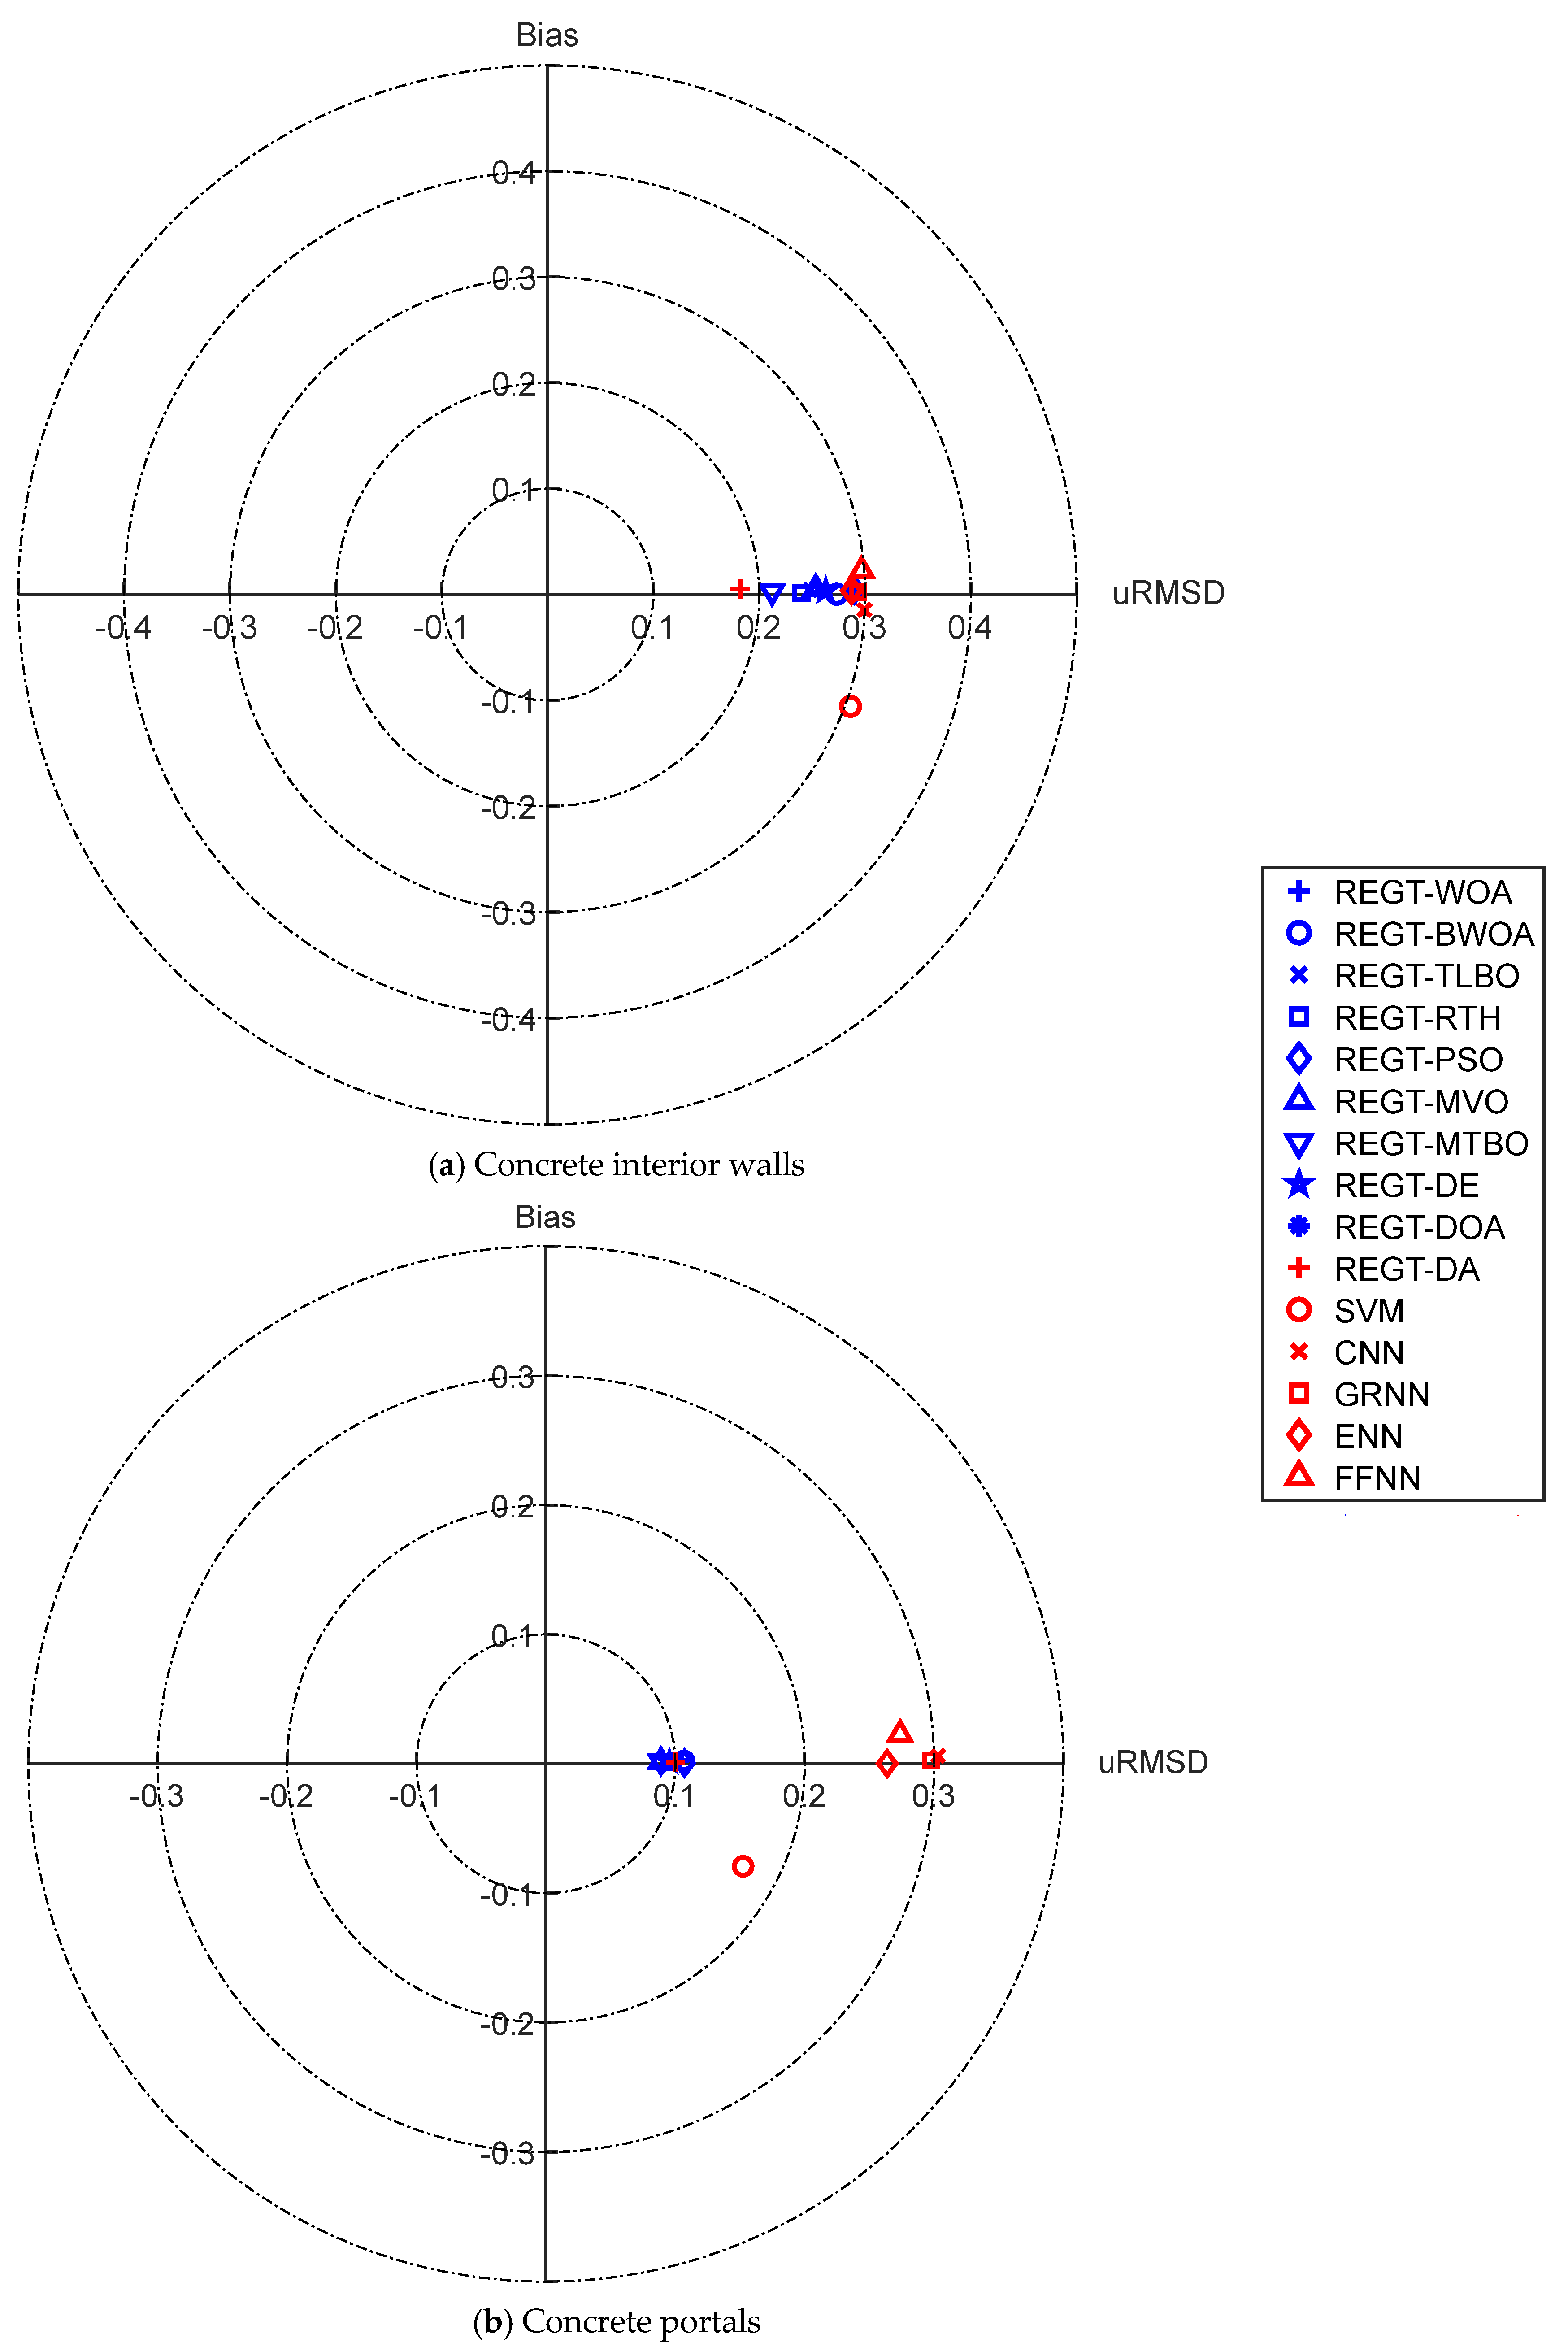
Figure 16b), it can be immediately observed that REGT-MVO is the best performing model with urmsd and bias values of 0.3649 and −0.0325, respectively. On the other hand, ENN (urmsd = 0.5877, bias = −0.2832) and CNN (urmsd = 0.5937, bias = −0.2753) are found to perform poorly in such area of application. The target diagram of concrete interior walls (Figure 17a) shows that REGT-DA (urmsd = 0.1819, bias = 0.0054) is the closest model to the origin. On the other hand, SVM failed to imitate the actual tunnel condition, whereas it obtained urmsd and bias values of 0.2862 and −0.1055, respectively. As for concrete portals (
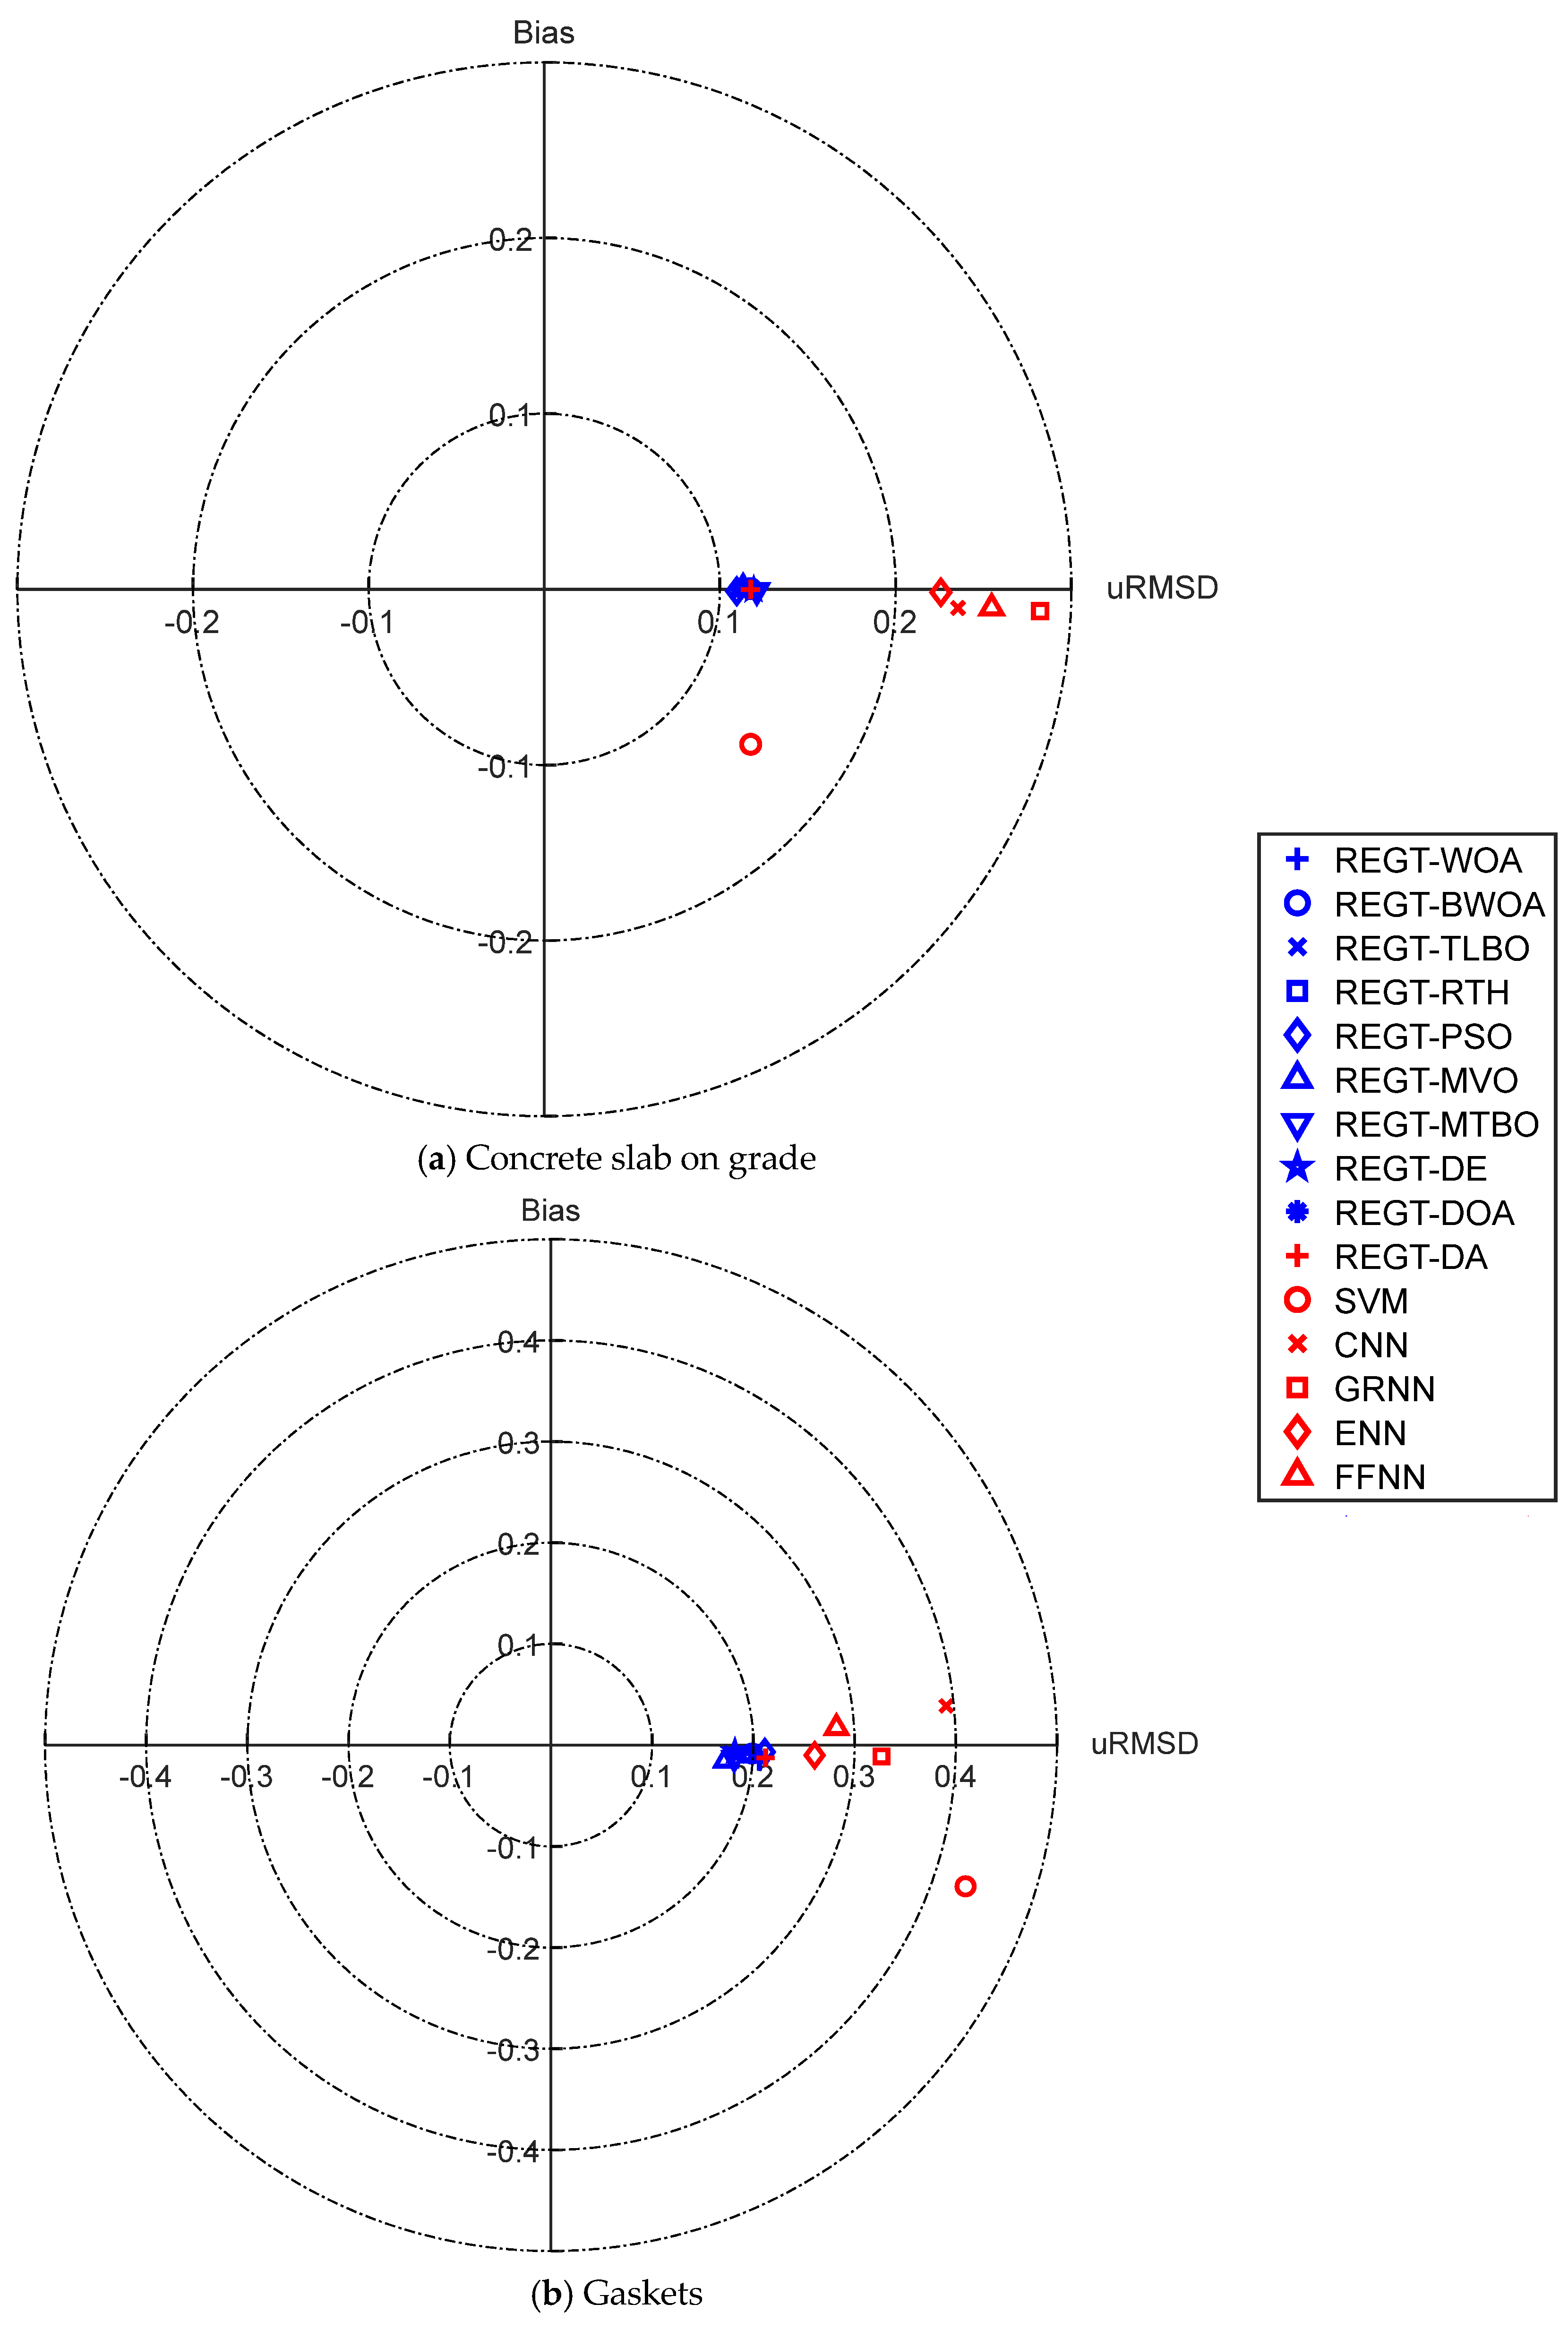
Figure 17b), the target diagram manifests that REGT-MVO and REGT-MTBO (urmsd = 0.0889, bias = −0.0018) work better than the remaining prediction models. As for concrete slab on grade (Figure 18a), it is propounded that the metaheuristic-based regression tree models sustain a far better performance than the typical machine learning models. For instance, the values of urmsd and bias of REGT-PSO are 0.1096 and −0.0011, respectively. As for gaskets (Figure 18b), the metaheuristic-based regression tree models established notable improvements in the predictive performance over the orthodox machine learning models. For example, the values of urmsd and bias of REGT-MVO are corresponding to 0.1733 and −0.015, respectively.

5.7. Influential Deterioration Factors

The optimum structures of the best performing deterioration models are listed in Table 9. It is propounded that the most influential factors affecting the condition of cast-in-place concrete tunnel liners are age, rehabilitation year, number of lanes, ADT, ADTT, detour length, service in tunnel, STRAHNET designation, functional classification, tunnel length, roadway width, number of bores, tunnel shape, portal shape, ground conditions, and complexity. As for the concrete cross passageway, the most significant deterioration factors include age, number of lanes, detour length, service in tunnel, NHS designation, STRAHNET designation, tunnel length, roadway width, hazardous material selection, tunnel shape, ground conditions, and complexity. In the same vein, concrete interior walls are found to be highly influenced by age, rehabilitation year, ADT, ADTT, detour length, service in tunnel, NHS designation, STRAHNET designation, functional classification, tunnel length, roadway width, hazardous material selection, number of bores, portal shape, ground conditions, and complexity. In addition, the top deterioration factors affecting concrete portals are the number of lanes, ADT, ADTT, detour length, service in tunnel, NHS designation, STRAHNET designation, functional classification, tunnel length, roadway width, hazardous material selection, number of bores, and ground conditions. with regard to concrete slab on grade, the most impacting deterioration factors are the number of lanes, ADT, NHS designation, STRAHNET designation, functional classification, hazardous material selection, tunnel shape, and complexity.
It is also revealed that the most affecting factors on the condition of gaskets encompass are rehabilitation year, number of lanes, service in tunnel, functional classification, tunnel length, roadway width, hazardous material selection, number of bores, tunnel shape, portal shape, and ground conditions. Generally speaking, the most paramount factors to pay attention to when studying tunnel deterioration are number of lanes, service in tunnel, tunnel length, and roadway width. The optimum structure of regression tree was investigated (type of predictor selection (psl), minimum parent size (ps), minimum leaf size (ls), and maximum number of splits (ns)). The optimum type of predictor selection method was either “all splits” or “interaction-curvature”. The optimum values of minimum parent size were either 2, 3, or 4. The optimum value of leaf size was 2, and the optimum values of maximum number of splits range between 800 and 2000. The optimum deterioration factors and hyperparameters can serve as useful references for the proper use of regression trees to accurately anticipate the condition of tunnel elements. For example, the optimum architecture of the regression tree used for the deterioration prediction of concrete interior walls is composed of “all splits” predictor selection and the minimum parent size, minimum leaf size, and maximum number of splits of 2, 2, and 2000, respectively.

5.8. Analysis and Discussion

In light of the foregoing, it can be underlined that no single metaheuristic-based regression tree was able to be the superior deterioration model across all tunnel elements. For example, REGT-MTBO was the best fitted deterioration model in cast-in-place concrete tunnel liners and concrete portals. In addition, REGT-MVO was the best-performing model in concrete cross passageways and concrete slab on grade. Moreover, REGT-DA and REGT-DE exhibited the highest accuracies in concrete interior walls and gaskets, respectively. In view of these findings, some conclusions can be drawn: (1) MTBO is the best metaheuristic in dealing with large dataset inventories, (2) DE achieves better accuracies with small datasets than with large ones, and (3) MVO performs nearly as well with small datasets as with the large ones. The study of deterioration factors revealed that the string of the most significant deterioration factors varies from one tunnel element to the other. However, there are four common factors that are total number of lanes, service in tunnel, tunnel length and roadway width. As for the optimum structures of regression trees, “all splits” was found to be the optimum type of predictor selection in five out of the six tunnel elements, and “interaction-curvature” was the optimal type in one tunnel element. The optimal values of minimum parent size ranged between 2 and 4, the minimum leaf size was 2, and the maximum number of splits extended from 800 to 2000.
Across the six tunnel elements, it is noted that the ten metaheuristic-based regression tree models outperformed classical machine learning models. This evinces the adaptability, robustness, high exploration/exploitation abilities, and fast convergence of the developed model. The high search abilities allowed us to effectively probe the design space without stagnating in local minima solutions and premature convergence. Another important feature of the developed model is its ability to automatically tune the hyperparameters of regression tree during the training process. This allowed us to alleviate the time-consuming nature of and suboptimal solutions to manually optimizing hyperparameters. A third important advantage of the developed model is its ability to perform automated feature selection of deterioration factors during the learning process of the regression tree, which aided in dodging the less predictive results of filter methods. The developed model consumes more training time than the classical machine learning models. However, it can be argued that the training process is carried out only once, and the model is well learned so that the optimum deterioration factors and features are appended and can be directly used for prediction.

6. Conclusions

This study introduced a novel hybrid metaheuristic-based regression tree model to predict the temporal deterioration behavior of six distinct tunnel components—cast-in-place concrete tunnel liners, concrete cross passageways, concrete interior walls, concrete portals, concrete slab on grade, and gaskets. Drawing upon a large-scale dataset sourced from the National Tunnel Inventory, the proposed framework leveraged ten metaheuristic algorithms (e.g., whale optimization, teaching–learning-based optimization, red-tailed hawk, particle swarm optimization, and differential evolution) to (1) optimize regression tree hyperparameters and (2) determine the most influential deterioration factors for each tunnel element. Comparative evaluations against conventional machine learning techniques, including support vector machines, neural networks, and ensemble methods, illustrated the superior predictive performance of metaheuristic-enhanced regression tree models in terms of lowered error metrics (MAE, RMSE, and MAPE), stronger generalization (via AIC and OBJ criteria), and more robust model stability (via target diagrams and PSC values).
Notably, while the metaheuristic-based regression trees generally outperformed standard machine learning methods, no single metaheuristic variant consistently dominated across all tunnel elements. This result underscores the complexity of tunnel deterioration processes: each tunnel component may respond differently to variations in environmental conditions, traffic loads, material properties, and other factors. The detailed feature-selection analysis revealed that number of lanes, service in tunnel, tunnel length, and roadway width emerged as critical predictors across multiple tunnel elements, suggesting that these factors warrant particular attention in maintenance planning and resource allocation. From a practical standpoint, this research study supplies transportation agencies with a reliable and robust platform to forecast the temporal deterioration rates of their tunnel infrastructure. It can also aid asset managers in customizing their own deterioration models based on the available dataset. Constituting a key pillar of budget allocation models, this in turn leads to more informed, sustainable, and cost-effective maintenance and rehabilitation programs, thereby enhancing public safety and the long-term operation of tunnel elements and extending their service life. This study also reports the most significant deterioration factors for each tunnel element, whereas collecting data about these factors can assist transportation agencies in building their tailored deterioration models, reducing the data collection burden, and understanding temporal tunnel performance. Future research can build on these insights by (1) devising non-destructive techniques-based deterioration models through incorporating multi-sensor technologies such as ground penetrating and digital photogrammetry, (2) integrating the developed model with internet of things for dynamic update and real time monitoring of condition data, and (3) leveraging metaheuristics with deep learning techniques such as convolutional neural network for tunnel deterioration prediction. Overall, the outcomes of this study demonstrate that combining regression trees with metaheuristic algorithms offers a powerful and versatile approach for advancing the state of the art in tunnel deterioration modeling and ensuring more resilient infrastructure systems.

Author Contributions

Conceptualization, E.M.A. and A.A.-S.; methodology, E.M.A. and A.A.-S.; formal analysis, E.M.A. and A.A.-S.; data curation, M.E., A.A.-S., M.E., A.O. and G.A.; investigation, M.E., A.A.-S., M.E., A.O. and G.A.; resources, M.E., A.A.-S., M.E., A.O. and G.A.; writing—original draft preparation, M.E., A.A.-S., M.E., A.O. and G.A.; writing—review and editing, M.E., A.A.-S., M.E., A.O. and G.A. All authors have read and agreed to the published version of the manuscript.

Funding

This work was funded by Researchers Supporting Project number (RSPD2025R899), King Saud University, Riyadh, Saudi Arabia.

Data Availability Statement

Some or all data that support the findings of this study are available from the corresponding author upon reasonable request.

Acknowledgments

This work was supported by Researchers Supporting Project number (RSPD2025R899), King Saud University, Riyadh, Saudi Arabia.

Conflicts of Interest

The authors declare no conflicts of interest.

References

  1. Asakura, T.; Kojima, Y. Tunnel Maintenance in Japan. Tunn. Undergr. Space Technol. 2003, 18, 161–169. [Google Scholar] [CrossRef]
  2. Usman, M.; Galler, R. Long-Term Deterioration of Lining in Tunnels. Int. J. Rock Mech. Min. Sci. 2013, 64, 84–89. [Google Scholar] [CrossRef]
  3. American Society of Civil Engineers. America’s Infrastructure Report Card 2021. Available online: https://infrastructurereportcard.org/. (accessed on 3 January 2025).
  4. Federal Transit Administration. Transit State of Good Repair: National Backlog Analysis; Federal Transit Administration: Washington, DC, USA, 2025. [Google Scholar]
  5. Wang, D.; Wang, J.; Rao, C.; Niu, X.; Xu, Q. Tunnel Lining Crack Expansion and Maintenance Strategy Optimization Considering Train Loads: A Case Study. PLoS ONE 2023, 18, e0290533. [Google Scholar] [CrossRef] [PubMed]
  6. Hu, W.; Chen, J.; Tian, Q.; Wang, C.; Zhang, Y. Analysis and Application of Highway Tunnel Risk Factors Based on Traffic Accident Data. In Proceedings of the 2024 7th International Symposium on Traffic Transportation and Civil Architecture (ISTTCA 2024), Tianjin, China, 21–23 June 2024; pp. 836–849. [Google Scholar]
  7. Rumman, R.; Bediwy, A.; Alam, M.S. Revolutionizing Concrete Durability: Case Studies on Encapsulation-Based Chemical (Autonomous) Self-Healing Techniques and Future Directions—A Critical Review. Case Stud. Constr. Mater. 2024, 20, e03216. [Google Scholar] [CrossRef]
  8. Liu, W.; Chen, J.; Luo, Y.; Shi, Z.; Ji, X.; Zhu, H. Study on the Annual Reduction Rate of Vehicle Emission Factors for Carbon Monoxide: A Case Study of Urban Road Tunnels in Shenzhen, China. Adv. Civ. Eng. 2020, 2020, 1686753. [Google Scholar] [CrossRef]
  9. Haack, A. Current Safety Issues in Traffic Tunnels. Tunn. Undergr. Space Technol. 2002, 17, 117–127. [Google Scholar] [CrossRef]
  10. Liu, X.; Zhuang, Y.; Zhou, X.; Liang, N.; Mao, J.; Chen, H. Study of the Damage Characteristics and Corrosion Mechanism of Tunnel Lining in a Sulfate Environment. Front. Mater. 2023, 10, 1323274. [Google Scholar] [CrossRef]
  11. Lai, L.; Zhang, Y.; Xu, K. Prediction of Wet Area of Underwater Tunnel Lining. Buildings 2024, 14, 408. [Google Scholar] [CrossRef]
  12. Hasan, S.; Elwakil, E. National Bridge Inventory Data-Based Stochastic Modeling for Deck Condition Rating of Prestressed Concrete Bridges. Pract. Period. Struct. Des. Constr. 2020, 25, 04020022. [Google Scholar] [CrossRef]
  13. Jiang, Y.; Wang, L.; Zhang, B.; Dai, X.; Ye, J.; Sun, B.; Liu, N.; Wang, Z.; Zhao, Y. Tunnel Lining Detection and Retrofitting. Autom. Constr. 2023, 152, 104881. [Google Scholar] [CrossRef]
  14. Lin, Z.; Feng, W.; Jin, K.; Chen, X.; Yang, H.; Hu, Y. Evolution of Cracking Damage and Load-Bearing Performance of in-Service Tunnel Linings with Cracks. Theor. Appl. Fract. Mech. 2025, 138, 104897. [Google Scholar] [CrossRef]
  15. Srikanth, I.; Arockiasamy, M. Deterioration Models for Prediction of Remaining Useful Life of Timber and Concrete Bridges: A Review. J. Traffic Transp. Eng. (Engl. Ed.) 2020, 7, 152–173. [Google Scholar] [CrossRef]
  16. Denysiuk, R.; Fernandes, J.; Matos, J.C.; Neves, L.C.; Berardinelli, U. A Computational Framework for Infrastructure Asset Maintenance Scheduling. Struct. Eng. Int. 2016, 26, 94–102. [Google Scholar] [CrossRef]
  17. Qing, S.; Li, C. Data-Driven Prediction on Critical Mechanical Properties of Engineered Cementitious Composites Based on Machine Learning. Sci. Rep. 2024, 14, 15322. [Google Scholar] [CrossRef]
  18. Harle, S.M. Advancements and Challenges in the Application of Artificial Intelligence in Civil Engineering: A Comprehensive Review. Asian J. Civ. Eng. 2024, 25, 1061–1078. [Google Scholar] [CrossRef]
  19. Sihag, P.; Singh, V.P.; Angelaki, A.; Kumar, V.; Sepahvand, A.; Golia, E. Modelling of Infiltration Using Artificial Intelligence Techniques in Semi-Arid Iran. Hydrol. Sci. J. 2019, 64, 1647–1658. [Google Scholar] [CrossRef]
  20. Subasi, A.; Saikia, A.; Bagedo, K.; Singh, A.; Hazarika, A. EEG-Based Driver Fatigue Detection Using FAWT and Multiboosting Approaches. IEEE Trans. Industr. Inform. 2022, 18, 6602–6609. [Google Scholar] [CrossRef]
  21. Javed, M.F.; Fawad, M.; Lodhi, R.; Najeh, T.; Gamil, Y. Forecasting the Strength of Preplaced Aggregate Concrete Using Interpretable Machine Learning Approaches. Sci. Rep. 2024, 14, 8381. [Google Scholar] [CrossRef]
  22. Malik, P.; Gehlot, A.; Singh, R.; Gupta, L.R.; Thakur, A.K. A Review on ANN Based Model for Solar Radiation and Wind Speed Prediction with Real-Time Data. Arch. Comput. Methods Eng. 2022, 29, 3183–3201. [Google Scholar]
  23. Ibrahim, A.; Abdelkhalek, S.; Zayed, T.; Qureshi, A.H.; Mohammed Abdelkader, E. A Comprehensive Review of the Key Deterioration Factors of Concrete Bridge Decks. Buildings 2024, 14, 3425. [Google Scholar] [CrossRef]
  24. Jamous, R.; ALRahhal, H.; El-Darieby, M. Neural Network Architecture Selection Using Particle Swarm Optimization Technique. Appl. Artif. Intell. 2021, 35, 1219–1236. [Google Scholar] [CrossRef]
  25. Zhang, J.; Sun, G.; Sun, Y.; Dou, H.; Bilal, A. Hyper-Parameter Optimization by Using the Genetic Algorithm for Upper Limb Activities Recognition Based on Neural Networks. IEEE Sens. J. 2021, 21, 1877–1884. [Google Scholar] [CrossRef]
  26. Karaman, A.; Karaboga, D.; Pacal, I.; Akay, B.; Basturk, A.; Nalbantoglu, U.; Coskun, S.; Sahin, O. Hyper-Parameter Optimization of Deep Learning Architectures Using Artificial Bee Colony (ABC) Algorithm for High Performance Real-Time Automatic Colorectal Cancer (CRC) Polyp Detection. Appl. Intell. 2023, 53, 15603–15620. [Google Scholar] [CrossRef]
  27. Fouad, Z.; Alfonse, M.; Roushdy, M.; Salem, A.B.M. Hyper-Parameter Optimization of Convolutional Neural Network Based on Particle Swarm Optimization Algorithm. Bull. Electr. Eng. Inform. 2021, 10, 3377–3384. [Google Scholar] [CrossRef]
  28. Zhang, P.; Wu, H.N.; Chen, R.P.; Chan, T.H.T. Hybrid Meta-Heuristic and Machine Learning Algorithms for Tunneling-Induced Settlement Prediction: A Comparative Study. Tunn. Undergr. Space Technol. 2020, 99, 103383. [Google Scholar] [CrossRef]
  29. Quinlan, J.R. Improved Use of Continuous Attributes in C4.5. J. Artif. Intell. Res. 1996, 4, 77–90. [Google Scholar] [CrossRef]
  30. Eusuff, M.; Lansey, K.; Pasha, F. Shuffled Frog-Leaping Algorithm: A Memetic Meta-Heuristic for Discrete Optimization. Eng. Optim. 2006, 38, 129–154. [Google Scholar] [CrossRef]
  31. Mirjalili, S. Moth-Flame Optimization Algorithm: A Novel Nature-Inspired Heuristic Paradigm. Knowl.-Based Syst. 2015, 89, 228–249. [Google Scholar] [CrossRef]
  32. Kennedy, J.; Eberhart, R. Particle Swarm Optimization. In Proceedings of the ICNN’95—International Conference on Neural Networks, Perth, WA, Australia, 27 November–1 December 1995; pp. 1942–1948. [Google Scholar] [CrossRef]
  33. Ding, X.; Hasanipanah, M.; Ulrikh, D.V. Hybrid Metaheuristic Optimization Algorithms with Least-Squares Support Vector Machine and Boosted Regression Tree Models for Prediction of Air-Blast Due to Mine Blasting. Nat. Resour. Res. 2024, 33, 1349–1363. [Google Scholar] [CrossRef]
  34. Mahmoodzadeh, A.; Nejati, H.R.; Mohammadi, M.; Hashim Ibrahim, H.; Khishe, M.; Rashidi, S.; Hussein Mohammed, A. Developing Six Hybrid Machine Learning Models Based on Gaussian Process Regression and Meta-Heuristic Optimization Algorithms for Prediction of Duration and Cost of Road Tunnels Construction. Tunn. Undergr. Space Technol. 2022, 130, 104759. [Google Scholar] [CrossRef]
  35. Hasan, S.; Elwakil, E. Operational Based Stochastic Cluster Regression-Based Modeling for Predicting Condition Rating of Highway Tunnels. Can. J. Civ. Eng. 2021, 48, 1601–1611. [Google Scholar] [CrossRef]
  36. Zhao, D.; Yang, Y.; Cao, C.; Liu, B. Prediction Models and Feature Importance Analysis for Service State of Tunnel Sections Based on Machine Learning. Appl. Sci. 2024, 14, 9167. [Google Scholar] [CrossRef]
  37. Gao, W.; Chen, X.; Chen, D. Genetic Programming Approach for Predicting Service Life of Tunnel Structures Subject to Chloride-Induced Corrosion. J. Adv. Res. 2019, 20, 141–152. [Google Scholar] [CrossRef] [PubMed]
  38. Wang, A.; Togo, R.; Ogawa, T.; Haseyama, M. Defect Detection of Subway Tunnels Using Advanced U-Net Network. Sensors 2022, 22, 2330. [Google Scholar] [CrossRef]
  39. Wu, J.; Zhang, X. Tunnel Crack Detection Method and Crack Image Processing Algorithm Based on Improved Retinex and Deep Learning. Sensors 2023, 23, 9140. [Google Scholar] [CrossRef]
  40. Huang, H.; Zhao, S.; Zhang, D.; Chen, J. Deep Learning-Based Instance Segmentation of Cracks from Shield Tunnel Lining Images. Struct. Infrastruct. Eng. 2022, 18, 183–196. [Google Scholar] [CrossRef]
  41. Xu, H.; Wang, M.; Liu, C.; Li, F.; Xie, C. Automatic Detection of Tunnel Lining Crack Based on Mobile Image Acquisition System and Deep Learning Ensemble Model. Tunn. Undergr. Space Technol. 2024, 154. [Google Scholar] [CrossRef]
  42. Liu, J.; Niu, P.; Kou, L.; Chang, H.; Guo, F. An Improved Block-Level Approach for Tunnel Lining Crack Detection. Intell. Transp. Infrastruct. 2024, 3, liae011. [Google Scholar] [CrossRef]
  43. Wang, H.; Wang, Q.; Zhang, W.; Zhai, J.; Yuan, D.; Tong, J.; Xie, X.; Zhou, B.; Tian, H. A Deep Learning-Based Watershed Feature Fusion Approach for Tunnel Crack Segmentation in Complex Backgrounds. Materials 2025, 18, 142. [Google Scholar] [CrossRef]
  44. Feng, Y.; Feng, S.J.; Zhang, X.L.; Zhang, D.M.; Zhao, Y. A Two-Step Deep Learning-Based Framework for Metro Tunnel Lining Defect Recognition. Tunn. Undergr. Space Technol. 2024, 150, 105832. [Google Scholar] [CrossRef]
  45. Xie, X.; Zhai, J.; Zhou, B. Back-Fill Grouting Quality Evaluation of the Shield Tunnel Using Ground Penetrating Radar with Bi-Frequency Back Projection Method. Autom. Constr. 2021, 121, 103435. [Google Scholar]
  46. Harseno, R.W.; Lee, S.J.; Kee, S.H.; Kim, S. Evaluation of Air-Cavities behind Concrete Tunnel Linings Using GPR Measurements. Remote Sens. 2022, 14, 5348. [Google Scholar] [CrossRef]
  47. Wu, X.; Bao, X.; Shen, J.; Chen, X.; Cui, H. Evaluation of Void Defects behind Tunnel Lining through GPR Forward Simulation. Sensors 2022, 22, 9702. [Google Scholar] [CrossRef] [PubMed]
  48. Bu, G.P.; Lee, J.H.; Guan, H.; Loo, Y.C.; Blumenstein, M. Prediction of Long-Term Bridge Performance: Integrated Deterioration Approach with Case Studies. J. Perform. Constr. Facil. 2015, 29, 04014089. [Google Scholar] [CrossRef]
  49. Chernigovskaya, M.; Nahhas, A.; Kharitonov, A.; Turowski, K. Hyper-Parameter Optimization in the Context of Smart Manufacturing: A Systematic Literature Review. Procedia Comput. Sci. 2024, 232, 804–812. [Google Scholar]
  50. Harizi, I.; Aldahri, T.; Chebli, D.; Tahraoui, H.; Bouguettoucha, A.; Rohani, S.; Zhang, J.; Amrane, A. Gaussian Process Regression with Levy Flight Optimization: Advanced AR66 Adsorption Studies. Chem. Eng. Res. Des. 2024, 207, 192–208. [Google Scholar] [CrossRef]
  51. Federal Highway Administration. Specifications for the National Tunnel Inventory; Federal Highway Administration: Washington, DC, USA, 2015. [Google Scholar]
  52. Massachusetts Department of Transportation. Tunnel Inspection Handbook 2018 Edition; Massachusetts Department of Transportation: Boston, MA, USA, 2018. [Google Scholar]
  53. Federal Highway Administration. Tunnel Operations, Maintenance, Inspection, and Evaluation (TOMIE) Manual; Federal Highway Administration: Washington, DC, USA, 2015. [Google Scholar]
  54. AASHTO Technical Committee for Tunnels. Best Practices for Implementing Quality Control and Quality Assurance for Tunnel Inspection; Gannett Fleming, Inc.: Camp Hill, PA, USA, 2009. [Google Scholar]
  55. Federal Highway Administration. Download NTI Data. Available online: https://www.fhwa.dot.gov/bridge/inspection/tunnel/inventory/download.cfm (accessed on 11 November 2024).
  56. Federal Highway Adminstratton. National Tunnel Inspection Standards. Available online: https://www.federalregister.gov/documents/2015/07/14/2015-16896/national-tunnel-inspection-standards (accessed on 15 November 2024).
  57. Nafees, A.; Khan, S.; Javed, M.F.; Alrowais, R.; Mohamed, A.M.; Mohamed, A.; Vatin, N.I. Forecasting the Mechanical Properties of Plastic Concrete Employing Experimental Data Using Machine Learning Algorithms: DT, MLPNN, SVM, and RF. Polymers 2022, 14, 1583. [Google Scholar] [CrossRef]
  58. Owusu-Ansah, D.; Tinoco, J.; Correia, A.A.S.; Oliveira, P.J.V. Prediction of Elastic Modulus for Fibre-Reinforced Soil-Cement Mixtures: A Machine Learning Approach. Appl. Sci. 2022, 12, 8540. [Google Scholar] [CrossRef]
  59. Georgioudakis, M.; Plevris, V. Response Spectrum Analysis of Multi-Story Shear Buildings Using Machine Learning Techniques. Computation 2023, 11, 126. [Google Scholar] [CrossRef]
  60. Kazemi, P.; Ghisi, A.; Mariani, S. Classification of the Structural Behavior of Tall Buildings with a Diagrid Structure: A Machine Learning-Based Approach. Algorithms 2022, 15, 349. [Google Scholar] [CrossRef]
  61. Esfandiari, M.J.; Urgessa, G.S. Progressive Collapse Design of Reinforced Concrete Frames Using Structural Optimization and Machine Learning. Structures 2020, 28, 1252–1264. [Google Scholar] [CrossRef]
  62. Pizarro, P.N.; Massone, L.M. Structural Design of Reinforced Concrete Buildings Based on Deep Neural Networks. Eng. Struct. 2021, 241, 112377. [Google Scholar] [CrossRef]
  63. Graciano, C.; Kurtoglu, A.E.; Casanova, E. Machine Learning Approach for Predicting the Patch Load Resistance of Slender Austenitic Stainless Steel Girders. Structures 2021, 30, 198–205. [Google Scholar] [CrossRef]
  64. Liu, Y.; Wei, S.Z.; Jiang, T. Design of Chromium-Vanadium Steel Based on Design Loop Combining Property-Oriented Design Criteria and Machine Learning Prediction Model. J. Mater. Res. Technol. 2024, 32, 86–96. [Google Scholar] [CrossRef]
  65. Zhang, S.; Li, X. A Comparative Study of Machine Learning Regression Models for Predicting Construction Duration. J. Asian Archit. Build. Eng. 2024, 23, 1980–1996. [Google Scholar] [CrossRef]
  66. Karki, S.; Hadikusumo, B. Machine Learning for the Identification of Competent Project Managers for Construction Projects in Nepal. Constr. Innov. 2023, 23, 1–18. [Google Scholar] [CrossRef]
  67. Ahmadi, M.; Kioumarsi, M. Predicting the Elastic Modulus of Normal and High Strength Concretes Using Hybrid ANN-PSO. Mater. Today Proc. 2023, in press. [CrossRef]
  68. Hoang, N.-D.; Nguyen, Q.-L.; Tien Bui, D. Image Processing–Based Classification of Asphalt Pavement Cracks Using Support Vector Machine Optimized by Artificial Bee Colony. J. Comput. Civ. Eng. 2018, 32, 04018037. [Google Scholar] [CrossRef]
  69. Wang, H.; Moayedi, H.; Kok Foong, L. Genetic Algorithm Hybridized with Multilayer Perceptron to Have an Economical Slope Stability Design. Eng. Comput. 2021, 37, 3067–3078. [Google Scholar] [CrossRef]
  70. Ghasemi, Z.; Neumann, F.; Zanin, M.; Karageorgos, J.; Chen, L. A Comparative Study of Prediction Methods for Semi-Autogenous Grinding Mill Throughput. Miner. Eng. 2024, 205, 108458. [Google Scholar] [CrossRef]
  71. Bajwa, R.; Yapici, M.K. Machine Learning-Based Modeling and Generic Design Optimization Methodology for Radio-Frequency Microelectromechanical Devices. Sensors 2023, 23, 4001. [Google Scholar] [CrossRef] [PubMed]
  72. Öngelen, G.; İnkaya, T. A Novel LOF-Based Ensemble Regression Tree Methodology. Neural Comput. Appl. 2023, 35, 19453–19463. [Google Scholar] [CrossRef]
  73. Mirjalili, S.; Lewis, A. The Whale Optimization Algorithm. Adv. Eng. Softw. 2016, 95, 51–67. [Google Scholar] [CrossRef]
  74. Hayyolalam, V.; Pourhaji Kazem, A.A. Black Widow Optimization Algorithm: A Novel Meta-Heuristic Approach for Solving Engineering Optimization Problems. Eng. Appl. Artif. Intell. 2020, 87, 103249. [Google Scholar] [CrossRef]
  75. Rao, R.V.; Savsani, V.J.; Vakharia, D.P. Teaching-Learning-Based Optimization: A Novel Method for Constrained Mechanical Design Optimization Problems. CAD Comput. Aided Des. 2011, 43, 303–315. [Google Scholar] [CrossRef]
  76. Ferahtia, S.; Houari, A.; Rezk, H.; Djerioui, A.; Machmoum, M.; Motahhir, S.; Ait-Ahmed, M. Red-Tailed Hawk Algorithm for Numerical Optimization and Real-World Problems. Sci. Rep. 2023, 13, 12950. [Google Scholar] [CrossRef]
  77. Mirjalili, S.; Mirjalili, S.M.; Hatamlou, A. Multi-Verse Optimizer: A Nature-Inspired Algorithm for Global Optimization. Neural Comput. Appl. 2016, 27, 495–513. [Google Scholar] [CrossRef]
  78. Faridmehr, I.; Nehdi, M.L.; Davoudkhani, I.F.; Poolad, A. Mountaineering Team-Based Optimization: A Novel Human-Based Metaheuristic Algorithm. Mathematics 2023, 11, 1273. [Google Scholar] [CrossRef]
  79. Storn, R.M.; Price, K. Differential Evolution: A Simple and Efficient Adaptive Scheme for Global Optimization Over Continuous Spaces. J. Glob. Optim. 1997, 11, 341–359. [Google Scholar] [CrossRef]
  80. Zhao, S.; Zhang, T.; Ma, S.; Chen, M. Dandelion Optimizer: A Nature-Inspired Metaheuristic Algorithm for Engineering Applications. Eng. Appl. Artif. Intell. 2022, 114, 105075. [Google Scholar] [CrossRef]
  81. Mirjalili, S. Dragonfly Algorithm: A New Meta-Heuristic Optimization Technique for Solving Single-Objective, Discrete, and Multi-Objective Problems. Neural Comput. Appl. 2016, 27, 1053–1073. [Google Scholar] [CrossRef]
  82. Liu, W.; Shao, Y.; Chen, K.; Li, C.; Luo, H. Whale Optimization Algorithm-Based Point Cloud Data Processing Method for Sewer Pipeline Inspection. Autom. Constr. 2022, 141, 104423. [Google Scholar] [CrossRef]
  83. Abdelkader, E.M.; Moselhi, O.; Marzouk, M.; Zayed, T. An Exponential Chaotic Differential Evolution Algorithm for Optimizing Bridge Maintenance Plans. Autom. Constr. 2022, 134, 104107. [Google Scholar] [CrossRef]
  84. AL-Smadi, H.; Al-Sakkaf, A.; Zayed, T.; Nasiri, F. An Integrated Space-Based Building Maintenance Management Model Using Multi-Objective Optimization. Smart Sustain. Built Environ. 2023, 12, 277–297. [Google Scholar] [CrossRef]
  85. Elshaboury, N.; Abdelkader, E.M.; Al-Sakkaf, A.; Alfalah, G. Teaching-Learning-Based Optimization of Neural Networks for Water Supply Pipe Condition Prediction. Water 2021, 13, 3546. [Google Scholar] [CrossRef]
  86. Alshinwan, M.; Abualigah, L.; Shehab, M.; Elaziz, M.A.; Khasawneh, A.M.; Alabool, H.; Hamad, H. Al Dragonfly Algorithm: A Comprehensive Survey of Its Results, Variants, and Applications. Multimed. Tools Appl. 2021, 80, 14979–15016. [Google Scholar] [CrossRef]
  87. Shehab, M.; Shambour, M.K.Y.; Abu Hashem, M.A.; Al Hamad, H.A.; Shannaq, F.; Mizher, M.; Jaradat, G.; Daoud, M.S.; Abualigah, L. A Survey and Recent Advances in Black Widow Optimization: Variants and Applications. Neural Comput. Appl. 2024. [Google Scholar] [CrossRef]
  88. Hu, G.; Zheng, Y.; Abualigah, L.; Hussien, A.G. DETDO: An Adaptive Hybrid Dandelion Optimizer for Engineering Optimization. Adv. Eng. Inform. 2023, 57, 102004. [Google Scholar] [CrossRef]
  89. Stow, C.A.; Jolliff, J.; McGillicuddy, D.J.; Doney, S.C.; Allen, J.I.; Friedrichs, M.A.M.; Rose, K.A.; Wallhead, P. Skill Assessment for Coupled Biological/Physical Models of Marine Systems. J. Mar. Syst. 2009, 76, 4–15. [Google Scholar] [CrossRef]
  90. Karthiga, S.; Umamaheswari, N. Prediction of Displacement of Composite Slab with Profiled Steel Deck Using Artificial Neural Network. Asian J. Civ. Eng. 2024, 25, 4179–4196. [Google Scholar] [CrossRef]
  91. Al-Madi, N.; Faris, H.; Mirjalili, S. Binary multi-verse optimization algorithm for global optimization and discrete problems. Int. J. Mach. Learn. Cybern. 2019, 10, 3445–3465. [Google Scholar] [CrossRef]
  92. Arun Kumar, R.; Vijay Franklin, J.; Koppula, N. A Comprehensive Survey on Metaheuristic Algorithm for Feature Selection Techniques. Mater. Today Proc. 2022, 64, 435–441. [Google Scholar]
  93. Cheng, M.Y.; Cao, M.T.; Jaya Mendrofa, A.Y. Dynamic Feature Selection for Accurately Predicting Construction Productivity Using Symbiotic Organisms Search-Optimized Least Square Support Vector Machine. J. Build. Eng. 2021, 35, 101973. [Google Scholar] [CrossRef]
  94. Talpur, N.; Abdulkadir, S.J.; Hasan, M.H.; Alhussian, H.; Alwadain, A. A Novel Wrapper-Based Optimization Algorithm for the Feature Selection and Classification. Comput. Mater. Contin. 2023, 74, 5799–5820. [Google Scholar] [CrossRef]
  95. Alzaqebah, M.; Jawarneh, S.; Mohammad, R.M.A.; Alsmadi, M.K.; Al-Marashdeh, I.; Ahmed, E.A.E.; Alrefai, N.; Alghamdi, F.A. Hybrid Feature Selection Method Based on Particle Swarm Optimization and Adaptive Local Search Method. Int. J. Electr. Comput. Eng. 2021, 11, 2414–2422. [Google Scholar] [CrossRef]
  96. Pham, T.H.; Raahemi, B. Bio-Inspired Feature Selection Algorithms With Their Applications: A Systematic Literature Review. IEEE Access 2023, 11, 43733–43758. [Google Scholar] [CrossRef]
  97. Krishnaveni, N. Feature Selection Algorithms for Data Mining Classification: A Survey. Indian J. Sci. Technol. 2019, 12, 1–11. [Google Scholar] [CrossRef]
  98. Mustafa, R.; Samui, P.; Kumari, S.; Armaghani, D.J. Appraisal of Numerous Machine Learning Techniques for the Prediction of Bearing Capacity of Strip Footings Subjected to Inclined Loading. Model. Earth Syst. Environ. 2024, 10, 4067–4088. [Google Scholar] [CrossRef]
  99. Mustafa, R.; Ahmad, M.T. Probabilistic Study of Liquefaction Response of Soil Based on Standard Penetration Test (SPT) Data Using Machine Learning Techniques. Transp. Infrastruct. Geotechnol. 2025, 12, 42. [Google Scholar] [CrossRef]
  100. Kumar, M.; Biswas, R.; Kumar, D.R.; Samui, P.; Kaloop, M.R.; Eldessouki, M. Soft Computing-Based Prediction Models for Compressive Strength of Concrete. Case Stud. Constr. Mater. 2023, 19, e02321. [Google Scholar] [CrossRef]
  101. Mustafa, R.; Ahmad, M.T. Reliability Analysis of Pile Foundation in Cohesionless Soil Using Machine Learning Techniques. Transp. Infrastruct. Geotechnol. 2024, 11, 2671–2699. [Google Scholar] [CrossRef]
  102. Nguyen, H.; Vu, T.; Vo, T.P.; Thai, H.T. Efficient Machine Learning Models for Prediction of Concrete Strengths. Constr. Build. Mater. 2021, 266, 120950. [Google Scholar] [CrossRef]
  103. Guo, H.; Huang, J.J.; Zhu, X.; Wang, B.; Tian, S.; Xu, W.; Mai, Y. A Generalized Machine Learning Approach for Dissolved Oxygen Estimation at Multiple Spatiotemporal Scales Using Remote Sensing. Environ. Pollut. 2021, 288, 117734. [Google Scholar] [CrossRef]
  104. Singh, R.B.; Olbert, A.I.; Samantra, A.; Uddin, M.G. AI-Driven Modelling Approaches for Predicting Oxygen Levels in Aquatic Environments. J. Water Process Eng. 2024, 66, 105940. [Google Scholar] [CrossRef]
  105. Fan, J.; Wu, L.; Zhang, F.; Cai, H.; Ma, X.; Bai, H. Evaluation and Development of Empirical Models for Estimating Daily and Monthly Mean Daily Diffuse Horizontal Solar Radiation for Different Climatic Regions of China. Renew. Sustain. Energy Rev. 2019, 105, 168–186. [Google Scholar] [CrossRef]
  106. Boye, C.B.; Boye, P.; Ziggah, Y.Y. Comparative Study of Suspended Sediment Load Prediction Models Based on Artificial Intelligence Methods. Artif. Intell. Appl. 2023, 2, 155–168. [Google Scholar] [CrossRef]
Figure 1. Framework of the developed deterioration prediction model of tunnel elements.
Mathematics 13 01021 g001
Figure 2. Convergence curves of the metaheuristic-based regression tree models for (a) cast-in-place concrete tunnel liners, (b) concrete cross passageway, (c) concrete interior walls, and (d) concrete portals.
Mathematics 13 01021 g002
Figure 3. Convergence curves of the metaheuristic-based regression tree models for (a) concrete slab on grade and (b) gaskets.
Mathematics 13 01021 g003
Figure 4. Error histograms of some deterioration models for cast-in-place concrete tunnel liners and concrete cross passageway. (a,b) REGT-MTBO and SVM for cast-in-place concrete tunnel liners; (c,d) REGT-MVO and SVM or concrete cross passageway.
Mathematics 13 01021 g004
Figure 5. Error histograms of some deterioration models for concrete interior walls and concrete portals. (a,b) REGT-DA and SVM for concrete interior walls; (c,d) REGT-MTBO and FFNN for concrete portals.
Mathematics 13 01021 g005
Figure 6. Error histograms of some deterioration models for concrete slab on grade and gaskets. (a,b) REGT-MVO and FFNN for concrete slab on grade; (c,d) are REGT-DE and FFNN for gaskets.
Mathematics 13 01021 g006aMathematics 13 01021 g006b
Figure 7. Illustration of the AIC values for (a) cast-in-place concrete tunnel liners and (b) concrete cross passageway.
Mathematics 13 01021 g007aMathematics 13 01021 g007b
Figure 8. Illustration of the AIC values for (a) cast interior walls and (b) concrete portals.
Mathematics 13 01021 g008aMathematics 13 01021 g008b
Figure 9. Illustration of the AIC values for (a) cast slab on grade and (b) gaskets.
Mathematics 13 01021 g009aMathematics 13 01021 g009b
Figure 10. PSC values for (a) cast-in-place concrete tunnel liners and (b) concrete cross passageway.
Mathematics 13 01021 g010aMathematics 13 01021 g010b
Figure 11. PSC values for (a) cast interior walls and (b) concrete portals.
Mathematics 13 01021 g011aMathematics 13 01021 g011b
Figure 12. PSC values for (a) cast slab on grade and (b) gaskets.
Mathematics 13 01021 g012aMathematics 13 01021 g012b
Figure 13. Visual illustration of actual and predicted condition obtained by (a) REGT-MTBO (cast-in-place concrete tunnel liners) and (b) REGT-MVO (concrete cross passageway).
Mathematics 13 01021 g013
Figure 14. Visual illustration of actual and predicted condition obtained by (a) REGT-DA (concrete interior walls) and (b) REGT-MTBO (concrete portals).
Mathematics 13 01021 g014
Figure 15. Visual illustration of actual and predicted condition obtained by (a) REGT-MVO (concrete slab on grade) and (b) REGT-DE (gaskets).
Mathematics 13 01021 g015
Figure 16. Target diagrams of deterioration models for (a) cast-in-place concrete tunnel liners and (b) concrete cross passageway.
Mathematics 13 01021 g016
Figure 17. Target diagrams of deterioration models for (a) cast interior walls and (b) concrete portals.
Mathematics 13 01021 g017
Figure 18. Target diagrams of deterioration models for (a) cast slab on grade and (b) gaskets.
Mathematics 13 01021 g018
Table 1. Descriptions of potential deterioration factors of tunnels.
VariableDescription
Age “X1Age of the tunnel from the construction year
Age from rehabilitation “X2Number of years from the rehabilitation year
Total number of lanes “X3Number of highway lanes in the tunnel
Annual average daily traffic “X4The most recent annual average daily traffic (AADT) for the route. The bidirectional AADT is considered for two-way tunnels, while unidirectional AADT is accommodated for one-way tunnels
Annual average daily truck traffic “X5Annual average daily truck traffic (AADTT) in the route before closure takes place
Detour length “X6The additional travel length of a vehicle produced from tunnel’s closure
Service in tunnel “X7The type of service can be (1) highway, (2) highway and railroad, (3) highway and pedestrian, (4) highway, railroad, and pedestrian, or (5) other
NHS designation “X8NHS is the national highway system, and the inventory route can be either on the national highway system (1) or not (0)
STRAHNET designation “X9STRAHNET is the strategic highway network, and it is a composition of interstate, primary highways, and connectors that grant access to the critical installations and ports of the United States. STRAHNET designation can be 1 if the inventory route is part of STRAHNET or 0 if it is not
Functional classification “X10The possible functional classifications of inventory routes are (1) interstate, (2) principal arterial (other freeways and expressways), (3) principal arterial, (4) minor arterial, (5) major collector, (6) minor collector, and (7) local
Tunnel length “X11The tunnel length measured along the centerline of the roadway
Roadway width “X12The minimum distance between rails or curbs on the tunnel roadway
Hazardous material selection “X13It can be either one of two options: (1) if the tunnel has a hazardous material restriction, and (0) if it does not
Number of bores “X14Number of bores in a certain tunnel
Tunnel shape “X15The possible types of tunnel shapes are (1) oval, (2) horseshoe, (3) rectangular, and (4) circular
Portal shape “X16The possible types of portal shapes are (1) oval, (2) horseshoe, (3) rectangular, (4) circular, and (5) other
Ground conditions “X17The types of ground conditions are (1) soil, (2) rock, and (3) mixed face
Complexity “X18A complex tunnel is distinguished by the presence of advanced structural elements or functional systems; the tunnel can be either (1) complex or (0) non-complex
Condition stateTunnel element can be in one of four condition states:
(1)
Good with no significant defects;
(2)
Fair with isolated deteriorated areas;
(3)
Poor with widespread breakdowns that do not reduce load capacity;
(4)
Severe with an urgent need to review the strength and serviceability of the tunnel.
Table 2. Values of tuning parameters of metaheuristics.
AlgorithmParameterValue
Common parametersMaximum number of iterations300
Population size50
Number of search agents 22
WOAb (shape constant of the logarithmic spiral)1
BWOACR (cannibalism rate) 0.44
PP (procreate rate)0.6
Pm (mutation rate) 0.4
RTHA (angle gain) 15
Ro (primary radius) 0.5
R (control gain) 1.5
MVOMinimum wormhole existence probability 0.2
Maximum wormhole existence probability 1
P (accuracy of exploitation within iterations)6
PSOInertia weight1
Inertia weight damping ratio0.99
Personal learning coefficient 1.5
Global learning coefficient 2
DECrossover probability 0.2
Lower bound of scaling factor 0.2
Upper bound of scaling factor 0.8
DAβ1.5
Table 3. Performance scores of deterioration models of cast-in-place concrete tunnel liners and concrete cross passageway (testing dataset).
Cast-in-Place Concrete Tunnel Liners
Deterioration ModelMAEMAPERMSPERMSENRMSEU95
REGT-WOA0.0392.227%10.948%0.1960.2010.572
REGT-BWOA0.0462.600%11.441%0.2150.2150.617
REGT-TLBO0.0422.467%11.323%0.2050.2050.590
REGT-RTH0.0452.728%12.731%0.2130.2150.614
REGT-PSO0.0532.867%14.085%0.2310.2460.686
REGT-MVO0.0382.209%11.466%0.1950.2030.574
REGT-MTBO0.0371.893%10.027%0.1920.2030.570
REGT-DE0.0412.407%12.229%0.2010.2080.589
REGT-DOA0.0442.461%11.322%0.2100.2090.601
REGT-DA0.0533.209%13.323%0.2290.2250.651
SVM0.19415.763%17.236%0.4400.2740.972
CNN0.15010.817%16.570%0.3880.2930.940
GRNN0.1258.502%15.297%0.3530.2820.885
ENN0.14910.768%16.413%0.3860.2920.936
FFNN0.15912.082%17.498%0.3990.2810.936
Concrete Cross Passageway
Deterioration ModelMAEMAPERMSPERMSENRMSEU95
REGT-WOA0.20813.788%31.881%0.4560.3361.199
REGT-BWOA0.23718.175%36.001%0.4860.3381.228
REGT-TLBO0.18913.528%32.442%0.4350.3201.150
REGT-RTH0.26820.909%39.791%0.5180.3671.310
REGT-PSO0.21015.584%31.583%0.4580.2981.127
REGT-MVO0.14910.173%26.077%0.3860.2681.000
REGT-MTBO0.20214.394%32.746%0.4500.3251.173
REGT-DE0.21516.017%35.483%0.4640.3301.195
REGT-DOA0.20214.394%32.746%0.4500.3251.173
REGT-DA0.25419.264%38.341%0.5040.3551.276
SVM0.36327.024%41.111%0.6030.4031.432
CNN0.53443.865%52.017%0.7310.4671.585
GRNN0.40532.115%44.770%0.6360.4131.464
ENN0.44036.598%54.490%0.6630.4461.539
FFNN0.45337.525%47.142%0.6730.4121.471
Table 4. Performance scores of deterioration models of concrete interior walls and concrete portals (testing dataset).
Concrete Interior Walls
Deterioration ModelMAEMAPERMSPERMSENRMSEU95
REGT-WOA0.15210.503%19.786%0.3900.3261.001
REGT-BWOA0.17212.154%20.014%0.4150.3401.047
REGT-TLBO0.1419.345%18.943%0.3760.3310.993
REGT-RTH0.1389.470%21.334%0.3710.3250.979
REGT-PSO0.17111.566%17.956%0.4140.3491.060
REGT-MVO0.1398.991%19.117%0.3730.3330.994
REGT-MTBO0.1248.225%23.189%0.3520.3450.992
REGT-DE0.15610.589%18.655%0.3950.3331.017
REGT-DOA0.17712.203%18.421%0.4210.3481.067
REGT-DA0.0925.604%17.507%0.3030.3010.867
SVM0.23418.495%23.923%0.4840.3491.126
CNN0.22116.453%22.158%0.4700.3621.133
GRNN0.19213.489%21.793%0.4390.3651.109
ENN0.19914.190%22.109%0.4460.3681.120
FFNN0.19413.483%22.246%0.4410.3741.126
Concrete Portals
Deterioration ModelMAEMAPERMSPERMSENRMSEU95
REGT-WOA0.0331.886%10.206%0.1810.1790.517
REGT-BWOA0.0331.912%9.532%0.1820.1580.486
REGT-TLBO0.0241.458%9.056%0.1560.1420.428
REGT-RTH0.0251.623%10.269%0.1580.1470.437
REGT-PSO0.0342.216%12.316%0.1850.1680.504
REGT-MVO0.0201.151%8.374%0.1400.1340.393
REGT-MTBO0.0201.151%8.374%0.1400.1340.393
REGT-DE0.0241.458%9.056%0.1560.1420.428
REGT-DOA0.0271.579%9.371%0.1640.1490.448
REGT-DA0.0271.572%8.830%0.1640.1440.441
SVM0.19616.261%17.464%0.4430.2640.960
CNN0.16512.566%17.166%0.4060.2880.951
GRNN0.1339.391%16.003%0.3650.2840.900
ENN0.13710.559%16.695%0.3700.2600.871
FFNN0.14010.503%15.804%0.3750.2680.888
Table 5. Performance scores of deterioration models of concrete slab on grade and gaskets (testing dataset).
Concrete Slab on Grade
Deterioration ModelMAEMAPERMSPERMSENRMSEU95
REGT-WOA0.0311.932%11.702%0.1770.2040.542
REGT-BWOA0.0311.860%10.874%0.1760.2030.539
REGT-TLBO0.0352.318%12.445%0.1870.2080.560
REGT-RTH0.0291.711%10.479%0.1700.1980.524
REGT-PSO0.0301.959%11.638%0.1730.2020.533
REGT-MVO0.0281.587%9.308%0.1670.1930.513
REGT-MTBO0.0352.312%12.525%0.1870.2090.562
REGT-DE0.0322.025%11.289%0.1790.2020.541
REGT-DOA0.0342.246%12.525%0.1850.2080.559
REGT-DA0.0321.987%11.897%0.1780.2050.545
SVM0.16514.335%15.433%0.4060.2410.881
CNN0.12610.198%13.974%0.3560.2450.824
GRNN0.0966.944%12.644%0.3100.2480.771
ENN0.1169.224%13.688%0.3400.2410.801
FFNN0.14912.391%16.004%0.3870.2630.884
Gaskets
Deterioration ModelMAEMAPERMSPERMSENRMSEU95
REGT-WOA0.15513.627%31.621%0.3940.2890.984
REGT-BWOA0.12210.181%27.008%0.3490.2640.893
REGT-TLBO0.11810.085%27.752%0.3440.2610.883
REGT-RTH0.12010.145%27.829%0.3460.2640.889
REGT-PSO0.12910.495%27.031%0.3580.2610.900
REGT-MVO0.11910.797%30.175%0.3450.2690.897
REGT-MTBO0.12310.870%30.096%0.3510.2790.920
REGT-DE0.0978.031%23.361%0.3110.2250.785
REGT-DOA0.14011.534%27.888%0.3740.2760.942
REGT-DA0.15313.023%31.026%0.3910.2880.978
SVM0.35328.804%31.711%0.5940.3431.238
CNN0.29124.097%33.752%0.5390.3501.214
GRNN0.26822.342%32.480%0.5180.3281.162
ENN0.23320.798%32.107%0.4820.2941.080
FFNN0.27725.276%41.038%0.5260.3591.220
Table 6. Details of OBJ values (cast-in-place concrete tunnel liners and concrete cross passageway).
Deterioration ModelCast-in-Place Concrete Tunnel LinersConcrete Cross Passageway
OBJ ValueRankOBJ ValueRank
REGT-WOA0.037430.22897
REGT-BWOA0.047980.26078
REGT-TLBO0.042050.20013
REGT-RTH0.046170.315110
REGT-PSO0.0679100.18722
REGT-MVO0.037020.12641
REGT-MTBO0.032610.21524
REGT-DE0.040340.22206
REGT-DOA0.045760.21524
REGT-DA0.061790.26389
SVM0.2460110.622411
CNN1.2766151.861715
GRNN0.6323120.764012
ENN1.1299140.786813
FFNN0.8667130.943714
Table 7. Details of OBJ values (concrete interior walls and concrete portals).
Deterioration ModelConcrete Interior WallsConcrete Portals
OBJ ValueRankOBJ ValueRank
REGT-WOA0.573050.02498
REGT-BWOA1.137880.02699
REGT-TLBO0.562140.01933
REGT-RTH0.422630.01935
REGT-PSO2.9393110.027010
REGT-MVO0.616560.01541
REGT-MTBO0.410520.01541
REGT-DE0.767770.01933
REGT-DOA2.8221100.02086
REGT-DA0.147710.02217
SVM1.856890.181011
CNN24.7867131.312215
GRNN27.0770140.811814
ENN16.0947120.414912
FFNN110.4573150.491513
Table 8. Details of OBJ values (concrete slab on grade and gaskets).
Deterioration ModelConcrete Interior WallsConcrete Portals
OBJ ValueRankOBJ ValueRank
REGT-WOA0.038940.15529
REGT-BWOA0.039350.12096
REGT-TLBO0.044990.10733
REGT-RTH0.034730.11365
REGT-PSO0.033110.13787
REGT-MVO0.033220.09692
REGT-MTBO0.0457100.10774
REGT-DE0.040670.08991
REGT-DOA0.044080.14198
REGT-DA0.039860.161310
SVM0.2414111.079115
CNN1.4635130.944014
GRNN5.3867140.578713
ENN0.8567120.316311
FFNN7.7609150.367512
Table 9. Optimum architecture of the best performing deterioration models.
Tunnel ElementDeterioration ModelInfluential Deterioration FactorsOptimum Hyperparameters (psl, ps, ls, ns)
Cast-in-place concrete tunnel linersREGT-MTBOX1, X2, X3, X4, X5, X6, X7, X9, X10, X11, X12, X14, X15, X16, X17, and X18(all splits, 3, 2, and 1525)
Concrete cross passagewayREGT-MVOX1, X3, X6, X7, X8, X9, X11, X12, X13, X15, X17, and X18(all splits, 2, 2, and 837)
Concrete interior wallsREGT-DAX1, X2, X3, X4, X5, X6, X7, X9, X10, X11, X12, X13, X14, X16, X17, and X18(all splits, 2, 2, and 2000)
Concrete portalsREGT-MTBOX3, X4, X5, X6, X7, X8, X9, X10, X11, X12, X13, X14, and X17(all splits, 2, 2, and 2000)
Concrete slab on gradeREGT-MVOX3, X4, X7, X8, X9, X10, X11, X12, X13, X15, and X18(all splits, 4, 2, and 1182)
GasketsREGT-DEX2, X3, X7, X10, X11, X12, X13, X14 X15, X16, X17, and X18(interaction-curvature, 3, 2, and 1312)
Disclaimer/Publisher’s Note: The statements, opinions and data contained in all publications are solely those of the individual author(s) and contributor(s) and not of MDPI and/or the editor(s). MDPI and/or the editor(s) disclaim responsibility for any injury to people or property resulting from any ideas, methods, instructions or products referred to in the content.

