Article

Edge Computing-Enabled Train Fusion Positioning: Modeling and Analysis

1
School of Electronic Information Engineering, Beihang University, Beijing 100191, China
2
School of Automation and Intelligence, Beijing Jiaotong University, Beijing 100044, China
3
College of Electrical Engineering and Automation, Shandong University of Science and Technology, Qingdao 266590, China
*
Author to whom correspondence should be addressed.
Mathematics 2025, 13(6), 1015; https://doi.org/10.3390/math13061015
Submission received: 13 January 2025 / Revised: 27 February 2025 / Accepted: 18 March 2025 / Published: 20 March 2025
(This article belongs to the Section E2: Control Theory and Mechanics)

Abstract

:
For train control systems, the accuracy of positioning tracking is essential for ensuring the safety and efficiency of operations. Multi-source information fusion techniques can improve positioning accuracy, but the computational limitations of onboard equipment impede the real-time processing capabilities required by advanced information fusion algorithms. An innovative approach, which combines multi-sensor information fusion with edge computing, is proposed to reduce the computational load on onboard systems and accelerate data processing. Colored Petri Nets (CPNs) are utilized for the modeling and validation of the algorithm. State-space analysis is used to evaluate the functional safety of the proposed method. Numerical simulations are performed to identify the key factors affecting the train positioning method’s performance. These simulations also determine the minimal tracking interval required for effective operation under edge computing. The results show that the edge computing-based train fusion positioning method reduces data processing delays and improves positioning accuracy. This approach offers a practical solution for real-time and accurate train control systems.

1. Introduction

As the core control center of rail transit systems, the train control system (TCS) plays a crucial role in ensuring safe and efficient train operations. The train positioning system, serving as a critical component of TCS, provides real-time precise position information that forms the foundation for key functions such as train protection curve calculation and movement authority generation. Current positioning solutions predominantly employ a hybrid architecture combining onboard equipment (e.g., odometers and Doppler radars) with wayside facilities (e.g., balises and track circuits) [1], with satellite positioning technology additionally integrated in specific lines such as the Qinghai–Tibet Railway [2]. However, existing train positioning technologies based on vehicle-ground collaboration present a significant technical–economic contradiction: the pursuit of high-precision positioning necessitates high-density deployment of ground-based infrastructure, resulting in exponentially increasing system operation and maintenance costs. Notably, as rail transit systems evolve toward automated operation and intelligent maintenance paradigms [3], conventional positioning methodologies relying on dedicated ground equipment are becoming increasingly inadequate to meet the dual requirements of economic viability and operational reliability demanded by advanced train control systems. Consequently, achieving a technological breakthrough in ground equipment-independent autonomous train positioning has emerged as a critical pathway for advancing intelligent rail transportation development. Therefore, research on autonomous train positioning methodologies holds substantial theoretical significance and engineering application value, particularly in addressing the evolving needs of next-generation rail transit systems.
To address these technical challenges, researchers have conducted extensive explorations from multiple dimensions, leading to several representative solutions: machine vision-based roadside feature recognition [4], LiDAR point cloud matching [5], mobile communication-based base station positioning [6], and laser ranging-based dynamic correction [7]. Experimental data indicate that machine vision methods perform well for positioning under adequate illumination conditions but experience performance degradation in low-light environments, with complete functional failure occurring under adverse meteorological conditions (e.g., fog, rain, or snow). Although LiDAR point cloud matching technology overcomes illumination limitations inherent in optical imaging, its point cloud resolution remains visibility-dependent, failing to completely eliminate performance degradation or failure in severe weather scenarios. While mobile communication-based positioning solutions can leverage existing infrastructure, they exhibit significantly increased positioning errors in environments with pronounced multipath effects, such as tunnels. The laser ranging system demonstrates relatively low architectural complexity but is prone to position divergence in feature-sparse environments. Comprehensive analysis reveals that existing single-sensor modalities exhibit significant performance boundaries in complex operational environments, highlighting the technical bottleneck of current solutions in meeting the full-scenario positioning requirements of rail transit under diverse working conditions. In this context, multi-source information fusion positioning technology has emerged as a research focus [8], demonstrating enhanced environmental adaptability and higher reliability through coordinated integration of heterogeneous sensor data.
Notably, while improving positioning performance, multi-source fusion technology introduces significant computational demands: the exponential growth of data volume from multi-sensor acquisition, coupled with the requirement for sophisticated modeling to achieve heterogeneous data fusion. This poses substantial challenges to the processing capacity of onboard security computers, often necessitating auxiliary computing units in conventional architectures. Although cloud computing offers advantages in elastic computing resources, the data transmission between cloud platforms and onboard terminals suffers from unpredictable communication latency and bandwidth consumption. In contrast, edge computing demonstrates unique strengths in reducing latency sensitivity and communication overhead through its proximal deployment characteristics, thereby providing a viable technical pathway for engineering implementation of multi-source fusion positioning systems [9].
Edge computing demonstrates excellent performance in fast sensing and the computing of massive sensor data to optimize decision-making [10]. H. Song et al. [11] break the data segregation under an autonomous train control system (ATCS) by applying data prediction and edge computing-based information fusion to process real dynamic data and estimate train speed and position. L. Zhu et al. [12] proposed a collaborative train and edge computing framework to provide real-time communication and computation services. L. Li et al. [13] proposed a Mobile Edge Computing (MEC) framework for millimeter-wave train–ground communication systems and a resource allocation and computation offloading (RACO) algorithm. M. Saki et al. [14] proposed a new framework for a future data-driven Railway Condition Monitoring (RCM) system and designed an edge processing unit. E. Pencheva et al. [15] designed a new mobile edge service to provide core functionality for many railroad use cases, supporting data sessions for application launch and operation. Although existing methods have made significant advancements in edge computing and multi-sensor fusion for train positioning, they face limitations in ensuring reliable performance under dynamic conditions [16].
Additionally, the complex operating environment of trains under edge computing may lead to data transmission failures, and the dynamic changes in the computing resources capacity of edge servers may cause delays in processing the train’s positioning data [17]. Therefore, designing the data processing flow for fusion positioning methods of trains under edge computing and validating their reliability holds significant theoretical and practical value. Before a system is implemented in practical applications, verifying its reliability is crucial. To achieve this, an essential procedure that translates the system’s behaviors and performances into a computerized model is necessary. Formal methods play a pivotal role in this context by providing a clear and unambiguous description of a system’s properties using rigorous mathematical symbols and rules. This approach not only facilitates the identification of logical and functional deficiencies, but also significantly enhances design reliability [18].
The main contributions of this paper are as follows:
  • A novel train fusion positioning method is introduced, leveraging edge computing to reduce onboard computational load and enhance real-time positioning accuracy.
  • A CPN model is proposed to ensure the system’s reliability and functional safety, providing a formal verification framework.
  • State-space analysis is conducted to validate the system’s safety under various fault conditions, demonstrating resilience during communication failures and limited computing resources.
  • Numerical experiments analyze factors influencing data processing delays, and a reference boundary for train tracking under edge computing is calculated to ensure safe operations.

2. Preliminaries

2.1. Application of CPNs in System Modeling and Verification

Modeling is an essential step in abstractly describing a system’s behavior and structure, traditionally achieved using techniques like Unified Modeling Language (UML) [19]. It is noteworthy that formal modeling, mandated as a compulsory methodology in the industry certification standard EN 50128-2011 (Railway Applications—Communication, Signaling and Processing Systems), demonstrates high reliability and safety characteristics attributable to its mathematical rigor. However, these conventional approaches often prove inadequate in effectively capturing concurrency, parallelism, and synchronization within complex systems. To address these limitations, Petri Nets (PNs) provide a mathematically grounded graphical modeling language whose formal verification framework maintains full compatibility with formal specifications of system behaviors, enabling rigorous logical deduction and state space analysis.
PNs comprise three foundational components, places, transitions, and arcs, which collectively characterize system states and their dynamic evolution through token distribution and transition mechanisms. Through formal analysis methods such as reachability analysis and liveness verification, PNs facilitate rigorous validation of system properties, exhibiting significant advantages in complex engineering domains with stringent reliability requirements, particularly railway systems [20]. In railway applications, notable implementations include Song et al.’s application of CPN for establishing formal models and performing performance evaluation in automatic line management systems [21]; Das et al.’s safety analysis of railway level crossing operations focusing on pedestrian–train interaction dynamics [22]; and Outafraout et al.’s development of a Multimodal Transportation System (MTS) model based on Colored Hybrid Petri Nets (CHPNs), which implemented an optimal control strategy guided by just-in-time criteria for critical parameter optimization and validation [23].
CPNs, an extension of basic PNs, further enhance this modeling approach by introducing data types and structured tokens, enabling more detailed system representations [24]. CPNs support complex data processing and integrate timing parameters, which are essential for analyzing temporal performance in systems characterized by randomness and concurrency. These features, coupled with the use of Meta Language (ML) for efficient state-space analysis, make CPNs well suited for verifying both system safety and performance [25].
Compared to techniques like Fault Tree Analysis (FTA) [26], Bayesian networks [27], and Markov processes [28], CPNs offer a more robust framework for modeling and verifying systems with concurrent and random behaviors, ensuring functional safety and facilitating performance evaluation in complex systems.

2.2. Basic Modeling Theory of CPNs

The CPN model is formalized as a nine-tuple C P N = ( Σ , P , T , A , N , C , G , E , I ) [29], where
  • Σ denotes a finite non-empty set of colors, representing different types of tokens.
  • P is the set of places, serving as holding areas for tokens.
  • T represents the set of transitions, which are events that can change the state of the system.
  • A constitutes the set of arcs, directing the flow between places and transitions.
  • N is the node function N : A P × T T × P , mapping arcs to their source and target nodes.
  • C is the coloring function C : P Σ , assigning colors to places and defining the type of tokens they can contain.
  • G is the guard function, assigning Boolean conditions to transitions to control their firing.
  • E is the expression function, defining the conditions under which tokens can move across arcs.
  • I is the initialization function, setting the initial marking of places in the net.
The dynamics of the CPN model are characterized by several foundational properties:
  • Reachability: A state M 2 is reachable from M 1 if there exists a sequence of transitions that can transform M 1 into M 2 .
  • Boundedness: A place is bounded if there is a maximum number of tokens it can contain, ensuring that the net does not grow indefinitely.
  • Security: The model is secure if every place in the net has a finite upper bound on the number of tokens it can hold.
  • Liveness: A transition is live if it can eventually fire from any reachable state, preventing deadlocks.
  • Fairness: When multiple transition are enabled, each one has an equal chance to fire, preventing resource monopolization.
For a comprehensive analysis of the system’s behavior, it is essential to define and verify system functional safety-related characteristics based on domain knowledge, thereby ensuring the reliability of the system modeled with CPNs.

3. System Structure of Train Fusion Positioning Method Based on Edge Computing

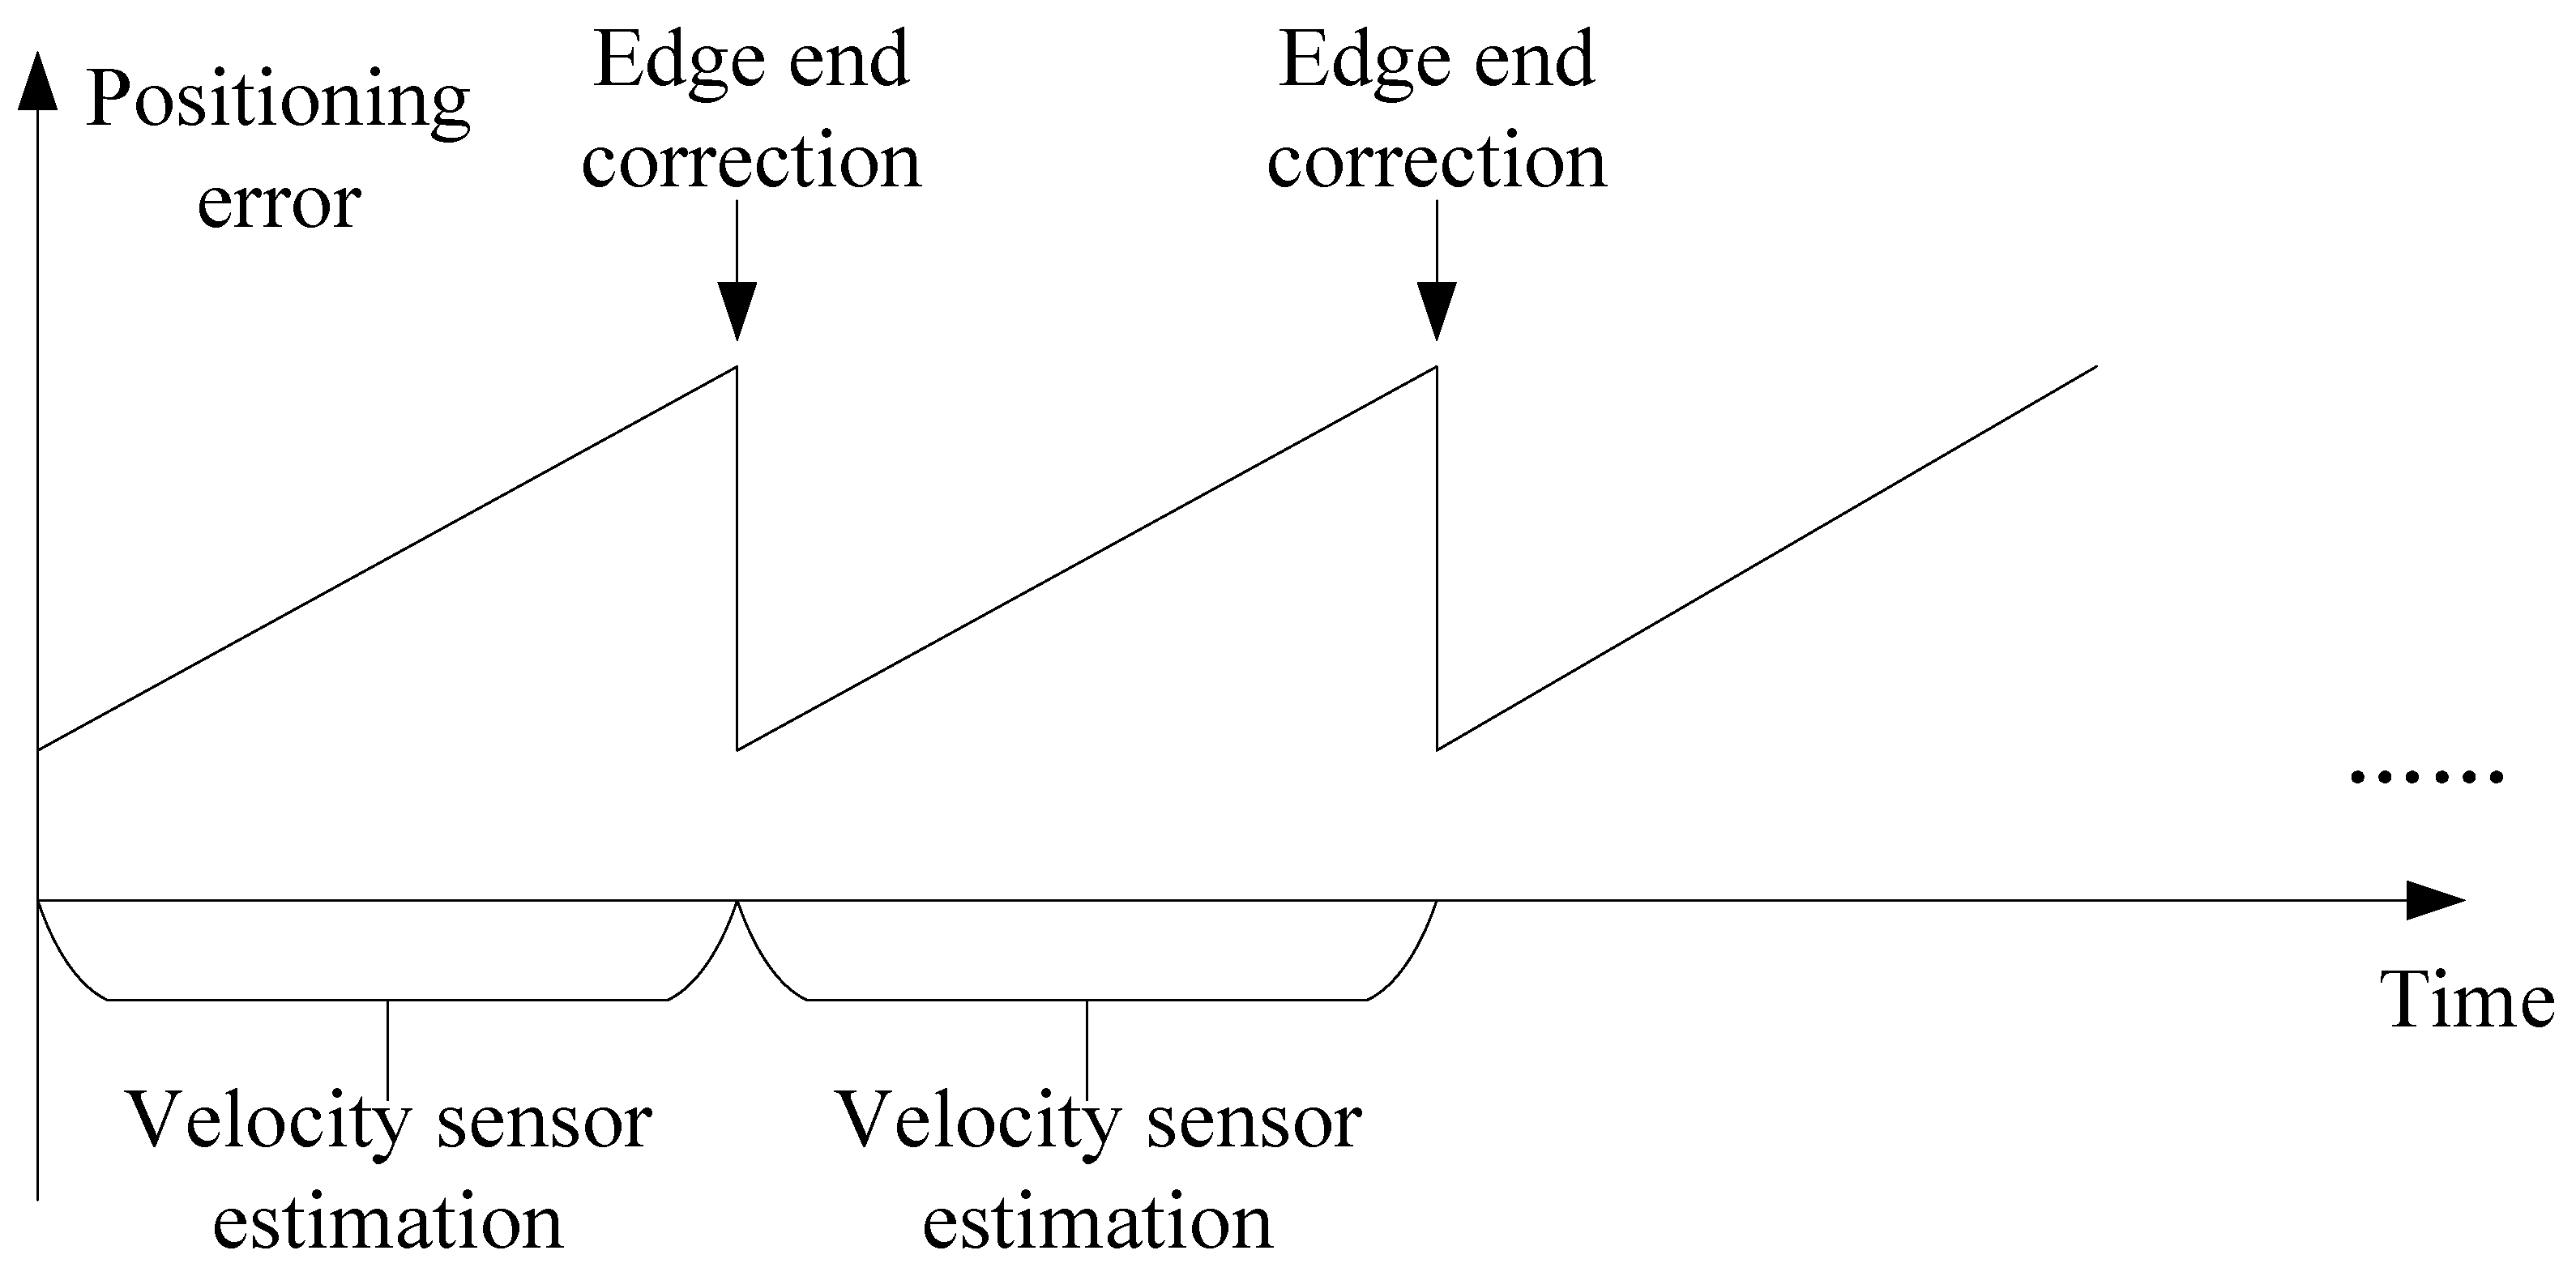
Coasting and slipping during train operation can cause gradual positioning errors if only the speed sensor is used [30]. To reduce these errors and improve accuracy, the train calculates the traveled distance with the speed sensor and regularly transmits data from other onboard sensors, such as GNSS and INS, to the edge server via the train–ground communication link. The edge server processes these data and sends back the corrected position, ensuring more precise and reliable positioning, as shown in Figure 1.
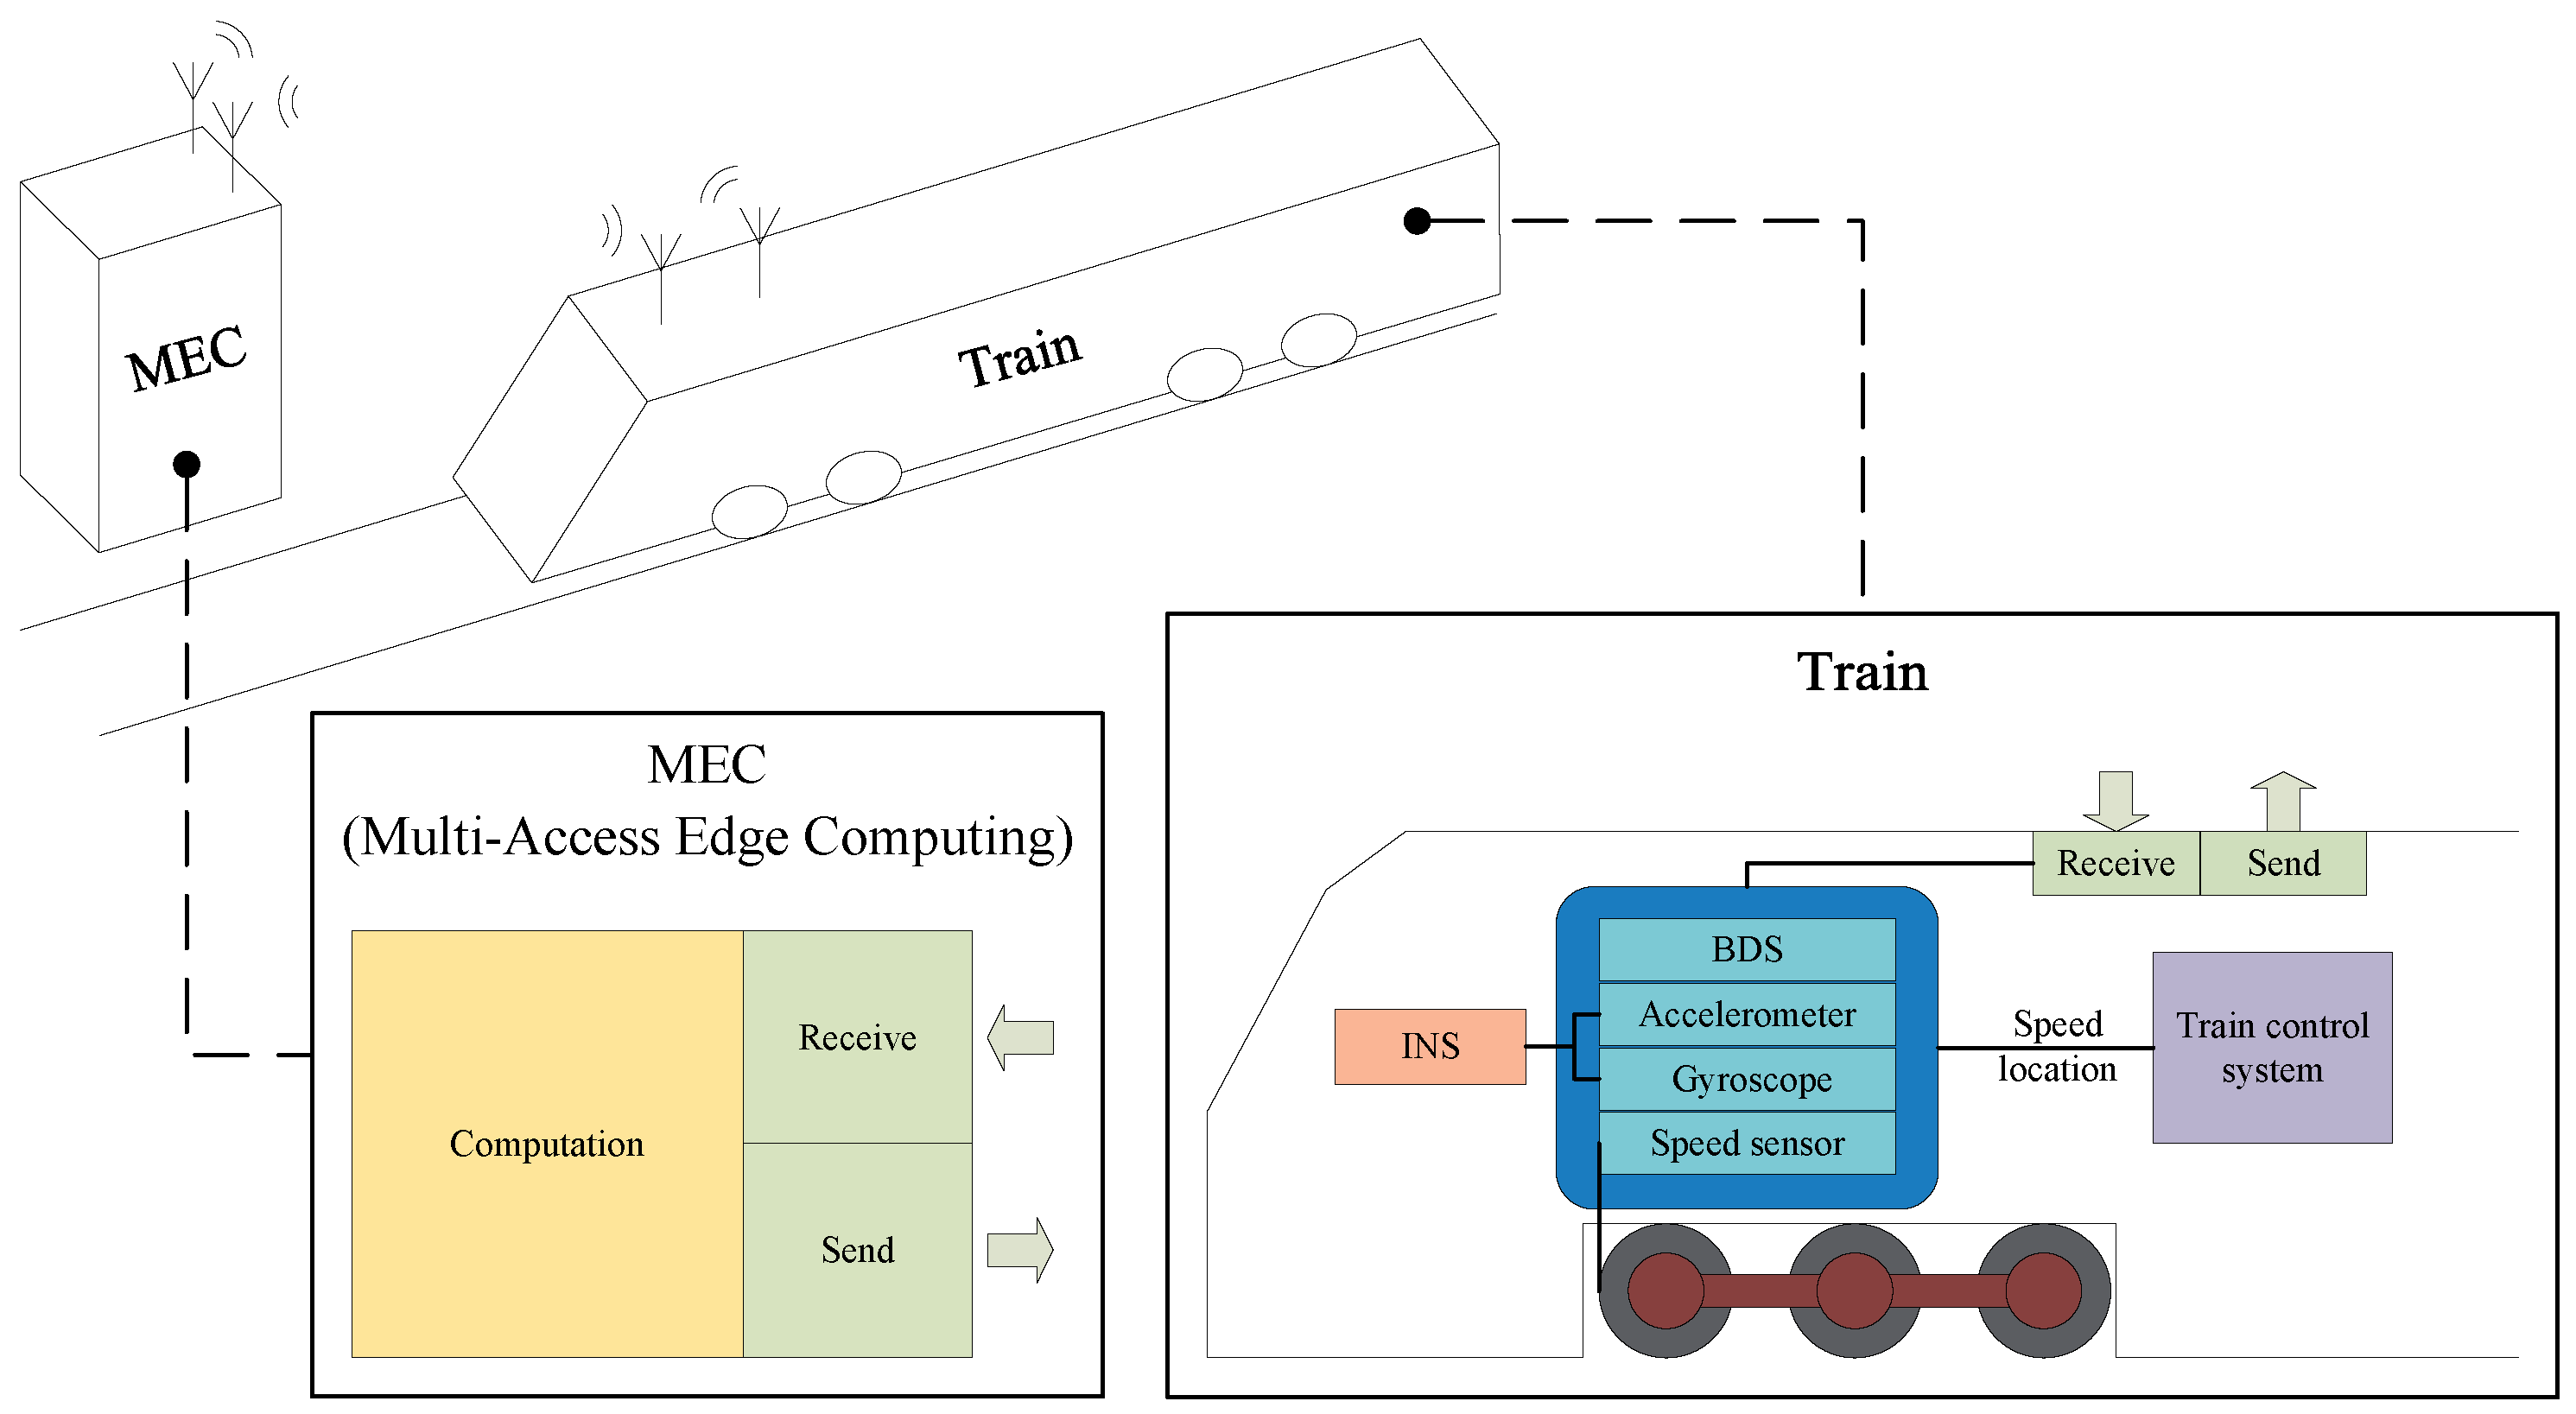
In the edge computing-based train fusion positioning framework, a variety of sensors are installed on the train to monitor its operational status, including speed sensors, GNSS, and Inertial Navigation System (INS) devices. These sensors generate real-time data that are essential for determining the train’s position. The onboard system utilizes speed data to calculate the traveled distance, which serves as the basis for initial positioning. The edge device, located on the ground, consists of computing units and wireless transceivers that receive, process, and transmit the sensor data back to the train, as illustrated in Figure 2.
The train module uses an extended Kalman filter (EKF) for real-time sensor data fusion, incorporating inputs from GNSS, inertial sensors, and speed sensors. In the edge module, we utilize a dynamic task allocation algorithm to prioritize computational resources based on the real-time processing needs of multiple trains. The multi-sensor fusion technique leverages a weighted fusion strategy to balance sensor reliability and minimize positioning errors. For details on the offloading algorithm used in the specific example, readers can refer to our previously published papers [31].
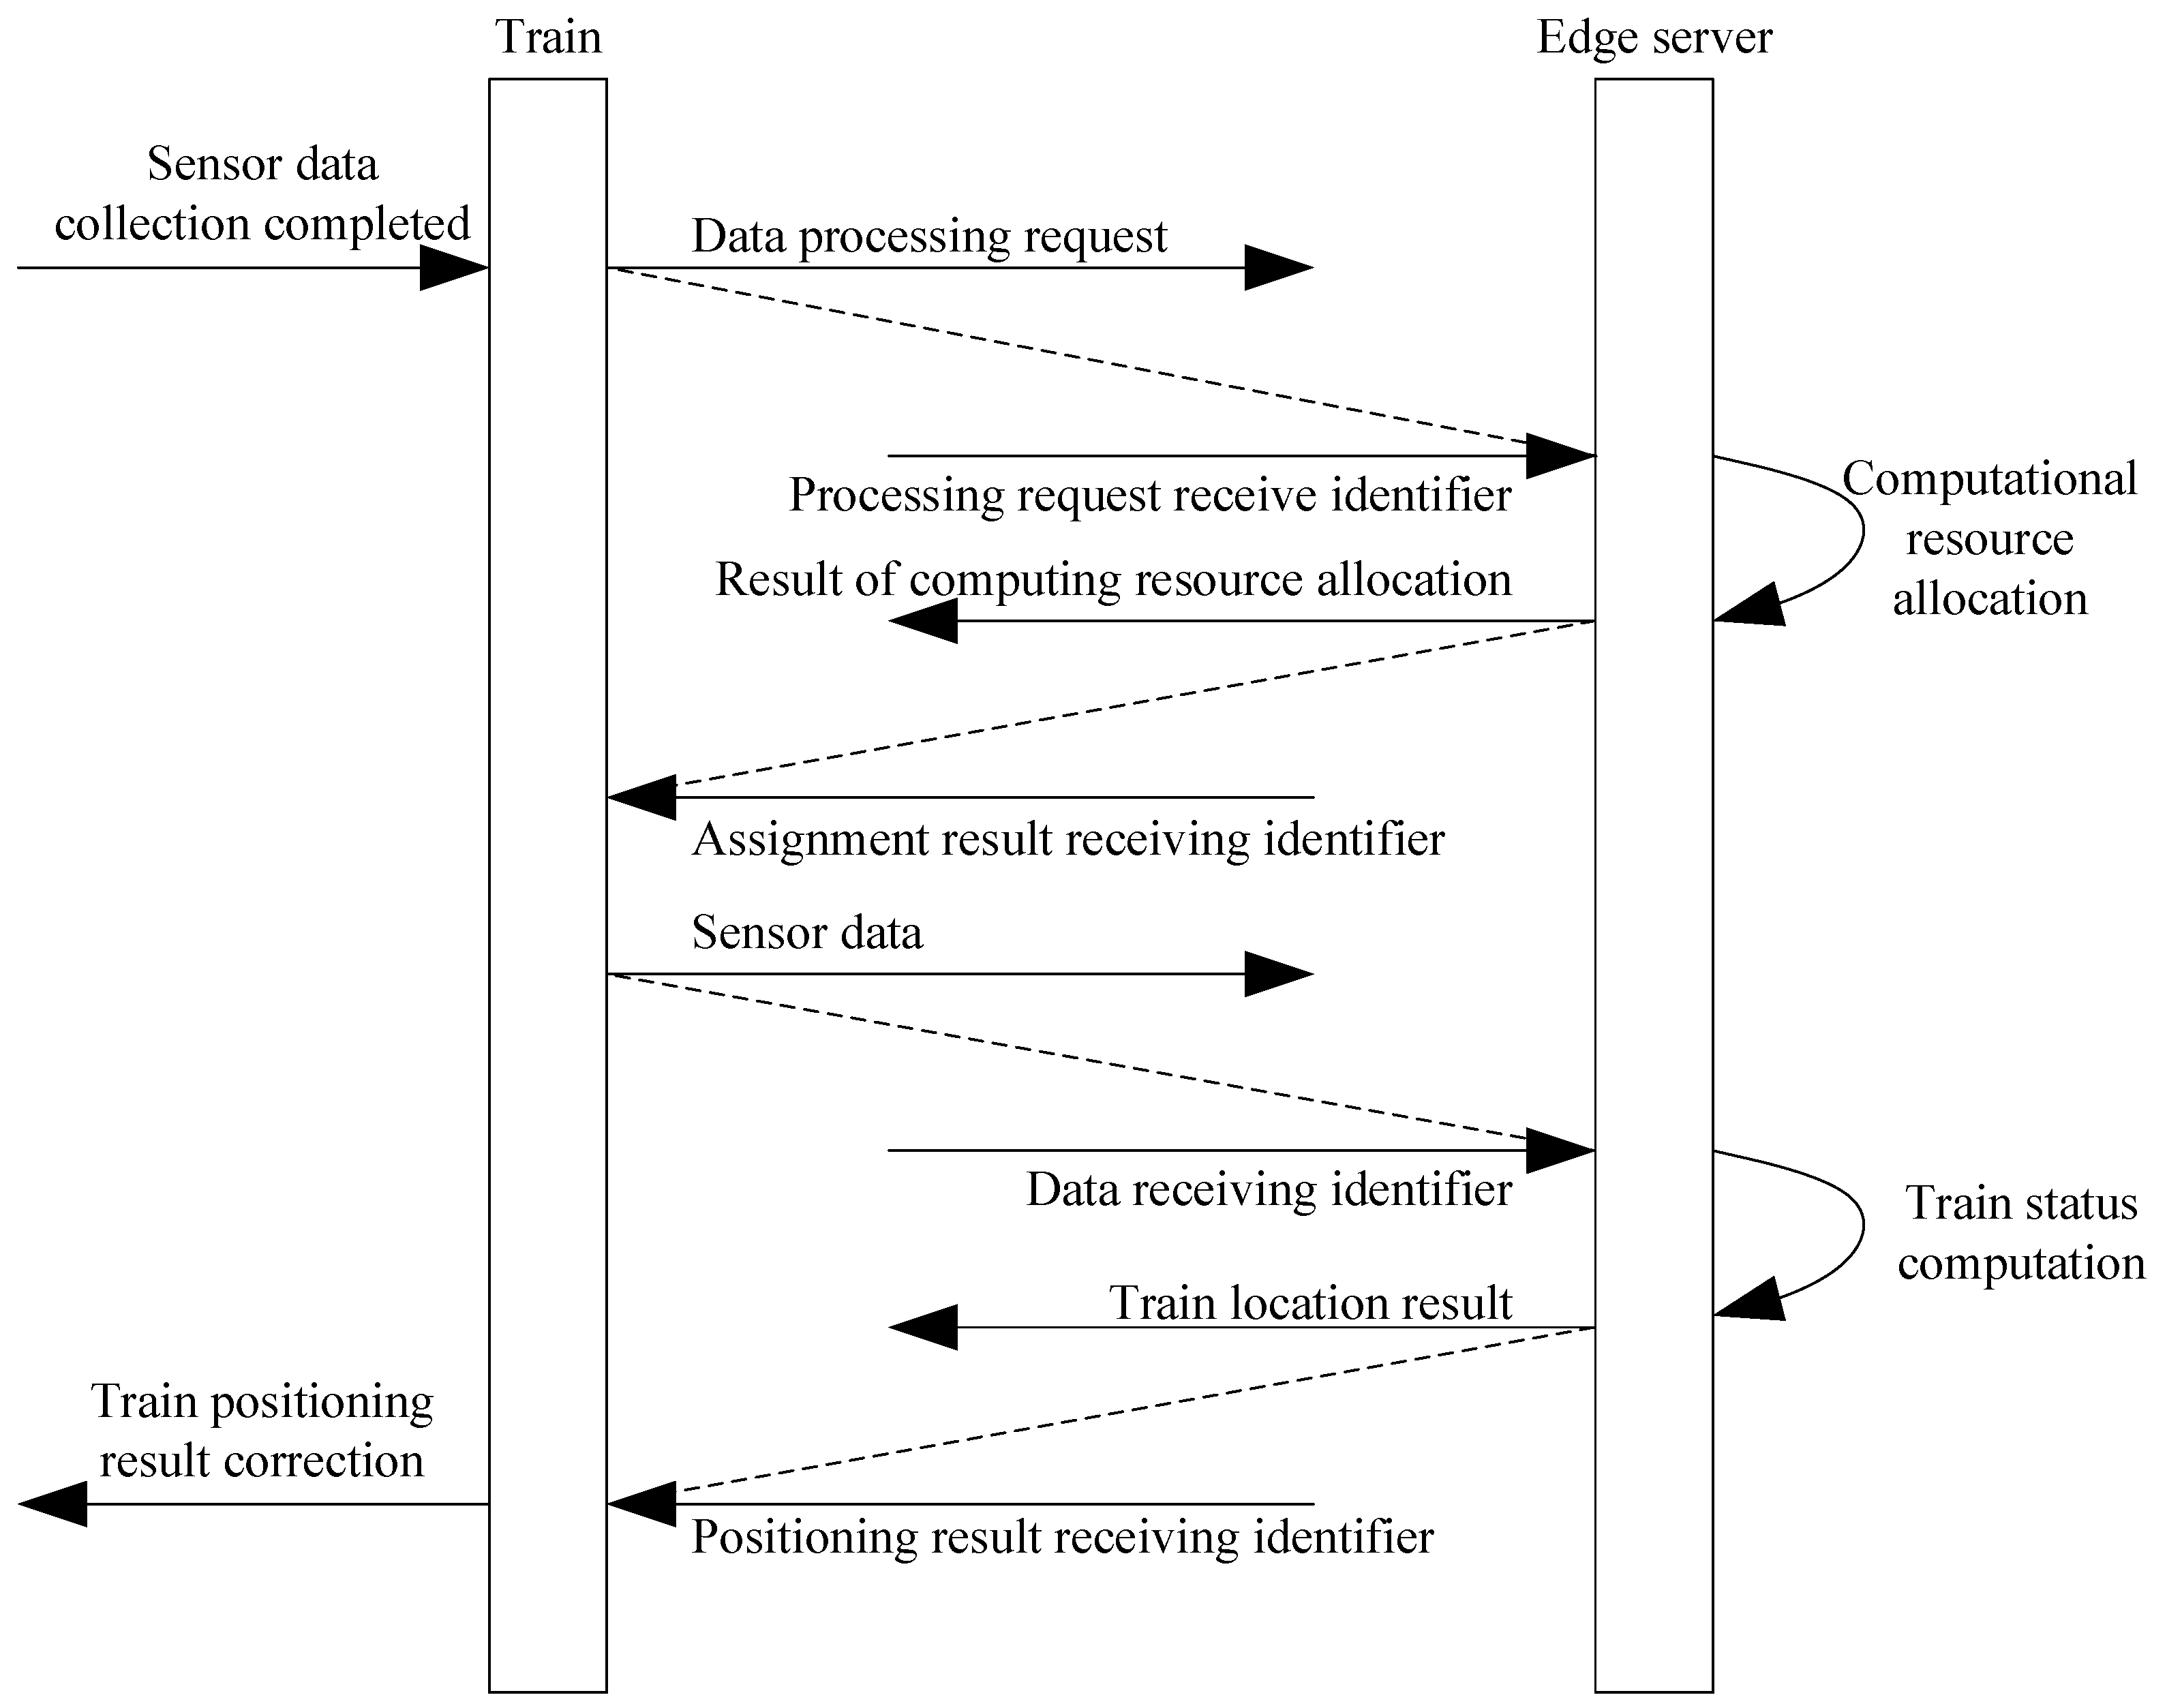
The communication sequence between the onboard system and the edge server follows a structured process, as illustrated in Figure 3. First, the train collects sensor data S t , where t represents the current time:
S t = f ( T ) .
After completing the data collection, the train sends a data processing request P r e q and identification I D to the edge server:
P r e q = g ( O ( S t ) , I D ) .
where O ( S t ) represents the algorithm complexity, the edge server allocates computational resources R a l l o c based on its current load C E and transmits the result back to the train:
R a l l o c = h ( P r e q , C E ) .
E T : R a l l o c ( I D ) .
Once the train receives the resource allocation, it sends the collected sensor data S t to the edge server for processing:
T E : S t ( I D ) .
The edge server processes the sensor data and performs the necessary calculations to generate the positioning result P r e s :
P r e s = f c a l c ( S t , R a l l o c ) .
Finally, the edge server transmits the positioning result back to the train, and the train updates its position accordingly:
E T : P r e s ( I D ) ,
Position T = Position T + Δ P r e s .
This sequence ensures the efficient processing and correction of the train’s position by leveraging edge computing, reducing onboard computational load while maintaining real-time positioning accuracy.

4. Modeling of Train Fusion Positioning Based on Edge Computing

The method is implemented using the modeling software CPN Tools (4.0.1 version), which provides a platform for simulating and analyzing the train fusion positioning system. The model is primarily composed of three key modules: (1) the transmission module, responsible for handling data communication between the vehicle and the edge server; (2) the vehicle module, which simulates the onboard systems, including sensor data generation and processing; and (3) the edge module, which processes the sensor data received from the vehicle and returns the corrected position. These modules work together to ensure accurate and efficient train positioning through edge computing.

4.1. Transmission Module

The transmission module facilitates two-way communication between the vehicle module (Train1) and the edge module (MEC), as shown in Figure 4. The vehicle module manages the generation and processing of dynamic sensor data from the train, while the edge module handles sensor data uploaded from the vehicle using the First In First Out (FIFO) principle. After processing the data, the edge module transmits the results back to the vehicle through the transmission module.
As the communication channel between the vehicle and edge modules, the transmission module simulates two-way communication, including potential issues such as packet loss, bit errors, and disconnections. The transitions Uplink and Downlink are linked to random variables, determining the outcomes of the communication process. Depending on these values, different tokens are generated to reflect normal transmission, packet loss, or disconnection, which are then fed back to either the edge or vehicle module. The places and transitions used in this module are described in Table 1.
During communication between the vehicle and ground, the transmission module indicates the transmission results by returning different token types to the vehicle terminal.

4.2. Vehicle Module

The vehicle terminal triggers corresponding changes based on the received tokens, including the following:
  • FAIL token: The Fail transition is activated, prompting the train to resend data or request processing from the edge server according to the timeout retransmission mechanism. If packet loss or bit errors exceed the allowable threshold within a single cycle, a communication abnormality is detected. In such cases, the Abandon transition is triggered, and the train ceases data uploads to the edge for that cycle, opting to use the onboard processor to correct the train’s position.
  • BREAK token: The Break transition is triggered when the communication link is disconnected. To minimize the impact of communication failure on the positioning function, the onboard processor is used to correct the train’s position until the communication link can be re-established.
The specific structure of the vehicle module is shown in Figure 5. The places, transitions included in the module, and their meanings are shown in Table 2. In the initial state, the place TrainState indicating the train status in the onboard module contains the token IDLE. By triggering the transition DataArrive, the train sends a data processing request to the edge to apply for computing resources to process the sensor data. At this time, the status changes from IDLE to WAIT, indicating that the vehicle terminal is waiting for the response result from the edge terminal.
The system uses two possible tokens to manage sensor data processing at the edge or locally, as shown in Algorithm 1:
Algorithm 1 Processing Sensor Data
  • Require: Initial states: T r a i n S t a t u s = W A I T
  • if Edge resources R E > 0  then
  •    Trigger Permit
  •    Send sensor data S ( t ) to the edge for processing:
  •              P r o c e s s D a t a ( E d g e ) with latency τ E
  • else
  •    Trigger Reject
  •    Process sensor data locally on CPU:
  •             P r o c e s s D a t a ( O n b o a r d ) with latency τ L o c a l
  • end if
  • Update T r a i n S t a t u s = U P D A T I N G
  • The PERMIT token indicates that additional computing resources are available at the edge. When the transition Permit is triggered, the current sensor data are packaged and sent to the edge for processing.
  • The REJECT token signifies that no remaining computing resources are available at the edge. In this case, the transition Reject is triggered, and the sensor data are transferred to the place CPU, representing the vehicle’s local processor for processing.
In both scenarios (whether edge or onboard processing), the train status transitions from WAIT to UPDATING, indicating that the sensor data are being processed. This can occur either at the edge system or the onboard system, depending on the availability of resources. As shown in Algorithm 2, after data processing is completed,
Algorithm 2 Data Processing Completion
  • Generate RESULT token
  • if Processed by Edge ( R E > 0 ) then
  •    Trigger EdgeCorrect
  •    Update train position:
  •             P new = P old + Δ P edge Δ P edge = f edge ( S ( t ) )
  • else
  •    Trigger LocalCorrect
  •    Update train position:
  •             P new = P old + Δ P local Δ P local = f local ( S ( t ) )
  • end if
  • Set T r a i n S t a t u s = U P D A T E D
  • Trigger Update, set T r a i n S t a t u s = I D L E
  • The onboard system generates a RESULT token, signaling that the data have been processed.
  • The train status changes from UPDATING to UPDATED via the transitions EdgeCorrect or LocalCorrect, depending on where the processing occurred.
  • The system triggers the Update transition, resetting the vehicle to the IDLE state, which marks the end of the current cycle and the start of the next.
Initially, the communication state (ComState) is set to NOLINK, indicating that the train-to-ground communication link has not yet been established. The transition Scan is triggered to attempt link establishment, changing the link status from NOLINK to ESTABLISHING. As illustrated in Algorithm 3, depending on the result stored in ScanResult:
Algorithm 3 Communication Link Establishment
  • Trigger Scan, set C o m S t a t e = E S T A B L I S H I N G
  • if Link established ( L s = 1 ) then
  •    Set C o m S t a t e = E S T A B L I S H E D
  • else
  •    Trigger Miss, set C o m S t a t e = N O L I N K
  • end if
  • If the link is successfully established, the communication state changes to ESTABLISHED.
  • If the link fails, the transition Miss is triggered, reverting the communication state back to NOLINK.
If the number of link attempts exceeds a predefined limit, the train stops further transmission for the current cycle and processes the data locally using the onboard processor. The train will retry link establishment in the next cycle, as shown in Algorithm 4.
Algorithm 4 Handling Link Attempts
  • if  n attempts > n max   then
  •    Halt transmission, process data locally:
  •                 P r o c e s s D a t a ( O n b o a r d )
  •    Retry link establishment in the next cycle
  • end if

4.3. Edge Module

The structure of the edge module in the model is illustrated in Figure 6, while the corresponding places, transitions, and their functions are detailed in Table 3. The vehicle terminal uploads different types of tokens to the edge module’s waiting queue (Queue) through the transmission module, triggering various transitions, including the following:
  • The REQUEST token represents a train positioning task. Upon receiving this token, the Judge transition is triggered to check if sufficient computing resources are available at the edge server.
  • The DATA token represents the sensor data uploaded by the train. If sufficient resources are available, the Apply transition is triggered to process the data. If resources are insufficient, the data wait in the queue until the previous task is completed and resources are freed.
  • Other types of tokens indicate issues such as packet loss or bit errors during transmission. In these cases, the ReSend transition is triggered to retransmit the data.

5. Reliability Verification

5.1. Prerequisites

Software reliability is defined as the ability of software to avoid system failures under specified conditions within a given time frame. The dependable operation of software systems fundamentally relies on robust hardware infrastructure, with the present system’s operational integrity being predicated on hardware configurations that satisfy the Safety Integrity Level 4 (SIL-4) requirements stipulated in the IEC 61508 international standard. In this study, the reliability of the train fusion positioning method under edge computing is reflected in the following aspects:
  • In fault scenarios, the method ensures that the train reaches the desired position update state within a finite number of state transitions.
  • Under normal operating conditions, the method consistently reaches the desired position update state within a finite number of steps, similar to the behavior in fault scenarios.
  • The processing delay of train positioning data in edge computing does not lead to train conflicts or other hazardous situations that could compromise operational safety.
The primary objective of functional safety verification is to ensure that the system’s safety functions operate correctly under both normal and fault conditions. The first two reliability requirements are verified through functional safety analysis, while performance analysis ensures that delays in processing train positioning data do not result in dangerous scenarios, such as rear-end collisions, thereby verifying the third reliability requirement [32].
Since system failures affect reliability, functional safety, and performance, functional safety verification and performance analysis are combined to meet the overall verification requirements for the method’s reliability [33].

5.2. Functional Safety Verification Principle

Functional safety refers to the part of a system’s overall safety that ensures the system or device can operate correctly in response to inputs or failures. CPNs describe the logical functions and properties of the proposed method using formal semantics, incorporating both its static structure and dynamic characteristics. Logical reasoning rules are employed to conduct reachability analysis on each node within the model’s state space, verifying whether it meets the functional safety requirements [34].
To verify functional safety, domain knowledge and system functional requirements are integrated with the model. The temporal logic analysis tool, ASK-CTL, traverses the state space to determine if nodes exist that satisfy the desired states. The specific verification requirements are defined as follows:
  • Can train positioning be achieved if the communication link is broken? Before transmitting data to the edge server, the train must establish a train-to-ground communication link. If the link fails to establish or disconnects after being established, the train cannot complete the positioning function.
  • Can train positioning be achieved after packet loss and bit errors? During the train-to-ground communication process, adverse environmental conditions may cause data packet loss and bit errors. In such cases, neither the onboard system nor the edge server can obtain relevant data in time, increasing data transmission delays and affecting train positioning.
  • Can train positioning be achieved when edge computing resources are limited? Edge servers have finite computing resources. If the server is overwhelmed with tasks, data processing requests from trains may be queued, leading to processing delays and impacting the train positioning function.

5.3. Case Studies

Functional safety assurance methods must satisfy two fundamental properties: operability and safety. The operability criterion mandates that the target state should be achievable through a finite sequence of state transitions, ensuring the feasibility of system operations. Concurrently, the safety criterion guarantees that no execution paths will lead to hazardous states during operational processes. Drawing upon edge computing principles and system functional requirements, this section conducts four case studies to validate the proposed functional safety framework.

5.3.1. Case 1: Communication Disconnection

This case verifies the impact of link establishment failure or communication disconnection on the train positioning function in a single-train scenario. According to the principle of operability, the method must ensure that an abnormal state can transition to a normal working state when adverse factors occur. Using timing logic, we verify whether the onboard system can update the train positioning result after a communication link failure.

5.3.2. Case 2: Packet Loss and Bit Error

The function Unexpect describes the unexpected state of the method when packet loss or error codes occur during communication (e.g., when the RecvBuffer at the vehicle terminal contains the token FAIL, or the Count token in the transmission module is not (1,0)).

5.3.3. Case 3: Limited Computing Resources

In this scenario, two trains are managed by the same edge server, but the server’s computing resources can only process the data from one train at a time. When resources are limited, the Queue place at the edge contains at least one token, indicating a task is in progress. Meanwhile, the Resources place contains a token value of 0, meaning no computing resources are available.
Using the CPN ML language, the inspection logic is implemented as shown in Table 4. The function Unexpect describes the unexpected state when the communication link fails or is broken (e.g., when the ScanResult place contains the token UNSUCCESS, or RecvBuffer contains the token BREAK). The function Expect represents the expected state, where the train positioning correction is successful (e.g., when the TrainState place contains the token UPDATED). The PredAllNodes function is used to traverse the state space and identify UnexpectList, the list of nodes in unexpected states. The formula myASKCTLformula is applied to verify the timing logic for reaching the expected state.
The results show that the method consistently corrects the train’s position, even when the communication link is broken, meeting the operability requirements. The method also successfully performs position correction after packet loss, bit errors, and under limited computing resources, further verifying its reliability and operability.

5.3.4. Case 4: Multi-Train Scenario

Safety requires that the method avoids transitioning to a dangerous state during execution. Let M n represent the dangerous state and M 0 the initial state. If there exists a path from M 0 to M n , i.e., M 0 [ t 0 > M 1 , , M n 1 [ t n 1 > M n , then the method fails to meet the safety requirements, as the system transitions to a dangerous state.
Based on the system’s functional requirements, if any node in a state transition path fails to complete the train positioning correction, it indicates the method has entered a dangerous state. Conversely, assume M m is the state where the train positioning result is successfully corrected. If for all reachable nodes from M 0 , M i R M 0 : M i [ t i > , , [ t m 1 > M m , meaning there exists a path to M m from any reachable state, then the method satisfies the safety requirements.
The logic verification function, implemented in CPN ML language, is used to verify the method’s safety. The specific results are presented in Table 5. The results demonstrate that, starting from the initial node in the state space, any given path can reach the desired node (TrainState, which represents the train’s status, contains the token UPDATED). This shows that the method can consistently correct the train positioning result, even in the presence of adverse factors, and meets the safety requirements.
According to the operability and safety analysis, the method designed in this paper satisfies the functional safety requirements and operates correctly under various inputs or fault conditions.
The safety validation of multi-train formations (consisting of three or more vehicles) can be deductively established based on the two-train safety verification framework. This conclusion stems from the structural observation that any multi-train configuration fundamentally comprises adjacent train pairs that replicate the classical leader–follower dynamic examined in preceding studies. Through rigorous verification of pairwise interaction safety under standard tracking conditions, the system’s collective safety properties are thereby demonstrably preserved in extended train formations.

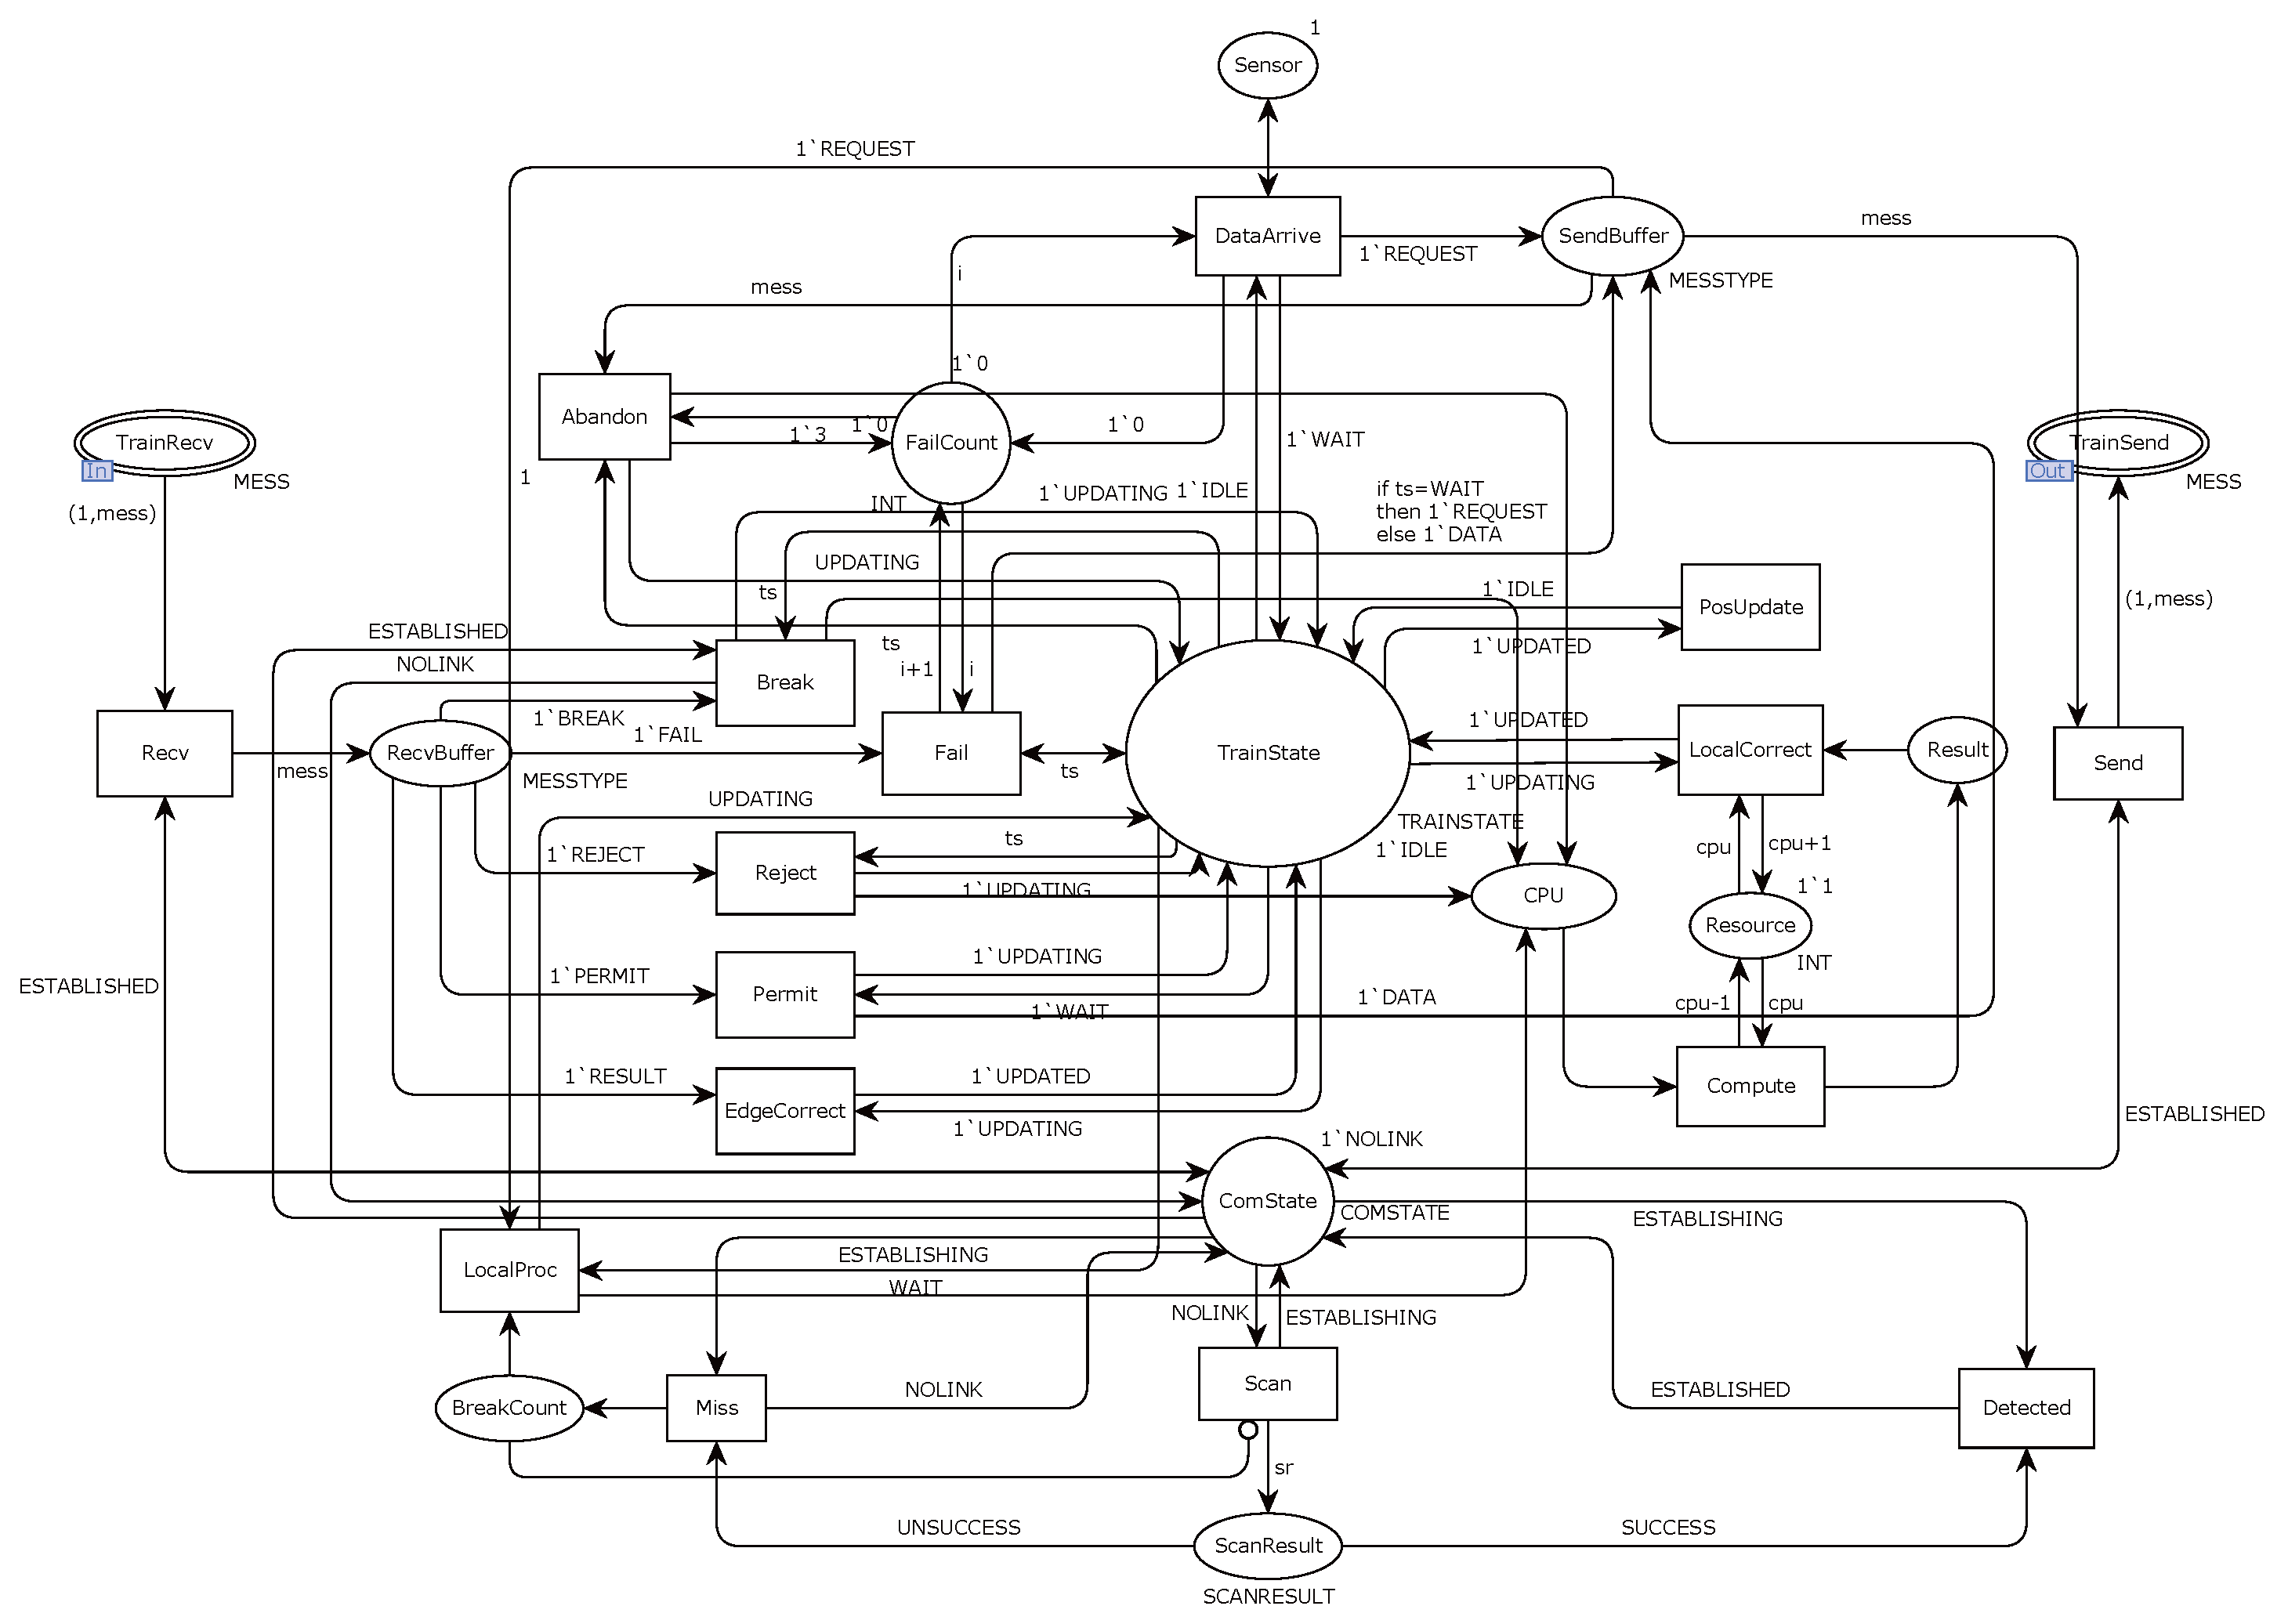
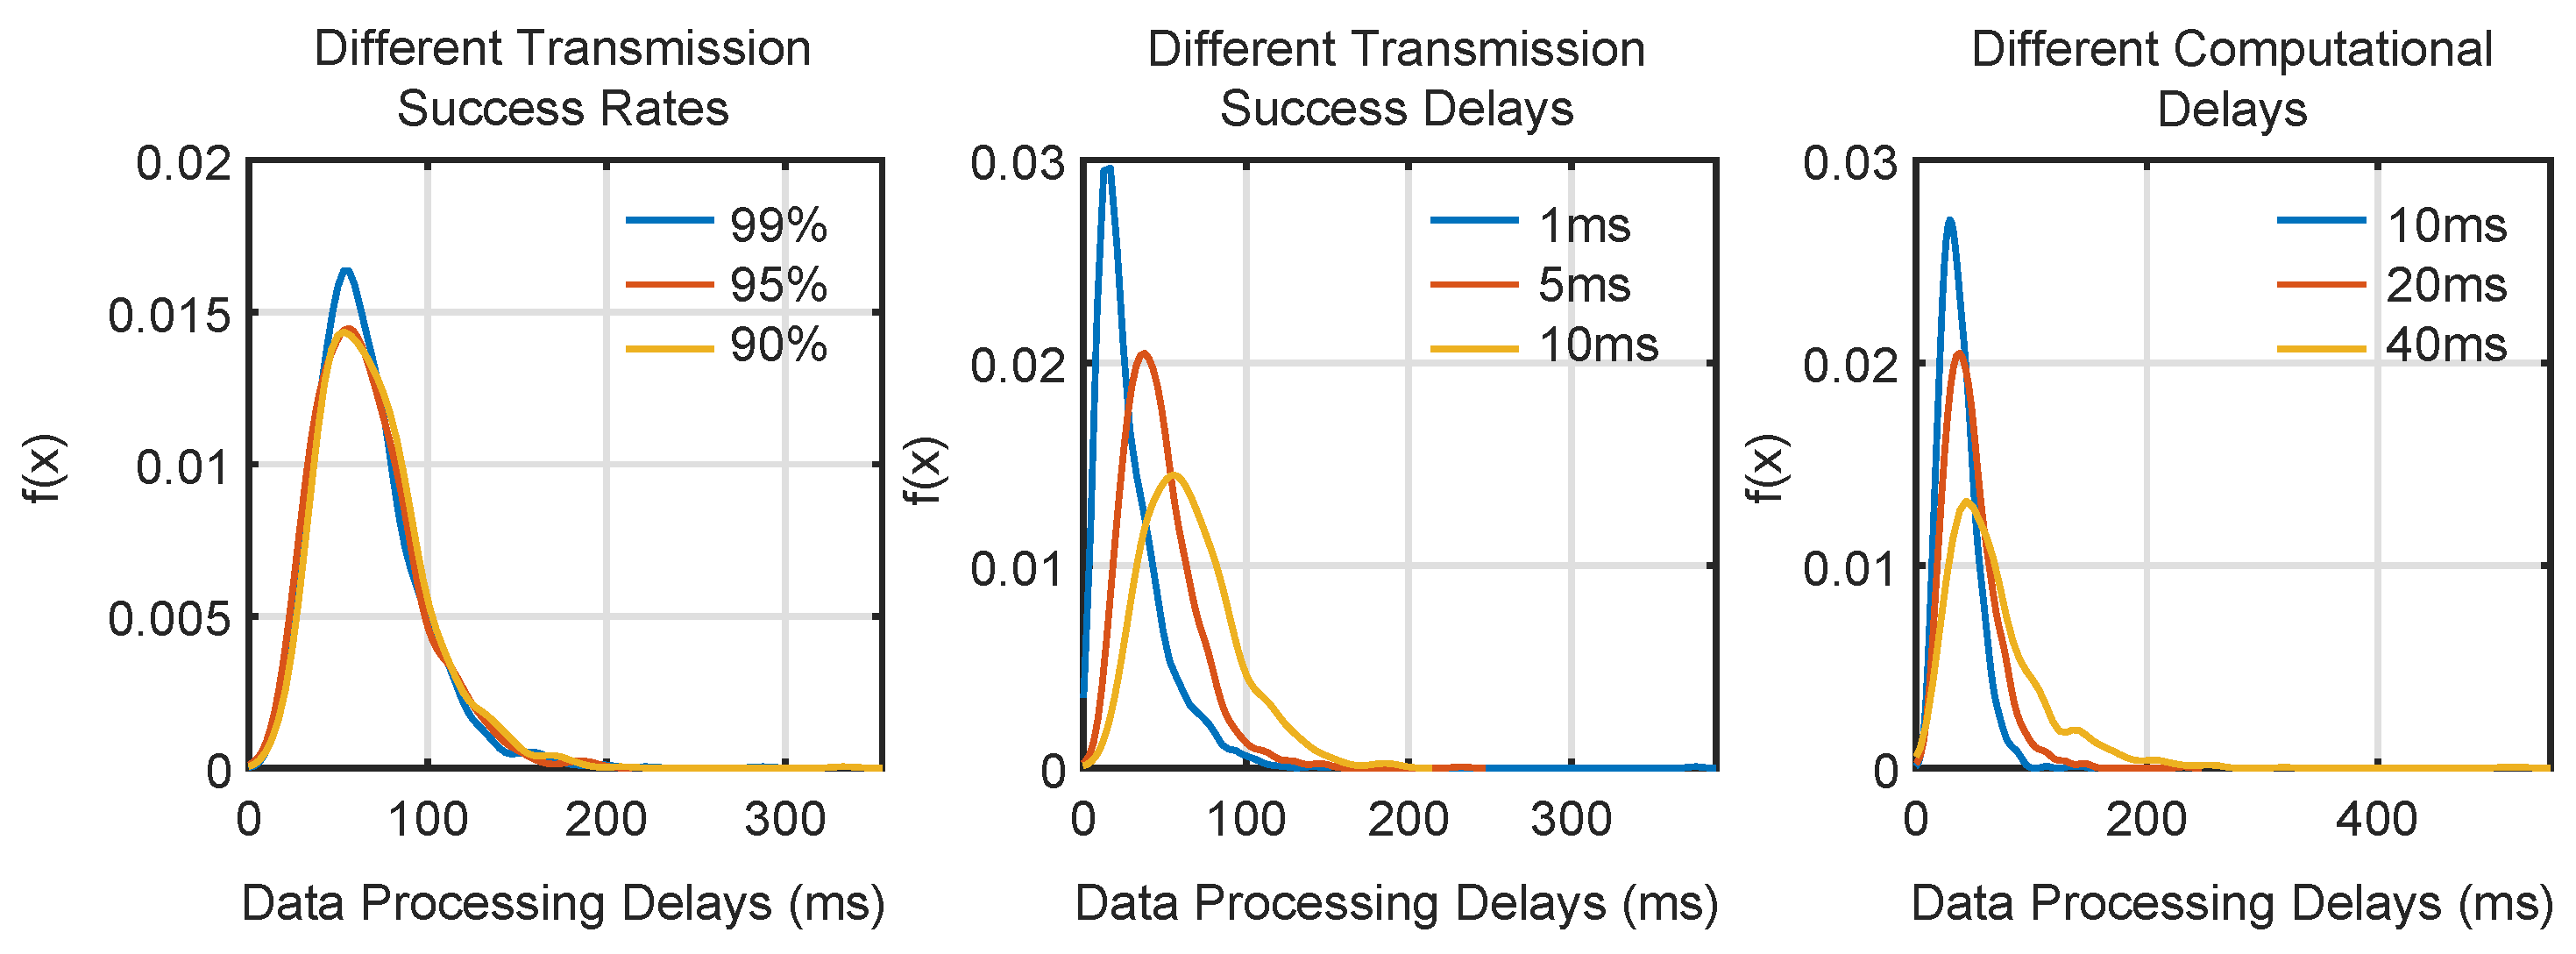
6. Numerical Performance Analysis

On the basis of verifying the functional safety of the method, the performance of the method under different conditions was analyzed. In the train fusion positioning method under edge computing, the data transmission success rate, transmission delay, and edge server computing delay will all affect the data processing timeliness of the method. Adding conditional triggering rules to directed arcs in the model and injecting random delay parameters into specific transitions can simulate the impact of the above disadvantages on the method. The method process is simulated based on the established CPN model, and the data monitor of CPN Tools is used to record the data processing delay of each position correction process. Based on the collected simulation data, the probability density distribution of data processing delays under different levels of influencing factors is obtained, as shown in Figure 7.
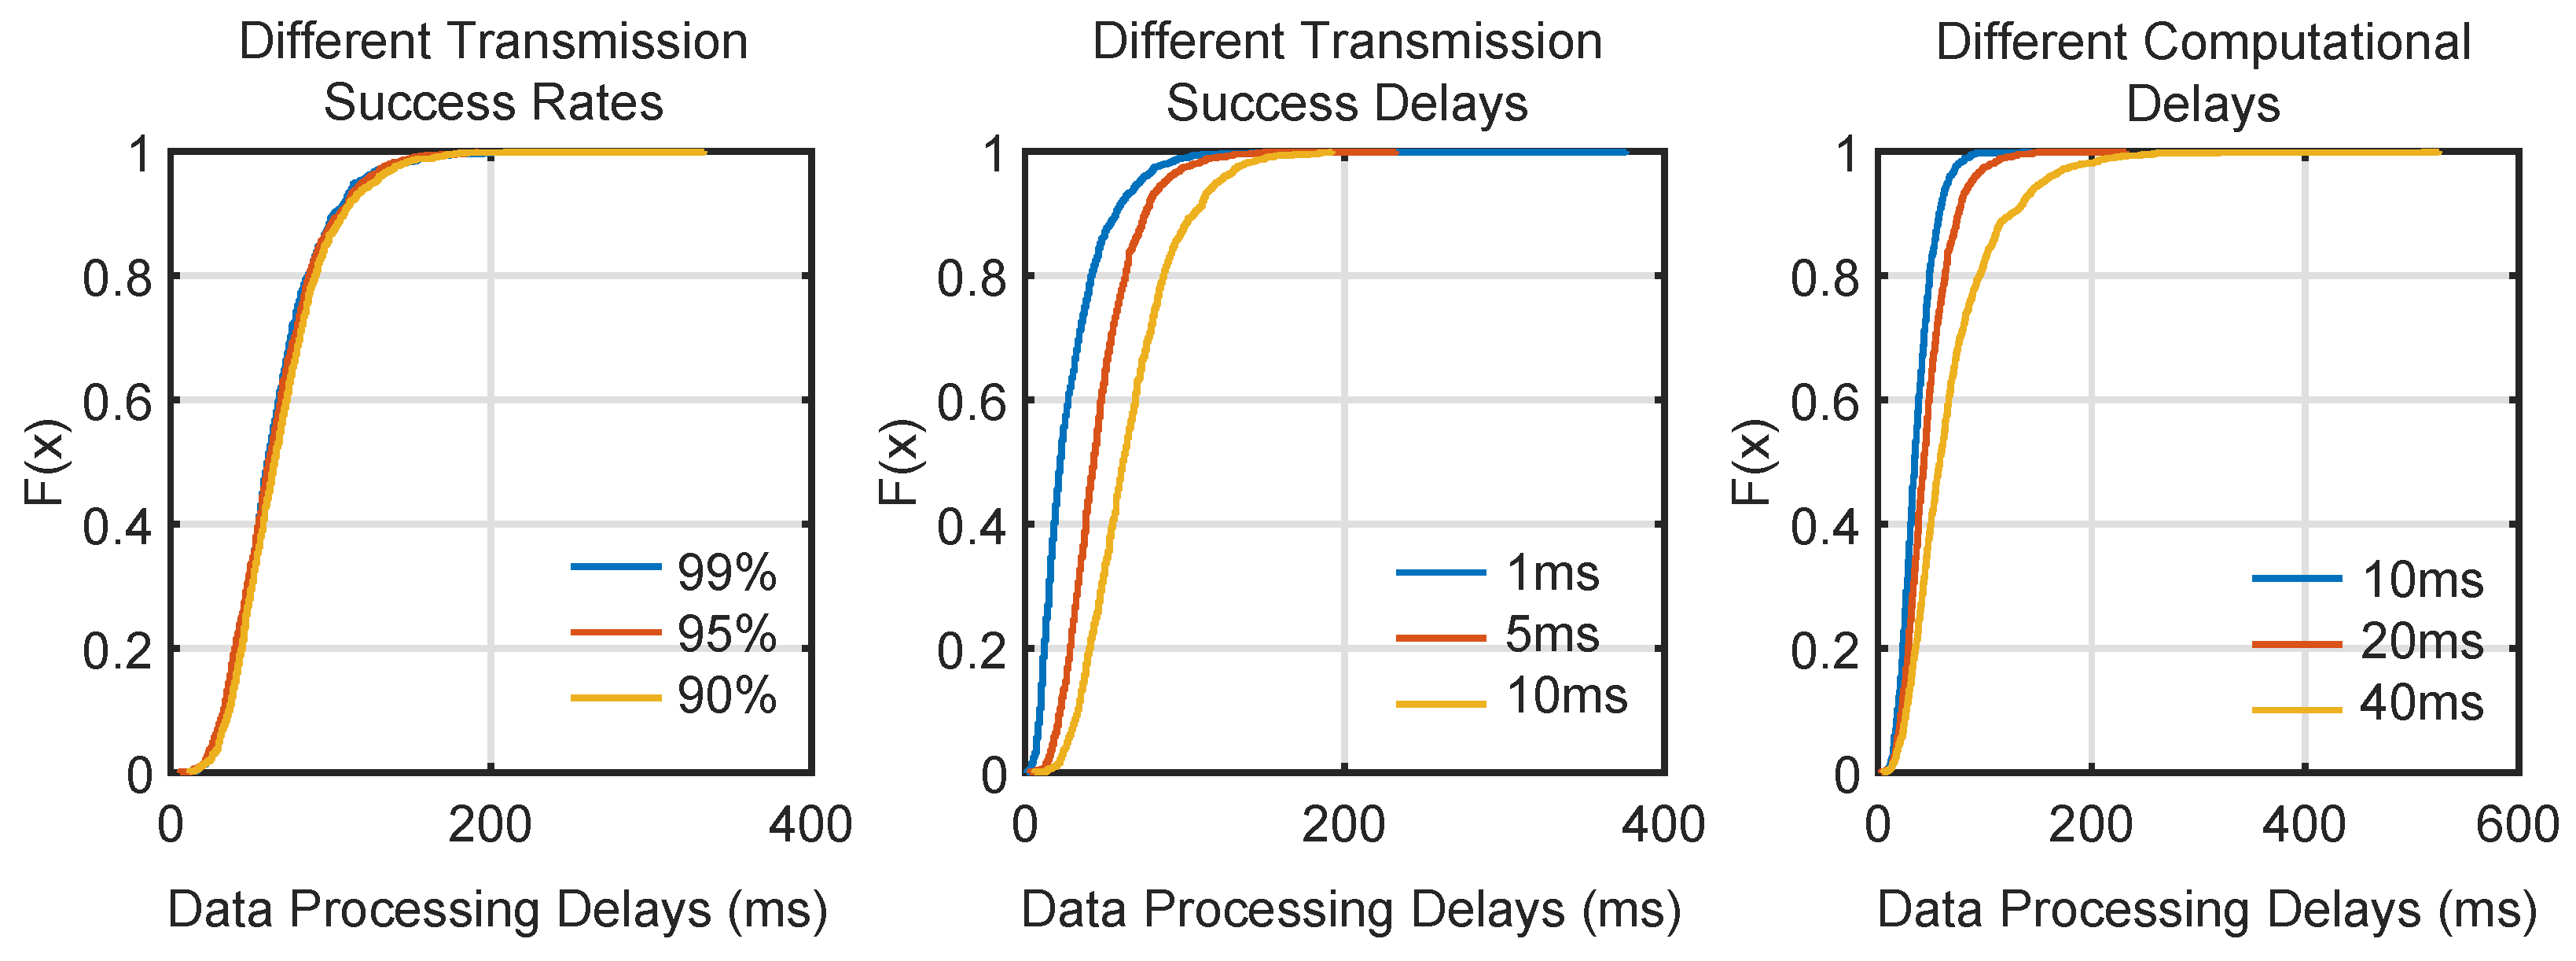
The corresponding cumulative distribution is shown in Figure 8. It can be seen that changes in different data transmission delays have the greatest impact on method data processing latency, followed by edge server computing latency, and data transmission failure rate has the least impact. Hence, transmission delay plays the most significant role in influencing data processing time, likely due to the inherent limitations of train–ground communication systems. In high-speed environments, even minor transmission disruptions can lead to significant delays in data relay between the train and edge server. These delays are exacerbated by environmental factors such as signal interference or train velocity.
In order to further verify the above conclusion, the orthogonal experimental method was used to conduct a qualitative analysis of each influencing factor based on the simulation results. The specific selected influencing factor levels are shown in Table 6.
According to the influencing factor level table, a three-factor and three-level orthogonal experiment was designed to obtain the model simulation results and conduct range analysis and variance analysis, as shown in Table 7, Table 8 and Table 9. It can be seen from the range analysis results that compared with the other two factors, the transmission delay factor has the largest range value, indicating that changes in transmission delay have the greatest impact on data processing delays. In addition, in order to avoid errors in the results of one-sided range analysis, variance analysis was performed on the experimental results. From the variance analysis output results, it can be seen that the transmission delay factor corresponds to the largest F value, which also shows that the transmission delay is the largest influencing factor of data processing delay, which is consistent with the range analysis results.
It can be seen from the analysis that the positioning method designed in this article requires multiple information interactions between the train and the edge server, and the data transmission delay will significantly affect the data processing efficiency. Under edge computing, data are mainly processed through edge servers, and the computing delay of the server will also have a significant impact on data processing efficiency. Under normal circumstances, the failure probability of method data transmission under edge computing is low, and the retransmission mechanism designed by the method can effectively reduce the impact of data transmission failure. The data transmission failure rate has a limited impact on the data processing delay of the method. To sum up, in the actual system development process, we should focus on reducing the data transmission delay in the train-to-ground communication process.
Based on the qualitative analysis results, in order to further ensure the reliability of the method, the train tracking interval under edge computing is calculated based on the mapping relationship between data processing delay and train safety tracking interval. The tracking interval represents the time interval between adjacent trains passing a certain same point, reflecting the line’s capacity. It is mainly determined by the train length l t r a i n , braking reaction time travel distance l r e a c t i o n , braking distance l b r a k e , safety margin distance l p r o t , and the distance from the front train to the entrance of the blockage zone where it is located l b l o c k . The details are as follows:
L = l t r a i n + l r e a c t i o n + l b r a k e + l p r o t + l b l o c k
If the train runs in a uniform deceleration state during the deceleration process and the common braking deceleration is a, the tracking interval is as follows, where v is the train speed:
T = v a + l t r a i n + l r e a c t i o n + l p r o t + l b l o c k v
The corresponding train speed protection curve is obtained according to the tracking separation distance, as shown in Figure 9.
When the train has positioning errors, it will affect the tracking interval. At this time, the tracking interval of the train needs to consider the size of the train positioning error, as shown in Figure 10.
The increase in data processing delay will lead to an increase in train positioning error, thus affecting the train tracking interval. The tracking interval considering the impact of the data processing delay is as follows, where Δ t is the additional data processing delay.
T = v a + l t r a i n + l r e a c t i o n + l p r o t + l b l o c k v + Δ t
Based on the simulation results, the distribution of data processing delays of the method under the worst case scenario (equal probability of communication link interruption, packet loss and bit error, and successful transmission during the communication process) is analyzed.
The simulation parameters are derived from the relevant literature, and their values are presented in Table 10. The function E x p ( 1 / r ) in the table represents the exponential distribution, where r > 0 . The delay follows an exponential distribution, expressed as follows:
f ( x ; r ) = r e r x , x 0 , r > 0
where the mean of the distribution is μ = 1 / r and the variance is σ 2 = 1 / r 2 . This distribution is used for modeling data transmission delays, edge computing delays, onboard computing delays, and communication chain building delays.
As shown in Figure 11, the maximum processing time for train positioning data during the simulation is 3053 milliseconds. To prevent unnecessary braking within 10 6 data processing cycles, the minimum tracking interval, calculated using Equation (11), must be more than 159 s. This ensures that the two trains maintain a safe operational distance under the edge computing-based train fusion positioning method.
The current operational status of rail transit systems in China indicates that train tracking intervals predominantly exceed 180 s. The novel train positioning system proposed in this study not only establishes a robust autonomous positioning solution, but also provides technical support for achieving shorter operational intervals through enhanced positioning accuracy. This system demonstrates significant potential for improving transportation efficiency in existing rail networks, while holding substantial engineering application value for advancing high-density train scheduling.

7. Conclusions

This study presents a comprehensive model of a train fusion positioning method utilizing edge computing, constructed and validated through the use of CPNs. Initially, the data processing flow of the method is rigorously defined within a hierarchical CPN model. Following the confirmation of the model’s validity, the method’s functional safety is assessed using state-space analysis. The findings indicate that the proposed positioning method maintains the integrity of train positioning functions across various fault scenarios. Further analysis identifies the three primary factors influencing the data processing delay of the method, highlighting that the delay in data transmission significantly impacts the positioning accuracy. Thus, enhancing the data transmission rate is pivotal in the design of actual systems. Moreover, by examining the relationship between positioning data processing delays and the minimal tracking interval, the study calculates the shortest tracking interval that ensures safe train operations under specified conditions, effectively mitigating potential train conflicts due to processing delays.
Despite these contributions, the study acknowledges several limitations that pave the way for future research. Firstly, the employed CPN model, while effective in abstractly simulating the method’s workflow, requires further refinement to mirror the intricacies of real-world systems more closely and achieve higher fidelity in the simulation of information exchange processes. Secondly, the optimization method for computational resources on edge servers is based on the assumption of simultaneous data arrival from all trains, an idealization that overlooks the stochastic nature of data arrival in practical implementations. Addressing this gap by considering the randomness in data arrival could enhance the method’s applicability. Lastly, the GNSS/INS fusion method’s reliance on historical data for training introduces variability in model performance due to differences in driving patterns influenced by human or external factors, suggesting a need to improve model generalizability and reduce prediction errors. Addressing these limitations will significantly advance the development of real-time, accurate train control systems.

Author Contributions

Conceptualization, H.S.; Methodology, H.Y.; Validation, R.W.; Formal analysis, Z.D.; Investigation, R.W.; Resources, H.S.; Writing—original draft, H.Y.; Writing—review and editing, M.Z.; Supervision, H.S. and H.D.; Project administration, H.D. All authors have read and agreed to the published version of the manuscript.

Funding

This work was jointly supported by the National Natural Science Foundation of China (No. 62327806, 62273027) and the Fundamental Research Funds for the Central Universities.

Data Availability Statement

The original contributions presented in this study are included in the article. Further inquiries can be directed to the corresponding author.

Conflicts of Interest

All authors declare that the research was conducted in the absence of any commercial or financial relationships that could be construed as a potential conflict of interest.

References

  1. Song, H.; Sun, Z.; Wang, H.; Qu, T.; Zhang, Z.; Dong, H. Enhancing train position perception through AI-driven multi-source information fusion. Control Theory Technol. 2023, 21, 425–436. [Google Scholar] [CrossRef]
  2. Jiang, W.; Liu, M.; Cai, B.; Rizos, C.; Wang, J. An accurate train positioning method using tightly-coupled GPS plus BDS PPP/IMU strategy. GPS Solut. 2022, 26. [Google Scholar] [CrossRef]
  3. Song, X.; Song, H.; Wang, H.; Zhang, Z.; Dong, H. Deep Learning-Based Railway Foreign Object Intrusion Intelligent Perception Using Attention-Aggregated Semantic Segmentation. IEEE/ASME Trans. Mechatron. 2024, 1–11. [Google Scholar] [CrossRef]
  4. Huang, K.; Shen, Y.; Chen, J.; Wang, L.; Wang, S.; Dai, P. FRVO-Mono: Feature-Based Railway Visual Odometry with Monocular Camera. IEEE Trans. Instrum. Meas. 2023, 72, 5030510. [Google Scholar] [CrossRef]
  5. Liu, R.; Geng, C. Research on Train Positioning Technology of Urban Rail Transit Based on Lidar. In Proceedings of the IEEE 7th International Conference on Intelligent Transportation Engineering (ICITE), Beijing, China, 11–13 November 2022; pp. 101–105. [Google Scholar] [CrossRef]
  6. Ko, K.; Byun, I.; Ahn, W.; Shin, W. High-Speed Train Positioning Using Deep Kalman Filter with 5G NR Signals. IEEE Trans. Intell. Transp. Syst. 2022, 23, 15993–16004. [Google Scholar] [CrossRef]
  7. Nai, W.; Chen, Y.; Zhang, X.; Lei, X.; Dong, D. A train positioning algorithm based on inflexion analysis by using sets of distance measurement data collected from on-board laser ranging equipments. In Proceedings of the 2017 3rd IEEE International Conference on Computer and Communications (ICCC), Chengdu, China, 13–16 December 2017; pp. 901–904. [Google Scholar] [CrossRef]
  8. Zhou, Y.; Lai, S.; Cheng, H.; Redhwan, A.H.M.; Wang, P.; Zhu, J.; Gao, Z.; Ma, Z.; Bi, Y.; Lin, F.; et al. Toward Autonomy of Micro Aerial Vehicles in Unknown and Global Positioning System Denied Environments. IEEE Trans. Ind. Electron. 2021, 68, 7642–7651. [Google Scholar] [CrossRef]
  9. Yang, Z.; Hu, Y.; Xu, Q. A Review of Task Offloading in Edge Computing for Intelligent and Connected Vehicles. J. Chongqing Jiaotong Univ. (Nat. Sci. Ed.) 2024, 43, 98–110. [Google Scholar]
  10. Brik, B.; Ksentini, A. Toward Optimal MEC Resource Dimensioning for a Vehicle Collision Avoidance System: A Deep Learning Approach. IEEE Netw. 2021, 35, 74–80. [Google Scholar] [CrossRef]
  11. Song, H.; Gao, S.; Li, Y.; Liu, L.; Dong, H. Train-Centric Communication Based Autonomous Train Control System. IEEE Trans. Intell. Veh. 2023, 8, 721–731. [Google Scholar] [CrossRef]
  12. Zhu, L.; Gong, T.; Wei, S.; Yu, F.R. Collaborative Train and Edge Computing in Edge Intelligence Based Train Autonomous Operation Control Systems. IEEE Trans. Intell. Transp. Syst. 2024, 25, 11991–120041. [Google Scholar] [CrossRef]
  13. Li, L.; Niu, Y.; Mao, S.; Ai, B.; Zhong, Z.; Wang, N.; Chen, Y. Resource Allocation and Computation Offloading in a Millimeter-Wave Train-Ground Network. IEEE Trans. Veh. Technol. 2022, 71, 10615–10630. [Google Scholar] [CrossRef]
  14. Saki, M.; Abolhasan, M.; Lipman, J. A Novel Approach for Big Data Classification and Transportation in Rail Networks. IEEE Trans. Intell. Transp. Syst. 2020, 21, 1239–1249. [Google Scholar] [CrossRef]
  15. Pencheva, E.; Atanasov, I. Application Initiated Data Session as a Service for High Reliable and Safe Railway Communications. In Proceedings of the Advances in Computing and Data Sciences (ICACDS 2022), PT II, Kurnool, India, 22–23 April 2022; Volume 1614, pp. 24–37. [Google Scholar]
  16. Li, Z.; Taiyuan, G.; Hao, L.; Tao, T.; Xi, W.; Hongwei, W. Application of Edge Intelligence in Rail Transit: Prospects and Outlook. J. Electron. Inf. Technol. 2023, 45, 1514–1528. [Google Scholar]
  17. Liu, J.; Wu, H.; Li, P. Research on Edge Computing Security in Railway 5G Mobile Communication Systems. J. Comput. Eng. Appl. 2021, 57, 1–10. [Google Scholar]
  18. Woodcock, J.; Larsen, P.G.; Bicarregui, J.; Fitzgerald, J. Formal methods: Practice and experience. ACM Comput. Surv. (CSUR) 2009, 41, 1–36. [Google Scholar]
  19. Barišić, A.; Ruchkin, I.; Savić, D.; Mohamed, M.A.; Al-Ali, R.; Li, L.W.; Mkaouar, H.; Eslampanah, R.; Challenger, M.; Blouin, D.; et al. Multi-paradigm modeling for cyber–physical systems: A systematic mapping review. J. Syst. Softw. 2022, 183, 111081. [Google Scholar]
  20. Giua, A.; Seatzu, C. Modeling and Supervisory Control of Railway Networks Using Petri Nets. IEEE Trans. Autom. Sci. Eng. 2008, 5, 431–445. [Google Scholar] [CrossRef]
  21. Song, H.; Li, L.; Li, Y.; Tan, L.; Dong, H. Functional Safety and Performance Analysis of Autonomous Route Management for Autonomous Train Control System. IEEE Trans. Intell. Transp. Syst. 2024, 25, 13291–13304. [Google Scholar] [CrossRef]
  22. Das, M.; Mohan, B.R.; Guddeti, R.M.R.; Rodagi, K.; Harale, M.; Kerkar, A.; Jain, R. Safety Assessment of Railway Crossing Junction Via Petri Nets. In Proceedings of the 2024 5th International Conference on Innovative Trends in Information Technology (ICITIIT), Kottayam, India, 15–16 March 2024; pp. 1–8. [Google Scholar] [CrossRef]
  23. Outafraout, K.; Nait-Sidi-Moh, A.; Chakir El Alaoui, E.H. A Control Approach Based on Colored Hybrid Petri Nets and (Max, plus) Algebra: Application to Multimodal Transportation Systems. IEEE Trans. Autom. Sci. Eng. 2020, 17, 1208–1220. [Google Scholar] [CrossRef]
  24. Zhou, Y.X.; Ni, F.; Liu, J.; Xiao, Y.T.; Zhu, J.Y. An Executable Modeling Method of CPN Based on i-BPMN Business Architecture. Adv. Appl. Math. 2023, 12, 550. [Google Scholar]
  25. Wu, D.; Lu, D.; Tang, T. Qualitative and Quantitative Safety Evaluation of Train Control System (CTCS) Using Stochastic Colored Petri Nets. IEEE Trans. Intell. Transp. Syst. 2022, 23, 10223–10238. [Google Scholar] [CrossRef]
  26. Yazdi, M.; Mohammadpour, J.; Li, H.; Huang, H.Z.; Zarei, E.; Pirbalouti, R.G.; Adumene, S. Fault tree analysis improvements: A bibliometric analysis and literature review. Qual. Reliab. Eng. Int. 2023, 39, 1639–1659. [Google Scholar] [CrossRef]
  27. Machado, P.G.; Ribeiro, C.d.O.; do Nascimento, C.A.O. Risk analysis in energy projects using Bayesian networks: A systematic review. Energy Strateg. Rev. 2023, 47, 101097. [Google Scholar] [CrossRef]
  28. Gupta, M.; Bhargava, A. Optimal selection and analysis of microgrid energy system using Markov process. Sustain. Energy Technol. Assess. 2024, 62, 103623. [Google Scholar] [CrossRef]
  29. Zroug, S.; Remadna, I.; Kahloul, L.; Terrissa, S.L.; Benharzallah, S. Towards performance evaluation prediction in WSNs using artificial neural network multi-perceptron. Clust. Comput. 2023, 26, 1405–1423. [Google Scholar]
  30. Yang, Z.; Datian, Z.; Hongjie, L.; Bo, L. Train Speed Measurement and Positioning Method Based on Multi-Sensor Fusion. Urban Rail Transit 2011, 24, 30–32. [Google Scholar]
  31. Wu, W.; Song, H.; Wang, H.; Dong, H. Potential game based task offloading in the high-speed railway with reinforcement learning. IEEE Trans. Intell. Transp. Syst. 2023, 24, 12671–12685. [Google Scholar]
  32. Ferrari, A.; Mazanti, F.; Basile, D.; Terbeck, M.H. System Evaluation and Usability Analysis of a Formal Method Tool for Railway Signaling System Design. IEEE Trans. Softw. Eng. 2022, 48, 4675–4691. [Google Scholar] [CrossRef]
  33. Liang, Z.; Xianan, C.; Bin, S. Review of Model Based Mission Assurance for Complex System. J. Comput. Eng. Appl. 2022, 58, 30–39. [Google Scholar] [CrossRef]
  34. Xu, Q.; Lin, J.T. Safety Requirement Verification of Train-Centric CBTC by Integrating STPA with Coloured Petri Net. Int. J. Ind. Syst. Eng. 2023, 43, 168–189. [Google Scholar]
Figure 1. Processing flow of train positioning data under edge computing.
Mathematics 13 01015 g001
Figure 2. Train positioning method model under edge computing.
Mathematics 13 01015 g002
Figure 3. Message transfer sequence diagram.
Mathematics 13 01015 g003
Figure 4. Transmission module.
Mathematics 13 01015 g004
Figure 5. Vehicle module.
Mathematics 13 01015 g005
Figure 6. Edge module.
Mathematics 13 01015 g006
Figure 7. Probability density distribution of data processing delay under different impact factors.
Mathematics 13 01015 g007
Figure 8. Cumulative distribution of data processing delay under different impact factors.
Mathematics 13 01015 g008
Figure 9. Tracking interval between trains.
Mathematics 13 01015 g009
Figure 10. Tracking interval between trains under positioning error.
Mathematics 13 01015 g010
Figure 11. Cumulative distribution of data processing time delay.
Mathematics 13 01015 g011
Table 1. Transition module’s places and transitions.
NameTypeDescription
TrainSendPlaceVehicle transmission buffer
TrainRecvPlaceVehicle receiving buffer
EdgeSendPlaceEdge transmission buffer
EdgeRecvPlaceEdge receiving buffer
CountPlaceTransfer failure count
UplinkTransitionUplink transmission
DownlinkTransitionDownlink transmission
BreakTransitionCommunication disconnection
Table 2. Vehicle module’s place and transition.
NameTypeDescription
TrainStatePlaceVehicle terminal status
ComStatePlaceCommunication status
ScanResultPlaceChain building results
RecvBufferPlaceReceive buffer
SendBufferPlaceSend buffer
SensorPlaceSensor data
CPUPlaceVehicle processor
ResourcePlaceOnboard computing resources
ResultPlaceOnboard calculation results
FailCountPlaceTransfer failure count
BreakCountPlaceChain building failure count
ScanTransitionAttempting to establish a link
MissTransitionLink establishment failed
DetectedTransitionLink established successfully
DataArriveTransitionSensor data generation
SendTransitionData transmission
RecvTransitionData reception
FailTransitionPacket loss error code
RejectTransitionRefuse to handle
PermitTransitionAllow processing
EdgeCorrectTransitionEdge position correction
LocalCorrectTransitionVehicle end position correction
PosUpdateTransitionUpdate positioning results
BreakTransitionCommunication disconnection
ComputeTransitionVehicle data processing
AbandonTransitionAbort upload
LocalProcTransitionTask local processing
Table 3. Places and transitions in the edge module.
NameTypeDescription
EdgeRecvPlaceReceiving buffer
EdgeSendPlaceTransmission buffer
QueuePlaceTask waiting queue
CPUPlaceTask execution pool
ResourcesPlaceComputing resource
RecvTransitionData reception
ApplyTransitionData processing
OutputTransitionData output
JudgeTransitionResource judgment
ReSendTransitionData retransmission
Table 4. Method operability verification in different cases.
ASK-CTL
Case 1: fun Unexpect n = (Mark.Train1’ScanResult 1 n = [UNSUCCESS]
orelse Mark.Train1’RecvBuffer 1 n = [BREAK]);
Case 2: fun Unexpect n = (Mark.Train1’RecvBuffer 1 n = [FAIL]
orelse Mark.Top’Count 1 n <>[(1,0)]);
Case 3: fun Unexpect n = (Mark.Edge’Resources 1 n = [0]
andalso size(Mark.Edge’Queue 1 n) <>0);
val UnexpectList = PredAllNodes(fn n=>(Unexpect n))
fun Expect n = (Mark.Train1’TrainState 1 n = [UPDATED]);
val myASKCTLformula = POS(MODAL(NF(“STILL WORK”,Expect)));
fun verify n = eval_arc myASKCTLformula n;
val results = map verify UnexpectList;
if(cf(true,results) >0)
then print “The method works normally”
else print “The method works abnormally”
Result
val Unexpect = fn: Node ->bool
val Expect = fn: Node ->bool
val myASKCTLformula =
EXIST UNTIL(TT,MODAL(NF(“STILL WORK”,fn))): A
val verify = fn: Arc ->bool
val results = [true,true,true,…]: bool list
The method works normally
Table 5. Method security validation.
ASK-CTL
Case 4: fun Unexpect n = (Mark.Train1’TrainState 1 n = [UPDATED]
orelse Mark.Train2’TrainState 1 n) = [UPDATED]);
val myASKCTLformula = EV(NF(“always get results”, Result));
eval_ node myASKCTLformula InitNode;
Result
val Result= fn: Node ->bool
val myASKCTLformula =
FORALL_ UNTIL(TT,NF(“ALWAYS GET RESULT”,fn)): A
val it = true: bool
Table 6. Influencing factor levels.
LevelTransmission Success (%)Delay (ms)Computing Latency (ms)
19915
295510
3901020
Table 7. Comparative experimental results.
No.Trans. Success (%)Delay (ms)Comp. Latency (ms)Proc. Delay (ms)
1991515.03
29551036.81
390102069.83
49912029.85
59510553.67
69051037.63
799101055.82
89552046.28
9901515.45
Table 8. Range analysis results.
Impact LevelTrans. Success (%)Trans. DelayComp. Latency
133.5720.1128.05
245.5940.2443.42
340.9759.7748.65
Range12.0239.6620.60
Table 9. Variance analysis results.
ItemSum of SquaresFreedomMSEF Value
Trans. Success220.62110.30265.73
Trans. Delay1799.332899.665536.14
Comp. Latency688.122344.061205.04
Error3.3621.678
Total2711.418
Table 10. Simulation parameter setting.
ParameterValue
Train length (m)180
Reaction time travel distance (m)416
Protection distance (m)110
Block zone length (m)1950
Position error (m)10
Service braking deceleration (m/ s 2 )0.671
Data transmission delay (ms)Exp (1/10)
Edge computing delay (ms)Exp (1/40)
Onboard computing delay (ms)Exp (1/200)
Communication chain building delay (ms)Exp (1/150)
Train speed (km/h)300
Maximum number of retransmissions3
Disclaimer/Publisher’s Note: The statements, opinions and data contained in all publications are solely those of the individual author(s) and contributor(s) and not of MDPI and/or the editor(s). MDPI and/or the editor(s) disclaim responsibility for any injury to people or property resulting from any ideas, methods, instructions or products referred to in the content.

