Article

Research on the Pricing Model of B2B Data Transactions and Its Nature for a Single Industrial Chain

1
School of Internet Economics and Business, Fujian University of Technology, Fuzhou 350118, China
2
College of Science, University of Central Florida, Orlando, FL 32801, USA
*
Author to whom correspondence should be addressed.
Mathematics 2025, 13(6), 1002; https://doi.org/10.3390/math13061002
Submission received: 11 February 2025 / Revised: 6 March 2025 / Accepted: 11 March 2025 / Published: 19 March 2025

Abstract

:
With the advancement of global digital transformation, data trading has become a pivotal element in value circulation and innovation among enterprises. In particular, pricing strategies in the industrial chain’s data trading process critically influence the cooperation and market competitiveness of upstream and downstream enterprises. To address this issue, this study develops a Business-to-Business data transaction pricing model tailored to a single industry chain. The model incorporates factors such as data scarcity, encryption protection efforts, and market demand dynamics. By employing a Stackelberg dynamic model, the study systematically examines the pricing strategies of upstream and downstream enterprises under various incentive mechanisms and evaluates the impacts of encryption protection efforts and incentive mechanism coefficients on the profitability of the industry chain. The experimental results reveal that introducing incentive mechanisms for downstream enterprises modestly increases the profits of both upstream and downstream entities. Meanwhile, incentivizing upstream enterprises yields a multiplier effect, significantly boosting their profits while causing a slight decline in the profitability of downstream enterprises.
MSC:
94A16; 91G30; 90B18; 91C05

1. Introduction

With the rapid advancements in the Internet, IoT, and cloud computing technologies, the amount of data generated has exhibited unprecedented exponential growth. This trend is profoundly reshaping the structure and operational models of traditional industries, accelerating their transformation into intelligent and data-driven systems [1]. At present, for industries that are reliant on data flow, efficiently and reasonably pricing and trading data have become core challenges in the era of the digital economy [2]. Against this backdrop, the global data trading market has emerged as a critical hub, linking upstream and downstream enterprises within industrial chains. However, due to the complexities of information asymmetry, privacy sensitivity, and data diversity, traditional commodity pricing theories have been proven to be inadequate for data trading scenarios [3]. The value of data extends beyond supply-and-demand relationships, influenced by factors such as encryption protection costs, data scarcity, and market demand fluctuations. In B2B (Business-to-Business) data transactions, data pricing affects not only the economic interests of participants but also the value creation and distribution patterns of the entire industrial chain.
In the digital economy era, data is regarded as a key factor of production. As such, developing reasonable pricing mechanisms for data has become a pressing concern for both academia and industry [4]. Unlike traditional commodities, data possess unique attributes such as intangibility, replicability, and non-exclusivity, making their pricing mechanisms significantly more complex [5]. Zhang et al. [6] proposed a fundamental data pricing framework based on supply-and-demand dynamics, highlighting the importance of considering the preferences of both suppliers and consumers, as well as the role of market structure in determining the value of data. However, unlike traditional commodities, data cannot achieve optimal pricing solely through supply-and-demand equilibrium, as they are influenced by additional variables. Liang et al. [7] further emphasized that data pricing is affected not only by market dynamics but also by the characteristics and complexity of the data, as well as their practical value in specific scenarios. For instance, high-quality data with broad coverage and fast response times often command a premium in B2B markets. Furthermore, the pricing of data must account for their potential future value and the benefits of their application across multiple scenarios. Surbakti et al. [8] demonstrated that the market value of data increases exponentially with their versatility. In practical industries, platforms such as the Shanghai Data Exchange have adopted differentiated pricing strategies for sensitive data transactions, referencing factors such as investments in security protection and data scarcity [9]. Meanwhile, the Guiyang Big Data Exchange tends to adjust its prices by integrating market demand fluctuations and data-type preferences, supplemented by incentive mechanisms targeting enterprises with higher transaction frequencies [10].
With the growing importance of data privacy and security, encryption protection measures have become a crucial determinant of the market value of data [11]. For highly sensitive data, robust encryption not only elevates their market value but also enhances the security of transactions. Encryption technologies enable operations to be performed directly on encrypted data, allowing for the processing of data without decryption and ensuring privacy and integrity during transmission and transactions. This is especially beneficial in multi-node and untrusted environments [12]. Selective encryption further optimizes processing efficiency by encrypting only sensitive data components, reducing computational and transmission overheads while preserving privacy protection in large-scale and real-time data transactions [13]. Integrating encryption with blockchain technology enhances the security and transparency of multi-source data transactions, ensuring secure data flows and traceability in complex, distributed scenarios [14,15]. If blockchain serves as the underlying technical architecture of the data trading platform, the integration of smart contracts enables further automation of the data transaction process within the industrial chain, optimizing pricing, payment, and delivery processes while enabling immediate settlement to data providers upon the completion of a transaction. This reduces trust costs and enhances the reliability and verifiability of transactions [16]. Hybrid encryption techniques strike a balance between efficiency and security, providing a scalable solution for large-scale data transactions by protecting sensitive data during key exchanges and transmissions [17]. Additionally, encryption measures ensure compliance with international regulations, mitigating risks associated with cross-border data transactions [18].
While encryption protection measures safeguard the security of transactions and data privacy, achieving efficient data circulation ultimately hinges on appropriate pricing. For instance, through constructing pricing models grounded in market mechanisms and transaction scenarios, researchers have examined the unique characteristics of data, incorporating risk costs and scenario-adjustment coefficients to refine data pricing strategies [19]. Tian et al. [20] utilized the Shapley value from cooperative game theory to quantify the marginal contribution of data to machine learning models. This approach evaluates the value of data based on its marginal return, promoting fair value distribution among transaction participants. Luo et al. [21] introduced a risk-averse game model, leveraging Stackelberg and Bertrand game theories to enhance the flexibility and accuracy of pricing amidst market uncertainties. Bin et al. [22] proposed a dynamic data pricing model that integrates credit evaluations with pricing strategies, achieving dynamic pricing mechanisms and stabilizing market fluctuations. Their results indicated a 96% success rate in data transactions.
Despite these advancements, most studies have emphasized static supply-and-demand relationships and game strategies, often overlooking the dynamic interactions between upstream and downstream entities in varying scenarios. Moreover, while encryption technologies ensure transaction security, their influence on pricing remains under-explored. To address these gaps, this study develops a B2B data transaction pricing model tailored to a single industrial chain. The model incorporates factors such as data scarcity, encryption protection costs, and market demand dynamics, using a dynamic game-theoretic approach to analyze the complex interactions between upstream and downstream enterprises. Through introducing incentive mechanisms and encryption protection efforts, the study optimizes data transaction decisions, maximizing the value of data while enhancing the efficiency of transactions.

2. Theoretical Analysis

To conduct research on B2B data transaction pricing, it is essential to first clarify the theoretical concepts surrounding B2B data, including its definition, ownership relationships, and marketization. Additionally, the design of an allocation mechanism for B2B data property rights should be developed in alignment with the coordination and requirements of the industrial chain.

2.1. Definition of B2B Data

In 1988, Goodhue et al. [23] conducted research on enterprise data management, categorizing data into various types, including business, operational, analytical, and access data. From the perspective of data association, Deng et al. [24] proposed that B2B data resources can be grouped into three module sets: basic description, content description, and external links. However, due to the absence of a systematic definition and detailed description, the fundamental nature of B2B data and their ownership relationships remain unclear [25]. Subsequently, Xu et al. [26] and Li [27] provided comprehensive analyses of the concept of data assets and their statistical accounting, which helped to standardize and unify the definition of data.

2.2. Ownership of B2B Data

To clarify the relationships among data resources and ensure their effective development and utilization, defining property rights is essential [28]. Property rights encompass elements such as ownership, possession, management, and usufruct. Notably, data ownership can vary across different stages of the data lifecycle [28]. To address the issue of unclear ownership, both legal frameworks [29] and technological solutions [30] have been applied. Additionally, concepts such as joint construction, joint governance, and shared governance [31,32] have been introduced to navigate the complex, multi-level, and dynamic nature of data ownership relationships. Hu et al. [33] have further categorized data resource ownership-sharing relationships into three types—core–core members, core–non-core members, and non-core–non-core members—and conducted studies on governance models for these ownership structures.

2.3. Data Marketization

For a resource to be considered an asset, it must meet the criteria of clear ownership, scarcity, and the potential to generate economic benefits [34]. Ambiguous property rights and high transaction costs are key factors hindering the marketization of data as a production factor [35]. Traditional data markets rely on centralized platforms for data storage, matching, and transactions—a model prone to issues such as data monopolization and opaque transactions. In contrast, decentralized data markets utilize blockchain and distributed storage technologies to diminish the dependence on central entities, facilitating direct connections between data providers and consumers. This approach enhances the transparency of transactions and reinforces data ownership control [36]. To address the operation mechanisms within the data ownership framework [37], Gao [38] introduced the theory of data production, offering a theoretical foundation for the allocation of data rights. This theory establishes an order of utilization, beginning with the original data producer, followed by the data set producer, and, ultimately the data analyst. Furthermore, the rise of various trading platforms has significantly accelerated the marketization of data [39].

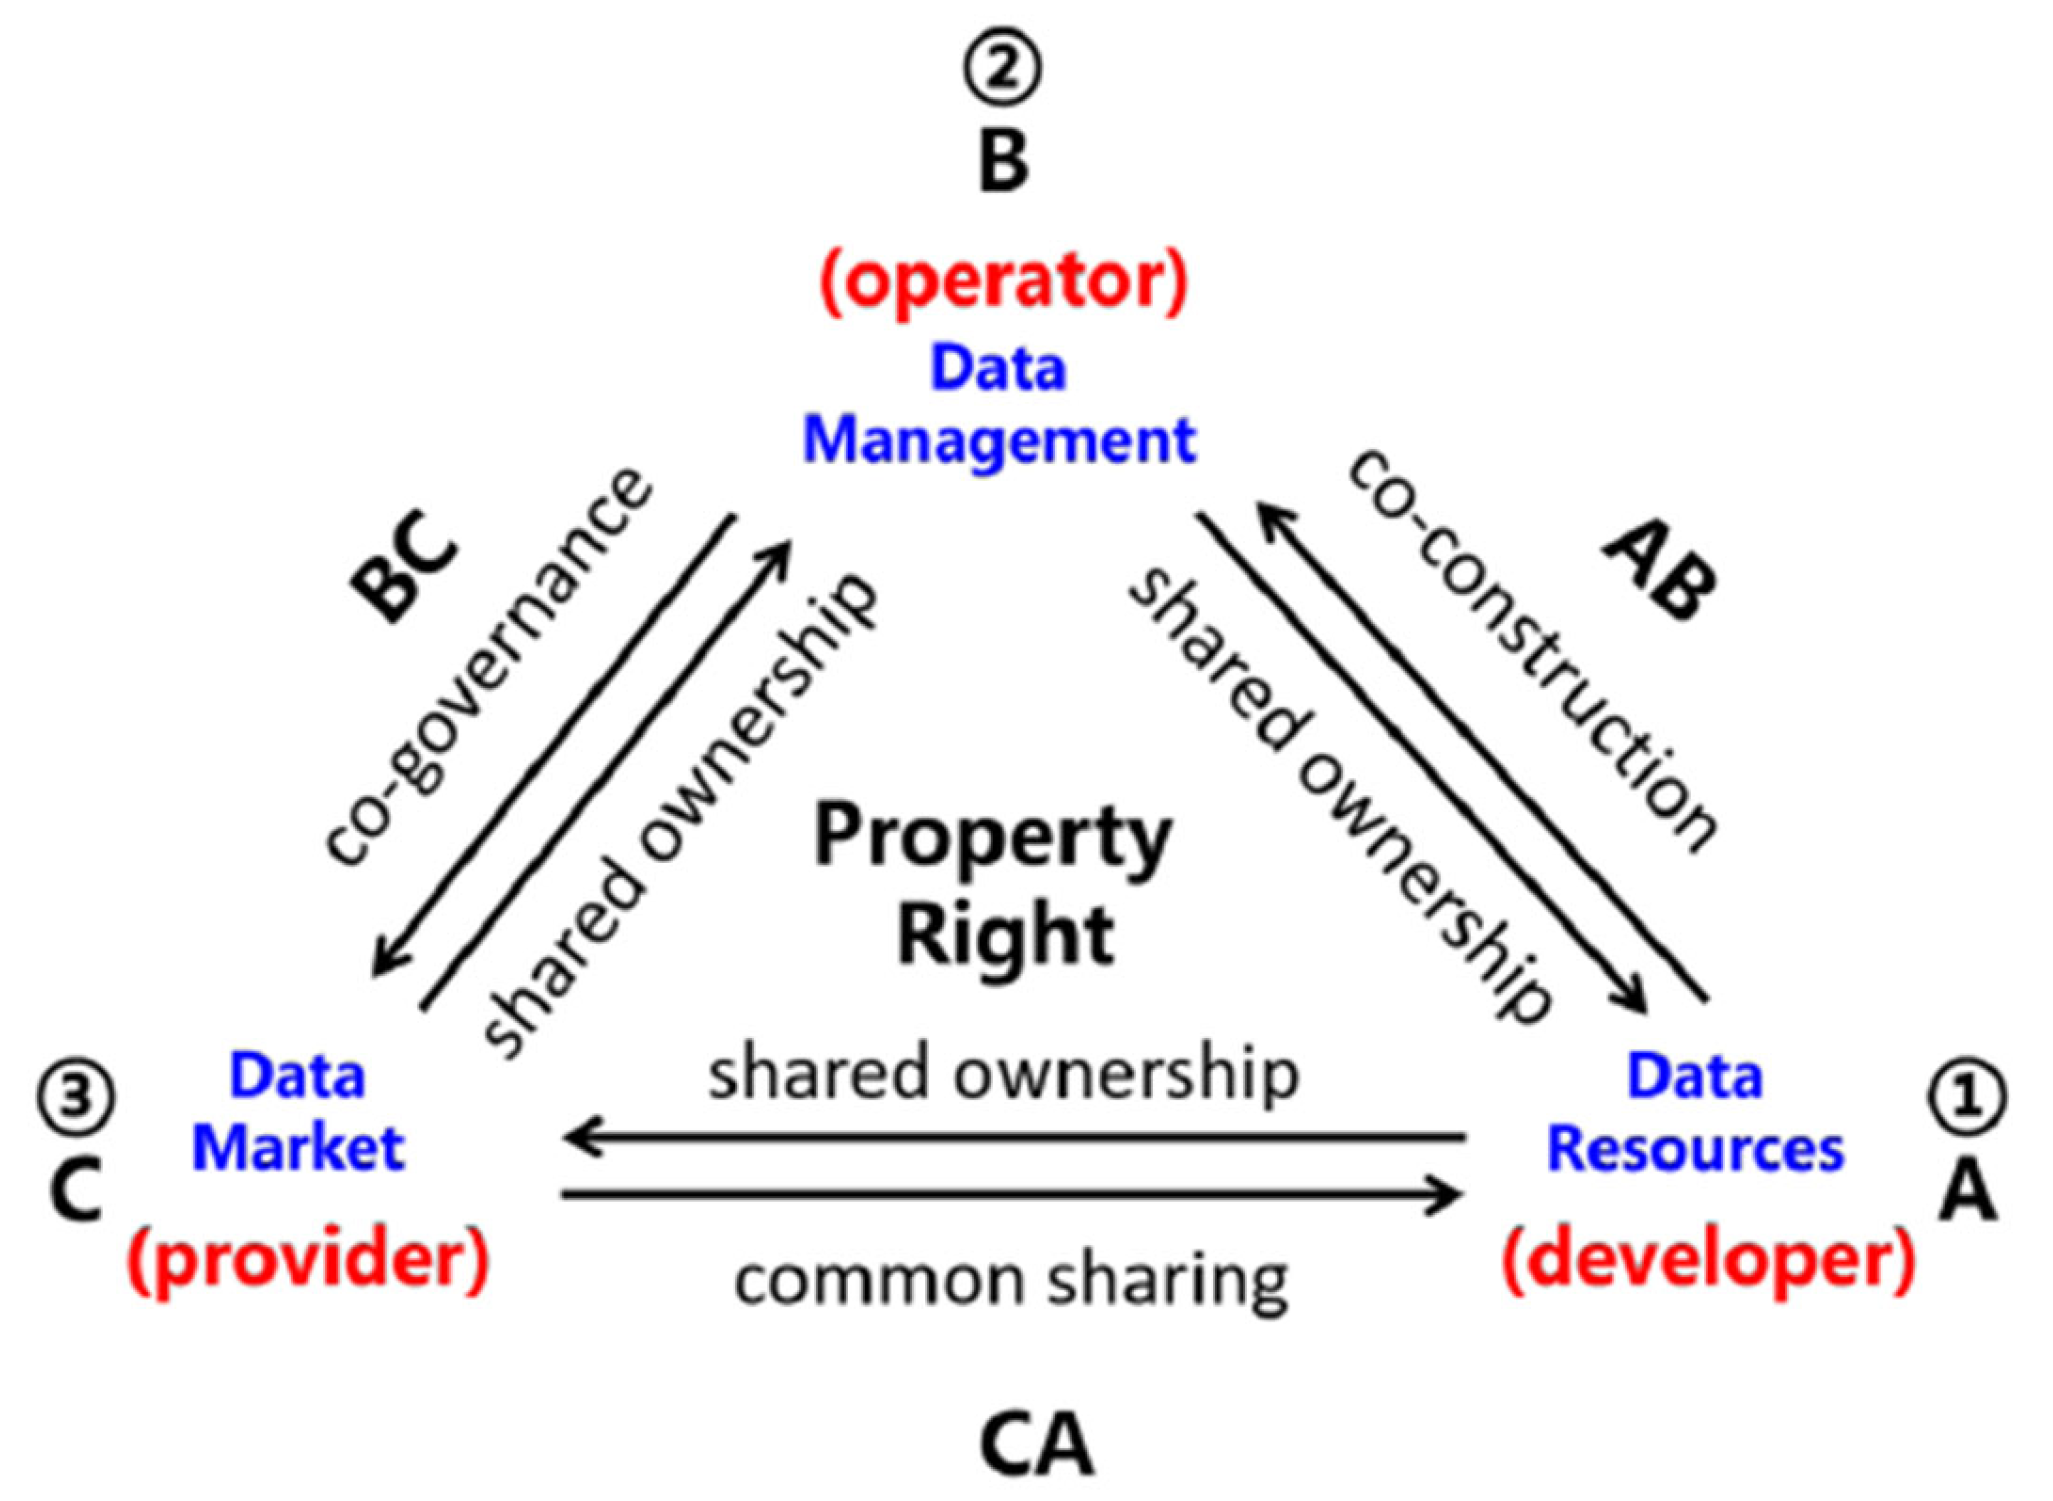
2.4. B2B Data Property Rights Allocation Under the Coordination of the Industrial Chain

Data marketization has significantly accelerated the growth of platform economies, reshaping supply chain collaboration. This, in turn, facilitates the empowerment of entities through data, allows for optimal data allocation, and further promotes marketization [40] (Figure 1).

2.4.1. B2B Data Participant Ownership Allocation

In B2B contexts, data can belong to organizations [41], collectors [42], controllers [23], or even individuals [43]. Tang [44] argued that enterprises typically have limited ownership over cleaned datasets. Wen [45] introduced the concept of “push-data property rights” as a meta-framework for defining data ownership. Following this framework, data control rights are allocated to users, while data management rights are allocated to enterprises. These rights encompass relative possession, productive use, autonomy in business operations, and incremental income rights. The allocation of data property rights reflects the interplay between participation and control which, when coordinated within the supply chain, contributes to the development of B2B data operational models.

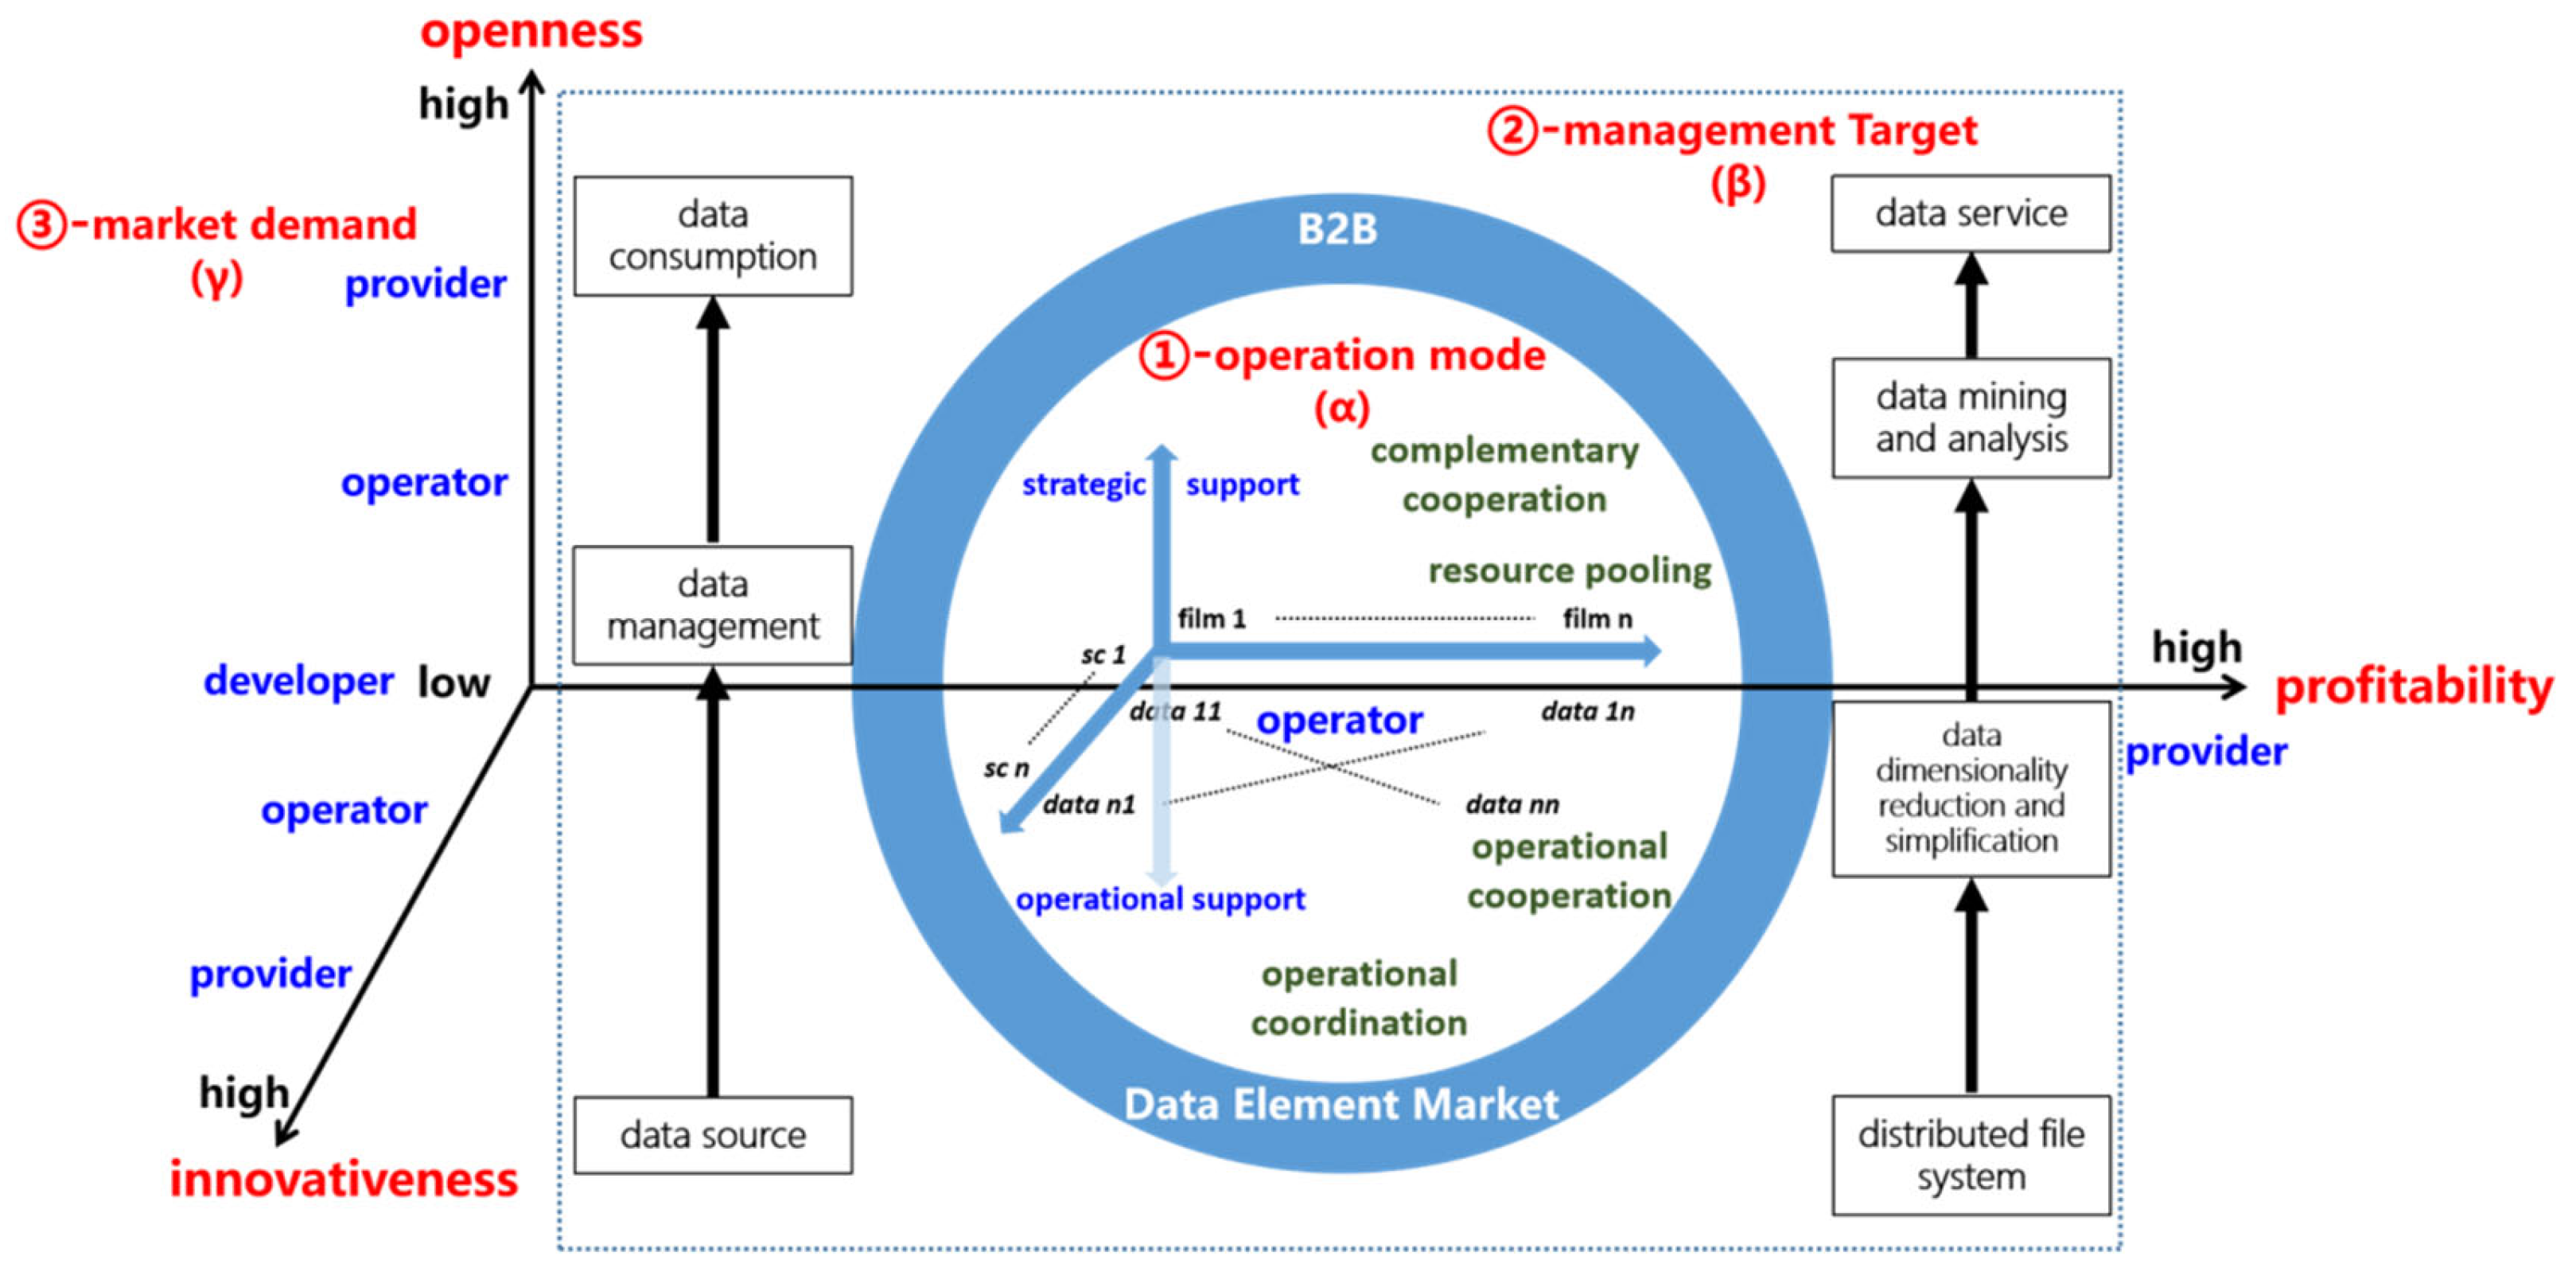
2.4.2. B2B Data Operation Mode and Unified Property Configuration

An operational model combines established standards and rules to manage resource allocation and ensure smooth data flows. It serves as a mechanism for expressing property rights in market circulation and realizing the configuration of data as a production factor [46]. Kauremaa et al. [47] proposed a framework encompassing horizontal and vertical proprietary standards. Chen (2021) [48] advanced this idea by introducing a supply chain ecosystem defined as a “digital-service-product package”, mapping the relationships among B2B data operations, property rights (Figure 2), and the rights boundaries of developers, operators, providers, and stakeholders [49].
Building on the governance principles of joint construction, joint governance, and shared ownership [50,51], we further refine the operational framework. The B2B operational mode [52] evolves into a three-dimensional model of data revenue operations (Figure 3), which models the data revenue distribution to delineate how data providers, platform operators, and developers—under four distinct digital platform models—leverage three key dimensions (i.e., operational models, management objectives, and market demands) to select optimal data service strategies across the nodes of the data industrial chain (e.g., from data sourcing to data management and finally to data consumption), thereby maximizing their respective benefits. This approach is designed to achieve openness [53], innovation [54], and profitability [47] and aligns with the structural industrial chain to unify B2B operational modes with the allocation of data property. It serves to clarify the multi-level dynamic ownership mechanisms of data subjects, thus establishing a robust B2B data property allocation system.

2.4.3. Ownership Allocation and Relationships

As shown in Figure 2, ownership allocation factors are represented symbolically by A, B, and C, representing developers, operators, and providers, respectively; furthermore, the combinations AB, BC, and AC illustrate the relationships of co-construction, co-governance, and shared ownership, respectively. These combinations encapsulate the operational dynamics and governance structures required for effective data marketization and collaborative supply chain coordination.

3. Transaction Parameter Description

The upstream enterprise, serving as the data provider, assumes a leadership role by first determining the pricing strategy, while the downstream enterprise responds accordingly based on the upstream firm’s decisions. This leader–follower interaction has been widely adopted in research on data product pricing and market relationships; for instance, Luo and Xing (2021) [21] employed a Stackelberg model to analyze data product pricing decisions under risk-averse conditions, highlighting how the leader’s pricing strategy significantly affects market responses to risk. Similarly, Zhao et al. (2023) [22] have utilized the Stackelberg game framework to investigate dynamic fluctuations in data pricing, emphasizing the strategic adaptability and decision-making flexibility of market participants in a dynamic market environment. Building upon these foundations, this study further extends the Stackelberg game model to the scenario of B2B data transactions within a single industrial chain, incorporating potential factors such as data encryption protection efforts in order to more accurately capture the strategic interactions and pricing dynamics between upstream and downstream enterprises.
Focusing on a single industry chain of B2B data as the research object, the data trading process (depicted in Figure 4) involves the upstream industry generating datasets (U) that are transmitted through two distinct channels. A proportion (P1) of sensitive data is transmitted via Channel 1 to the downstream industry, requiring additional investment into encryption and protection efforts. In contrast, a proportion (P2) of non-sensitive data is transmitted via Channel 2, which does not require such protections. Ultimately, the downstream industry receives a dataset Dd that is a subset of the upstream data Du.
In this process, the data flow is influenced by several factors, including the data scarcity S, potential market demand Md, market sensitivity Ms to the value of the data, and the data discount rate θ . These factors collectively determine the efficiency, value, and dynamics of the data trading process within the industrial chain.
To ensure equity in pricing and enhance market competitiveness within transactions, this model incorporates an external incentive mechanism, which is designed to mitigate disparities in bargaining power between upstream and downstream enterprises caused by information asymmetry and market imperfections. This mechanism thereby promotes fairness in the pricing process and contributes to the sustainable development of competitive market dynamics.
To analyze the impacts of data encryption protection efforts and incentives on the profits of upstream and downstream industries under different market structures, we introduce a series of symbols to describe the parameters in the model, as shown in Table 1. In particular, η represents the effort level of data encryption protection, with value range ( 0 , 1 ) , which is used to quantify the participants’ input intensity; θ represents the degree of data discount, with value range ( 0 , 1 ) , which is used to evaluate the price loss of the data in the transaction process; c represents the data acquisition cost, which reflects the costs incurred by the data provider in data collection, processing, and transmission; d represents the potential market demand, which measures the potential purchase intention and scale of the market demand for the data; the data encryption protection cost coefficient k is used to describe the sensitivity of the cost during the data encryption process (i.e., how the data protection cost fluctuates with the level of protection effort); w and p represent the decision price on the provider and demand sides, respectively, reflecting the pricing strategy and game of both parties in the data transaction; s is used to quantify the sensitivity of the market to data price fluctuations; γ represents the scarcity of data, indicating the availability and scarcity of data in the market; β represents the transaction proportion of sensitive data in the market, with value range ( 0 , 1 ) , which is used to quantify the proportion of sensitive data in overall market transactions; and, finally, the incentive mechanism coefficient λ , with value range ( 0 , 1 ) , describes the influence of the incentive mechanism on the behavior of all participants in the market.
These parameters form the basis for evaluating how encryption efforts, data-related costs, market demand, and incentive mechanisms influence the profitability and dynamics of data transactions in upstream and downstream industries under varying market structures.

4. Data Transaction Pricing Model

4.1. Model Description and Assumptions

Assumption 1.
The upstream and downstream entities within a single industry can fully access each other’s pricing strategies and make informed decisions during the pricing game. For simplicity, sensitive data are assumed to be equivalent to non-sensitive data.
Assumption 2.
The upstream data provider operates two distinct trading channels; one for sensitive data and the other for non-sensitive data. Data market demand, data discount rates, and data scarcity are key factors in this system. Encryption protection efforts applied to sensitive data can significantly enhance data security, thereby reducing the discount requirements of the demand side. Based on these assumptions, the sensitive data demand function is  D 1 = β d s p + 1 θ + η γ , and the non-sensitive data demand function is D 2 = 1 β d s p + θ γ .
Assumption 3.
During data transactions between upstream and downstream industries, the cost of encryption protection for sensitive data is assumed to be borne by the downstream industry. The cost function is expressed as   1 2 k η 2 , where  η  represents the level of encryption protection effort.
Assumption 4.
The additional profits generated by the incentive mechanism are assumed to be funded by a third party. These funds are sourced independently—for example, through government subsidies, financial support from industry associations, or specialized innovation incentive funds—rather than being deducted from transaction revenue or profits within the industrial chain.

4.2. Pricing Model Without Incentive Mechanism

Based on the above assumptions, and drawing upon the existing traditional supply chain game-theoretic frameworks proposed by Guo et al. [55] and Liu et al. [56], we construct a Stackelberg model incorporating the specific characteristics of data transaction scenarios to analyze the data transaction process between the upstream (data provider) and downstream (data demander) industries. In this model, the data provider acts as the leader, making its decision w   first. Subsequently, the data demander, as the follower, adjusts its corresponding decisions p and η based on the provider’s initial decision. The profit functions for the data provider and the data demander are expressed as follows:
Π 1 = ( w c ) ( D 1 + D 2 ) = ( w c ) [ d 2 s p + ( 1 + η ) γ ]
Π 2 = [ p ( 1 + θ ) w ] ( D 1 + D 2 ) = [ p ( 1 + θ ) w ] [ d 2 s p + ( 1 + η ) γ ] 1 2 k η 2
In the profit function represented by Equation (1), the left-hand ( w c ) denotes the unit profit obtained by the upstream firm from selling data products, while ( D 1 + D 2 ) indicates the total market demand for these data products. The purpose of this formulation is to clearly distinguish between the two core components—unit profit and market demand—in order to effectively capture the strategic interactions and profit allocation mechanisms among upstream and downstream firms in the game model.
In Equation (2), the downstream firm’s profit function incorporates the unit profit term [ P ( 1 + θ ) w ] , where the parameter ( 1 + θ ) is introduced to reflect value depreciation after the data transaction, meaning that the actual cost borne by the downstream firm exceeds the initial wholesale price. Additionally, the cost term 1 2 k η 2 captures the nonlinear nature of data security protection costs, accurately representing the economic constraints faced by downstream firms when investing in data protection measures.
Proposition 1.
No incentive mechanism exists for bilateral transactions, and if the condition  4 k γ 2 > 0  is satisfied, then the optimal decision satisfies (11)–(13).
Proof. 
Solve the Stackelberg equilibrium solution by reverse induction and find the first-order derivatives of the parameters p and η in Equation (2):
2 p = d 2 s p + ( 1 + η ) γ 2 s [ p ( 1 + θ ) ] w
2 η = γ [ p ( 1 + θ ) w ] k η
The corresponding Hessian matrix is
H = 2 2 p 2 2 2 p η 2 2 η p 2 2 η 2 = 4 s γ γ k
As the negative definiteness condition of the Hessian matrix is 4 k γ 2 > 0 , such that the optimal solution can be found by setting 2 p = 0 and 2 η = 0 , then the optimal reaction function sums for the downstream industry demand side are p = d + ( 1 + η ) γ + 2 s ( 1 + θ ) w 4 s and η = γ [ p ( 1 + θ ) w ] k . Subsequently, substituting p and η into the upstream industry data provider profit function:
Π 1 = ( w c ) d 2 + γ γ ( p w ( θ + 1 ) ) k + 1 γ ( η + 1 ) 2 s w ( θ + 1 )
Π 1 w = d k + γ ( k η k + 2 γ p ) + 2 c ( γ 2 + k s ) ( 1 + θ ) 4 ( γ 2 + k s ) ( 1 + θ ) w 2 k
When 4 k γ 2 > 0 , the profits are maximal and in equilibrium:
w = 1 4 2 c + d k + γ ( k η k + 2 γ p ) ( γ 2 + k s ) ( 1 + θ )
Substituting w into the optimal reaction functions p and η , we obtain
p = 2 ( 1 + η ) γ 3 + ( 3 + η ) γ k s + d ( 2 γ 2 + 3 k s ) + 2 c k s 2 ( 1 + θ ) + 2 γ 2 s ( c + p + c θ ) 8 s ( γ 2 + k s )
η = γ ( d k + γ k η γ k 2 γ 2 p 4 k p s + 2 c ( γ 2 + k s ) ( 1 + θ ) ) 4 k ( γ 2 + k s )
Combining (8)–(10), we obtain the solution to
w = 2 d k 2 s c γ 4 + 2 γ k 2 s + 4 c k 2 s 2 c γ 4 θ + 3 c γ 2 k s + 4 c k 2 s 2 θ + 3 c γ 2 k s θ ( θ + 1 ) ( 8 k 2 s 2 + 3 γ 2 k s γ 4 )
p = γ 3 k c γ 4 + 3 d k 2 s + 3 γ k 2 s + 2 c k 2 s 2 + d γ 2 k c γ 4 θ + c γ 2 k s + 2 c k 2 s 2 θ + c γ 2 k s θ 8 k 2 s 2 + 3 γ 2 k s γ 4
η = γ ( d γ 2 + γ 3 + d k s + γ k s 2 c γ 2 s 2 c k s 2 2 c γ 2 s θ 2 c k s 2 θ ) 8 k 2 s 2 + 3 γ 2 k s γ 4

4.3. Pricing Model of the Incentive Mechanism for Downstream Industries

In the game between the upstream industry (the data provider) and the downstream industry (the data demander), the cost of data encryption protection is borne by the downstream industry; this may put the downstream industry at a disadvantage, especially when the market has high requirements for data security. To balance this disadvantage, we adjust the downstream benefit distribution by introducing an incentive mechanism coefficient λ . At this time, the new downstream industry demand-side profit function is 2 = 2 + λ ( 1 + 2 ) :
Π 2 = 1 2 η 2 k ( 1 + λ ) η γ ( c λ ( 1 + λ ) p + ( 1 + θ + λ θ ) w ) ( d + γ 2 p s ) ( c λ ( 1 + λ ) p + ( 1 + θ + λ θ ) w )
Proposition 2.
By adding an incentive mechanism for the downstream industry, the optimal decision satisfies (19)–(21).
Proof. 
The reverse induction method is used again, and the first-order derivative of p for the downstream industry demand side profit function 2 is taken:
Π 2 p = d ( 1 + λ ) + ( 1 + η ) γ ( 1 + λ ) + 2 s ( c λ 2 ( 1 + λ ) p + ( 1 + θ + λ θ ) w )
The second-order derivative is 2 Π 2 p 2 = 4 s 4 λ s < 0 . Thus, 2 is a strictly concave function of p , and, so, the pricing strategy is unique.
Letting Π 2 p = 0 , we obtain the solution
p 1 = d + γ ( η + 1 ) + λ ( d + 2 s ( c w ) + γ ( η + 1 ) + 2 s w ( θ + 1 ) ) + 2 s w ( θ + 1 ) 4 s + 4 λ s .
Next, the first-order derivative of η for the downstream industry demand-side profit function 2 is taken:
Π 2 η = γ ( p w ( θ + 1 ) ) η k λ ( η k γ ( p w ( θ + 1 ) ) + γ ( c w ) )
The second-order derivative is 2 Π 2 η 2 = k k λ < 0 . Thus, 2 is a strictly concave function of η , and, so, the pricing strategy is unique.
Let Π 2 η = 0 . Then, we obtain the solution
η 1 = ( γ w γ p + c γ λ γ λ p + γ θ w + γ λ θ w ) k + k λ .
Substituting p 1 and η 1 into the function 1 , we obtain
Π 1 = ( c w ) γ γ w γ p + c γ λ γ λ p + γ θ w + γ λ θ w k + k λ 1 ( c w ) d + ( c w ) 2 s ( d + γ ( η + 1 ) + λ ( d + 2 s ( c w ) + γ ( η + 1 ) + 2 s w ( θ + 1 ) ) + 2 s w ( θ + 1 ) ) 4 s + 4 λ s
The first-order derivative of w for the upstream industry profit function 1 is then taken, which gives
Π 1 w = ( 1 + λ ) ( d k + γ ( k η k + 2 γ p ) ) + 2 c ( γ 2 + k s ) ( 1 + λ ( 1 + θ ) + θ ) 4 ( γ 2 + k s ) ( 1 + θ + λ θ ) w 2 k ( 1 + λ )
The second-order derivative is 2 Π 1 w 2 = 2 ( γ 2 + k s ) ( 1 + θ + λ θ ) k ( 1 + λ ) < 0 . Thus, 1 is a strictly concave function of w . Letting Π 1 w = 0 , we obtain the solution:
w 1 = ( 1 + λ ) ( d k + γ ( k η k + 2 γ p ) ) + 2 c ( γ 2 + k s ) ( 1 + λ ( 1 + θ ) + θ ) 4 ( γ 2 + k s ) ( 1 + θ + λ θ )
Finally, we combine p 1 , η 1 , and w 1 to obtain the optimal solutions for three reaction functions:
p 1 = γ 3 k c γ 4 + 3 d k 2 s + 3 γ k 2 s + 2 c k 2 s 2 + d γ 2 k c γ 4 θ + c γ 2 k s + 2 c k 2 s 2 θ + c γ 2 k s θ 8 k 2 s 2 + 3 γ 2 k s γ 4
η 1 = γ ( d γ 2 + γ 3 + d k s + γ k s 2 c γ 2 s 2 c k s 2 2 c γ 2 s θ 2 c k s 2 θ ) 8 k 2 s 2 + 3 γ 2 k s γ 4
w 1 = c 4 k 2 s 2 ( 1 + λ ( 1 + θ ) + θ ) + γ 4 ( 1 + θ + λ θ ) 3 γ 2 k s ( 1 + θ + λ θ ) 2 ( d + γ ) k 2 ( 1 + λ ) s ( γ 4 3 γ 2 k s 8 k 2 s 2 ) ( 1 + θ + λ θ )
Corollary 1.
According to the equation above, obtain p = p 1 . When d + γ > 2 c s ( 1 + θ ) and k s γ 2 , then
w w 1 = 2 k 2 λ s ( d + γ 2 c s 2 c s θ ) ( θ + 1 ) ( θ + λ θ + 1 ) ( 8 k 2 s 2 + 3 γ 2 k s γ 4 ) < 0 ,   w 1 λ = 2 k 2 s ( d + γ 2 c s 2 c s θ ) ( θ + λ θ + 1 ) 2 ( 8 k 2 s 2 + 3 γ 2 k s γ 4 ) > 0 .
Corollary 1 shows that, when incentivizing downstream industries, the upstream industry usually increases its pricing, while the downstream industry’s pricing remains unchanged, mainly as the incentives increase the demand of the downstream industry for upstream products, thus motivating upstream companies to increase their earnings through raising the price. With an increase in the incentive coefficient, yielding increasing downstream demand for upstream data products, the upstream enterprises further increase the price (i.e., w increases). This is because upstream enterprises see higher market demand and profit space and use their market pricing power to make a greater profit. Meanwhile, downstream enterprises, under competitive pressure to maintain their market share and customer relations, choose not to adjust the price.

4.4. Pricing Model of the Incentive Mechanism for the Upstream Industry

Although high-quality data need to be provided, the upstream industry is often in a relatively weak position in an environment characterized by fierce market competition, especially when the downstream industry is relatively strong. Downstream industries often have greater bargaining power and can demand lower prices or higher data discounts, thereby weakening the profits of upstream providers. In this context, the upstream industry profit function with the incentive mechanism is constructed as 1 = 1 + 1 + λ 1 λ ( 2 1 ) .
Proposition 3.
When an incentive mechanism is added to the upstream industry, and 4 k γ 2 > 0 is satisfied, the optimal decision meets (27)–(29).
Proof. 
The profit function under the incentive mechanism is as follows:
Π 1 = ( d + γ + η γ 2 p s ) ( w c ) + 1 + λ λ 1 η 2 k 2 + ( d + γ + η γ 2 p s ) ( c w ) + ( d + γ + η γ 2 p s ) ( p ( 1 + θ ) w )
According to (3)–(5), we obtain the optimal reaction function sums for the downstream industry as p = d + ( 1 + η ) γ + 2 s ( 1 + θ ) w 4 s and η = γ [ p ( 1 + θ ) w ] k . Then, we substitute these into 1 and obtain
Π 1 = λ + 1 λ 1 d + γ ( η + 1 ) + 2 s w ( θ + 1 ) 4 s w ( θ + 1 ) d 2 + γ γ ( p w ( θ + 1 ) ) k + 1 γ ( η + 1 ) 2 s w ( θ + 1 ) + λ + 1 λ 1 ( c w ) d 2 + γ γ ( p w ( θ + 1 ) ) k + 1 γ ( η + 1 ) 2 s w ( θ + 1 ) γ 2 ( p w ( θ + 1 ) ) 2 2 k ( c w ) d 2 + γ γ ( p w ( θ + 1 ) ) k + 1 γ ( η + 1 ) 2 s w ( θ + 1 )
The reverse induction method is used, and the first- and second-order derivatives of w for the upstream industry provider profit function 1 are taken:
Π 1 w = 1 4 k ( 1 + λ ) s ( 1 + η ) γ 3 ( 1 + λ ) ( 1 + θ ) + 2 γ k s ( 3 + 2 η θ λ ( 1 + θ ) ) 1 4 k ( 1 + λ ) s d γ 2 ( 1 + λ ) ( 1 + θ ) + 2 k s ( 3 + λ + θ + λ θ ) + 1 4 k ( 1 + λ ) s 4 k s 2 ( 1 + θ ) ( 2 c + ( 5 + λ + θ + λ θ ) w ) + 1 4 k ( 1 + λ ) s 2 γ 2 s 4 c ( 1 + θ ) + p ( 3 + λ + θ + λ θ ) + 8 ( 1 + θ ) w
2 Π 1 w 2 = 2 s ( θ + 1 ) ( λ + 1 ) + 2 γ 2 ( θ + 1 ) ( λ + 1 ) k 1 λ
As 2 Π 1 w 2 < 0 , 1 is a strictly concave function of w . Letting Π 1 w = 0 , we obtain the solution:
w 2 = ( 1 + η ) γ 3 ( 1 + λ ) ( 1 + θ ) + 8 c k s 2 ( 1 + θ ) + 2 γ k s ( 3 2 η + λ + θ + λ θ ) + 2 γ 2 s ( 4 c ( 1 + θ ) 4 s ( 1 + θ ) ( 4 γ 2 + k s ( 5 + λ + θ + λ θ ) ) p ( 3 + λ + θ + λ θ ) ) + d ( γ 2 ( 1 + λ ) ( 1 + θ ) + 2 k s ( 3 + λ + θ + λ θ ) ) 4 s ( 1 + θ ) ( 4 γ 2 + k s ( 5 + λ + θ + λ θ ) )
Similarly, p , η , and w 2 can be obtained as follows:
w 2 = ( d + γ ) k 2 s ( 3 + λ + θ + λ θ ) c ( γ 2 4 k s ) ( γ 2 + k s ) ( 1 + θ ) ( 1 + θ ) ( γ 4 + 3 γ 2 k s + 2 k 2 s 2 ( 5 + λ + θ + λ θ ) )
p 2 = c ( γ 2 2 k s ) ( γ 2 + k s ) ( 1 + θ ) ( d + γ ) k ( γ 2 + k s ( 4 + λ + θ + λ θ ) ) γ 4 3 γ 2 k s 2 k 2 s 2 ( 5 + λ + θ + λ θ )
η 2 = γ ( γ 2 + k s ) ( d + γ 2 c s ( 1 + θ ) ) 3 γ 2 k s + 2 k 2 s 2 ( 5 + λ + θ + λ θ ) γ 4
Corollary 2.
When d + γ > 2 c s ( 1 + θ ) and k s γ 2 , then
p p 2 = k 2 ( 1 + λ ) s ( γ 4 + γ 2 k s + 2 k 2 s 2 ) ( 1 + θ ) ( d γ + 2 c s ( 1 + θ ) ) ( γ 4 3 γ 2 k s 8 k 2 s 2 ) ( γ 4 3 γ 2 k s 2 k 2 s 2 ( 5 + λ + θ + λ θ ) ) < 0 ,
p 2 λ = k 2 s ( θ + 1 ) ( 2 k 2 s 2 γ 4 + γ 2 k s ) ( d + γ 2 c s 2 c s θ ) ( 10 k 2 s 2 γ 4 + 2 k 2 λ s 2 + 2 k 2 s 2 θ + 3 k s γ 2 + 2 k 2 λ s 2 θ ) 2 > 0 ,
w w 2 = k 2 s ( λ + 1 ) ( 4 k 2 s 2 γ 4 + 3 γ 2 k s ) ( d + γ 2 c s 2 c s θ ) ( 8 k 2 s 2 γ 4 + 3 γ 2 k s ) ( 10 k 2 s 2 γ 4 + 3 γ 2 k s + 2 k 2 λ s 2 + 2 k 2 s 2 θ + 2 k 2 λ s 2 θ ) < 0 ,
w 2 λ = k 2 s ( 4 k 2 s 2 γ 4 + 3 γ 2 k s ) ( d + γ 2 c s 2 c s θ ) ( 10 k 2 s 2 γ 4 + 2 k 2 λ s 2 + 2 k 2 s 2 θ + 3 k s γ 2 + 2 k 2 λ s 2 θ ) 2 > 0 .
Corollary 2 shows that the continuous incentive for upstream industries will lead to higher pricing for both upstream and downstream industries, where the pricing further increases with an increase in the incentive coefficient. This is because the incentive mechanism for upstream industries is usually designed to enhance their data production and supply capacity; this directly increases the value of data and market demand, and therefore, they can make higher profits by increasing their pricing. In the face of the price increase of upstream data, the downstream purchase cost increases. For such industries to maintain their own profit margin and competitiveness, the pricing of their own products or services must be improved.
Additionally, an increase in the incentive coefficient means that the upstream industry’s innovation ability will be significantly improved, which further increases the value of data in the market and makes the parties in data transactions more competitive. This also greatly improves the pricing power of the upstream industry and promotes increased pricing in the downstream industry through the transmission effect. This upward trend will be more significant with a greater increase in the incentive coefficient.

5. Numerical Simulation

Building on the above model, we can derive the behavioral patterns and pricing strategies of upstream and downstream industries in terms of data trading under various market conditions and incentive mechanisms. To enhance the practical applicability of the results, we performed a numerical simulation of the model parameters and analyzed the optimal pricing decisions and profit variations for both parties. The parameters used in the simulation are detailed in Table 2, with values assigned based on actual market research data and theoretical assumptions in order to closely represent the dynamics of the pricing game in a real market environment.
Figure 5 illustrates the dynamic effects of data encryption protection efforts on the profits of upstream and downstream industries, as well as overall market profits, in the absence of an incentive mechanism. As the variable η increases from 0 to 1, the upstream industry maintains consistent profitability, with profit values remaining stable above 60. This indicates that the upstream industry enjoys strong profitability and a relatively stable market position throughout the data trading process.
In contrast, the downstream industry’s profitability is weaker, with profit values stabilizing around 55. This reflects its vulnerability and relative market disadvantage, particularly in absorbing the costs associated with data encryption protection.
The total profit curve exhibits a steady upward trend across the range of η , suggesting that overall market profitability is primarily driven by the upstream industry’s strong performance. In comparison, the downstream industry’s profit has a relatively minor impact on the total market profit. This highlights the upstream industry’s dominant role in supporting the market’s overall economic gains.
Figure 6 and Figure 7 illustrate the varying effects of data encryption protection efforts on the profits of the upstream and downstream industries, as well as overall market benefits, under different incentive mechanisms.
In Figure 6, as the level of data encryption protection efforts increases, the downstream industry’s profit remains stable at approximately 60, while the upstream industry’s profit remains around 80, presenting a modest growth rate. This reflects a balanced but limited impact of encryption efforts on profits for both industries.
In contrast, Figure 7 shows a scenario with the same range of effort levels but with significantly different results. The upstream industry’s profit increases sharply from approximately 180 to 200, while the downstream industry’s profit remains stable at around 25. Compared to the non-incentive mechanism scenario, introducing an incentive mechanism targeted at the downstream industry results in an increase in overall market profits. However, this comes at the cost of slightly weakening the upstream industry’s profitability. The downstream industry experiences only a marginal improvement in its profit levels, maintaining relative stability.
Conversely, when the incentive mechanism is directed toward the upstream industry, the results differ notably. While this negatively impacts the downstream industry’s profits, the upstream industry’s profits increase significantly, reaching nearly double the level observed in the non-incentive mechanism scenario. This substantial growth in upstream profitability also drives an increase in overall market profits.
These findings suggest that under upstream-focused incentives, enhanced data encryption–protection efforts not only boost the upstream industry’s profit levels but also contribute to the overall growth of market profits. This achieves the dual objectives of optimizing market efficiency and enhancing overall economic benefits.
Figure 8 and Figure 9 highlight the differentiated effects of varying incentive mechanism coefficients on the profits of stakeholders under two market structures: “upstream–downstream (incentive)” and “upstream (incentive)–downstream”.
In Figure 8, as the incentive mechanism coefficient increases from 0 to 0.9, the profits of all parties show an upward trend. Notably, the profit curves of the upstream and downstream industries gradually converge, reflecting a clear trend of synergistic development. This suggests that incentivizing downstream industries not only enhances the profitability of the upstream industry but also fosters steady growth in the downstream industry’s profits, thereby driving the collective advancement of the overall market.
In Figure 9, for the same range of incentive mechanism coefficients, the downstream industry’s profit remains stable at approximately 25. Meanwhile, the upstream industry’s profit exhibits significant nonlinear growth, with a sharp increase beyond a coefficient of 0.7. This nonlinear growth indicates that, once the incentive mechanism coefficient surpasses a critical threshold, the benefits for the upstream industry expand rapidly, demonstrating high market–income elasticity; however, the downstream industry remains in a stable but low-profit state. This highlights the downstream industry’s relative vulnerability in the “upstream (incentive)–downstream” market structure, where its development is heavily influenced by the upstream industry’s growth.
These results underline the importance of tailoring incentive mechanisms to promote balanced development. While upstream-focused incentives can drive significant growth in upstream profitability and market efficiency, they risk leaving the downstream industry in a weaker position unless complementary measures are implemented.
Figure 10 illustrates the dynamic changes in the profits of upstream and downstream industries under the combined influence of data encryption protection efforts and the incentive mechanism coefficient, specifically when the downstream industry is incentivized. As both η and λ increase, the profits of both industries show an upward trend, but notable differences emerge in their relative profit levels.
The upstream industry experiences steady profit growth, starting at an initial value of 70 and reaching approximately 110. In contrast, the downstream industry begins with an initial profit of 50, peaking at around 95. While the introduction of the incentive mechanism enhances the downstream industry’s profits, its growth rate aligns closely with that of the upstream industry.
These findings highlight that, under similar conditions, the upstream industry achieves greater profit accumulation due to its stronger market position and control over resources. Conversely, despite the downstream industry benefiting from incentives, its profit growth remains significantly constrained, reflecting the limitations imposed by its subordinate role in the market structure. This underscores the persistent imbalance in profit distribution between upstream and downstream industries, even with targeted interventions.
Figure 11 illustrates the dynamic changes in profits for upstream and downstream industries under the combined influence of data encryption protection efforts and the incentive mechanism coefficient, specifically when the upstream industry is incentivized.
For upstream enterprises, the profits exhibit exponential growth as both η and λ increase. In the high-value ranges of these variables, profits surge dramatically, reaching nearly 1000. This reflects the synergistic effect of the incentive mechanism and data encryption protection, creating a clear multiplier impact. Through strengthening data control and protection, upstream enterprises bolster their market position and significantly expand their profit potential.
In stark contrast, the downstream industry’s profits show a substantial downward trend under the same conditions. Initially, at 26, profits gradually decline to 16 as η and λ increase. This indicates that while the incentive mechanism and encryption efforts generate significant profit growth for upstream enterprises, they simultaneously impose additional pressures on downstream enterprises, further constraining their profit margins.
This dynamic underscores a critical imbalance: although data encryption protection enhances the overall security of data transactions, its benefits disproportionately favor upstream enterprises. These enterprises gain increased pricing power and market dominance, while downstream enterprises are unable to achieve corresponding growth in their profits. This highlights the downstream industry’s vulnerability in scenarios where upstream-focused incentives and enhanced protection measures dominate the market structure.
To validate the theoretical effectiveness of our numerical simulations, we compared our results with findings from the existing literature. Gordon and Loeb (2002) [57] established an economic model of information security investment, highlighting that appropriate security investments significantly enhance the economic value of data assets, thereby increasing the profitability of enterprises. Biswas et al. (2021) [58] designed an incentive mechanism based on privacy valuation in data markets, demonstrating that appropriate privacy-based incentives effectively enhance data providers’ willingness to participate. Although the incentive mechanism proposed by Biswas et al. differs slightly from ours, both approaches share a common rationale: using external incentives to improve market efficiency and profitability in data trading. Our numerical results align well with these previous findings and further extend the literature by explicitly elucidating the interactive effects between data encryption protection and external financial incentives, particularly regarding their impacts on the distribution of profit among upstream and downstream enterprises in the supply chain.

6. Parameter Confirmatory Test

To further validate the rationality of the model parameters, this study conducted an online questionnaire survey targeting personnel involved in data trading within data trading platform companies, data departments of internet enterprises, and traditional industrial enterprises in China. The respondents included data trading specialists, data analysts, data product managers, and other related roles. All respondents possessed practical experience in data trading activities and were thus capable of objectively evaluating the importance of data encryption protection, incentive mechanisms, and pricing decisions. A five-point Likert scale was adopted for the survey, resulting in 94 valid questionnaires with an effective response rate exceeding 90%. The collected data were analyzed using descriptive statistics and correlation analysis in MATLAB R2024a to further clarify the practical significance of each factor, providing robust empirical support for the parameterization of the model.
Table 3 presents a descriptive statistical analysis evaluating the perceived importance of each key parameter. The statistical results for each parameter include the mean, standard deviation, rank, and minimum and maximum values, offering insights into the central tendencies and variability of each factor within the sample. This analysis provides a foundational understanding of the key factors influencing the data trading market.
Key Findings:
  • High-Mean Parameters: Parameters such as data encryption protection cost, data encryption protection effort, and data acquisition cost were found to have higher mean values, indicating their significant perceived importance among respondents. These factors play critical roles in market decision making.
  • Low-Variance Parameters: The selling price had the lowest standard deviation (0.986), suggesting that respondents have a consistent perception of its importance.
  • High-Variance Parameters: Data scarcity showed a higher standard deviation (1.223), reflecting diverse opinions on its significance, likely due to varying situational factors affecting the respondents’ evaluations.
  • Concentration of Ratings: Most responses clustered around values of 4 and 5, indicating that the majority of respondents regarded these parameters as highly important in the context of data transactions.
This statistical analysis highlights the critical parameters and their perceived importance in the data trading market, providing a valuable reference for understanding industry trends and decision-making priorities.
Table 4 presents the Pearson correlation coefficient matrix for the data trading market parameters, quantifying the linear correlation strengths between them. This matrix serves to identify potential synergies or independent relationships among factors, offering a quantitative foundation for a deeper understanding of how these parameters influence data trading behaviors. Through analyzing these correlations, the matrix provides insights into the interdependencies and interactions that shape decision making and market dynamics.
Overall, most correlation coefficients between the parameters fell within the range of 0.4–0.6, indicating moderate correlations. This suggests that, while these factors exhibit a degree of interdependence in market decision making, they also retain distinct characteristics. Notably, the correlations between data value sensitivity, data encryption protection efforts, and the incentive mechanism coefficient with upstream and downstream pricing were significant, highlighting their critical influences on pricing strategies. These factors play pivotal roles in shaping and regulating prices in the data trading market.
Key Observations:
  • Data Encryption Protection Efforts and Pricing:
    The correlation coefficient between data encryption protection efforts and upstream pricing was 0.437, while that for downstream pricing was 0.419.
    This indicates that, as data encryption protection efforts increase, both upstream and downstream prices tend to rise (particularly upstream).
    This relationship suggests that enhanced data encryption measures improve data security and market confidence, thereby creating opportunities for higher premiums in data transactions.
  • Incentive Mechanism Coefficient and Pricing:
    The incentive mechanism coefficient showed moderate positive correlations with upstream pricing (0.456) and downstream pricing (0.468).
    This reflects the fact that incentive mechanisms encourage upstream data providers to adopt more active pricing strategies while also increasing the downstream demand side’s willingness to pay, thereby elevating the overall pricing levels in the market.
These findings emphasize the interplay between data protection measures, incentive mechanisms, and pricing strategies, underscoring their importance in driving market efficiency and value creation in the market.
Figure 12 depicts the importance scores of data encryption protection efforts and incentive mechanism coefficients, as perceived by respondents, in relation to upstream and downstream pricing. The boxplot visually conveys the distribution of scores, illustrating the relative impacts of these two factors on market pricing decisions. This analysis provides insights into the distinct roles of data protection and incentives in shaping pricing strategies.
Key Observations:
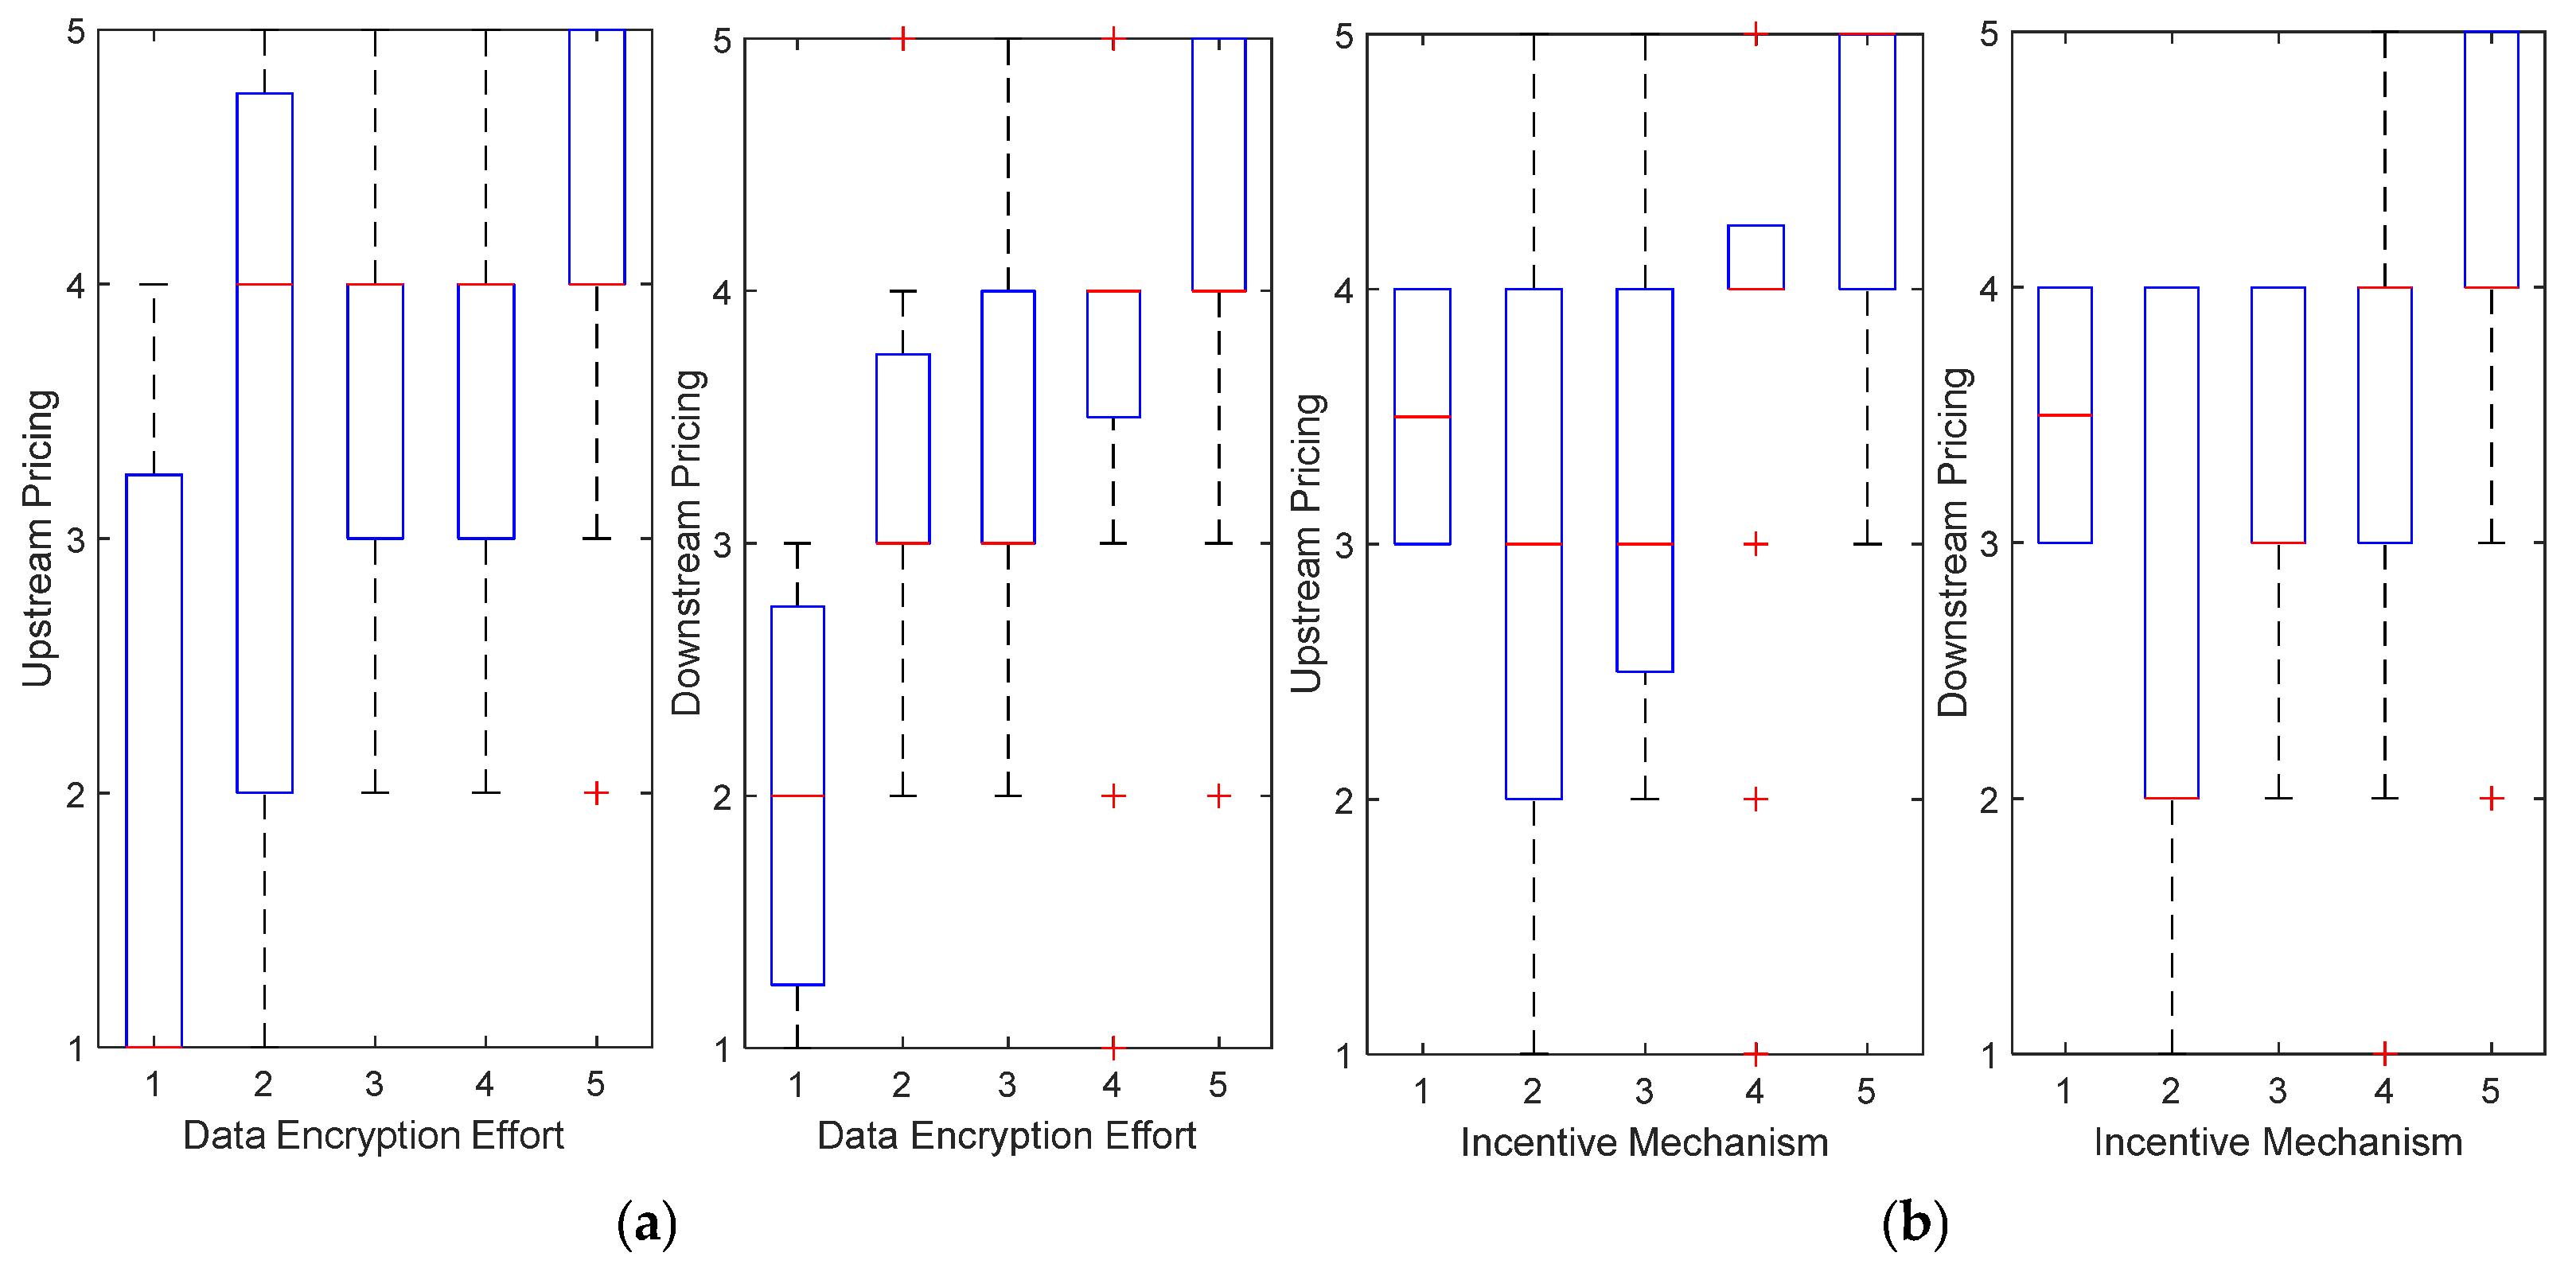
  • Data Encryption Protection Efforts (Figure 12a):
    The importance of data encryption protection efforts in upstream pricing increased significantly with higher scores.
    When the encryption effort score is 1, the median upstream pricing score is 1.
    At a score of 5, the median upstream pricing score rises to 4.
    This indicates that high levels of encryption protection are crucial for increasing upstream pricing.
    For downstream pricing, the scoring trends for encryption efforts were similar but slightly lower overall.
    This reflects the respondents’ perception that encryption protection has a less pronounced role in the downstream market when compared with upstream.
  • Incentive Mechanism Coefficient (Figure 12b):
    The influence of the incentive mechanism coefficient on pricing also increases steadily with higher scores.
    As the incentive score increases from 1 to 5, the median upstream pricing score rises from 3.5 to 5.
    For downstream pricing, the median score increases from 3.5 to nearly 4.
    This suggests that while the incentive mechanism positively affects both upstream and downstream pricing, its impact is more significant for upstream pricing.
Summary:
Overall, data encryption protection efforts were perceived to have greater importance for upstream pricing, while incentives play a relatively smaller but still significant role in downstream pricing. These findings underscore the differential impacts of these factors on market positioning, highlighting their strategic importance in pricing decisions for upstream and downstream market segments.

7. Conclusions

This study reached the following conclusions:
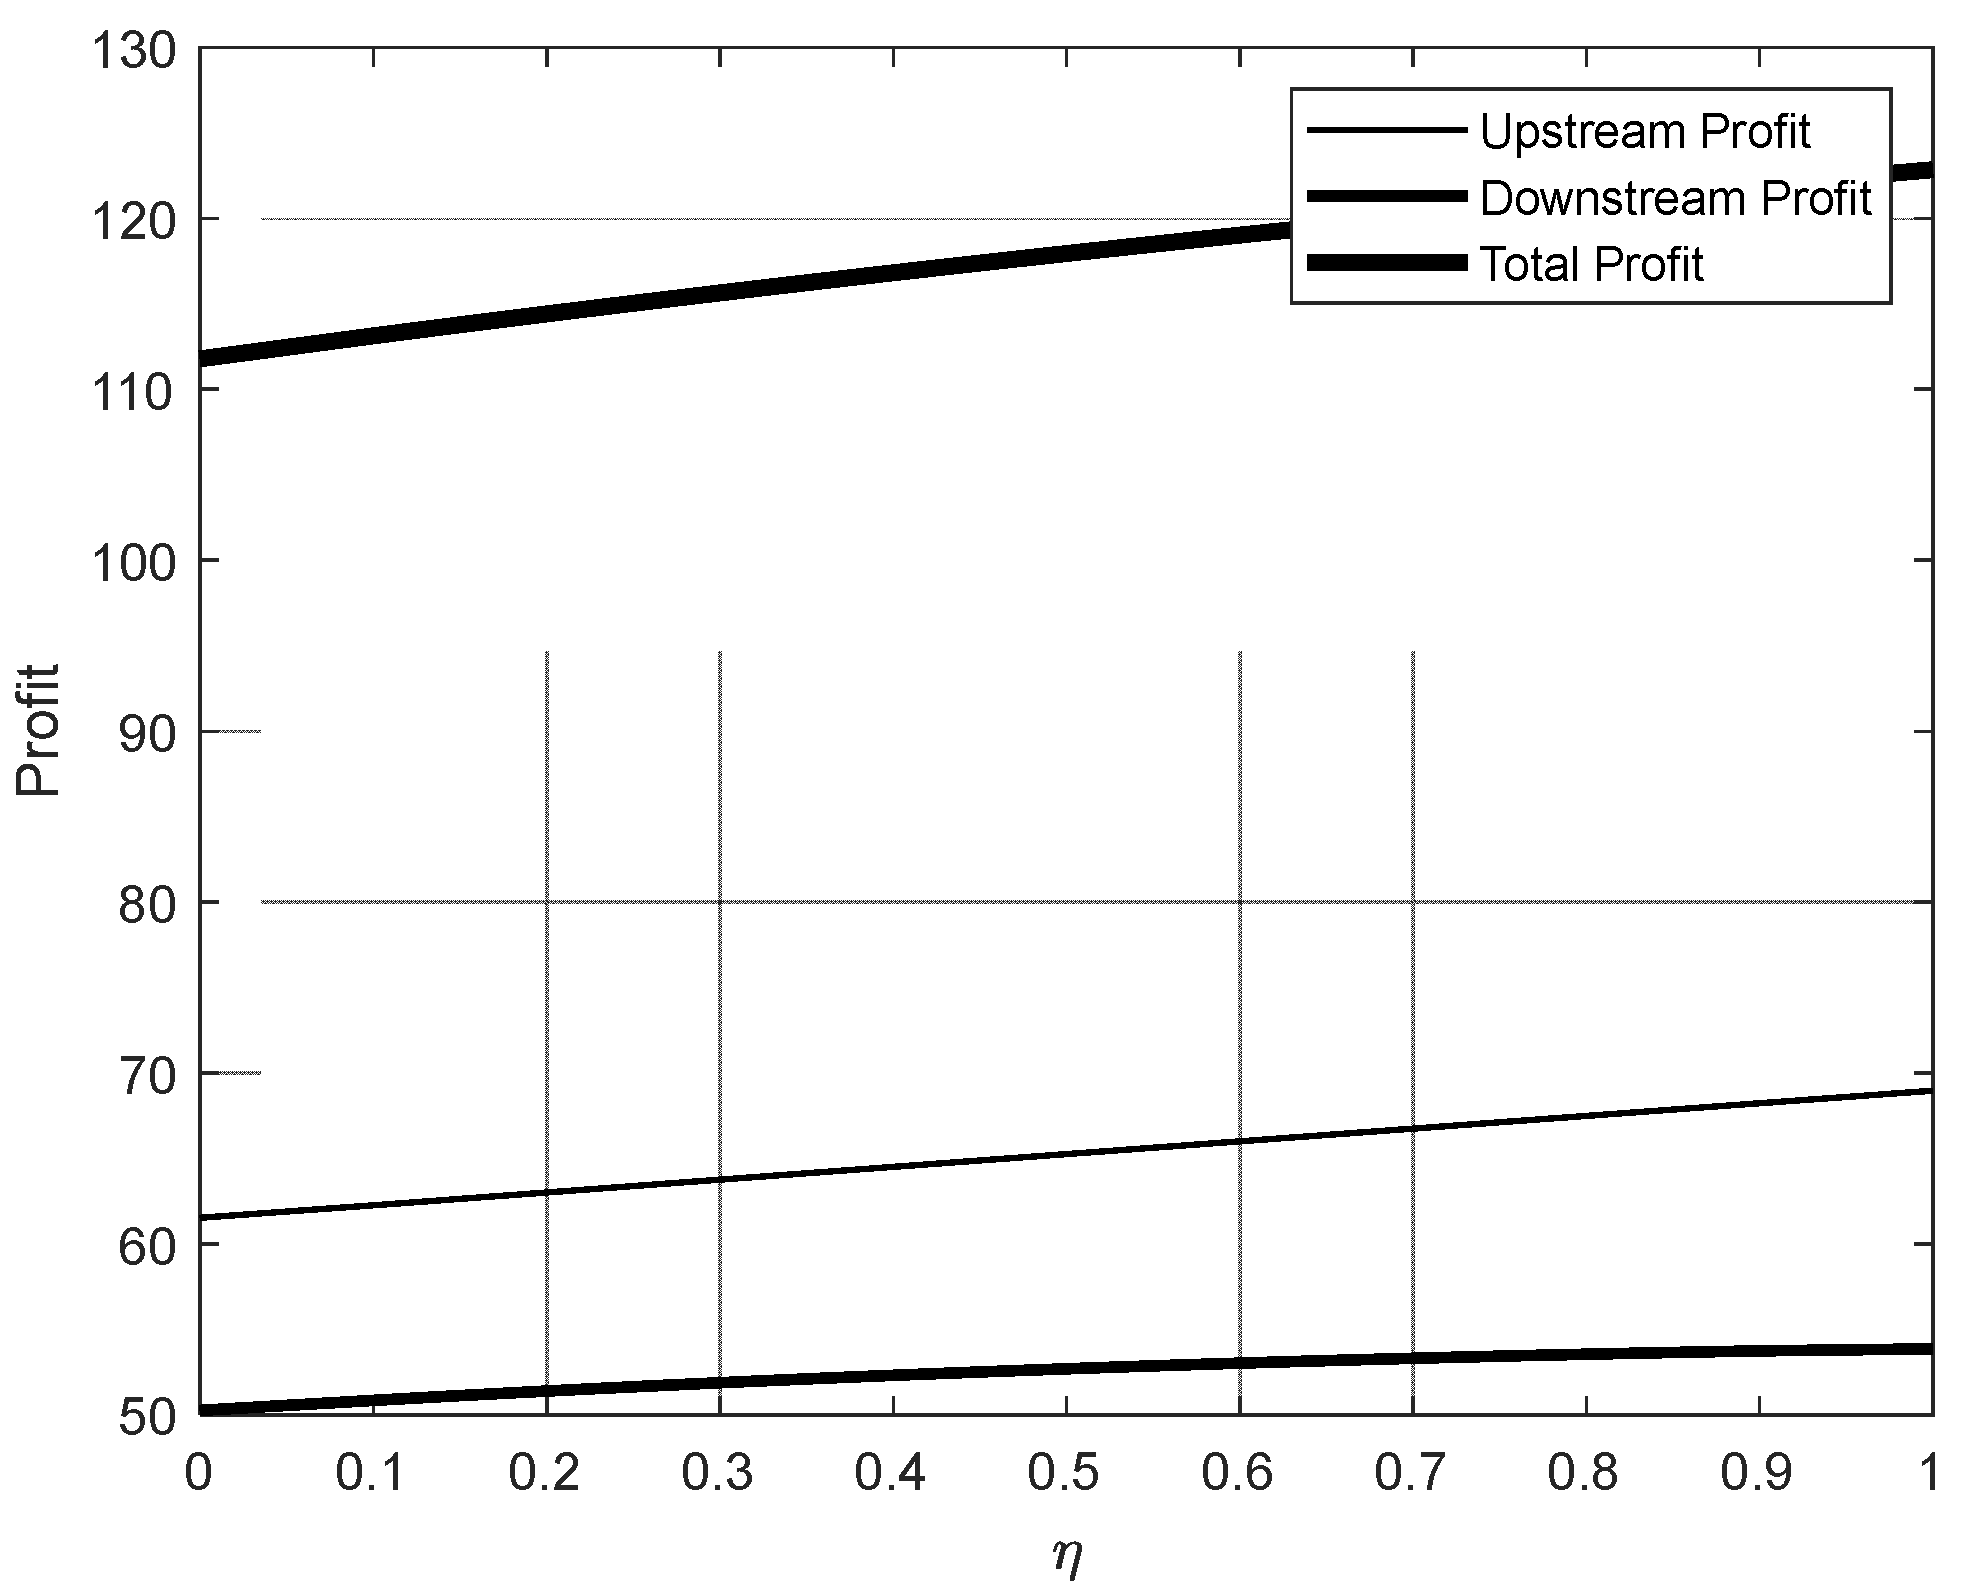
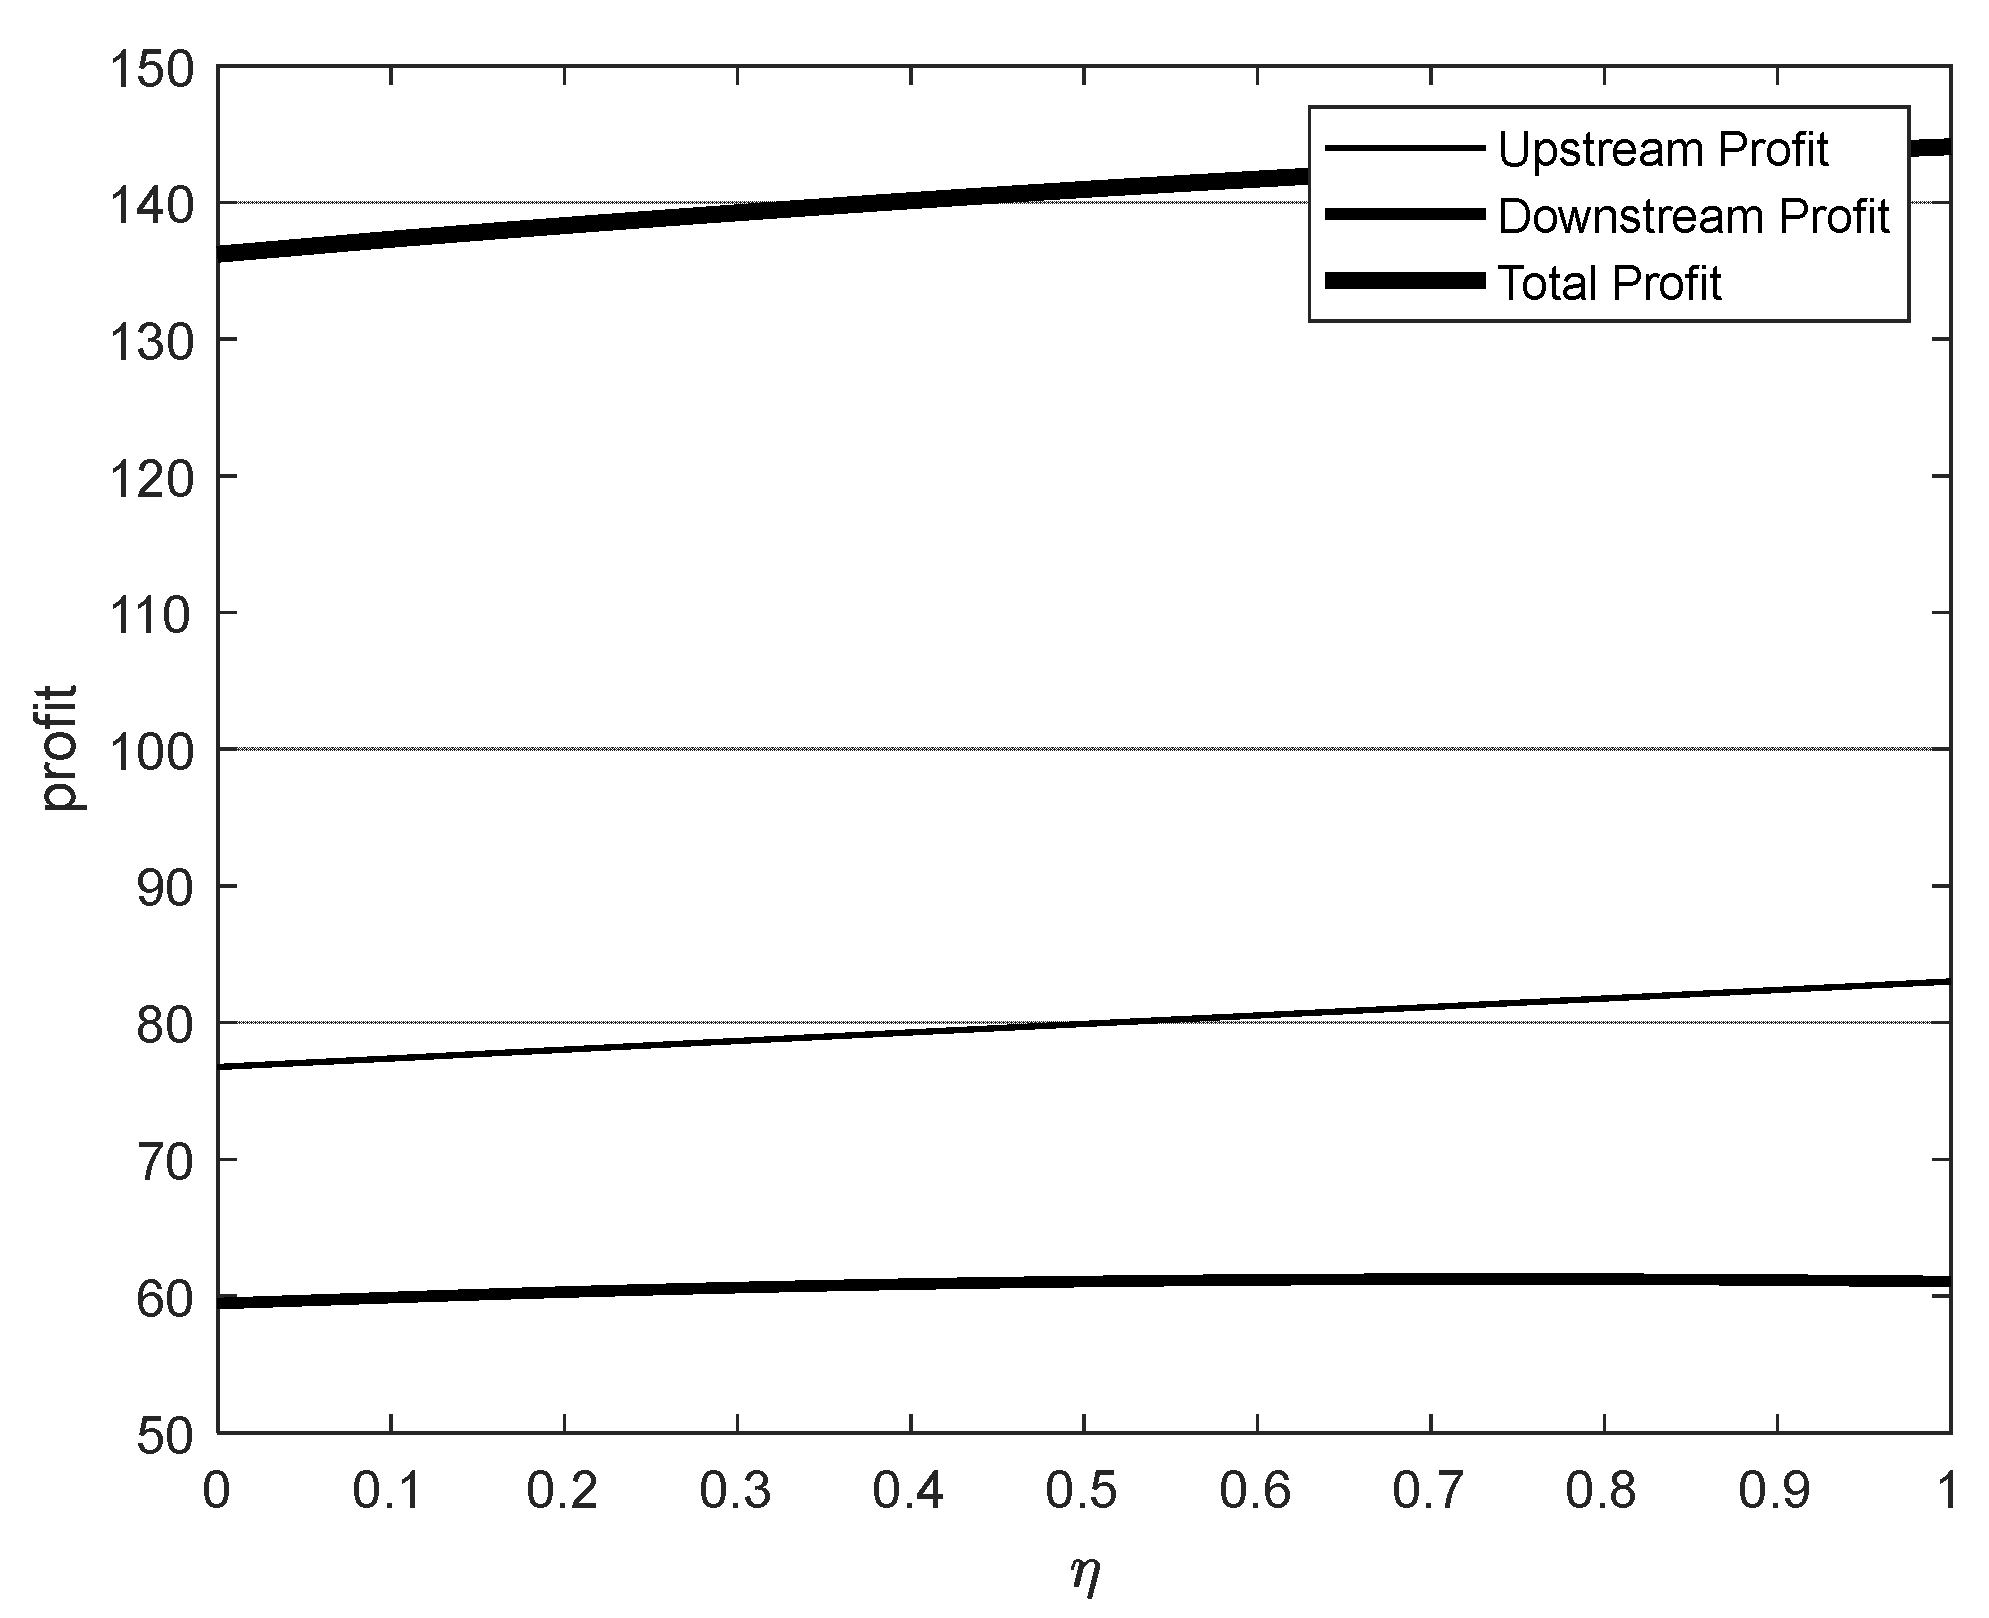
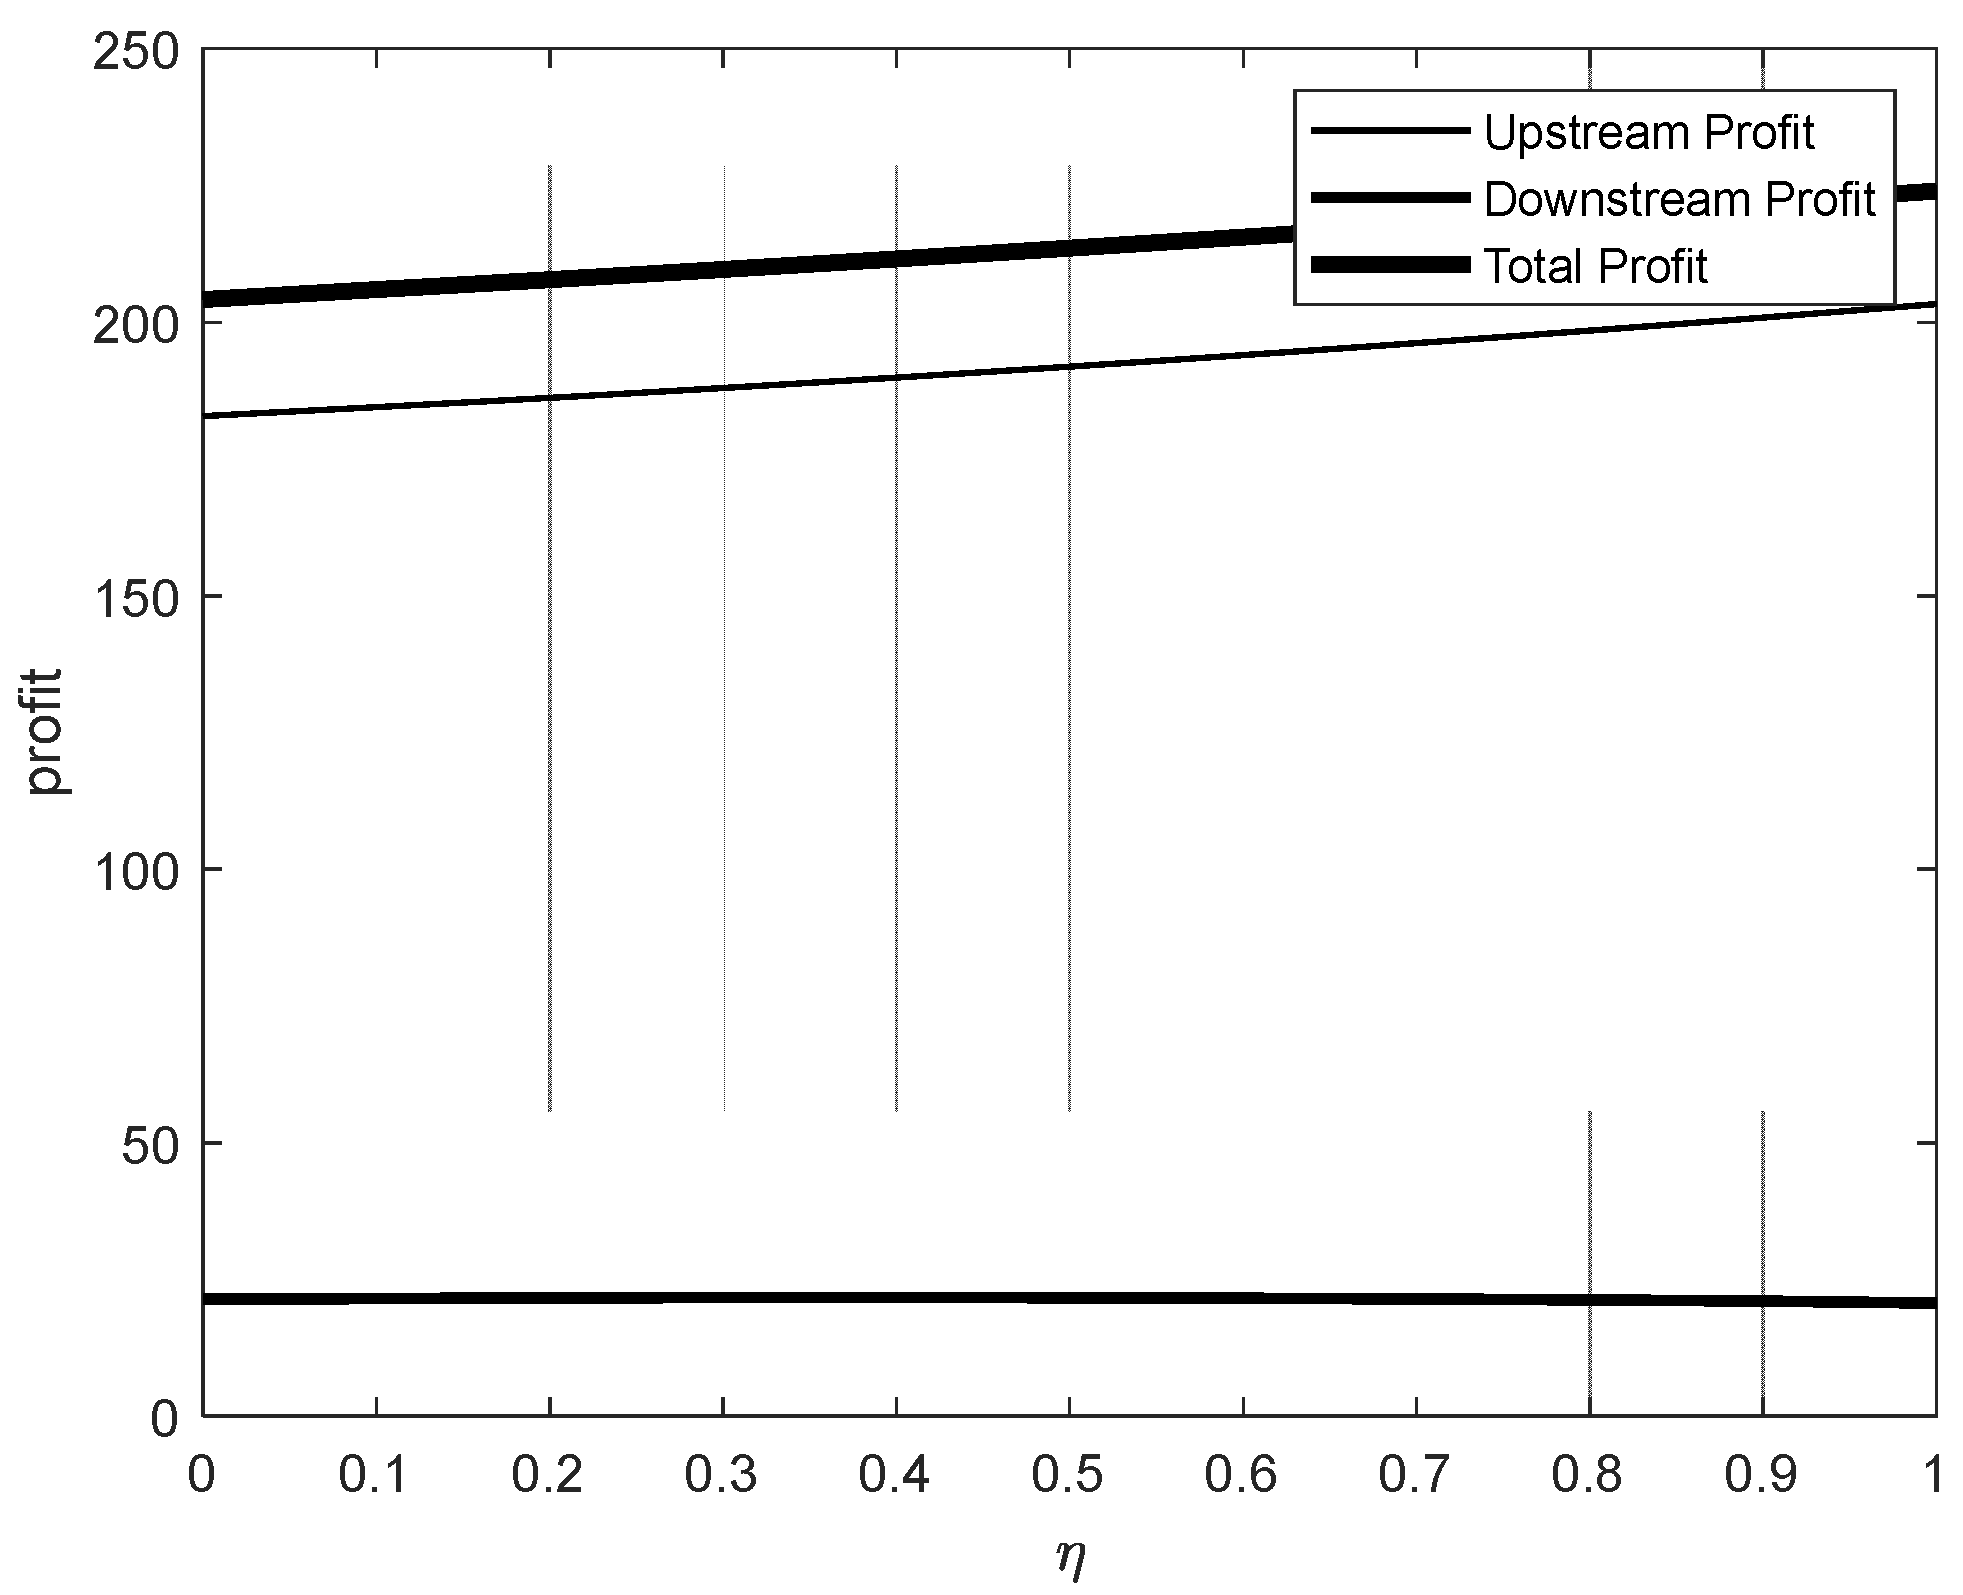
  • Impact of Incentive Mechanisms on Pricing Strategies:
    The introduction of incentive mechanisms significantly influences the pricing strategies of upstream and downstream industries. While incentives applied to both upstream and downstream industries enhance overall profitability, the effects differ based on their position in the industrial chain:
    Incentives targeting the downstream industry promote steady and sustainable growth in overall market profits.
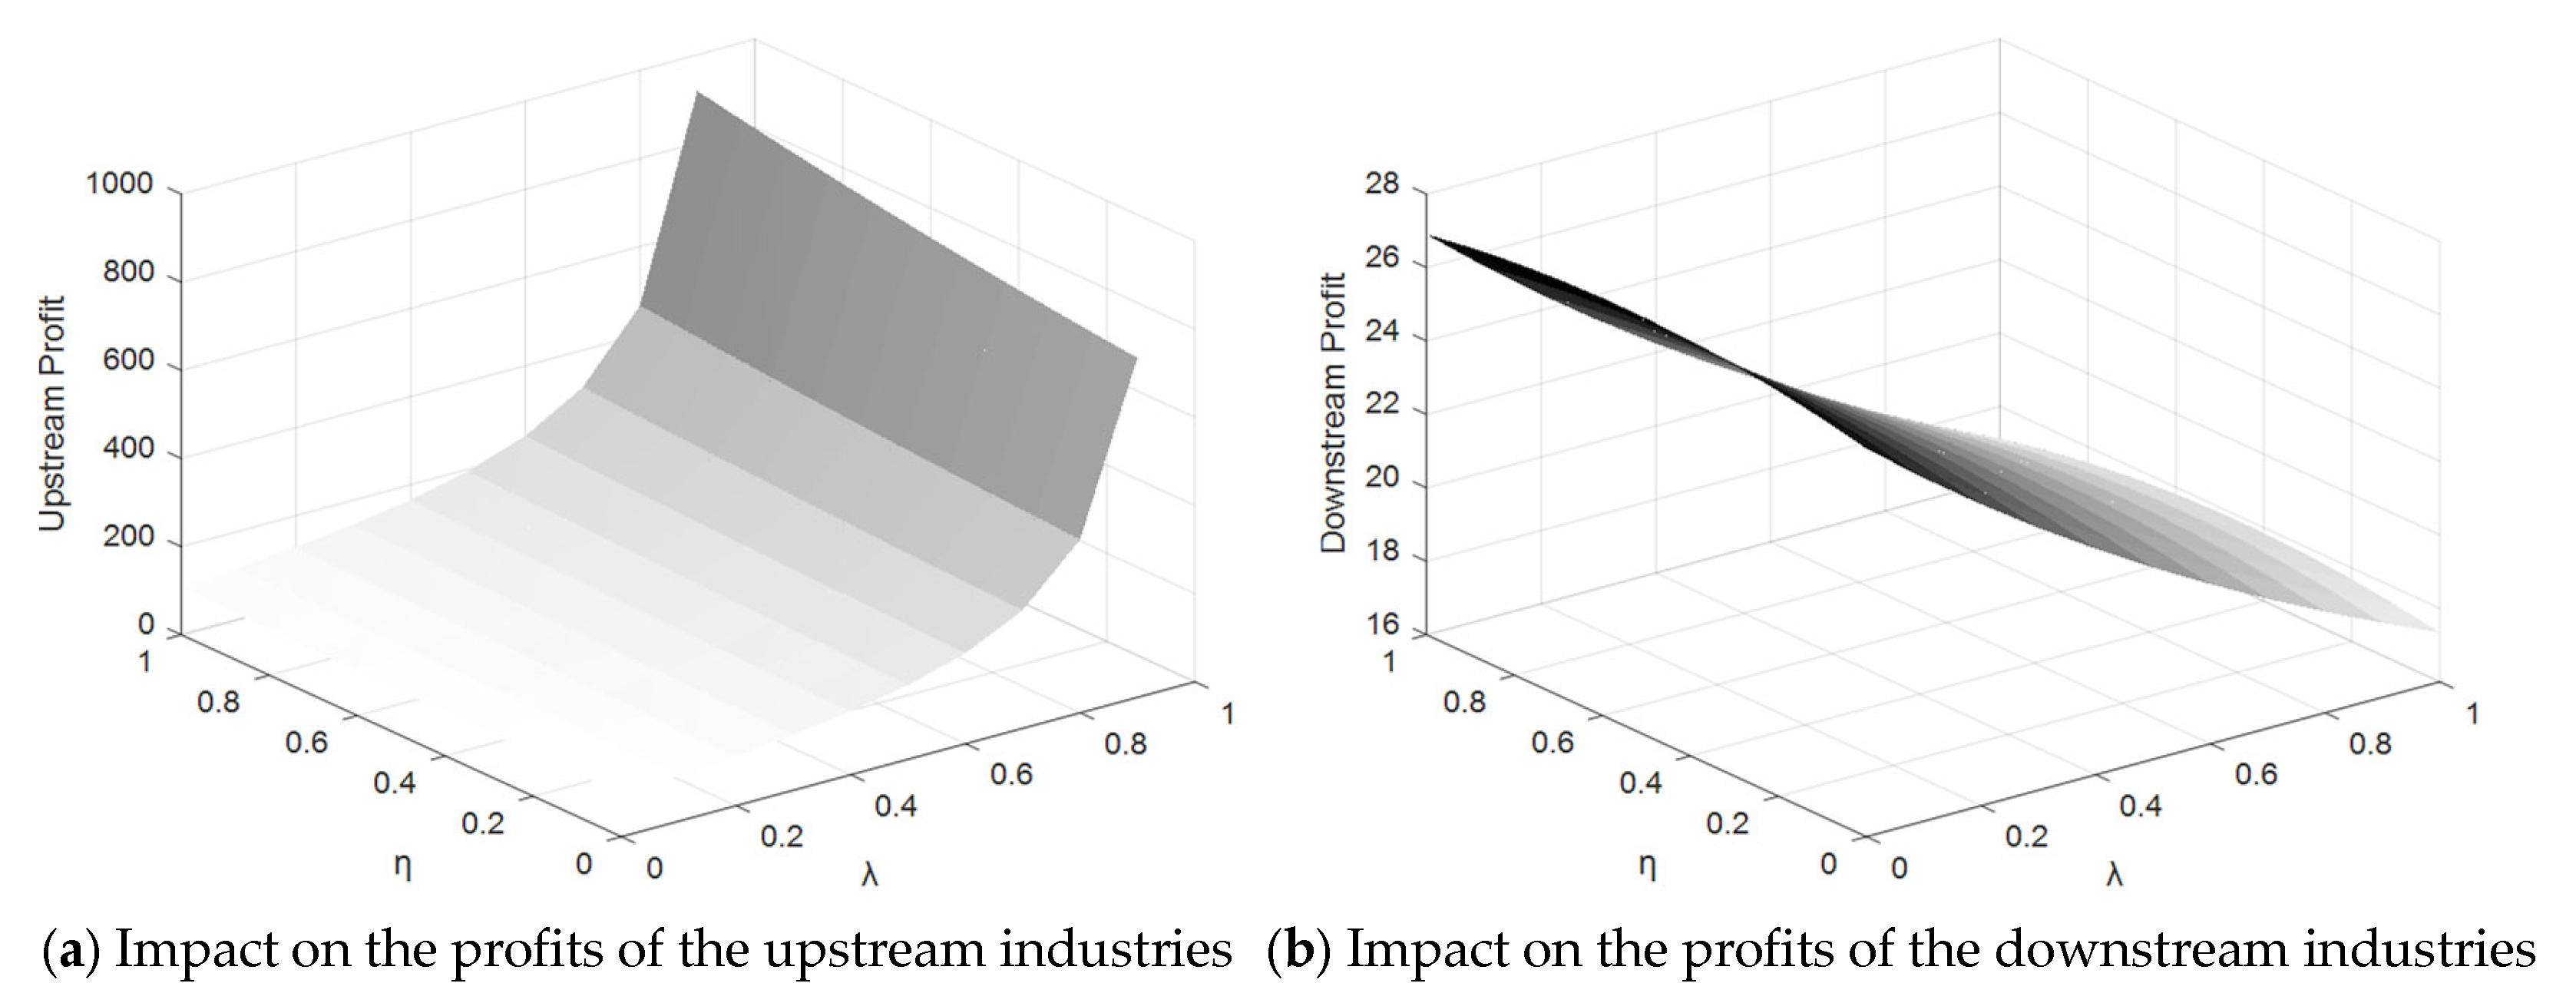
    Incentives directed at the upstream industry lead to nonlinear amplification of upstream profits but constrain downstream profitability, creating an imbalance in the profit distribution.
  • Pricing Behavior Under Different Incentive Scenarios:
    When incentives are applied exclusively to the downstream industry, both upstream and downstream enterprises tend to maximize their profits through increased pricing.
    In contrast, when only the upstream industry is incentivized, upstream enterprises prefer to raise their prices to capitalize on their strengthened market position. Meanwhile, downstream enterprises often maintain stable pricing to retain their market share and competitiveness, mitigating the impacts of upstream price increases and fluctuations in market demand.
  • Effect of Data Encryption Protection:
    Strengthened data encryption protection significantly enhances the value and security of upstream enterprises’ data, granting them greater market dominance and increased pricing power. However, this creates added capital pressures for downstream enterprises due to the higher costs associated with encryption protection. As a result, downstream enterprises face limited flexibility in adjusting their pricing strategies, further accentuating the disparity in market dynamics between the two segments.

Author Contributions

W.Z. designed the ideas, framework, and approach, and edited the draft of the manuscript. H.Y. edited the draft of the manuscript. M.C.W. contributed to the modification of the manuscript. All authors have read and agreed to the published version of the manuscript.

Funding

This research was supported by the National Social Science Foundation (No. 22BGL007), from the National Office for Philosophy and Social Sciences of China.

Institutional Review Board Statement

The study has been confirmed to not involve personal privacy and other issues, such as personal ethics, by the ethics committee of the School of Internet Economics and Business of Fujian University of Technology.

Informed Consent Statement

All subjects gave their informed consent for inclusion before they participated in the study.

Data Availability Statement

The original contributions presented in the study are included in the article, and further inquiries can be directed to the corresponding author.

Acknowledgments

The authors would like to thank the reviewers and editors for improving this manuscript.

Conflicts of Interest

The authors declare no conflicts of interest.

References

  1. Xu, X.; Zhao, M.; Li, T.; Li, S. Data Factor and Enterprise Innovation: The perspective of R & D competition. Econ. Res. 2023, 58, 39–56. [Google Scholar]
  2. Pei, J. A Survey on Data Pricing: From Economics to Data Science. IEEE Trans. Knowl. Data Eng. 2022, 34, 4586–4608. [Google Scholar]
  3. Shen, Y.; Guo, B.; Shen, Y.; Duan, X.; Dong, X.; Zhang, H. A Pricing Model for Big Personal Data. Tsinghua Sci. Technol. 2016, 21, 482–490. [Google Scholar]
  4. Hao, J.; Deng, Z.Y.; Li, J.P. The Evolution of Sata Pricing: From Economics to Computational Intelligence. Heliyon 2023, 9, e20274. [Google Scholar] [PubMed]
  5. Zhang, M.; Lu, X.; Wu, Y. Data Factor Economics: Characteristics, Right Confirmation, Pricing and Transaction. Economist 2024, 35–44. [Google Scholar]
  6. Zhang, M.X.; Beltrán, F.; Liu, J.M. A Survey of Data Pricing for Data Marketplaces. IEEE Trans. Big Data 2023, 9, 1038–1056. [Google Scholar]
  7. Liang, J.; Yuan, C.H. Data Price Determinants Based on a Hedonic Pricing Model. Big Data Res. 2021, 25, 100249. [Google Scholar]
  8. Surbakti, F.P.S.; Wang, W.; Indulska, M.; Sadiq, S. Factors Influencing Effective Use of Big Data: A research Framework. Inf. Manag. 2020, 57, 103146. [Google Scholar]
  9. Wang, W.; Zhang, M.J.; Wang, J. Research on Risk Factor Identification in Business Process of Big Data Transaction. Inf. Stud. Theory Appl. 2019, 42, 80–85. [Google Scholar]
  10. Zhao, X.Y.; Ji, X.F.; Guo, Y.Z. Research on the Model Construction of the Influencing Factors of Data Exchange Platforms under the Innovation Incentive Target--Taking Guiyang Data Exchange Platform as an Example. J. Mod. Inf. 2023, 43, 101–112+124. [Google Scholar]
  11. Thenmozhi, R.; Shridevi, S.; Mohanty, S.N.; García-Díaz, V.; Gupta, D.; Tiwari, P.; Shorfuzzaman, M. Attribute-Based Adaptive Homomorphic Encryption for Big Data Security. Big Data 2024, 12, 343–356. [Google Scholar] [PubMed]
  12. Jin, B.; Jiang, D.S.; Xiong, J.B.; Chen, L.; Li, Q. D2D Data Privacy Protection Mechanism Based on Reliability and Homomorphic Encryption. IEEE Access 2018, 6, 51140–51150. [Google Scholar]
  13. Qiu, H.; Qiu, M.K.; Liu, M.Q.; Ming, Z. Lightweight Selective Encryption for Social Data Protection Based on EBCOT Coding. IEEE Trans. Comput. Soc. Syst. 2020, 7, 205–214. [Google Scholar]
  14. Xu, Z.; Cao, S.X. Multi-Source Data Privacy Protection Method Based on Homomorphic Encryption and Blockchain. Cmes-Comput. Model. Eng. Sci. 2023, 136, 861–881. [Google Scholar]
  15. Hu, Q.; Huang, C.; Zhang, G.; Cai, L.; Jiang, T. Towards Accountable and Privacy-preserving Blockchain-based Access Control for Data Sharing. J. Inf. Secur. Appl. 2024, 85, 103866. [Google Scholar]
  16. Jiang, Y.N.; Zhong, Y.; Ge, X.H. Smart Contract-Based Data Commodity Transactions for Industrial Internet of Things. IEEE Access 2019, 7, 180856–180866. [Google Scholar]
  17. Ping, H. Network Information Security Data Protection Based on Data Encryption Technology. Wirel. Pers. Commun. 2022, 126, 2719–2729. [Google Scholar]
  18. Liu, Y.; Yang, C.S.; Liu, Q.; Xu, M.; Zhang, C.; Cheng, L.; Wang, W. PDPHE: Personal Data Protection for Trans-Border Transmission Based on Homomorphic Encryption. Electronics 2024, 13, 1959. [Google Scholar] [CrossRef]
  19. Zhang, Y.J. Pricing Model of Data Elements Based on Market Mechanism and Transaction Scenario. Soc. Sci. 2023, 72–76+84. [Google Scholar]
  20. Tian, Y.J.; Ding, Y.R.; Fu, S.J.; Liu, D. Data Boundary and Data Pricing Based on the Shapley Value. IEEE Access 2022, 10, 14288–14300. [Google Scholar]
  21. Luo, S.Z.; Xing, L.N. Neutrosophic Game Pricing Methods with Risk Aversion for Pricing of Data Products. Expert Syst. 2021, 38, e12697. [Google Scholar]
  22. Zhao, B.; Zhang, J.Q.; Cao, W.; Li, B.; Zhang, W.; Gao, Y. A dynamic Evaluation Model of Data Price Based on Game Theory. Peer-to-Peer Netw. Appl. 2023, 16, 2073–2088. [Google Scholar]
  23. Goodhue, D.L.; Quillard, J.A.; Rockart, J.F. Managing the Data Resource: A Contingency Perspective. MIS Q. 1988, 12, 373–392. [Google Scholar]
  24. Deng, L.L.; Li, C.W. Research on Similarity Calculation Method for Associated Data Resource Set. Inf. Stud. Theory Appl. 2012, 35, 112–116. [Google Scholar]
  25. Wang, Y.; Cai, S.Q. Towards a Big Data Model for Social Media Platform. J. Manag. 2018, 15, 1064–1071. [Google Scholar]
  26. Xu, X.C.; Zhang, Z.W.; Hu, Y.R. Research on Deriving Measures of Data Assets in National Accounts. J. Manag. World 2022, 38, 16–30. [Google Scholar]
  27. Li, J.P. Research on Reconding Data Asset in National Accounts. Stat. Res. 2020, 37, 3–14. [Google Scholar]
  28. Duan, Z.X.; Wu, Y.Q. Property Right Structure and System Construction of Big Data Resources. E-Government 2017, 23–30. [Google Scholar]
  29. Zhou, P. The Boundary of Practice and Deconstruction for Right and Interest on Data Transaction. Electron. Intellect. Prop. Rights 2020, 67–77. [Google Scholar]
  30. Guo, Q.L.; Wang, B.H.; Tian, N.F.; Sun, H.; Wen, B. Data Transactions in Energy Internet: Architecture and Key Technologies. J. Electr. Technol. 2020, 35, 2285–2295. [Google Scholar]
  31. Zhu, G.L. China’s new Governance Concept in the Process of Comprehensively Deepening Reform. Soc. Sci. China 2017, 27–39. [Google Scholar]
  32. Fang, J.; Xi, J.P. Thought on Socialism with Chinese Characteristics for a New Era. Comp. Econ. Soc. Syst. 2019, 1–8. [Google Scholar]
  33. Hu, Y.L.; Gao, C.Y.; Zhang, S.C. Data Resources Sharing Relationship and Modeling Analysis in Big Data Alliance. Inf. Stud. Theory Appl. 2018, 41, 28–33. [Google Scholar]
  34. Mu, Y.; Wang, W.; Zhao, Y. Research on the Status Quo, Problems and Countermeasures of Asset Management of Data Resources in China. E-Government 2017, 66–74. [Google Scholar]
  35. Yang, D. The Marketization of Data Elements Reinforces the Government Governance Model. Peoples Forum 2020, 12, 60–62. [Google Scholar]
  36. Li, T.T.; Li, D.Q.; Wang, M.S. Blockchain-based Fair and Decentralized Data Trading Model. Comput. J. 2022, 65, 2133–2145. [Google Scholar] [CrossRef]
  37. Koutris, P.; Upadhyaya, P.; Balazinska, M.; Howe, B.; Suciu, D. Query-based Data Oricing. J. ACM 2015, 62, 43. [Google Scholar] [CrossRef]
  38. Gao, F.P. Data Production Theory--Basic Theory of Data Resource Rights Allocation. SJTU Law Rev. 2019, 5–19. [Google Scholar]
  39. Li, C.X.; Wen, T.X. Research on the Profit Models of Big Data Transaction in China. J. Intell. 2020, 39, 180–186. [Google Scholar]
  40. Chen, G.Q.; Ren, M.; Wei, Q.; Guo, X.; Yi, C. Data-Intelligence Empowerment: A New Leap of Information Systems Research. J. Manag. World 2022, 38, 180–196. [Google Scholar]
  41. Culliton, B.J. Authorship, data ownership examined. Science 1988, 242, 658–659. [Google Scholar] [CrossRef] [PubMed]
  42. Singh, P.J.; Vipra, J. Economic Rights Over Data: A Framework for Community Data Ownership. Development 2019, 62, 53–57. [Google Scholar]
  43. McGuire, A.L.; Roberts, J.; Aas, S.; Evans, B.J. Who Owns the Data in a Medical Information Commons? J. Law Med. Ethics 2019, 47, 62–69. [Google Scholar] [PubMed]
  44. Tang, Q. Study on the Property Right Issues in Big Data Trade. Libr. Inf. 2016, 4, 38–45. [Google Scholar]
  45. Wen, Y.H. Paradigm Shift, Concept Selection and the Owner of Data Rights Establishment. J. Northeast. Norm. Univ. (Philos. Soc. Sci.) 2019, 69–78. [Google Scholar]
  46. Hong, Y.X. Realizing the Reform of Market-oriented Allocation of Factors. Economist 2020, 2, 5–14. [Google Scholar]
  47. Kauremaa, J.; Tanskanen, K. Designing Interorganizational Information Systems for Supply Chain Integration: A Framework. Int. J. Logist. Manag. 2016, 27, 71–94. [Google Scholar]
  48. Chen, J.; Liu, Y. Operation Management Innovation Enabled by Digitalization and Intellectualization: From Supply Chain to Supply Chain Ecosystem. J. Manag. World 2021, 37, 227–240. [Google Scholar]
  49. Jiang, J. Cultivate and Develop the Difficult Problems and Legal Response of the Data Element Market. Libr. Inf. 2020, 3, 22–24. [Google Scholar]
  50. Yan, X.; Li, X. A Study on the Governance Concept of Socialism with Chinese Characteristics. Res. Social. Chin. Charact. 2014, 5, 27–31. [Google Scholar]
  51. Kang, X. The theoretical characteristics of Xi Jinpings modern national governance view. Stud. Marx. 2016, 10, 59–65. [Google Scholar]
  52. Hong, I.B. A new framework for interorganizational systems based on the linkage of participants roles. Inf. Manag. 2002, 39, 261–270. [Google Scholar]
  53. Immonen, A.; Ovaska, E.; Paaso, T. Towards certified open data in digital service ecosystems. Softw. Qual. J. 2018, 26, 1257–1297. [Google Scholar]
  54. Majchrzak, A.; Markus, M.L.; Wareham, J. Designing for Digital Transformation: Lessons for Information Systems Research from the Study of ICT and Societal Challenges. MIS Q. 2016, 40, 267–277. [Google Scholar]
  55. Guo, X.L.; Tang, T.T.; Su, Z.H. Pricing Strategies Considering Logistics Service Efforts on the Online Freight Platform. Chin. J. Manag. Sci. 2022. [Google Scholar] [CrossRef]
  56. Liu, Z.; Huang, N.; Hu, B.; Zhao, Y.; Guo, H. Research on Cold Chain Pricing Model of Fresh Products Based on Freshness and Fairness Concern Behavior. Front. Sci. Technol. Eng. Manag. 2024. Available online: https://kns.cnki.net/kcms/detail/34.1013.N.20240717.1636.002.html (accessed on 1 March 2025).
  57. Gordon, L.A.; Loeb, M.P. The Economics of Information Security Investment. ACM Trans. Inf. Syst. Secur. 2002, 5, 438–457. [Google Scholar]
  58. Biswas, S.; Junk, K.; Palamidessi, C. An Incentive Mechanism for Trading Personal Data in Data Markets. In Theoretical Aspects of Computing—ICTAC 2021; Springer International Publishing: Cham, Switzerland, 2021. [Google Scholar]
Figure 1. Relationship diagram.
Mathematics 13 01002 g001
Figure 2. B2B triangle mapping framework for data operation and ownership.
Mathematics 13 01002 g002
Figure 3. B2B data revenue operation mode for industrial chain collaboration.
Mathematics 13 01002 g003
Figure 4. Flow chart of data transactions.
Mathematics 13 01002 g004
Figure 5. Impact of data encryption protection efforts on profit without incentive mechanism.
Mathematics 13 01002 g005
Figure 6. The impact of data encryption protection efforts on profits under downstream industry incentives.
Mathematics 13 01002 g006
Figure 7. The impact of data encryption protection efforts on profits under upstream industry incentives.
Mathematics 13 01002 g007
Figure 8. The effect of the incentive mechanism coefficient in the upstream–downstream (incentive) market structure on profit.
Mathematics 13 01002 g008
Figure 9. The effect of the incentive mechanism coefficient in the upstream (incentive)–downstream market structure on profit.
Mathematics 13 01002 g009
Figure 10. Impacts of η and λ on profit in the upstream–downstream (incentive) mode.
Mathematics 13 01002 g010
Figure 11. Impacts of η and λ on profit in the upstream (incentive)–downstream mode.
Mathematics 13 01002 g011
Figure 12. Boxplot analysis. (a) Impact of data encryption protection efforts on upstream and downstream pricing; (b) Impact of the incentive mechanism coefficient on upstream and downstream pricing.
Mathematics 13 01002 g012
Table 1. Definitions for utilized notation.
SymbolMeaning
η Represents the level of effort in data encryption protection η , where η 0,1 . It quantifies the intensity of participants’ input in protection measures.
θ Denotes the degree of data discount θ , where θ 0,1 , which is used to measure the price loss of data during the transaction process.
c Represents the data acquisition cost, reflecting the expenses incurred by data providers for data collection, processing, and transmission.
d Indicates potential market demand, measuring the market’s purchase intention and the scale of demand for the data.
k Refers to the data encryption protection cost coefficient, describing how sensitive the encryption cost is to changes in the level of protection effort.
w The data provider decides the selling price.
p The data demanders decide the selling price.
s Quantifies the market’s sensitivity to data price fluctuations, indicating how demand responds to price changes.
γ Represents the scarcity of data, reflecting its availability and exclusivity in the market.
β Denotes the transaction proportion of sensitive data β , where β 0,1 . It quantifies the share of sensitive data in overall market transactions.
λ Represents the incentive mechanism coefficient λ , where λ 0,1 , to describe the degree of influence that the incentive mechanism has on the behavior of market participants.
Table 2. Values of parameters used in the numerical simulation.
Parameter η θ c d k s γ β λ
Numeric value0.30.331505730.30.3
Table 3. Descriptive statistical analysis.
SymbolMeanStandard ErrorModeMinimum ValueMaximum Value
η 3.8621.064415
θ 3.7021.096415
c 3.7661.072415
d 3.6061.128415
k 3.9261.029415
w 3.8091.148415
p 3.9571.126515
s 3.8091.029415
γ 3.6810.986415
β 3.7451.154415
λ 3.7981.223515
Table 4. Pearson’s correlation matrix.
η θ c d k w p s γ β λ
η 10.4740.4420.4710.3630.4370.4190.5140.4910.5270.396
θ 0.47410.4190.4970.3080.3690.4080.4090.3780.2950.376
c 0.4420.41910.5340.5540.5040.4320.4910.4830.5140.501
d 0.4710.4970.53410.4100.5600.4490.5150.5010.5350.426
k 0.3630.3080.5540.41010.4100.4240.4550.2280.3560.419
w 0.4370.3690.5040.5600.41010.5010.4470.3870.5020.456
p 0.4190.4080.4320.4490.4240.50110.5420.3380.5680.468
s 0.5140.4090.4910.5150.4550.4470.54210.5040.5430.490
γ 0.4910.3780.4830.5010.2280.3870.3380.50410.4440.620
β 0.5270.2950.5140.5350.3560.5020.5680.5430.44410.508
λ 0.3960.3760.5010.4260.4190.4560.4680.4900.6200.5081
Disclaimer/Publisher’s Note: The statements, opinions and data contained in all publications are solely those of the individual author(s) and contributor(s) and not of MDPI and/or the editor(s). MDPI and/or the editor(s) disclaim responsibility for any injury to people or property resulting from any ideas, methods, instructions or products referred to in the content.

