Article

The Waxing and Waning of Fear Influence the Control of Vector-Borne Diseases

Department of Biology, College of Science & Engineering, Texas Christian University, 2955 S. University Drive, Fort Worth, TX 76109, USA
Mathematics 2025, 13(5), 879; https://doi.org/10.3390/math13050879
Submission received: 9 January 2025 / Revised: 19 February 2025 / Accepted: 4 March 2025 / Published: 6 March 2025

Abstract

:
One major challenge in preventing infectious diseases comes from human control behaviors. In the context of vector-borne diseases (VBDs), I explored how the waxing and waning of a human psychological emotion—fear—can generate diverse control actions, which, in turn, influence disease dynamics. Fear may diminish over time after being triggered but can also be reinforced when new triggers emerge. By integrating fear dynamics into a generic Ross–MacDonald model tailored for the Zika virus, I found that an increase in initial fear can enhance control efforts, thereby reducing the number of infected individuals and deaths. Once initial fear becomes strong enough to deplete the mosquito population, any further increase in fear no longer impacts disease dynamics. When initial fear is at an intermediate level, the increase in disease caused by greater decay in fear can be counterbalanced by increasing the frequency of fear triggers. Interestingly, when the control period is short and initial fear is at an intermediate level, increasing the frequency of fear reinforcement can lead to a “hydra effect”, which increases disease transmission. These findings help explain variations in human control efforts and provide insights for developing more effective disease control strategies that account for the fear dynamics of local communities. This work also contributes to advancing the theory at the intersection of human behavior, disease ecology, and epidemiology.

1. Introduction

The feedback between human behaviors and infectious diseases can significantly influence the implementation of disease surveillance and community-based management policies [1,2]. For example, as disease prevalence increases, the public often enhances self-protection measures, such as increasing social distance and wearing masks [3,4]. These behaviors, in turn, shape disease prevalence in communities [5]. Since COVID-19, an increasing number of studies have begun exploring human behavioral responses to infectious diseases (e.g., awareness of infection leading to voluntary quarantine and vaccination decisions [6,7,8]). Theoretical work in this area has also increased dramatically. For example, the behavior–disease feedback was initially modeled implicitly (e.g., by introducing a saturation term in the transmission rate, or by assuming a positive correlation between disease level and control efforts; see [9,10]). Recently, more disease epidemiological models have started to explicitly incorporate human behaviors (e.g., behaviors as functions of current and past disease information [5,11]).
As a primary motivation for behaviors, certain studies have begun exploring how human emotions (e.g., fear of infection and death) can shape human behaviors and further affect disease epidemiology (see [12,13,14]). These studies typically focus on airborne diseases (e.g., how human behaviors shape infection by affecting contact rates among people [15,16]). With the increasing prevalence of vector-borne diseases (VBDs) in the past decade (e.g., the dramatic rise in cases of Zika virus, West Nile virus, and Lyme disease; see [17,18]), it has become urgent to develop theories that explore the interactions between human behaviors, disease levels, and human psychology specifically tailored to VBDs. Integrating psychology into behavioral epidemiology would significantly enhance our ability to explain diverse human behaviors toward infectious diseases. However, given the complexity of human psychology [19,20], there remains a substantial gap in understanding the mechanisms driving diverse human behaviors despite access to the same disease information.
One complexity of human psychology is that human emotions often go through waxing and waning stages. For example, human moods can fluctuate with temperature or light [21,22,23]. Fear can fade over time but can be rekindled when triggered [24,25]. This dynamic nature of human psychology is often overlooked in many behavioral epidemiological studies. Additionally, without accounting for psychological changes during control periods, the disease management strategies enacted (e.g., the public’s involuntary control efforts such as the use of insecticides or pesticides [26]) may fail to achieve their desired outcomes. For instance, control efforts may decrease if people gradually become less fearful of an infectious disease [27]. Meanwhile, many factors can trigger fear and potentially increase control efforts. For example, with the increasing popularity of social media, the public can easily access disease information from various platforms [16,28,29]. Exposure to disease information can trigger fear (e.g., news of death tolls from infectious diseases [30]). The time interval and frequency with which people perceive disease information contribute to the waxing and waning of fear. In general, control efforts are positively correlated with fear levels [12,31] but are also limited by other factors (e.g., the cost of enacting control actions; see [32,33]). Consequently, control actions typically begin once the number of infections reaches a certain level and only lasts for a limited period [34].
In this study, I explore how the waxing and waning dynamics of fear shape control efforts and, in turn, influence disease levels in VBD systems. Specifically, I incorporated the fear dynamics into a generic vector-borne disease model (i.e., a modified Ross–MacDonald model with control efforts) to investigate whether and how the decay and reinforcement of fear affect disease levels. This model is specifically tailored and parameterized for the Zika virus, transmitted by Aedes aegypti mosquitoes, and allows for the periodic release of disease information. Given that people’s control actions often occur on a discrete time scale (e.g., days or months, with effort depending on the threshold of their fear levels), I have developed a discrete version of the VBD model with discrete control efforts. I first explored the separate and joint effects of initial fear and its decay over one waxing and waning period. I then extended this study to multiple periods. I analytically solved the phases of disease dynamics under different levels of initial fear and a single fear decay, and I numerically simulated the dynamic changes in the susceptible, infected, and deceased populations, as well as the mosquito population, over a one-year timeframe.

2. Methods

Here, I assume that both the human and mosquito populations are well mixed in the system. Initially, the system consists of S H 0 susceptible humans and S M 0 susceptible mosquitoes. The Zika virus is then introduced into this system by infecting ten humans initially ( I H 0 = 10 ). At any given time, humans can be in one of three states: susceptible to infection ( S H ), infected ( I H ), or recovered ( R H ). A certain proportion of infected humans may develop severe symptoms and eventually die from the infection ( D H ). The total human population is described as follows:
NH = SH + IH + RH
I also consider the natural birth rate ( b H ) and death rate ( μ H ) for the human population. The mosquito population consists of two states: susceptible to infection but uninfected ( S M ) and infected ( I M ), which can transmit the virus to susceptible humans ( S H ). The infection rates from infected humans on susceptible mosquitoes and from infected mosquitoes on susceptible humans are denoted as β M and β H , respectively. The natural death rate of mosquitoes is μ M . The mosquito birth rate is limited by its carrying capacity, given by the following function:
f ( M ,   K ) = M ( 1 M K )
where K is the maximum carrying capacity of mosquitoes, and η is the laying egg rate, and M = S M + I M is the total mosquito population producing offspring.
During a disease outbreak, both human and mosquito dynamics influence human control actions on susceptible and infected mosquitoes through insecticide usage (control effort, C , as described in Equations (7) and (8)). For simplicity, without losing generality, I assume that fear is triggered by death toll information (which is proportional to infected humans), and the control effort ( C ( t ) ) is positively related to both the fear level and the number of deaths ( D H ). The fear dynamics following a trigger (at time t_start) follow an exponential decay curve:
f ( θ ,   τ ,   t ) = θ e τ t
where θ is the initial fear, τ is the decay rate of fear, and t is the time after disease information triggers fear (modified from the trend of memory kernels; 5). Here, I assume that people’s control actions begin immediately once fear is triggered [11], and that control actions are initiated when the death toll at that time exceeds a threshold ϵ . Given limited resources or other constraints on control actions (e.g., economic limitations, environmental concerns such as preventing pollution from insecticide use; see [10,35]), I assume that a single control action following a fear trigger can last a maximum of CD days. Multiple control actions may occur with multiple fear triggers. If new fear triggers occur within CD days, the control period will be shortened to the time interval between two consecutive fear triggers.
Given that control actions occur in discrete time, I propose a modified Ross–MacDonald equation [36,37] in discrete form to capture the dynamics among humans ( S H ,   I H , R H and D H ), mosquitoes ( S M   and   I M ), and control actions ( C ). The detailed model is as follows:
S H ( t + 1 ) = S H ( t ) + b H N H ( t ) β H I M ( t ) S H ( t ) μ H S H ( t )
I H ( t + 1 ) = I H ( t ) + β H I M ( t ) S H ( t ) r I H ( t ) μ H I H ( t ) δ I H ( t )
R H ( t + 1 ) = R H ( t ) + r I H ( t ) μ H R H ( t )
D H ( t + 1 ) = D H ( t ) + δ I H ( t )
S M ( t + 1 ) = S M ( t ) + f ( η M ( S M ( t ) + I M ( t ) ) ,   K ) β M I H ( t ) S M ( t ) μ M S M ( t ) C ( t ) S M ( t )
I M ( t + 1 ) = I M ( t ) + β M I H ( t ) S M ( t ) μ M I M ( t ) C ( t ) I M ( t )
C ( t ) = { f ( θ ,   τ ,   t ) D H ( t _ s t a r t )   if     D H ( t _ s t a r t ) > ϵ   or   0 < C o u n t ( t ) < CD 0                                                                                       otherwise
in which we also define the details of Count(t) as follows:
{ 0 i f   c o u n t ( t 1 ) = 0 ;   and   D H ( t ) ϵ 1 i f   c o u n t ( t 1 ) = 0 ;   D H ( t ) > ϵ ; D H ( t 1 ) ϵ c o u n t ( t 1 ) + 1 i f   c o u n t ( t 1 ) > 0
where Equations (3)–(6) describe the dynamics of the human population, Equations (7) and (8) describe mosquito dynamics, and Equations (9) and (10) represent the dynamics of control efforts on mosquitoes. The details of all the variables in the model are provided in Table 1, and the parameters and their values are listed in Table 2. The time t is measured in days. Below, I use one-year (365 days) time steps after the initial control for disease simulations, which are sufficient for the system to capture the dynamics of a full disease outbreak under the assigned parameters.
Here, I track the dynamics of control effort ( C ( t ) ) and the corresponding susceptible ( S H ( t ) ), infected ( I H ( t ) ) and death human ( D H ( t ) ). I also calculate the following indexes: total infected humans ( t I t H ), maximum infected humans ( max t   I t H ), total death cases ( t D t H ) and control efficacy ( D C H D C + H C t ), where D C H and D C + H represent the human death cases in the absence and presence of control actions (C) over the entire simulation.
Using this model, I first analytically solve for the equilibrium of human infection I H ( t ) when the mosquito population goes extinct and discuss the phase changes with respect to initial fear and the decay of fear. I then perform numerical analyses to simulate the disease transient dynamics (susceptible, infected, and death cases in humans) under the separate and combined effects of initial fear and the decay of fear when disease information is released only once during the disease outbreak. Armed with the analyses under a single control period, I then simulate and compare disease dynamics under three frequencies of fear seasonality, both with and without decay of fear.

3. Results

3.1. Analytical Solutions

When exploring the equilibrium without the mosquito population, I set up S M = I M = 0 and solve the I H from Equation (4) as follows:
I H ( t ) = I H ( 0 ) ( 1 r μ H δ ) t
Which shows that infection dynamics when mosquitoes go to extinction do not depend on control effort and human fear: i.e., the equilibrium points can be achieved when there is no disease in the system ( I H ( 0 ) = 0 ; not stable), or the sum of the recovery rate r , human natural morality μ H , and composite rate δ equals 1 ( r + μ H + δ = 1; stable state). Because β H I M ( t ) S H ( t ) 0 , the infection would be larger when the mosquito population is >0 compared to the case when the mosquito population = 0 (Equation (11)). Therefore, the lowest infection occurs when the mosquito population is near 0. If we assume that mosquito abundance > 0 in the absence of control, factors that can quickly drive mosquitoes to extinction would lead to the lowest overall infection in humans.
By summing Equations (7) and (8), I obtain the dynamics of the mosquito population:
S M ( t ) + I M ( t ) = ( S M ( 0 ) + I M ( 0 ) ) ( 1 μ M C ( t ) ) t
It shows that control effort is the only factor that can potentially lead mosquitoes to extinction and generate the lowest disease level in the system. Since the term ( 1 μ M C ( t ) ) t could be any sign, depending on the dynamics of the control effort C ( t ) , the mosquito population could fluctuate over time (see the purple and red lines in Figure 1F).
Under the one control period, the lowest disease would be achieved when control effort C ( t ) is high enough to drive S M ( t ) + I M ( t ) = 0 , which could either come from large f ( θ ,   τ ,   t ) , or high-death cases ( D H ( t ) ). Therefore, if fear of death is very high, the control effort would be high as well, which can potentially lead to the phase when mosquitoes go to extinction; if the disease causes very high deaths that boost the control effort, the mosquito population can also shrink to 0 and disease suddenly drops to the phase in Equation (11). The latter scenario with high death cases D H ( t ) does not occur based on the parameters of the Zika virus (see Table 2); so, only manipulating fear levels can drive mosquitoes to extinction.

3.2. Numerical Simulations

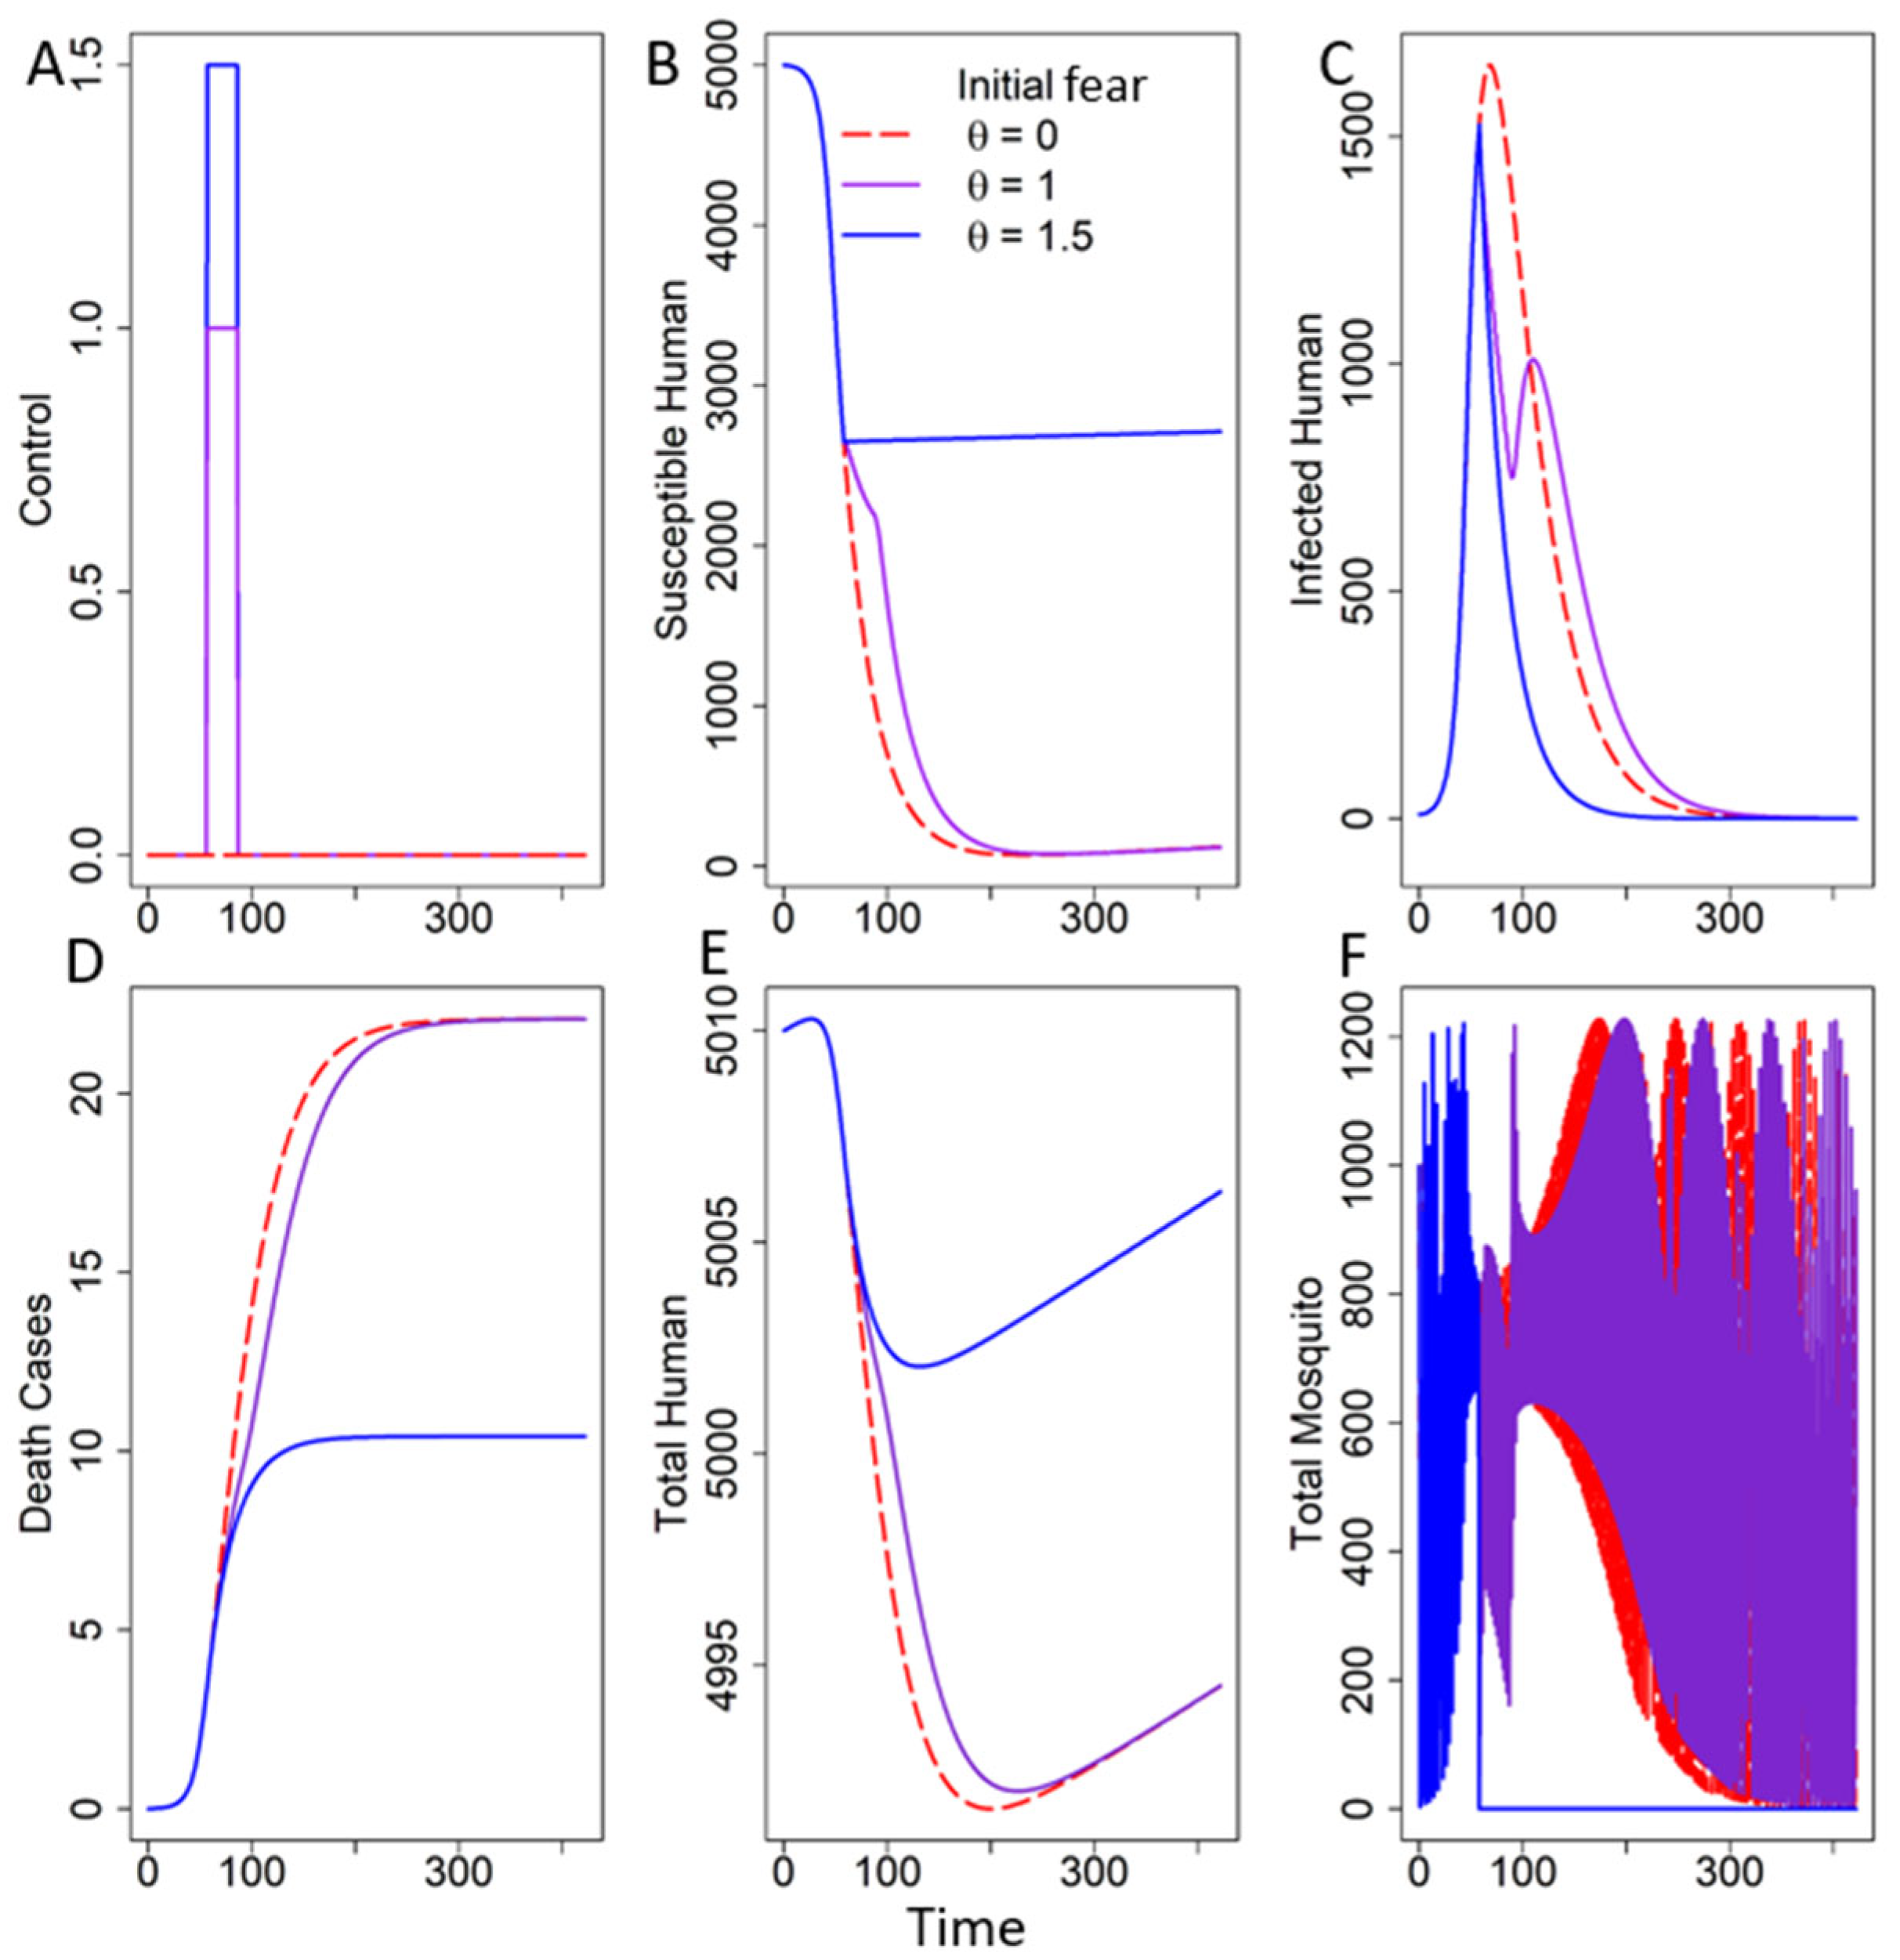
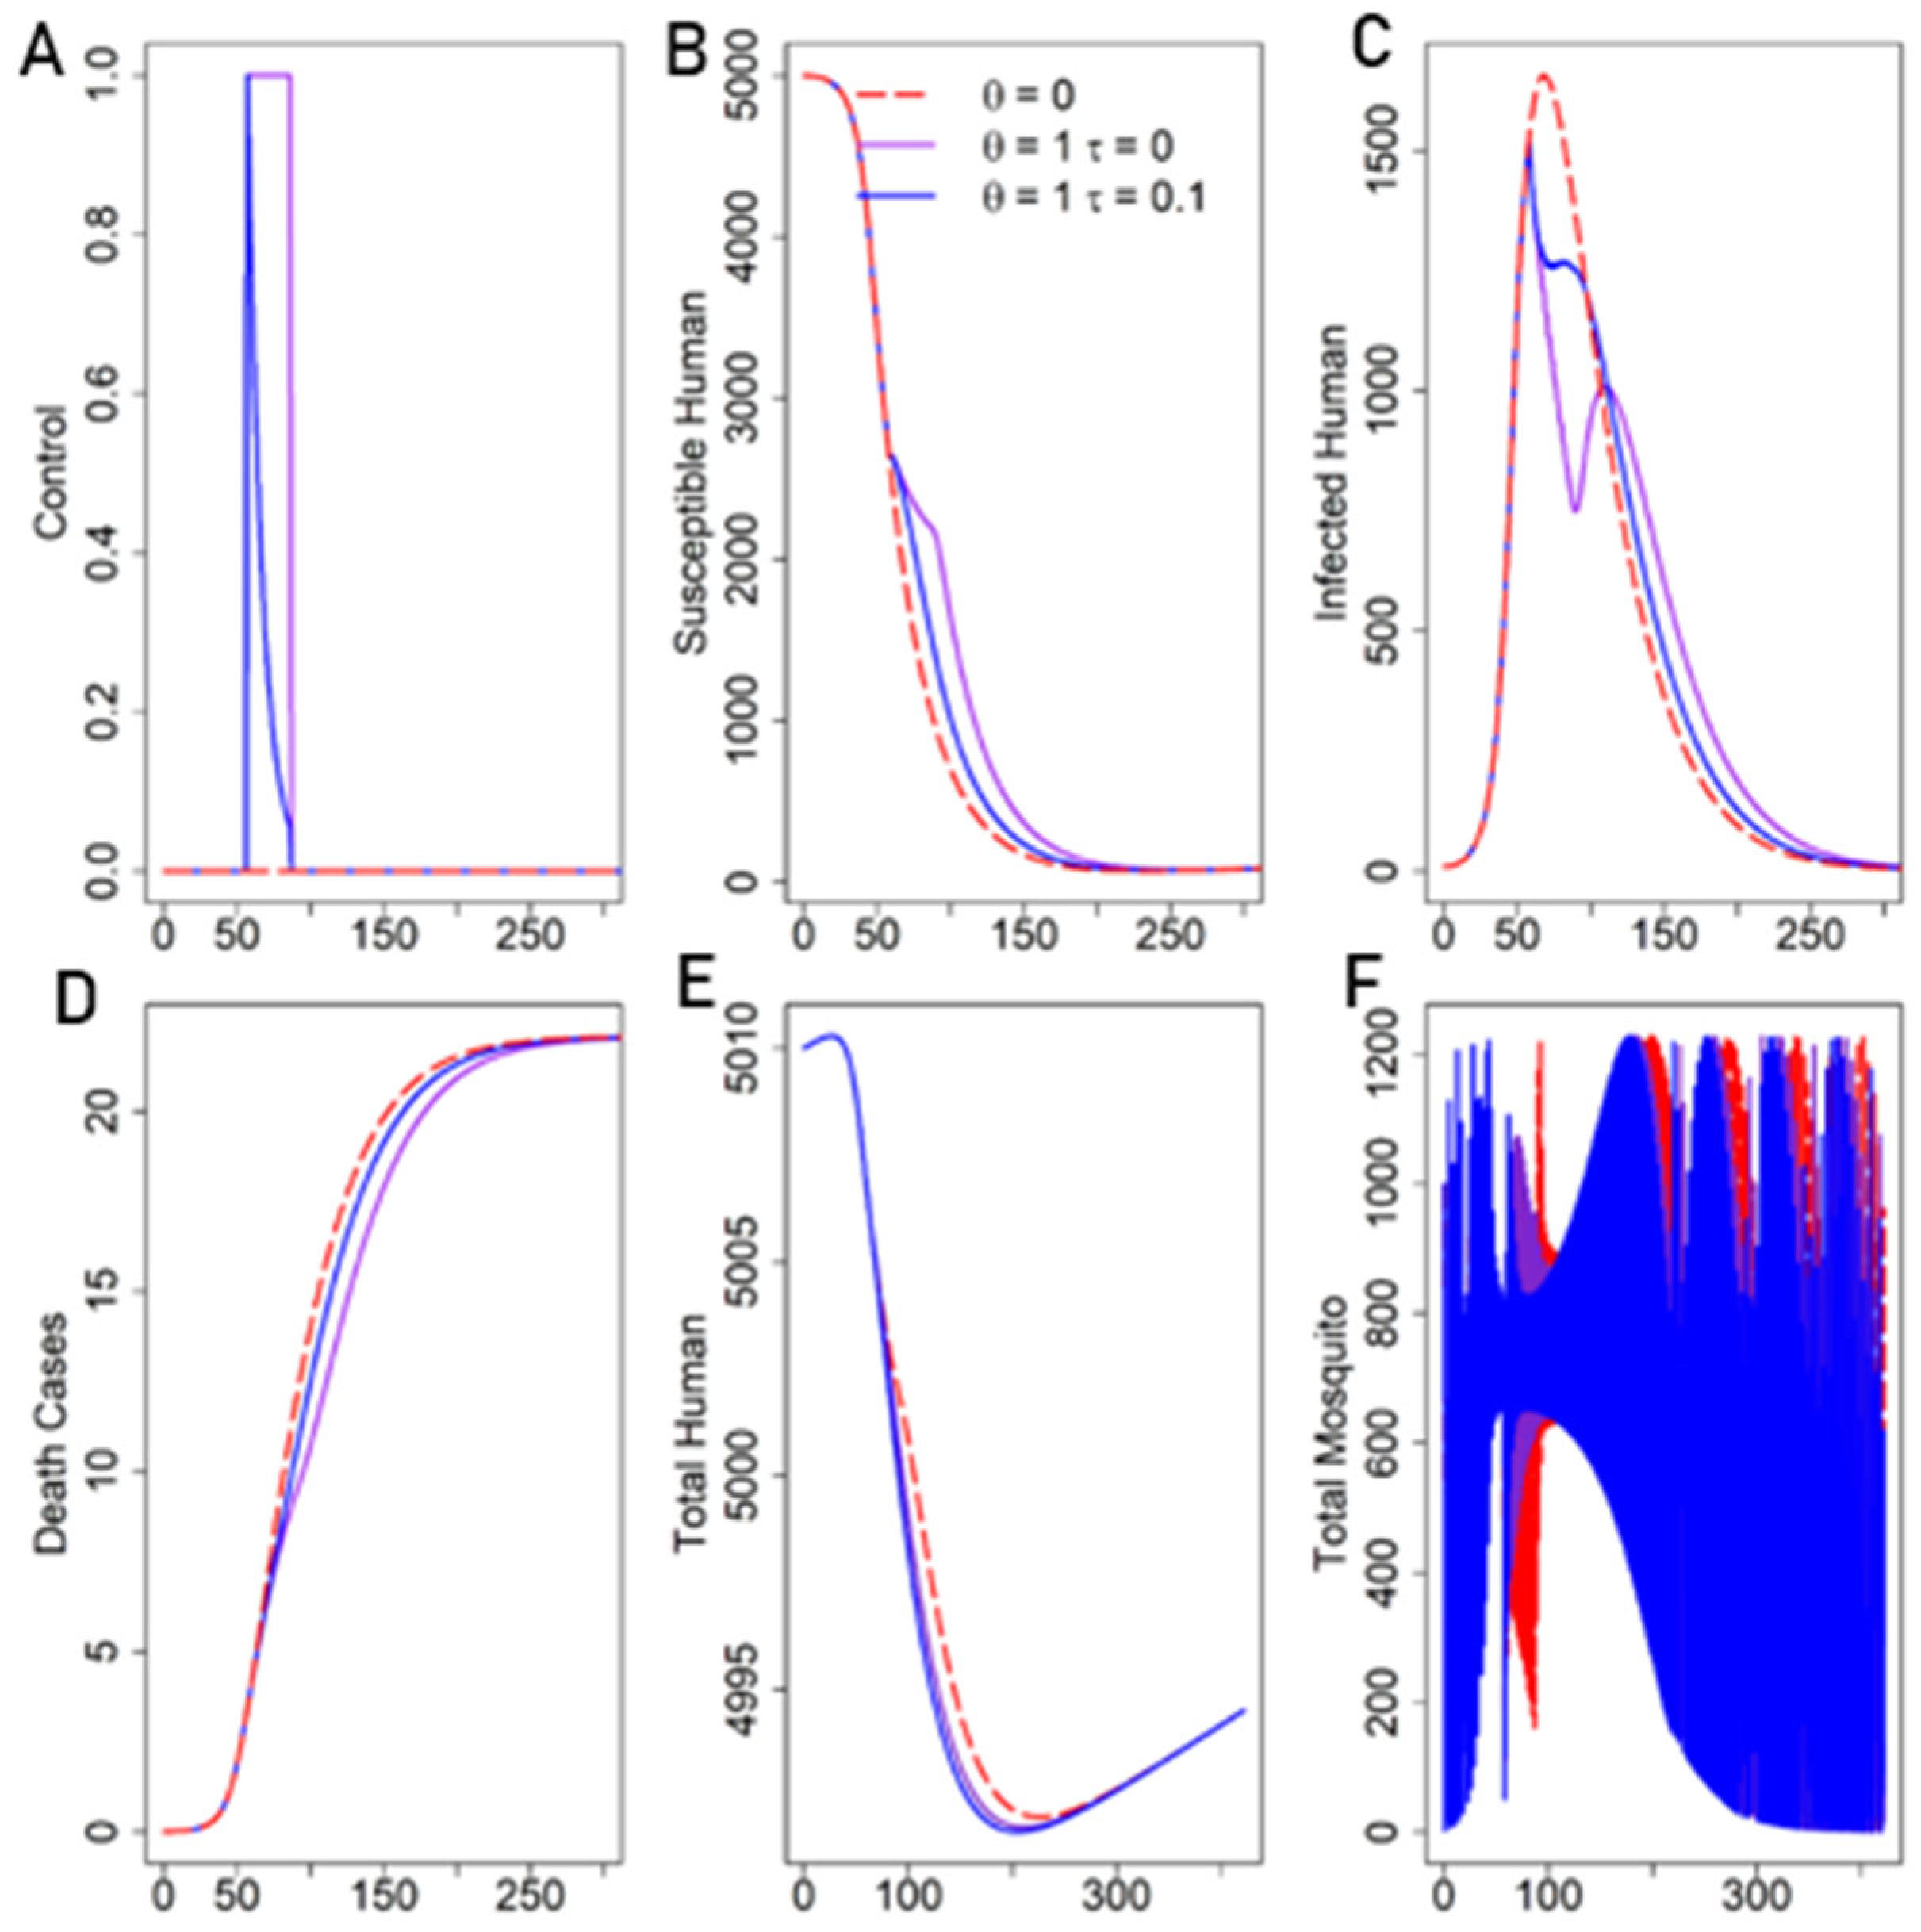
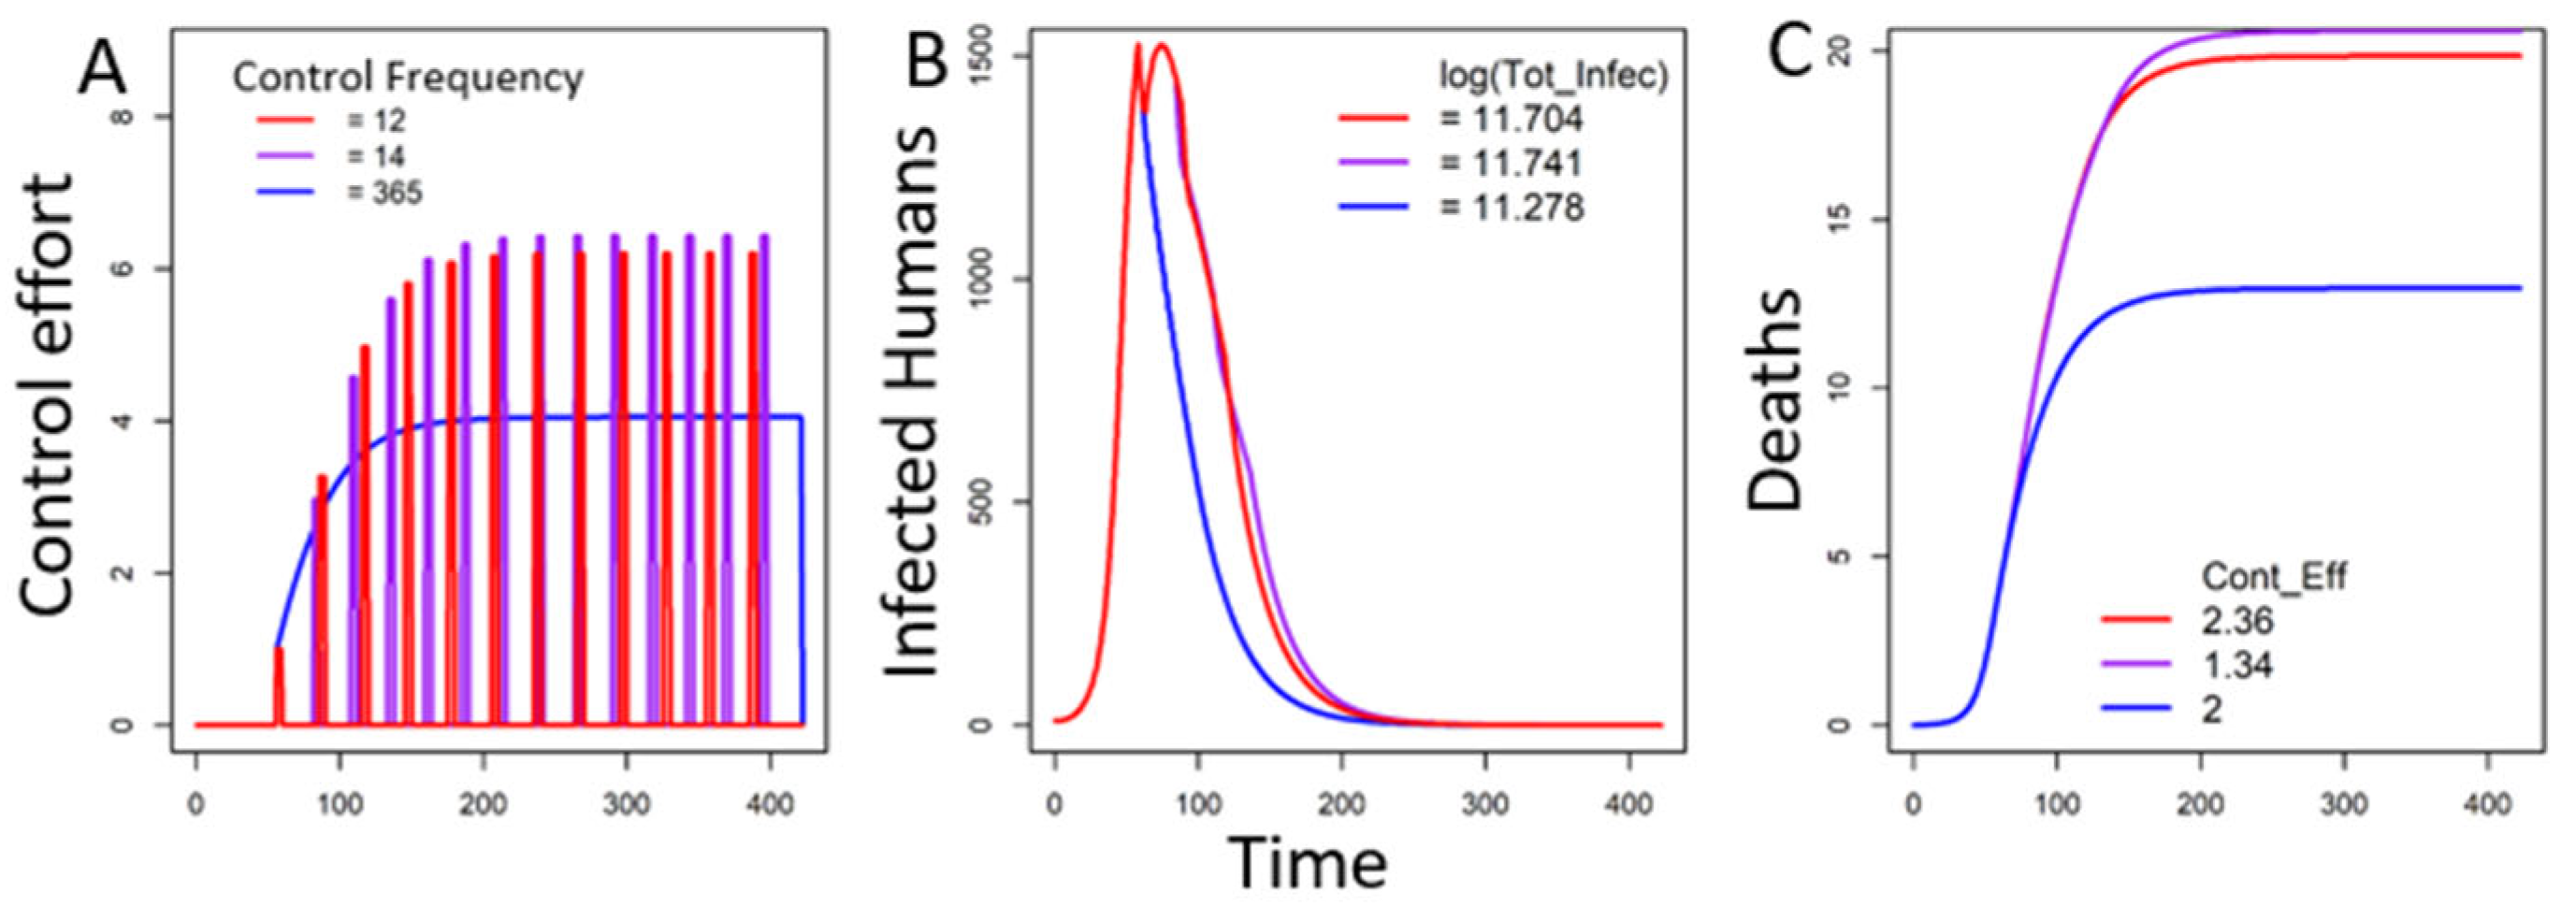
3.2.1. Fear Under One Trigger

In the Absence of Decay of Fear

Under one fear trigger without the decay of fear, the control effort starts on day 57 and remains constant for 30 days (CD = 30 in Table 2). The mosquito population shows a general decreasing trend due to control after day 57. When initial fear is high (θ = 1.5), the control effort is also high (see the highest blue line in Figure 1A), which drives the mosquito population to extinction (see the sharp drop to 0 of the blue line in Figure 1F) and boosts the susceptible human population (see the sudden increase in the blue curve near day 57 in Figure 1B). Based on the analytical calculation in the previous section (Equation (11)), infected humans reach the lowest phase when mosquitoes go extinct (the blue line in Figure 1C), as do death cases (the lowest blue line in Figure 1D). Further increases in initial fear (θ > 1.5), which would drive mosquitoes to extinction, would converge to the case when θ = 1.5.
When the initial fear is 0, the system would not have any control action (see the horizontal line in Figure 1A), and, thus, disease levels would reach the highest point (see the red dashed curve in Figure 1C). When initial fear is at an intermediate level (θ = 1), the mosquito population experiences a sharp decrease just before day 100 (see the drop in the purple line near day 100 in Figure 1F), creating a significant trap in infected humans (see the concave shape of the purple curve in Figure 1C). However, intermediate initial fear is not enough to drive the mosquito population to 0; so, after the control period, the mosquito population quickly increases again (see the purple curves almost overlapping the red ones in Figure 1F after day 100), leading to another disease outbreak (see the second hump trend of the purple curve after day 100 in Figure 1C).
When the control period (CD) is small, control takes very little time. Thus, the effects of initial fear (θ) on disease dynamics, as well as the differences among different levels of initial fear, become weak (compare the three lines in Figure S1 in the Supplementary Materials when CD = 3). Only the disease dynamics under high initial fear (θ) do not change at all (see the same blue line under CD = 7, 14, and 30).

In the Presence of Decay of Fear

The disease dynamics in response to the decay of fear largely depend on the levels of initial fear. When initial fear is at an intermediate level (e.g., θ = 1), the disease is more sensitive to the decay of fear. Introducing the decay of fear into the system would reduce the total control effort (compare the areas shaped by the purple and blue lines in Figure 2A; see the transition area in Figure 3A). As a result, the mosquito population can increase more quickly after the control period (see the quicker increase in the blue line compared to the purple once the control period ends in Figure 2F), generating a shallower trap in infected humans and more deaths than in the case without fear decay (compare the blue and purple curves in Figure 2C,D). In general, the decay of fear (e.g., τ = 0.1) tends to increase the disease levels and balance out the effects of initial fear on the system without control (see the blue lines between the purple and red lines in Figure 2B–D). These effects of fear decay become weaker when the control period is shorter (compare the colored lines in Figure S2 when CD = 3), but they are stronger when the control period is longer and fear does not decay to 0 before the control ends.
However, the decay of fear has little influence on system dynamics if initial fear is either extremely large or small (see the overlapping lines of the three colors when initial fear θ is <0.1 or >1.5 in Figure 3). For example, when initial fear is large enough to drive the mosquito population to extinction (e.g., θ = 1.5; the purple and blue curves in Figure S3), whether there is decay of fear or not does not affect the mosquito population anymore; thus, disease dynamics would remain unchanged (see the fully overlapped purple and blue curves in Figure S3C). In this case, further increases in initial fear (θ ≥ 1.5) would only increase the total control effort without changing the disease, leading to a decrease in control efficacy (see the relative positions of the three colored lines when θ ≥ 1.5 in Figure 3D).
When initial fear is very small, introducing the decay of fear would increase deaths more than the reduced control effort, leading to a decrease in control efficacy (compare the positions of the three colored lines when θ < 1 in Figure 3D, or θ = 0.1 in Figure S4). However, because the entire fear of death term f(θ,τ,t) is small at a lower initial fear, the influence of fear decay is minimal (see the almost overlapped curves of the three colored lines in total infected humans, and the slight differences among these lines in maximum infected humans and total deaths when θ < 1 in Figure 3A–C and Figure S4C).

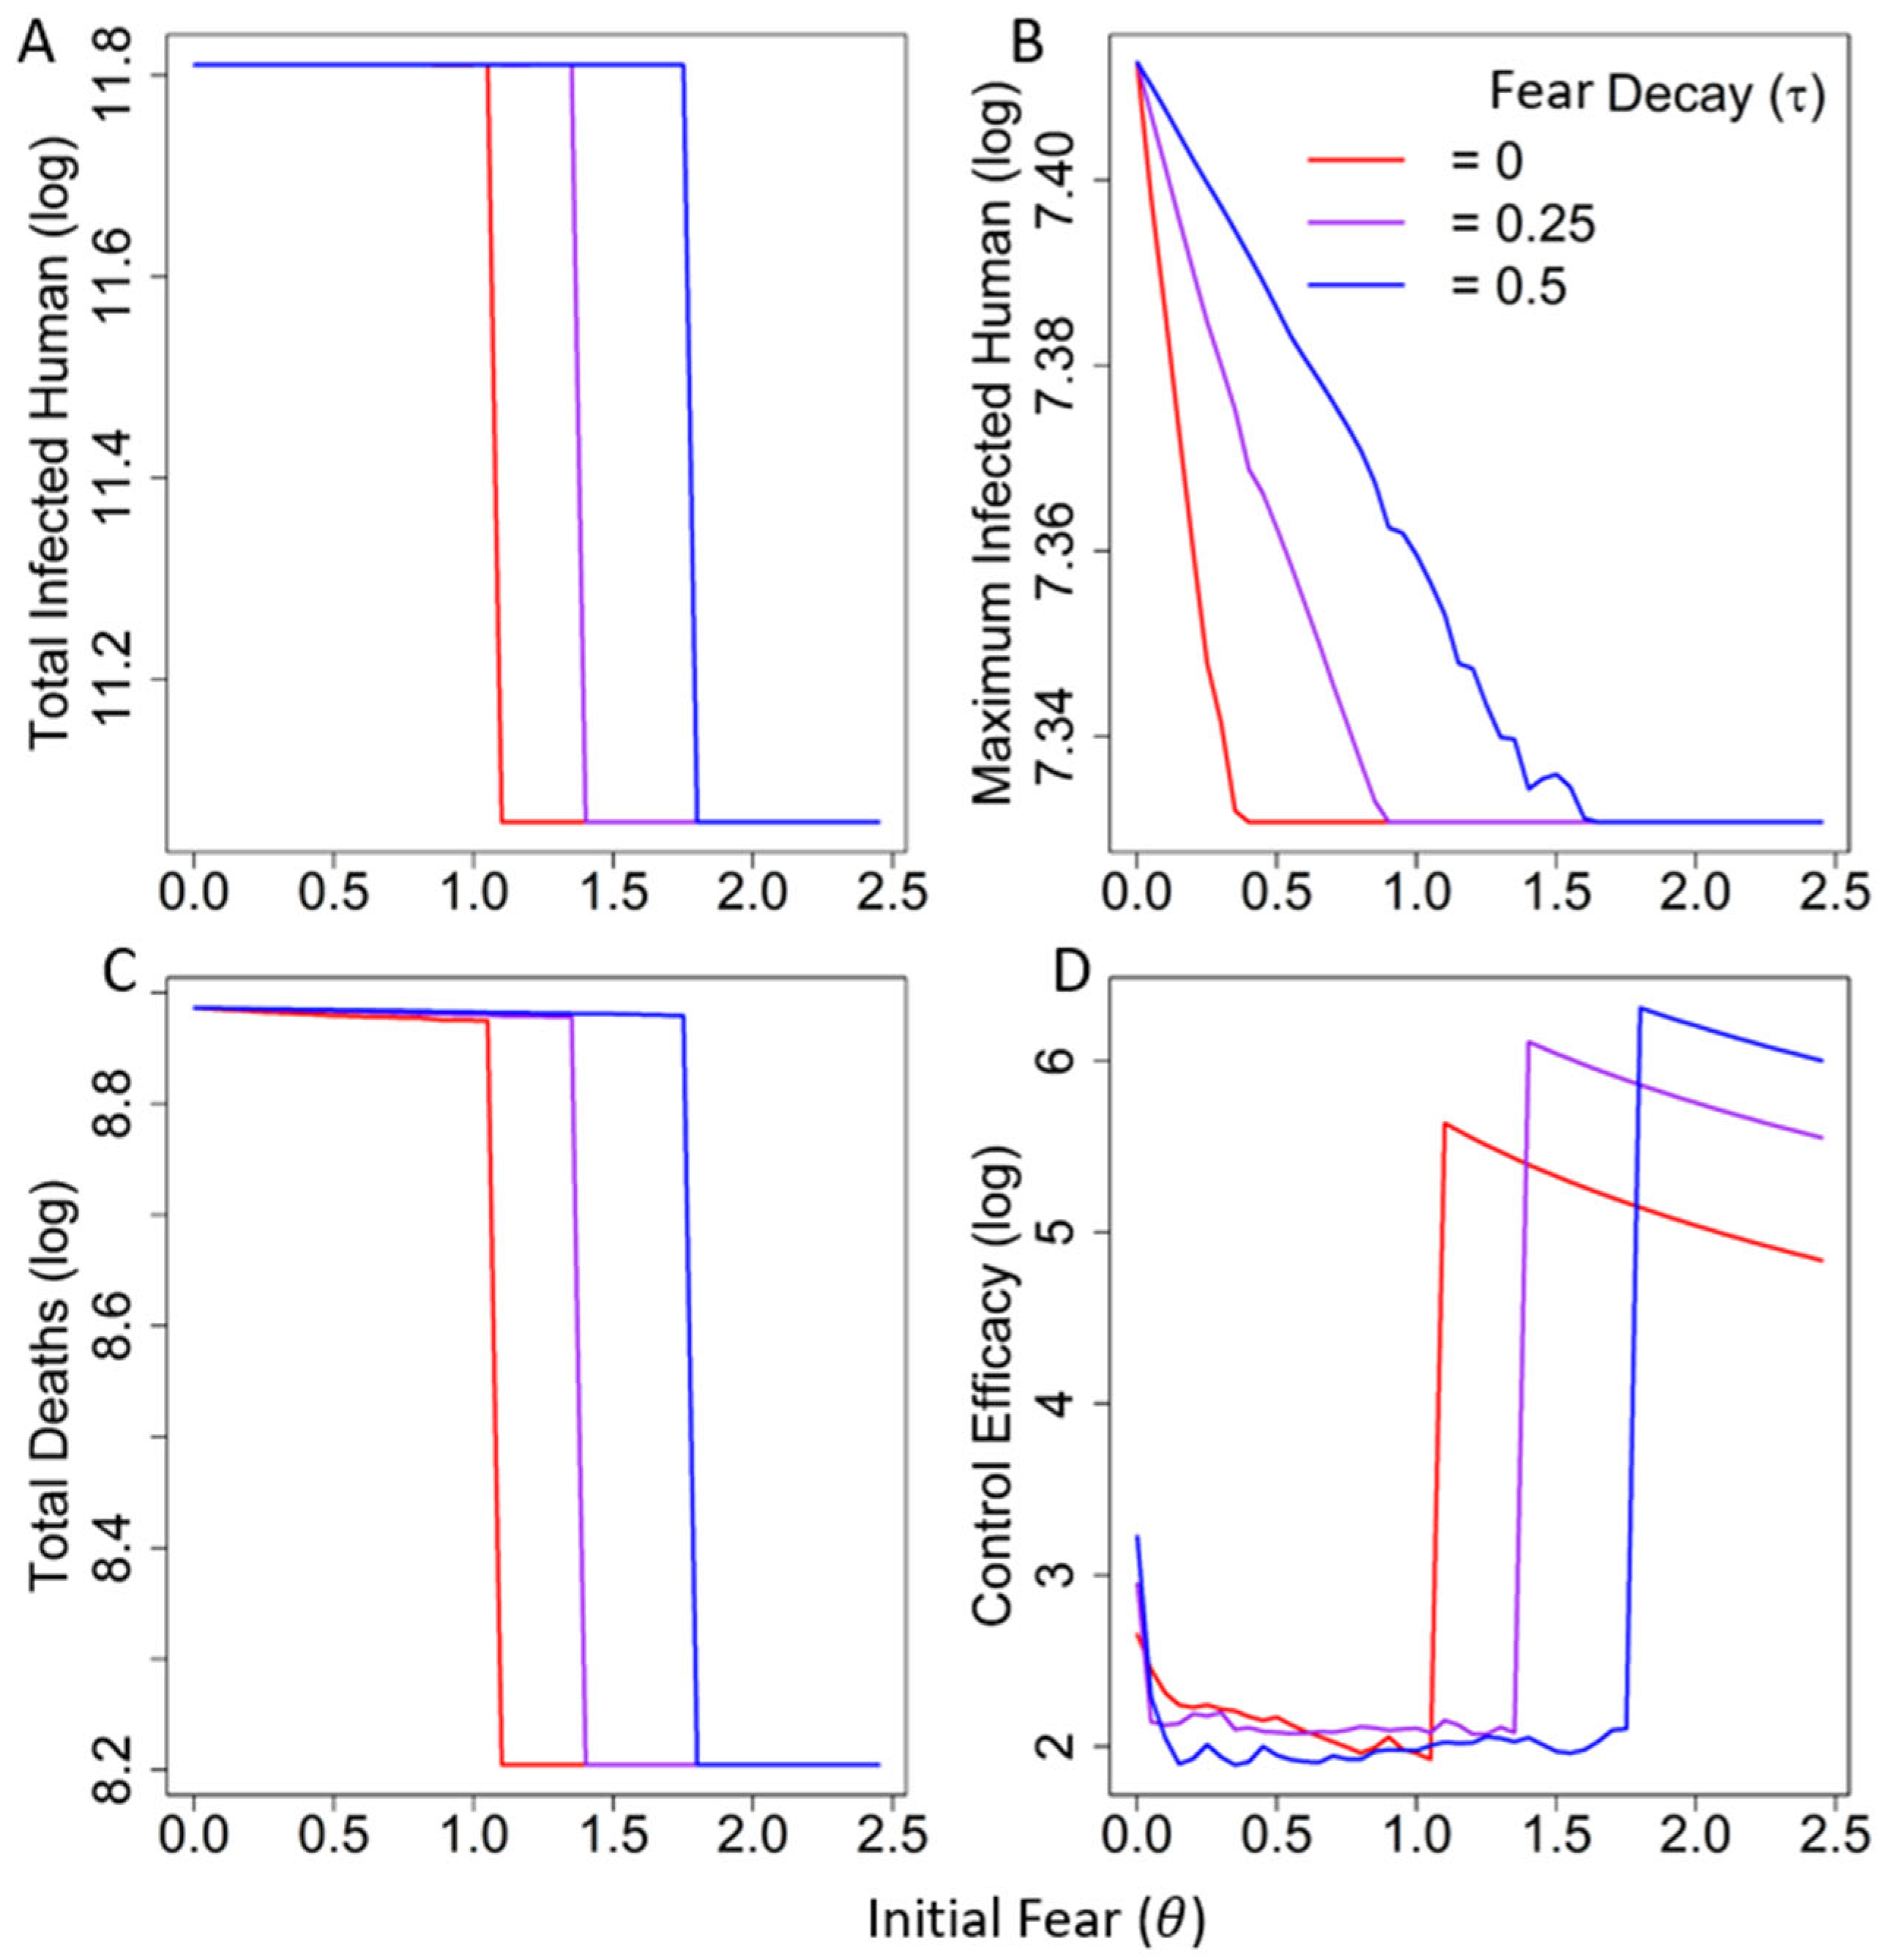
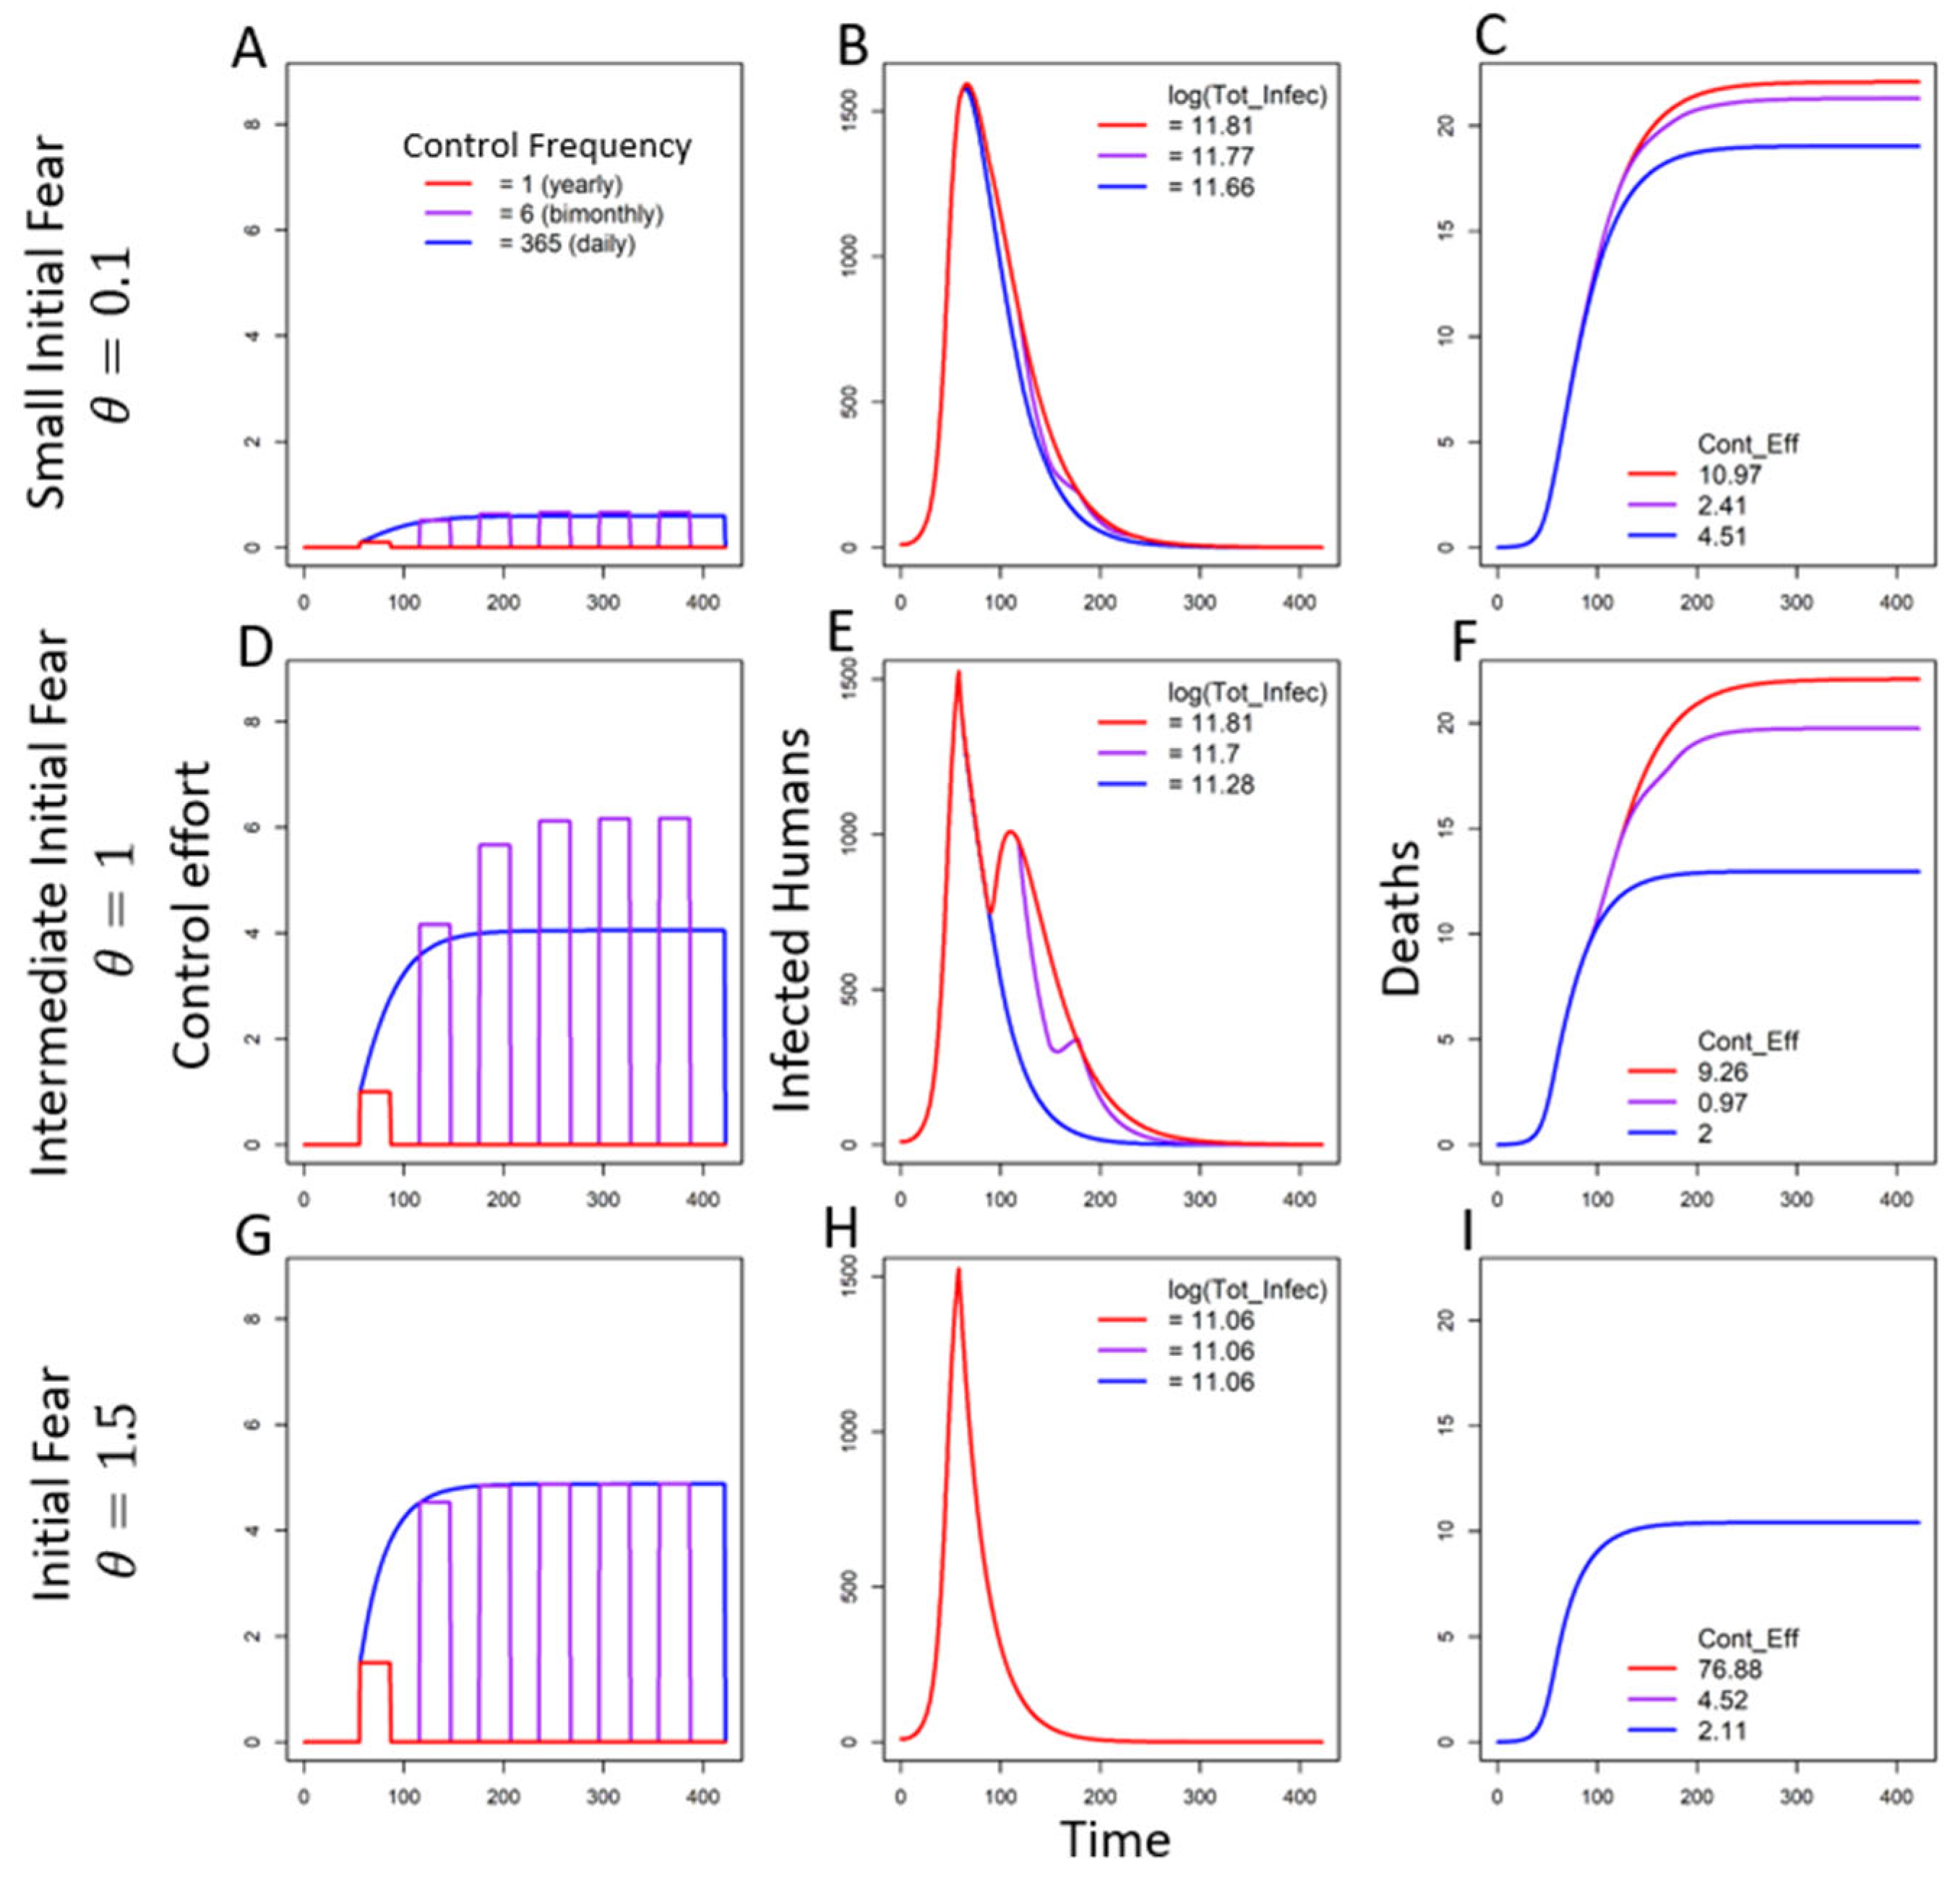
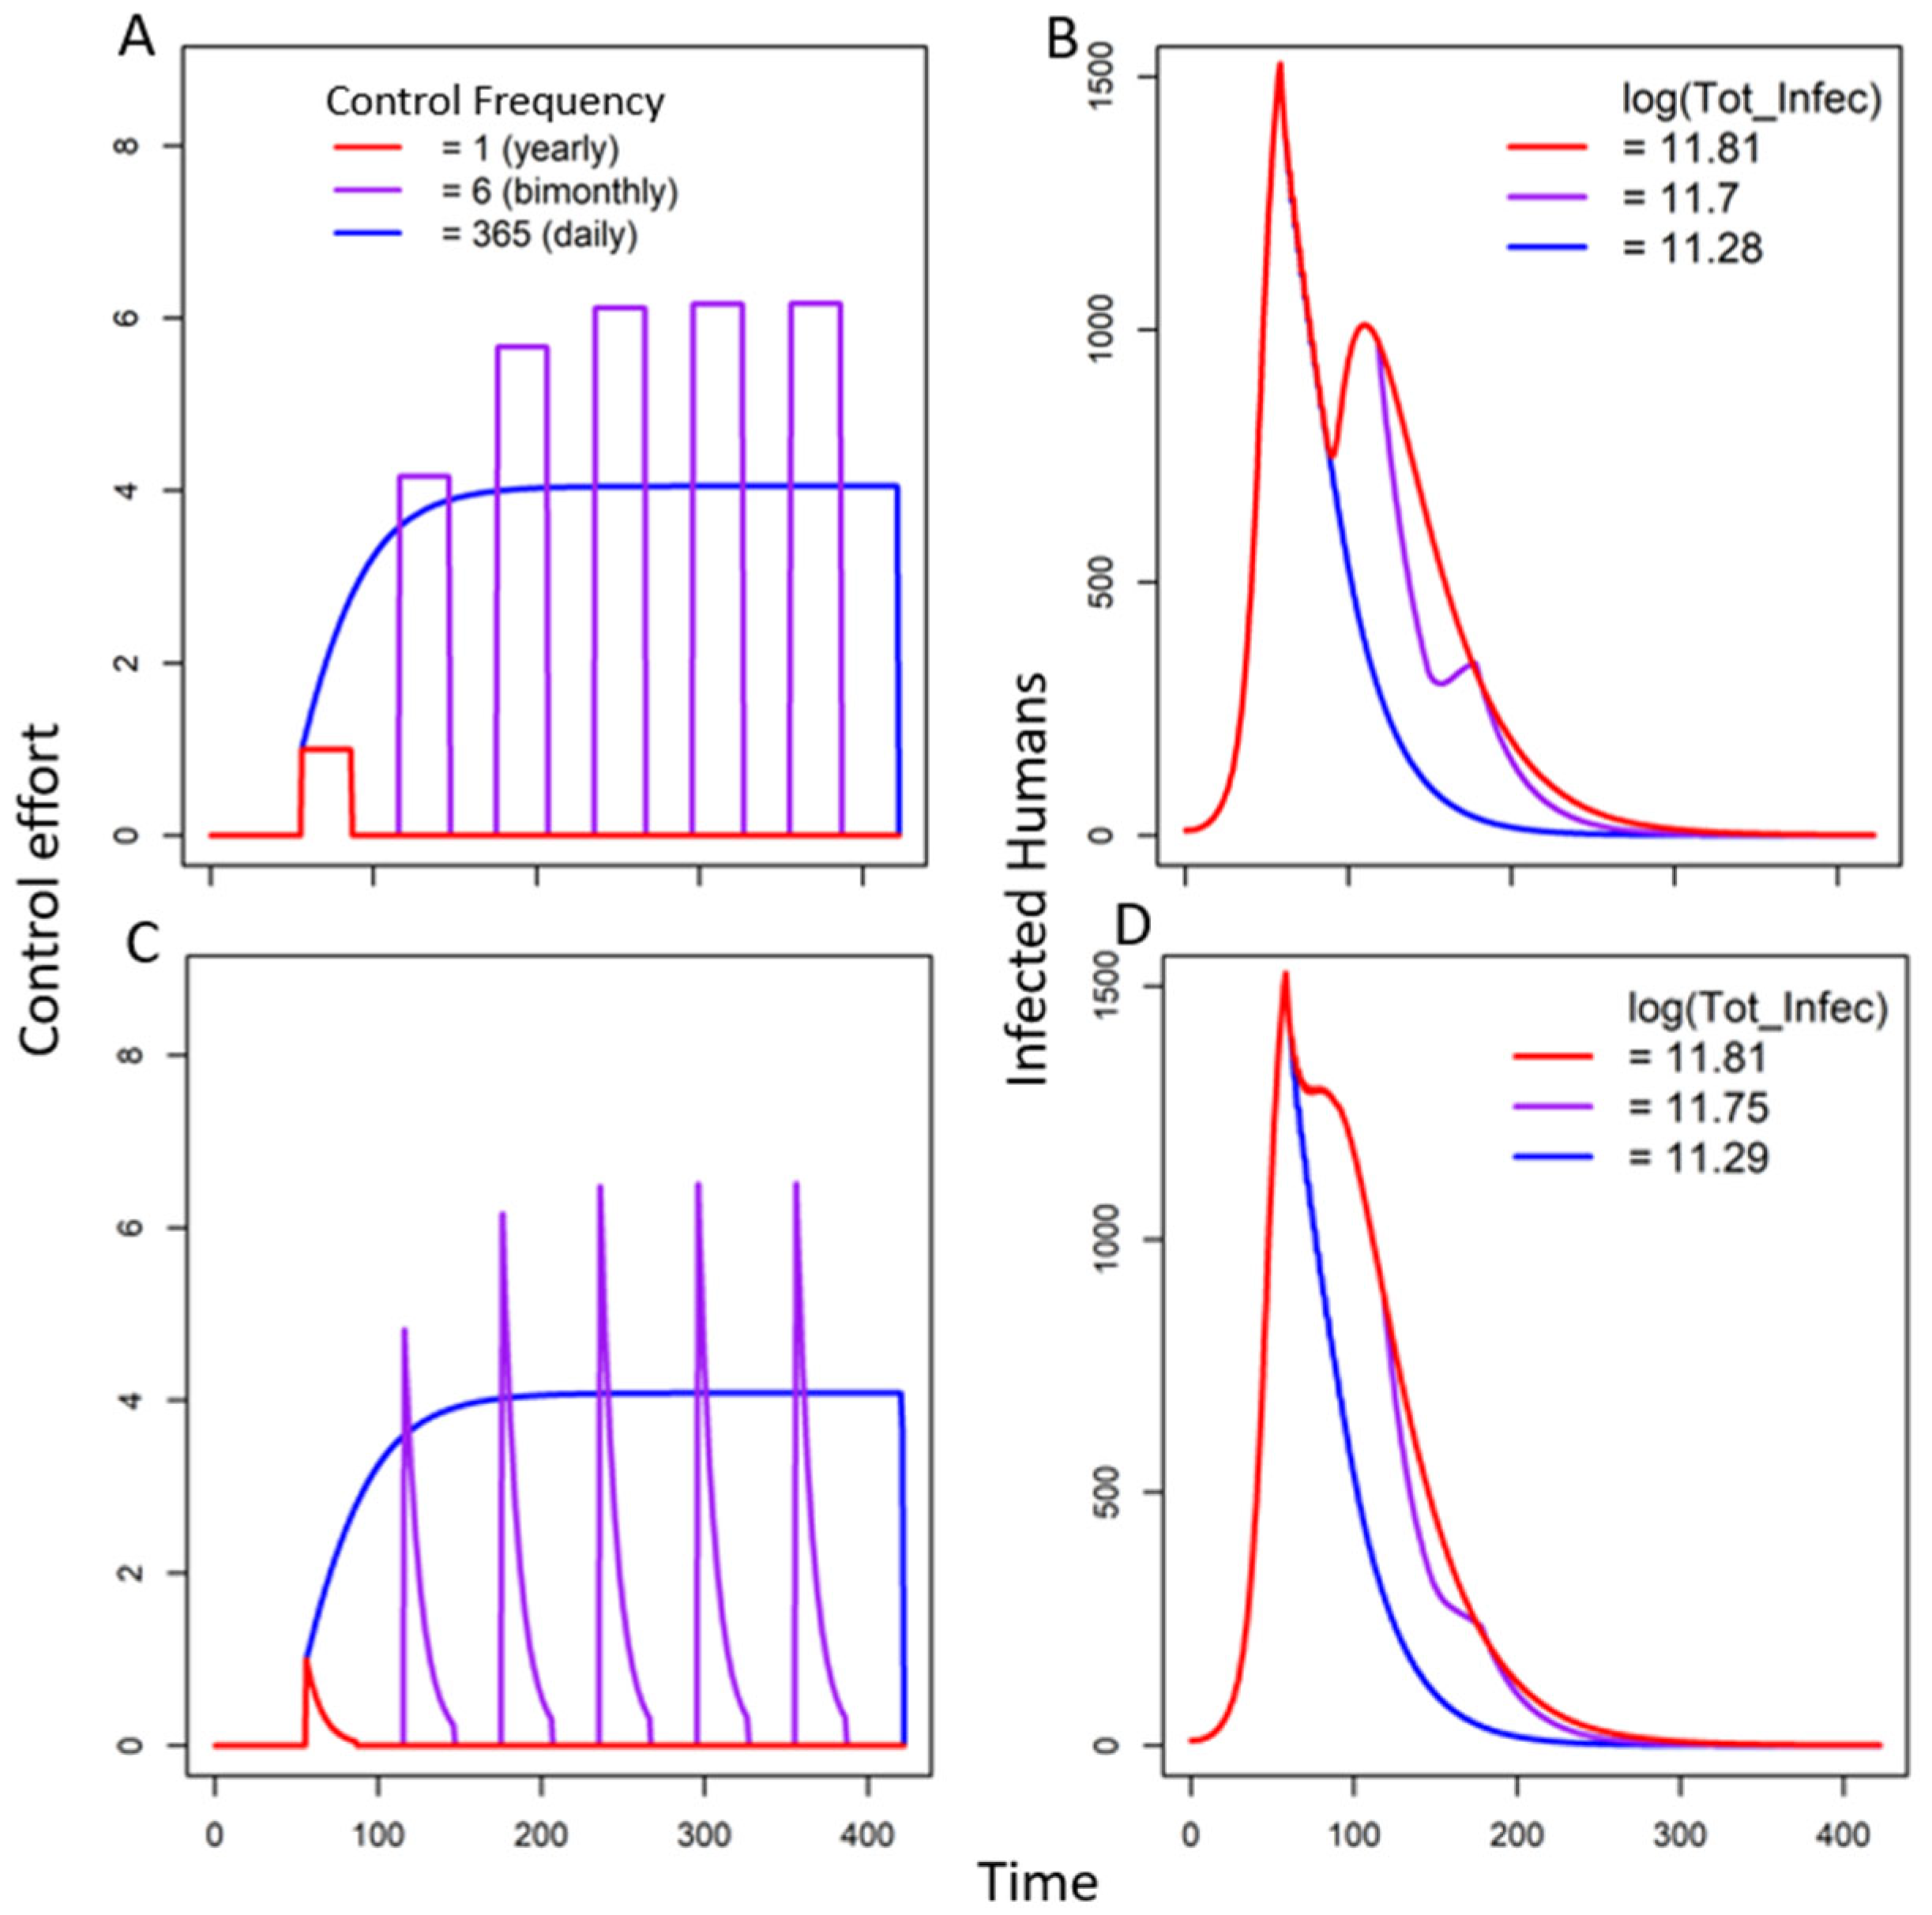
3.2.2. Seasonal Fear Under Multiple Triggers

In the Absence of Decay of Fear

In general, increasing the frequency of fear seasonality would decrease the mosquito population (see the mosquito population sizes shifting from red to purple, and then to blue lines in Figure S5C,F in the Supplementary Materials), which further reduces the number of infected humans and deaths (see the decreasing trend from red to purple to blue lines in Figure 4B,E,F for infected humans, and Figure 4C,F,I for deaths). However, when the initial fear is large enough to drive the mosquito population to extinction (see Figure S5I), increasing the frequency of fear seasonality would not affect disease dynamics (see the overlapping lines for infected humans and deaths at the three levels of control frequency in Figure 4H,I). On the contrary, if the control duration after each trigger is short (e.g., 3 days after the start of each control period), a small increase in the frequency of fear seasonality (e.g., increasing annual frequency from 12 to 14) could cause a hydra effect. That is, more control periods would increase the mosquito population (see the increased mosquito numbers from the red to purple lines in Figure S6F) and disease levels (see the increased total infected humans and deaths from the red to purple lines in Figure 5B,C). This happens because, under overall low control (e.g., short control duration and infrequent control), the mosquito population benefits from control-induced mortality due to the reduction in its density-dependent mortality [42,43,44]. Thus, a small increase in control (e.g., through increased control frequency) could further reduce density-dependent mortality, boosting both the mosquito population and total infection.
Similar to an increase in initial fear, increasing the frequency of fear seasonality could also change the phase of disease dynamics. For example, when the disease is in phase 2 under one control period (see the red concave curve in Figure 4E), increasing the control frequency could drive the system toward phase 3 (see the blue curve, which exhibits a similar pattern to the case described by Equation (11) in Figure 4E). This phase change occurs only at an intermediate level of initial fear. When initial fear is low, and the system stays at phase 1 (see the hump-shaped curves of all three colored lines in Figure 4B), the total control effort is limited, even with high control frequency (e.g., daily control).
When the time unit is per day, the highest frequency is daily control, where control efforts over time become almost continuous. Because the decay of fear is assumed to occur daily, daily control can effectively counter any effects of fear decay on the system. In this way, disease information would be released every day, and the public would take control actions based on the daily-released information (e.g., the death toll from Zika infection). Daily control has the highest total control effort due to the longest overall control duration. However, the control effort each day in daily control may be lower than that in less frequent control (see the higher y-axis values in the purple line compared to the blue lines in Figure 4D). This is because the control effort depends on the reported death cases (see Equation (9)). With a high frequency of fear seasonality, daily control leads to very low infections and deaths, which further reduce the strength of the control effort. Although disease reduction is high in the daily control scenario, the increase in total control is also substantial. Therefore, the control efficacy for daily control is lower than that for yearly control, but still relatively higher than for intermediate frequencies (i.e., bimonthly control) (see the first decrease followed by an increase in the red, purple, and blue lines in Figure 4C,D and Figure 5C).

In the Presence of Decay of Fear

Based on the results above for one control period, it is demonstrated that when daily control is almost continuous over time, there is little opportunity for fear to decay before a new triggered control action begins. Therefore, introducing the decay of fear has minimal impact on disease dynamics when the frequency of fear seasonality is very high (see the blue curves, which are nearly identical between Figure 6A,C). Additionally, whether or not fear decays, a small initial fear has little effect on disease dynamics (see the almost overlapping lines of the three colors in Figure 4B and Figure S7B in the Supplementary Materials). As such, I only analyze the effects of fear decay when initial fear is at an intermediate level.
Similar to the case with daily control, if the control period is short (i.e., CD is small), the decay of fear has limited influence on the system because the time between two control triggers is too brief to allow for significant fear decay, even with more control periods (see the small difference in total infected humans in the purple lines between Figure 5B and Figure S6E). However, when the duration of each control period is longer (e.g., CD = 30), there is a stronger reduction in control efforts with the introduction of fear decay, especially at intermediate frequencies (e.g., bimonthly). In this case, the decay of fear significantly reduces total control efforts but increases disease levels (see the noticeable difference in the purple lines between Figure 6B,D). Furthermore, introducing fear decay reduces control efforts more than it increases disease levels; so, adding the decay of fear likely leads to improved control efficacy (see the general increase in labeled control efficacy in Figure 6D compared to Figure 6B).

4. Discussion

This work studied how the waxing and waning of fear emotions in vector-borne disease (VBD) systems can lead to different control actions and, in turn, generate distinct disease patterns. In general, we found that initial fear can significantly influence the phases of disease dynamics: if initial fear is low, the system remains in a state without control (see Equation (9)); if initial fear is high, the system tends to approach the case where the vector population goes extinct (Equation (11)). In both cases, changes in the waxing and waning of fear have little impact on disease dynamics (see Figure 4 and Figure S4–S7G–I). Only when initial fear is at an intermediate level does a higher frequency of fear reinforcement compensate for the effects of fear decay on disease levels. However, if the control period is very short, repetitive fear reinforcement may increase disease levels, leading to the hydra effect (see the increased total infection from the red to purple lines in Figure 5 [43,44]). This indicates that frequent but shorter control periods may facilitate the proliferation of the vector population and increase disease spread. Therefore, periodic control actions may actually exacerbate disease rather than reduce it, and detailed conditions must be considered when governments or agencies implement periodic control strategies. Due to the discrete control actions, a discrete-version model is adopted, although the disease dynamics itself could be continuous (see [45,46] for discrete and continuous models).
The findings of this work can be broadly applied to the design of different disease control strategies tailored to local community variations. For example, if a community consists of many individuals who are less fearful of certain VBDs due to a lack of knowledge about the dangers of infection, education-related programs could be highly effective in reducing disease levels by increasing the community’s fear. If individuals have an intermediate initial fear with a large decay for certain diseases, local governments or public health agencies could focus on increasing the frequency of releasing disease information to the public (e.g., reporting death tolls through social media, broadcasting, etc.), which would lead to higher frequencies of fear seasonality and more frequent control actions. If the local community does not have a strong initial fear and frequently implements short-term controls, increasing control frequency should be recommended to avoid the hydra effect. If the majority of the community is suffering from chronic diseases and is easily scared of infection, taking strong control actions, the government may need to issue warnings to prevent overcontrol (e.g., encourage one-time control actions, avoid long-term or frequent controls, or limit the use of insecticides on vectors).
Additionally, with dynamic demographic data from a local community, which may influence the overall fear level, governments can use our analyses to adjust their strategies over time to promote more effective disease control or find the balance between different strategies. For instance, if, at a given time, a community has a substantial number of individuals with low or intermediate fear of death from certain diseases, this study can help calculate how to allocate resources for releasing disease information or educating the public about the dangers of infection. If the local government or agencies have already established a fixed frequency for disease education, this study can also assist in determining how effective each education program must be to achieve the desired level of disease reduction. In this study, fear is assumed to be a driver for human control actions; so, other fear–control relationships are not within the scope of this work (e.g., large fear may cause stigma, reducing or delaying control efforts in some individuals [47]). Future studies could explore what types of social media, what kinds of educational programs, and what other psycho-social characteristics (e.g., personality [48,49], personal concerns [50], risk-prone or -averse behavior [51], rebellious mentality [52,53], social networks [54]) may produce equal or even opposite effects on the public’s control actions beyond fear emotion.
This study explicitly explored one common mechanism—fear—to explain variations in people’s reactions to certain VBDs that can well describe real-world control behaviors. This work contributes to the growing body of studies on how human psychological processes and behaviors influence disease epidemiology (e.g., [55,56,57,58,59,60]). The findings can provide guidance for local governments or related agencies to design more effective disease control strategies based on the characteristics of their local communities. Moreover, the results of this study can significantly advance the theory integrating human behavior, disease epidemiology, and disease control [52,61,62,63].

Supplementary Materials

The following supporting information can be downloaded at: https://www.mdpi.com/article/10.3390/math13050879/s1, Figure S1: System dynamics (i.e., A. control, B. susceptible, C. infected and D. death cases in humans) along time under three levels of initial fear: θ = 0 (red dashed line; no control), 1 (purple line), 1.5 (blue line) in the absence of fear decay (τ = 0) and when the control duration time is 3 days (CD = 3). All other parameters are listed in Table 2. Figure S2: System dynamics (i.e., A. control, B. susceptible, C. infected and D. death cases in humans) along time in the absence and presence of fear decay: τ = 0 (purple line; no fear decay), 0.1 (blue line; with fear decay at rate 0.1) under intermediate initial fear (θ = 1) when control duration time is 3 days (CD = 3). For reference, the scenario without control is also plotted (θ = 0; red dashed lines). All other parameters are listed in Table 2. Figure S3: System dynamics (i.e., A. control, B. susceptible, C. infected and D. death cases in humans, and E. total populations of human and F. mosquitoes) along time in the absence and presence of fear decay: τ = 0 (purple line; no fear decay), 0.1 (blue line; with fear decay at rate 0.1) under large initial fear ( θ = 1.5 ). For reference, the scenario without control is also plotted ( θ = 0 ; red dashed lines). All other parameters are listed in Table 2. Figure S4: System dynamics (i.e., A. control, B. susceptible, C. infected and D. death cases in humans, and E. total populations of human and F. mosquitoes) along time in the absence and presence of fear decay: τ = 0 (purple line; no fear decay), 0.1 (blue line; with fear decay at rate 0.1) under small initial fear ( θ = 0.1 ). For reference, the scenario without control is also plotted ( θ = 0 ; red dashed lines). All other parameters are listed in Table 2. Figure S5: The dynamics of the control effort; susceptible humans and mosquito population size tracked under three levels of initial fear ( θ = 0.1 , 1 and 1.5, corresponding to each row) and three levels of control periods (yearly in red, bimonthly in purple, and daily in blue, corresponding to the different periods of fear waxing and waning) in the absence of fear decay ( τ = 0 ). The total population sizes of mosquitoes under each combination of initial fear and fear frequency are calculated and labeled in the third column. Figure S6: The dynamics of the control effort; susceptible humans and mosquito population size tracked under three levels of initial fear ( θ = 0.1 , 1 and 1.5, corresponding to each row) and three levels of control frequency (yearly in red, bimonthly in purple, and daily in blue, corresponding to the different periods of fear waxing and waning) in the absence of fear decay ( τ = 0 ) when one control period lasts 3 days (CD = 3). The total population sizes of mosquitoes under each combination of initial fear and fear frequency are calculated and labeled in the third column. Figure S7: The dynamics of the control effort; infected human and death cases tracked under three levels of initial fear ( θ = 0.1 , 1 and 1.5, corresponding to each row) and three levels of control frequency (yearly in red, bimonthly in purple, and daily in blue, corresponding to the different periods of fear waxing and waning) in the presence of fear decay ( τ = 0.1 ). The log of the total infected humans and control efficacy are calculated and labeled for each combination of initial fear and fear frequency in the subplots of the second and third columns.

Funding

This work was supported by the Department of Biology Adkins and Kendall funds and Junior Faculty Summer Support from Texas Christian University.

Data Availability Statement

This manuscript is a theoretical work without raw data. The R code generating all figures is available from Zenodo: https://doi.org/10.5281/zenodo.13147444, accessed on 1 August 2024.

Acknowledgments

Part of the model structure was based on the author’s previous work in Nina. H. Fefferman’s lab at the University of Tennessee, Knoxville. Thanks to anonymous reviewers and Eun Hye Lee from the Department of Mathematics of Texas Christian University for the constructive comments on the model structure.

Conflicts of Interest

The author declares no conflicts of interest. The funders had no role in the design of the study; in the collection, analyses, or interpretation of data; in the writing of the manuscript; or in the decision to publish the results.

Abbreviations

The following abbreviations are used in this manuscript:
VBDVector-Borne Disease
CDControl Duration (days for one control period)

References

  1. Althouse, B.M.; Scarpino, S.V.; Meyers, L.A.; Ayers, J.W.; Bargsten, M.; Baumbach, J.; Brownstein, J.S.; Castro, L.; Clapham, H.; Cummings, D.A. Enhancing disease surveillance with novel data streams: Challenges and opportunities. EPJ Data Sci. 2015, 4, 17. [Google Scholar] [CrossRef] [PubMed]
  2. Sabin, N.S.; Calliope, A.S.; Simpson, S.V.; Arima, H.; Ito, H.; Nishimura, T.; Yamamoto, T. Implications of human activities for (re) emerging infectious diseases, including COVID-19. J. Physiol. Anthropol. 2020, 39, 29. [Google Scholar] [CrossRef] [PubMed]
  3. Stockmaier, S.; Stroeymeyt, N.; Shattuck, E.C.; Hawley, D.M.; Meyers, L.A.; Bolnick, D.I. Infectious diseases and social distancing in nature. Science 2021, 371, eabc8881. [Google Scholar] [CrossRef]
  4. Cheng, V.C.-C.; Wong, S.-C.; Chuang, V.W.-M.; So, S.Y.-C.; Chen, J.H.-K.; Sridhar, S.; To, K.K.-W.; Chan, J.F.-W.; Hung, I.F.-N.; Ho, P.-L. The role of community-wide wearing of face mask for control of coronavirus disease 2019 (COVID-19) epidemic due to SARS-CoV-2. J. Infect. 2020, 81, 107–114. [Google Scholar] [CrossRef]
  5. Manfredi, P.; D’Onofrio, A. Modeling the Interplay Between Human Behavior and the Spread of Infectious Diseases; Springer Science & Business Media: New York, NY, USA, 2013. [Google Scholar]
  6. Almaghrabi, M.K. Public awareness, attitudes, and adherence to COVID-19 quarantine and isolation in Saudi Arabia. Int. J. Gen. Med. 2021, 14, 4395–4403. [Google Scholar] [CrossRef] [PubMed]
  7. Elgendy, M.O.; Abd Elmawla, M.N.; Abdel Hamied, A.M.; El Gendy, S.O.; Abdelrahim, M.E. COVID-19 patients and contacted person awareness about home quarantine instructions. Int. J. Clin. Pract. 2021, 75, e13810. [Google Scholar] [CrossRef]
  8. Masadeh, M.M.; Alzoubi, K.H.; Al-Azzam, S.I.; Al-Agedi, H.S.; Abu Rashid, B.E.; Mukattash, T.L. Public awareness regarding children vaccination in Jordan. Hum. Vaccines Immunother. 2014, 10, 1762–1766. [Google Scholar] [CrossRef]
  9. Capasso, V.; Serio, G. A generalization of the Kermack-McKendrick deterministic epidemic model. Math. Biosci. 1978, 42, 43–61. [Google Scholar] [CrossRef]
  10. Jiao, J.; Suarez, G.P.; Fefferman, N.H. How public reaction to disease information across scales and the impacts of vector control methods influence disease prevalence and control efficacy. PLoS Comput. Biol. 2021, 17, e1008762. [Google Scholar] [CrossRef]
  11. d’Onofrio, A.; Manfredi, P. The interplay between voluntary vaccination and reduction of risky behavior: A general behavior-implicit SIR model for vaccine preventable infections. In Current Trends in Dynamical Systems in Biology and Natural Sciences; Springer: Cham, Switzerland, 2020; pp. 185–203. [Google Scholar]
  12. Chen, Y.; Bi, K.; Zhao, S.; Ben-Arieh, D.; Wu, C.-H.J. Modeling individual fear factor with optimal control in a disease-dynamic system. Chaos Solitons Fractals 2017, 104, 531–545. [Google Scholar] [CrossRef]
  13. Pappas, G.; Kiriaze, I.J.; Giannakis, P.; Falagas, M.E. Psychosocial consequences of infectious diseases. Clin. Microbiol. Infect. 2009, 15, 743–747. [Google Scholar] [CrossRef] [PubMed]
  14. Epstein, J.M.; Parker, J.; Cummings, D.; Hammond, R.A. Coupled contagion dynamics of fear and disease: Mathematical and computational explorations. PLoS ONE 2008, 3, e3955. [Google Scholar] [CrossRef]
  15. Maji, C. Impact of Media-Induced Fear on the Control of COVID-19 Outbreak: A Mathematical Study. Int. J. Differ. Equ. 2021, 1, 2129490. [Google Scholar] [CrossRef]
  16. Funk, S.; Salathé, M.; Jansen, V.A. Modelling the influence of human behaviour on the spread of infectious diseases: A review. J. R. Soc. Interface 2010, 7, 1247–1256. [Google Scholar] [CrossRef]
  17. Manwar, M.H.G.; Khan, R.A.H. A Review on Vector Borne Diseases and Controlling Challenges. J. Algebr. Stat. 2022, 13, 398–409. [Google Scholar]
  18. Chala, B.; Hamde, F. Emerging and re-emerging vector-borne infectious diseases and the challenges for control: A review. Front. Public Health 2021, 9, 715759. [Google Scholar] [CrossRef]
  19. Guastello, S.J.; Koopmans, M.; Pincus, D. Chaos and Complexity in Psychology: The Theory of Nonlinear Dynamical Systems; Cambridge University Press: Cambridge, UK, 2008. [Google Scholar]
  20. Hohm, I.; Wormley, A.S.; Schaller, M.; Varnum, M.E. Homo temporus: Seasonal cycles as a fundamental source of variation in human psychology. Perspect. Psychol. Sci. 2024, 19, 151–172. [Google Scholar] [CrossRef]
  21. Magnusson, A.; Boivin, D. Seasonal affective disorder: An overview. Chronobiol. Int. 2003, 20, 189–207. [Google Scholar] [CrossRef]
  22. Han, L.; Wang, K.; Du, Z.; Cheng, Y.; Simons, J.S.; Rosenthal, N.E. Seasonal variations in mood and behavior among Chinese medical students. Am. J. Psychiatry 2000, 157, 133–135. [Google Scholar] [CrossRef]
  23. Siegel, M. False Alarm: The Truth About the Epidemic of Fear; Turner Publishing Company: Paducah, KY, USA, 2008. [Google Scholar]
  24. Kindt, M. The surprising subtleties of changing fear memory: A challenge for translational science. Philos. Trans. R. Soc. B Biol. Sci. 2018, 373, 20170033. [Google Scholar] [CrossRef]
  25. Palmer, M.S.; Gaynor, K.M.; Abraham, J.O.; Pringle, R.M. The role of humans in dynamic landscapes of fear. Trends Ecol. Evol. 2023, 38, 217–218. [Google Scholar] [CrossRef] [PubMed]
  26. Cuervo-Parra, J.A.; Cortés, T.R.; Ramirez-Lepe, M. Mosquito-borne diseases, pesticides used for mosquito control, and development of resistance to insecticides. In Insecticides Resistance; InTechOpen: Rijeka, Croatia, 2016; Volume 2, pp. 111–134. [Google Scholar]
  27. Kaur, A.; Tyson, R.; Moyles, I. The impact of fear and behaviour response to established and novel diseases. arXiv 2024, arXiv:2406.15595. [Google Scholar]
  28. Yang, E.; Kim, J.; Pennington-Gray, L. Social media information and peer-to-peer accommodation during an infectious disease outbreak. J. Destin. Mark. Manag. 2021, 19, 100538. [Google Scholar] [CrossRef]
  29. Lerouge, R.; Lema, M.D.; Arnaboldi, M. The role played by government communication on the level of public fear in social media: An investigation into the Covid-19 crisis in Italy. Gov. Inf. Q. 2023, 40, 101798. [Google Scholar] [CrossRef]
  30. Dillard, J.P.; Li, R.; Yang, C. Fear of Zika: Information seeking as cause and consequence. Health Commun. 2021, 36, 1785–1795. [Google Scholar] [CrossRef]
  31. Steimer, T. The biology of fear-and anxiety-related behaviors. Dialogues Clin. Neurosci. 2002, 4, 231–249. [Google Scholar] [CrossRef] [PubMed]
  32. Ash, T.; Bento, A.M.; Kaffine, D.; Rao, A.; Bento, A.I. Disease-economy trade-offs under alternative epidemic control strategies. Nat. Commun. 2022, 13, 3319. [Google Scholar] [CrossRef]
  33. Oleś, K.; Gudowska-Nowak, E.; Kleczkowski, A. Understanding disease control: Influence of epidemiological and economic factors. PLoS ONE 2012, 7, e36026. [Google Scholar] [CrossRef]
  34. Hindes, J.; Bianco, S.; Schwartz, I.B. Optimal periodic closure for minimizing risk in emerging disease outbreaks. PLoS ONE 2021, 16, e0244706. [Google Scholar] [CrossRef]
  35. Suarez, G.P.; Udiani, O.; Allan, B.F.; Price, C.; Ryan, S.J.; Lofgren, E.; Coman, A.; Stone, C.M.; Gallos, L.K.; Fefferman, N.H. A generic arboviral model framework for exploring trade-offs between vector control and environmental concerns. J. Theor. Biol. 2020, 490, 110161. [Google Scholar] [CrossRef]
  36. Ross, R. Some quantitative studies in epidemiology. Nature 1911, 87, 466–467. [Google Scholar] [CrossRef]
  37. Macdonald, G. The analysis of infection rates in diseases in which super infection occurs. Trop. Dis. Bull. 1950, 47, 907–915. [Google Scholar] [PubMed]
  38. Gao, D.; Lou, Y.; He, D.; Porco, T.C.; Kuang, Y.; Chowell, G.; Ruan, S. Prevention and control of Zika as a mosquito-borne and sexually transmitted disease: A mathematical modeling analysis. Sci. Rep. 2016, 6, 28070. [Google Scholar] [CrossRef]
  39. Agency, C.I. The World Factbook 2009; Central Intelligence Agency: McLean, VA, USA, 2009. [Google Scholar]
  40. Stone, C.M.; Schwab, S.R.; Fonseca, D.M.; Fefferman, N.H. Human movement, cooperation and the effectiveness of coordinated vector control strategies. J. R. Soc. Interface 2017, 14, 20170336. [Google Scholar] [CrossRef] [PubMed]
  41. Ellington, S.R.; Devine, O.; Bertolli, J.; Quiñones, A.M.; Shapiro-Mendoza, C.K.; Perez-Padilla, J.; Rivera-Garcia, B.; Simeone, R.M.; Jamieson, D.J.; Valencia-Prado, M. Estimating the number of pregnant women infected with Zika virus and expected infants with microcephaly following the Zika virus outbreak in Puerto Rico, 2016. JAMA Pediatr. 2016, 170, 940–945. [Google Scholar] [CrossRef]
  42. Cortez, M.H.; Abrams, P.A. Hydra effects in stable communities and their implications for system dynamics. Ecology 2016, 97, 1135–1145. [Google Scholar] [CrossRef]
  43. Abrams, P.A. When does greater mortality increase population size? The long history and diverse mechanisms underlying the hydra effect. Ecol. Lett. 2009, 12, 462–474. [Google Scholar] [CrossRef]
  44. Jiao, J.; Pilyugin, S.S.; Osenberg, C.W. Random movement of predators can eliminate trophic cascades in marine protected areas. Ecosphere 2016, 7, e01421. [Google Scholar] [CrossRef]
  45. Galor, O. Discrete Dynamical Systems; Springer Science & Business Media: Berlin/Heidelberg, Germany, 2007. [Google Scholar]
  46. Ossimitz, G.; Mrotzek, M. The basics of system dynamics: Discrete vs. continuous modelling of time. In Proceedings of the 26th International Conference of the System Dynamics Society, Athens, Greece, 20–24 July 2008. [Google Scholar]
  47. Person, B.; Sy, F.; Holton, K.; Govert, B.; Liang, A.; Team, S.C.O.; Garza, B.; Gould, D.; Hickson, M.; McDonald, M. Fear and stigma: The epidemic within the SARS outbreak. Emerg. Infect. Dis. 2004, 10, 358. [Google Scholar] [CrossRef] [PubMed]
  48. Napolioni, V.; Murray, D.R.; Comings, D.E.; Peters, W.R.; Gade-Andavolu, R.; MacMurray, J. Interaction between infectious diseases and personality traits: ACP1* C as a potential mediator. Infect. Genet. Evol. 2014, 26, 267–273. [Google Scholar] [CrossRef]
  49. Schaller, M.; Murray, D.R. Pathogens, personality, and culture: Disease prevalence predicts worldwide variability in sociosexuality, extraversion, and openness to experience. J. Personal. Soc. Psychol. 2008, 95, 212. [Google Scholar] [CrossRef]
  50. Roosa, K.; Fefferman, N.H. A general modeling framework for exploring the impact of individual concern and personal protection on vector-borne disease dynamics. Parasites Vectors 2022, 15, 361. [Google Scholar] [CrossRef] [PubMed]
  51. Manrubia, S.; Zanette, D.H. Individual risk-aversion responses tune epidemics to critical transmissibility (R= 1). R. Soc. Open Sci. 2022, 9, 211667. [Google Scholar] [CrossRef]
  52. Wang, B. How to change American attitudes towards the epidemic. Int. J. Front. Sociol. 2020, 2, 139–142. [Google Scholar]
  53. Chakrabarty, D. Community, State and the Body: Epidemics and popular culture in colonial India 1. In Medical Marginality in South Asia; Routledge: Milton Park, UK, 2013; pp. 36–58. [Google Scholar]
  54. Buckee, C.; Noor, A.; Sattenspiel, L. Thinking clearly about social aspects of infectious disease transmission. Nature 2021, 595, 205–213. [Google Scholar] [CrossRef] [PubMed]
  55. Chew, Q.H.; Wei, K.C.; Vasoo, S.; Chua, H.C.; Sim, K. Narrative synthesis of psychological and coping responses towards emerging infectious disease outbreaks in the general population: Practical considerations for the COVID-19 pandemic. Singap. Med. J. 2020, 61, 350. [Google Scholar] [CrossRef] [PubMed]
  56. Ackerman, J.M.; Tybur, J.M.; Blackwell, A.D. What role does pathogen-avoidance psychology play in pandemics? Trends Cogn. Sci. 2021, 25, 177–186. [Google Scholar] [CrossRef]
  57. Weston, D.; Ip, A.; Amlôt, R. Examining the application of behaviour change theories in the context of infectious disease outbreaks and emergency response: A review of reviews. BMC Public Health 2020, 20, 1483. [Google Scholar] [CrossRef]
  58. Bedson, J.; Skrip, L.A.; Pedi, D.; Abramowitz, S.; Carter, S.; Jalloh, M.F.; Funk, S.; Gobat, N.; Giles-Vernick, T.; Chowell, G. A review and agenda for integrated disease models including social and behavioural factors. Nat. Hum. Behav. 2021, 5, 834–846. [Google Scholar] [CrossRef]
  59. Murray, D.R.; Prokosch, M.L.; Airington, Z. PsychoBehavioroimmunology: Connecting the behavioral immune system to its physiological foundations. Front. Psychol. 2019, 10, 200. [Google Scholar] [CrossRef]
  60. Schaller, M.; Park, J.H. The behavioral immune system (and why it matters). Curr. Dir. Psychol. Sci. 2011, 20, 99–103. [Google Scholar] [CrossRef]
  61. Abramowitz, S.A.; Hipgrave, D.B.; Witchard, A.; Heymann, D.L. Lessons from the West Africa Ebola epidemic: A systematic review of epidemiological and social and behavioral science research priorities. J. Infect. Dis. 2018, 218, 1730–1738. [Google Scholar] [CrossRef] [PubMed]
  62. World Health Organization. Operational Guide for Engaging Communities in Contact Tracing, 28 May 2021; World Health Organization: Geneva, Switzerland, 2021. [Google Scholar]
  63. Zelner, J.; Masters, N.B.; Naraharisetti, R.; Mojola, S.A.; Chowkwanyun, M.; Malosh, R. There are no equal opportunity infectors: Epidemiological modelers must rethink our approach to inequality in infection risk. PLoS Comput. Biol. 2022, 18, e1009795. [Google Scholar] [CrossRef] [PubMed]
Figure 1. The dynamics of control effort (A), susceptible (B), infected (C), death (D), total population in humans (E), and total mosquitoes (F) under the three levels of initial fear: θ = 0 (red dashed line), θ = 1 (purple line), and θ = 1.5 (blue line) in the absence of fear decay ( τ = 0 ). The control lasts for 30 days (CD = 30). All other parameters are listed in Table 2.
Mathematics 13 00879 g001
Figure 2. The dynamics of control effort (A), susceptible (B), infected (C), death (D), total population in humans (E), and total mosquitoes (F) with and without fear decay: τ = 0 (purple line; no fear decay), 0.1 (blue line; with fear decay at rate 0.1) when initial fear is at intermediate level ( θ = 1 ) and control duration time is 30 days (CD = 30). The red dashed line shows the scenario without control ( θ = 0 ). All other parameters are listed in Table 2.
Mathematics 13 00879 g002
Figure 3. The relationships between initial fear ( θ ) and total infected human (A), maximum infected human (B), total deaths (C), and control efficacy (D) under the three levels of fear decay ( τ = 0, 0.25, 0.5, plotted in red, purple and blue, respectively). The time window is one year and control lasts for 30 days (CD = 30). All y-axis values are log-transferred. Other parameters are listed in Table 2.
Mathematics 13 00879 g003
Figure 4. The dynamics of the control effort (A,D,G), infected human (B,E,H) and death cases (C,F,I) under the three levels of initial fear, θ = 0.1 (AC), 1 (DF) and 1.5 (GI), and the three levels of control frequency (yearly in red, bimonthly in purple, and daily in blue, corresponding to three levels of fear waxing and waning periods). The control lasts for 30 days after each fear waxing (CD = 30) without decay ( τ = 0 ). All y-axis values are log-transferred. Other parameters are listed in Table 2.
Mathematics 13 00879 g004
Figure 5. The dynamics of control effort (A), infected human (B) and death cases (C) when initial fear is at intermediate level: θ = 1 under the three levels of control frequency (yearly in red, bimonthly in purple, and daily in blue, corresponding to three levels of fear waxing and waning periods) in the absence of fear decay ( τ = 0 ). The control lasts for 30 days after each fear waxing (CD = 30) without decay ( τ = 0 ). All y-axis values are log-transferred. Other parameters are listed in Table 2.
Mathematics 13 00879 g005
Figure 6. The comparison between the dynamics of control effort (A,C) and infected humans (B,D) with and without fear decay ( τ = 0 for (A,B); τ = 1 for (C,D)) when initial fear is at an intermediate level ( θ = 1) under three levels of control frequency (yearly in red, bimonthly in purple, and daily in blue, corresponding to three levels of fear waxing and waning periods). The control duration is set up as 30 days after each fear waxing (CD = 30). All other parameters are listed in Table 2.
Mathematics 13 00879 g006
Table 1. All variables and the corresponding initial values in the model.
VariablesDescriptionInitial Values
N H Total human population size S H + I H + R H
S H Susceptible humans5000
I H Infected humans10
R H Recovered humans0
D H Death cases in humans0
S M Susceptible mosquitoes1000
I M Infected mosquitoes0
C Control on mosquito0
Table 2. All parameters and the corresponding values in the model. Some parameter values were chosen from the incidence and mortality in early Zika outbreaks in South America (based on daily values; see Reference).
ParametersDescriptionValueReference
β H Transmission rate in humans 1.5 × 10 4 [10,38]
β M Transmission rate in mosquitoes 3.0 × 10 4 [10,38]
μ H Natural mortality in humans 6.731886 × 10 5 [39]
μ M Natural mortality in mosquitoes1/13[40]
b H Birth rate in humans 7.04501 × 10 5 [41]
r Recovery rate in humans0.037[38]
δ Composite rate190/3,474,182[41]
η M Egg laying rate for mosquitoes5
θ Initial fear1 or very
τ Fear decay0.1 or vary
ϵ Critical deaths that trigger the control3
CDDays for one control period30 or vary
K Carrying capacity of mosquito3500
Disclaimer/Publisher’s Note: The statements, opinions and data contained in all publications are solely those of the individual author(s) and contributor(s) and not of MDPI and/or the editor(s). MDPI and/or the editor(s) disclaim responsibility for any injury to people or property resulting from any ideas, methods, instructions or products referred to in the content.

