Article

Maximizing Tax Revenue for Profit-Maximizing Monopolist with the CES Production Function and Linear Demand as a Stackelberg Game Problem

Faculty of Economics & Business, University of Zagreb, Trg J. F. Kennedyja 6, 10 000 Zagreb, Croatia
*
Author to whom correspondence should be addressed.
Mathematics 2025, 13(5), 825; https://doi.org/10.3390/math13050825
Submission received: 25 January 2025 / Revised: 22 February 2025 / Accepted: 23 February 2025 / Published: 28 February 2025
(This article belongs to the Section D2: Operations Research and Fuzzy Decision Making)

Abstract

:
The optimization of taxation and profit maximization constitute two fundamental and interconnected problems, inherently entwined as firms navigate within a given tax framework. Nonetheless, existing literature commonly treats these problems separately, focusing either on optimal taxation or on profit maximization independently. This paper endeavors to unify these problems by formulating a bilevel model wherein the government assumes the role of a leader, and the profit-maximizing monopolist acts as a follower. The model assumes technology given by a constant elasticity of substitution (CES) production function, with market prices following a linear demand curve. Since the solution for a general case with an arbitrary degree of homogeneity cannot be determined explicitly, analytical expressions for the tax revenue function, profit function, optimal tax rates, and optimal input levels are derived for scenarios with degrees of homogeneity set to values 0.5 for decreasing and 1 for constant returns to scale. Several illustrative numerical examples are presented alongside corresponding graphical representations. The last example, with a degree of homogeneity set to value 2, shows that the optimal solution is achievable under monopolist assumption even with increasing returns to scale, a scenario impossible under perfect competition. The paper ends with discussions on sensitivity analysis of the change in the optimal solution with regard to the change in the producer’s price.

1. Introduction

Taxation is one of the most critical instruments of any government. Its fundamental role is to finance government expenditure. However, its significance extends beyond mere fiscal provisioning as it also exerts a profound impact on the competitiveness of companies, thereby influencing economic growth, investments, as well as supply and demand dynamics. Consequently, devising an optimal tax policy is of paramount importance to any government.
The task of devising optimal taxation naturally entails a hierarchical structure, with governments making tax decisions, and companies subsequently operating independently within a given tax system, striving to optimize their own objectives. Hence, it is natural to model this problem as a bilevel programming problem. Bilevel programming problems (see for example [1] or [2]) were initially described by von Stackelberg [3,4], with the first mathematical model presented by Bracken and McGill [5,6]. Bilevel models describe problems with hierarchical structures, featuring two players positioned at different levels of hierarchy. The decision-maker at the upper level is referred to as the leader, while the one at the lower level is termed the follower. Decisions are made sequentially, under the assumption of perfect information. The leader acts first, striving to optimize her objective. However, in making her decision, she must anticipate the response of the follower, who, upon receiving the leader’s decision, acts independently to optimize her own objective. Consequently, one of the leader’s optimization problem constraints is the optimization problem of the follower. A parallel programming framework can also be employed to address problems in which a leader’s decision is based on the decisions of multiple followers, as illustrated in [7].
Taxation is a crucial tool of fiscal policy that impacts economic growth, investments, and company competitiveness. Designing tax policy effectively involves understanding tax revenue [8,9]. Numerous studies address optimal taxation. For instance, Tanaka [10] examines optimal commodity taxes under monopolistic competition, breaking them into tax revenue, tax shifting, and product variation parts. Auerbach and Hines [11] analyze optimal taxation in imperfectly competitive private markets. Coto-Martinez et al. [12] explore optimal fiscal policy in imperfectly competitive markets, showing its dependence on market power, specialization returns, and government control over market entry. Reinhorn [13] studies optimal taxation to correct monopolistic distortions in a Dixit–Stiglitz model. Takatsuka [14] examines how unit and ad valorem taxes influence firm location in regions of different sizes. Colciago [15] derives optimal labor and dividend taxation in an oligopolistic competition model. Sachs et al. [16] use a variational approach to study nonlinear tax reforms in general equilibrium. Despite the extensive literature on optimal taxation and long-term profit maximization, these issues are usually treated separately, even though they are naturally related. The aim of this paper is to bridge the gap by examining the relationship between taxation and profit maximization in a perfectly competitive firm within a bilevel programming framework. Given that tax decisions precede corporate operations, the problem has a hierarchical structure, making bilevel programming an appropriate modeling approach.
This paper formulates the problem of devising an optimal tax policy as a bilevel programming problem, with the government acting as the leader. It has to make the tax amount decision with the objective of maximizing tax revenue. The tax is modeled as an amount per unit product. The follower is the monopolist who, upon receiving the tax decision of the leader, chooses the production level that maximizes her profit. The model assumes that production is described by the CES production function and that the market price follows linear demand. This study constitutes an extension of the work by Lukač et al. [17], which addresses a similar problem but with the production technology described by the Cobb-Douglas production function.
The problem of profit-maximizing monopolies is of significant importance and is covered in any intermediate microeconomics textbook (see, for example, Mas-Collel et al. [18]). As for production functions, Avvakumov et al. [19] offer extensive coverage of the properties of both the Cobb-Douglas and CES production functions. The maximization of the tax revenue function is also an important and well-studied problem [8,9]. However, to the best of our knowledge, these two problems were not considered together as a single problem in the context of bilevel programming. Therefore, the main contribution of the paper consists of the formulation of a new bilevel model that establishes a logical connection between the problem of the profit-maximizing monopolist and the optimal taxation problem. In the proposed model, the government acts first as the leader at the top level and makes the tax decision with the objective of maximizing the tax revenue. The government also takes into account that the producer (i.e., monopolist), at the lower level, will act independently, and make a decision which is personally best for her, i.e., given the tax decision of the leader, she will choose the production level which maximizes her profit function. In addition, the paper derives an analytical solution for decreasing and constant returns to scale with assumed values of 0.5 and 1, respectively. Moreover, the numerical solution for the illustrative example with increasing returns to scale set to 2 proves that the solution can exist if we are dealing with monopolist assumption instead of perfect competition.
The paper is organized as follows: after presenting notation in the Section 2, the Section 3 and Section 4 formulate and solve the problem in the case of n 2 inputs. Conclusions are provided in the Section 4.

2. Model

The notation used in this paper is shown in Table 1.
The model is based on several assumptions. Specifically, it assumes that the output quantity q of the monopolist is characterized by the CES production function that incorporates more than two inputs ( n 2 ), such as labor and capital, denoted as x 1 , x 2 , , x n
q = q x 1 , x 2 , , x n = A α 1 x 1 ρ + α 2 x 2 ρ + + α n x n ρ σ ρ .
In the microeconomic literature, for example [18,19,20,21], it is widely acknowledged that the firm’s cost function under CES technology is represented by
c q = ω q 1 / σ ,
where
ω = A 1 σ i = 1 n α i w i ρ 1 1 + ρ 1 + 1 ρ .
Moreover, the conditional input demand functions of the firm under CES technology are given by
x i = q 1 σ α i w i 1 1 + ρ A 1 σ i = 1 n α i w i ρ 1 1 + ρ 1 ρ , i = 1 , 2 , , n .
Additionally, within our model, the monopolist is compensated with price p for the product. Nevertheless, the government imposes a tax amount t per unit of product, thus resulting in the market price paid by buyers for the product being p + t. The market demand has a linear form, formally expressed by the inverse demand function p q = a b q
p + t = a b q p = p q = a t b q ,
where
a t > 0 and a t b q > 0 .
The linear demand curve is a straight line with a negative slope (−b), so it reflects the inverse relationship between price and demand—as demand increases, price decreases, and vice versa.
The leader acts first and makes the decision about the tax per unit product t. However, in doing so, she must consider the response of the follower who, given the tax decision t of the leader, optimizes her own outcome. Therefore, the government’s tax decision influences market supply. Consequently, the leader’s tax revenue function depends on t as well as the output level q, and is expressed by the following formula:
T t , q = t q .
The variable t is controlled by the leader (i.e., government), whereas the variable q is controlled by the follower (i.e., monopolist).
Given tax decision t, the follower maximizes her profit function. Considering that the monopolist receives a price p, from Equations (2) and (5) it follows that her profit function is equal to
Π t , q = p q q c q = a t q b q 2 ω q 1 / σ .
The problem of finding the optimal tax policy for a profit-maximizing monopolist with the CES production function and linear demand function can now be mathematically formulated as the following bilevel programming problem:
max 0 < t < a T t , q = t q
s . t . max q > 0 Π t , q = a t q b q 2 ω q 1 / σ .
The tax decision t made by the leader influences the options accessible to the follower. With the leader’s selection t, the follower operates autonomously and pursues what optimizes her own interests, rather than those of the leader. In other words, the monopolist selects the output level that maximizes her profit.
Another important assumption in this model is the perfect information assumption. Generally, the perfect information assumption means that all participants have complete knowledge about all factors that influence economic decisions, such as prices, product quality, market conditions, regulators, etc. In this model, perfect information means that the government knows, for every tax decision t, what the monopolist will do—which output level q she would choose. In other words, the government knows the monopolist’s profit function.

3. Results

To address the bilevel programming problems (9) and (10), the initial step involves solving the follower’s problem for an arbitrary, yet fixed tax amount t, thus acquiring the optimal output level as a function of t. Once the optimal decision of the follower is determined for any given value of t, the leader’s problem can be solved.
Let us first analyze and discuss the solution to the given bilevel programming problems (9) and (10). In the following subsection, we will present solutions for some special cases, since the general explicit solution cannot be found in general. After that, we will comment on some sensitivity analyses of the obtained results.

3.1. On the Explicit Closed-Form Solution and Some Special Cases

In the same way as in [17], we first address the stationary point of the follower’s problem (10).
Theorem 1.
The stationary point of the follower’s problem (10) for an arbitrary but fixed tax amount t is defined implicitly as the solution of the equation
( a t ) 2 b q = ω σ q 1 σ 1 ,
where condition
( a t ) 2 b q > 0 q 0 , a t 2 b
must be satisfied.
Proof. 
Let tax amount t per unit product be arbitrary but fixed. For a given t, from the first-order condition on the follower’s optimization problem given in the form (10), the following equation is obtained
Π q t , q = ( a t ) 2 b q ω σ q 1 σ 1 = 0 ,
from where Equation (11) follows directly if we put ω σ q 1 σ 1 on the right-hand side. Since the expression ω σ q 1 σ 1 on the right-hand side of the Equation (11) is positive because it is the product of positive expressions σ > 0 , ω > 0 and q 1 σ 1 > 0 , and because of economic reasons too, the left-hand side of Equation (11) must be positive too, i.e., ( a t ) 2 b q > 0 ( a t ) > 2 b q q < a t 2 b and condition (12) must hold. □
Clearly, the precise analytical closed-form expression for the stationary point of the follower’s problem (10) cannot be determined for an arbitrary degree of homogeneity σ > 0 . Instead, it is derived by solving Equation (11) with a specified value of σ .
After determining the solution to the follower’s problem for a selected, yet fixed tax amount t, the leader’s optimization problem can be addressed. We will exemplify the solution of the problems (9) and (10) through the following numerical cases.
Corollary 1
(Constant returns of scale, σ = 1 ). For the constant returns of scale σ = 1 bilevel programming problems (9) and (10) become
max 0 < t < a T t , q = t q
s . t . max q > 0 Π t , q = a ω t q b q 2 .
The optimal solution to the problems (14) and (15) is given by
t = a ω 2 ,
q = a ω 4 b ,
where t  and q  are the optimal leader’s and follower’s decisions, respectively. The optimal leader’s tax is equal to
T = a ω 2 8 b ,
while the optimal follower’s profit and input levels are, respectively, equal to
Π = a ω 2 16 b ,
x i = α i w i 1 1 + ρ a ω 4 b A 1 i = 1 n α i w i ρ 1 1 + ρ 1 / ρ ,   i = 1 , 2 , , n .
Proof. 
For σ = 1 Equation (13) becomes
a t ω 2 b q = 0 ,
which implies
q = a t ω 2 b .
Note that q > 0 and b > 0 together with (22) imply the following condition:
a t ω > 0 t 0 , a ω .
Furthermore, since b > 0 and 2 b < 0 , and
Π q q t , q = q a t ω 2 b q = 2 b < 0 ,
the follower’s profit function is concave overall its domain in q and the maximum profit is achieved. By substituting (22) q = a t ω 2 b with (14) T t , q = t q we have
T t , a ω t 2 b = t 2 2 b + a ω 2 b t .
It is easy to see that the maximum of the function (25) equals (18) and that it is obtained for (16). Indeed, T t = t b + a ω 2 b and T t = 0 for t = a ω 2 , as stated in (18). Since T t t = 1 b < 0 the leader’s tax function is concave overall, its domain in t and the maximum tax is achieved.
That is, the optimal leader’s tax is equal to (18) and it is achieved at level (16). Now, substituting (16) into (22) we obtain (17). Finally, by substituting (16) and (17) into (15), we obtain (19). Furthermore, for constant returns to scale σ = 1 , from (17) and (4) follows (20).
Finally, from (16) and (17) it is easy to check that inequality q < a t / 2 b holds, which verifies (12). Indeed, if we insert t = a ω 2 and q = a ω 4 b into q < a t / 2 b , we obtain a ω 4 b < a a ω 2 / 2 b a ω 4 b < a + ω 4 b a ω < a + ω ω < ω 2 ω > 0 .
This proves the theorem. □
Example 1.
Constant returns of scale:  σ = 1 .
Let the number of inputs be n = 2 . Let the input prices be w 1 = 8 and w 2 = 5 respectively, let the coefficients of the demand function be a = 50 and b = 80 , respectively, and let the allocation coefficients of the CES production function be α 1 = 0.4 and α 2 = 0.6 , respectively. Furthermore, let the scale of production be A = 1 , the degree of homogeneity of the CES production function be σ = 1 and the substitution coefficient of the CES production function be ρ = 2 .
Note that the sum of the allocation coefficients of the CES production function equals 1, i.e., α 1 + α 2 = 0.4 + 0.6 = 1 .
The production function (1) is given by
q = q x 1 , x 2 = 0.4 x 1 2 + 0.6 x 2 2 1 2 .
Also note that according to (3)
ω = 0.4 8 2 1 1 + 2 + 0.6 5 2 1 1 + 2 1 + 1 2 = 12.595 .
Since for σ = 1
Π t , q = a ω t q b q 2 = 37.405 t q 80 q 2 ,
problems (14) and (15), i.e., (9) and (10) can now be stated as the following bilevel programming problem:
max 0 < t < a T t , q = t q
s . t . max q > 0 Π t , q = 37.405 t q 80 q 2 .
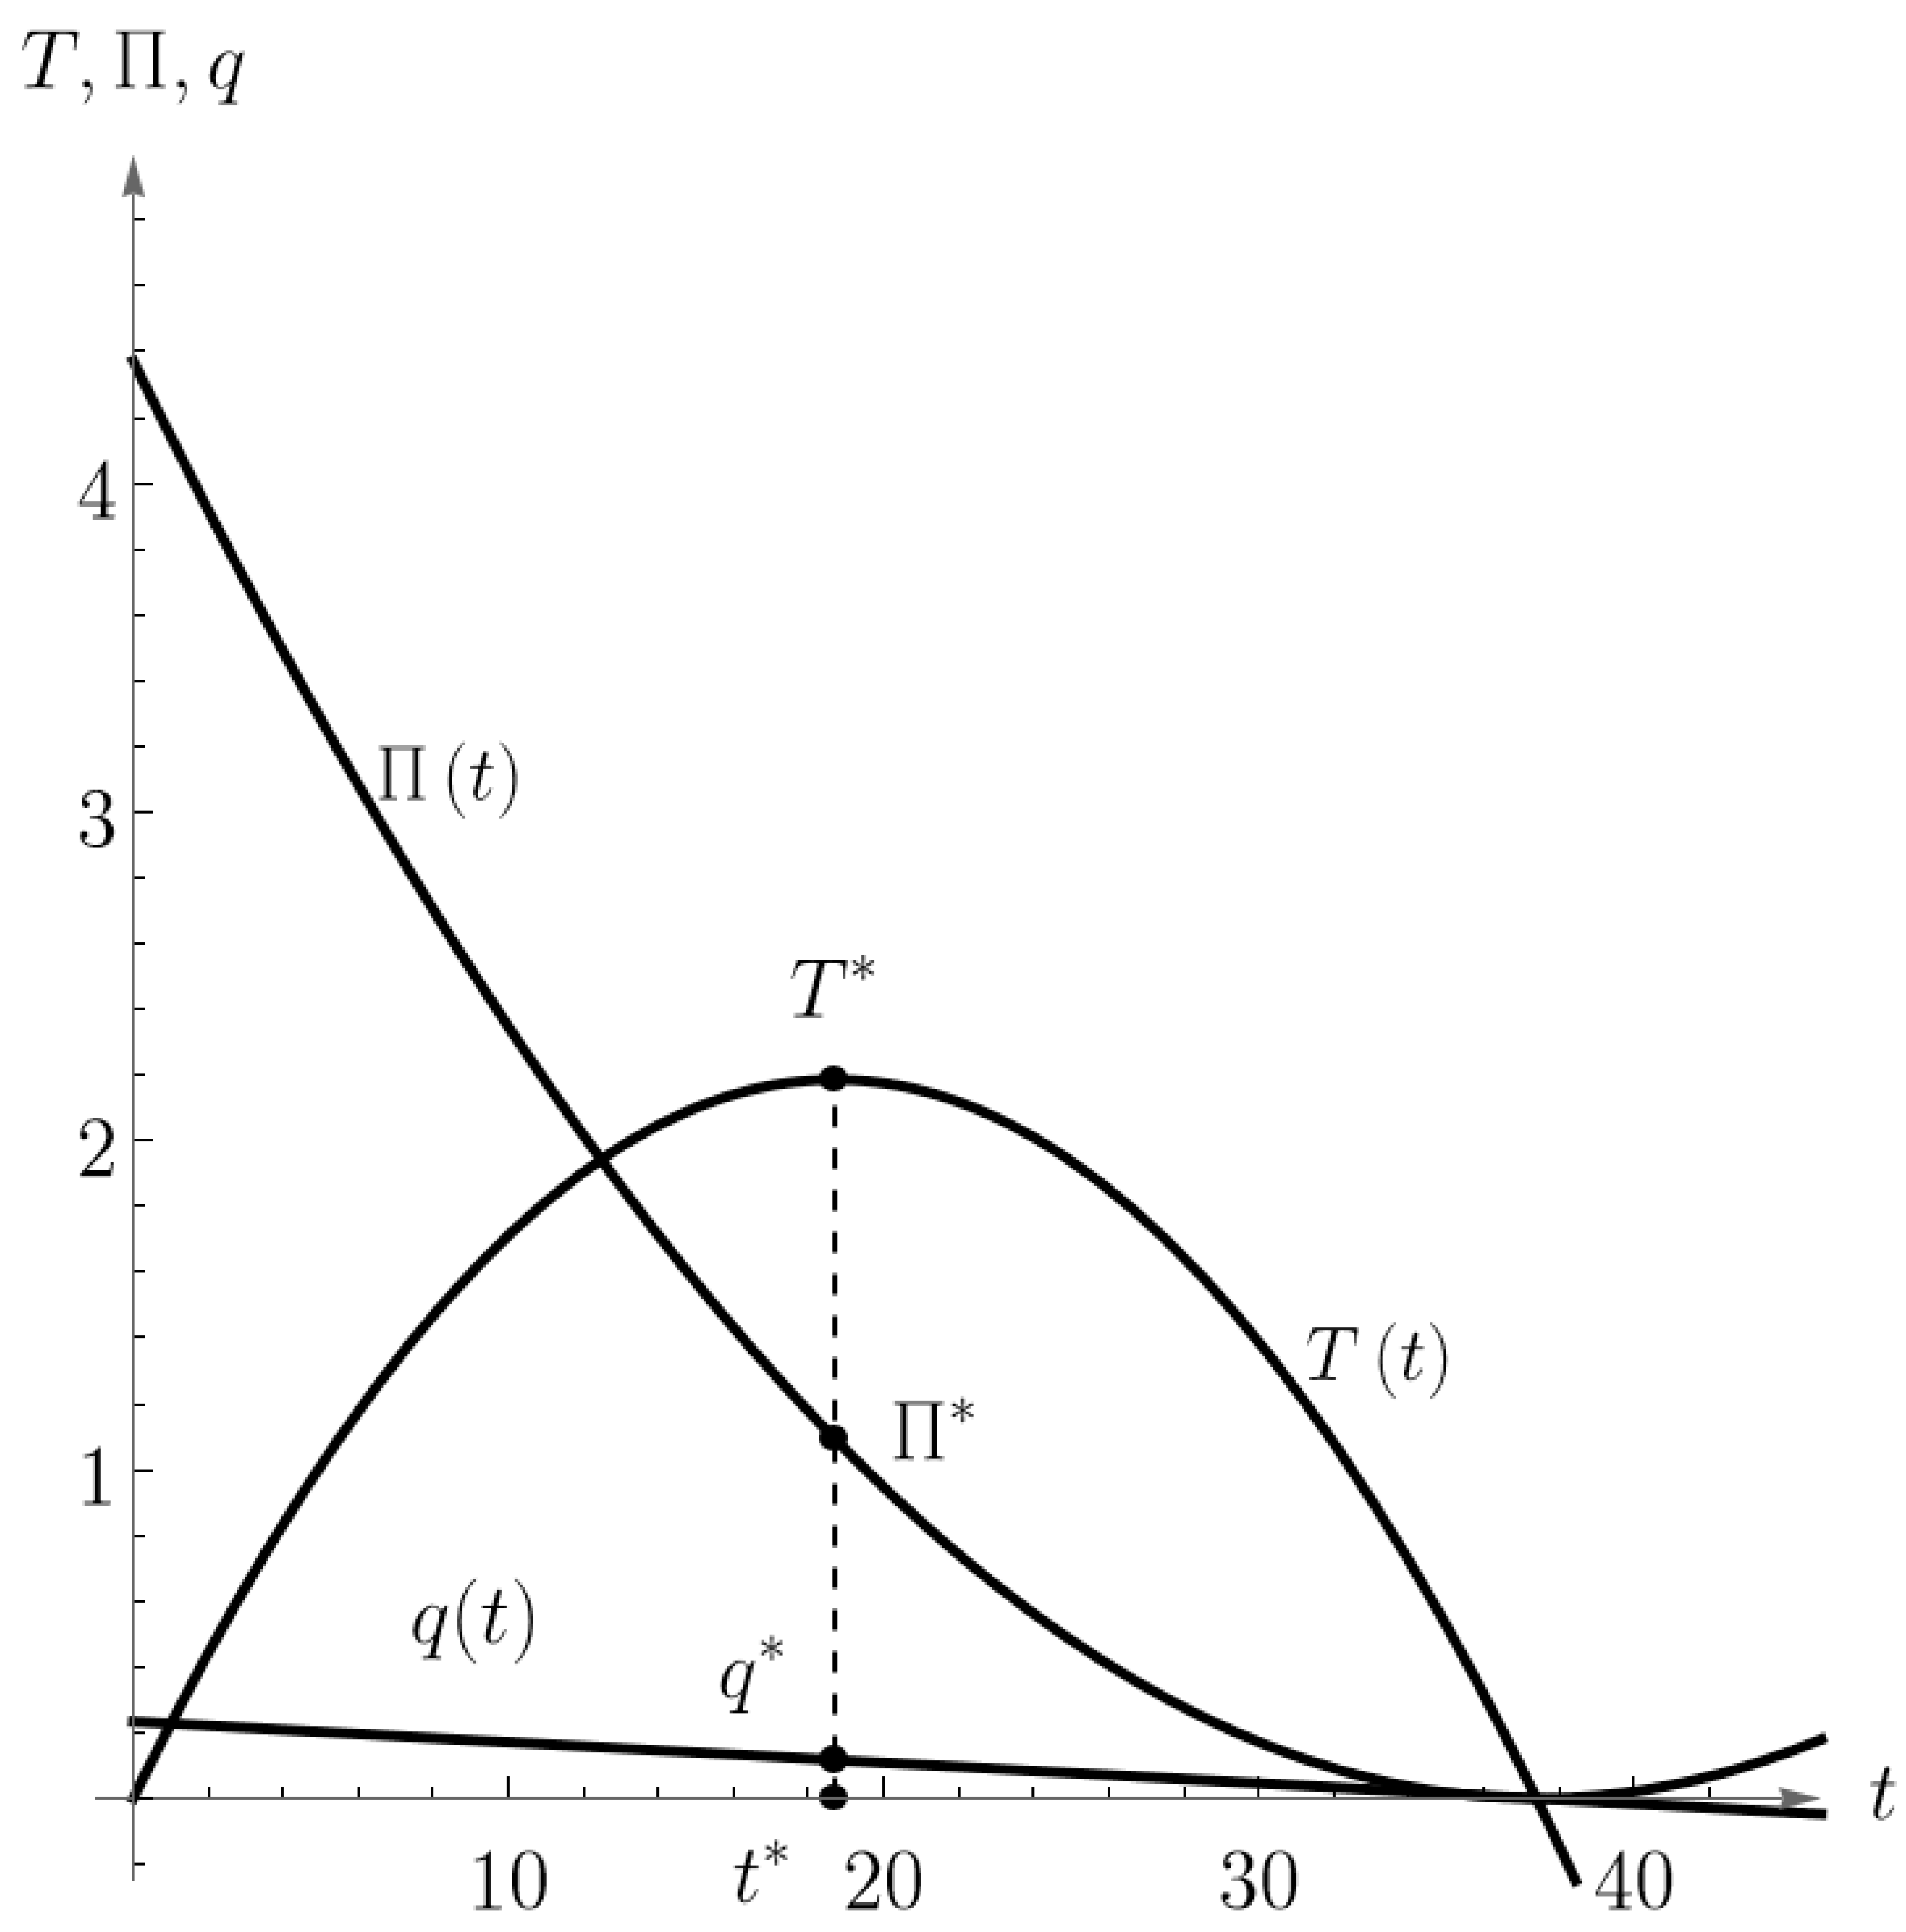
The optimal solutions t and q of the problems (29) and (30) is given by Formulas (16) and (17), i.e., t = a ω 2 = 50 12.595 2 = 18.702 , q = a ω 4 b = 50 12.595 4 80 = 0.117 , while the optimal leader’s tax and the optimal follower’s profit is given by Formulas (18) and (19), i.e., T = a ω 2 8 b = 80 12.595 2 8 80 = 2.186 , Π = a ω 2 16 b = 50 12.595 2 16 80 = 1.093 .
Although the optimal solution and the optimal values of the problems (29) and (30) are already given by Formulas (16) and (19), let us consider and solve the problems (29) and (30) following the steps from Corollary 1 and let us look at the graphical representation of the problem.
First, we solve the follower’s problem (30) for a given but fixed tax amount t . From the first-order conditions on (31)
Π q t , q = ( 37.405 t ) 160 q = 0 ,
we obtain the optimal output level
q ( t ) = 37.405 t 160 .
Furthermore, since Π q q t , q = 160 < 0 , the follower’s profit function is concave; overall, its domain in q and the maximum profit is achieved.
By substituting q ( t ) = 37.405 t 160 into the leader’s optimization problem (29) max 0 < t < a T t , q = t q we obtain the following tax revenue function of only tax amount t :
T t , 37.405 t 160 = t 2 + 37.405 t 160 .
The maximum of the leader’s tax revenue function T ( t ) is obtained for T ( t ) = 2 t + 37.405 = 0 because T ( t ) = 2 < 0 . It is easy to see that t = 18.702 and T = 2.186 .
Furthermore, the optimal output level
q ( t ) = 37.405 t 160 = 37.405 18.702 160 = 0.117 .
Finally, by substituting t = 18.702 and q = 0.117 back into the follower’s profit function, we obtain the optimal follower’s profit
Π t , q = 37.405 t q 80 ( q ) 2 = 1.093 .
Figure 1 and Figure 2 show 2D and 3D graphical representations of the optimal solution t = 18.702 and q = 0.117 (black points) and optimal value T = 2.186 and Π = 1.093 of the bilevel problems (30) and (31) from Example 1. The pink-colored surface in Figure 2 represents the leader’s T t , q = t q function. Purple-colored surface represents the follower’s Π t , q = 37.405 t q 80 q 2 function. Green-colored vertical plane is the first-order condition Π q t , q = ( 37.405 t ) 160 q = 0 plane. If we express q ( t ) = 37.405 t 160 from the first-order condition, we will obtain T t and Π t functions just like in Figure 1.
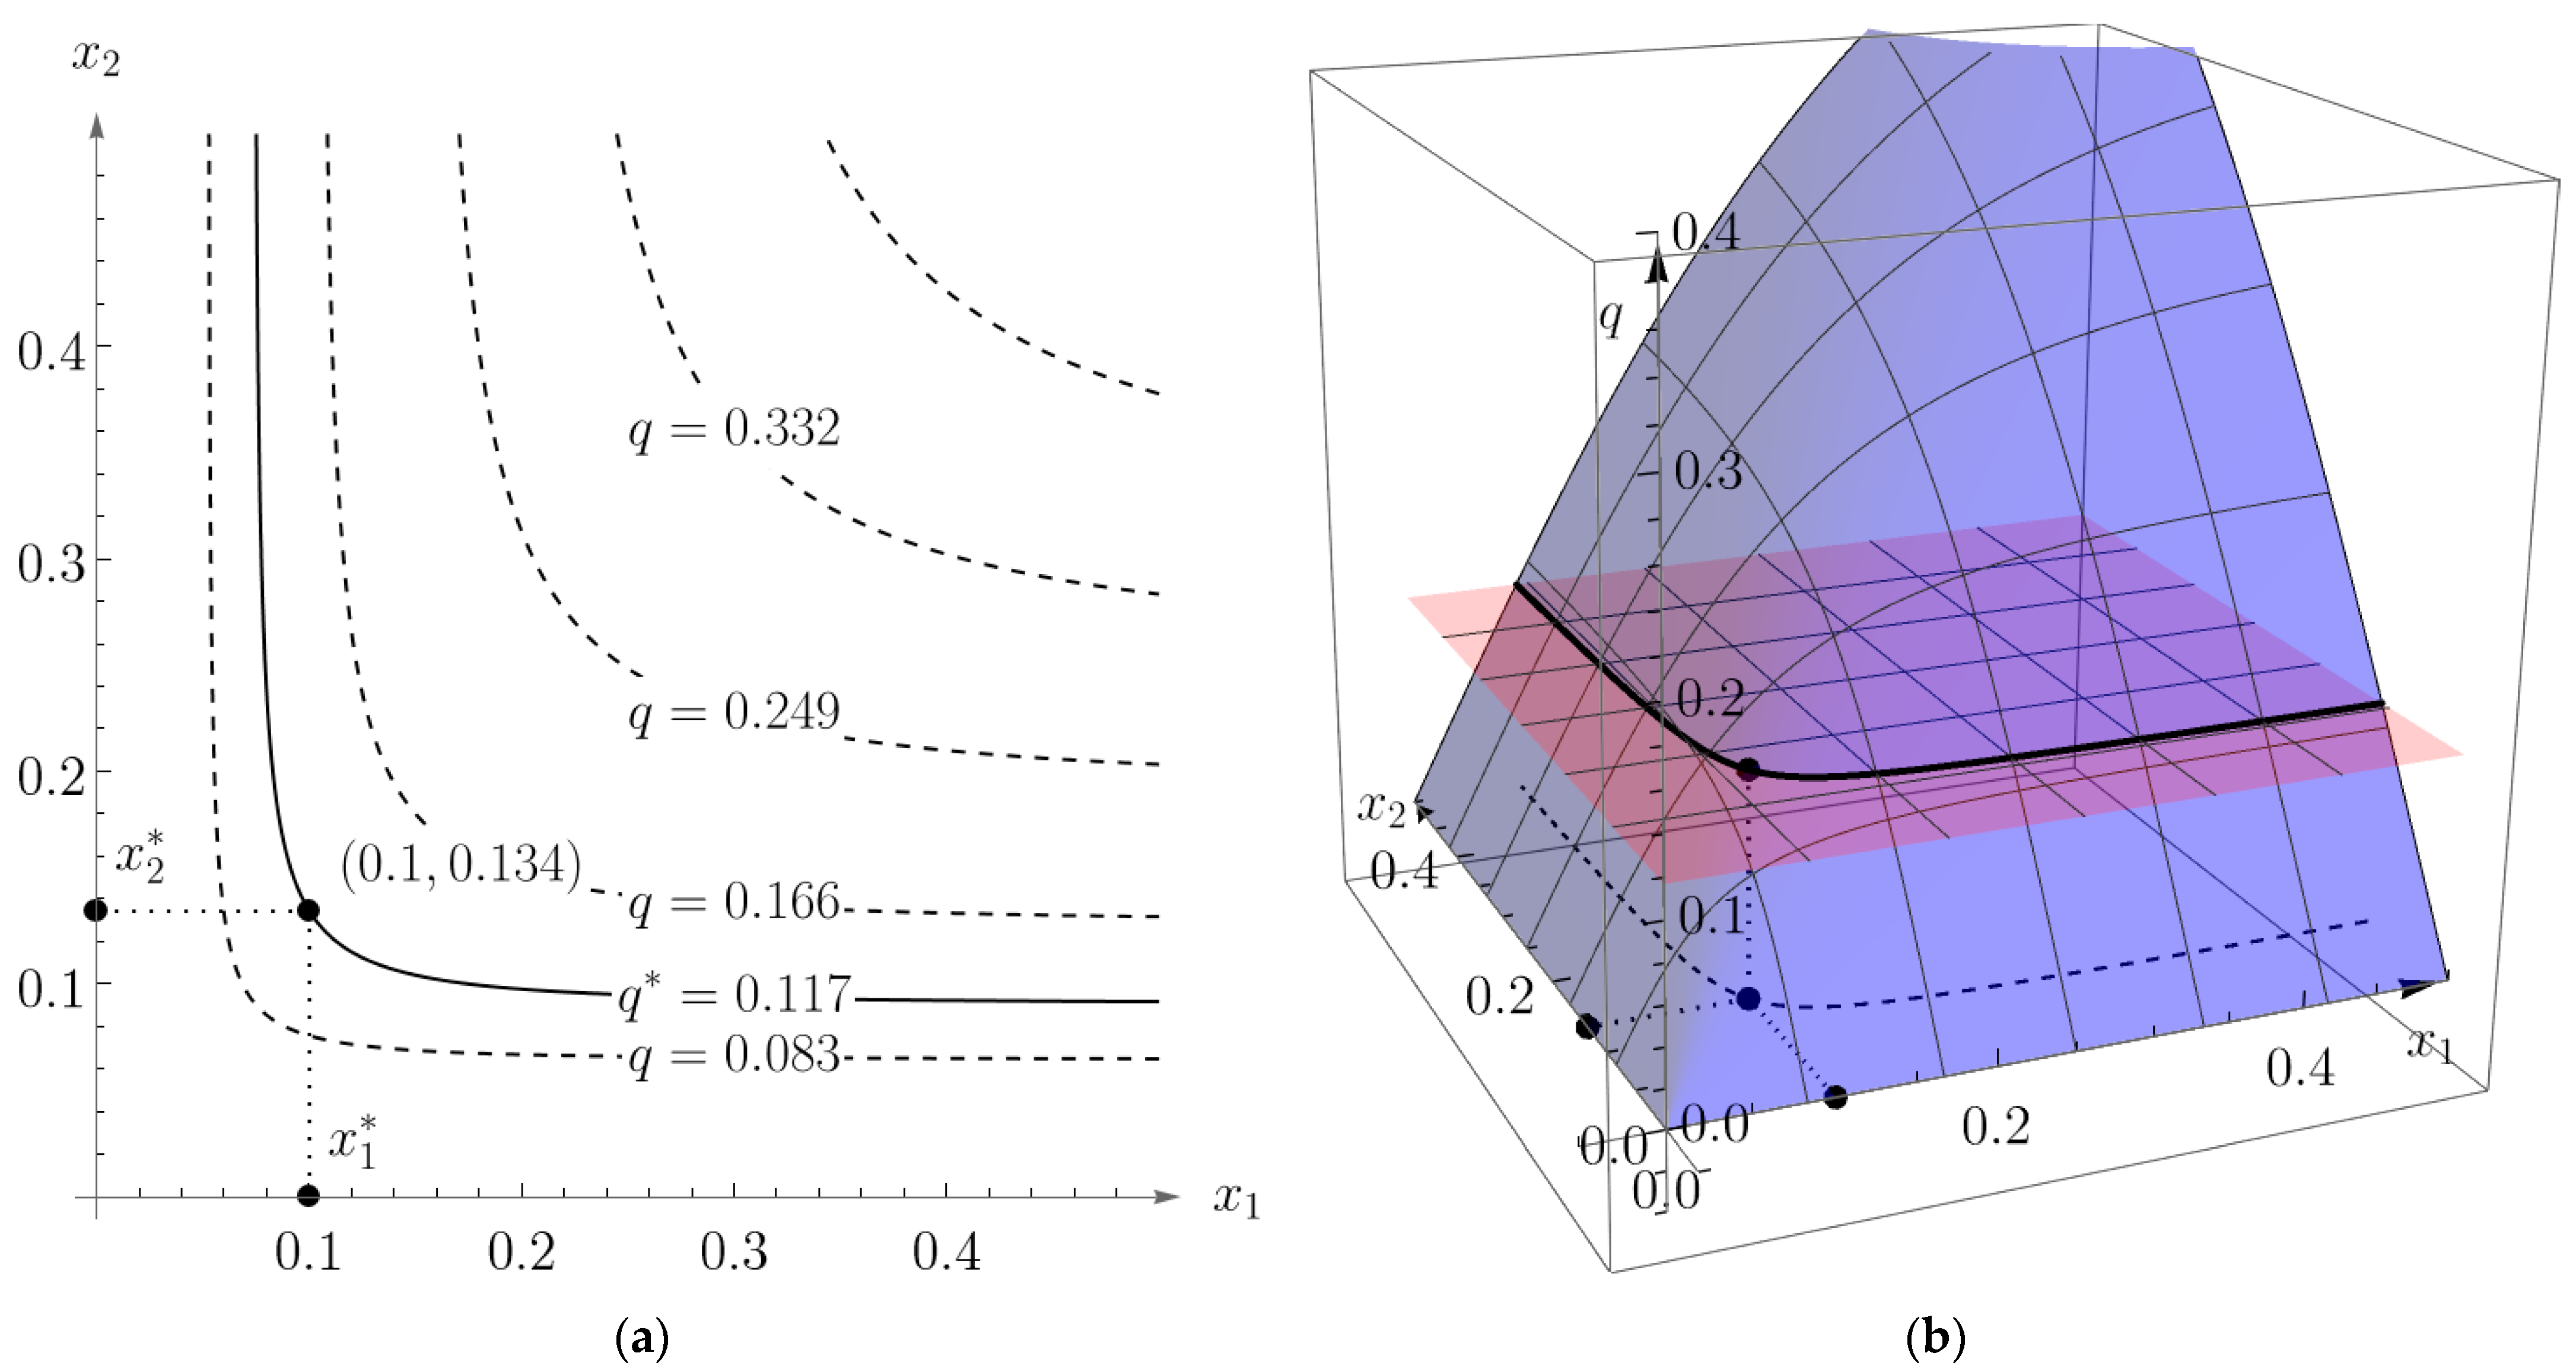
Furthermore, for constant returns to scale σ = 1 , from the optimal output level q = 0.117 and (4) follows the optimal inputs (labor and capital) levels
x 1 = 0.117 1 1 0.4 8 1 1 + 2 0.4 8 2 1 1 + 2 + 0.6 5 2 1 1 + 2 1 2 = 0.100
and
x 2 = 0.117 1 1 0.6 5 1 1 + 2 0.4 8 2 1 1 + 2 + 0.6 5 2 1 1 + 2 1 2 = 0.134 .
Graphical representations of the optimal capital and labor levels x 1 = 0.100 and x 2 = 0.134 (black points) for the bilevel problems (29) and (30) are given in Figure 3. The red horizontal plane in Figure 3b is q = q = 0.117 plane and the blue surface is the CES production function q = q x 1 , x 2 = 0.4 x 1 2 + 0.6 x 2 2 1 2 . A black solid curve represents the intersection of the red and blue surfaces. The black dotted curve is the projection of the intersection to x 1 , x 2 plane. Figure 3a shows the level curves of the CES production function.
Corollary 2
(Decreasing returns of scale, σ = 0.5 ). For the decreasing returns of scale σ = 0.5  bilevel programming problems (9) and (10) becomes
max 0 < t < a T t , q = t q
s . t . max q > 0 Π t , q = b + ω q 2 + a t q .
The optimal solution to the problems (14) and (15) is given by
t = a 2 ,
q = a 4 b + ω ,
where   t   and   q   are the optimal leader’s and follower’s decisions, respectively. The optimal leader’s tax is equal to
T = a 2 8 b + ω ,
while the optimal follower’s profit and input levels are, respectively, equal to
Π = a 2 16 b + ω ,
x i = α i w i 1 1 + ρ a 4 b + ω 2 A 2 i = 1 n α i w i ρ 1 1 + ρ 1 / ρ ,   i = 1 , 2 , , n .
Proof. 
For σ = 0.5 Equation (13) becomes
a t 2 b + ω q = 0 ,
which implies
q = a t 2 b + ω .
Note that (33) implies the following condition:
a t > 0 t 0 , a .
Furthermore, since
Π q q t , q = q a t 2 b + ω q = 2 b + ω < 0 ,
the follower’s profit function is concave overall its domain in q and the maximum profit is achieved. By substituting (46) with (38) we have
T t , a t 2 b + ω = 1 2 b + ω t 2 + a t .
It is easy to see that the maximum of the function (49) equals (42) and that it is obtained for (40). That is, the optimal leader’s tax is equal to (36) and it is achieved at level (40). Now, substituting (40) into (46) we obtain (41). Finally, by substituting (40) and (41) into (39), we obtain (43). Furthermore, for decreasing returns to scale σ = 0.5 , from (41) and (4) follows (44). Finally, from (40) and (41) it is easy to check that inequality q < a t / 2 b holds, which verifies (12). This proves the corollary. □
Example 2.
Decreasing returns of scale:  σ = 0.5 .
Let us consider the example similar to Example 1, but with the degree of homogeneity of the CES production function set to σ = 0.5 instead of 1. The number of inputs is again n = 2 , the input prices w 1 = 8 and w 2 = 5 , respectively, the coefficients of the demand function a = 50 and b = 80 , respectively, the allocation coefficients of the CES production function α 1 = 0.4 and α 2 = 0.6 , respectively, the scale of production A = 1 and the substitution coefficient of the CES production function ρ = 2 .
The production function (1) is given by
q = q x 1 , x 2 = 0.4 x 1 2 + 0.6 x 2 2 0.5 2 = 0.4 x 1 2 + 0.6 x 2 2 1 4 .
Note that according to (3) ω again has the same value ω = 12.595 .
Since for σ = 0.5
Π t , q = b + ω q 2 + a t q = 50 t q 92.595 q 2 .
problems (38) and (39), i.e., (9) and (10) can now be stated as the following bilevel programming problem:
max 0 < t < a T t , q = t q
s . t . max q > 0 Π t , q = 50 t q 92.595 q 2 .
The optimal solution t and q of the problems (52) and (53) are given by Formulas (40) and (41), i.e., t = a 2 = 50 2 = 25 , q = a 4 b + ω = 50 4 80 + 12.595 = 0.135 , while the optimal leader’s tax according to (42) is given by T = a 2 8 b + ω = 50 2 8 80 + 12.595 = 3.375 and the optimal follower’s profit according to Formula (43) is given by Π = a 2 16 b + ω = 50 2 16 80 + 12.595 = 1.687 .
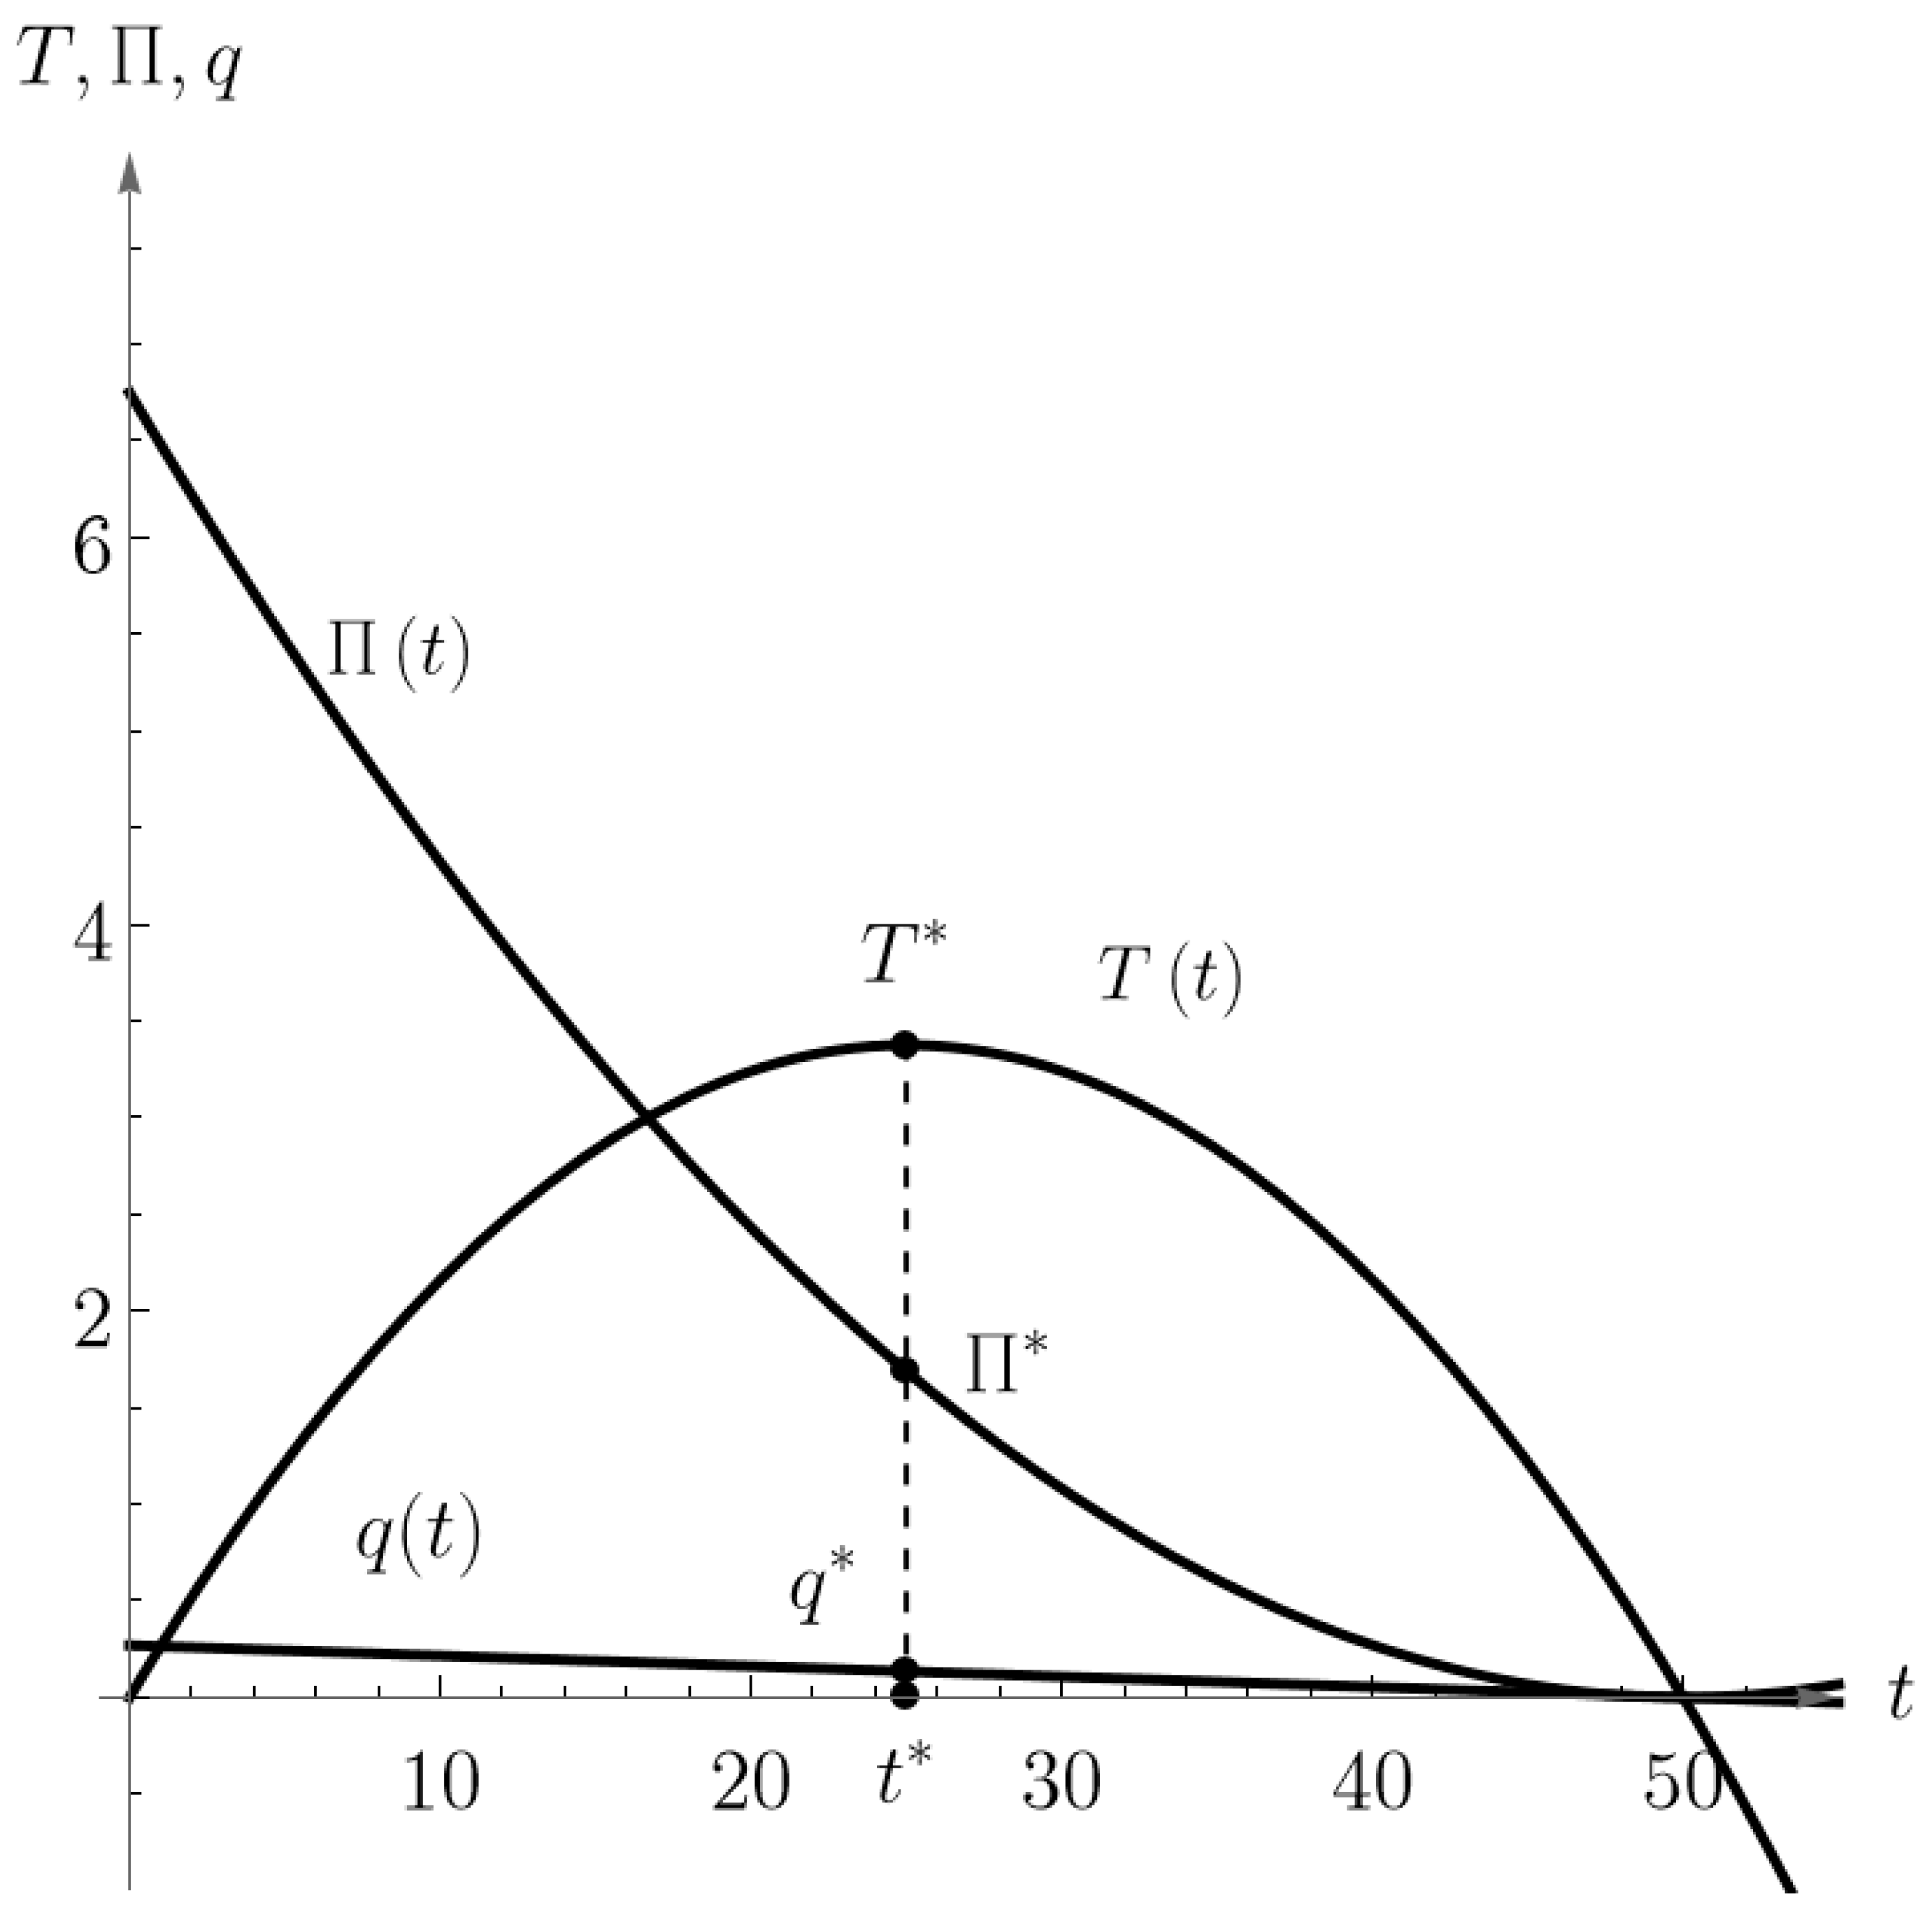
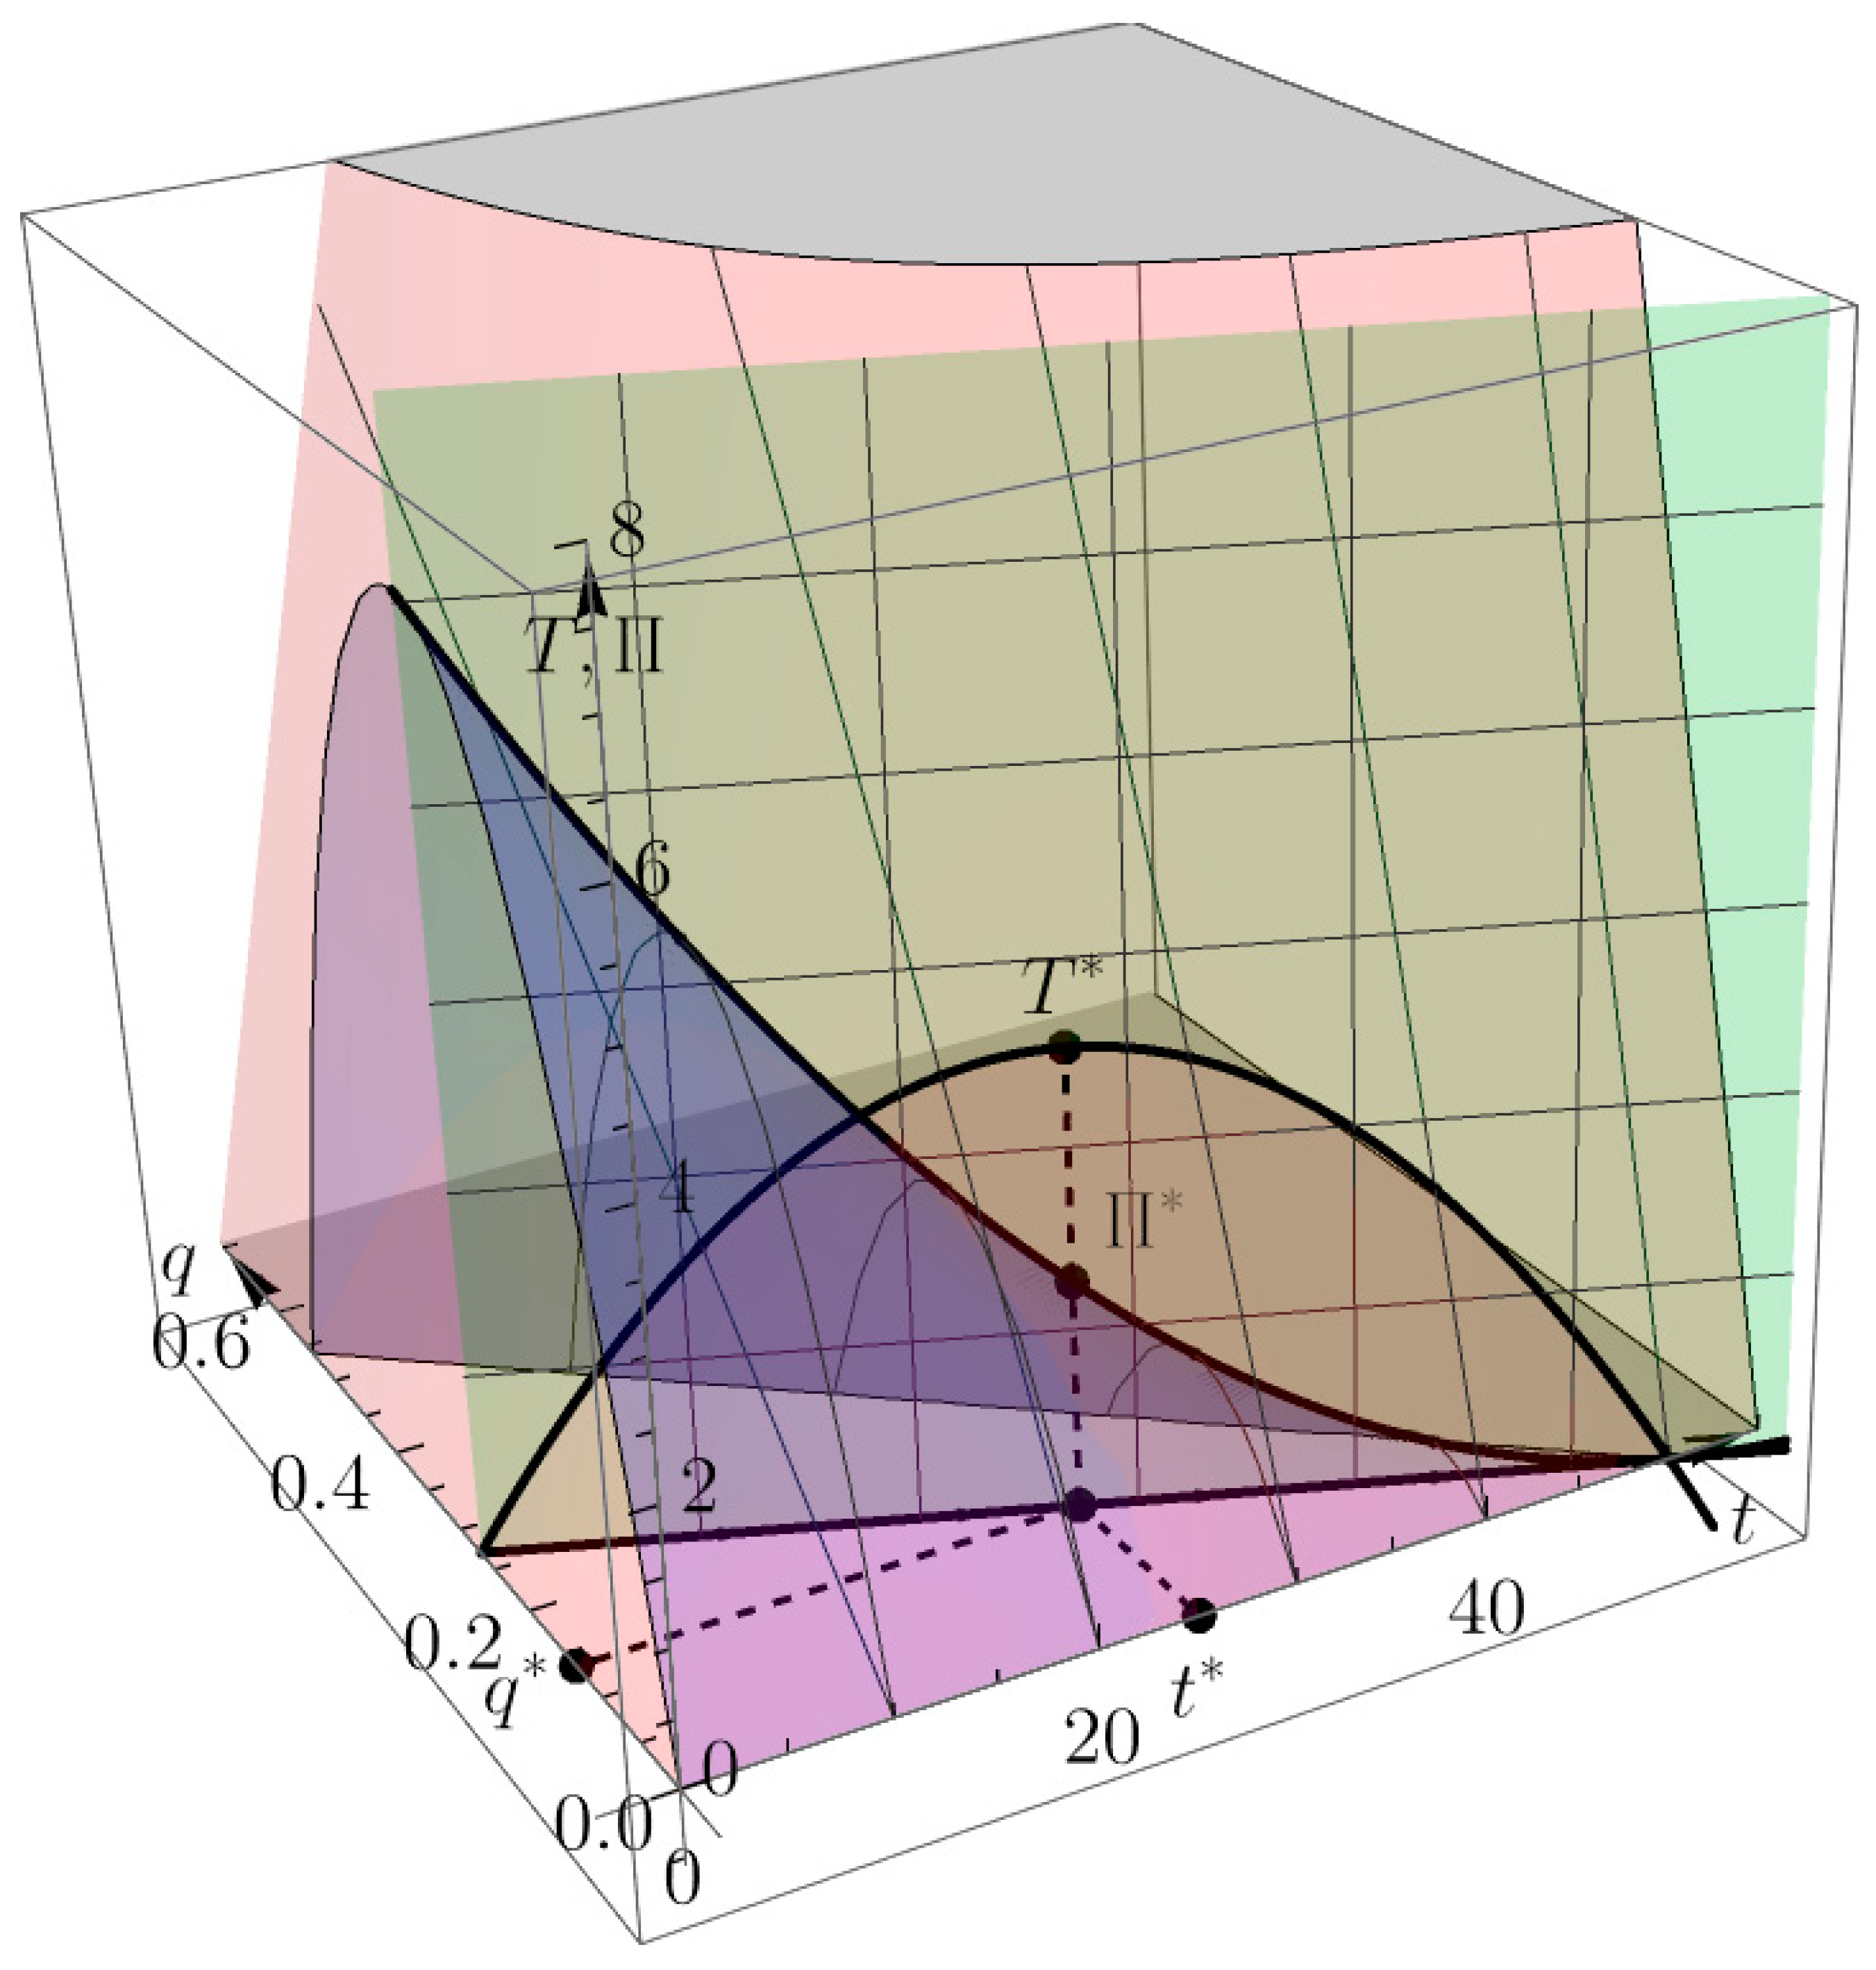
Although the optimal solution and the optimal values of the problems (52) and (53) are already given by Formulas (40) and (43), let us consider and solve the problems (52) and (53) following the steps from Corollary 2 and let us look at the graphical representation of the problem given in Figure 4, Figure 5 and Figure 6.
First, we solve the follower’s problem (53) for a given but fixed tax amount t. From the first-order conditions on (53)
Π q t , q = ( 50 t ) 185.191 q = 0 ,
we obtain the optimal output level
q ( t ) = 50 t 185.191 .
Furthermore, since Π q q t , q = 185.191 < 0 , the follower’s profit function is concave overall with its domain in q and the maximum profit is achieved.
By substituting q ( t ) = 50 t 185.191 into the leader’s optimization problem (52) max 0 < t < a T t , q = t q we obtain the following tax revenue function of only tax amount t :
T t , 50 t 185.191 = t 2 + 50 t 185.191 .
The maximum of the leader’s tax revenue function T ( t ) is obtained for T ( t ) = 2 t + 50 = 0 because T ( t ) = 2 < 0 . It is easy to see that t = 25 and T = 3.375 .
Furthermore, the optimal output level
q ( t ) = 50 t 185.191 = 50 25 185.191 = 0.135 .
Finally, by substituting t = 25 and q = 0.135 back into the follower’s profit function, we obtain the optimal follower’s profit
Π t , q = 50 t q 92.595 ( q ) 2 = 1.687 .
Figure 4 and Figure 5 show 2D and 3D graphical representations of the optimal solution t = 25 and q = 0.135 (black points) and optimal value T = 3.375 and Π = 1.687 of the bilevel problems (52) and(53) from Example 2. The pink-colored surface in Figure 5 represents the leader’s T t , q = t q function. Purple-colored surface represents the follower’s Π t , q = 50 t q 92.595 q 2 function. The green-colored vertical plane is the first-order condition Π q t , q = ( 50 t ) 185.191 q = 0 plane. If we express q ( t ) = 50 t 185.191 from the first-order condition, we will obtain T t and Π t functions just like in Figure 4.
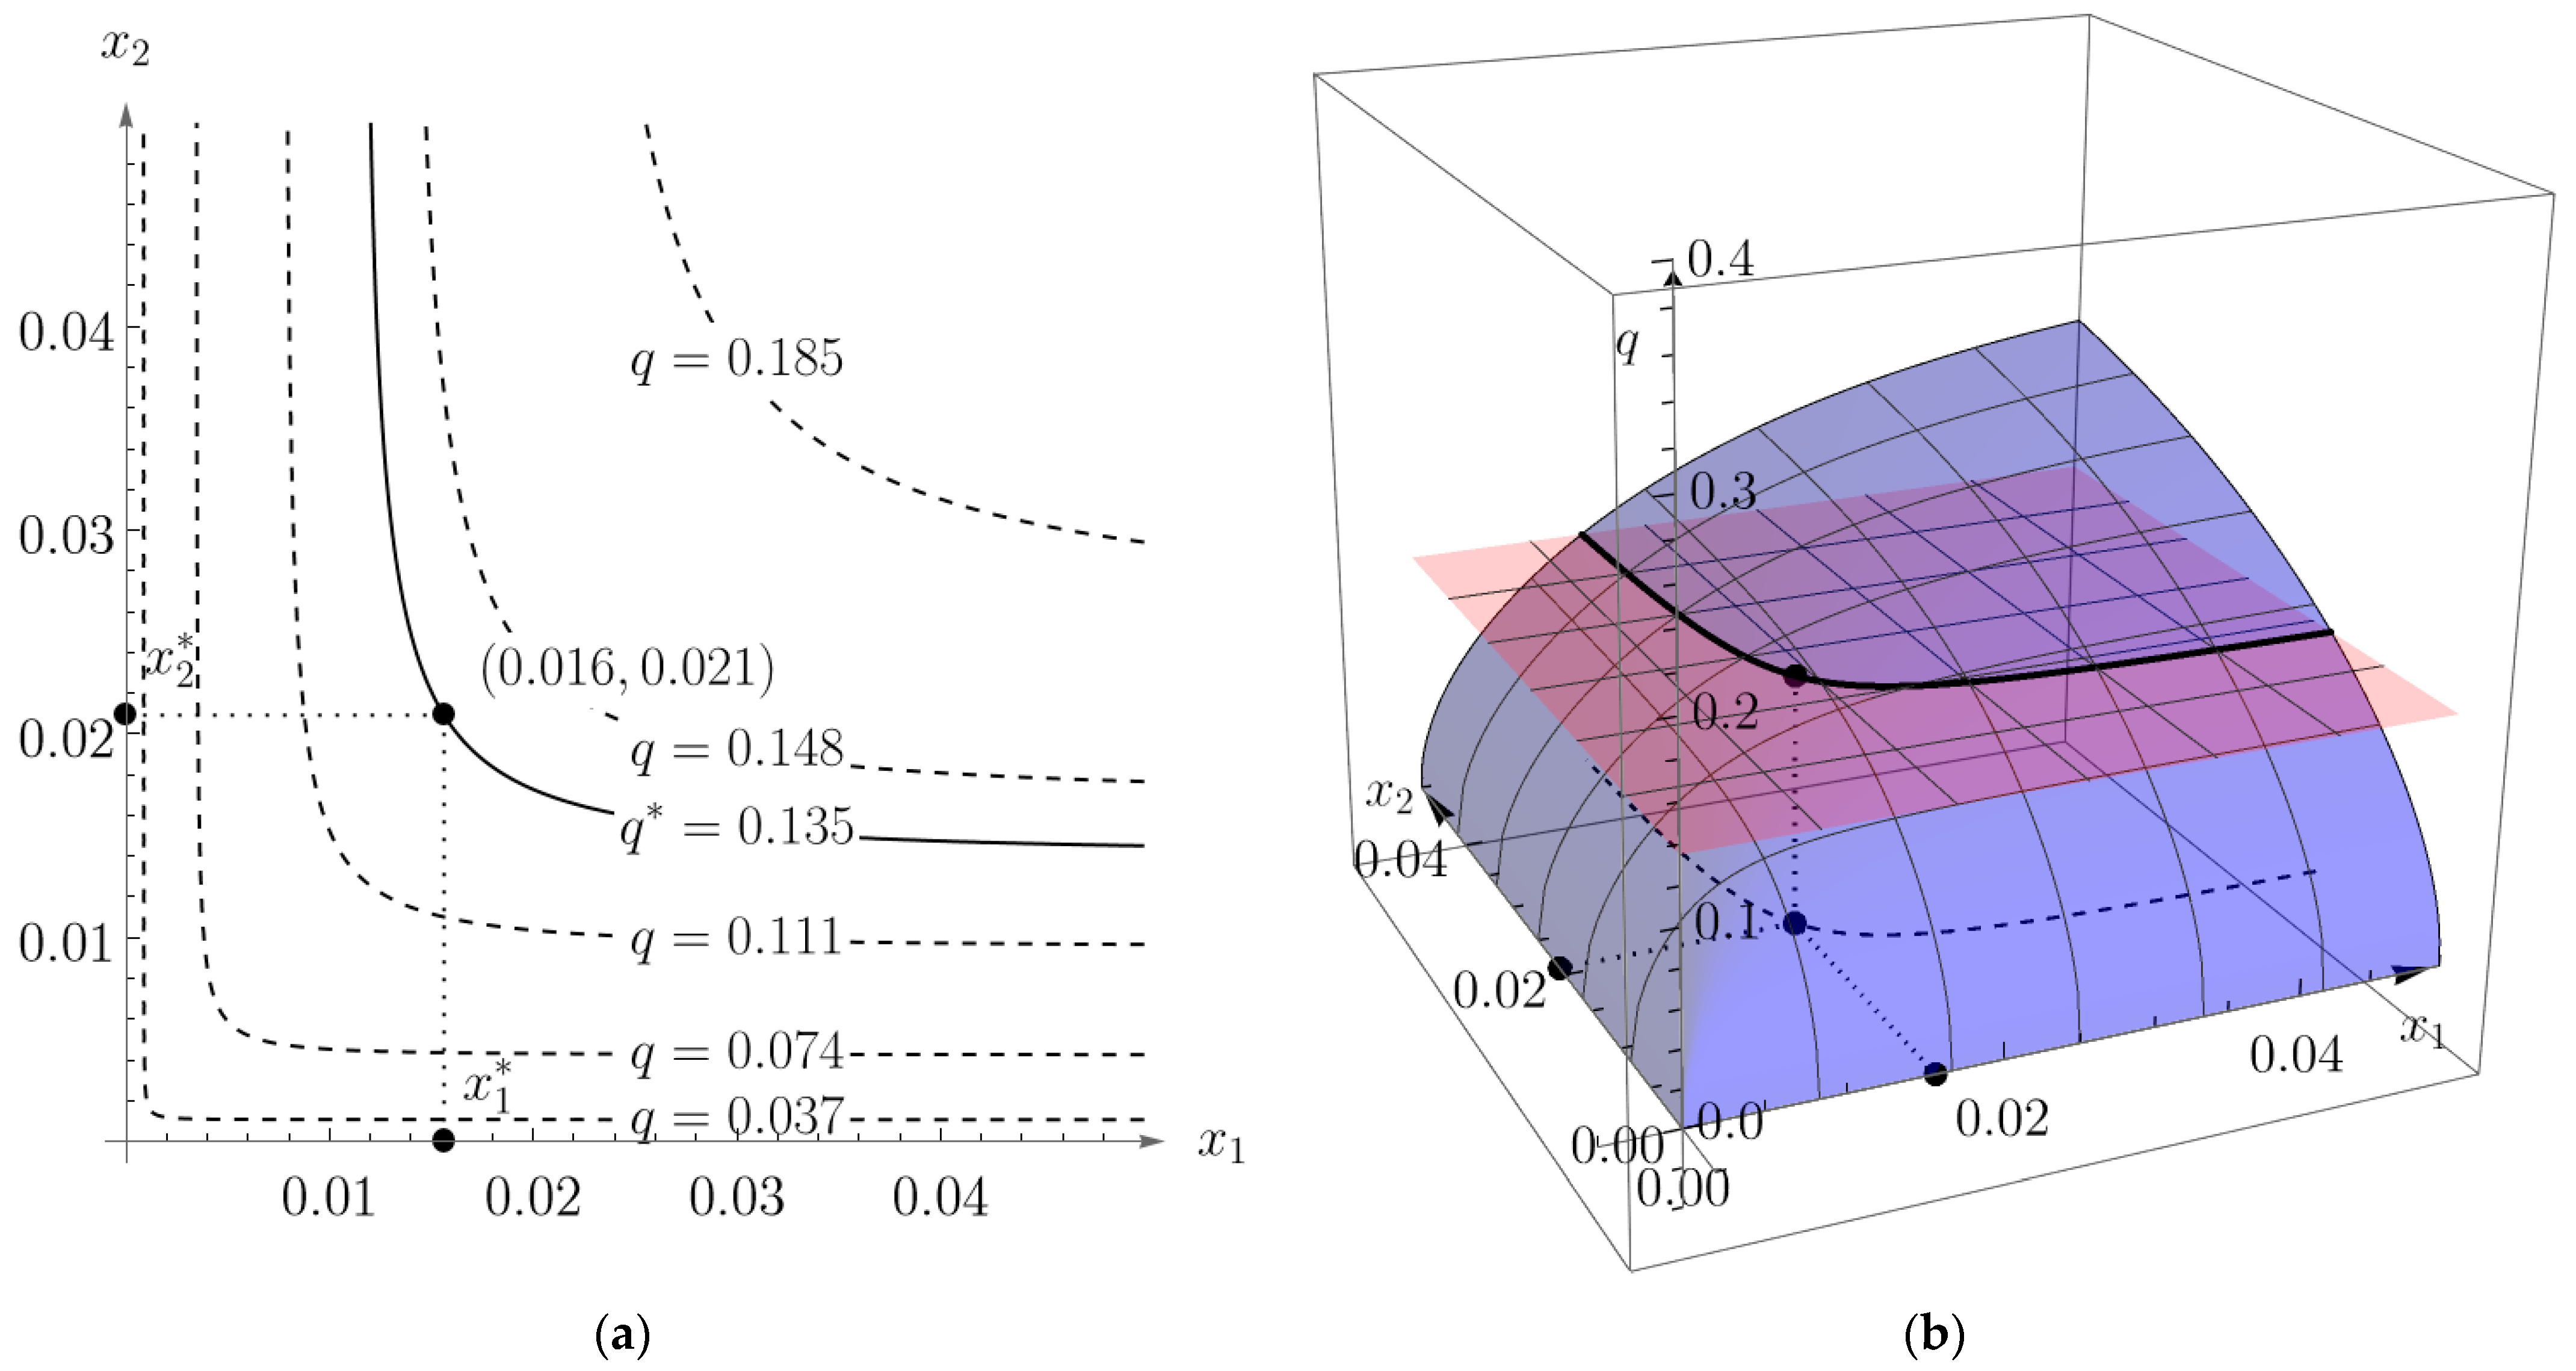
Furthermore, for decreasing returns to scale σ = 0.5 , from the optimal output level q = 0.135 and (4) follows the optimal inputs (labor and capital) levels
x 1 = 0.135 1 0.5 0.4 8 1 1 + 2 0.4 8 2 1 1 + 2 + 0.6 5 2 1 1 + 2 1 2 = 0.016
and
x 2 = 0.135 1 0.5 0.6 5 1 1 + 2 0.4 8 2 1 1 + 2 + 0.6 5 2 1 1 + 2 1 2 = 0.021 .
Graphical representations of the optimal capital and labor levels x 1 = 0.016 and x 2 = 0.021 (black points) for the bilevel problems (52) and (53) are given in Figure 6. The red horizontal plane in Figure 6b is q = q = 0.135 plane and the blue surface is the CES production function q = q x 1 , x 2 = 0.4 x 1 2 + 0.6 x 2 2 1 4 . Black solid curve represents the intersection of the red and blue surfaces. The black dotted curve is the projection of the intersection to x 1 , x 2 plane. Figure 6a shows level curves of the CES production function.
According to [22], when the follower operates as a perfect competitor, attaining maximum profit becomes unfeasible for increasing returns to scale, i.e., for σ > 1 . However, within our models (9) and (10), given that the follower assumes a monopolistic role with the linear demand (5), the solution of the bilevel programming problems (9) and (10) is attainable for specific numerical parameter values within the model. We will illustrate this scenario with the following example.
Example 3.
Increasing returns to scale:  σ = 2 .
Let us consider the example with the degree of homogeneity of the CES production function set to σ = 2 , instead of to 1 or 0.5 as in the Examples 1 and 2. Let the number of inputs be n = 2 . Let the input prices be w 1 = 8 and w 2 = 5 , respectively, let the coefficients of the demand function be a = 80 and b = 50 , respectively, and let the allocation coefficients of the CES production function be α 1 = 0.4 and α 2 = 0.6 , respectively. Furthermore, let the scale of production be A = 1 and let the substitution coefficient of the CES production function be ρ = 2 .
The production function (1) is given by
q = q x 1 , x 2 = 0.4 x 1 2 + 0.6 x 2 2 2 2 = 0.4 x 1 2 + 0.6 x 2 2 1 .
Note that according to (3) ω again has the same value ω = 12.595 .
Since for σ = 2
Π t , q = a t q b q 2 ω q 1 / 2 = 80 t q 50 q 2 12.595 q 1 / 2 .
Problems (9) and (10) can now be stated as the following bilevel programming problem:
max 0 < t < a T t , q = t q
s . t . max q > 0 Π t , q = 80 t q 50 q 2 12.595 q 1 / 2 .
First, we solve the follower’s problem (64) for a given but fixed tax amount t . From the first-order conditions on (64)
Π q t , q = 80 t 100 q 6.298 q 1 / 2 = 0 ,
we should obtain the optimal output level q ( t ) . Note that Equation (65) cannot be solved for q explicitly. Solving the problems (63) and (64) numerically, we obtain the optimal solution t = 32.279 and q ( t ) = 0.374 with T = 12.081 . Note that Π q q t , q = 100 + 3.159 ( q ) 3 / 2 = 86.247 < 0 so t and q ( t ) really maximize the follower’s problem (64).
Note that (6) implies t < a = 80 . To solve the problems (63) and (64) numerically, one can generate values for t between 0 and 80 with step 0.001, for example, and then solve the first-order condition (65) for q. For obtained pairs (t,q) condition Π q q t , q < 0 should be checked in order to ensure the maximization point for the follower’s problem (64). Finally, across all pairs (t,q), find the pair (t*,q*) that maximizes the leader’s function T t , q = t q .
Note also that the bilevel programming problems (63) and (64) cannot be solved directly just by placing the model into some application. It is not easy to solve it even if the follower’s problem is replaced with first-order conditions (65).
Finally, by substituting t = 32.279 and q = 0.374 back into the follower’s profit function, we get the optimal follower’s profit
Π t , q = 80 t q 50 ( q ) 2 12.595 ( q ) 1 / 2 = 3.151 .
Furthermore, for increasing returns to scale σ = 2 , from the optimal output level q = 0.374 and (4) follows the optimal inputs (labor and capital) levels
x 1 = 0.374 1 2 0.4 8 1 1 + 2 0.4 8 2 1 1 + 2 + 0.6 5 2 1 1 + 2 1 2 = 0.524 ,
x 2 = 0.374 1 2 0.6 5 1 1 + 2 0.4 8 2 1 1 + 2 + 0.6 5 2 1 1 + 2 1 2 = 0.702 .

3.2. Some Sensitivity Analysis Remarks

In this subsection, we analyze how optimal solutions obtained in previously presented examples change when the price of the product received by the producer p > 0 changes. Let us recall from Equation (5) that p has a form
p = a t b q ,
where a > 0 and b > 0 are coefficients of the demand function and t > 0 is the tax amount per unit product. Obviously, from (69), we can see that for fixed t , b and q , p as a function of a parameter a > 0 is linearly increasing, i.e., p = p ( a ) is increasing. Similarly, p = p ( b ) is decreasing.
In the case of constant returns of scale where σ = 1 , from Corollary 1. we see that the change in parameter a > 0 affects all optimal values (16) and (19), while the change in b > 0 has an impact on (17) and (19) only. Precisely, from (16) and (19) we can see that if a > 0 increases, the optimal leader’s (i.e., government’s) decision t increases, the optimal follower’s (i.e., monopolist’s) decision increases, optimal government’s tax T increases, and optimal monopolist’s profit Π increases, respectively. Similarly, if the parameter b > 0 increases, then the optimal government’s decision t remains the same, the optimal monopolist’s decision decreases, the optimal government’s tax T decreases and the optimal monopolist’s profit Π decreases, respectively.
In the case of decreasing returns of scale where σ = 0.5 , from Corollary 2. we see that the change in parameter a > 0 affects all optimal values (40) and (43), while the change in b > 0 has an impact on (41) and (43) only. Precisely, from (40) and (43) we can see that if a > 0 increases, the optimal government’s decision t increases, the optimal monopolist’s decision increases, the optimal government’s tax T increases, and the optimal monopolist’s profit Π increases, respectively. Similarly, if the parameter b > 0 increases, then the optimal government’s decision t remains the same, the optimal monopolist’s decision decreases, the optimal government’s tax T decreases and the optimal monopolist’s profit Π decreases, respectively.
Closed-form expressions for optimal values (16), (19), (40), and (43) enable us to calculate precise percent changes in all of these values for a given change in parameters a > 0 and b > 0 . Table 2 shows these calculations, where we assume increments in parameters a > 0 and b > 0 for Δ a > 0 and Δ b > 0 , respectively.
Data in Table 2 are easily calculated from Corollary 1 and 2. As the final remark in this subsection, it is interesting to note that, both in the case of the constant returns to scale ( σ = 1 ) as in the case of decreasing returns to scale (for σ = 0.5 ), the optimal government’s tax is twice as great as the optimal monopolist’s profit. Indeed, from Corollary 1 and Corollary 2, we have
T Π = ( 18 ) ( 19 ) a ω 2 8 b / a ω 2 16 b = 2 ,
T Π = ( 43 ) ( 44 ) a 2 8 b + ω / a 2 16 b + ω = 2 .

4. Conclusions

This study presents a formalized mathematical model addressing the bilevel programming problem concerning the determination of the optimal tax amount that maximizes the government’s tax revenue, in the presence of a profit-maximizing monopolist whose output is characterized by the CES production function. The necessary conditions for the follower’s maximal profit are derived for the scenario with two or more inputs. These conditions are obtained in an implicit form, as they cannot be expressed explicitly for an arbitrary value of the degree of homogeneity of the CES production function. To address this issue, the specific formulation of the tax revenue function, alongside the determination of optimal tax rates and input levels, is then established for two distinct cases: one with decreasing returns to scale where the degree of homogeneity equals 0.5 and another with constant returns to scale where the degree of homogeneity equals 1. Furthermore, considering our model’s assumption of a monopolist with linear demand as a follower, through numerical examples, we illustrate that the optimal solution can still be attained even under conditions of increasing returns to scale where the degree of homogeneity equals 2, a scenario not applicable when the follower operates as a perfect competitor. Lastly, we offer insights into sensitivity analysis, particularly in selected numerical instances, and show how the optimal solutions change with the change in the producer’s price.
In this work, we assumed a linear demand function. In future research, we could analyze more complex demand functions, e.g., nonlinear ones such as quadratic or hyperbolic, and check if there is a closed-form solution for a certain degree of homogeneity values. Another question to be addressed is the existence of the solution, as well as the conditions for the existence, of increasing returns to scale. Although there is no closed-form solution for the general problem, it would be interesting to see if a simple numerical method could be created to approximately solve the problem. Finally, it would be interesting to find some real-world examples.

Author Contributions

Conceptualization, Z.L.; methodology, Z.L., K.P., and V.K.; software, K.P. and V.K.; validation, Z.L., K.P., and V.K.; formal analysis, Z.L., K.P., and V.K.; investigation, Z.L. and V.K.; writing—original draft preparation, Z.L. and V.K.; writing—review and editing, K.P. and V.K.; visualization, K.P. All authors have read and agreed to the published version of the manuscript.

Funding

This research received no external funding.

Data Availability Statement

No new data were created or analyzed in this study. Data sharing is not applicable to this article.

Conflicts of Interest

The authors declare no conflicts of interest.

References

  1. Colson, B.; Marcotte, P.; Savard, G. An Overview of Bilevel Optimization. Ann. Oper. Res. 2007, 153, 235–256. [Google Scholar] [CrossRef]
  2. Floudas, C.A.; Pardalos, P.M. (Eds.) Encyclopedia of Optimization; Springer: Boston, MA, USA, 2009; ISBN 9780387747583/9780387747590. [Google Scholar]
  3. von Stackelberg, H. Market Structure and Equilibrium; Springer: Berlin/Heidelberg, Germany, 2011; ISBN 9783642125850/9783642125867. [Google Scholar]
  4. von Stackelberg, H. Marktform und Gleichgewicht; Springer: Vienna, Austria, 1934. [Google Scholar]
  5. Bracken, J.; McGill, J.T. Mathematical Programs with Optimization Problems in the Constraints. Oper. Res. 1973, 21, 37–44. [Google Scholar] [CrossRef]
  6. Bracken, J.; McGill, J.T. Computer Program for Solving Mathematical Programs with Nonlinear Programs in the Constraints. 1972. Available online: https://apps.dtic.mil/sti/citations/AD0742098 (accessed on 24 January 2025).
  7. Lukač, Z. Optimal Tax Policy for Single Homogeneous Commodity on n Markets with Export Costs as a Stackelberg Game. Cent. Eur. J. Oper. Res. 2023, 31, 873–890. [Google Scholar] [CrossRef]
  8. Lott, W.F.; Miller, S.M. Excise Tax Revenue Maximization. South. Econ. J. 1974, 40, 657. [Google Scholar] [CrossRef]
  9. Gahvari, F. The Nature of Government Expenditures and the Shape of the Laffer Curve. J. Public Econ. 1989, 40, 251–260. [Google Scholar] [CrossRef]
  10. Tanaka, Y. Optimal Commodity Taxation under Monopolistic Competition. Keio Econ. Stud. 1993, 30, 7–17. [Google Scholar]
  11. Auerbach, A.J.; Hines, J.R., Jr. Perfect Taxation with Imperfect Competition; National Bureau of Economic Research, Inc.: Cambridge, MA, USA, 2001. [Google Scholar]
  12. Coto-Martinez, J.; Garriga, C.; Sánchez Losada, F. Optimal Taxation With Imperfect Competition and Aggregate Returns to Specialization. SSRN J. 2007. [Google Scholar] [CrossRef]
  13. Reinhorn, L.J. Optimal Taxation with Monopolistic Competition. Int. Tax Public Financ. 2012, 19, 216–236. [Google Scholar] [CrossRef]
  14. Takatsuka, H. Tax Effects in a Two-region Model of Monopolistic Competition. Pap. Reg. Sci. 2014, 93, 595–618. [Google Scholar] [CrossRef]
  15. Colciago, A. Imperfect Competition and Optimal Taxation. SSRN J. 2013. [Google Scholar] [CrossRef]
  16. Sachs, D.; Tsyvinski, A.; Werquin, N. Nonlinear Tax Incidence and Optimal Taxation in General Equilibrium. ECTA 2020, 88, 469–493. [Google Scholar] [CrossRef]
  17. Lukač, Z.; Puljić, K.; Kojić, V. Maximizing Tax Revenue for Profit Maximizing Monopolist with the Cobb-Douglas Production Function and Linear Demand as a Bilevel Programming Problem. EFZG Work. Pap. Ser. 2024, 2024, 1–16. [Google Scholar]
  18. Mas-Colell, A.; Whinston, M.; Green, J. Microeconomic Theory; Oxford University Press: Oxford, UK, 1995. [Google Scholar]
  19. Avvakumov, S.N.; Kiselev, Y.; Orlov, M.; Tarasyev, A.M. Profit Maximization Problem for Cobb–Douglas and CES Production Functions. Comput. Math Model 2010, 21, 336–378. [Google Scholar] [CrossRef]
  20. Rasmussen, S. Production Economics; Springer Texts in Business and Economics; Springer: Berlin/Heidelberg, Germany, 2013; ISBN 9783642301995/9783642302008. [Google Scholar]
  21. Zevelev, A.A. Closed Form Solutions in Economics. SSRN J. 2013. [Google Scholar] [CrossRef]
  22. Lukač, Z. Optimal Taxation of a Perfectly Competitive Firm with Cobb–Douglas Production Function as a Bilevel Programming Problem. Cent. Eur. J. Oper. Res. 2023, 31, 891–909. [Google Scholar] [CrossRef]
Figure 1. Notably, 2D graphical representation of the optimal solution of the bilevel problems (29) and (30).
Mathematics 13 00825 g001
Figure 2. Notably, 3D graphical representation of the optimal solution of the bilevel problems (29) and (30).
Mathematics 13 00825 g002
Figure 3. Graphical representation of the optimal capital and labor levels for the bilevel problems (29) and (30) in (a) 2D; and (b) 3D.
Mathematics 13 00825 g003
Figure 4. Notably, 2D graphical representation of the optimal solution of the bilevel problems (52) and (53).
Mathematics 13 00825 g004
Figure 5. Notably, 3D graphical representation of the optimal solution of the bilevel problems (52) and (53).
Mathematics 13 00825 g005
Figure 6. Graphical representation of the optimal capital and labor levels for the bilevel problems (52) and (53) in (a) 2D; and (b) 3D.
Mathematics 13 00825 g006
Table 1. Notation.
Table 1. Notation.
LabelConstraintDescription
n n , n 2 Number of inputs
x 1 , x 2 , , x n x 1 , x 2 , , x n > 0 Inputs (labor, capital, etc.)
w 1 , w 2 , , w n w 1 , w 2 , , w n > 0 Input prices
A A > 0 Scale of production
α 1 , α 2 , , α n α 1 , α 2 , , α n > 0
i = 1 n α i = 1
Allocation coefficients of the CES production function
σ σ > 0 Degree of homogeneity of the CES production function
ρ ρ > 1 , ρ 0 Substitution coefficient of the CES production function
q q > 0 Output level
t t > 0 Tax amount per unit product
p p > 0 Price of the product received by the producer
p + t p + t > 0 Market price of the product
a , b a , b > 0 Coefficients of the demand function
Table 2. Changes in optimal decision values t * , q * , T * , and Π * according to changes in price p .
Change in
Parameters
a > 0 and b > 0
Optimal
Government’s
Decision
Optimal
Monopolist’s
Decision
Optimal
Government’s
Tax
Optimal
Monopolist’s
Profit
CRS
σ = 1
a a + Δ a Δ a > 0 Δ a a ω 100 % Δ a a ω 100 % 2 Δ a a ω + Δ a 2 a ω 2 100 % 2 Δ a a ω + Δ a 2 a ω 2 100 %
Δ a = a / 100 ----
b b + Δ b Δ b > 0 0 1 + b Δ b 1 100 % 1 + b Δ b 1 100 % 1 + b Δ b 1 100 %
Δ b = b / 100 0 0.99 % 0.99 % 0.99 %
DRS
σ = 0.5
a a + Δ a Δ a > 0 Δ a a 100 % Δ a a 100 % 1 + Δ a a 2 1 100 % 1 + Δ a a 2 1 100 %
Δ a = a / 100 1 % 1 % 2.01 % 2.01 %
b b + Δ b Δ b > 0 0 b + ω Δ b + 1 100 % b + ω Δ b + 1 100 % b + ω Δ b + 1 100 %
Δ b = b / 100 0 ---
Disclaimer/Publisher’s Note: The statements, opinions and data contained in all publications are solely those of the individual author(s) and contributor(s) and not of MDPI and/or the editor(s). MDPI and/or the editor(s) disclaim responsibility for any injury to people or property resulting from any ideas, methods, instructions or products referred to in the content.