Abstract
This research investigates the effectiveness of four metaheuristic algorithms, the Population-Based Genetic Algorithm, Particle Swarm Optimization, JAYA, and Generalized Normal Distribution Optimizer, for managing the energy production of wind-based distributed generators (DGs). The aim is to reduce operational costs in a 33-node microgrid (MG) operating under both connected and isolated configurations. The study seeks to identify the most efficient algorithm for minimizing operational expenses in distributed generation systems, specifically in terms of energy production and purchasing costs, as well as the maintenance costs of DGs. Due to limited statistical validation and unrealistic operational constraints in previous studies, we propose a novel framework that offers a robust, reproducible solution for optimizing the management of wind-based distributed generators in microgrids. Through 100 independent trials for each algorithm and configuration, rigorous statistical analyses are conducted, including ANOVA and Tukey’s post hoc test, to assess performance consistency and the significance of cost reduction outcomes across algorithms. The results indicate that the PGA demonstrates superior cost efficiency and stability, particularly in the connected MG configuration.
Keywords:
metaheuristic optimization; energy management; operational cost minimization; statistical analysis; energy systems; eolic generation MSC:
90C59; 90C90; 49M37; 37M10
1. Introduction
The energy transition towards renewable sources and distributed generation technologies has generated a growing interest in optimizing the costs and operational efficiency of microgrids (MGs) [1]. MGs, composed of a variety of energy resources, offer the flexibility to operate both in grid-connected and isolated modes (standalone), allowing for more efficient management of resources based on demand and local generation availability [2]. In particular, integrating wind turbines (WTs) into MGs has emerged as a promising alternative due to their low carbon footprint and potential to reduce operational costs [3]. The most widely implemented technologies are photovoltaic (PV) and wind generators, the latter being the focus of the research in this work.
The central issue in the operation of MGs with WTs lies in how to manage the active power of these generators to minimize the costs of purchasing energy from the grid or conventional generators, as well as the operational and maintenance costs of the wind turbines themselves [4], while ensuring at all times that the power limits of the renewable generation system are met, which depend on the wind characteristics and the wind energy capture machine, as well as the operational and technical constraints of the grid: active and reactive power balance, nodal voltage limits, current limits in the devices, among others [5]. This work focuses on the mathematical formulation and solution of an objective function that aims to minimize these costs, incorporating the technical constraints necessary to ensure the reliable operation of the system [6], employing a high-performance optimization strategy as a solution to address optimization problems of a nonlinear nature, such as the one explored in this paper.
Various optimization methodologies have been used to tackle the energy management challenges in electrical grids, aiming to reduce operational costs. Among these, metaheuristic algorithms are particularly notable for their effectiveness in managing complex and nonlinear problems in this context and other engineering areas [7]. However, the specialized literature has primarily focused on solving the energy management problem in PVs, as seen in [8,9,10]. These approaches have achieved excellent results in terms of solution quality and processing times, emphasizing the need to ensure that solution methodologies are compared adequately with other methods reported in the literature, using statistical analysis to guarantee the evaluation of solution repeatability each time they are executed, promoting fast solutions for decision-making processes in the energy dispatch problem by microgrid (MG) operators or owners.
The scenario is different in the context of energy management for WTs in electrical grids. This topic is still under development and has a limited number of reported works, where the primary focus of research has been on solving the integration and sizing problem, with few studies concentrating on intelligent energy management. Among the published works, the study reported in [11] stands out, where the authors addressed the problem of integration and optimal operation of WTs in electrical grids to reduce operational costs. In this study, the lion’s swarm optimization algorithm was employed to solve the operation problem of the generators, comparing it with the Genetic Algorithm by Chu and Beasley (GA) and the Particle Swarm Optimization (PSO) method. The results demonstrated the effectiveness of these methodologies for solving the energy management problem of WTs in electrical grids during a specific hour of operation. However, it was recognized that there was a need to extend the analysis to a longer period, such as a full day of operation, to evaluate the long-term impact of energy management on operational costs.
In the study reported in [12], a GA is proposed to solve the operation problem of intelligently located WTs, utilizing the same algorithm within a 33- and a 69-node electrical distribution network. This strategy achieves a significant reduction in energy losses within the grid, which directly impacts the operational costs, while ensuring the balance of active and reactive power within the system, as well as compliance with nodal voltage limits. However, the authors do not integrate the power limits of the generation devices or the maximum currents of the lines within the operational constraints of the problem, which prevents a realistic representation of the addressed problem. Consequently, the solutions that are obtained lack representativeness for practical application. This same issue is presented in [13], where the authors propose implementing the primal-dual interior-point method to solve the intelligent operation problem of WTs in an 88-node electrical grid. In this work, a notable reduction in the system’s energy losses was achieved by controlling renewable resource generation.
The study reported in [14] addresses the challenge of managing wind generation and energy storage systems through effectively controlling complex systems with multivariable constraints, fluctuations in generator speed, and high operational costs. Model predictive control (MPC) is proposed to be combined with distributed control as a solution. This allows systems to be decomposed into subsystems that interact through a network, thus reducing their complexity, meaning that the generators considered within the network are operated independently. Additionally, an energy management system is developed based on a multi-objective optimization that aims to reduce operational costs and improve the system’s technical conditions while reducing the impact of wind variability. The results show that the distributed control based on MPC significantly reduces fluctuations in generator speed and optimizes operational costs. However, the authors do not consider the multiple nodes composing the electrical grid nor compare the results obtained with other methodologies reported in the literature.
The research reported in [15] addresses the challenge of optimizing the location, sizing, and operation of energy storage systems and distributed generation based on WTs in electrical grids to improve the economic and operational conditions of the grid. To solve this problem, a modified version of the Artificial Hummingbird Algorithm is employed, incorporating a long-term memory component to enhance the algorithm’s ability to make decisions based on previous experiences, explore a broader range of promising locations, and reduce the risk of premature convergence or stagnation. The results demonstrate the effectiveness of this methodology in improving the performance of 33- and 69-node electrical grids, with statistical comparison through analysis of the best solution, average solution, and standard deviation against optimization methodologies reported in the specialized literature, such as GA and PSO. However, despite the excellent results reported, the authors do not adequately tune the parameters of the optimization methodologies used, which can significantly influence the quality of the solutions obtained, as an optimization strategy is only as effective as the proper tuning of its parameters [16].
In [17], the authors address reductions in emissions and energy losses in electrical systems by replacing diesel generators with renewable sources, optimizing their operation through a hybrid method called the Levy Coyote Optimization Algorithm, which combines the Coyote Algorithm with Levy Flight. This approach achieved significant improvements in results compared to other optimization methods, such as the GA and PSO algorithms, standing out for its statistical analysis based on multiple executions to evaluate the quality and stability of the solutions. However, a limitation identified was the need for an hourly optimal power flow analysis to validate the long-term operation of WTs and the inclusion of current limits within the lines that make up the system in the mathematical formulation.
In the research presented in [18], a new optimization algorithm named Lightning Search Optimization (LSO) was employed to determine the location, sizing, and operation of a hybrid system of distributed generation based on renewable sources (WTs) and battery storage within a 33-node electrical grid. The study considered variations in load power demand and renewable generation, aiming to minimize total power losses, voltage deviation, and operational and investment costs. The results demonstrated the effectiveness of the LSO algorithm in solving the formulated problem while meeting the technical–operational constraints of the grid. However, the absence of a comparison of the obtained results with other optimization algorithms reported in the literature stands out, as well as the need to evaluate the stability and quality of the solutions through statistical analysis and simulations under different operational scenarios.
The analysis of the previously presented works highlights the need to develop an advanced mathematical formulation to operate WTs in electrical grids efficiently. This formulation should focus on minimizing operational costs while improving the technical conditions of the grid, integrating a realistic set of operational, technical, and economic constraints that accurately reflect the operational characteristics of current electrical networks. High-performance optimization methodologies are required to ensure high-quality solutions with adequate repeatability and competitive processing times, key factors for their practical implementation. On the other hand, the state of the art emphasizes that energy management in MGs is an emerging field, with an urgent need to explore and validate strategies for both grid-connected and isolated operational conditions. These conditions present unique challenges not fully addressed in traditional distribution grids, where DG management has been more extensively studied. In this context, a significant opportunity is identified to advance knowledge by designing and validating new strategies that optimize energy management in electrical MGs, considering the particularities of MGs and the efficient integration of renewable generation technologies based on wind systems.
This research addresses the issues identified in the previous paragraph by developing a mathematical formulation to model the nonlinear optimization problem that represents the energy management of DGs, in this case, WTs, in electrical MGs. The objective function aims to minimize the operational costs of the MG and the maintenance of distributed generation devices, considering key technical and operational constraints such as the active and reactive power limits of the devices, power balance, nodal voltage limits, and the maximum currents in the lines. To solve this problem, a master–slave methodology is proposed. The master stage uses a population-based version of the Genetic Algorithm (PGA) to manage the active power of the WTs over a 24 h horizon. Simultaneously, the slave stage employs an hourly load flow based on successive approximations to assess the impact of the proposed solutions in terms of the objective function and technical constraints, using an adaptation function [19]. This approach reduces operational costs and ensures power configurations that meet the technical constraints, securing robust performance of the MG in both grid-connected and isolated operation modes.
In the MR, the grid-connected mode considers the electrical grid at the slack bus of the system, which has the capability to both inject and receive electrical energy from the MR [20] in order to meet its demand while also improving both the objective function and its technical conditions. On the other hand, the isolated mode considers a diesel generator at the slack bus instead of the electrical grid, and it can switch to this mode in case of a failure in the electrical grid, allowing the MR to continue operating autonomously [21,22]. This mode does not provide an unlimited power injection source at the slack bus, as the diesel generator has certain power limits that must be respected in order to preserve the generator’s lifespan and ensure its proper functioning [23]. Additionally, this mode does not allow power injection from the MR into the slack bus.
The 33-node MG reported in [24] is adapted to validate the proposed solution methodology’s effectiveness. It is modified to evaluate its operation in both isolated and grid-connected modes, integrating variable generation and demand for an average operating day in a region of Colombia. Additionally, three widely reported comparison methodologies from the literature for energy management of DGs are employed: the PSO, the JAYA optimization method, and the Nonlinear Gradient-Based Dynamic Optimization Method (GNDO) [7,25,26]. Similar to the PGA, these techniques were selected due to their outstanding performance in solution quality, repeatability, and processing times. They were also chosen for their proven ability to achieve good convergence and avoid local optima in non-convex optimization problems, which are highly relevant to the nature of the problem addressed in this research.
The main contributions of this research work are listed below:
- A comprehensive mathematical model that represents the energy management problem of distributed wind turbines in electrical microgrids (MGs) operating in both grid-connected and isolated modes, fully incorporating the technical constraints that govern the actual operation of the MG.
- The implementation of PGA to solve the energy management problem are highlighted, ensuring lower average operational costs for the grid operator and MG owners and high repeatability of the obtained solutions.
- A rigorous statistical analysis was conducted using analysis of variance (ANOVA) and the Tukey post hoc test to systematically compare the performance of the proposed PGA with other high-performance optimization methodologies, including PSO, JAGA, and GNDO. This ensures the robustness and consistency of the obtained results.
- An energy management system for AC microgrids that accounts for the variability in generation and demand of wind turbines and users, enabling the owner or operator to reduce operational costs in both grid-connected and standalone modes. The system ensures compliance with all technical constraints related to the grid components and adheres to the electrical regulations applicable to such systems.
The document’s structure is organized as follows: Section 2 presents the mathematical formulation of the problem, highlighting the objective function related to costs and the relevant technical constraints. Section 3 details the master–slave solution methodology and the optimization algorithms employed. Section 4 describes the operational characteristics of the 33-node MG, considering its ability to operate in both grid-connected and isolated modes. Section 5 presents the results and performance analysis of the optimization techniques used. Finally, Section 6 provides the conclusions of the work and possible future research directions.
2. Mathematical Formulation
The mathematical formulation of the optimization problem in this research aims to minimize the total operating cost of the MG, considering both the cost of energy purchased from conventional generators and the maintenance costs associated with the WTs. This model is designed to operate in both grid-connected and isolated modes and is defined as a minimization problem.
2.1. Operational Cost Objective Function
The objective function, denoted as , seeks to minimize the daily operating cost of the MG and is expressed as shown in Equation (1):
In this equation, represents the unit cost of the energy produced by conventional generators, while denotes the operation and maintenance cost of the WTs. The variable refers to the active power supplied by the conventional generators at node i and at hour h, whereas represents the active power generated by the WTs at node i during hour h. The summation is carried out over all hours within the 24 h operation horizon, and for all nodes within the MG. Finally, represents the duration of each time period, which in this case is one hour. In this objective function, the power supplied by the conventional generator can be associated with energy purchases from the grid in the on-grid operation scenario and with energy production by diesel generators installed within the MG in the isolated operation scenario.
2.2. Constraints
To ensure reliable and efficient operation of the MG, power balance constraints, load capacity limits, and node voltage levels are integrated, which are described below.
The active power balance at each node and for each hour of operation is ensured by Equation (2):
where is the demand power at node i and at hour h; and are the magnitudes of the voltage at nodes i and j, respectively, for hour h; represents the magnitude of the admittance between nodes i and j; and and are the voltage angles for the same nodes at hour h. The term corresponds to the angle of admittance between nodes i and j.
The reactive power balance, presented in Equation (3), ensures that the reactive power in the system is balanced at each node and for each hour:
Here, and represent the reactive power generated and demanded at node i and at hour h, respectively. This equation ensures that the reactive power is properly managed at each node.
To avoid overload in the conventional generators, the active power at each node must comply with the following limits in Equation (4):
where and represent the minimum and maximum active generation limits of the conventional generators at node i. It is important to highlight that in the on-grid operation mode, this power limit is associated with the energy sale capacities of the grid at the connection point, which is the case in most situations. Meanwhile, in the isolated operation mode, it is associated with the power limits of the diesel generators, which typically range between 40 and 80% of the nominal capacity of the fossil fuel-based generation plant.
As an additional constraint in the isolated operation mode, in Equation (5), the power generated by the conventional generators associated with the diesel generation point must always be greater than or equal to zero.
The above is because, unlike grid connection points, this generation system cannot absorb energy, which is essential for ensuring power balance. This limitation further complicates energy management in electrical MGs, requiring precise control of both generation and demand to ensure system stability and meet other operational constraints.
Similar to the previous constraint, conventional generators must operate within their reactive power limits, as presented in Equation (6):
where and are the reactive power limits for each conventional generator at node i.
The power generated by the WTs is limited by wind availability and installed capacity, as represented by Equation (7):
where and represent the minimum and maximum power limits of the WTs, respectively, while denotes the wind generation factor at hour h, based on wind speed and the technical characteristics of the wind turbine.
In Equation (8), a constraint is presented, which shows that the voltage at each node must remain within certain limits to ensure system stability:
where and represent the minimum and maximum allowed voltage limits at node i.
Finally, following what is presented in Equation (9), the current flowing through each line of the MG must not exceed its nominal capacity:
where is the current in the line connecting nodes i and j at hour h, and is the maximum current the line can support without compromising its integrity.
These constraints and the cost objective function define the optimization model used for the MG operation analysis. The constraints ensure that the power dispatch decisions minimize operational costs without compromising the system’s stability and security while meeting the technical limits established for each network component.
3. Solution Methodology
3.1. Relationship Between Optimization Methodologies and the Problem Addressed
Four metaheuristic methods are implemented to solve the proposed optimization problem, with the proposed PGA serving as the primary methodology. In addition, three other techniques are employed for comparison: PSO, the JAYA algorithm, and GNDO. These methods are selected based on their well-established exploration and exploitation capabilities in the search space, as well as their efficiency in solving nonlinear and multinodal problems, which are inherent characteristics of the problem studied.
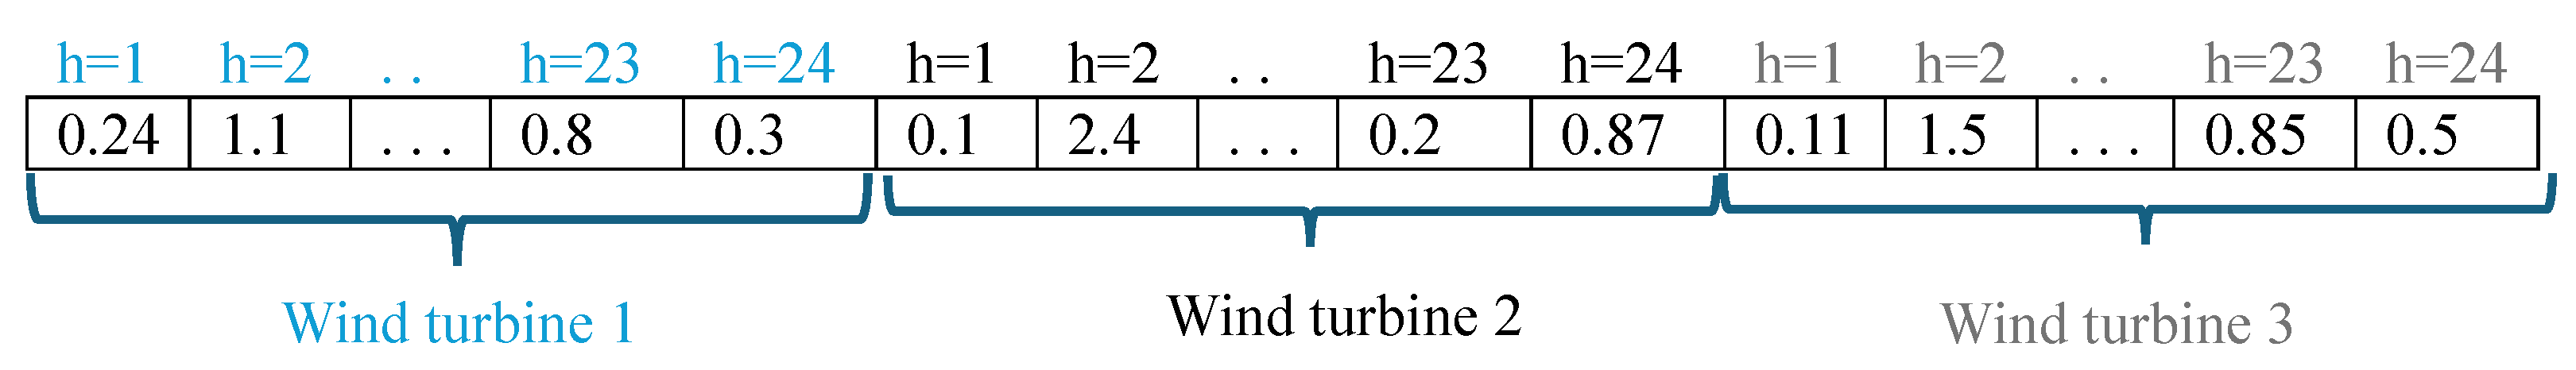
To address the energy management problem of wind turbines in AC microgrids, this study implements a power dispatch strategy for distributed generators using the coding scheme presented in Figure 1. This figure illustrates the power dispatch of three wind turbines, where each unit injects a specific amount of power into the grid during each period of time analyzed (h). The power supplied to the grid directly impacts the economic performance of microgrid operation. Therefore, the objective of the optimization methodologies is to determine the optimal dispatch schedule for each distributed wind generator while ensuring compliance with all technical and operational constraints.
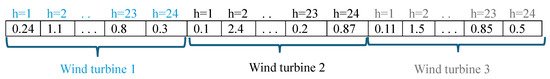
Figure 1.
Codification used for representing the optimization problem.
In this context, the power limits for each hour of operation are determined by the maximum power point of each generator, which is directly influenced by wind conditions and the efficiency of the wind turbine. Meanwhile, the minimum power level can correspond to 0 watts, representing the scenario where the turbine is taken out of operation. These constraints introduce an additional layer of complexity to the optimization problem, as the solution must account for the fluctuating nature of wind energy while ensuring the reliability and stability of the microgrid.
Since this problem involves continuous variables, it is classified as a highly nonlinear optimization problem, making it challenging to solve. As a result, high-performance optimization methodologies are required to achieve an efficient solution, as used in this research.
The solutions obtained with each of these methods are comparatively analyzed below, evaluating the effectiveness of each technique in terms of its performance in minimizing the operational costs of the MG. This analysis helps to identify the most suitable methodology for such systems and for specific operation cases.
3.2. Population-Based Genetic Algorithm (PGA)
The PGA is based on genetic evolution principles, such as selection, recombination, and mutation, and it has been adapted for continuous optimization in power management systems. This approach allows for the update of solutions through the evolution of descendant populations, which increases convergence efficiency and the ability to reach a high-quality solution compared to the traditional genetic method [4].
In the context of the operational cost minimization problem in an MG, the PGA begins with an initial population of randomly generated solutions representing different power configurations for each wind turbine. Then, the fitness function is evaluated, including the objective function for operational costs and the penalties associated with violating technical and operational constraints, to penalize infeasible solutions.
For evaluating the effect of the operational costs and constraints that represent the problem, an hourly power flow analysis is carried out using the successive-approximation (SA) technique to assess the proposed power injections for wind generators within the MG by considering the hourly power demand and parameters of the MG. This method offers a computationally efficient approach for load flow calculations while maintaining reliable convergence properties [27]. The process involves performing power flow simulations for each hour, covering 24 h in this study, by adjusting the system’s generation and demand according to the data provided for each time interval. The hourly impact on the objective function and system constraints is determined throughout this process using nodal voltage results from the load flow analysis and other system parameters. Any violations of constraints are addressed by applying penalties through an adaptation function, which modifies the objective function accordingly. Once all 24 h have been analyzed, the total impact for the day is obtained by summing the hourly results, representing the overall operational performance of the MG.
The hourly power flow analysis requires essential input data supplied by the PGA, including system parameters, hourly wind generation values (decision variables), and power demand. For each hour h, the following steps are performed:
- Load the user power demand for hour h.
- Load the wind generation output for each distributed generator at hour h.
- Solve the load flow for hour h using the SA method [27]. This iterative process calculates the nodal voltage magnitudes based on Equation (10), ensuring convergence when the tolerance criterion () is satisfied:
- Calculate the objective function (e.g., minimizing operational costs) and identify any constraint violations for hour h.
- Apply penalties for constraint violations through the adaptation function, as shown in Equation (11), which increases the value of the objective function based on the severity of violations:For grid-connected mode, penalties are calculated usingHere, and represent violations of the loading and voltage limits, while and are penalty factors set heuristically (e.g., 1000). Considering the selection of these values, they were chosen to be large enough so that, in the event that this penalty is applied, the adaptation function is significantly impacted. This indicates that the solution producing these penalties is not feasible. For isolated mode, additional penalties are incorporated:Here, and correspond to violations related to the slack bus power sales and diesel generator output exceeding their defined limits.
- Accumulate the hourly adaptation function values into a total daily result.
- Send the total adaptation function value to the PGA for the individual in the analysis.
Based on the fitness function values calculated for the individuals in the population of PGA, the best solution is selected as the incumbent. This process ensures that lower-cost solutions are favored for participation in recombination and mutation procedures in future generations, thus promoting convergence toward optimal configurations.
The iterative process of the PGA applies a random selection of individuals to ensure adequate exploration of the solution space, for which four parents are randomly selected. Then, regarding the fitness function, the two fittest individuals from this group are recombined to generate a descendant. Recombination is performed by combining the parents’ characteristics, averaging the values assigned to each problem variable, thus exploiting the continuous nature of the optimization to guide the exploration toward lower-cost solutions. Mutation introduces variability in the descendants by generating random values within the established active power limits for each wind turbine during the different periods, thus allowing for diversified search and avoiding premature convergence to local optima.
Subsequently, the descendant population is evaluated using the fitness function, and those descendants with better results replace their less fit parents. In this way, the PGA retains only the best-performing solutions in each generation, updating the incumbent of the problem when a better global solution is found in terms of operational costs.
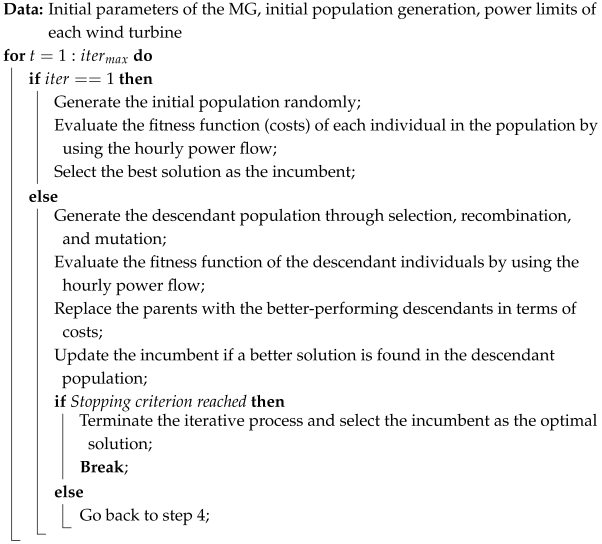
The algorithm concludes when the stopping criterion is met, either by reaching the maximum number of iterations or stabilizing the fitness function. At this point, the incumbent represents the optimal power configuration to minimize operational costs in the MG. The following is the pseudocode for the PGA Algorithm 1.
In this scheme, the fitness function used is adjusted to minimize costs, penalizing any violation of the operational constraints of the MG, such as active power limits and energy demands in each period. This allows the PGA to evolve power configurations towards a solution with the lowest cost, thus ensuring optimal and reliable operation of the MG.
| Algorithm 1: Iterative process of the PGA for cost minimization in MG |
 |
3.3. Comparison Algorithms
The PSO is inspired by the collective behavior observed in swarms or flocks in nature [25]. In this approach, the solution space is modeled as a swarm of particles, where each particle represents a potential solution to the problem at hand. During each iteration, the particles adjust their positions and velocities based on their own experience and the best global experience of the swarm. This mechanism allows PSO to efficiently guide both the exploration and exploitation of the search space, steering each particle towards promising solutions and improving convergence to the global optimum. In this study, PSO is specifically applied to identify the minimum cost configuration in the MG under the system’s constraints.
On the other hand, the JAYA algorithm uses an optimization strategy that approximates solutions towards the best ones found and moves them away from the worst without needing additional parameters [28]. In each iteration, the positions of the individuals in the population are modified to move towards the best and away from the worst, simplifying its implementation and minimizing the risk of suboptimal adjustments. The JAYA algorithm is employed in this work for cost optimization in the MG, allowing a comparative analysis of its performance against other metaheuristic methods in terms of efficiency and effectiveness.
The GNDO operates based on statistical principles and the behavior of normal distributions [26]. This algorithm employs a combined search strategy: in the local phase, it adjusts the position of the individuals considering the best-known solution, using the mean and standard deviation of a normal distribution. In the global phase, the GNDO explores new areas of the search space through random variability, which increases its ability to avoid local optima. This study uses GNDO to reduce operational costs, allowing its performance to be evaluated against PGA, PSO, and JAYA in terms of accuracy and convergence speed.
Each method is evaluated using the cost function defined in Equation (1) as the fitness function, quantifying the performance of the solutions generated in each iteration. Throughout the comparative experiments, the ability of each algorithm to reduce operational costs in the MG is analyzed, along with convergence metrics, solution quality, and the consistency of the results across iterations.
3.4. Tuning of the Optimization Algorithms
To adjust and optimize the proposed optimization strategies, a PSO was used [29]. This algorithm employed a population of 100 particles, with equal values of 1.494 for the cognitive and social components, an initial maximum inertia of 1 and a minimum of 0, and a limit of 300 iterations. This approach has been widely used in multiple publications to optimize and maximize the performance of energy management methodologies applied to various types of distributed energy resources, as reported in ref. [24]. This PSO is responsible for finding the optimal parameters for each technique used, ensuring that each methodology demonstrates the best performance and solution possible for the corresponding test scenario. In other words, for this case, the methodology is executed 100 times with different parameters, and then the process begins to iterate, progressively coming closer to the best possible parameter configuration as it approaches the maximum number of iterations, which in this case is 300. The parameters obtained for the optimization methodologies considered, both for on-grid and off-grid operation, are presented in the Table 1.

Table 1.
Parameters of optimization methodologies used for the 33-node MG for grid-connected and isolated operation modes.
4. Test System
This work adapts the 33-node alternating current MG as a test system, widely used in the specialized literature to validate energy management strategies [30]. This MG consists of 33 nodes and 33 lines, with a base voltage of 12.66 kV and a base power of 100 kVA.
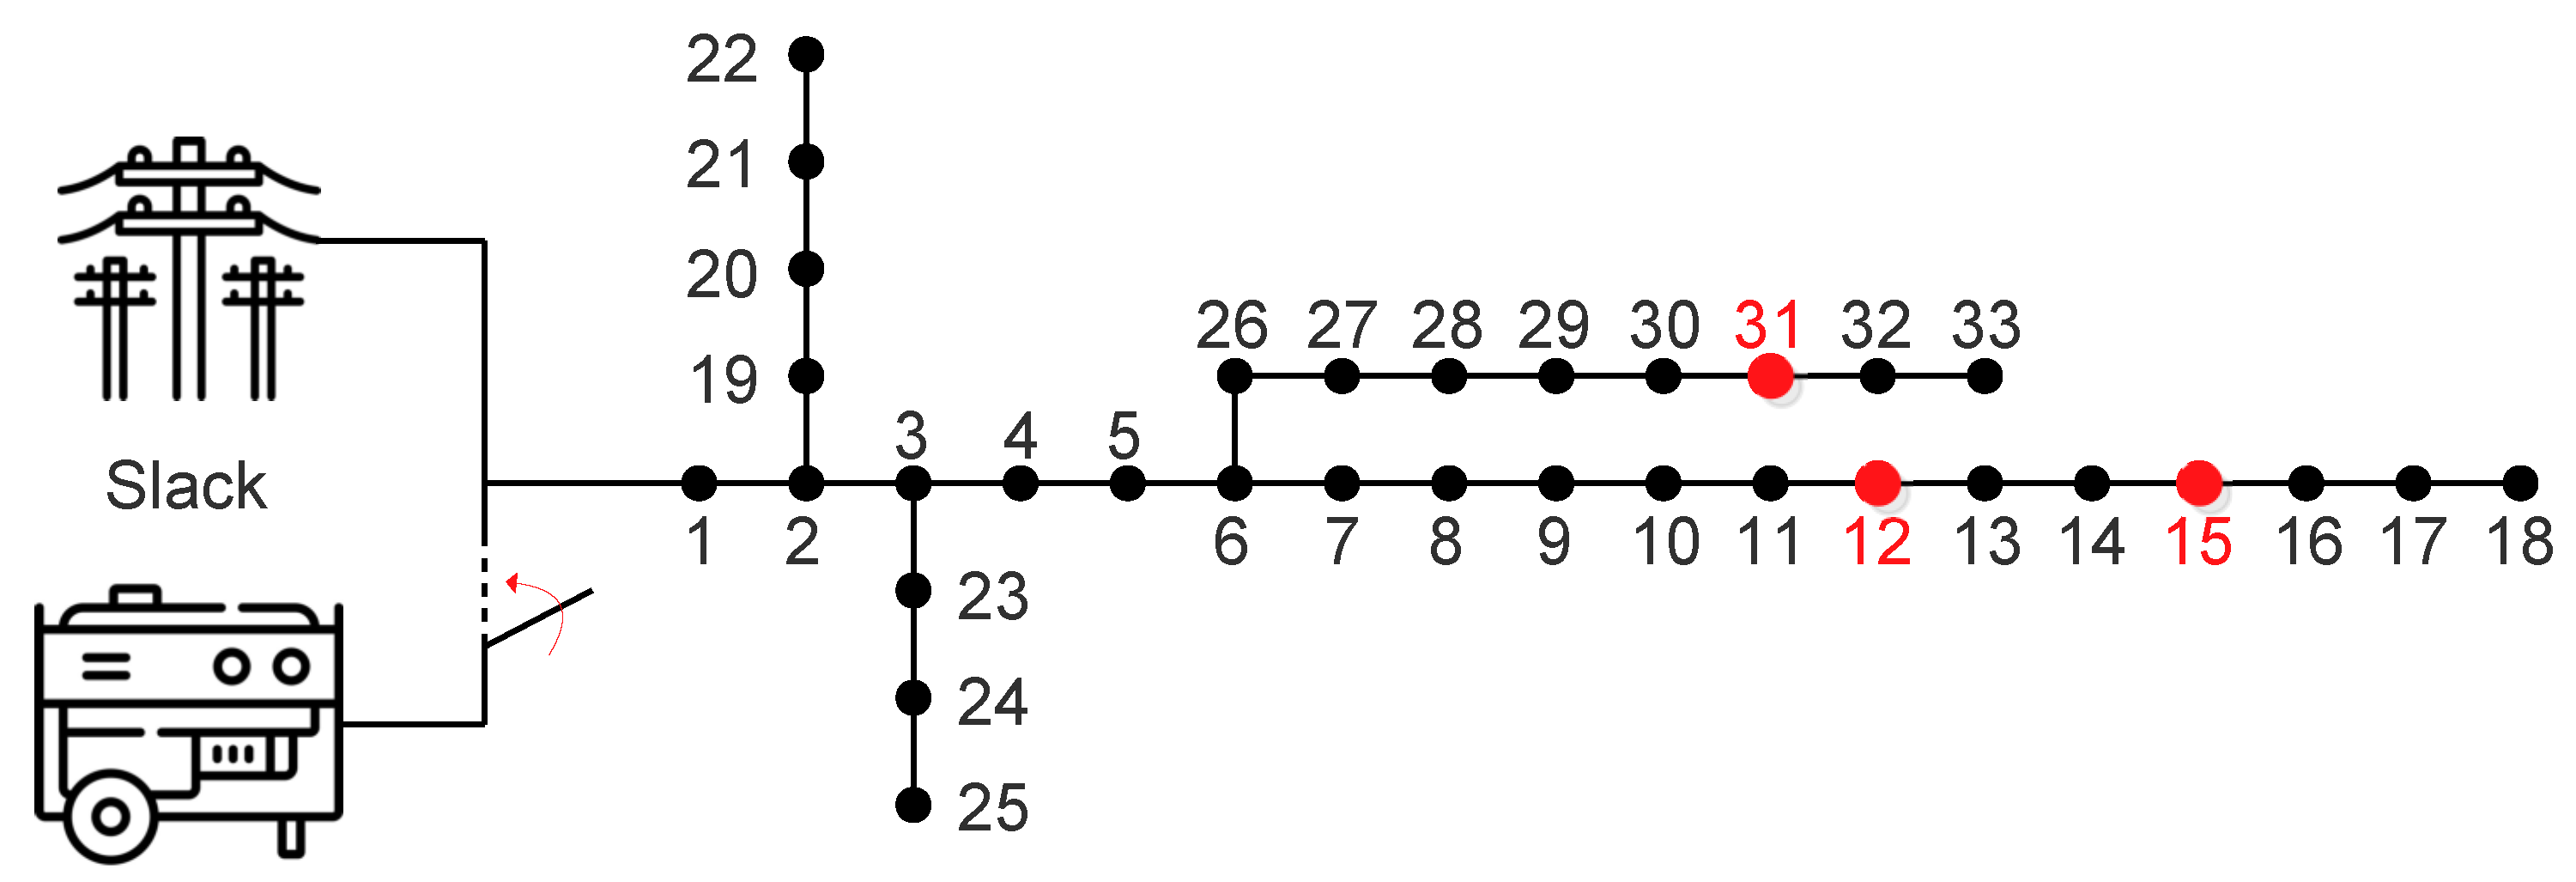
Figure 2 illustrates the electrical diagram of the 33-node MG employed. In this figure, it can be seen that the MG has a slack node at node 1, which can be supplied by the electrical grid in the grid-connected operation mode or by a 4000 kW diesel generator that operates in the isolated mode in cases where the grid fails or needs to be disconnected. This generator has power limits with minimum and maximum values corresponding to 40% and 80% of its nominal power, respectively. Additionally, the red points represent the locations of the WTs within the MG, specifically at nodes 12, 15, and 31, each with an installed capacity of 1200 kW. It is also important to mention that there are electrical loads present at each of the system’s nodes, which have both active and reactive power demands. This can be more clearly seen in Table 2.
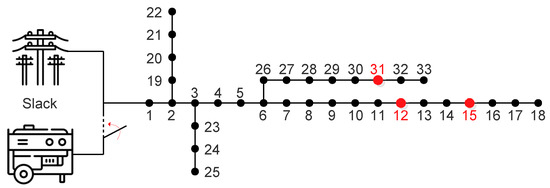
Figure 2.
Electrical diagram of the 33-node MG.
Table 2.
Technical parameters of the 33-node MG.
The technical parameters of the system are presented in Table 2. From left to right, this table shows the line number, the sending node, the receiving node, the resistance and reactance of the line, the active and reactive power demanded at the receiving node, and the maximum current the line can support according to its construction characteristics. Additionally, this MG has a maximum voltage variation range of ±8% of the system’s nominal voltage.
Table 3 presents the energy purchase and production costs of the conventional generators (), as well as the maintenance costs of the WTs (), for the grid-connected and isolated operation modes of the MG, respectively.
Table 3.
Cost, maintenance, and emission level parameters for the grid-connected and standalone operating modes of the MG.
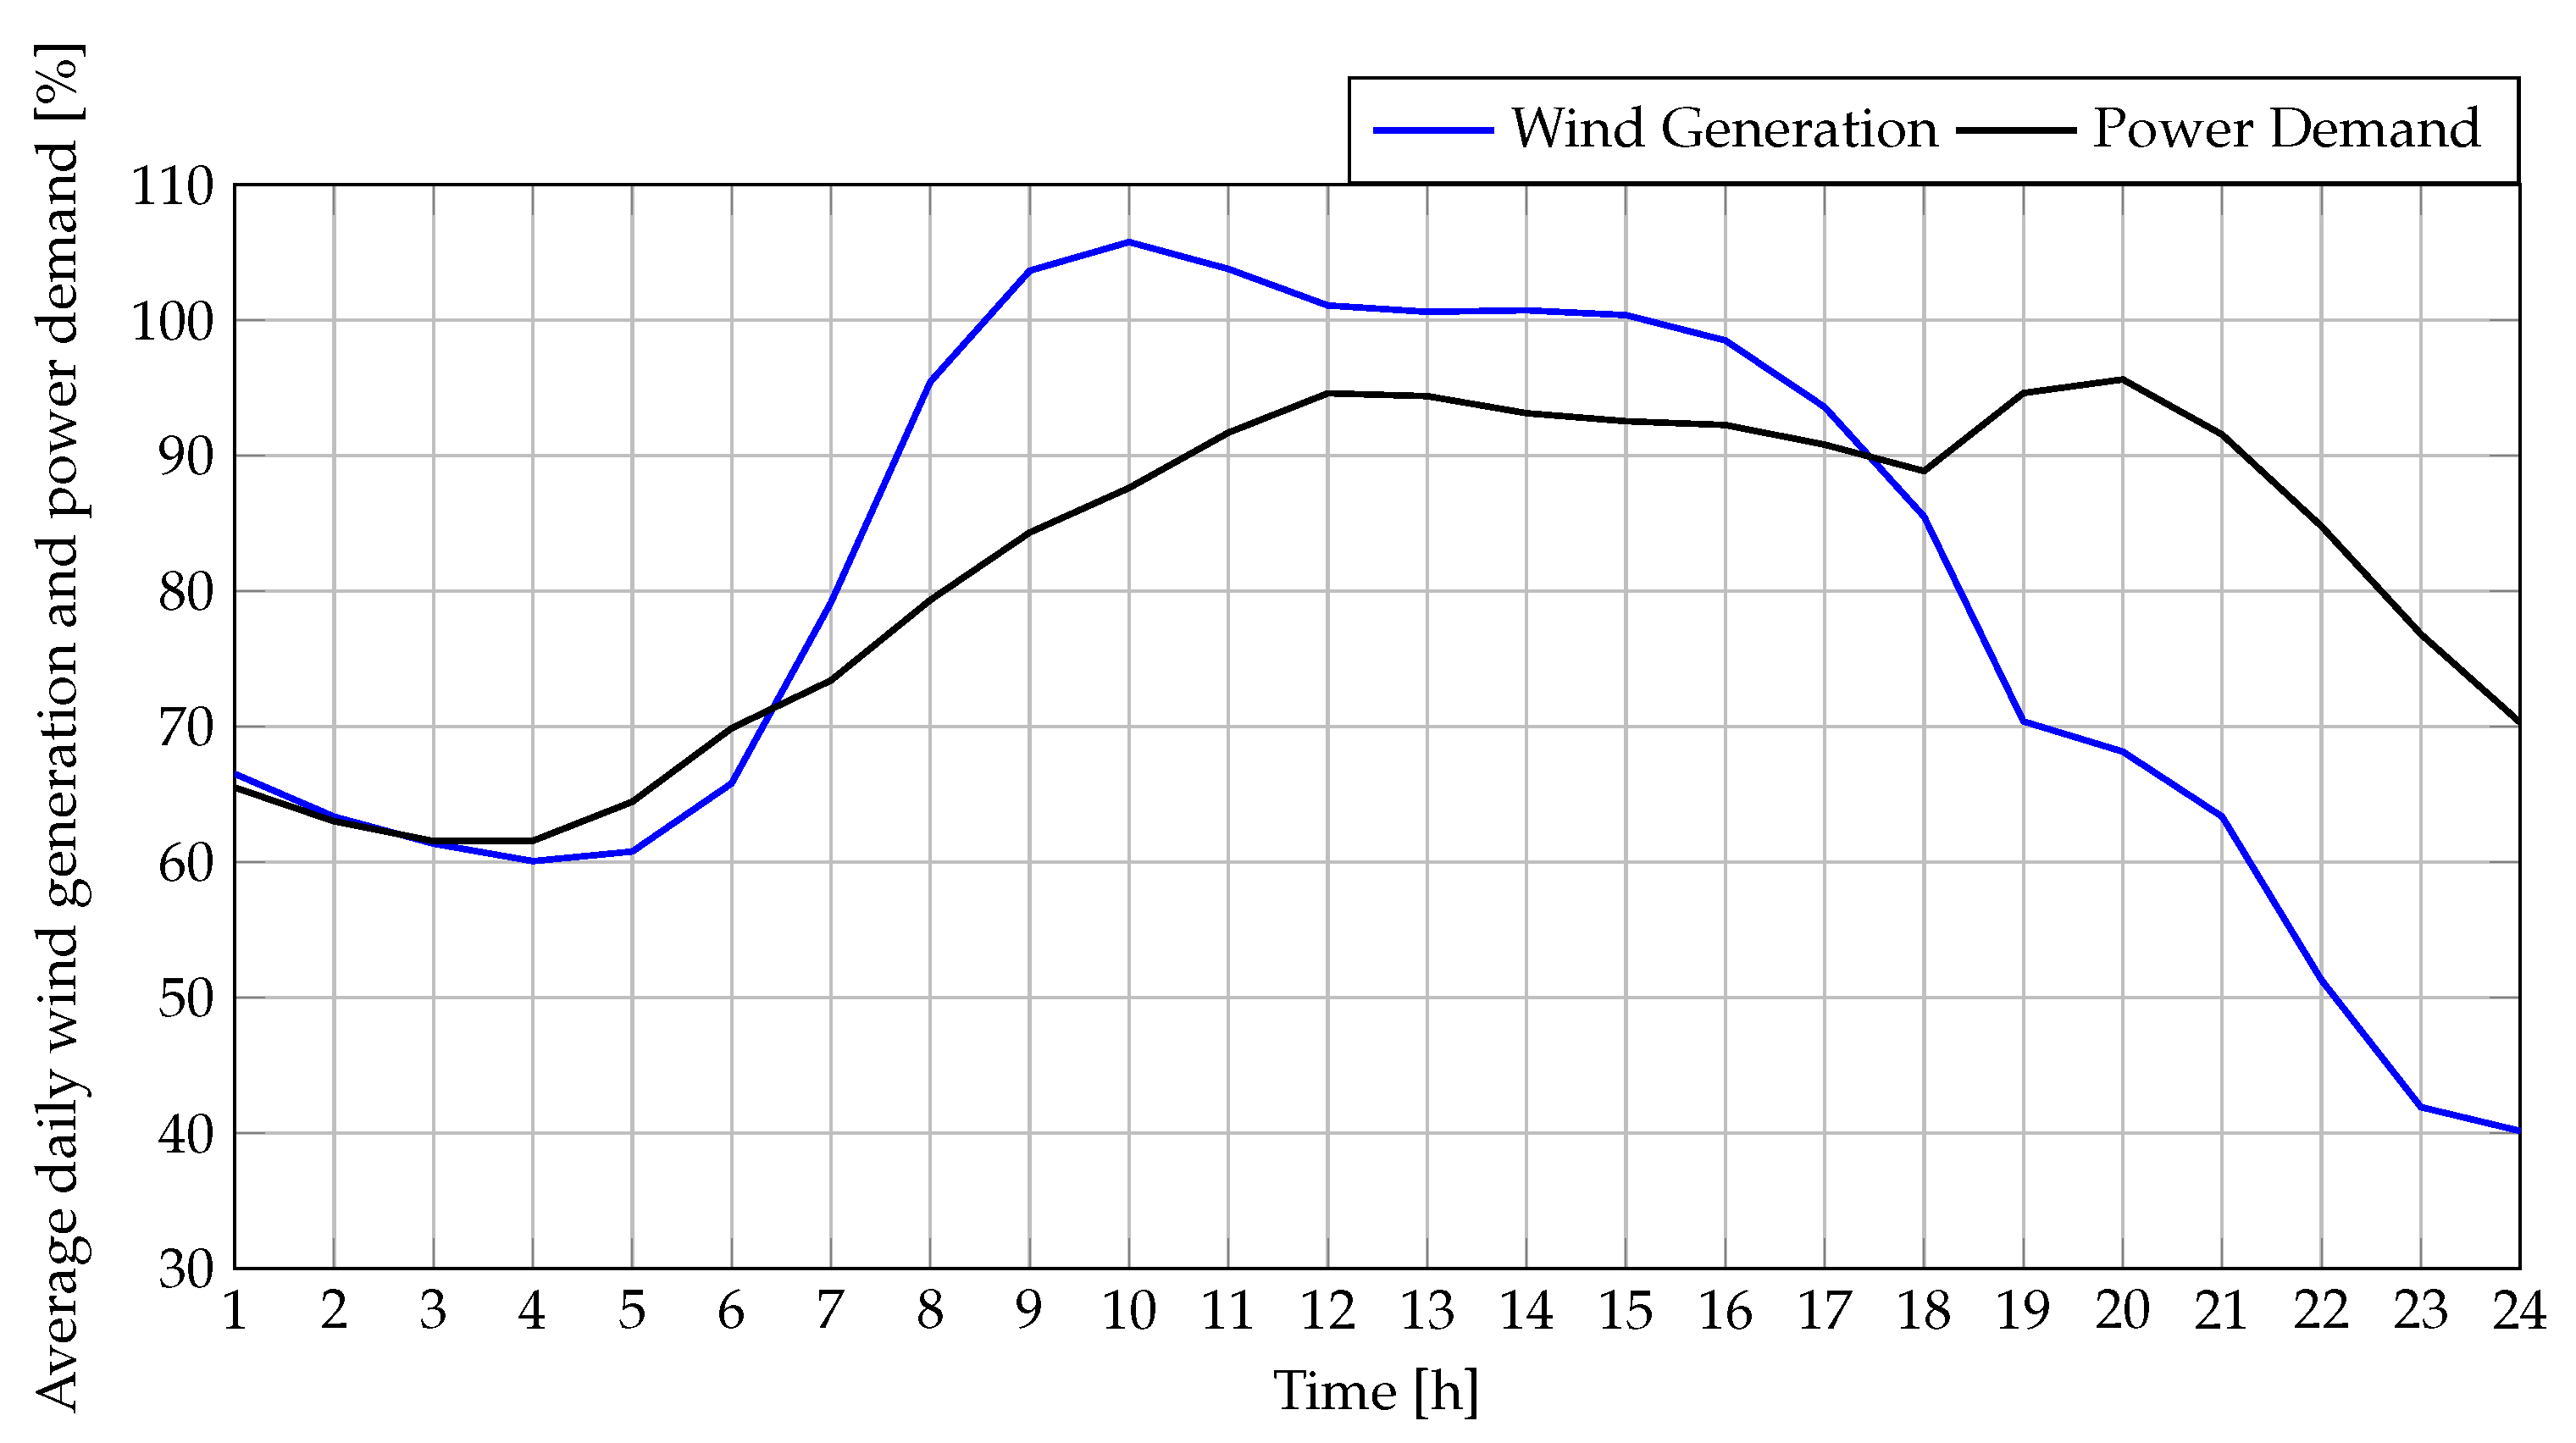
Finally, Figure 3 shows the variation in generation and power demand in p.u. for the installed wind generation systems within the MG and the power demand behavior of the users connected to the MG, for an average day. These values were obtained using the behavior of renewable energy resources and energy demand from a region in Colombia [24].
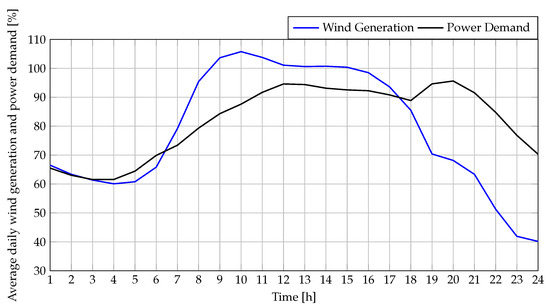
Figure 3.
Average daily generation of WTs located in a region of Colombia.
5. Results and Discussion
5.1. Optimization Results for the 33-Node MG
Four metaheuristic algorithms were tested on a 33-node MG operating in both connected and isolated modes to evaluate the optimization methods. The analysis focused on the objective function , which corresponds to the minimization of operational costs, expressed in United States dollars (USD). To perform a rigorous statistical comparison and analyze the effectiveness of each algorithm, 100 independent runs were carried out for each method.
The effectiveness of each method was evaluated in terms of the best solution obtained, the consistency of its results across multiple runs, and other statistical dispersion indicators. In particular, the operational costs’ minimum, average, and standard deviation were recorded for each set of simulations. These parameters allow measuring not only the ability of each algorithm to reach optimal solutions but also the stability and robustness of its solutions across different executions.
The optimization strategies outlined earlier were implemented using the MATLAB program (latest v. 2024R), and the simulations were conducted on a personal HP Victus computer featuring an Intel(R) Core(TM) i7-11800H processor running at 2.30 GHz, with 16 GB of RAM and a 64-bit Windows 11 operating system, the computer was manufactured by Hewlett Packard in China and bought in a commercial store in Santiago de Chile. In addition, each optimization algorithm was executed 100 times to assess the performance of each method in terms of the best solution, average solution, and standard deviation.
The results obtained for the network in connected mode and in isolated mode are presented in Table 4 and Table 5, respectively.
Table 4.
Optimization results for in the 33-node grid-connected MG.
Table 5.
Optimization results for in the 33-node isolated MG.
Table 4 shows that the PSO algorithm achieves the lowest recorded minimum solution at USD 3831.9679, although with a higher standard deviation (USD 51.1591), indicating more significant variability in its results compared to the PGA, which exhibits high consistency reflected in its low standard deviation (USD 0.8039) and a minimum value of USD 3837.2199. In contrast, GNDO shows a significantly higher standard deviation (USD 80.6143) and a higher average (USD 4854.8275), suggesting lower precision and consistency in its results for this configuration.
For the MG in isolated mode, Table 5 reveals a similar behavior, with PSO once again achieving the lowest operational cost (USD 11,386.8667), although with more significant variability (USD 87.5612) compared to PGA (USD 0.7194). JAYA exhibits high variability in its results, while GNDO is characterized by a higher minimum value (USD 12,194.3101) and a considerable standard deviation (USD 226.8097), reflecting its lower effectiveness in this specific context.
In addition to the previous analysis, a comparison of results between the system’s base case and the objective function values obtained by each metaheuristic technique can also be conducted. However, this analysis can only be performed for the MG’s connected configuration. For the isolated mode of the MG, the base case is not feasible, as there are hours during the day when the diesel generator, connected to the slack bus, must exceed its technical limits to meet the required demand (Equations (3)–(5)).
The base case for the MG operating in connected mode is USD 9931.64. When comparing the average reductions achieved by each metaheuristic technique against this base case, we observe reductions of 61.35% for the PGA, 60.95% for the PSO, 60.91% for the JAYA algorithm, and 51.12% for the GNDO. This analysis shows that while all the metaheuristic techniques result in significant reductions, the PGA consistently provides the highest reduction compared to the other methods.
Figure 4 presents the results of the four algorithms operating in connected mode, using boxplots and violin plots. The results show that PSO reaches a minimum value close to the optimal (USD 3831.97), closely followed by PGA, whose minimum is slightly higher (USD 3837.22). However, the standard deviation in PSO is considerably more significant compared to PGA, which is evident in the box’s width and the presence of outliers above USD 4200. This behavior indicates that although PSO can find optimal solutions in some runs, its consistency is limited and heavily dependent on the initial conditions of each run. In practical implementation applications, this would pose a risk, as consistency in operational costs is crucial for the planning and operation of renewable energy resources, WTs in this case, within the MG.
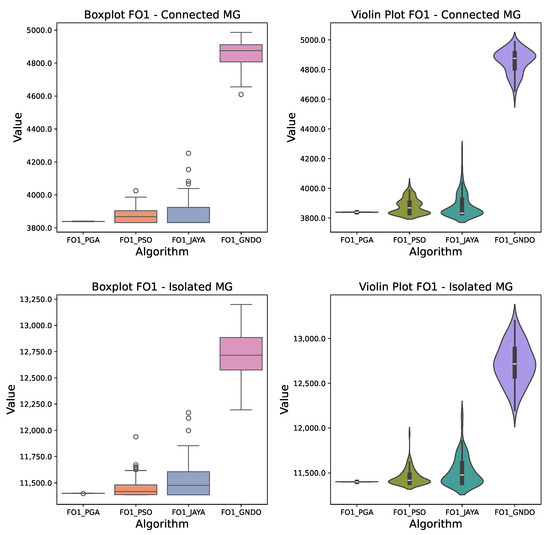
Figure 4.
Objective function results for the 33-node MG operating in grid-connected and isolated modes, evaluated through boxplots and violin plots for each algorithm.
In a different regard, the PGA exhibits a remarkably stable behavior, with a minimal standard deviation (USD 0.8039), which is reflected in a narrow box in the boxplot. This result indicates a high consistency in its solutions, making PGA the most reliable algorithm for the cost objective function in this connected MG configuration. This suggests to the grid operator that every time the energy management strategy is executed for the generators, an excellent quality solution will be obtained, close to the best solution.
The JAYA algorithm exhibits intermediate performance, with a moderate standard deviation and several outliers above USD 4200. At the same time, GNDO shows a considerably higher standard deviation (USD 80.6143) and a median significantly higher than the other algorithms, suggesting that it is not suitable for cost optimization in this configuration due to its tendency to become trapped in suboptimal solutions.
In the violin plot, the distribution of solutions generated by each algorithm is more distinctly visualized. The PGA exhibits a probability density concentrated near its median, reinforcing its stability. While having a density centered in a low range, the PSO shows an extension toward higher values, confirming its high variability and tendency to generate less adequate values. In contrast, JAYA and GNDO present more dispersed distributions, suggesting lower efficiency in converging to optimal solutions.
For the case of the MG operating in isolated mode, the results show similar trends but with higher values in terms of operational costs. The PSO again reaches the lowest minimum value (USD 11,386.87), although, as in grid-connected mode, it shows high variability (USD 87.5612), indicating inconsistency between runs. In this configuration, PGA again stands out for its low standard deviation (USD 0.7194), reaffirming its reliability in scenarios where a stable and repeatable solution is required.
JAYA and GNDO also show high dispersion in this configuration, with GNDO recording an even higher median and outliers extending up to USD 13,000. This confirms that GNDO is unsuitable for the cost minimization objective in isolated networks, as it tends to converge to local optima and exhibits low accuracy.
The violin plot for the isolated mode of the MG provides a visual representation that supports the previous observations. The density of the PGA remains compact, while PSO shows a more dispersed shape toward the right, illustrating its variability. JAYA and GNDO display distributions with lower density and greater width, highlighting their low effectiveness in optimizing the objective function in this network configuration.
The obtained results demonstrate that PGA is the most suitable method for optimizing the operational cost objective function in both configurations of the MG (connected and isolated). Its ability to generate consistent solutions with low variability represents a significant advantage in electrical MG applications where stability in operational costs is required for effective planning and management. Implementing this algorithm in real-world scenarios would allow grid operators to obtain reliable cost predictions, facilitating strategic decision making and the evaluation of economic feasibility in distributed generation systems.
5.2. Analysis of Variance (ANOVA) for Algorithm Comparison in the MG in Its Grid-Connected and Isolated Modes
To evaluate the performance of the algorithms in optimization, a one-way analysis of variance (ANOVA) was conducted [31]. This statistical test allows for the identification of significant differences in the operational cost results among the evaluated methods, considering the (objective function of costs) results in both configurations of the MG.
The ANOVA results are shown in Table 6. In the case of the MG in its grid-connected mode, an F value of 6351.66 and a p-value of < were obtained, indicating statistically significant differences among all the algorithms for this configuration. Similarly, for the MG operating in its isolated mode, an F value of 1848.56 and a p-value of < confirm the existence of significant differences among the methods.
Table 6.
ANOVA results for the analysis of the algorithms in cost optimization () in the grid-connected and isolated MG.
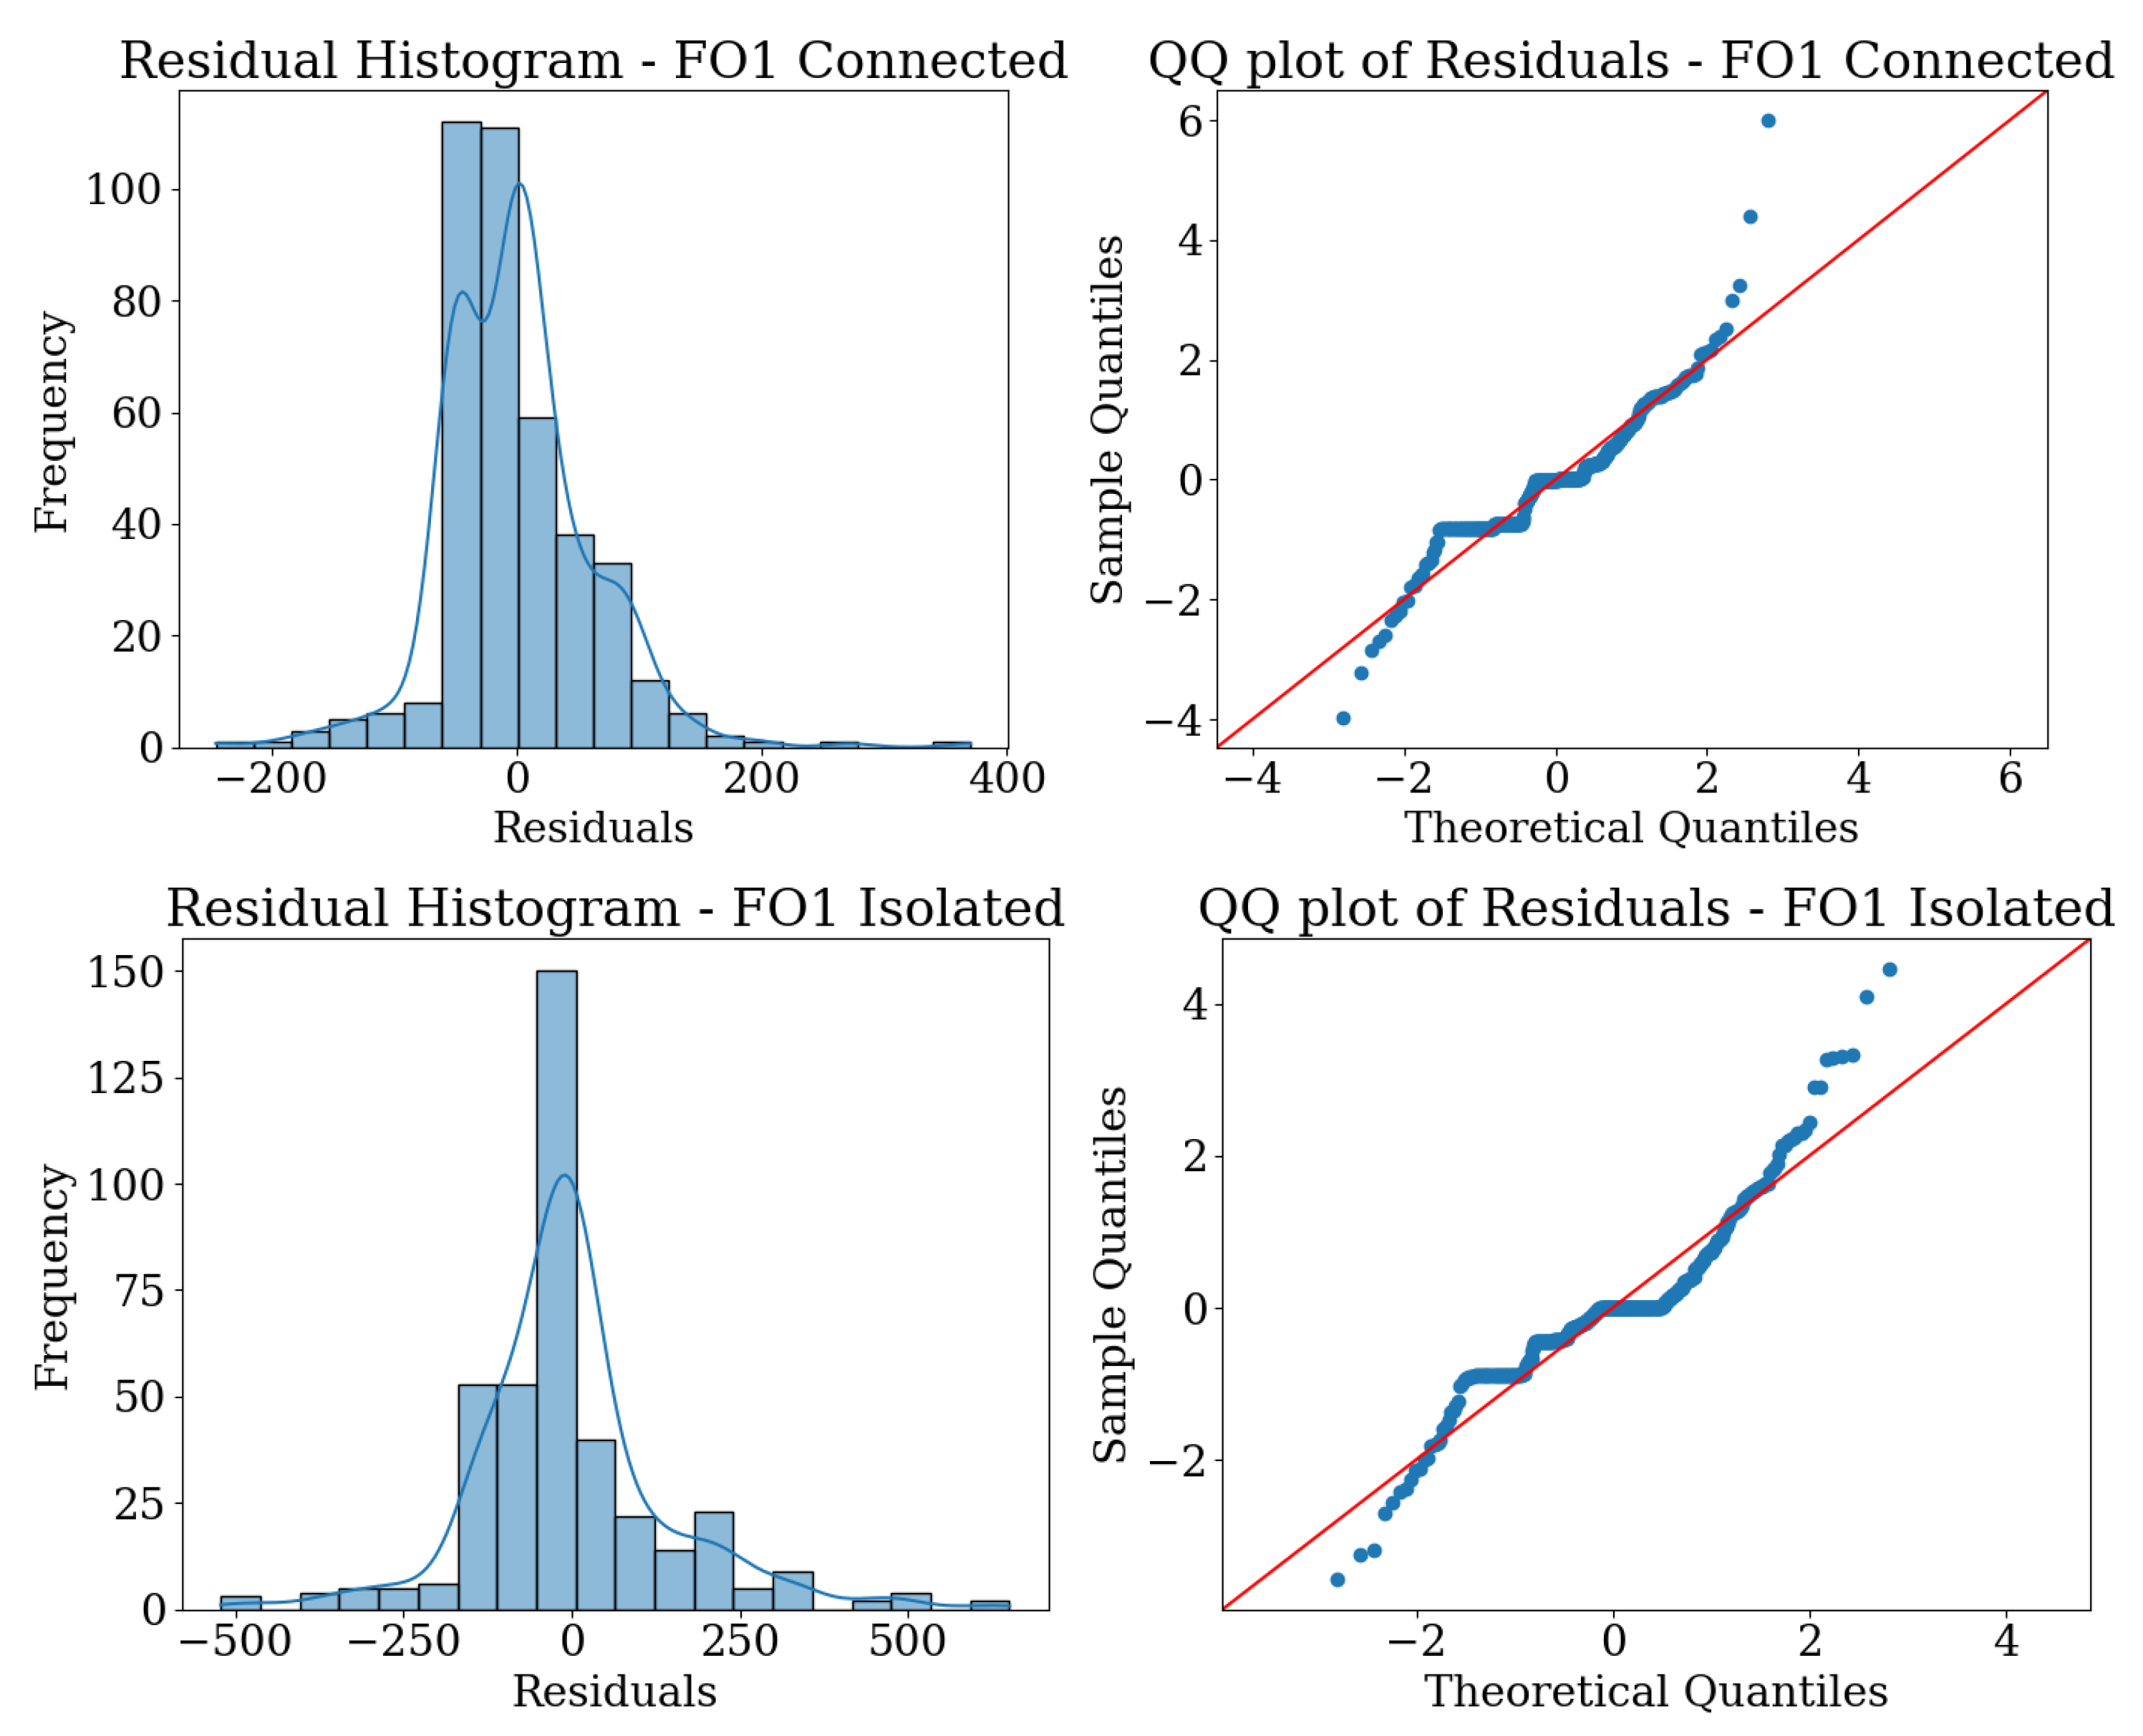
The normality of the residuals was verified using the Shapiro–Wilk test, obtaining a p-value of for the connected mode of the MG and for the isolated mode, suggesting a deviation from normality in the residuals. Despite this, the robustness of the ANOVA to moderate deviations from normality allows for the continuation of the analysis. Additionally, Levene’s test for the homogeneity of variances yielded p-values of (grid-connected) and (isolated), indicating heteroscedasticity, particularly notable in the GNDO and JAYA algorithms. As indicated by the standard deviation of the algorithms, it is evident that they exhibit higher variability compared to PGA and PSO in both configurations (grid-connected and isolated configurations of MG).
Figure 5 shows the histogram and Q-Q plot of the residuals for each configuration. A deviation of the residuals from the normality line is observed, particularly in the tails, which confirms the results from the Shapiro–Wilk and Levene tests. It highlights the variability among the algorithms, especially in the GNDO.
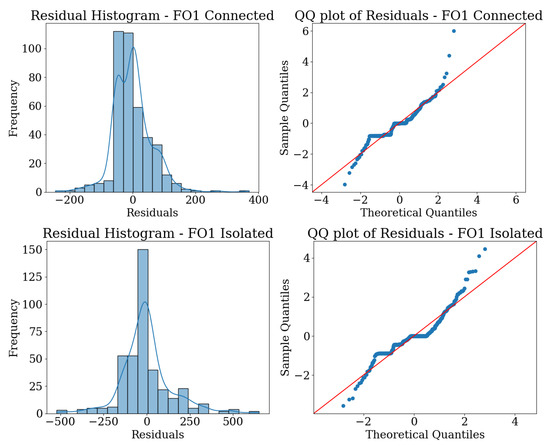
Figure 5.
Histogram and Q-Q plot of the residuals from the ANOVA model in the optimization of for the grid-connected MG (top) and isolated MG (bottom).
The ANOVA analysis suggests that there are statistical differences in the results of the algorithms. When comparing the PGA data, PGA is found to outperform the other methods in terms of efficiency and consistency for minimizing operational costs in the MG. This conclusion is reinforced by the residual results and the additional normality and homogeneity of variance tests. In the following sections, a post hoc analysis using the Tukey test is included to identify the differences between pairs of algorithms specifically.
It is important to emphasize that the departures from normality observed in the residuals, especially for the GNDO and JAYA algorithms, carry significant implications for the interpretation of the statistical analysis. The Shapiro–Wilk test revealed a strong deviation from normality in these cases, suggesting that the error distributions for GNDO and JAYA are not symmetrically distributed around their means. This non-normality can be indicative of the presence of outliers or skewed performance results, which in turn reflect a higher variability and less consistent behavior of these algorithms. The ANOVA test is generally robust to moderate deviations from normality; this further reinforces the conclusion that the PGA algorithm, which shows minimal departures from normality and low variability in its residuals, offers more robust and consistent performance compared to GNDO and JAYA.
5.3. Analysis of Mean Comparison: Tukey Test
To evaluate the effectiveness of the algorithms in terms of the objective function , the Tukey HSD multiple mean comparison test was used, with a significance level of 0.05. This analysis, presented in Table 7, allows for determation of whether the observed differences between the algorithms are statistically significant, providing a quantitative perspective on the performance of the GNDO, JAYA, PGA, and PSO methods.
Table 7.
Tukey HSD test results for the grid-connected and isolated MGs.
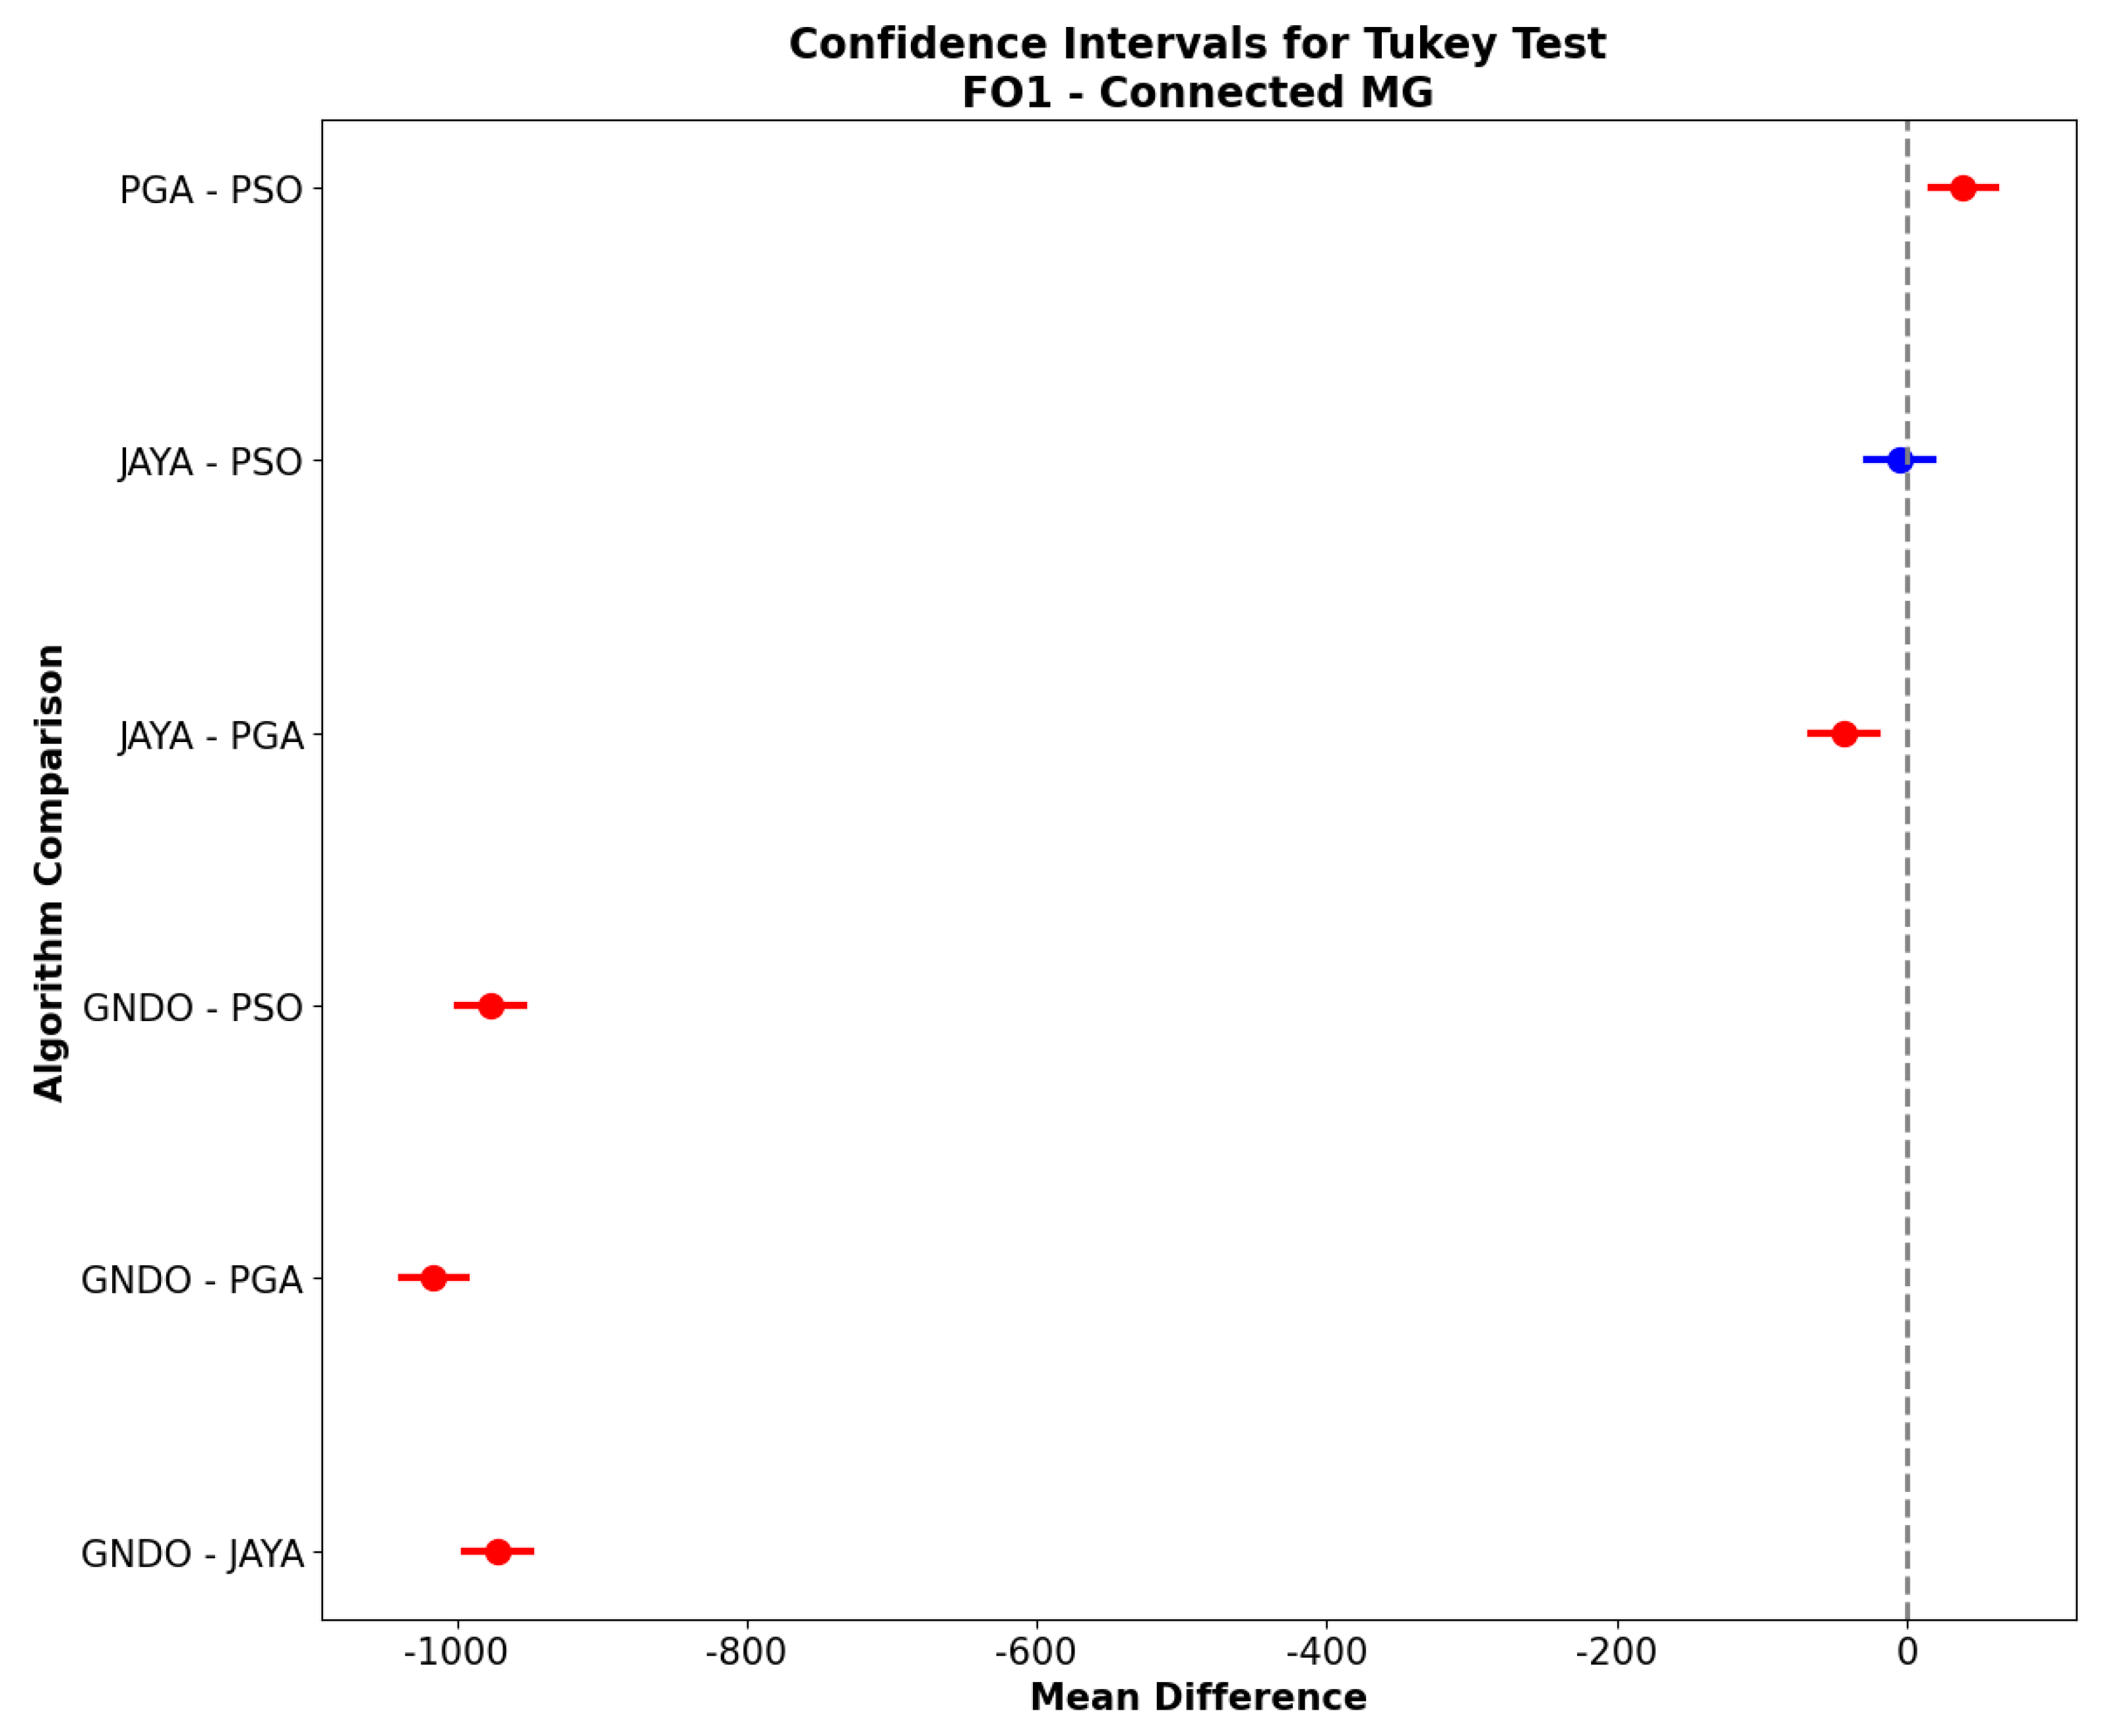
In the connected configuration of the MG, the results indicate significant differences in the average operational costs between most algorithm pairs. The GNDO algorithm shows significantly poorer performance than the other methods, with a p-value of 0.0 in all its comparisons, evidencing that its operational costs are substantially higher in this configuration. A statistically significant difference is observed when comparing JAYA and PGA, with a mean of −43.6999 and a confidence interval that does not cross zero. This supports the superiority of PGA in minimizing operational costs compared to JAYA in the connected MG. However, no significant difference are found between JAYA and PSO, given the p-value of 0.949, suggesting that both algorithms perform comparably in this configuration. The comparison between PGA and PSO shows a mean difference of 38.9552, which is significant with a p-value of 0.0001, where PGA demonstrates superior performance in cost reduction.
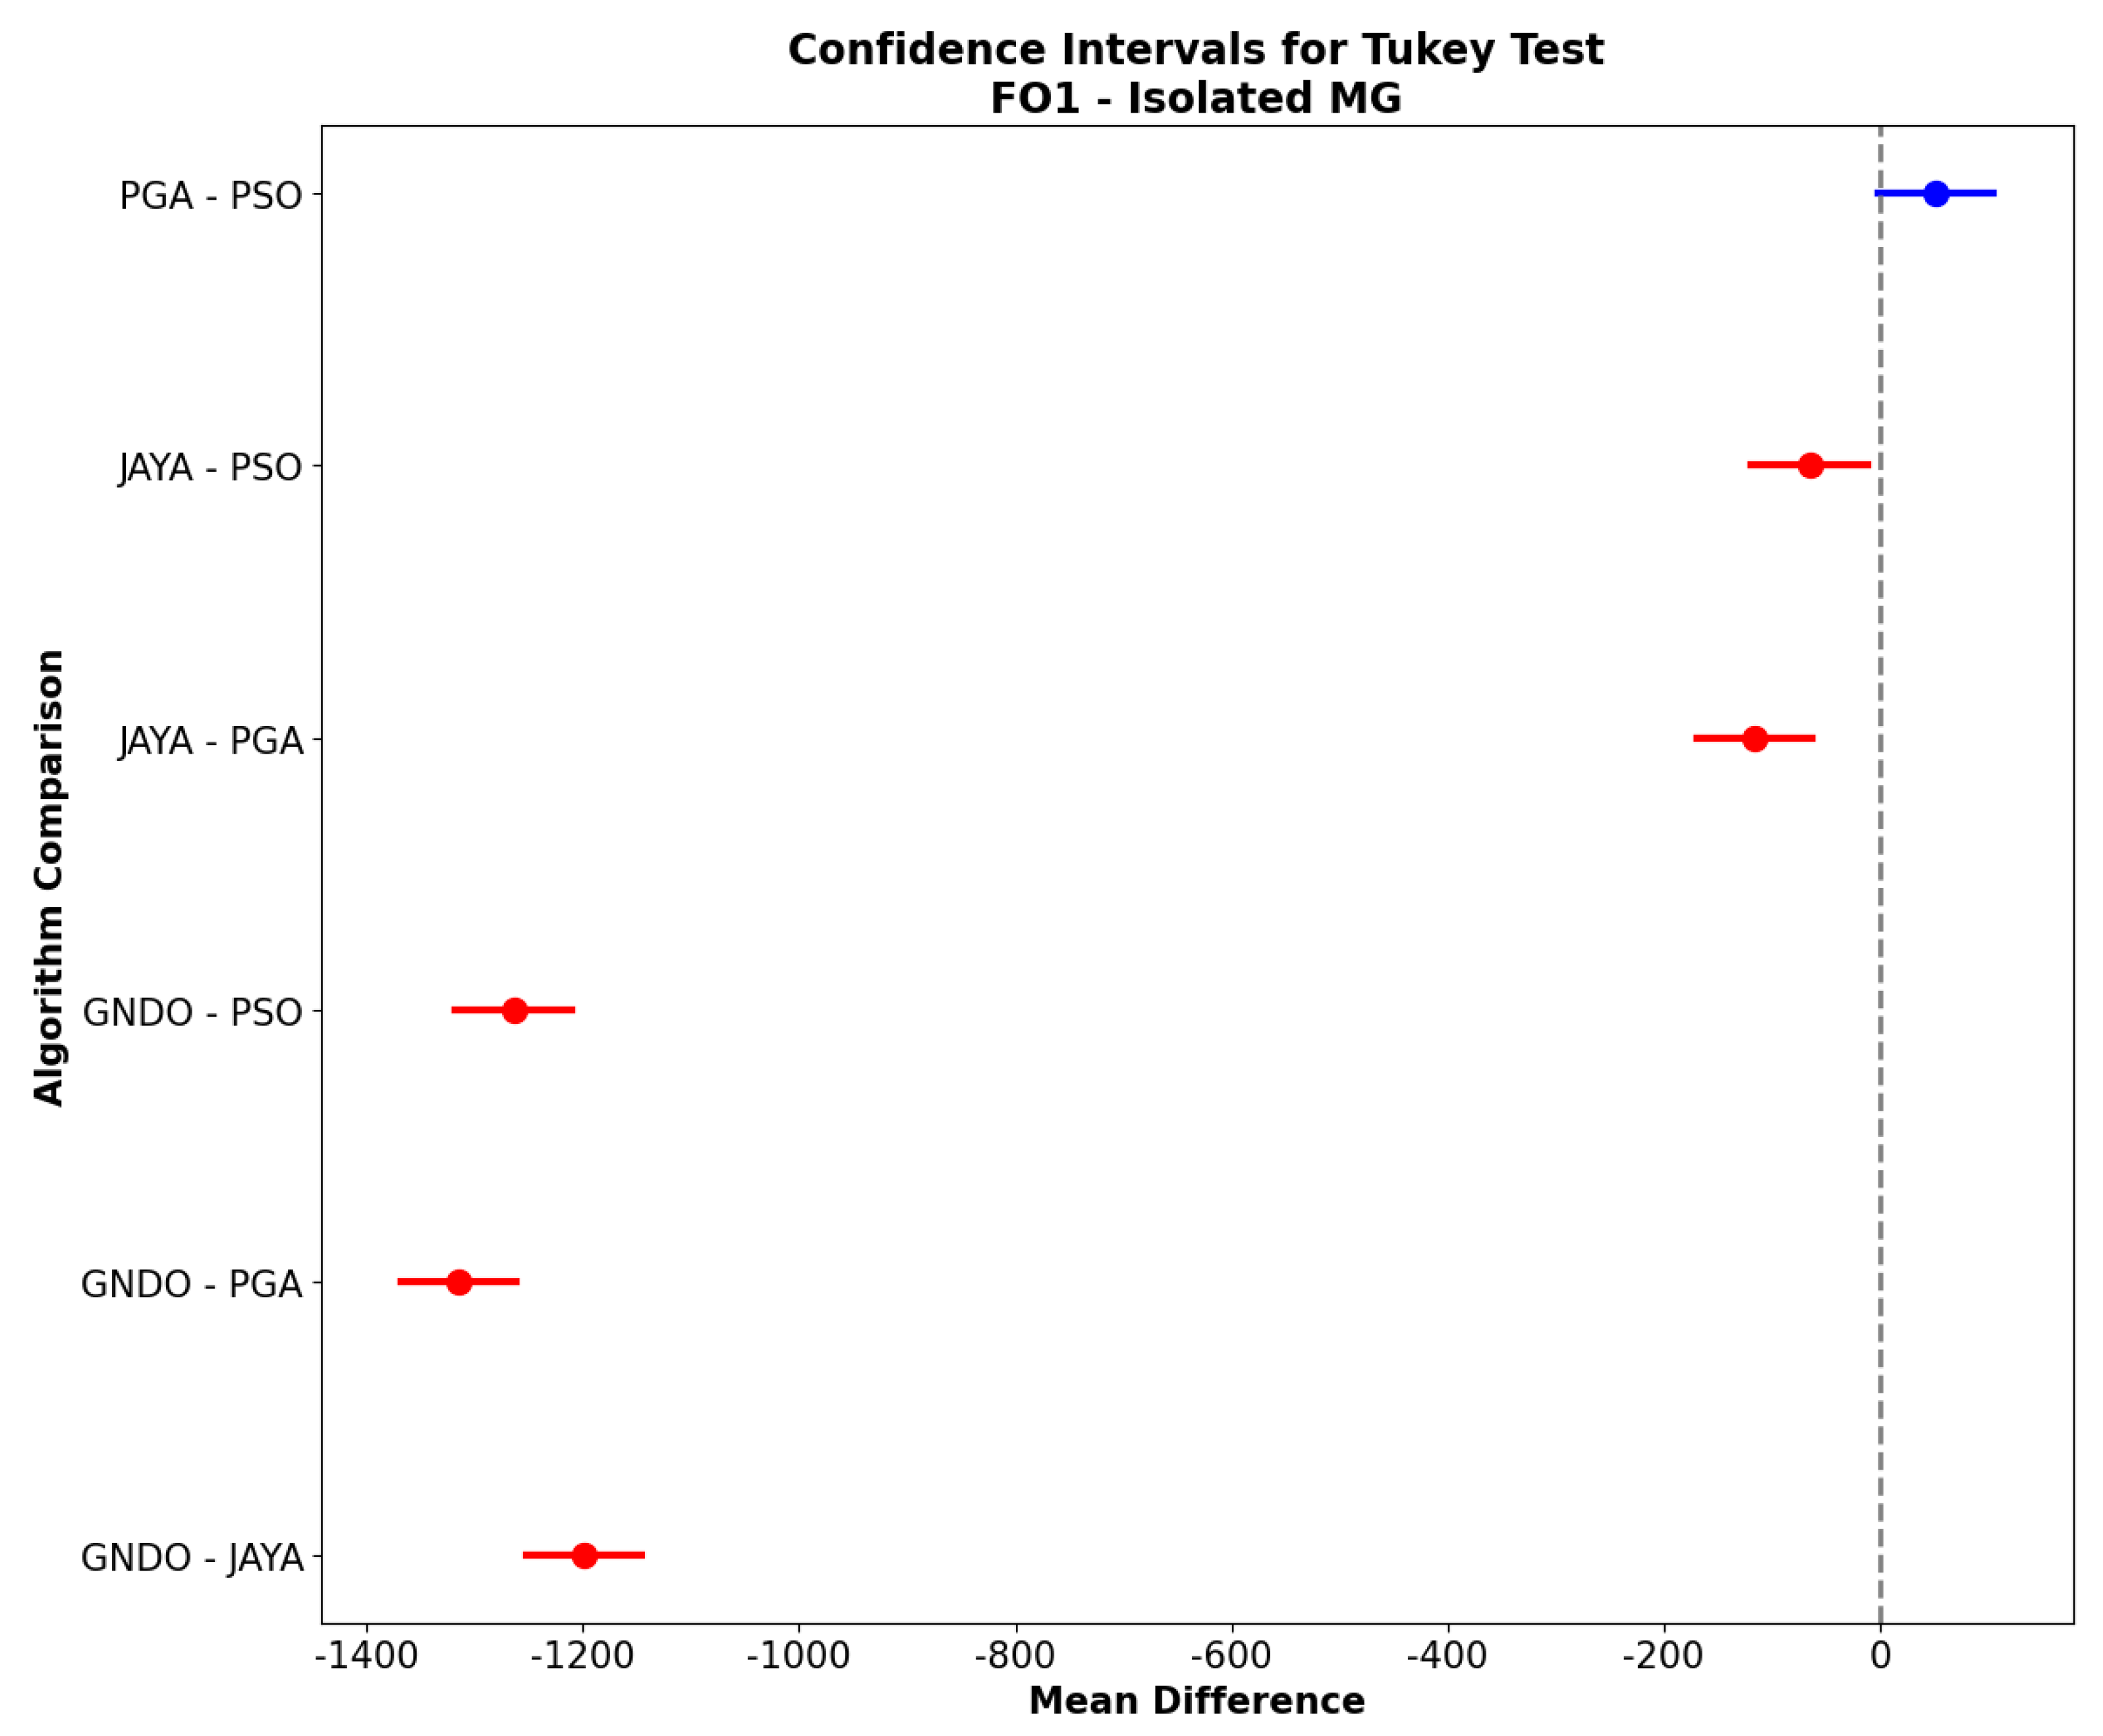
On the other hand, in the isolated configuration of the MG, the Tukey results show a similar pattern of significant differences. GNDO, once again, stands out from all the other methods with statistically significant differences, reaffirming its lower effectiveness in cost minimization in this isolated operating environment. When examining the difference between JAYA and PGA, statistical significance is observed with a p-value 0.0 and a confidence interval confirming that PGA achieves lower costs than JAYA. The comparison between JAYA and PSO also reveals a significant difference, with a p-value of 0.0096, indicating that PSO performs better on average than JAYA in this isolated context. However, when contrasting PGA with PSO, the result is insignificant (p-value of 0.0679), suggesting that both algorithms may be considered statistically equivalent regarding operational costs within the isolated MG.
These results support the conclusion that the PGA algorithm is consistently more effective in reducing operational costs in the connected MG, and shows competitive performance in the isolated MG. The Tukey HSD test results further reinforce the superiority of the PGA algorithm in both MG configurations regarding operational cost minimization, consistency, and statistical relevance in the generated solutions.
In Figure 6 and Figure 7, the confidence intervals for each comparison are presented, where the red and blue colors indicate whether the difference between the algorithms is significant. The red color denotes significant differences in performance between the algorithms, while the blue color indicates a difference that is not statistically significant at the significance level. The dashed vertical line at zero represents the threshold of no difference; if the confidence interval of the mean difference between two algorithms includes this point, there is insufficient evidence to claim that their performances are distinct. On the other hand, if the interval does not cross zero, the null hypothesis of equality of means is rejected, suggesting that one algorithm is significantly better or worse than the other.
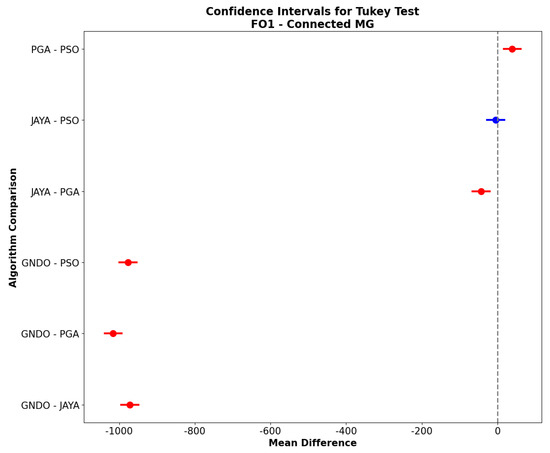
Figure 6.
Confidence intervals for the Tukey test in for grid-connected MG.
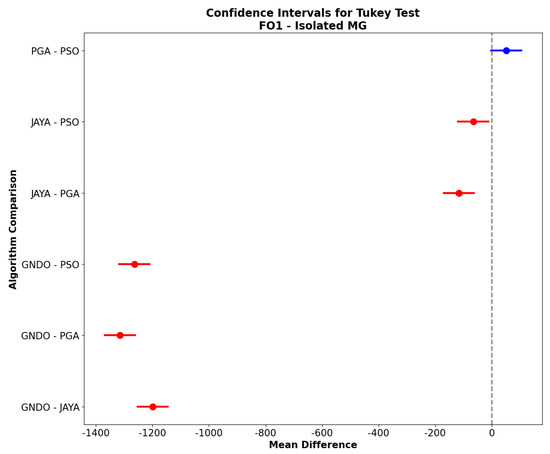
Figure 7.
Confidence intervals for the Tukey test in for isolated MG.
In Figure 6, corresponding to the MG in its connected mode, it can be observed that the PGA algorithm shows a statistically significant difference compared to the JAYA, GNDO, and PSO methods. The comparison between JAYA and PSO, marked in blue, indicates a non-significant difference, suggesting that these two algorithms have similar performance for in the connected grid. However, PGA stands out as the best option, consistently showing lower operational costs and significant differences from the other methods.
The results are consistent in Figure 7, representing the scenario of the MG in its isolated mode. Once again, the PGA algorithm proves to be significantly better than GNDO and JAYA, as evidenced by the confidence intervals that are far from zero. The comparison between JAYA and PSO also shows a significant difference in this case. In contrast, the comparison between PGA and PSO, shown in blue, crosses zero, indicating that their performances do not differ significantly. However, they would only be considered comparable in this specific case.
These Tukey test results reinforce the conclusion that the PGA algorithm provides the best solution in terms of operational cost for the MG in both operating modes. Although PSO shows similar performance to PGA in the isolated case, in the overall context of both scenarios, PGA stands out as the most consistent and efficient method.
Several statistical methods were applied to test the robustness and consistency of the optimization algorithms used for minimizing operational costs in the microgrid. First, a one-way analysis of variance (ANOVA) was conducted to assess whether there were statistically significant differences among the algorithms in both grid-connected and isolated configurations; the results indicated highly significant differences (). To further examine the residuals, the Shapiro–Wilk test was employed to check for normality, revealing deviations from normality, and Levene’s test confirmed the presence of heteroscedasticity—especially notable in the results from the GNDO and JAYA algorithms. Finally, Tukey’s honest significant difference (HSD) post hoc test was used for pairwise comparisons, which demonstrated that although PSO sometimes achieved slightly lower minimum cost values, its higher variability rendered it less reliable than the Population-Based Genetic Algorithm (PGA). These statistical analyses show that the PGA consistently delivers robust and stable performance across multiple runs, making it the most reliable method for operational cost minimization in this application. Table 8 provides a summary of the purpose and findings of those tests.
Table 8.
Summary of statistical methods and main conclusions.
6. Conclusions
This study evaluates four metaheuristic algorithms (PGA, PSO, JAYA, and GNDO) for minimizing operational costs in a 33-node microgrid under both connected and isolated modes. Our novel statistical framework, which employs ANOVA and Tukey’s post hoc tests, confirms significant performance differences and establishes the robustness of each method. Notably, the PGA algorithm consistently outperforms the others in the connected configuration due to its high stability and low variability, while PSO shows comparable results in the isolated mode. These findings fill an important gap in the literature by offering an evidence-based, statistically validated comparison that provides practical insights for microgrid designers and energy system operators.
Looking ahead, future research should expand cost optimization by incorporating not only the active power injection from WTs, but also the reactive power they generate. While reactive power is typically not managed in WTs, its inclusion would provide a more accurate representation of their impact on the technical conditions of the MG. Furthermore, this approach would facilitate a clearer evaluation of the potential for cost minimization improvements. Considering reactive power could lead to even greater cost reductions compared to managing only active power, highlighting the enhanced effectiveness of the implemented strategy and contributing to a deeper understanding of this optimization approach for such systems.
Another approach that could be further explored based on this research is incorporating additional objective functions, such as emissions and power loss () minimization. Optimizing these metrics in parallel with cost could lead to a more holistic approach to MG management, addressing both economic and environmental goals. Furthermore, exploring hybrid models that leverage the strengths of multiple algorithms could provide enhanced convergence speed and solution quality in complex multi-objective settings typical of modern distributed energy systems. Finally, the optimal location and sizing of wind turbines in the AC microgrid could be studied to enhance the economic, technical, and environmental impact of this renewable technology on the grid.
Author Contributions
Conceptualization, H.P.V. and L.F.G.-N.; methodology, L.F.G.-N. and D.S.-V.; software, L.F.G.-N., H.P.V. and D.S.-V.; validation, H.P.V. and D.S.-V.; formal analysis, H.P.V. and V.B.-G.; investigation, L.F.G.-N. and D.S.-V.; resources, L.F.G.-N.; data curation, H.P.V.; writing—original draft preparation, D.S.-V.; writing—review and editing, O.D.M. and V.B.-G.; visualization, D.S.-V. and H.P.V.; supervision, L.F.G.-N.; project administration, L.F.G.-N.; funding acquisition, L.F.G.-N. All authors have read and agreed to the published version of the manuscript.
Funding
This research has been funded by the ANID FONDECYT Iniciación 2024 Folio (11240006) under the project: “Smart energy management methods for improving the economic, technical, and environmental indexes of the alternating current microgrids including variable generation”.
Data Availability Statement
The original contributions presented in the study are included in the article; further inquiries can be directed to the corresponding author.
Acknowledgments
During the preparation of this work, the authors used Grammarly and ChatGPT to improve the writing and style. After using this tool, the authors reviewed and edited the content as needed and took full responsibility for the publication’s content.
Conflicts of Interest
The authors declare no conflicts of interest.
References
- Boche, A.; Foucher, C.; Villa, L.F.L. Understanding microgrid sustainability: A systemic and comprehensive review. Energies 2022, 15, 2906. [Google Scholar] [CrossRef]
- CNE. Norma Técnica de Calidad de Servicio para Sistemas de Distribución. 2019. Available online: https://www.cne.cl/wp-content/uploads/2019/12/Norma-Técnica-de-Calidad-de-Servicio-para-Sistemas-de-Distribución.pdf (accessed on 5 January 2025).
- Brusca, S.; Lanzafame, R.; Messina, M. Wind turbine placement optimization by means of the Monte Carlo simulation method. Model. Simul. Eng. 2014, 2014, 760934. [Google Scholar] [CrossRef]
- Emami, A.; Noghreh, P. New approach on optimization in placement of wind turbines within wind farm by genetic algorithms. Renew. Energy 2010, 35, 1559–1564. [Google Scholar] [CrossRef]
- MansourLakouraj, M.; Shahabi, M.; Shafie-khah, M.; Catalão, J.P. Optimal market-based operation of microgrid with the integration of wind turbines, energy storage system and demand response resources. Energy 2022, 239, 122156. [Google Scholar] [CrossRef]
- Asaah, P.; Hao, L.; Ji, J. Optimal Placement of Wind Turbines in Wind Farm Layout Using Particle Swarm Optimization. J. Mod. Power Syst. Clean Energy 2021, 9, 367–375. [Google Scholar] [CrossRef]
- Zitar, R.; Al-Betar, M.; Awadallah, M.; Abu Doush, I.; Assaleh, K. An Intensive and Comprehensive Overview of JAYA Algorithm, its Versions and Applications. Arch. Comput. Methods Eng. 2021, 29, 763–792. [Google Scholar] [CrossRef]
- Shaheen, M.A.M.; Hasanien, H.M.; Al-Durra, A. Solving of Optimal Power Flow Problem Including Renewable Energy Resources Using HEAP Optimization Algorithm. IEEE Access 2021, 9, 35846–35863. [Google Scholar] [CrossRef]
- Farhat, M.; Kamel, S.; Atallah, A.M.; Khan, B. Optimal Power Flow Solution Based on Jellyfish Search Optimization Considering Uncertainty of Renewable Energy Sources. IEEE Access 2021, 9, 100911–100933. [Google Scholar] [CrossRef]
- Reddy, Y.; Jithendranath, J.; Chakraborty, A.K.; Guerrero, J.M. Stochastic optimal power flow in islanded DC microgrids with correlated load and solar PV uncertainties. Appl. Energy 2022, 307, 118090. [Google Scholar] [CrossRef]
- Cantor, J.; Rivera, S. Optimización heurística en el diseño de parques eólicos. Ing. Región 2016, 16, 9–24. [Google Scholar] [CrossRef]
- Mahat, P.; Ongsakul, W.; Mithulananthan, N. Optimal Placement of Wind Turbine DG in Primary Distribution Systems for Real Loss Reduction. 2006. Available online: https://www.researchgate.net/publication/43516541_Optimal_placement_of_wind_turbine_DG_in_primary_distribution_systems_for_real_loss_reduction (accessed on 1 February 2025).
- Mokryani, G.; Siano, P.; Piccolo, A. Optimal allocation of wind turbines in microgrids by using genetic algorithm. J. Ambient Intell. Humaniz. Comput. 2013, 4, 613–619. [Google Scholar] [CrossRef]
- Zhao, L.; Yao, G.; Zhou, L. Construction of Wind Power Generation System Control and Energy Management System Based on Model Predictive Control. In Proceedings of the 2023 International Conference on Telecommunications, Electronics and Informatics (ICTEI), Lisbon, Portugal, 11–13 September 2023; IEEE: Piscataway, NJ, USA, 2023; pp. 586–590. [Google Scholar]
- Belbachir, N.; Kamel, S.; Hassan, M.H.; Zellagui, M. Optimizing energy management of hybrid wind generation-battery energy storage units with long-term memory artificial hummingbird algorithm under daily load-source uncertainties in electrical networks. J. Energy Storage 2024, 78, 110288. [Google Scholar] [CrossRef]
- Joshi, S.K.; Bansal, J.C. Parameter tuning for meta-heuristics. Knowl.-Based Syst. 2020, 189, 105094. [Google Scholar] [CrossRef]
- Kaymaz, E.; Duman, S.; Guvenc, U. Optimal power flow solution with stochastic wind power using the Lévy coyote optimization algorithm. Neural Comput. Appl. 2021, 33, 6775–6804. [Google Scholar] [CrossRef]
- Hossain, M.A.; Ahmed, A.; Tito, S.R.; Ahshan, R.; Sakib, T.H.; Nengroo, S.H. Multi-Objective Hybrid Optimization for Optimal Sizing of a Hybrid Renewable Power System for Home Applications. Energies 2022, 16, 96. [Google Scholar] [CrossRef]
- Herrera-Briñez, M.; Montoya Giraldo, O.; Alvarado-Barrios, L.; Chamorro, H. The Equivalence between Successive Approximations and Matricial Load Flow Formulations. Appl. Sci. 2021, 11, 2905. [Google Scholar] [CrossRef]
- Sreelekshmi, R.; Lakshmi, R.; Nair, M.G. AC microgrid with battery energy storage management under grid connected and islanded modes of operation. Energy Rep. 2022, 8, 350–357. [Google Scholar]
- Sebastián, R. Review on dynamic simulation of wind diesel isolated microgrids. Energies 2021, 14, 1812. [Google Scholar] [CrossRef]
- Bahij, Z. DC Microgrid Modeling and Control in Islanded Mode; Rochester Institute of Technology: Rochester, NY, USA, 2021. [Google Scholar]
- Mobarra, M.; Rezkallah, M.; Ilinca, A. Variable speed diesel generators: Performance and characteristic comparison. Energies 2022, 15, 592. [Google Scholar] [CrossRef]
- Grisales-Noreña, L.F.; Montoya, O.D.; Ramos-Paja, C.A. An energy management system for optimal operation of BSS in DC distributed generation environments based on a parallel PSO algorithm. J. Energy Storage 2020, 29, 101488. [Google Scholar] [CrossRef]
- Jain, N.; Singh, S.; Srivastava, S. PSO based placement of multiple wind DGs and capacitors utilizing probabilistic load flow model. Swarm Evol. Comput. 2014, 19, 15–24. [Google Scholar] [CrossRef]
- Barnawi, A.B. Development and Analysis of Optimization Algorithm for Demand-Side Management Considering Optimal Generation Scheduling and Power Flow in Grid-Connected AC/DC Microgrid. Sustainability 2023, 15, 15671. [Google Scholar] [CrossRef]
- Rosales Muñoz, A.A.; Grisales-Noreña, L.F.; Montano, J.; Montoya, O.D.; Giral-Ramírez, D.A. Optimal power dispatch of distributed generators in direct current networks using a Master–Slave methodology that combines the Salp swarm algorithm and the successive approximation method. Electronics 2021, 10, 2837. [Google Scholar] [CrossRef]
- Yu, K.; Liang, J.; Qu, B.; Chen, X.; Wang, H. Parameters identification of photovoltaic models using an improved JAYA optimization algorithm. Energy Convers. Manag. 2017, 150, 742–753. [Google Scholar] [CrossRef]
- Kusuma, V.A.; Firdaus, A.A.; Suprapto, S.S.; Putra, D.F.U.; Prasetyo, Y.; Filliana, F. Leveraging PSO algorithms to achieve optimal stand-alone microgrid performance with a focus on battery lifetime. Int. J. Appl. Power Eng. 2023, 12, 293–299. [Google Scholar] [CrossRef]
- Grisales-Noreña, L.; Cortés-Caicedo, B.; Montoya, O.D.; Sanin-Villa, D.; Gil-González, W. Integration of BESS in grid connected networks for reducing the power losses and CO2 emissions: A parallel master-stage methodology based on PDVSA and PSO. J. Energy Storage 2024, 87, 111355. [Google Scholar] [CrossRef]
- Sanin-Villa, D.; Hernandez, C.M.; Martinez, A.F. Analyzing Travel Service Costs and Customer Behavior Through ANOVA and Chi-Square Tests. Futur. Proc. 2024, 1. [Google Scholar] [CrossRef]

Disclaimer/Publisher’s Note: The statements, opinions and data contained in all publications are solely those of the individual author(s) and contributor(s) and not of MDPI and/or the editor(s). MDPI and/or the editor(s) disclaim responsibility for any injury to people or property resulting from any ideas, methods, instructions or products referred to in the content. |
© 2025 by the authors. Licensee MDPI, Basel, Switzerland. This article is an open access article distributed under the terms and conditions of the Creative Commons Attribution (CC BY) license (https://creativecommons.org/licenses/by/4.0/).