Article

Novel Approach for Robust Control of Axial Piston Pump

1
Department of Systems and Control, Technical University of Sofia, Kliment Ohridski 8 Boulevard, 1000 Sofia, Bulgaria
2
Department of Hydroaerodynamics and Hydraulic Machines, Technical University of Sofia, Kliment Ohridski 8 Boulevard, 1000 Sofia, Bulgaria
*
Author to whom correspondence should be addressed.
Mathematics 2025, 13(4), 643; https://doi.org/10.3390/math13040643
Submission received: 31 January 2025 / Revised: 12 February 2025 / Accepted: 14 February 2025 / Published: 16 February 2025

Abstract

:
The article is devoted to designing novel multivariable robust μ-control of an open-circuit axial piston pump. In contrast with classical solutions of displacement volume control, in our case, the hydro-mechanical controller (by pressure, flow rate, or power) is replaced by an electro-hydraulic proportional valve which receives a control signal from an industrial microcontroller. The valve is used as the actuator of the pump swash plate. The pump swash plate swivel angle determines the displacement volume and the flow rate of the pump. The μ-controller design is performed on the basis of a one-input, two-output model with multiplicative output uncertainty. This model is estimated and validated from experimental data at various loads by multivariable identification. The designed control system achieves robust stability and robust performance for the wide working mode of an axial piston pump. To conduct this experimental study, the authors have developed a laboratory test bench, enabling a real-time function of the control system via USB/CAN communication. The designed controller is implemented in a rapid prototyping system, and real-time experiments are performed. They show the advantages of μ-control and confirm the possibility of its implementation in the case of the real-time control of an axial piston pump.

1. Introduction

In the theory and practice of hydraulic drives, there are three main methods used to control the speed of hydraulic cylinders or motors—throttle, volumetric, and combined (volumetric–throttle). With respect to energy efficiency, the volumetric method is preferred for both industrial and mobile applications of hydraulic drive, especially in cases where the power is above 2–4 kW [1]. Volumetric control is based on the use of a variable displacement pump. This means that at a constant rotation frequency of the pump, depending on the control law of the pump regulator, the main energy parameters (flow rate and pressure) are changed. The classical controllers are hydro-mechanical (by pressure, flow rate, or power). The purpose of volumetric control is to use as much energy as is necessary for the drive, and not at the expense of losses from hydraulic resistance, as in the case of the throttle control method [2]. A special case of this volumetric method is a pump with a fixed displacement volume with the ability to change the rotational frequency [3].
For the control of axial piston pumps and motors, most types of control laws are implemented in control devices. Replacing the hydro-mechanical controller with a proportional or servo valve, which serves as an actuator when changing the displacement volume, has led to a significant increase in the possibilities for regulation, allowing for a combination of classical control laws and the achievement of better control performance [4]. Along with a number of their other advantages (high power density, high pressure, higher rotational frequency, compactness, etc.), the possibilities for the more efficient drive and control of large power applications make axial piston machines the most preferred, especially when they are implemented as a pump [5,6]. In addition, the development of control theory [7,8] further expands the possibility of increasing efficiency by applying robust real-time control laws through embedded controllers of a proportional spool valve [9,10,11,12,13,14]. It is worth noting that the development of digital transformation has not missed hydraulic drives. Looking for a way to increase the efficiency and control performance, as well as reduce the cost, one possible approach is to replace proportional, high-response, and servo valves with small, two-way two-position valves connected in parallel, which are controlled by a high-frequency digital signal. This motivates the development of “digital fluid power” [15,16,17,18,19].
Foregoing is the reason why researchers and practitioners have been searching for years for a synergy between modern hydraulic devices and modern control theory [2,7]. In retrospect, the first research and development were based on the use of a proportional or servo valve controlled by a selective external electronic amplifier implementing an analog PID controller with the possibility of the potentiometer adjustment of control parameters [4,20,21,22]. The feedback is either mechanical or through a built-in position transducer. With the development of industrial microcontrollers, the possibility of their application in hydraulic drives appears in particular variable displacement pumps [23]. In this way, the analog PID controller becomes embedded through a suitable software environment. Further improvement in the classical PID control law is aimed at the development of advanced control techniques based on the search for optimality criteria on the transfer matrix of the plant [24,25,26]. Their implementation becomes relatively easy with the development of computing technology. Regardless of the type of embedded control law, the requirement of an adequate mathematical model is still relevant today. The limitation for deriving a physical model [27] is overcome by the means and methods of system identification [28,29,30]. Through it, based on experimentally obtained data, a model which sufficiently accurately describes the dynamics of the plant in a wide frequency range can be obtained and validated. This facilitates the application of adaptive and robust controllers by a preliminary study of uncertainty [9,11,13,31]. With the development of modern control theory, advanced techniques such as linear–quadratic–Gaussian (LQG), H-infinity (H), and μ-controller have found applications in hydraulic drives [7,8,32,33,34,35,36,37,38,39].
The main goal of this article is to design a novel multivariable robust μ-controller of an open-circuit axial piston pump. In contrast with classical solutions of displacement volume control, in our case, the hydro-mechanical controller (by pressure, flow rate, or power) is replaced by an electro-hydraulic proportional valve, which receives a control signal from an industrial microcontroller. The valve is used as the actuator of the pump swash plate. The pump swash plate swivel angle determines the displacement volume and the flow rate of the pump. The μ-controller design is performed on the basis of an one-input, two-output model with multiplicative output uncertainty. This model is estimated and validated from experimental data at various loads by multivariable identification. The designed control system achieves robust stability and robust performance for the wide working mode of an axial piston pump. To conduct this experimental study, the authors developed a laboratory test bench, enabling a real-time function of the control system via USB/CAN communication. The designed controller is implemented in a rapid prototyping system, and real-time experiments are performed. They show the advantages of μ-control and confirm the possibility of its implementation in the case of the real-time control of an axial piston pump.
The main contributions of this article are as follows:
  • The general novelty of this paper is that for the first time, a discrete time multivariable robust μ-controller for open-circuit axial piston pumps is designed. Moreover, it is implemented in a conventional digital device. In this way, the traditional hydro-mechanical controller is replaced with an electro-hydraulic proportional valve controlled by an industrial microcontroller.
  • The design and implementation of a laboratory test bench enable the real-time control and rapid prototyping of μ-controllers. Moreover, this test bench provides the possibility of investigating relatively easily an axial piston pump control system with all types of digital controllers.
  • The performance of robust stability and robust performance analysis of uncertain systems with designed full-order and reduced-order μ-controllers.
  • Successful implementation and experimental validation of μ-controllers of different orders (21st, 6th, and 4th), demonstrating robust stability and robust performance across a wide range of operating conditions.
These contributions advance the field of hydraulic displacement pump control by demonstrating the effectiveness of robust control techniques in maintaining stability and performance across varying load conditions while also showing the potential for implementing reduced-order controllers without significant performance degradation.
This article is organized as follows: Section 2 presents a short description of the system for the rapid prototyping of control algorithms and the identification of the model procedure with output multiplicative uncertainty. In Section 3, the novel robust control approach is shown, Section 4 presents the experimental results obtained with the designed robust controller, and Section 5 details a short conclusion.

2. Plant Description and Modeling

2.1. System for Rapid Prototyping of Control Algorithms

The authors have developed a laboratory setup for testing a variable displacement axial piston adjustable pump. The setup allows for a rapid prototyping of various control algorithms for controlling the pump’s displacement volume in real time. The detailed diagram of the experimental setup, including the two main subsystems (hydraulic and control), is shown in Figure 1. A description of the system is presented in [23], and in this article, only a brief explanation of the main components and the principle of operation is given.
The hydraulic subsystem consists of a tank with a volume of 130 L which serves as the base of the hydraulic power unit. The power unit consists of a variable displacement axial piston pump type A10VSO with a displacement volume of 18 cm3 intended for hydraulic systems with open circulation. The pump is driven by a three-phase asynchronous electric motor with a power of 7.5 kW and a constant rotation frequency of 1450 min−1. Unlike the classic pump configuration with a hydro-mechanical controller [40], in this case, it is replaced with a three-way two-position proportional valve of type VT-DFP [41] with an embedded spool position feedback LVDT sensor. The valve has the same mount plate for the connection to the pump housing. The valve is selective for the specific pump type and serves to change the swash plate swivel angle (specific to this type of the pump), which changes the flow rate at a constant rotation frequency. As an addition, a hydraulic coupling plate has been developed, allowing for the parallel connection of a hydro-mechanical pressure controller type DR. The DR controller serves to limit the maximum pressure value in the case of the failure of proportional control. The pump loading system is implemented by a direct operated pressure-relief valve and a throttle check valve connected in parallel. The relief valve sets the maximum pressure level, and the throttle valve precisely adjusts the load pressure disturbance. A measurement of the flow rate and outlet pressure is performed by a gear flow meter with a pressure transducer.
The control subsystem includes the system for the rapid prototyping of control algorithms [42]. It consists of an external electronic amplifier of type VT-5041 designed for the used type of proportional valve, which receives a control signal from a microcontroller type MC012-022 [43]. In the MATLAB/Simulink®, various control algorithms are implemented that form a signal according to the assignment to the microcontroller. The connection between the portable workstation and the microcontroller is made via USB/CAN interface type CG150. The controller calculates the control signal values supplied to the power stage of the electronic amplifier. The electronic amplifier drives the valve’s proportional solenoid and processes the spool position feedback signal. In this case, the control subsystem enables real-time control through an algorithm implemented by the Simulink® model. The sampling time of 0.01 s ensures precise control of the pump displacement volume.

2.2. Identification Model with Multiplicative Uncertainty

There are many theoretical possibilities to develop various models of an axial piston pump. The obvious choice is to obtain a nonlinear model by describing the physics of the processes occurring in the pump, especially depending on the dynamics between the axial piston pump flow, axial piston pump pressure, and duty coefficient of the pulse width modulation of the swash plate. The main difficulty in obtaining such a nonlinear model is that there is not a sufficient amount of information about more of the axial piston pump parameters, which results in an additional modeling error. Moreover, after the eventual linearization of this model, additional errors will occur. This motivates us to obtain a directly linear discrete time invariant axial piston pump model. The black-box discrete time state-space model is estimated from the experimental data. The main advantage of this model is that it can be used directly for the design of various discrete time controllers, which can be implemented in digital control devices. Another advantage of such a modeling approach is that there is no need for prior information of the axial piston pump’s parameter values and characteristics. Moreover, it is possible to obtain not only a nominal pump model but also a model with uncertainty. Herein, the discrete time state-space model with output multiplicative uncertainty of the axial piston pump is presented.
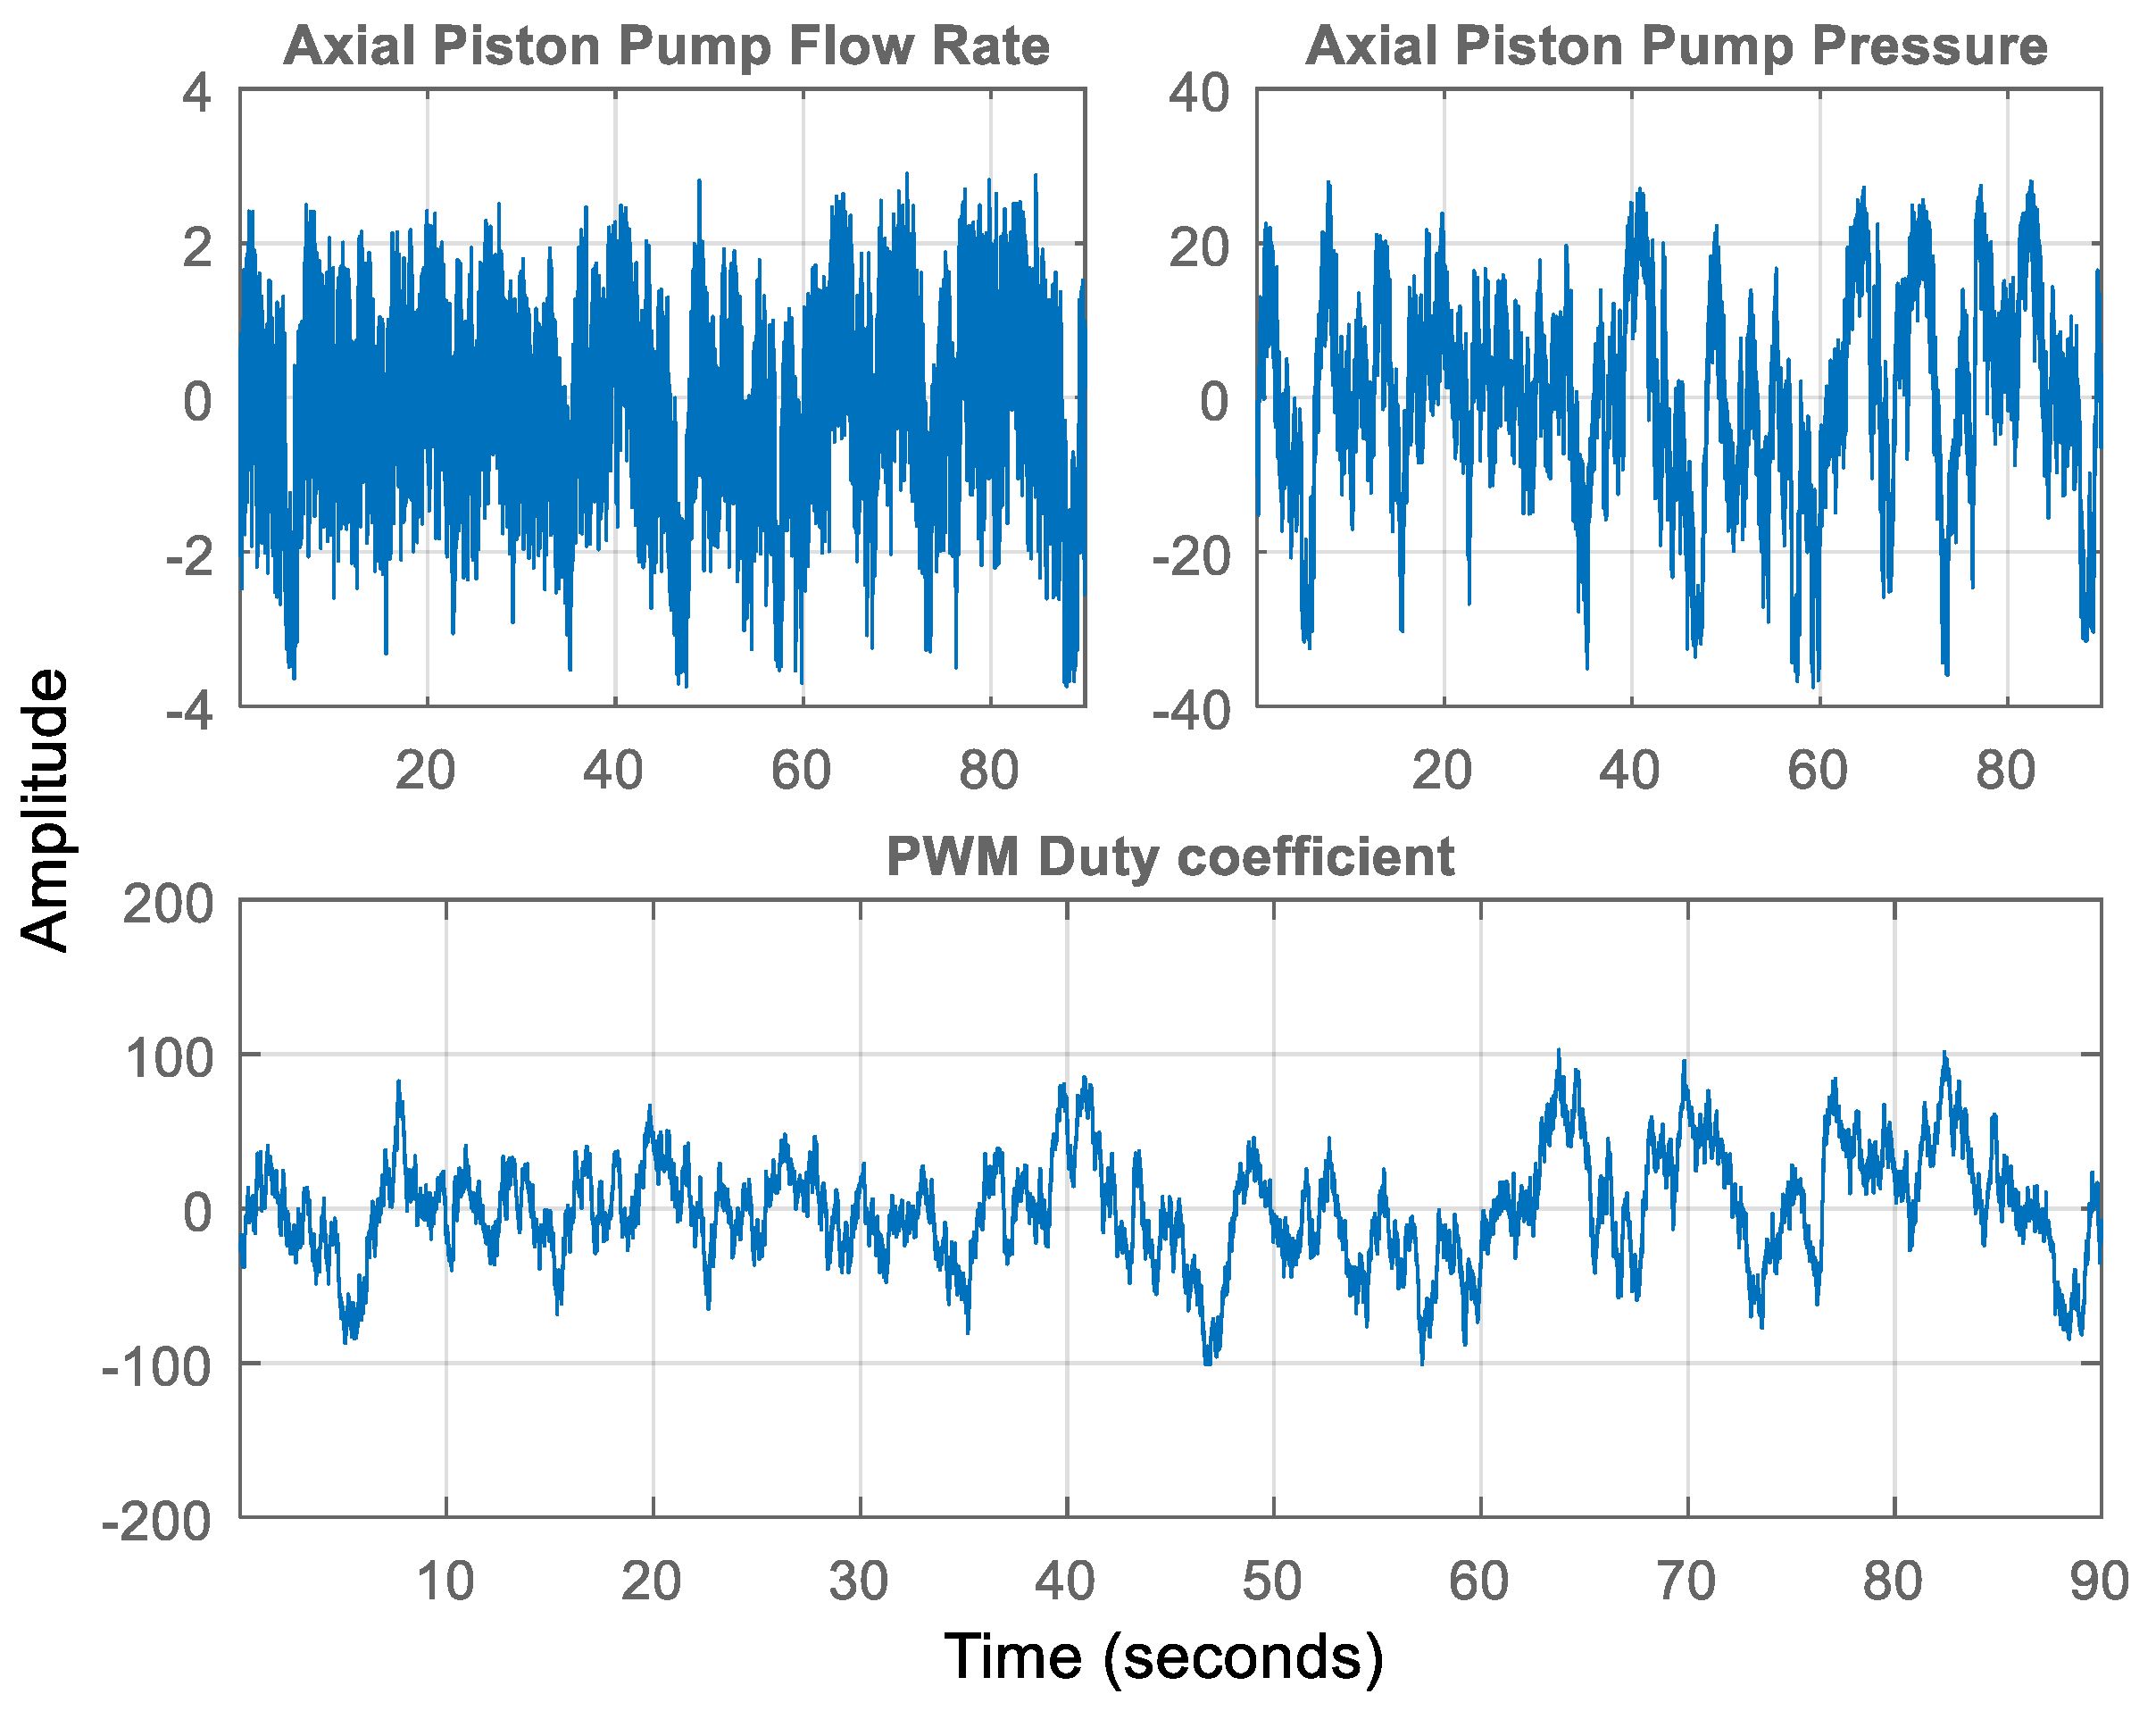
The nominal two outputs, one input discrete time state-space model of the sixth order is estimated by a prediction error method for state-space models using the MATLAB System Identification Toolbox™ function ssest [44]. This is performed on the basis of centered experimental data (pump control signal, pump flow rate, and pump pressure) measured with sample time T 0 = 0.01 s and depicted in Figure 2 [29]. The nominal model equations are
x ( k + 1 ) = A   x ( k ) + B   u ( k ) + K m η ( k ) , y ( k ) = C   x ( k ) + D   u ( k ) + η ( k ) .
The values of the matrices are
A = 0 1 0 0 0 0 0 0 1 0 0 0 0.3 0.43 0.84 0.01 0.04 0.03 0 0 0 0 1 0 0 0 0 0 0 1 0.57 11.17 10.83 0.72 1.62 1.9 , B = 0.005 0.161 0 0.209 0.046 0.058 , K m = 0 0.075 0.082 0.015 0.031 0.031 0.423 0.099 0.033 0.259 0.141 0.029 , C = 1 0 0 0 0 0 0 0 0 1 0 0   and   D = 0 0 ,
where x ( k ) = x 1 ( k ) x 2 ( k ) x 3 ( k ) x 4 ( k ) x 5 ( k ) x 6 ( k ) T is the state vector, y ( k ) = y Q y P T is the output vector, y Q (L/min) is the measured axial piston pump flow rate, y P (bar) is the measured axial piston pump pressure, u ( k ) (mV) is the control signal (pulse width modulation), η ( k ) = η Q ( k ) , η p ( k ) T is the residual vector, η Q ( k ) is the pump flow rate residual error, and η P ( k ) is the pump pressure residual error. It is well known that if the elements of the residual vector are white Gaussian noises, then the estimated model parameters A , B , C , D , K m are unbiased.
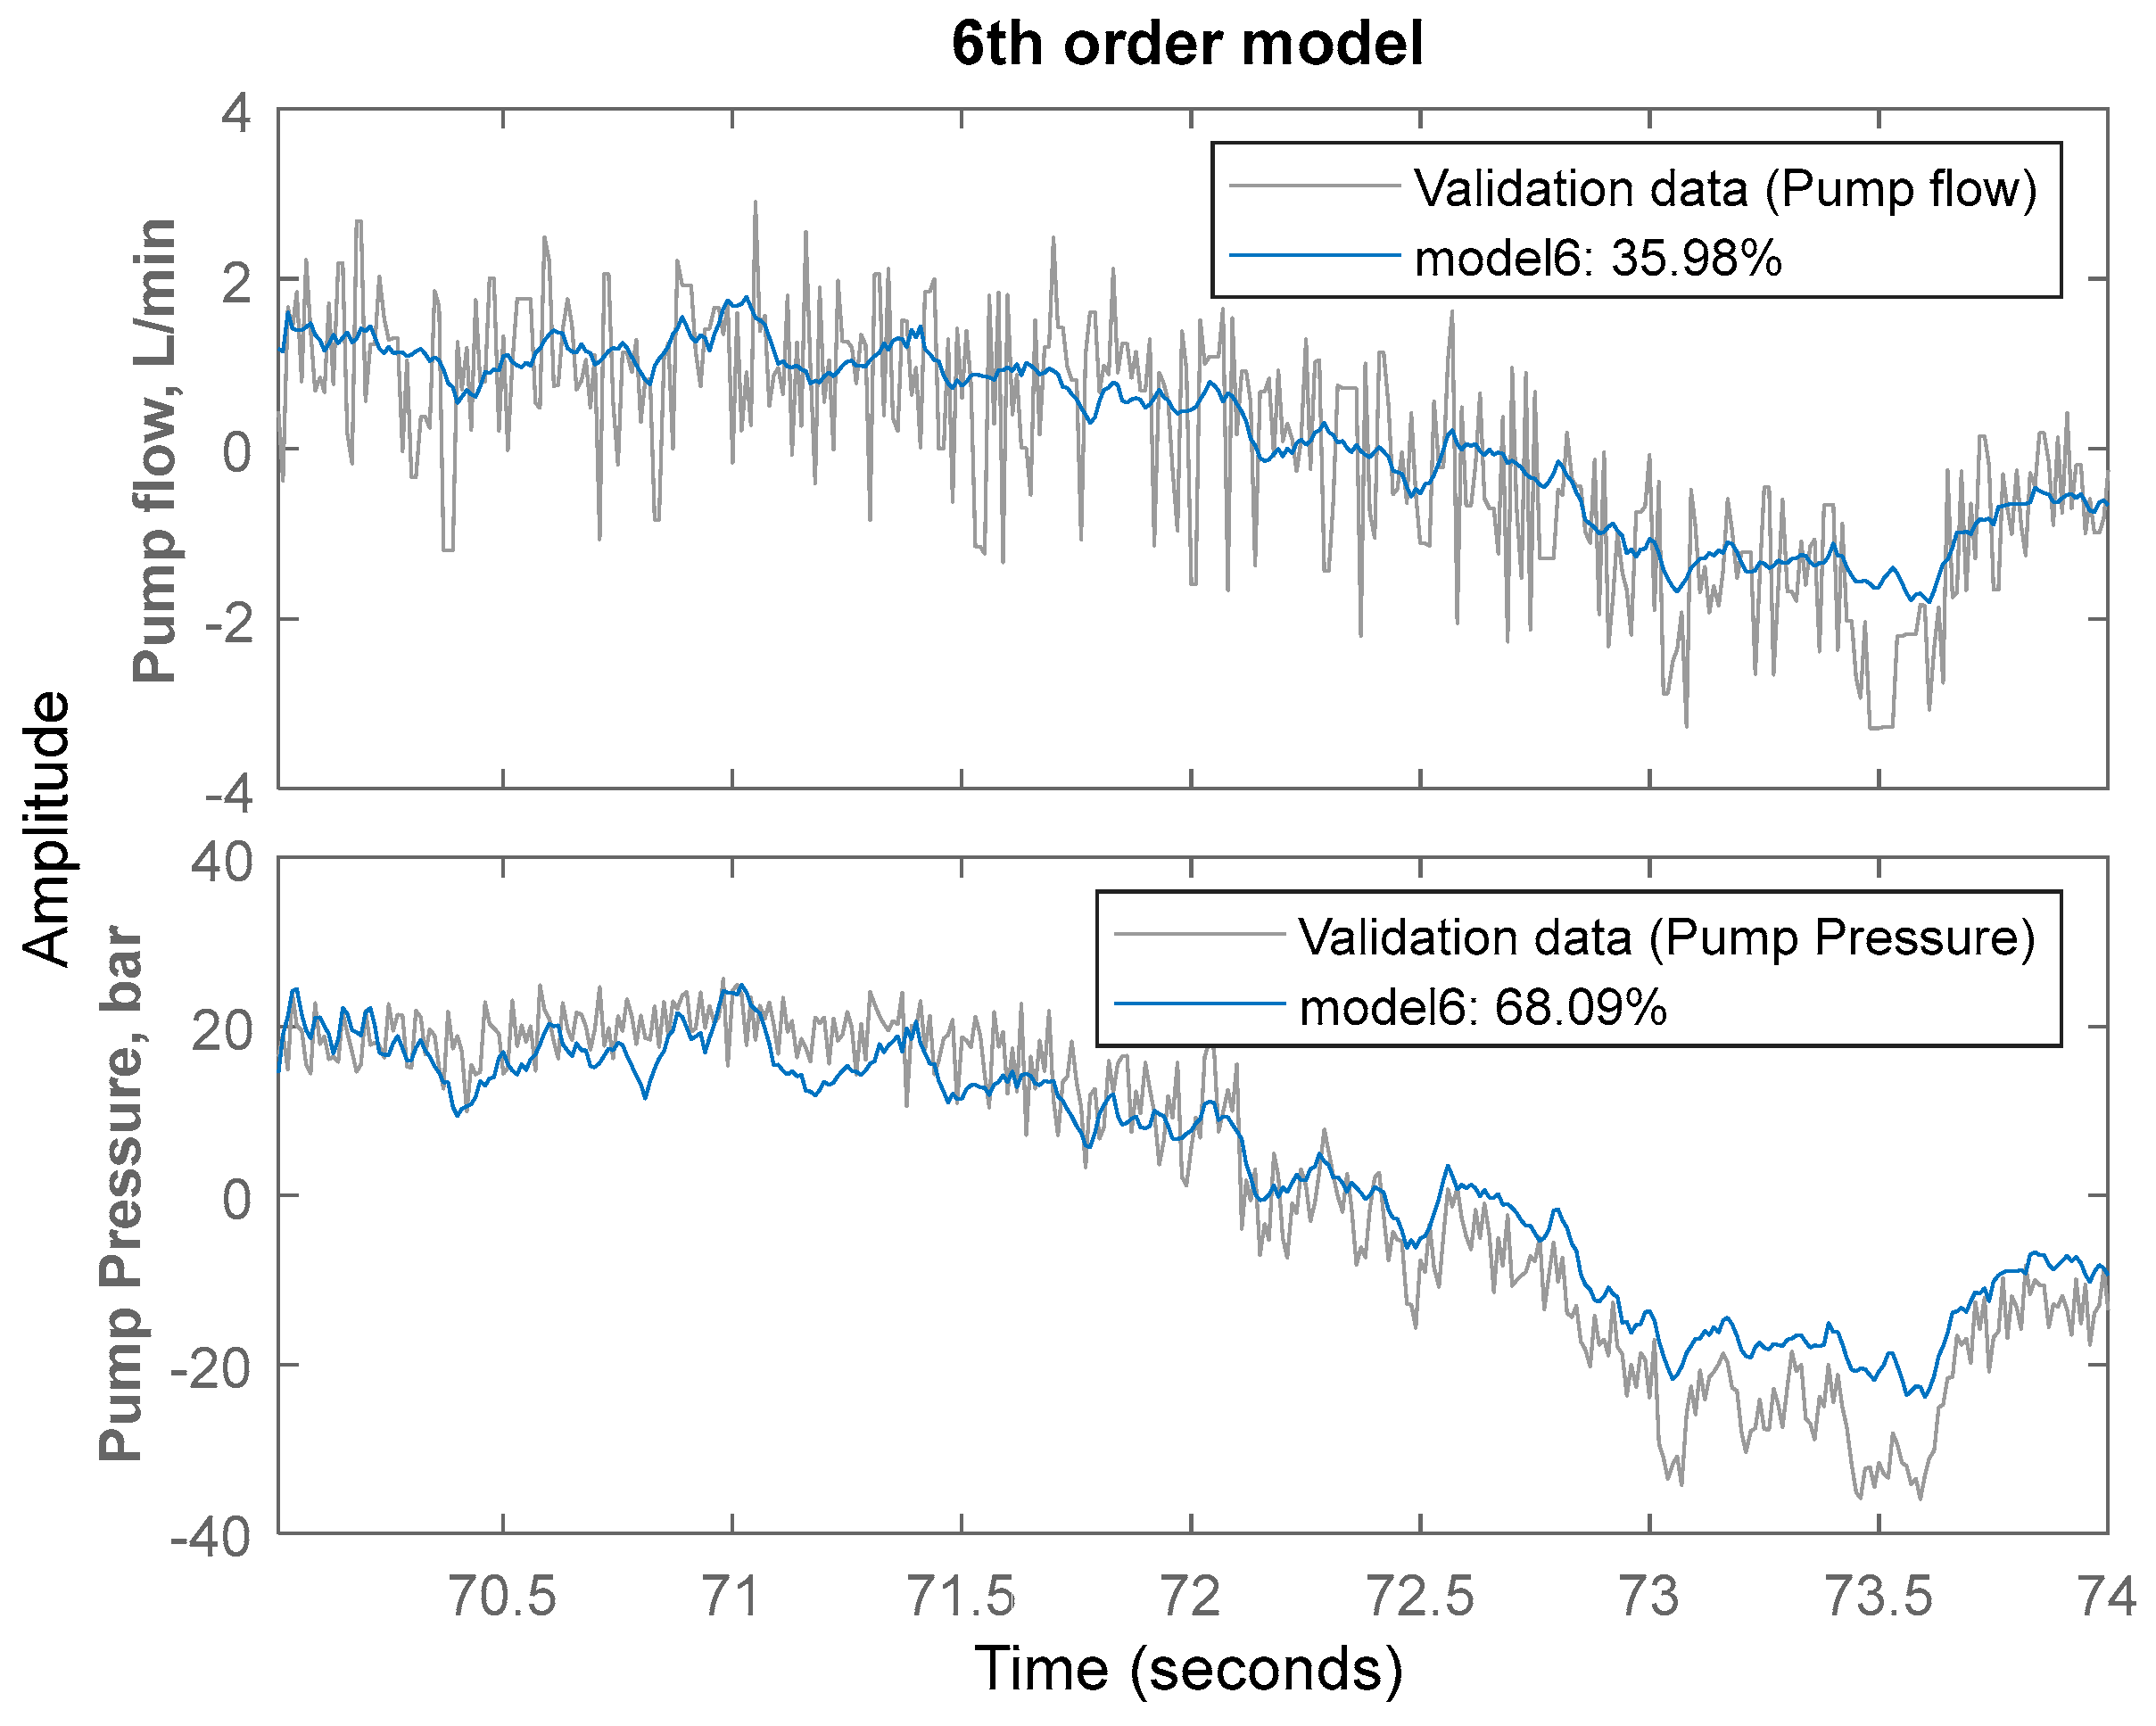
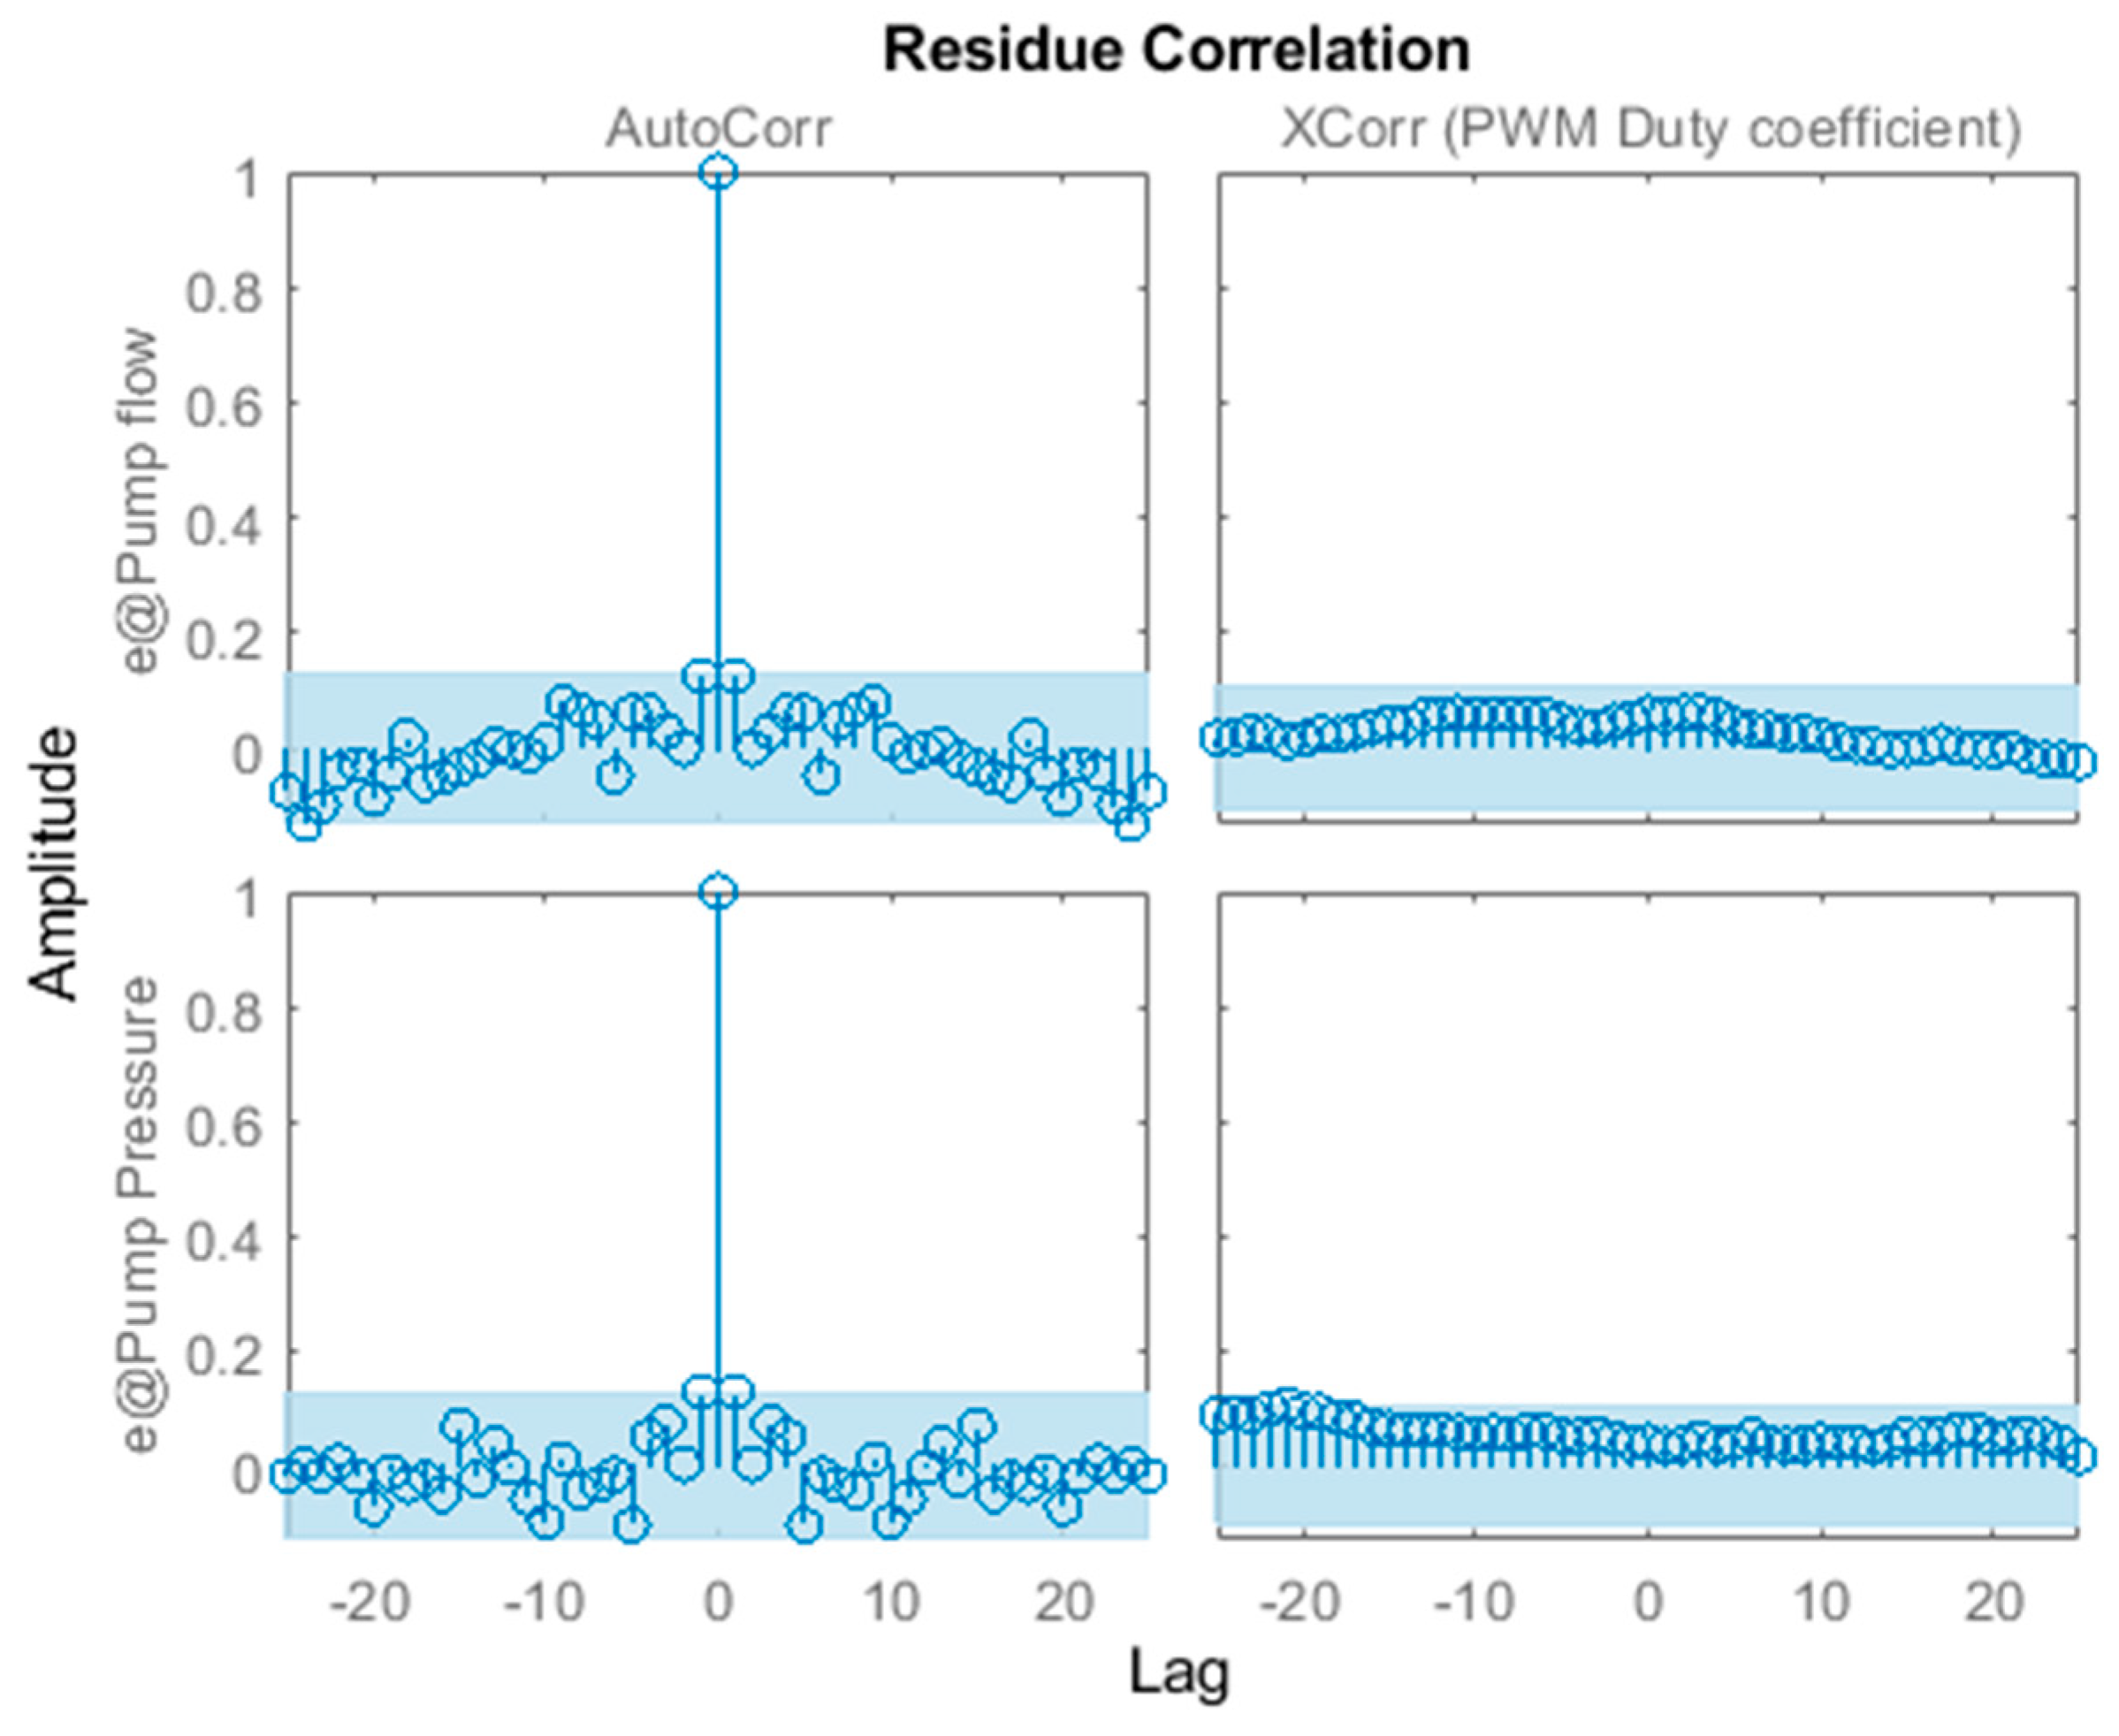
In Figure 3, the model outputs and measured outputs are compared. The obtained values of FIT between outputs are sufficiently large. It is seen that the main dynamics for both outputs are well described by the obtained state-space model. In Figure 4, the results from the residual error correlation test for model validation are presented. The residual errors η Q ( k ) and η P ( k ) are white Gaussian noises, and there is no correlation between the residuals and input signal.
Because of the unbiasedness of the model parameter estimates, it is easy to obtain bounds of structured (parameters) uncertainty on the basis of their confidence intervals. It is known that the synthesis of the μ -controller has some numerical problems in the case of many uncertain parameters. Here, model (1) has 30 uncertain parameters that are too much for the μ design procedure. One possible solution to this problem is to transform the model with structured uncertainty to one with unstructured uncertainty. This is achieved with the help of the Gauss approximation [28]. As a result, the covariances of the frequency responses of model (1) are formed by
Δ G Q ( j ω ) = 1 N G Q ( j ω , θ ) T P θ G Q ( j ω , θ ) T Δ G P ( j ω ) = 1 N G P ( j ω , θ ) T P θ G P ( j ω , θ ) T ,
where N is the number of experimental data and θ is the model parameters vector (elements of matrices in (1)). G Q ( j ω , θ ) and G P ( j ω , θ ) are the gradients of discrete time transfer functions corresponding to nominal model (1) with respect to θ . P θ is the covariation matrix of the model parameters. It is evaluated based on the residual error η ( k ) with the help of the MATLAB System Identification Toolbox™ function ssest [44]. Due to the unbiasedness of the parameter’s estimates, it follows with a probability of 0.997 that
G Q t ( j ω ) = G Q ( j ω ) ± 3 Δ G Q ( j ω ) G P t ( j ω ) = G P ( j ω ) ± 3 Δ G P ( j ω ) ,
where G Q t ( j ω ) and G P t ( j ω ) are transfer functions with “true” parameters. Due to the fact that Δ G Q ( j ω ) and Δ G P ( j ω ) are estimated in the form of nonparametric frequency responses, they should be parametrized in order to obtain the plant model that involves “true” dynamics with probability tending to 1. It is proposed that an uncertain model with output multiplicative uncertainty is used for the approximation of each transfer function, such as
G Q ( z ) = ( 1 + G Q , max ( z ) Δ Q ) G Q , n o m ( z ) G P ( z ) = ( 1 + G P , max ( z ) Δ P ) G P , n o m ( z ) ,
where G Q , n o m ( z ) , G P , n o m ( z ) are nominal transfer functions corresponding to model (1), and G Q , max ( z ) , G P , max ( z ) are weighting filters. Δ Q < 1 , Δ P < 1 are scalar uncertainties. The filters G Q , max ( z ) , G P , max ( z ) are obtained by the approximation of nonparametric frequency models
3 Δ G Q ( j ω ) G Q , n o m ( j ω ) , 3 Δ G P ( j ω ) G P , n o m ( j ω ) ,
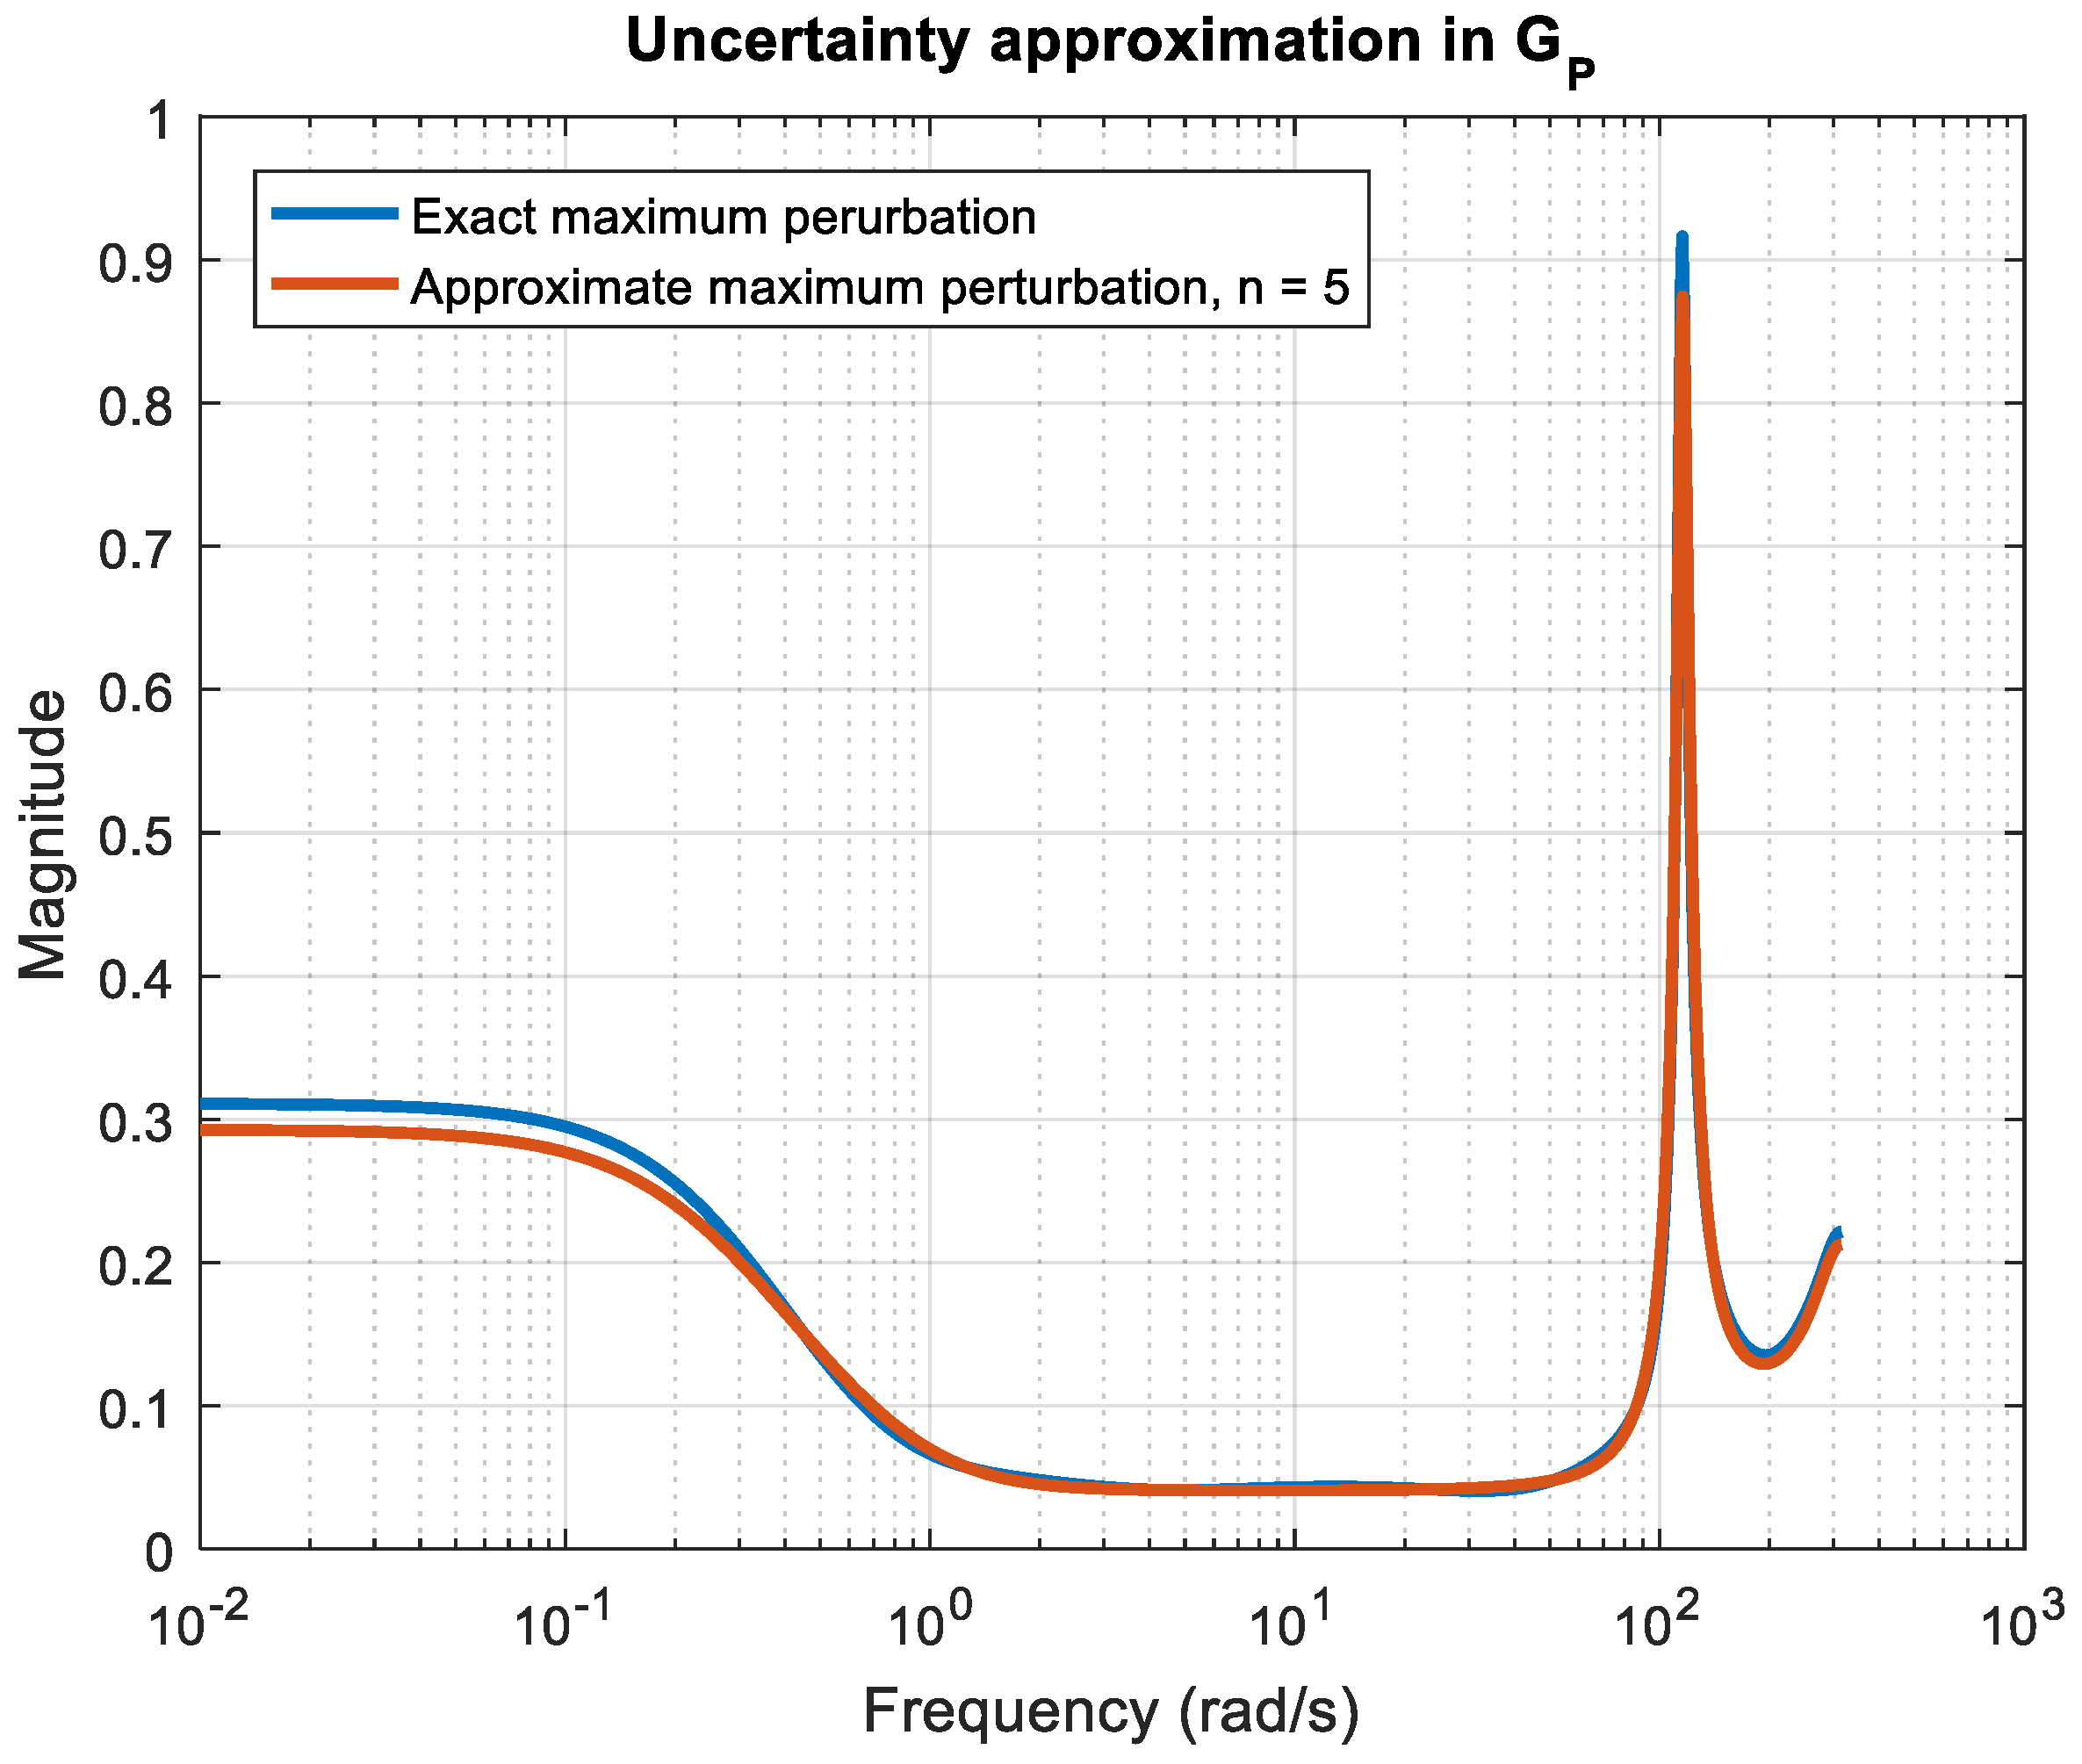
with discrete time stable minimum phase systems. In Expression (6), G Q , n o m ( j ω ) and G P , n o m ( j ω ) denote the frequency responses of nominal model (1) with respect to the pump flow rate and pump output pressure. Approximation (6) is performed by solving the optimization problem with the help of the MATLAB® function firmagfrd. Useful results are obtained for systems of the fifth order. As a result, discrete time transfer functions, approximated as G P , max ( z ) and G P , max ( z ) , are
G Q , max ( z ) = 0.2389 z 5 0.7547 z 4 + 1.081 z 3 0.9286 z 2 + 0.4445 z + 0.08076 z 5 2.15 z 4 + 1.739 z 3 0.3649 z 2 0.821 z + 0.5987 , G P , max ( z ) = 0.1289 z 5 0.3532 z 4 + 0.3597 z 3 0.1724 z 2 + 0.0353 z + 0.0016 z 5 2.222 z 4 + 1.953 z 3 0.7306 z 2 0.4909 z + 0.4904 .
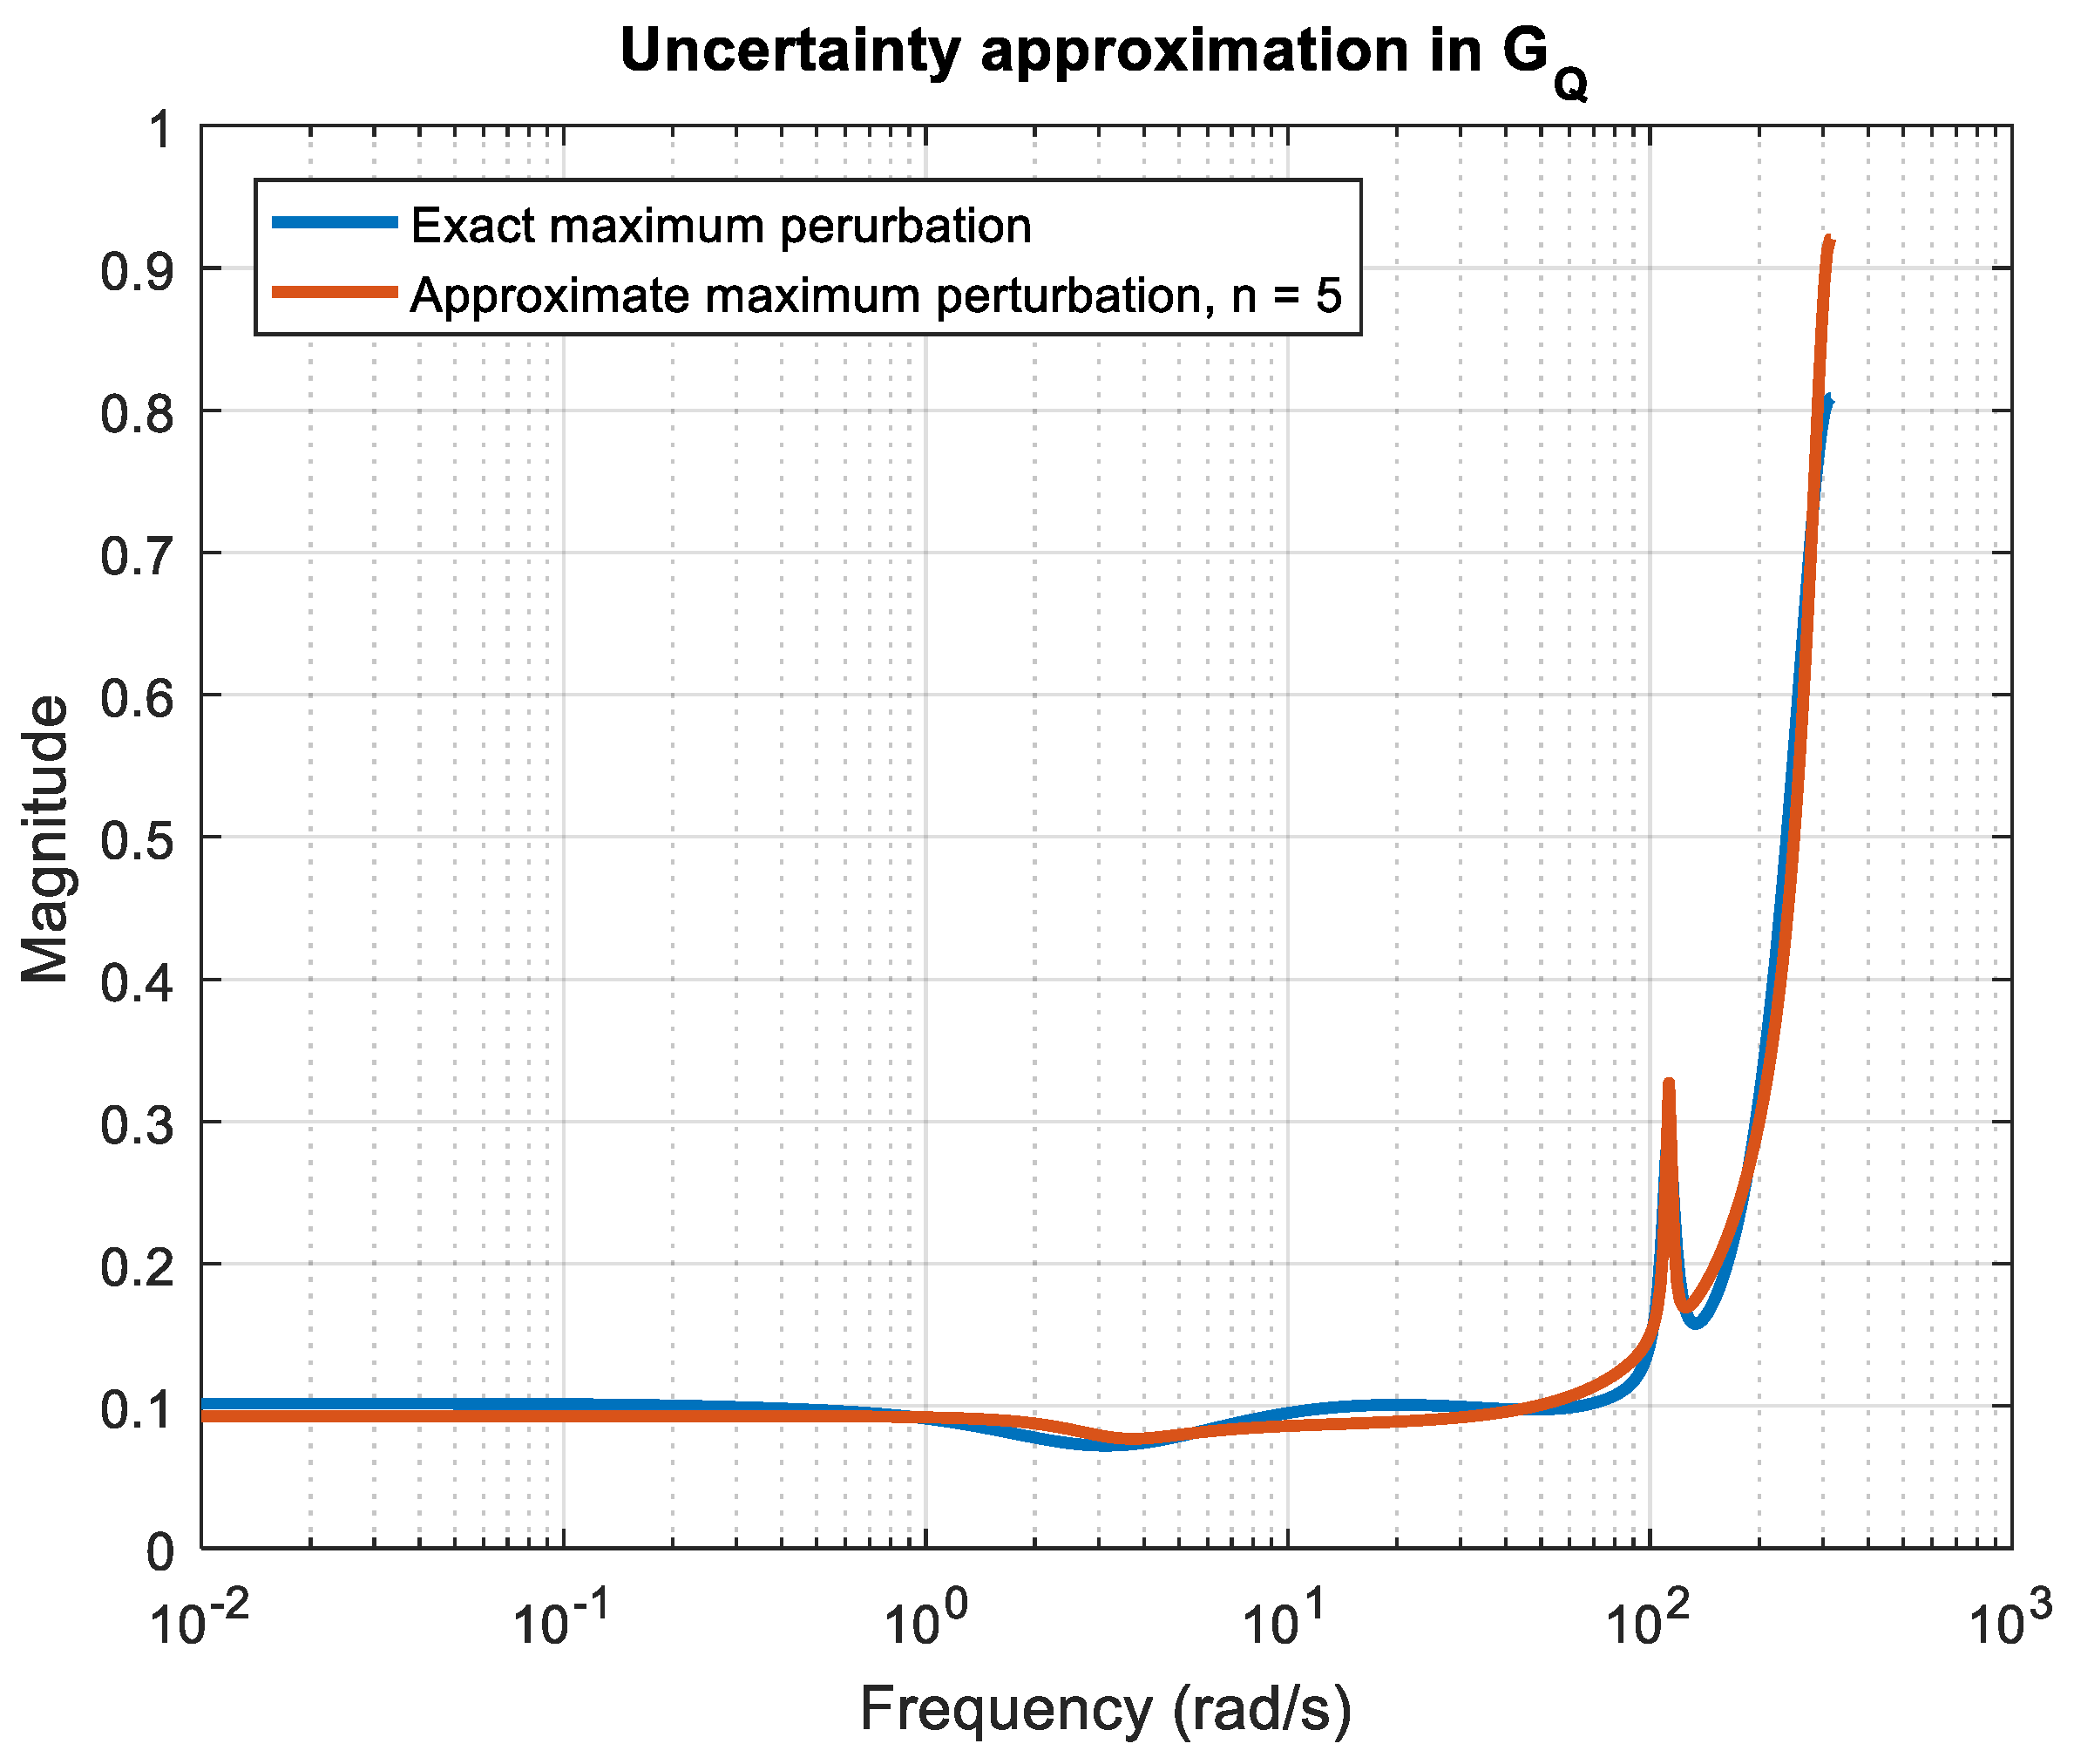
In Figure 5 and Figure 6, the approximated filters (7), bounds, and exact bounds of G Q , max ( j ω ) and G P , max ( j ω ) are shown. It is seen that the approximations are very close to the exact values.
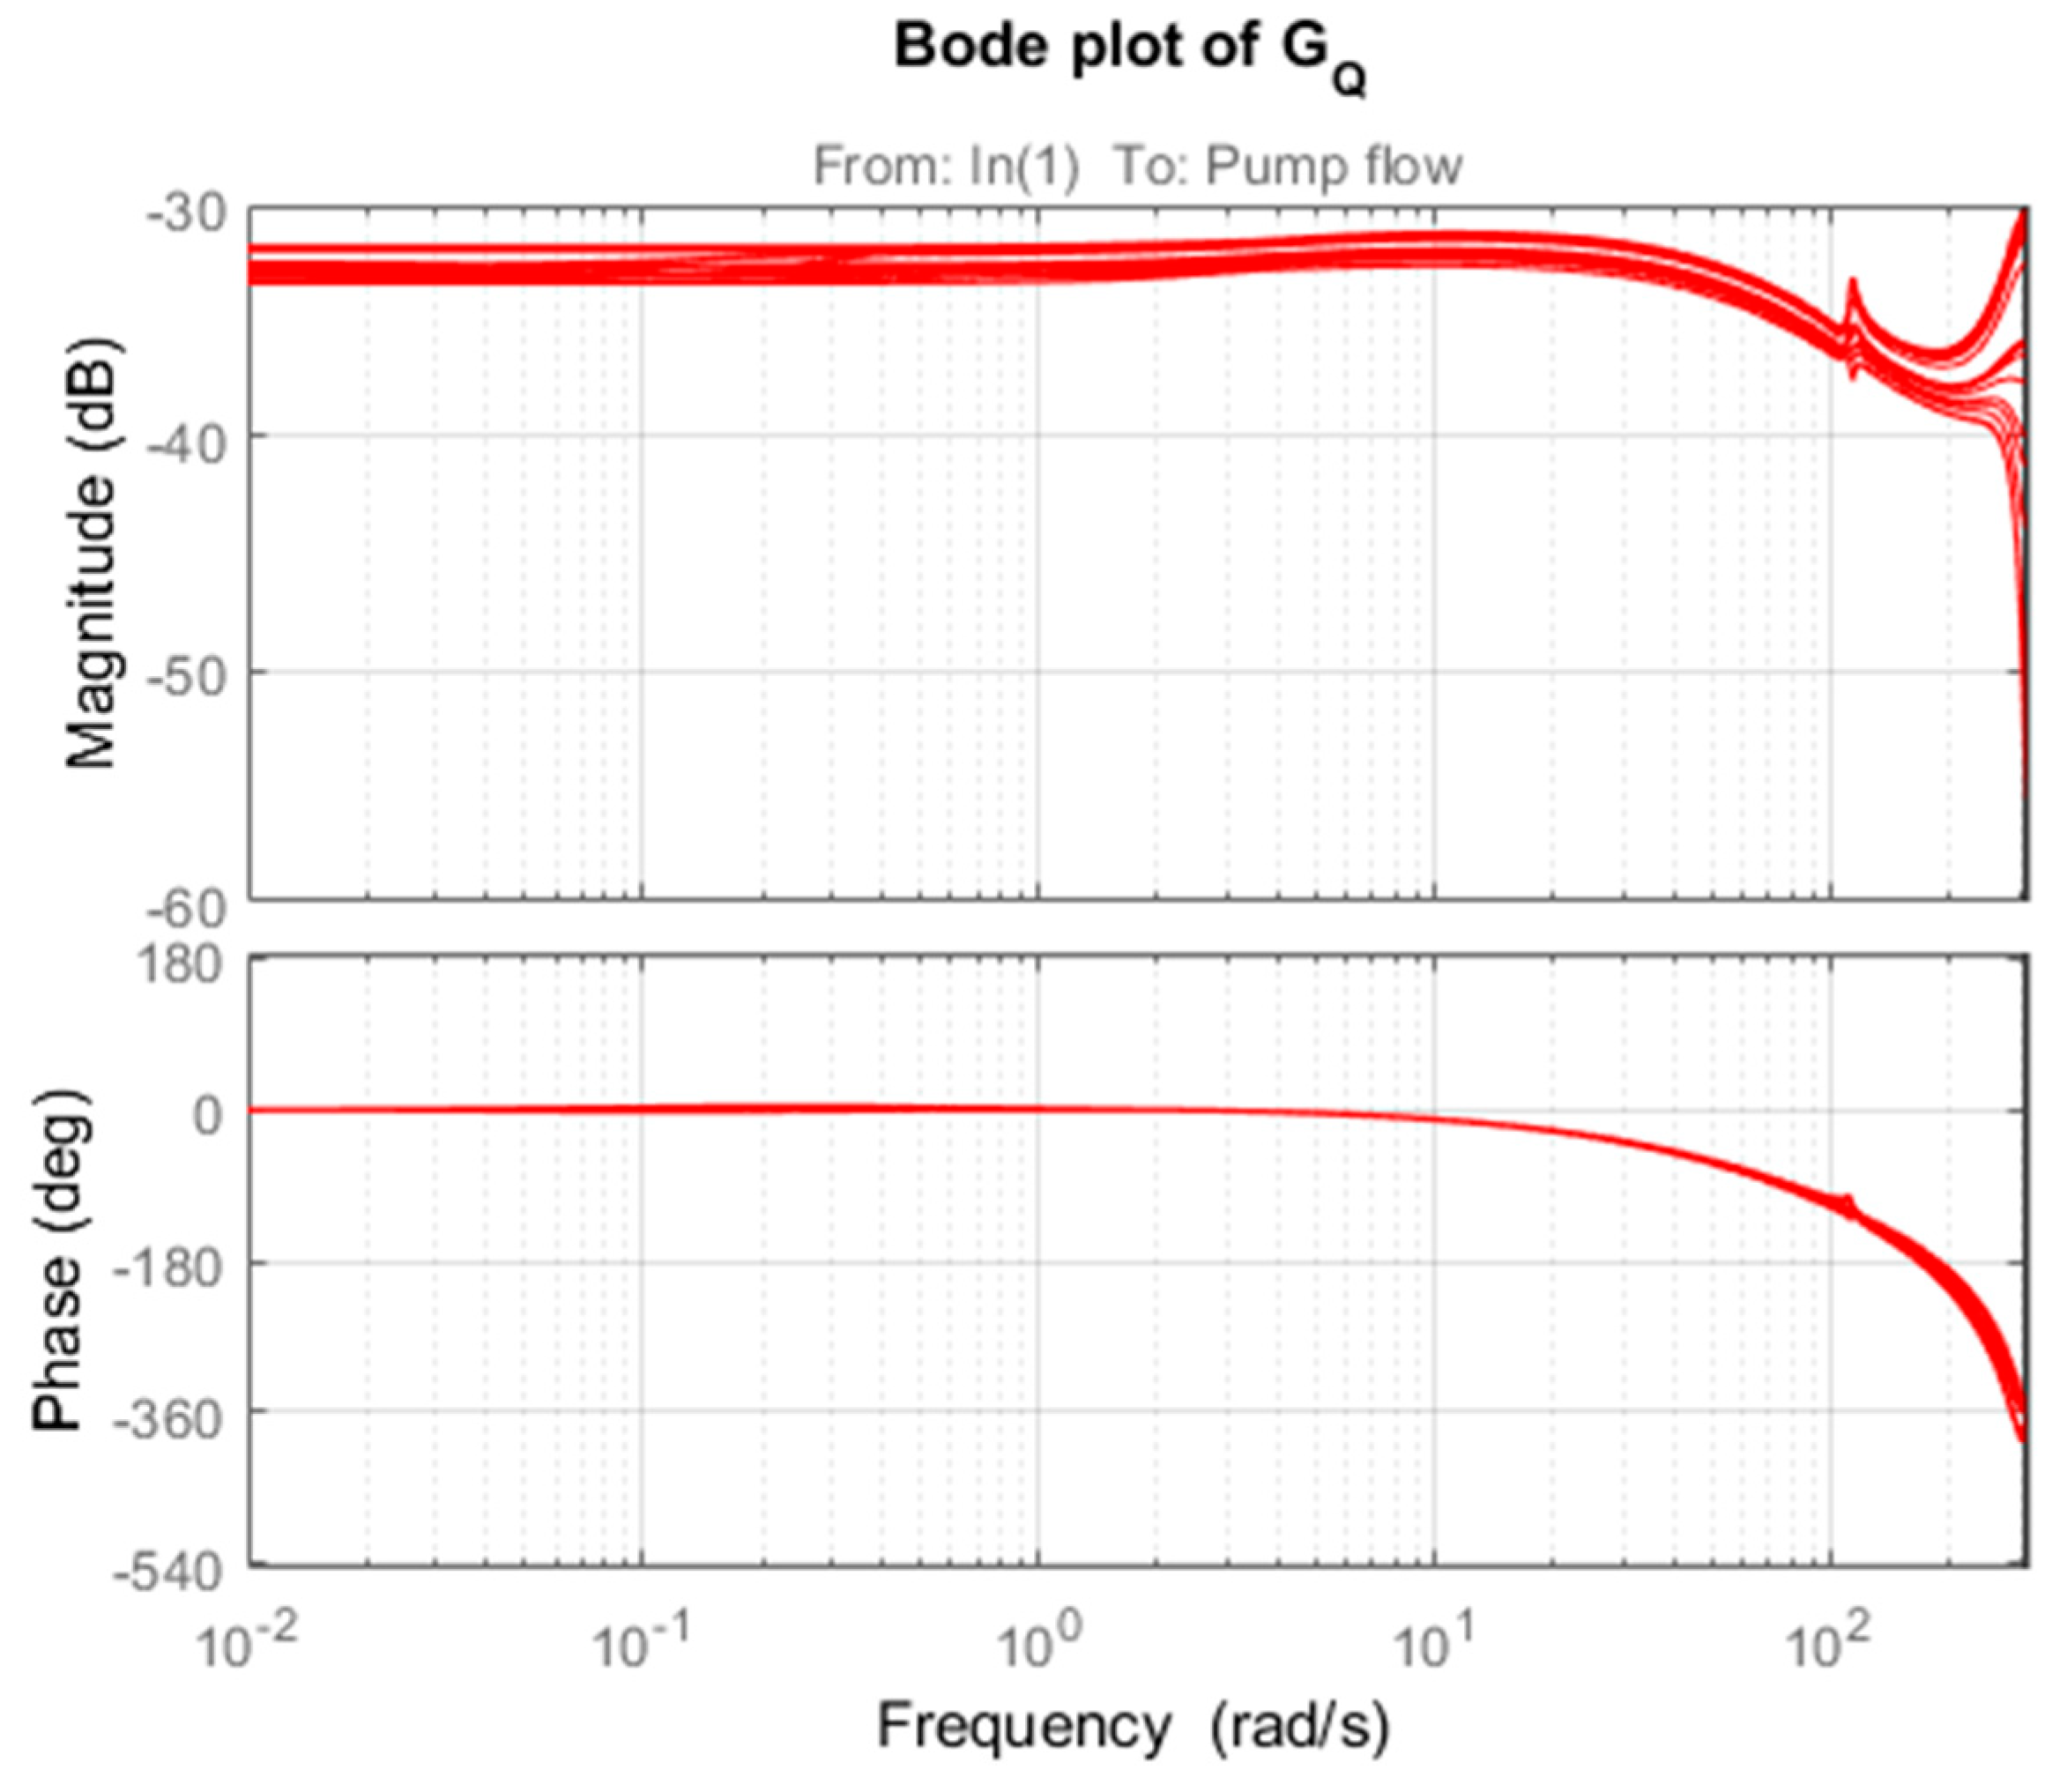
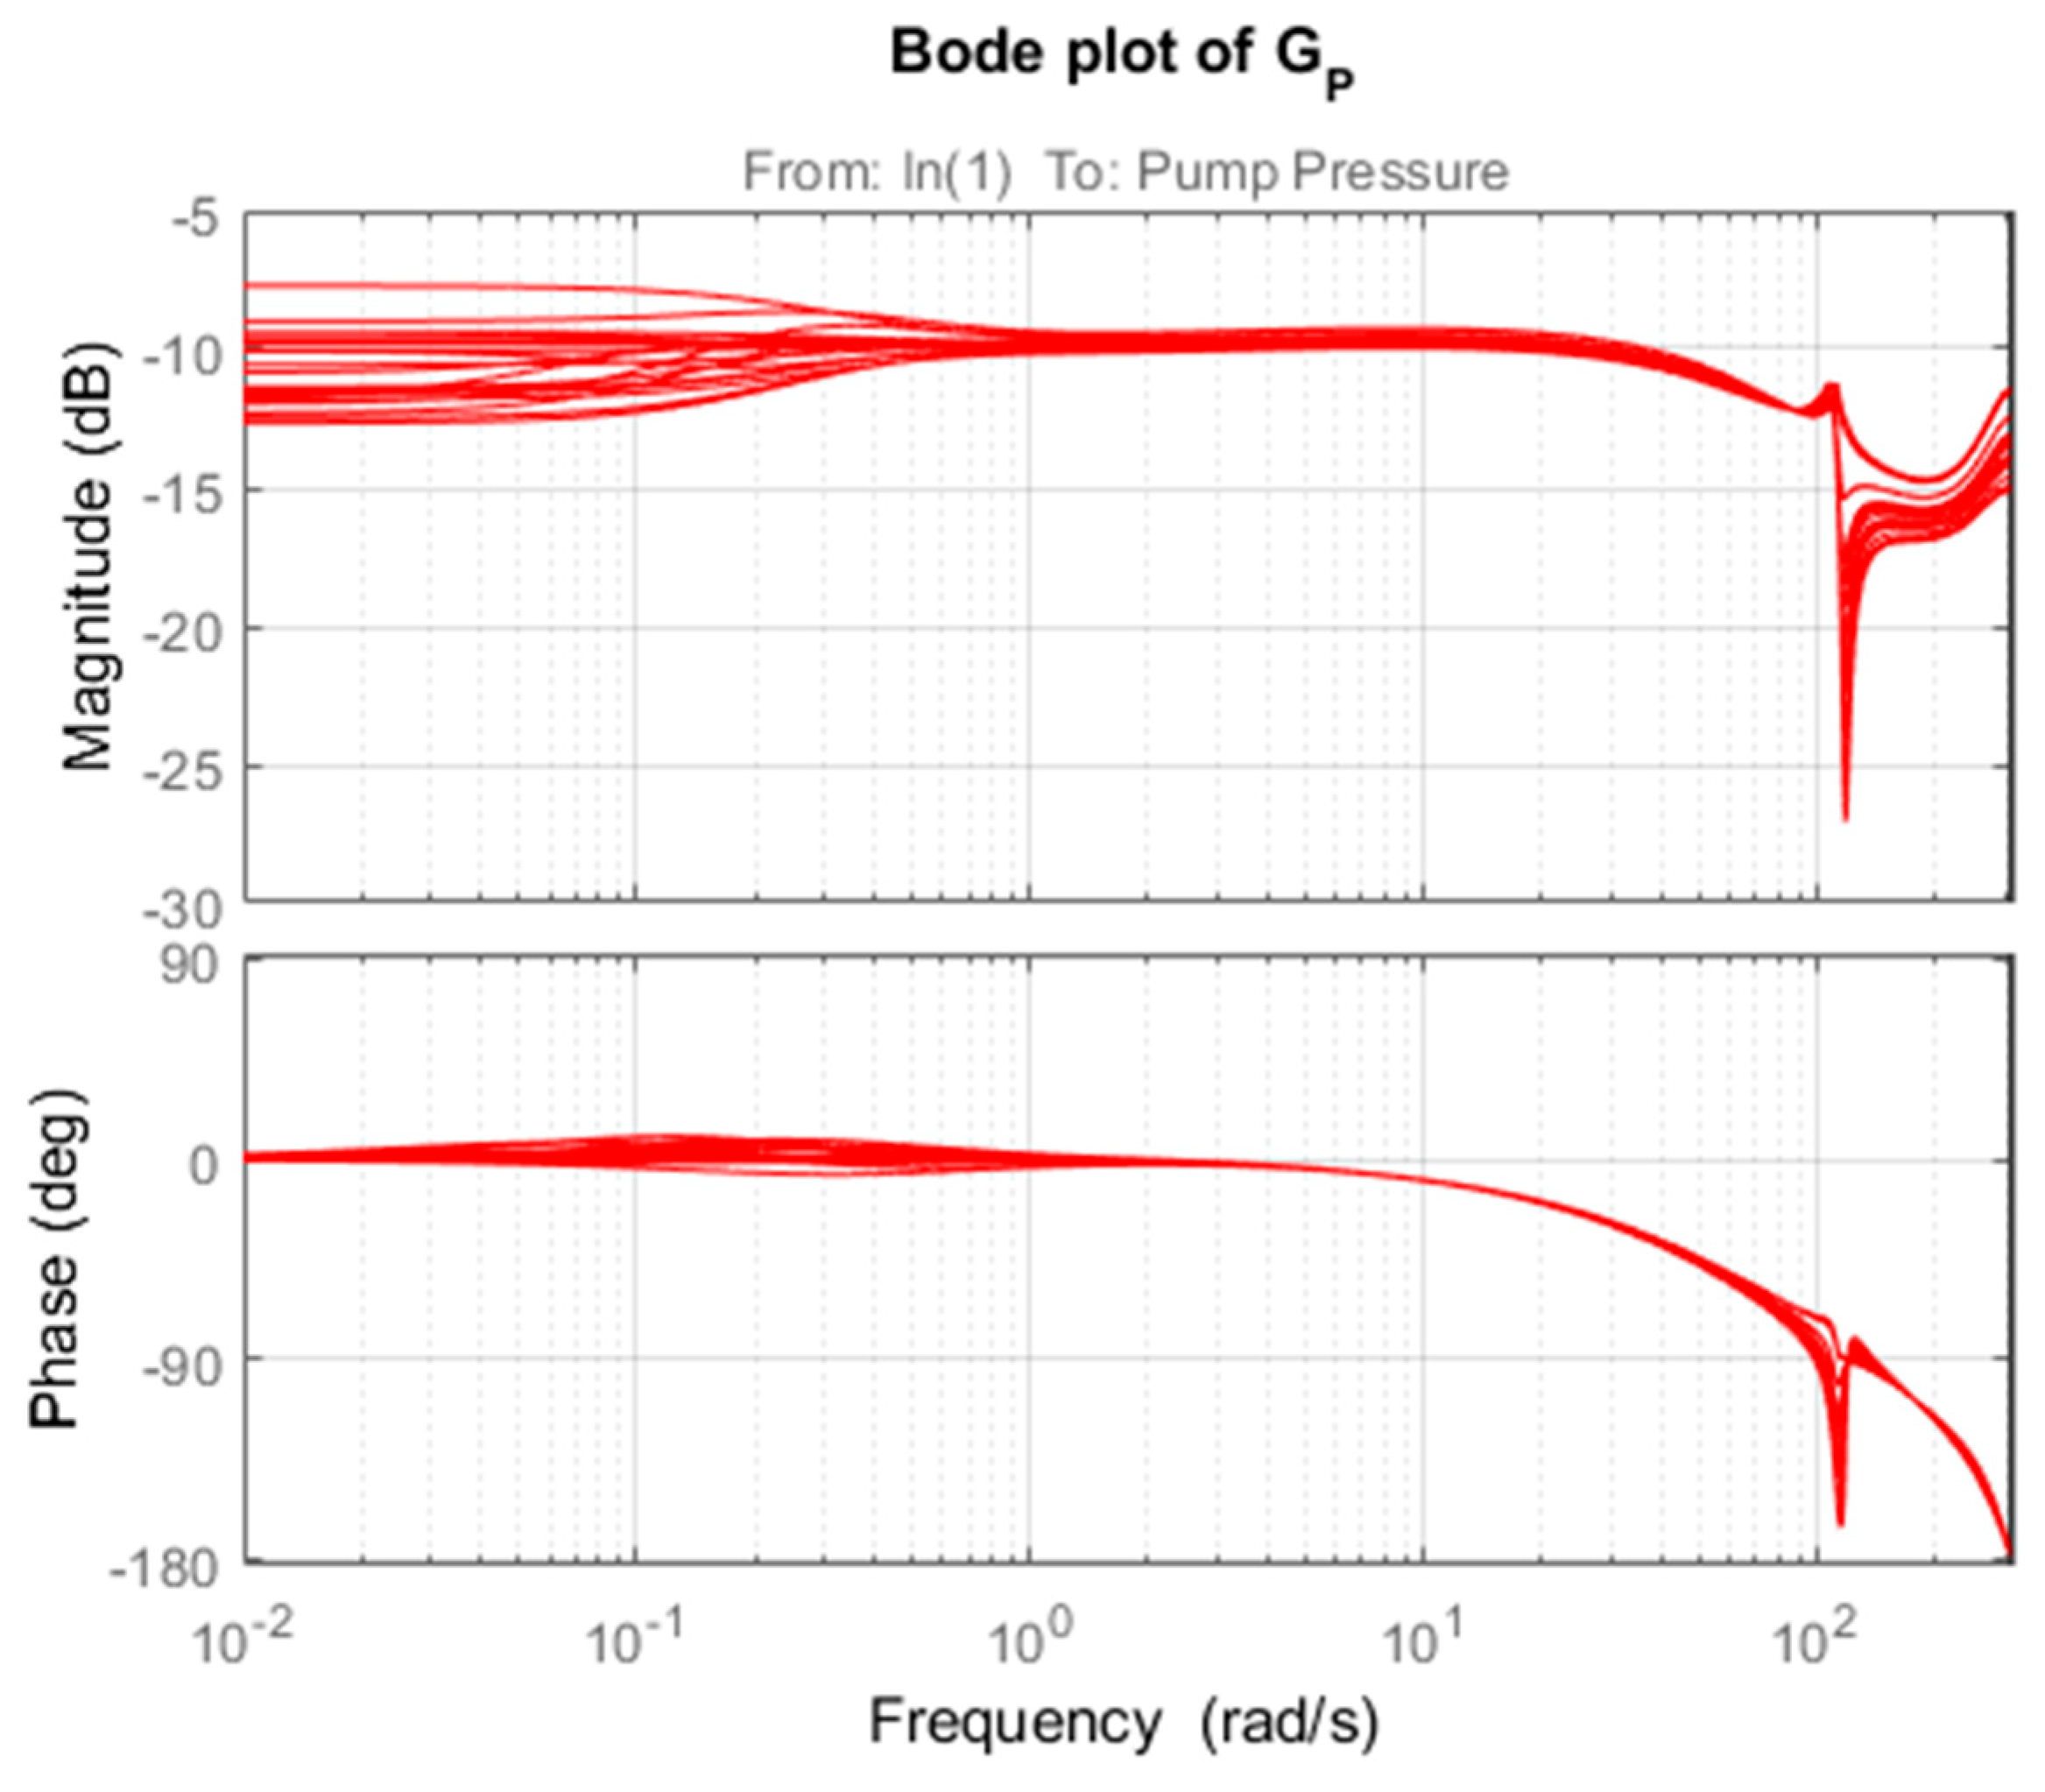
The frequency responses of the developed uncertainty model with approximations (7) are depicted for 30 random samples of model uncertainty in Figure 7 (pump flow rate) and Figure 8 (pump pressure). As can be expected, the uncertainty is larger for the high-frequency range. The uncertainty in the low-frequency range for pump flow rate is smaller than the uncertainty in low frequencies for pump pressure.
The developed two outputs and one input model with the unstructured uncertainty of the axial piston pump (3) is used for μ -controller design in the next section.

3. Robust Control Approach

3.1. μ-Control Design

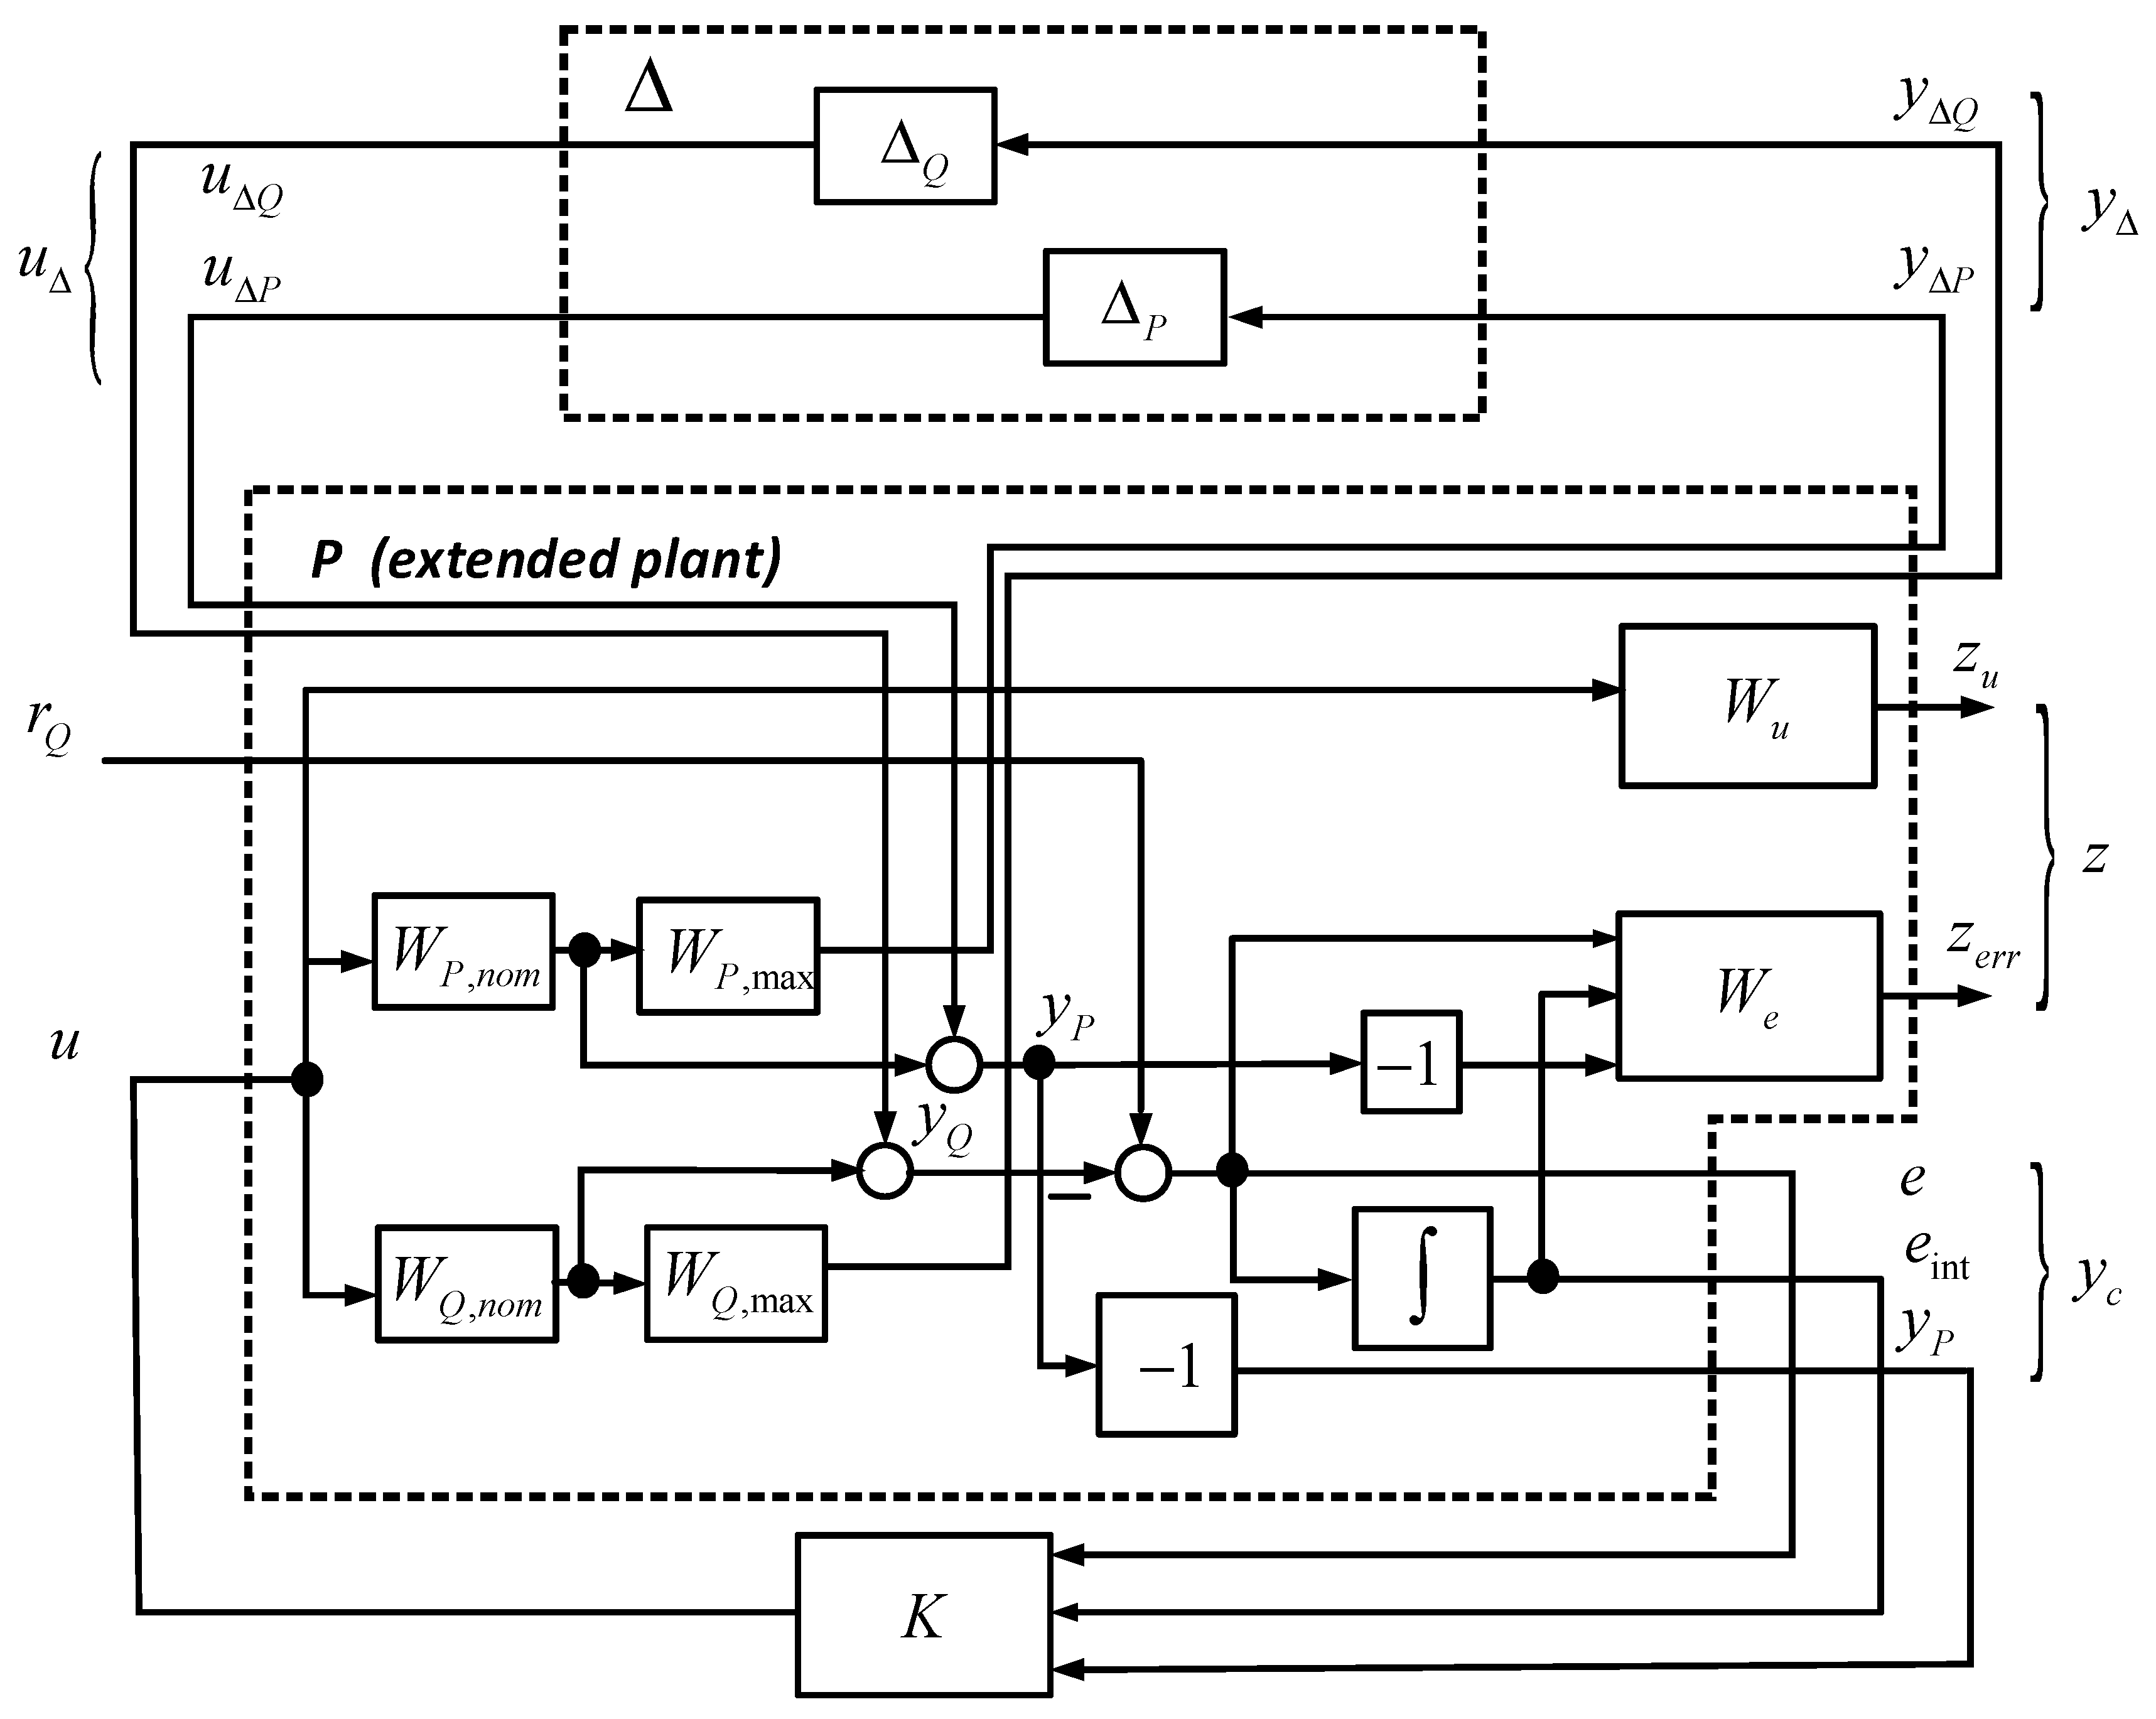
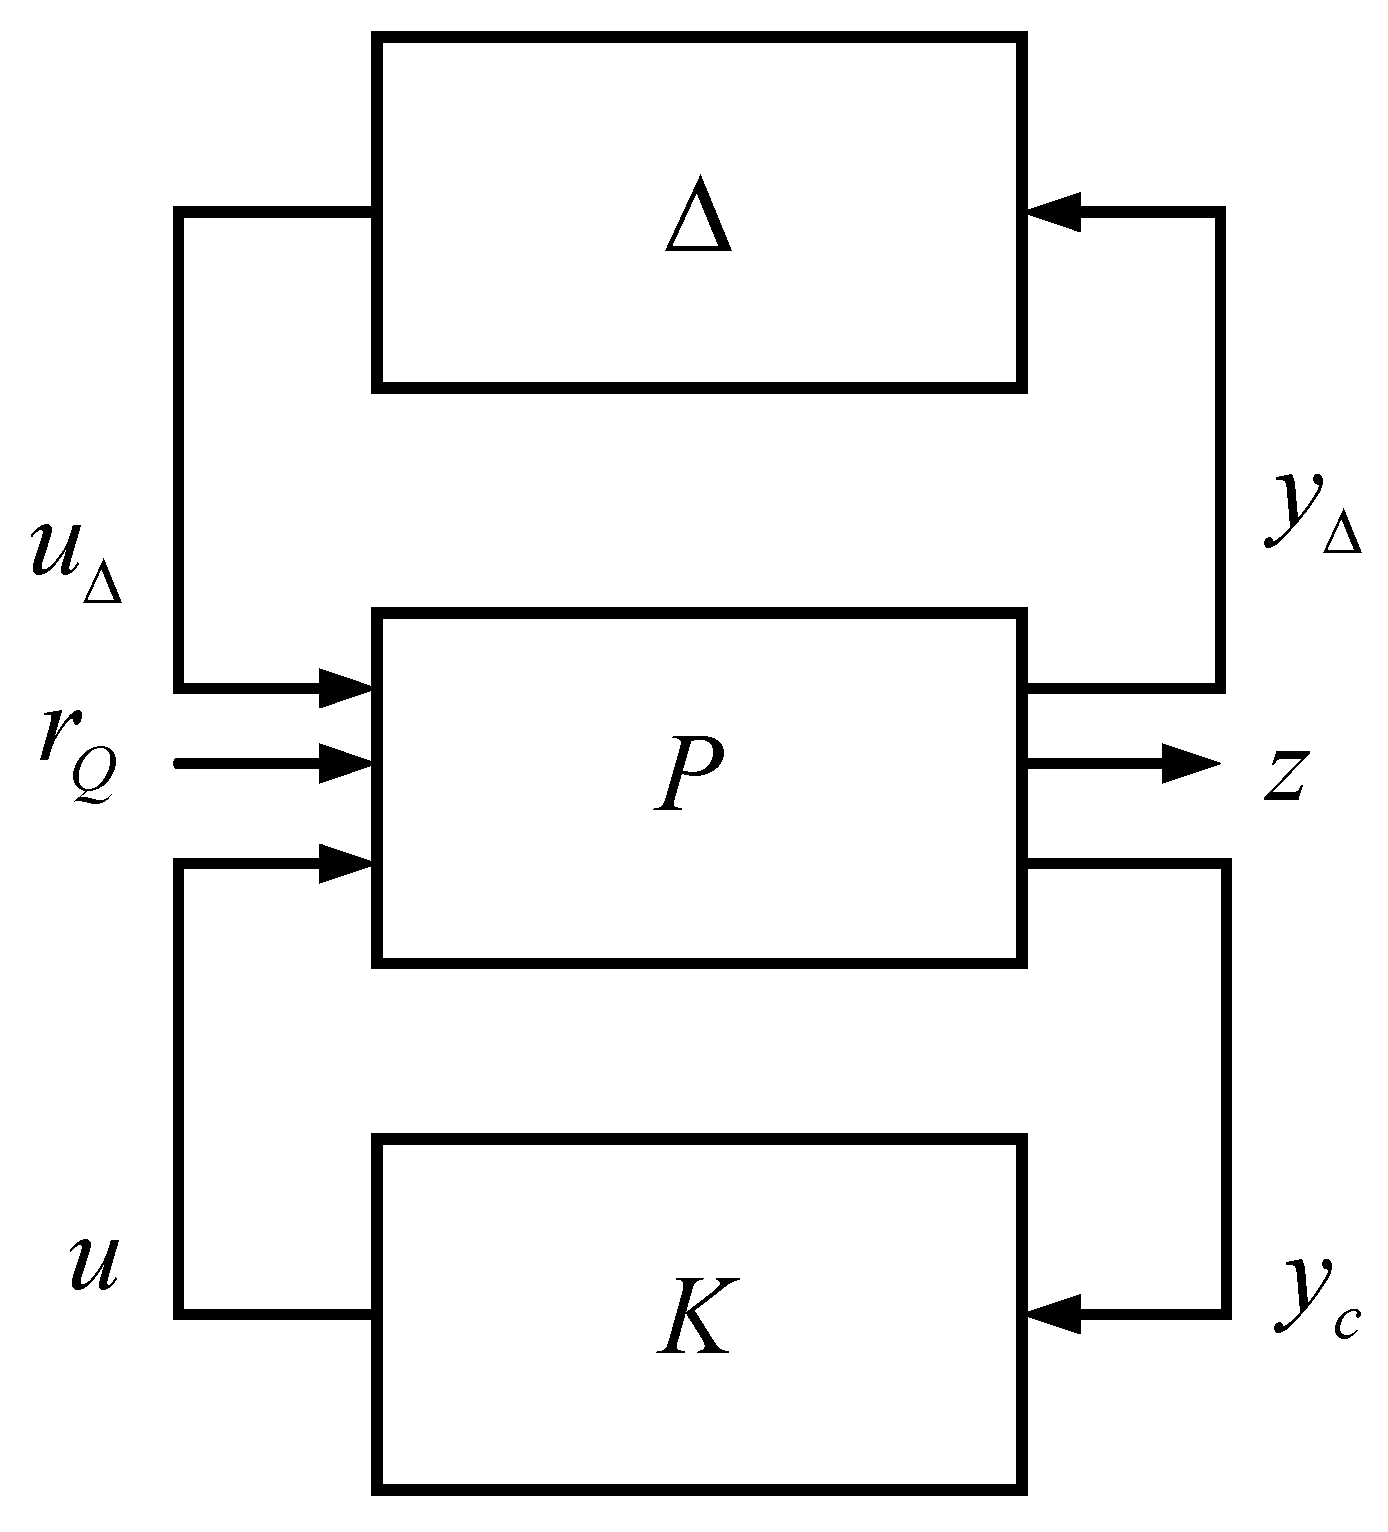
One of the powerful approaches to provide the robust stability and robust performance of a closed-loop control system in the presence of uncertainties, noises, and disturbances is to design a so-called μ-controller. To achieve robustness of the control system, the μ design accounts explicitly for model uncertainties, in contrast with the H design, that uses only a nominal plant model and cannot guarantee the robust stability and robust performance of the control system. The structure scheme of the system for the control of an open-circuit axial piston pump utilized for μ-controller design is depicted in detail in Figure 9.
As can be seen, the three groups of input signals and output signals are defined as follows:
  • u Δ = u Δ Q u Δ P T —inputs due to model uncertainty with respect to flow rate u Δ Q and pump pressure u Δ P ;
  • r Q —external input (pump flow rate reference signal);
  • u c —control input (control signal);
  • y Δ = y Δ Q y Δ P T —outputs due to model uncertainty with respect to flow rate y Δ Q and pump pressure y Δ P ;
  • z = z e r r z u T —external performance outputs, z e r r = z e z e , int z p r e s , z e —performance output of the flow rate error, z e , int —performance output of the discrete time integral of the flow rate error, z p r e s —performance output of the pump pressure, and z u —performance output of the control signal;
  • y c = e e int , y P T —measured (controlled) outputs, where e = r Q y Q is the pump flow rate error and e int is the discrete time integral of the pump flow rate error.
It is easy to represent the structure scheme from Figure 9 as a general structure of the Liner Fractional Transformation presented in Figure 10. The transfer matrix P represents the nominal axial piston pump model, performance weighting functions, and uncertainty weighing functions. The block Δ ( Δ < 1 ) represents model uncertainty, and block K represents the controller transfer matrix.
The description of the extended axial piston pump model is given by
y Δ Q y Δ P z e z e , int z p r e s z u e e int y P = P u Δ Q u Δ P r u , P = 0 0 0 W Q , max W Q , n o m 0 0 0 W P , max W P , n o m W e r r 0 W e r r W e r r W Q , n o m T 0 z 1 W e r r , int 0 T 0 z 1 W e r r , int T 0 z 1 W e r r , int W Q , n o m 0 W p r e s 0 W p r e s W P , n o m 0 0 0 W u 1 0 1 W Q , n o m T 0 z 1 0 T 0 z 1 T 0 z 1 W Q , n o m 0 1 0 W P , n o m ,
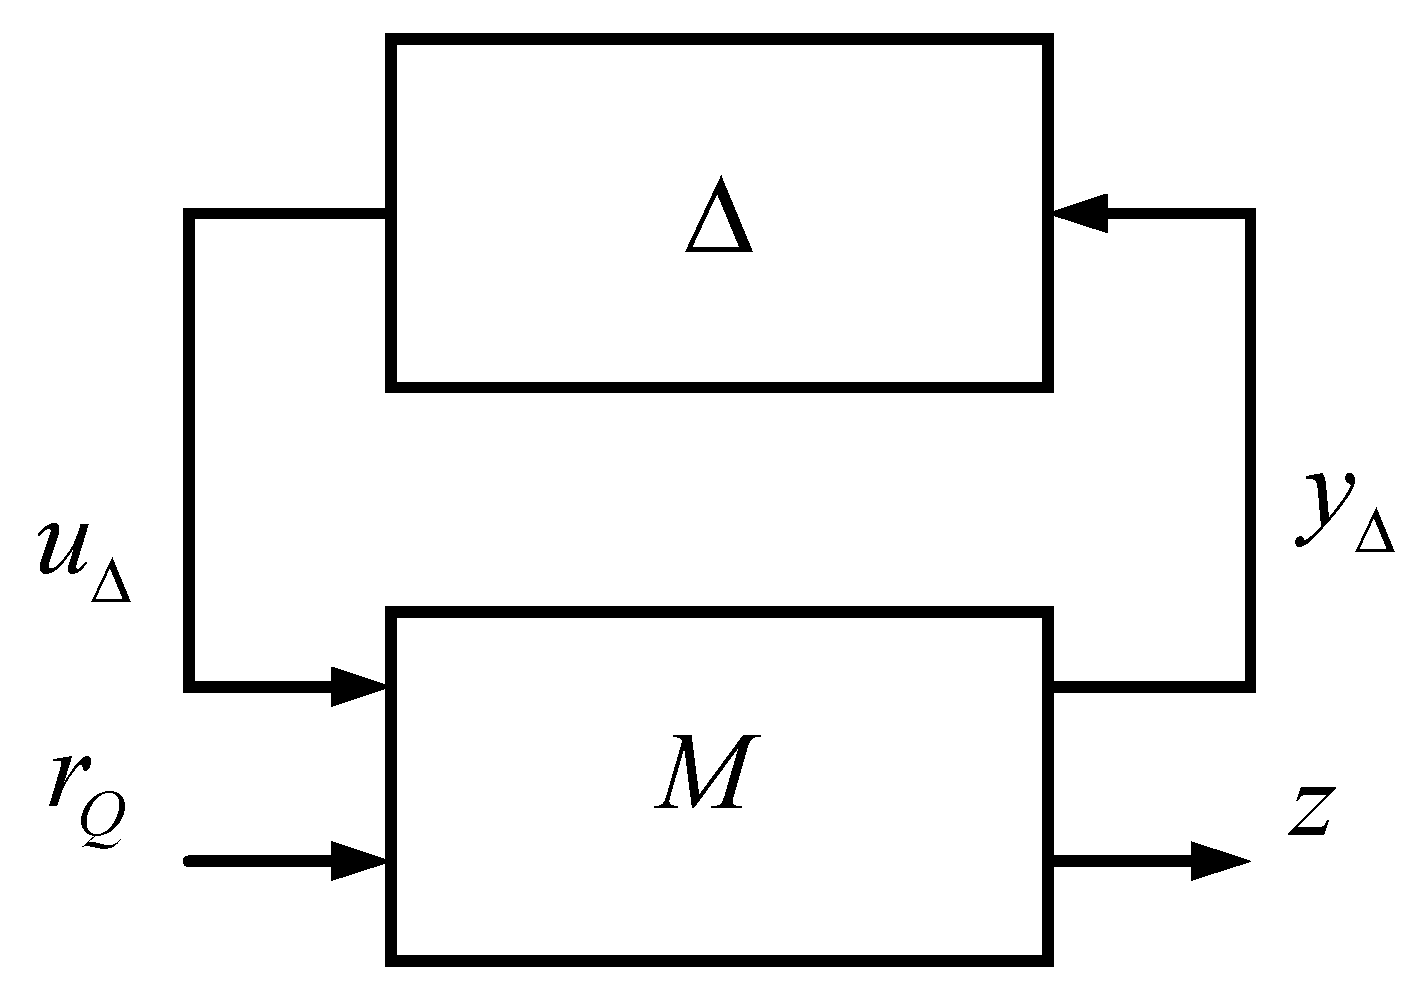
where W e r r , W e r r , int , W p r e s , W u are weighting functions for the flow rate error, integral of the flow rate error, pump pressure, and control signal, respectively, and T 0 is the sample time. In order to put the design problem in a framework for the synthesis of μ-controller and to analyze the robustness of the control system by a structured singular value, the uncertainty control system from Figure 10 is transformed to the classical M Δ structure presented in Figure 11.
In this structure, the transfer matrix of the nominal control system is denoted by M , while the uncertainty part is denoted by Δ . The nominal part is formed as
M = F l ( P , K )
where F l ( P , K ) is the lower fractional transformation between the extended axial piston pump model and the controller K . The detailed description of M is given by
y Δ Q y Δ P z e z e , int z p r e s z u = W Q , max W Q , n o m K S W 1 W Q , max W Q , n o m K S W 2 W Q , max W Q , n o m K S W 3 W P , max W P , n o m K S W 1 W P , max W P , n o m K S W 2 W P , max W P , n o m K S W 3 W e ( 1 + W Q , n o m K S W 1 ) W e W Q , n o m K S W 2 W e ( 1 W Q , n o m K S W 3 ) T 0 z 1 W e , int ( 1 + W Q , n o m K S W 1 ) T 0 z 1 W e , int W Q , n o m K S W 2 T 0 z 1 W e , int ( 1 W Q , n o m K S W 3 ) W p r e s W P , n o m K S W 1 W p r e s ( 1 + W P , n o m K S W 2 ) W p r e s W P , n o m K S W 3 W u K S W 1 W u K S W 2 W u K S W 3 M u Δ Q u Δ P r ,
where
  • W 1 = 1 T 0 z 1 0 T , W 2 = 0 0 1 T , W 3 = 1 T 0 z 1 0 T , W 4 = W Q , n o m T 0 z 1 W Q , n o m W P , n o m T .
It is well known that the uncertain closed-loop system from Figure 11 is robustly stable for all Δ < 1 if the structured singular value of the closed-loop system satisfies condition
μ Δ ( M ( j ω ) ) < 1 ,
where
μ Δ ( M ( j ω ) ) = 1 min { σ ¯ ( Δ ) : Δ < 1 , det ( I M Δ ) = 0 } .
It is seen that μ Δ ( M ( j ω ) ) is the reciprocal value of the smallest uncertainty that makes the closed-loop system unstable. Moreover, the difference between the unity and structured singular value (12) defines the robust stability margin that shows how much the uncertainty can be increased so that the closed-loop system remains stable.
The closed-loop system from Figure 11 has a robust performance if it is robustly stable and the performance condition is fulfilled
F U ( M , Δ ) < 1 ,
where F U ( M , Δ ) is an upper Linear Fractional Transformation between the nominal closed-loop system with the given controller K and uncertainty block Δ . It is known that for some K , Condition (13) can be transformed to the condition for robust stability (11) with respect to extended uncertainty
Δ ˜ = Δ 0 0 Δ F ,
where Δ F C 1 × 4 , Δ F < 1 is fictitious complex uncertainty that completes the loop between the flow rate reference signal and performance outputs
r Q ( j ω ) = Δ F z e z e , int z p r e s z u .
It should be noted that Δ ˜ < 1 because Δ < 1 and Δ F < 1 . Thus, the closed-loop system achieves robust performance if
μ Δ ˜ ( M ( j ω ) ) < 1 .
The purpose of μ -design is to find a stabilizing controller that minimizes the peak value of the structured singular value of the closed-loop with respect to extended uncertainty, as given in Expression (16). Thus, the synthesis problem can be written as
min K s t a b i l i z i n g max ω μ Δ ˜ ( M ( j ω ) ) .
If the peak of the structured singular value for the design of the controller according to (17) is smaller than 1, then the closed-loop system achieves robust performance for all admissible uncertainty in terms of the chosen weighting functions W e r r , W e r r , int , W p r e s , W u . The important subtask of μ -controller design is to make an appropriate choice of weighting functions that defines the performance requirements. The role of W e r r and W e r r , int is to weigh the error between the axial piston pump flow reference and the measured axial piston pump flow and its integral in the low-frequency range. Thus, most often they are chosen as low-pass filters. In this way, the output load disturbances are also suppressed. The role of W p r e s is to penalize the axial piston pump pressure and can be chosen as a low-pass filter. W u is used to penalize the control signal in order to impose a constraint for the magnitude of the control signal. Often, W u is chosen as a high-pass filter to reduce the magnitude of the control signal in the high-frequency range in order to avoid the amplification of noises by feedback. It should be noted that the minimal order of the controller obtained by the optimization of Expression (17) is equal to the order of the extended plant model (8). Therefore, to simplify the controller structure, some weighting filters can initially be selected as static gains and if the obtained controller does not ensure the robust performance of the control system then the synthesis can be performed again with weighting filters of the first order.
The design of μ -controller is carried out for various weighting filters for the pump flow rate error, integral of the pump flow rate error, pump pressure, and control signal. On the basis of the experiments, the good compromise between robust performance, robust stability, and controller order is obtained with filters
W e r r ( s ) = 0.2 s + 10 s + 10 ,   W e r r , int ( s ) = 0.2 s + 0.005 s + 0.005 ,   W p r e s ( s ) = 0.001 ,   W u ( s ) = 0.011 .
It is seen that the weights for the flow rate error and its integral are chosen as low-pass filters with an appropriate bandwidth in order to obtain a sufficient small settling time for the closed-loop system with respect to the flow rate and sufficient suppression of the load disturbance. The control signal and pump pressure weights for simplicity are chosen as static gains. The value of 0.011 for W u provides an admissible shape of the control signal. Moreover, as can be seen later, the maximum control signal magnitude is far from the maximal admissible value. Since the design of μ -controller is performed in discrete time in order of its implementation in the programmable logic controller, the weighting functions (18) are discretized with sample time T 0 = 0.01 s, taking into account the dynamics of the zero-order holder. So, the discrete time filters are
W e r r ( z ) = 0.2 z 0.1048 z 0.9048 ,   W e r r , int ( z ) = 0.2 z + 0.2 z 1 ,   W p r e s ( s ) = 0.001 ,   W u ( s ) = 0.011 .
One of the most often used methods for solving optimization problem (17) is the so-called D-K iterations [7]. They are based on the approximation of the upper and lower bounds of μ Δ ˜ ( M ( j ω ) ) by
max U ρ ( U M ) μ Δ ˜ ( M ( j ω ) ) inf D σ ¯ ( D M D 1 ) ,
where ρ ( ) denotes the matrix spectral radius and σ ¯ ( ) denotes the maximal singular value; U is the unitary matrix, such that U Δ ˜ < 1 , Δ ˜ U < 1 , and D C 6 × 6 is the symmetric matrix, such that D Δ ˜ = Δ ˜ D . By changing the elements of matrices U and D , it is possible to find the close approximation of the structured singular value. The aim is to find an upper bound of the μ ; then, with this upper bound, the design problem is equivalent to H design, which can be solved with linear matrix inequalities or the solution of the corresponding Ricatti equations. The μ - design is performed by MATLAB® function dksyn that for K-step ( H design problem) uses a classical approach to solve the coupled Ricatti equations and applies a bisection algorithm to find suboptimal controller K , such that
σ ¯ ( μ Δ ˜ ( M ) ) = σ ¯ ( D M D 1 ) < γ ,
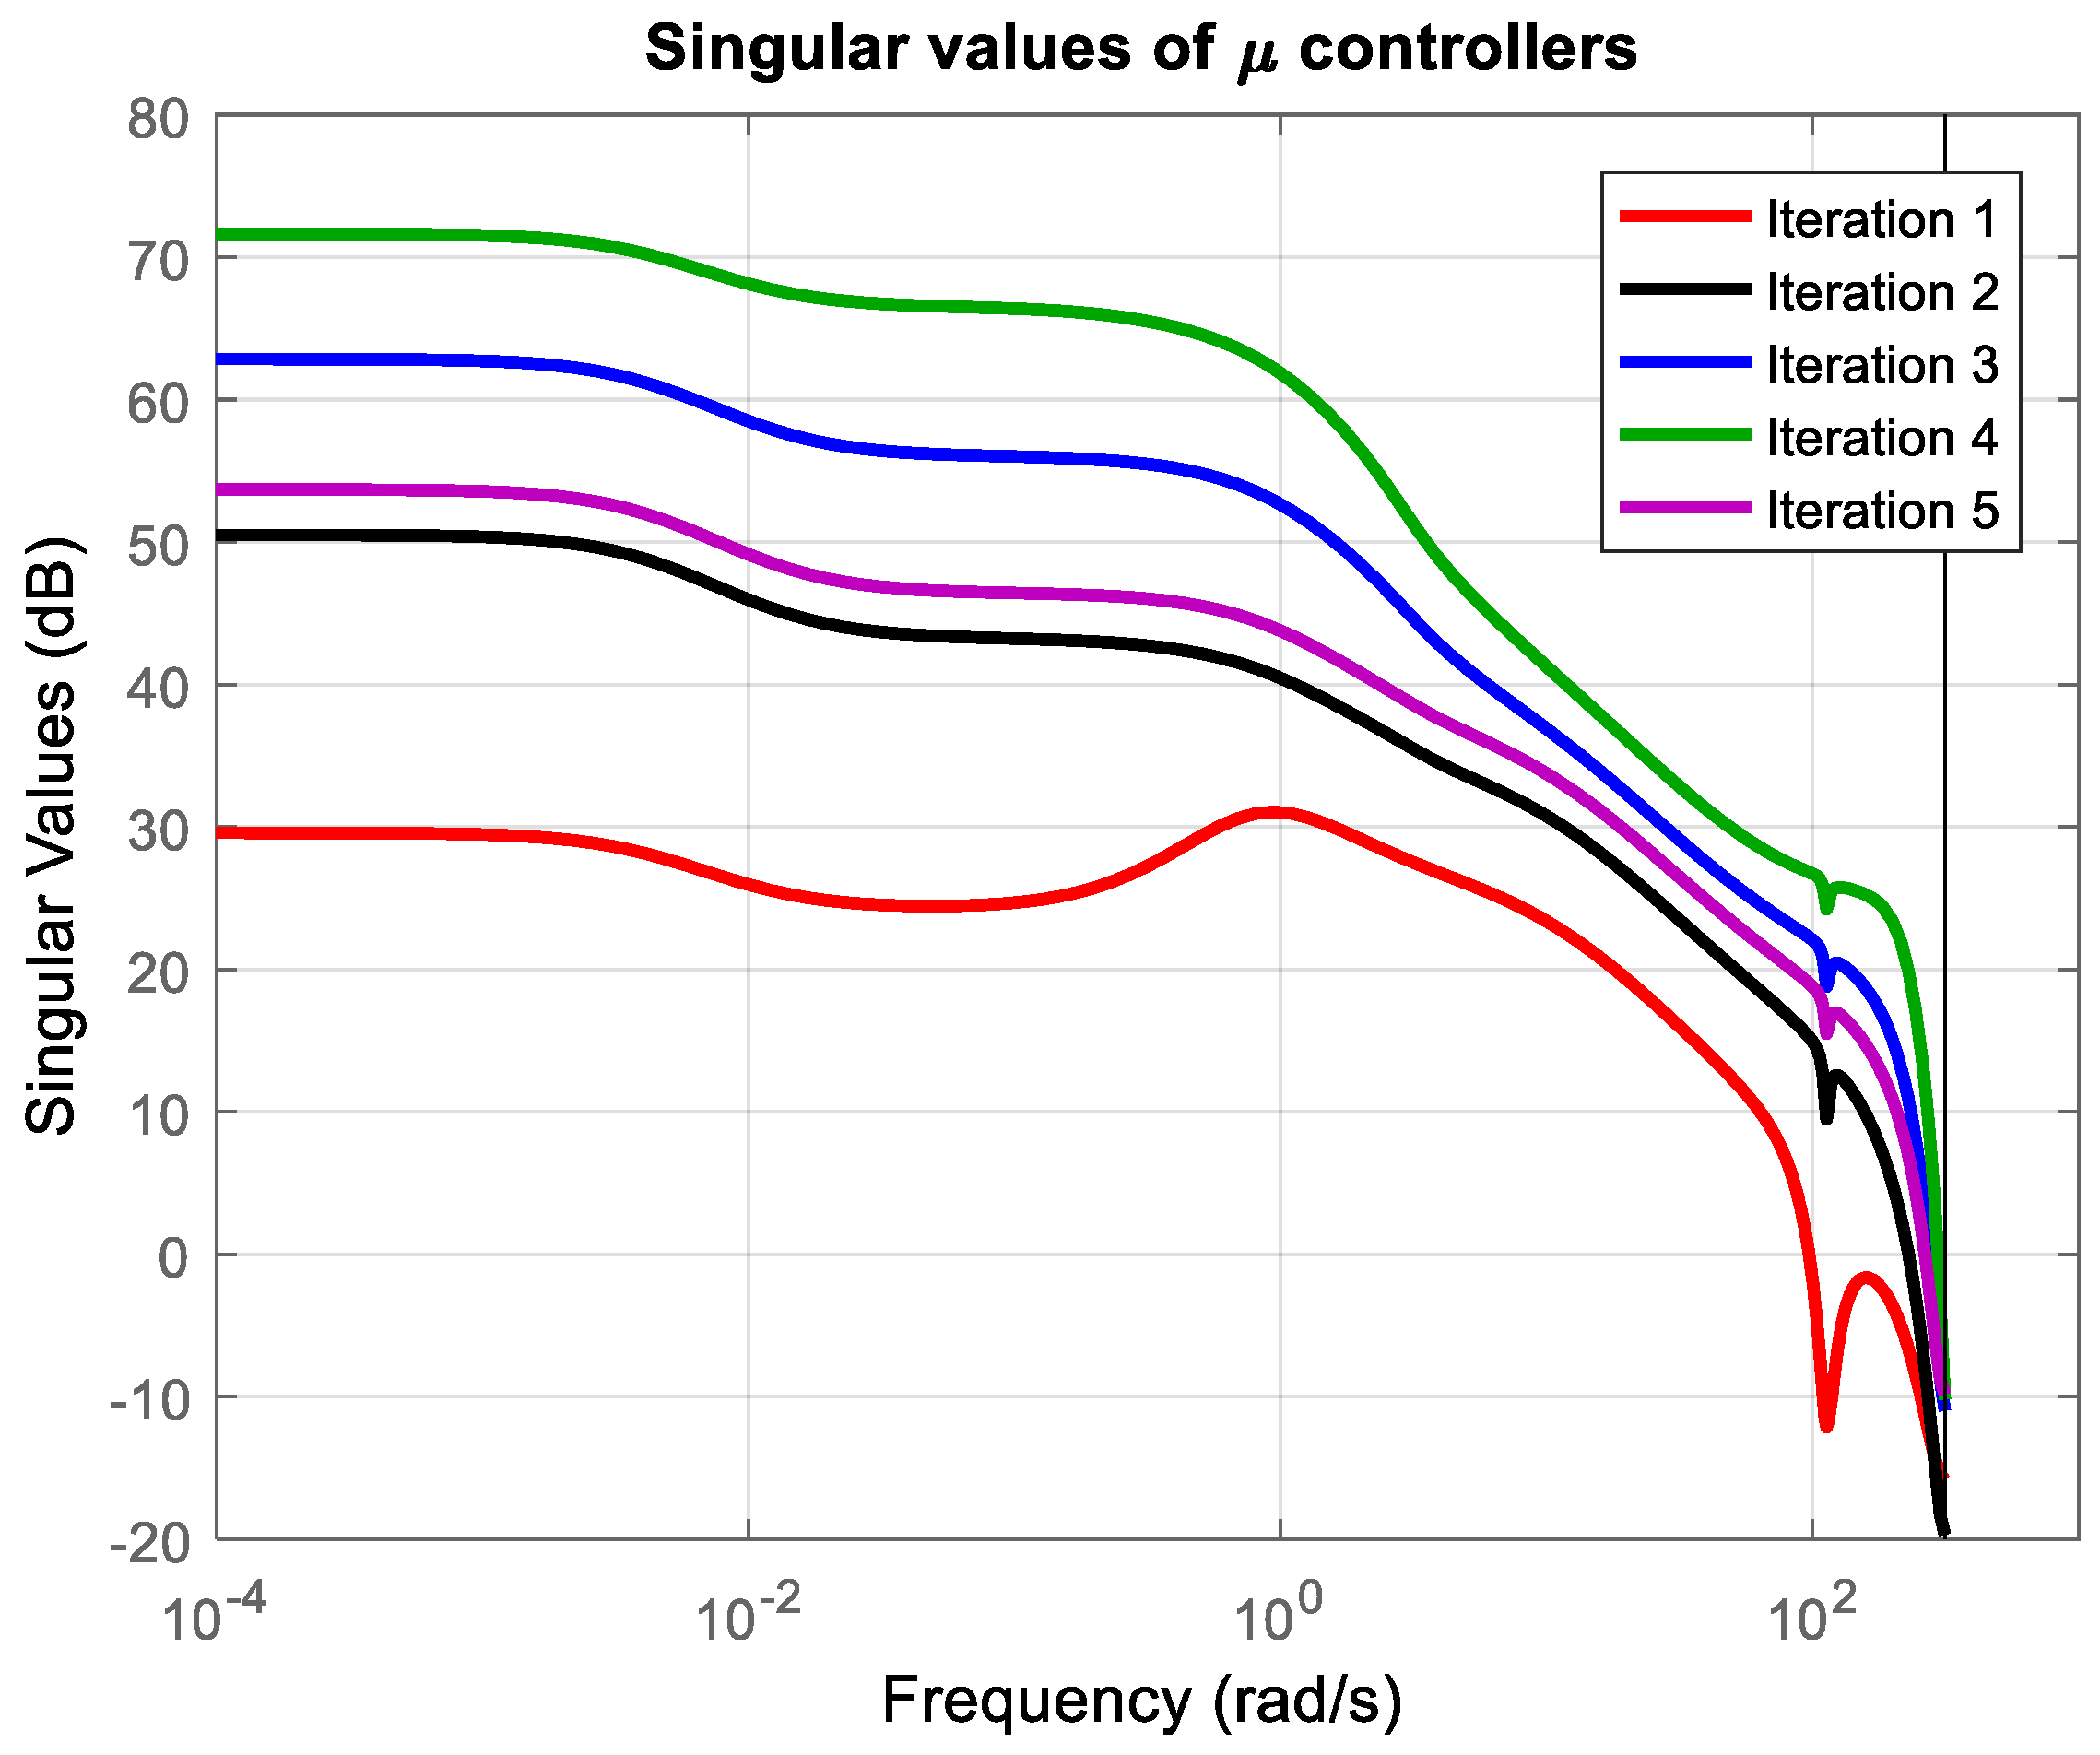
where γ > 0 is a constant. Expression (21) should hold for all frequencies ω and scaling factor D = D ( j ω ) , that is the matrix or transfer functions. For given γ and D , the stabilizing controller can exist or not. If it exists, the value of γ is decreased by the bisection in order to approximate its minimal value. If the controller does not exist, then the value of γ is increased, and for the new value, the Ricatti equations are solved again. When the controller K is found, the robust performance test is performed by calculating the μ upper bound, which is equivalent to the minimizing peak value of σ ¯ ( D M D 1 ) . This is achieved by the optimization of the symmetric matrix D . It is performed by frequency domain numerical optimization methods, followed by the approximation of the obtained frequency responses with minimal phase stable transfer functions. When the upper bound of μ is determined with the proper tuning of D , the H design problem is carried again for the extended scaling matrix D system. After that, the D step is performed again for the closed-loop system with the new controller. As a result of the D-K iterations, a sequence of μ -controllers is obtained. The controller with a minimal peak of μ is selected because it provides the largest stability margin. The results from the D-K iterations applied to the structure with the uncertain axial piston pump model presented in Figure 9 are shown in Table 1. It is seen that the peak of the structured singular value for the system with controllers from the third, fourth, and fifth iterations is almost the same, which is an indication for the convergence of the optimization procedure and to find the local minimum.
The controllers produced from the second to fifth iterations provide the robust performance of the closed-loop system. The order of the controller for each iteration is equal to the order of the extended plant plus the order of the D-scale matrix used to approximate μ bounds according to (20). It should be noted that in the first iteration, the D matrix is equal to the identity matrix and the first regulator is the H controller. The order of the extended plant is 19, which is formed as the order of uncertainty of the axial piston pump model (its order is 16) extended with the discrete time integrator for calculating e int plus the order of the weighting filters (their order is 2). The best controller that ensures the largest robust performance margin is produced by the fourth iteration.
In Figure 12, the singular values of the obtained controllers are presented. It is seen that for the controllers from the second to fifth iterations, the shape of the singular values is almost the same. The difference is only in the proportional part of the controller. The controller from the fourth iteration has the largest gain and provides the smallest peak in the structured singular value (largest robust performance margin). All the controllers have a small magnitude in the high-frequency range, which means that the measurement noise does not have a significant effect on the control signal. For further investigations, the controller from the fourth iteration is chosen.

3.2. Robust Stability and Robust Performance Analysis

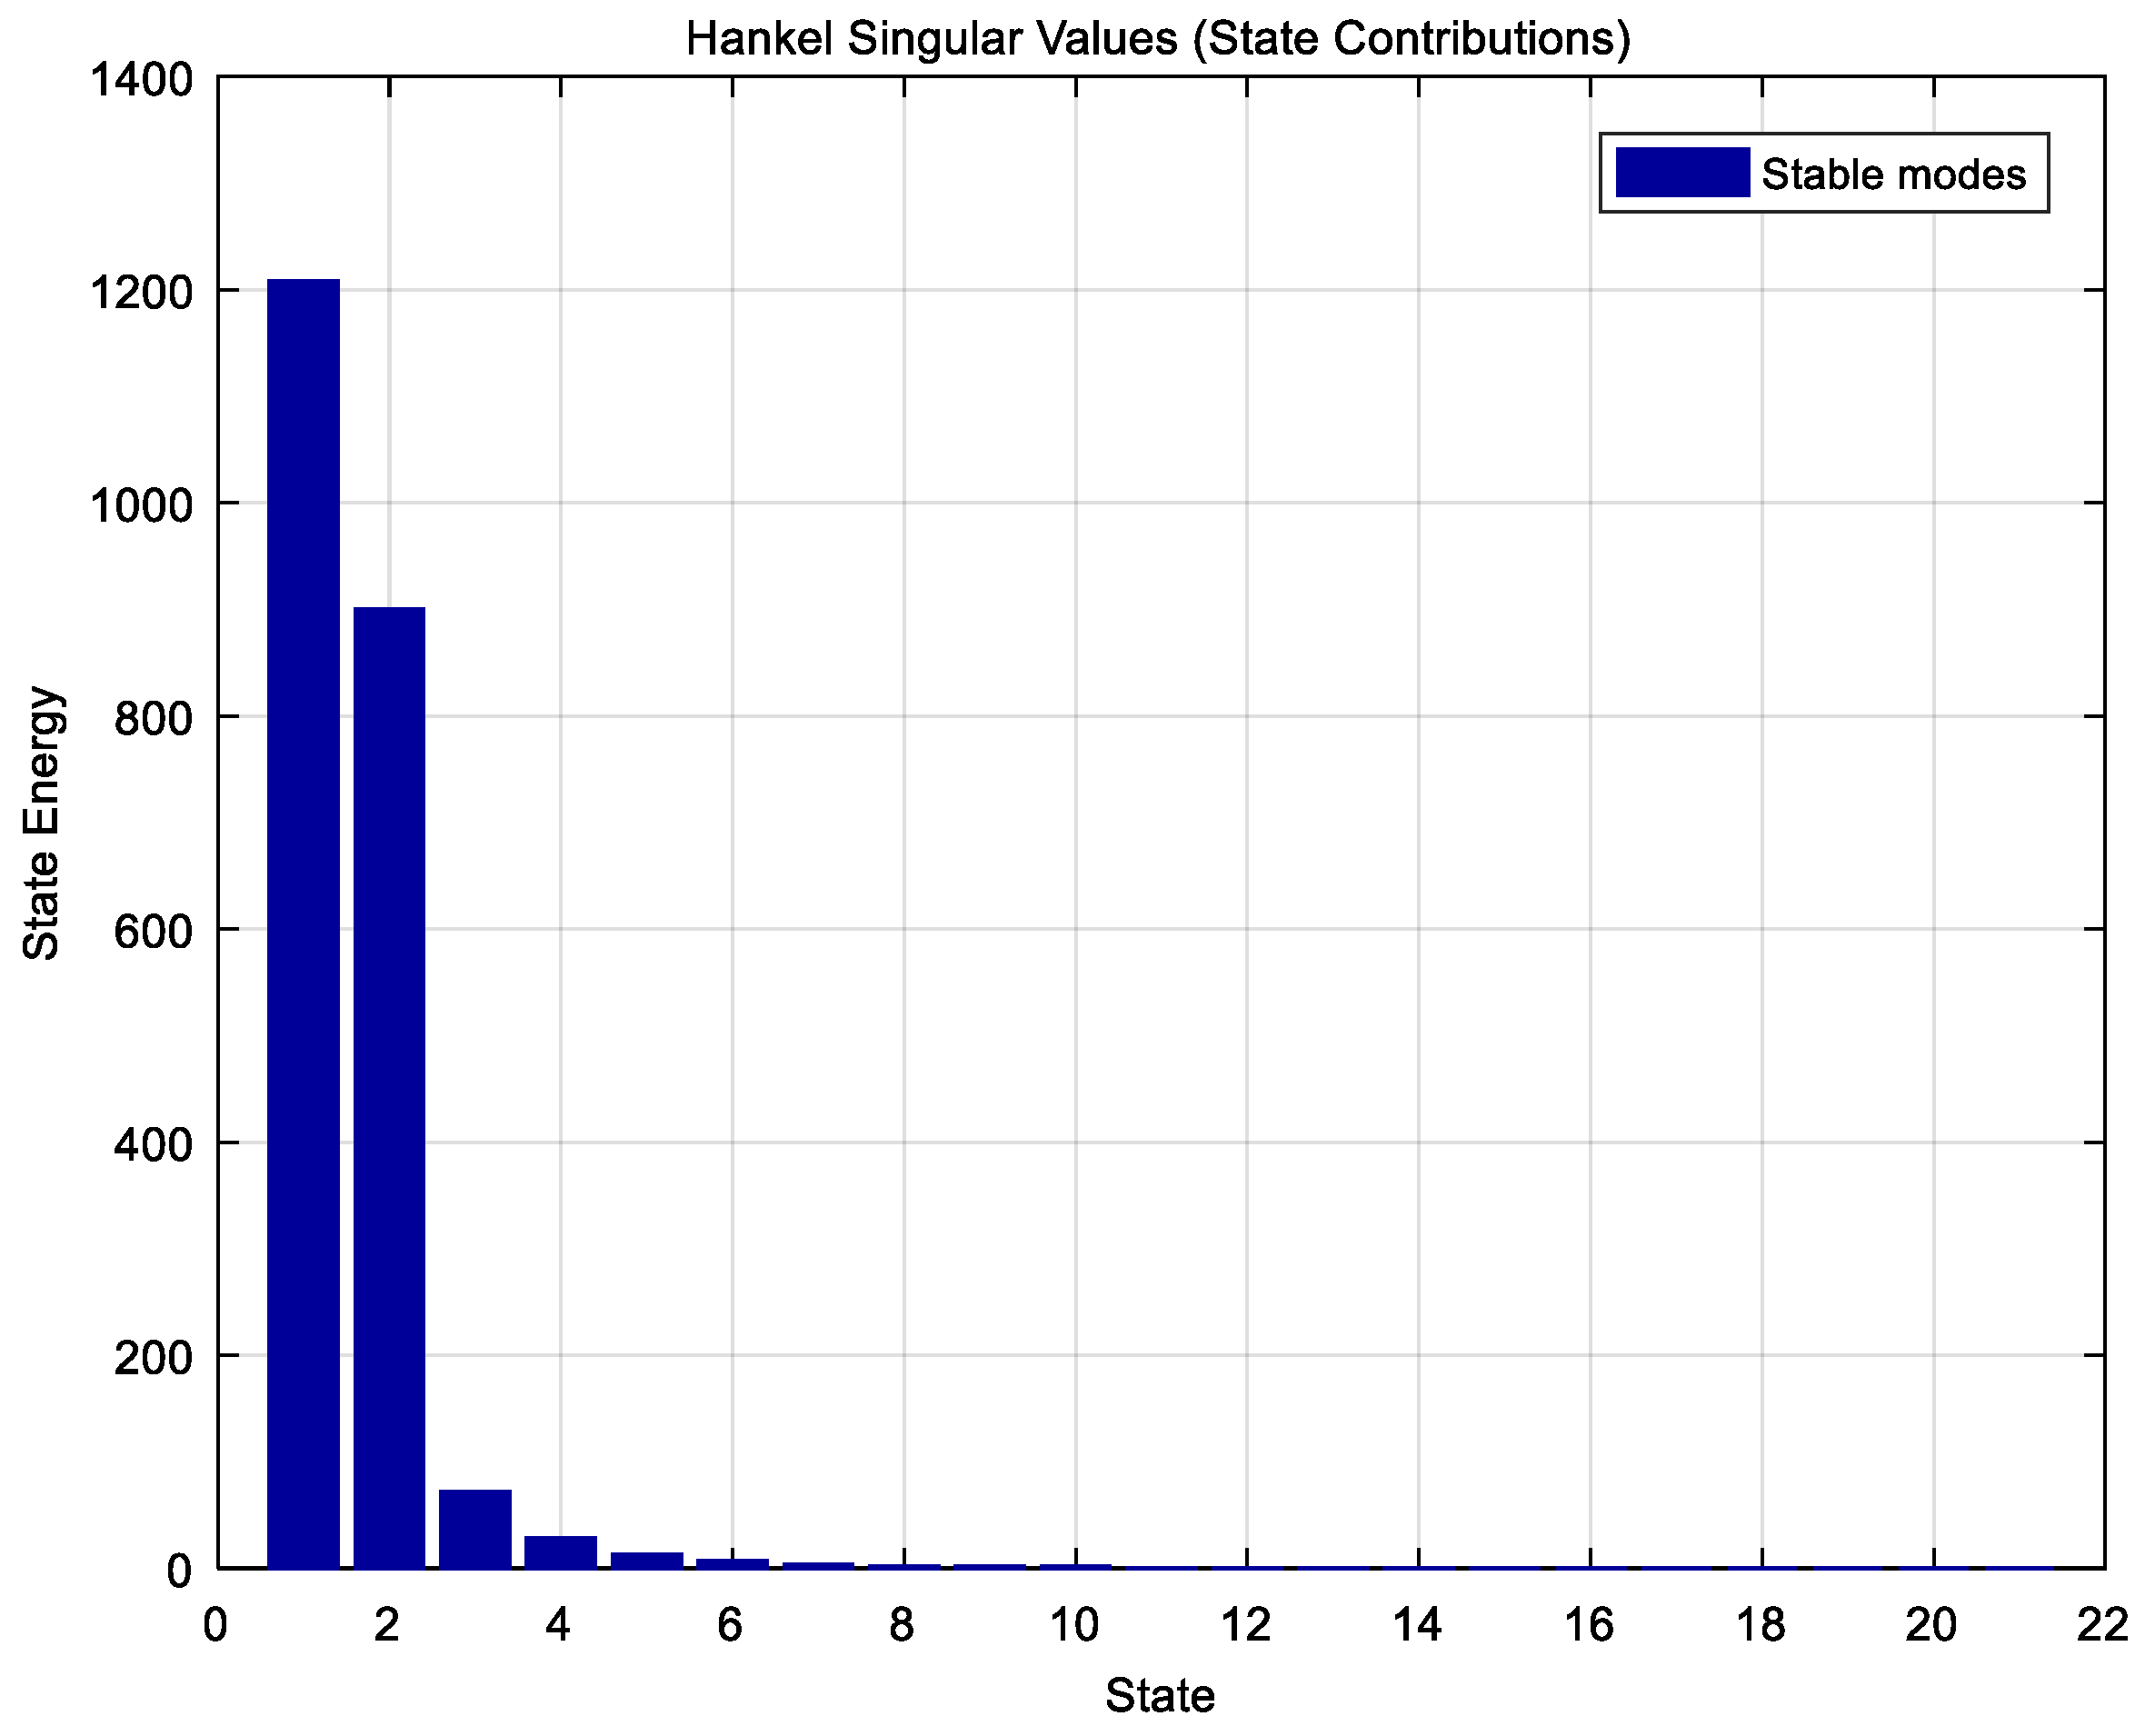
The order of the selected μ -controller is 21, which is too high for the axial piston pump control. The Hankel singular values of the μ -controller that represent the controller’s state energy are shown in Figure 13. As can be seen, six states have significant energy. Moreover, the Hankel singular values after the fourth state decrease significantly. This means that the controller order can be reduced to six or even four.
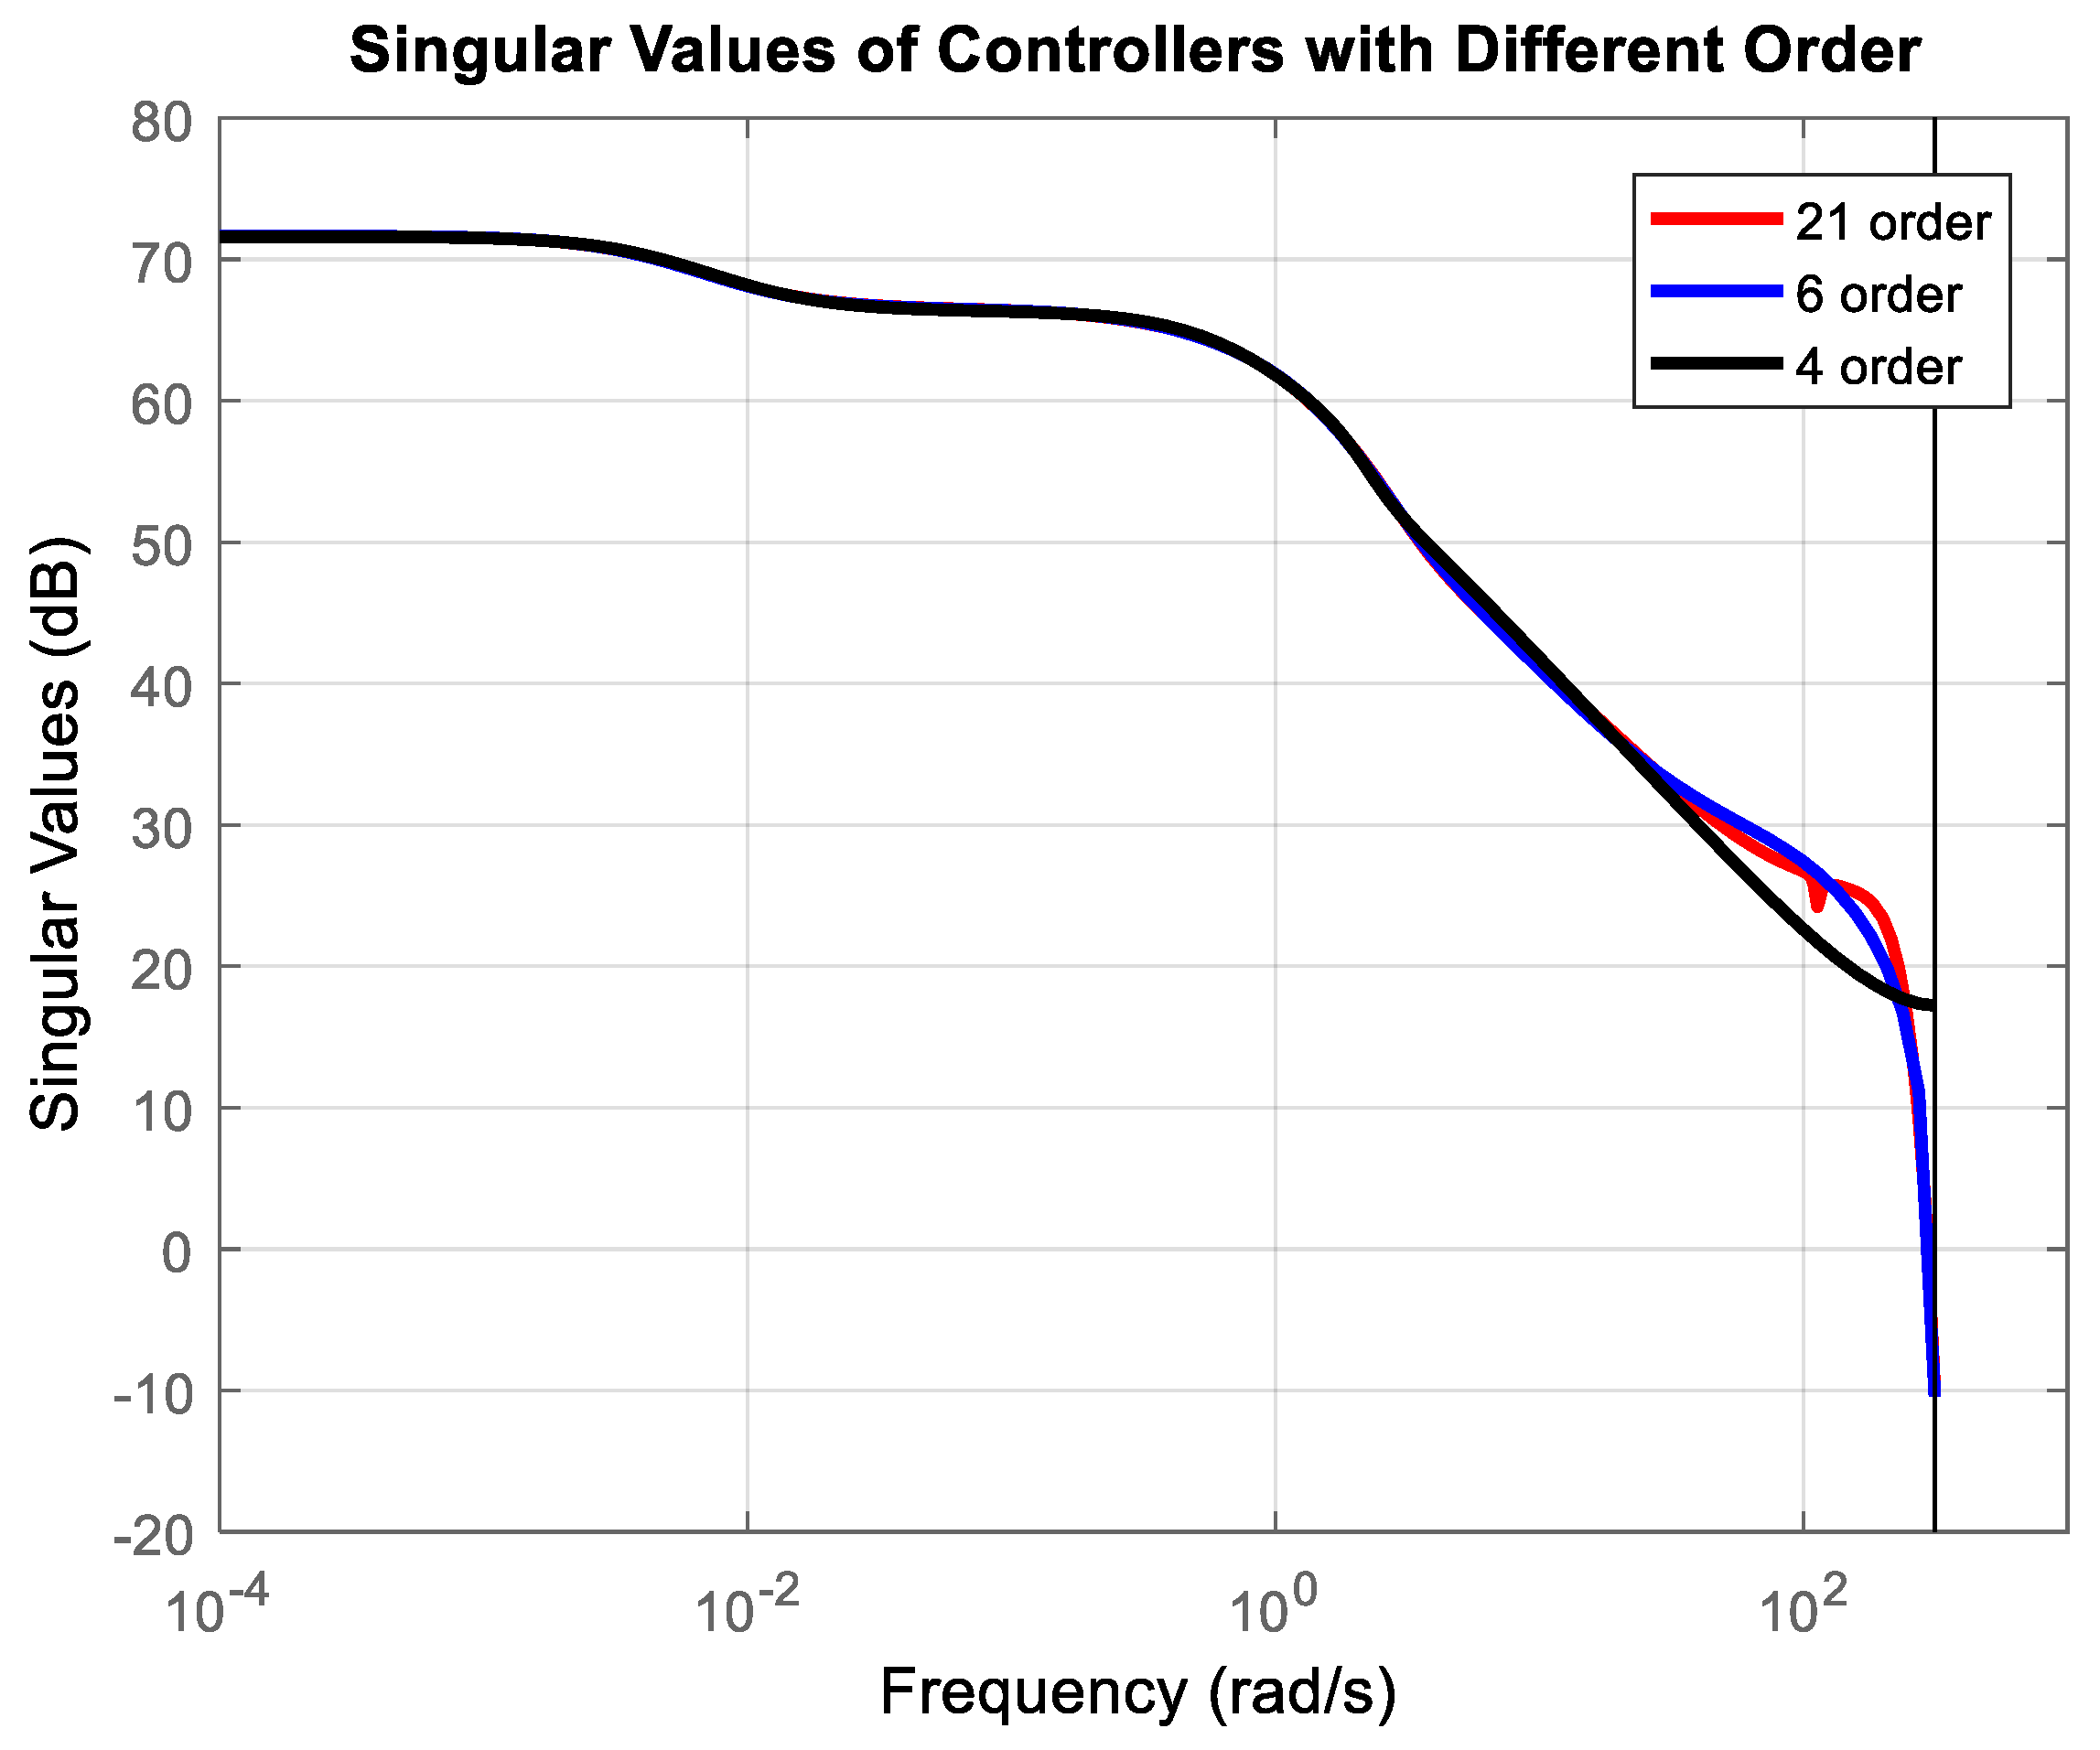
In Figure 14, the singular values of the full-order and reduced-order μ -controllers are presented. There is a negligible difference between the controllers of the 21st and 6th orders. The controller of the fourth order differs only in the high-frequency range.
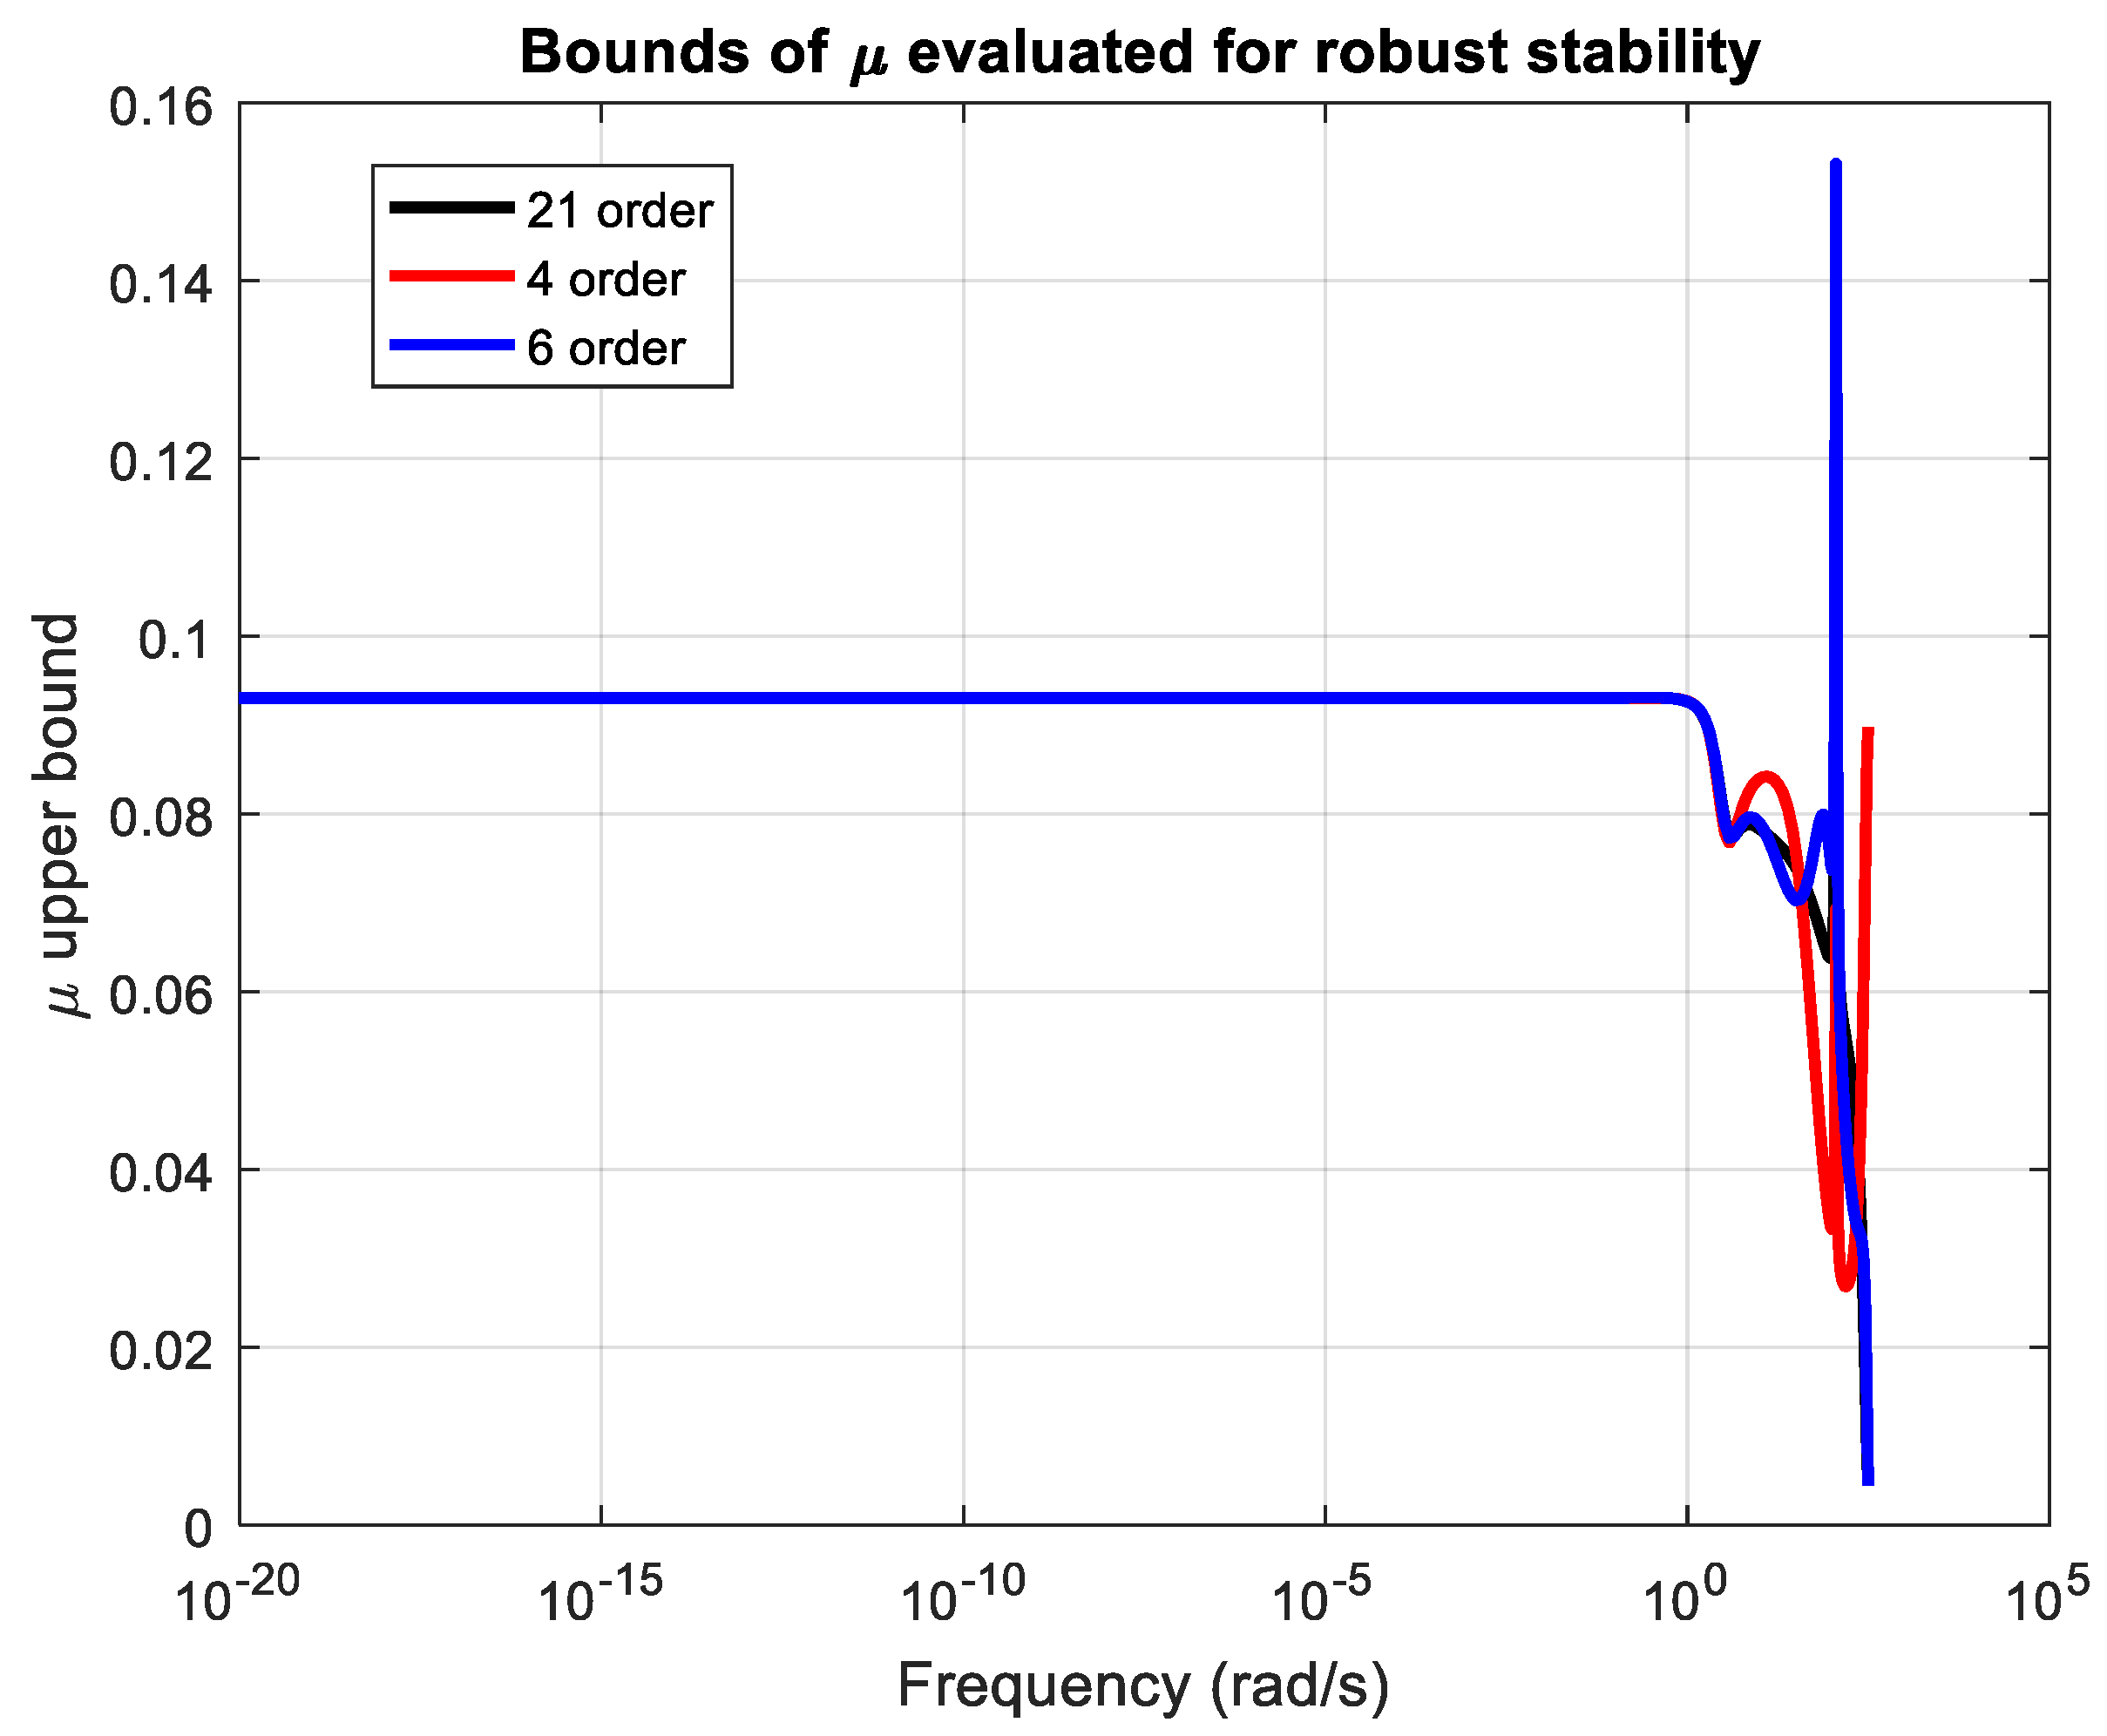
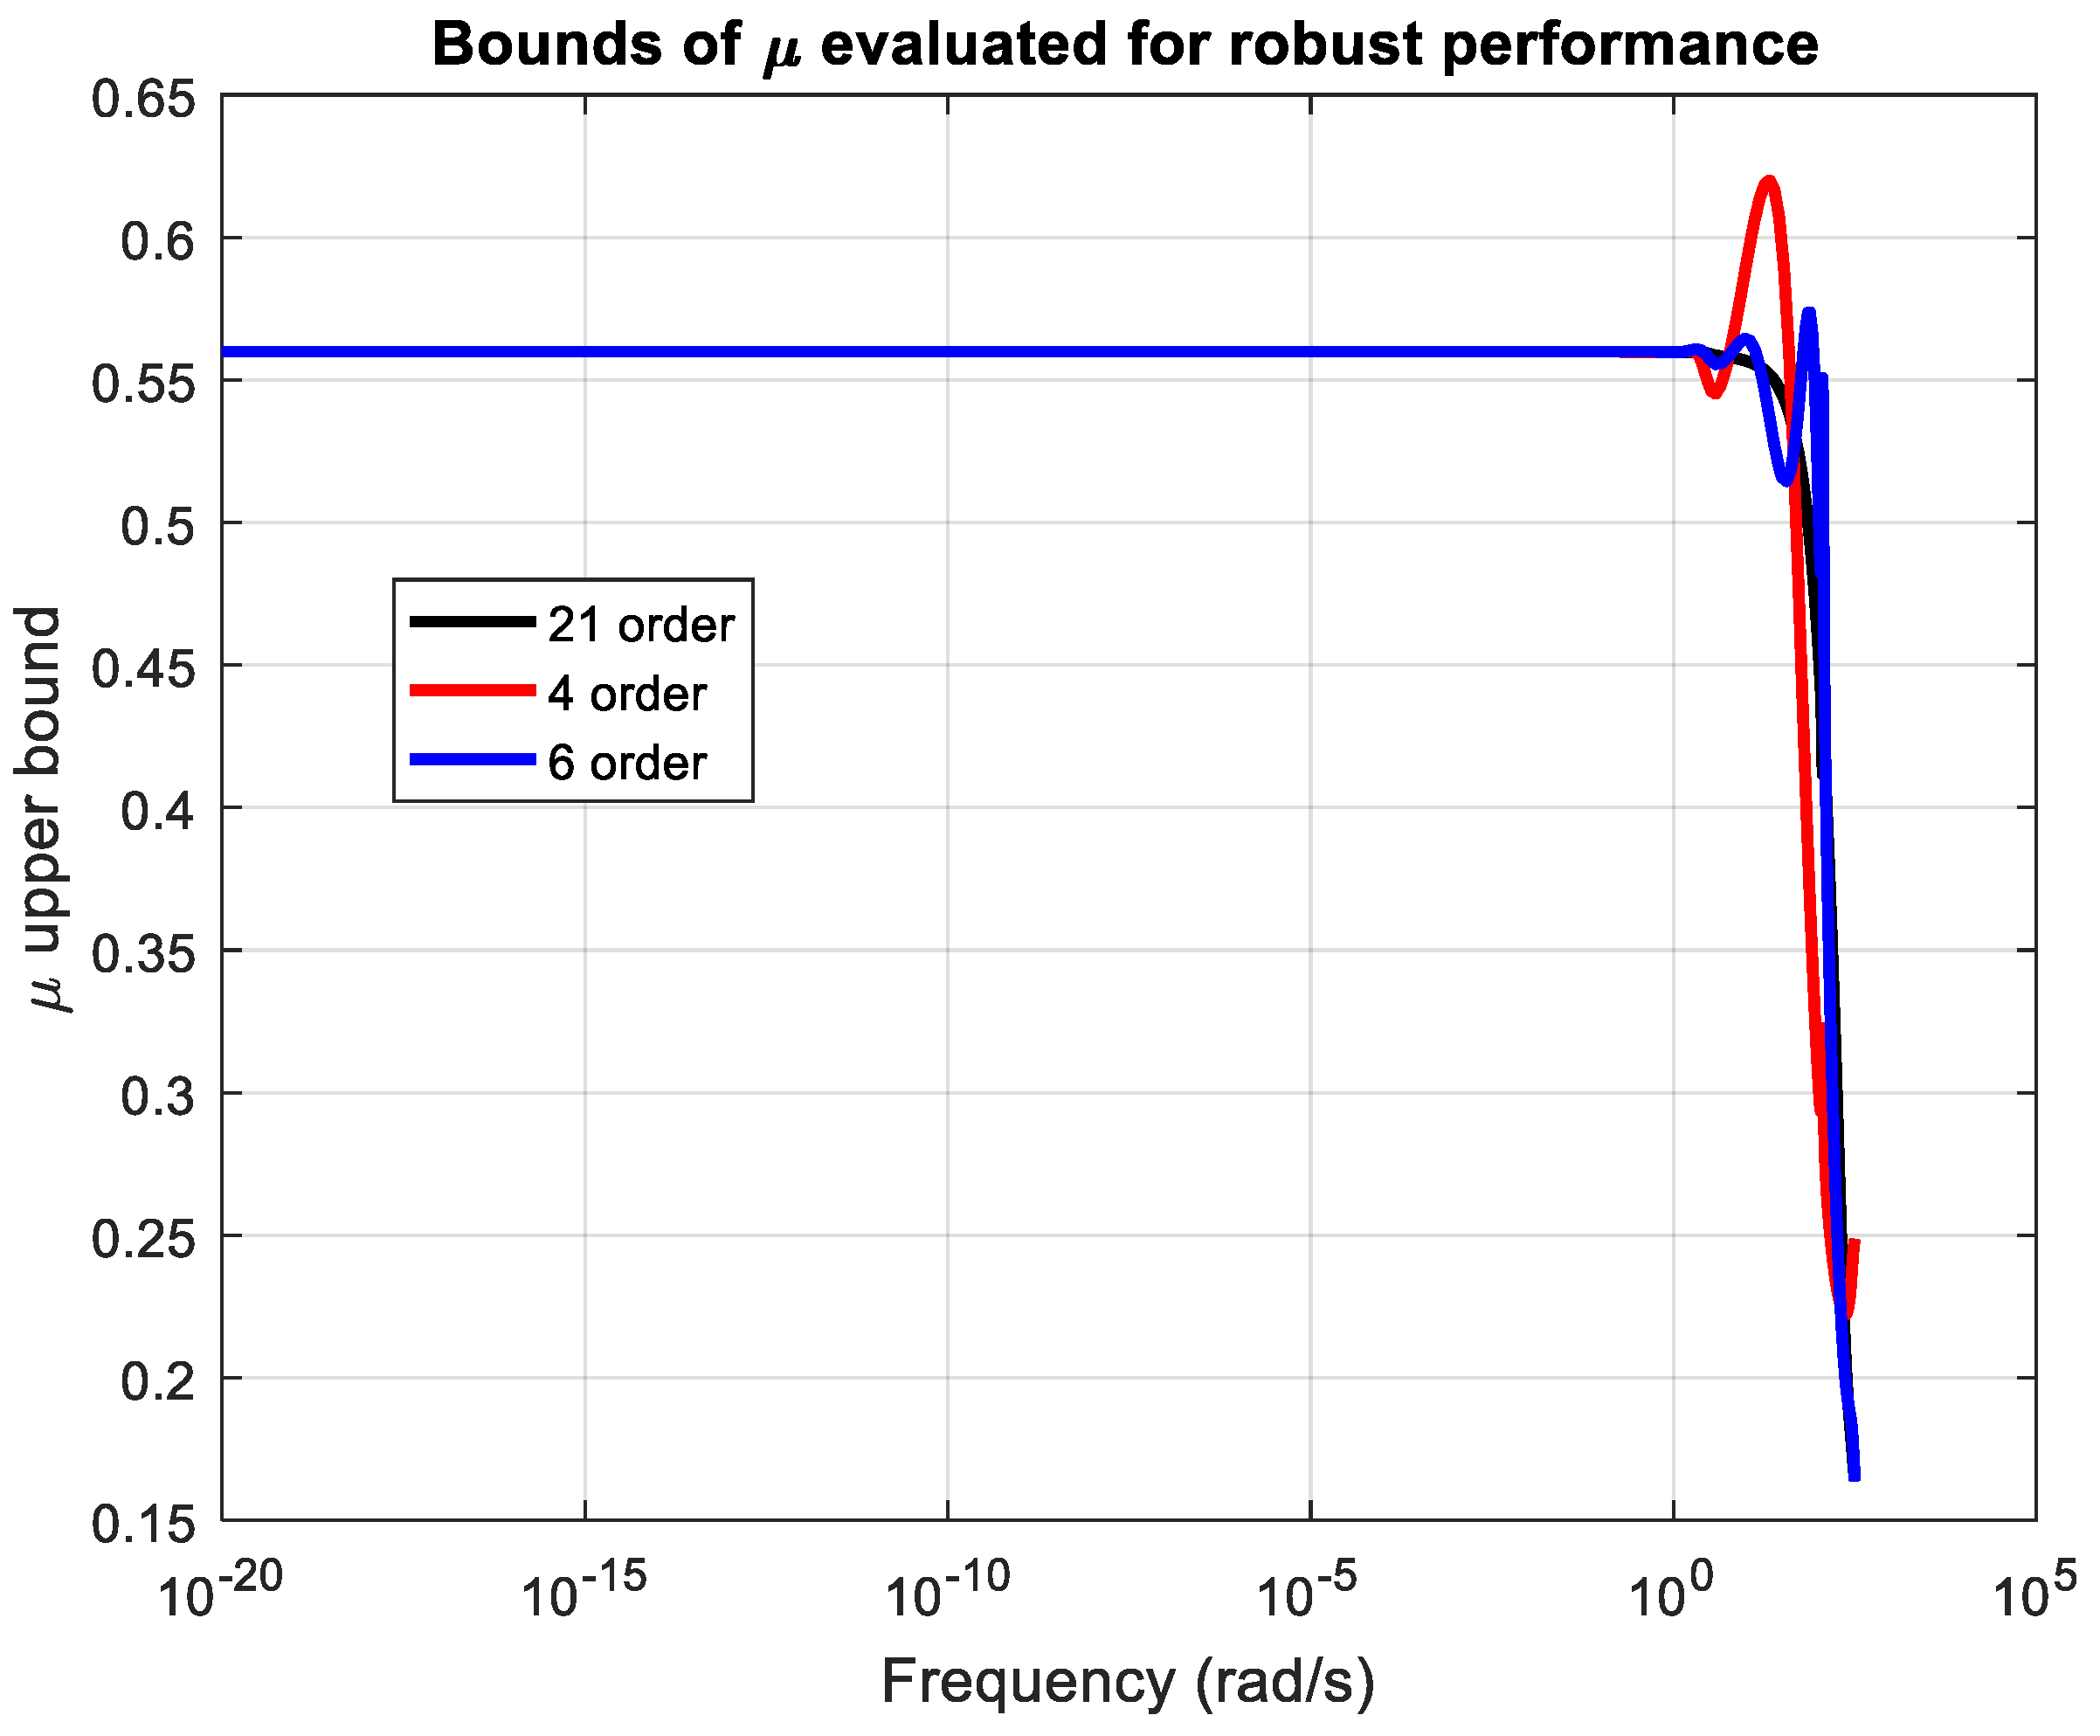
The robust stability test (condition (11)) and robust performance test (condition (16)) are performed for closed-loop systems with μ -controllers of the 21st, 6th, and 4th orders. The bounds of the structured singular values for the analysis of robust stability and robust performance are presented in Figure 15 and Figure 16, respectively. The closed-loop systems with all three designed μ -controllers achieve robust stability and robust performance. The systems with controllers from the 4th and 21st orders can tolerate up to approximately 10 times larger uncertainty than the one introduced in model (3). The system with the sixth-order controller has a smaller stability margin and admits uncertainty 6.5 times larger than that prescribed in uncertainty model (3). These three robust stability margins are sufficiently large, and they will guarantee the axial piston pump’s workability for the complete operating mode. The peak of the structured singular value for the system with a sixth-order controller is in the high-frequency range, where the modeled uncertainty is the largest.
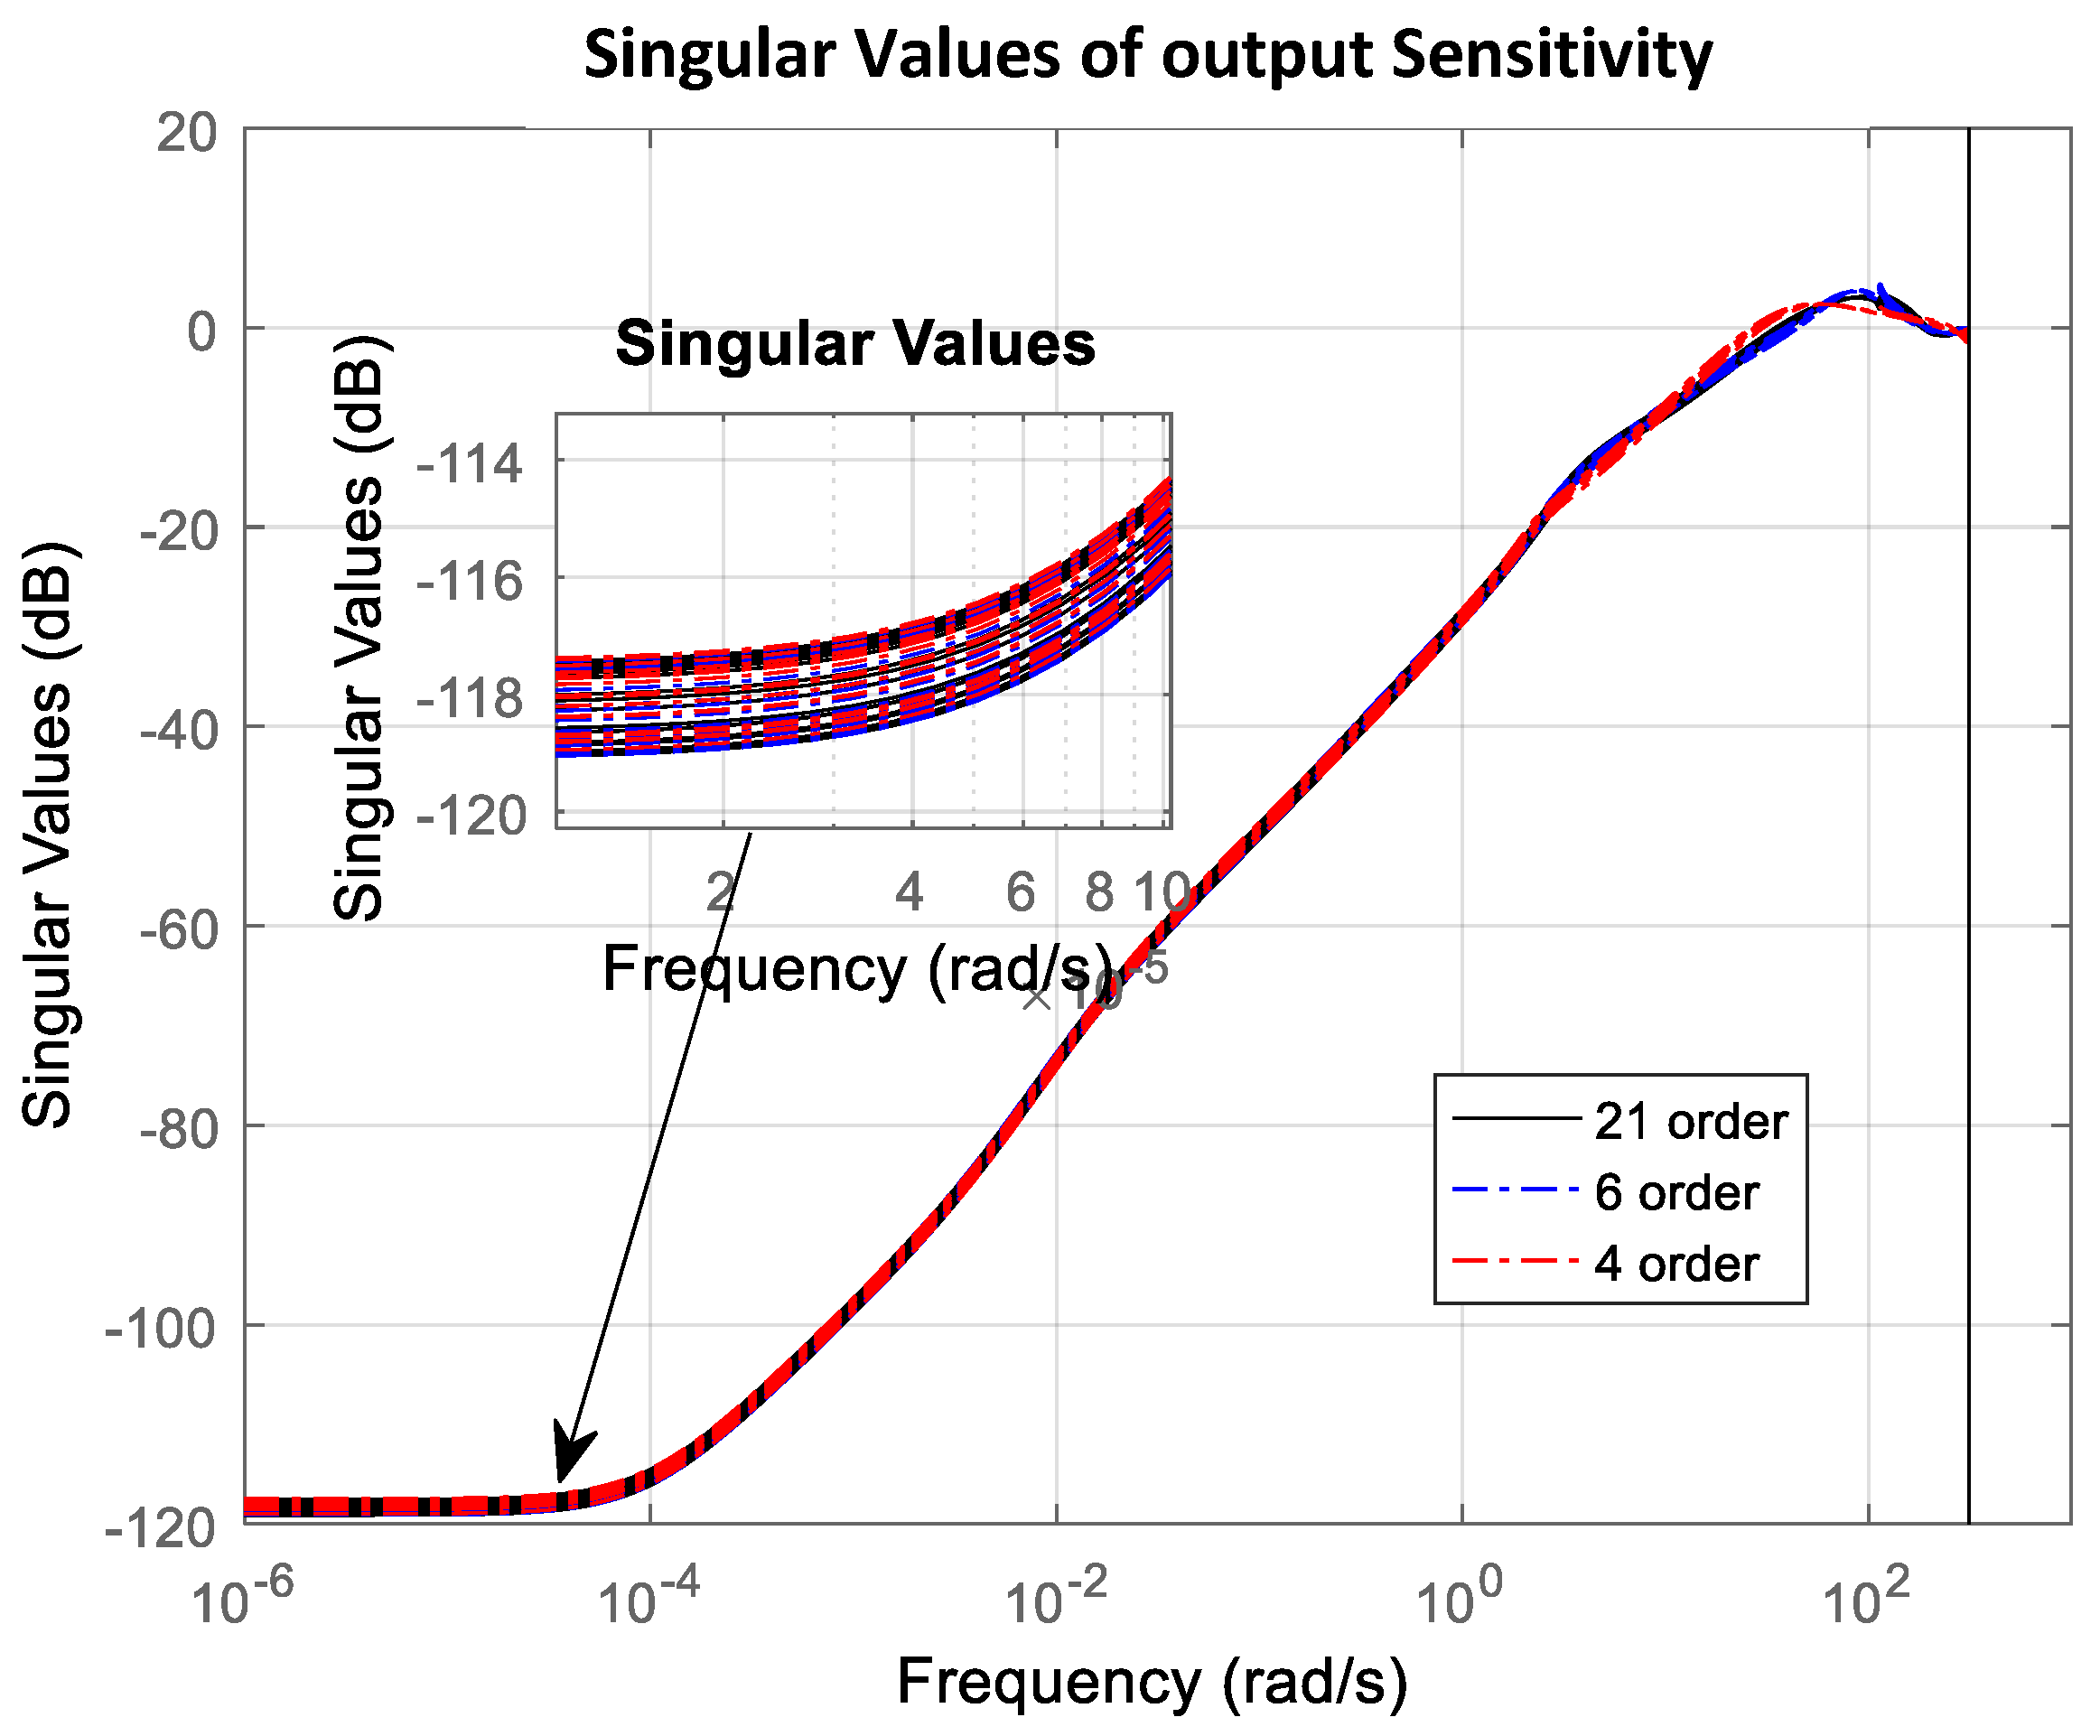
The systems with 21st-order and 6th-order controllers will keep robust performance for approximately 1.8 times larger uncertainty than those modeled in (3), while the system with the 4th-order controller can tolerate uncertainty up to 1.6 times larger than the modeled one. This means that the three closed-loop systems will achieve performance in terms of the chosen weighting filters for the wide working mode. The output sensitivities of the three closed-loop systems for the 30 randomly chosen samples of uncertainty are presented in Figure 17.
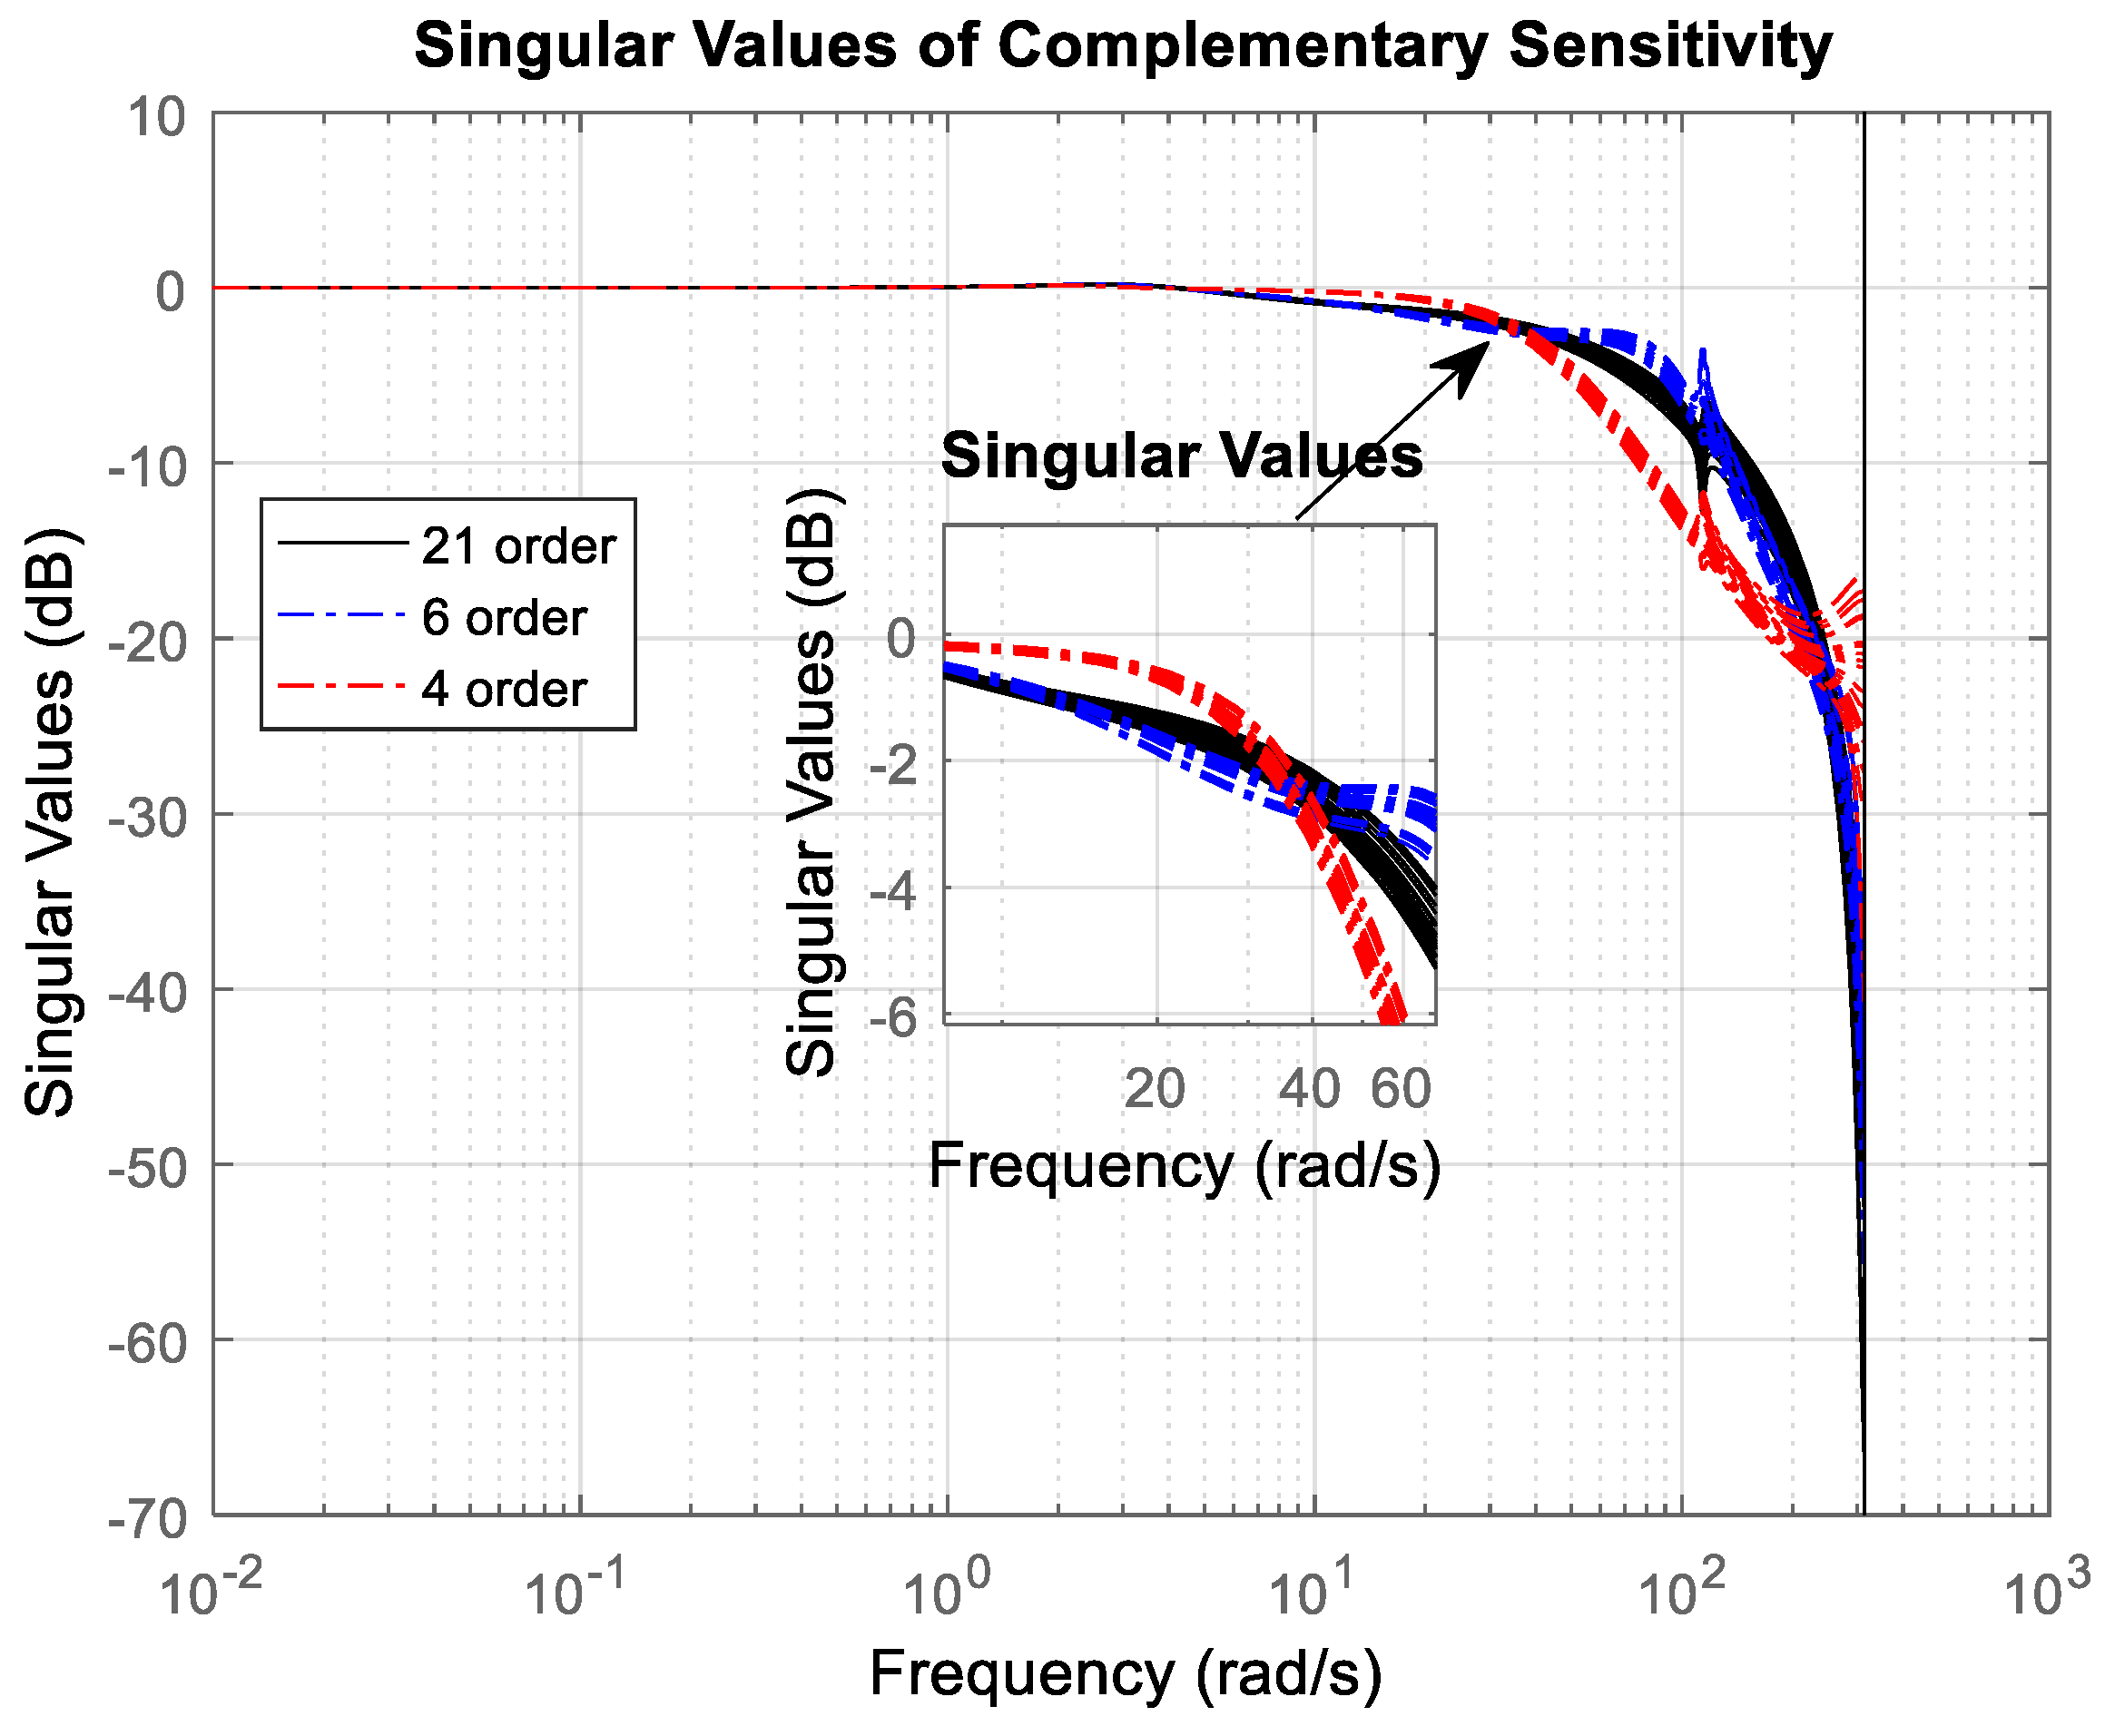
It is seen that the bandwidths of the three control systems for all 30 samples are almost the same (they are approximately 20 rad/s). This again shows the robustness of the closed-loop system against load disturbances. The cut-off frequency of 20 rad/s will provide a sufficiently small response time with respect to load disturbances. The complementary sensitivities of the three closed-loop systems for the 30 randomly chosen samples of modeled uncertainty are presented in Figure 18. The bandwidths with respect to the desired flow rate for the three systems are approximately 30 rad/s. Again, the insensitivity of the reference tracking performance to the modeled uncertainty can be seen, which means that the settling time of the axial piston pump control system will be almost the same in wide working mode.
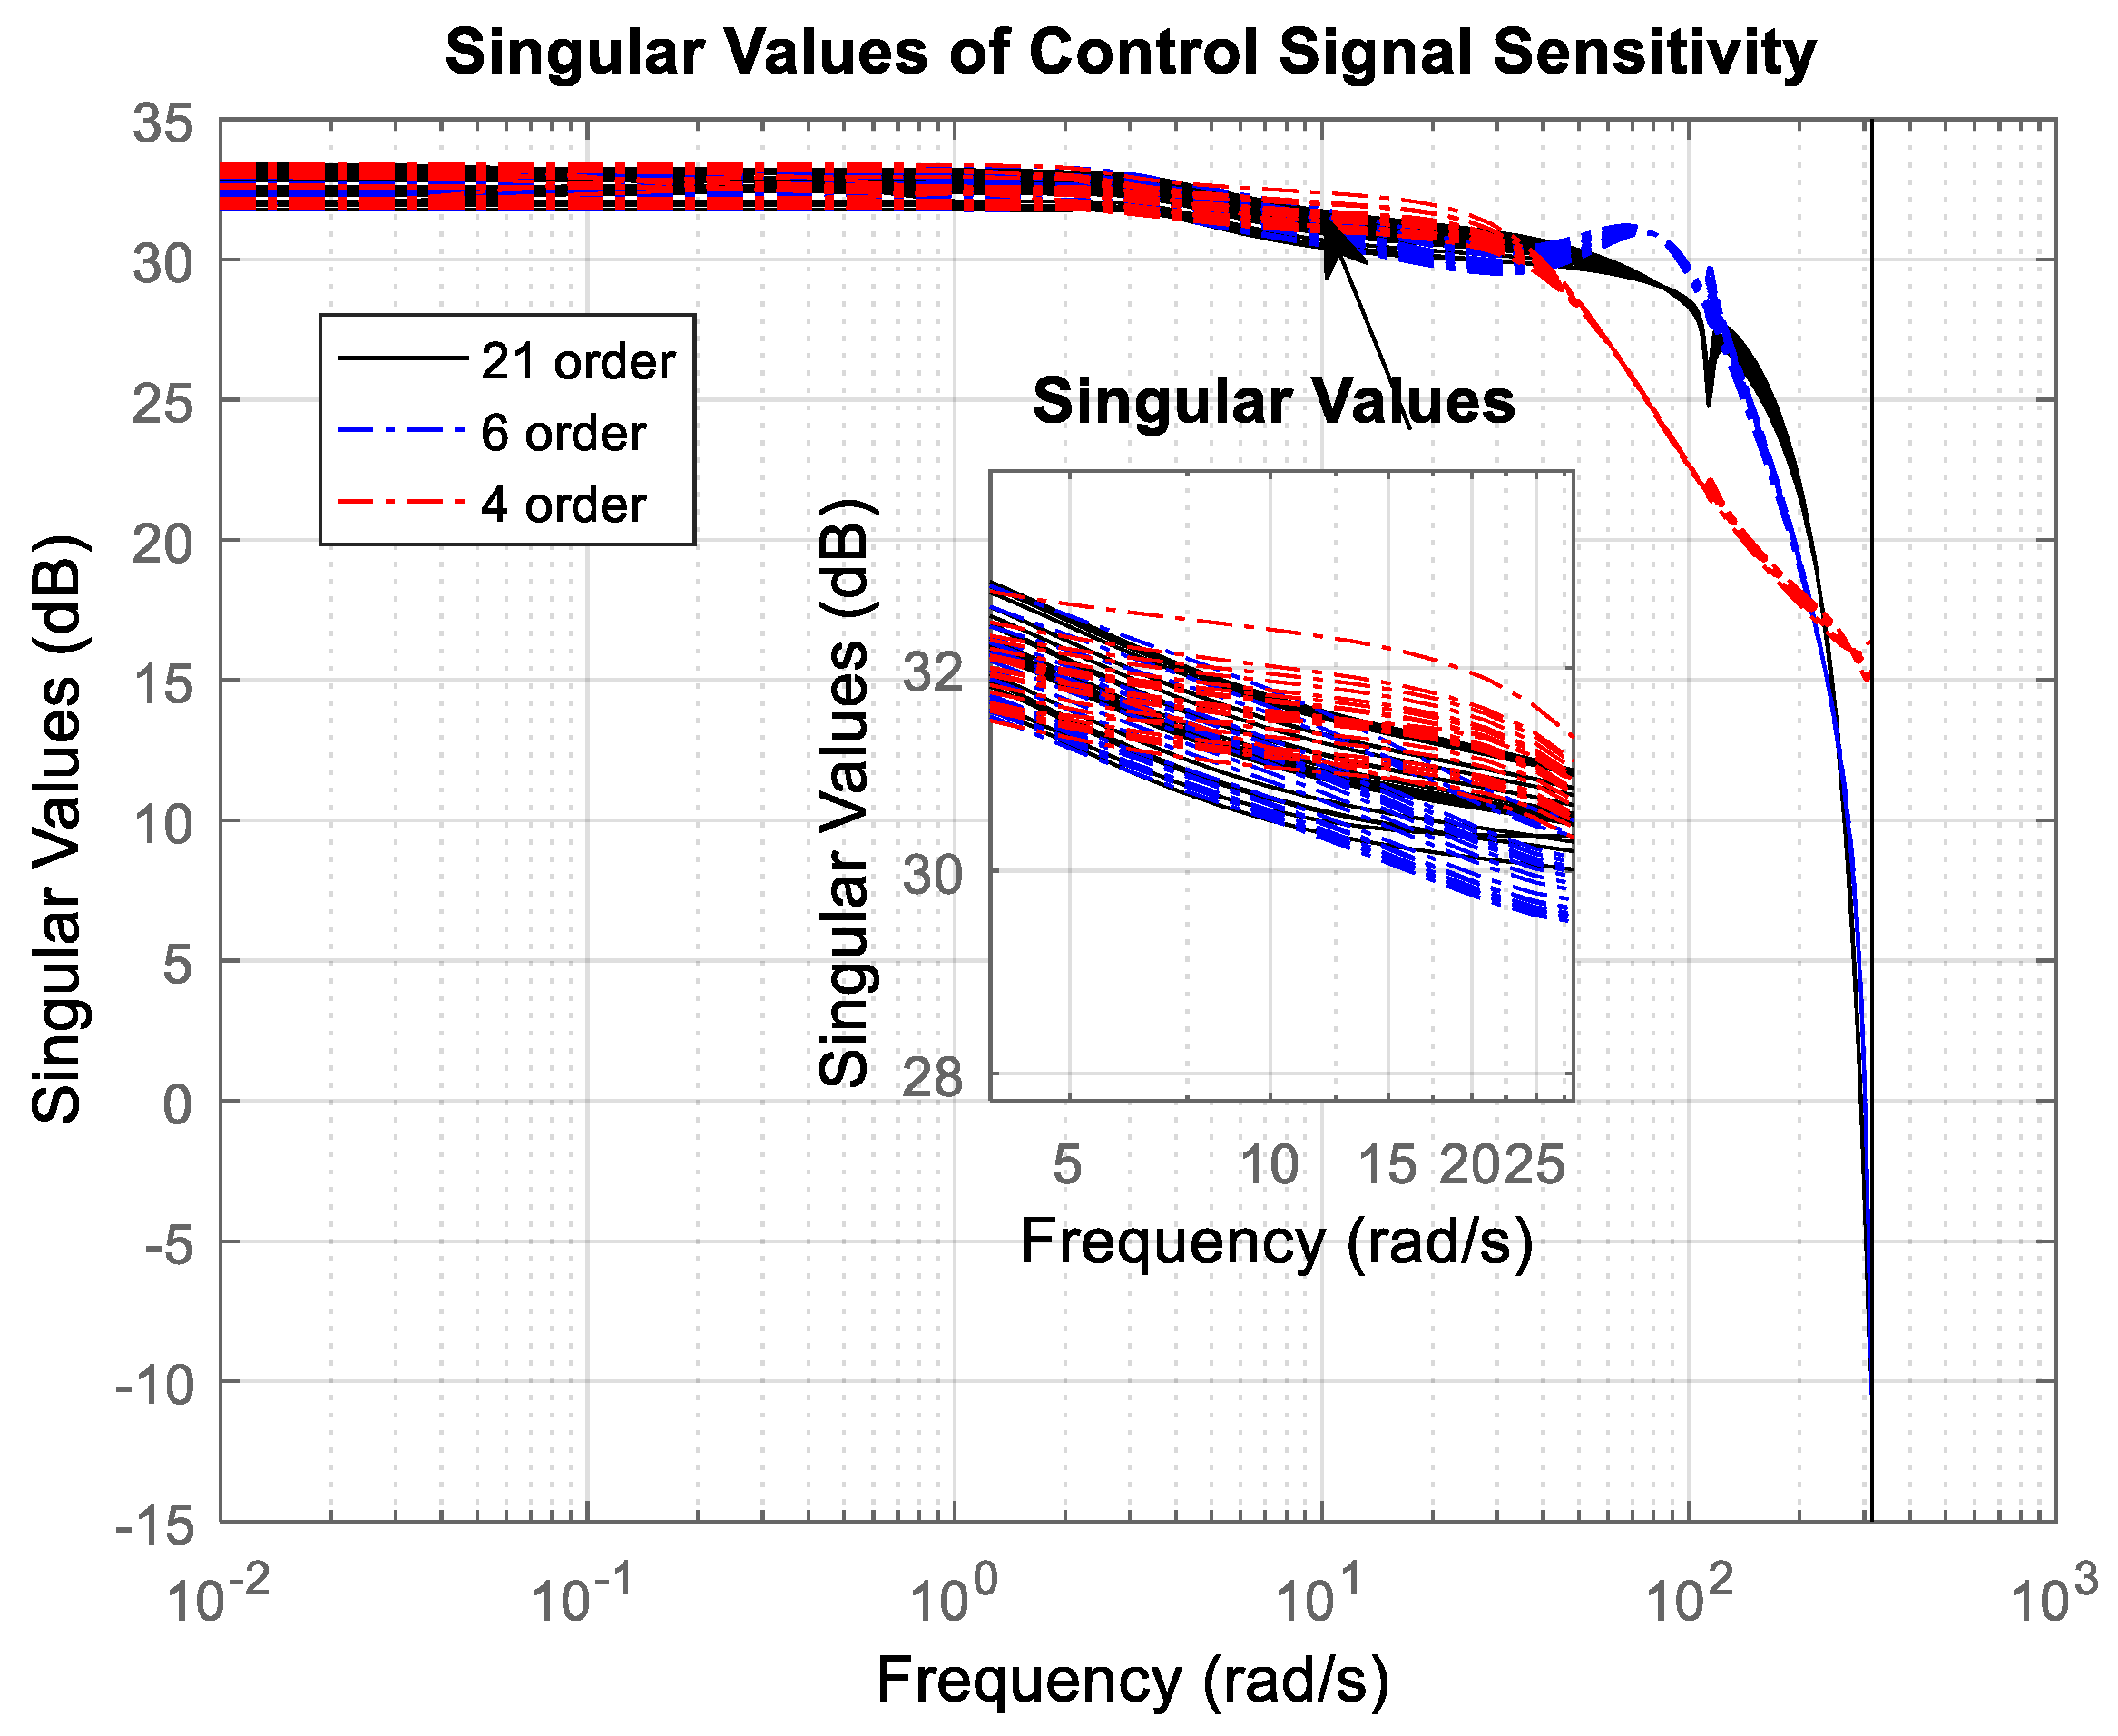
The control signal sensitivities for the same 30 randomly chosen samples of modeled uncertainty are depicted in Figure 19. The amplification of signals in low frequencies for the three systems will be almost the same, and the amplification is insensitive to model uncertainty. There is a high-frequency range ( 40 ω 200 rad/s) where the control signal of the system with a fourth-order controller will be more insensitive to noises due to the measurement of the pump flow rate and pump pressure.
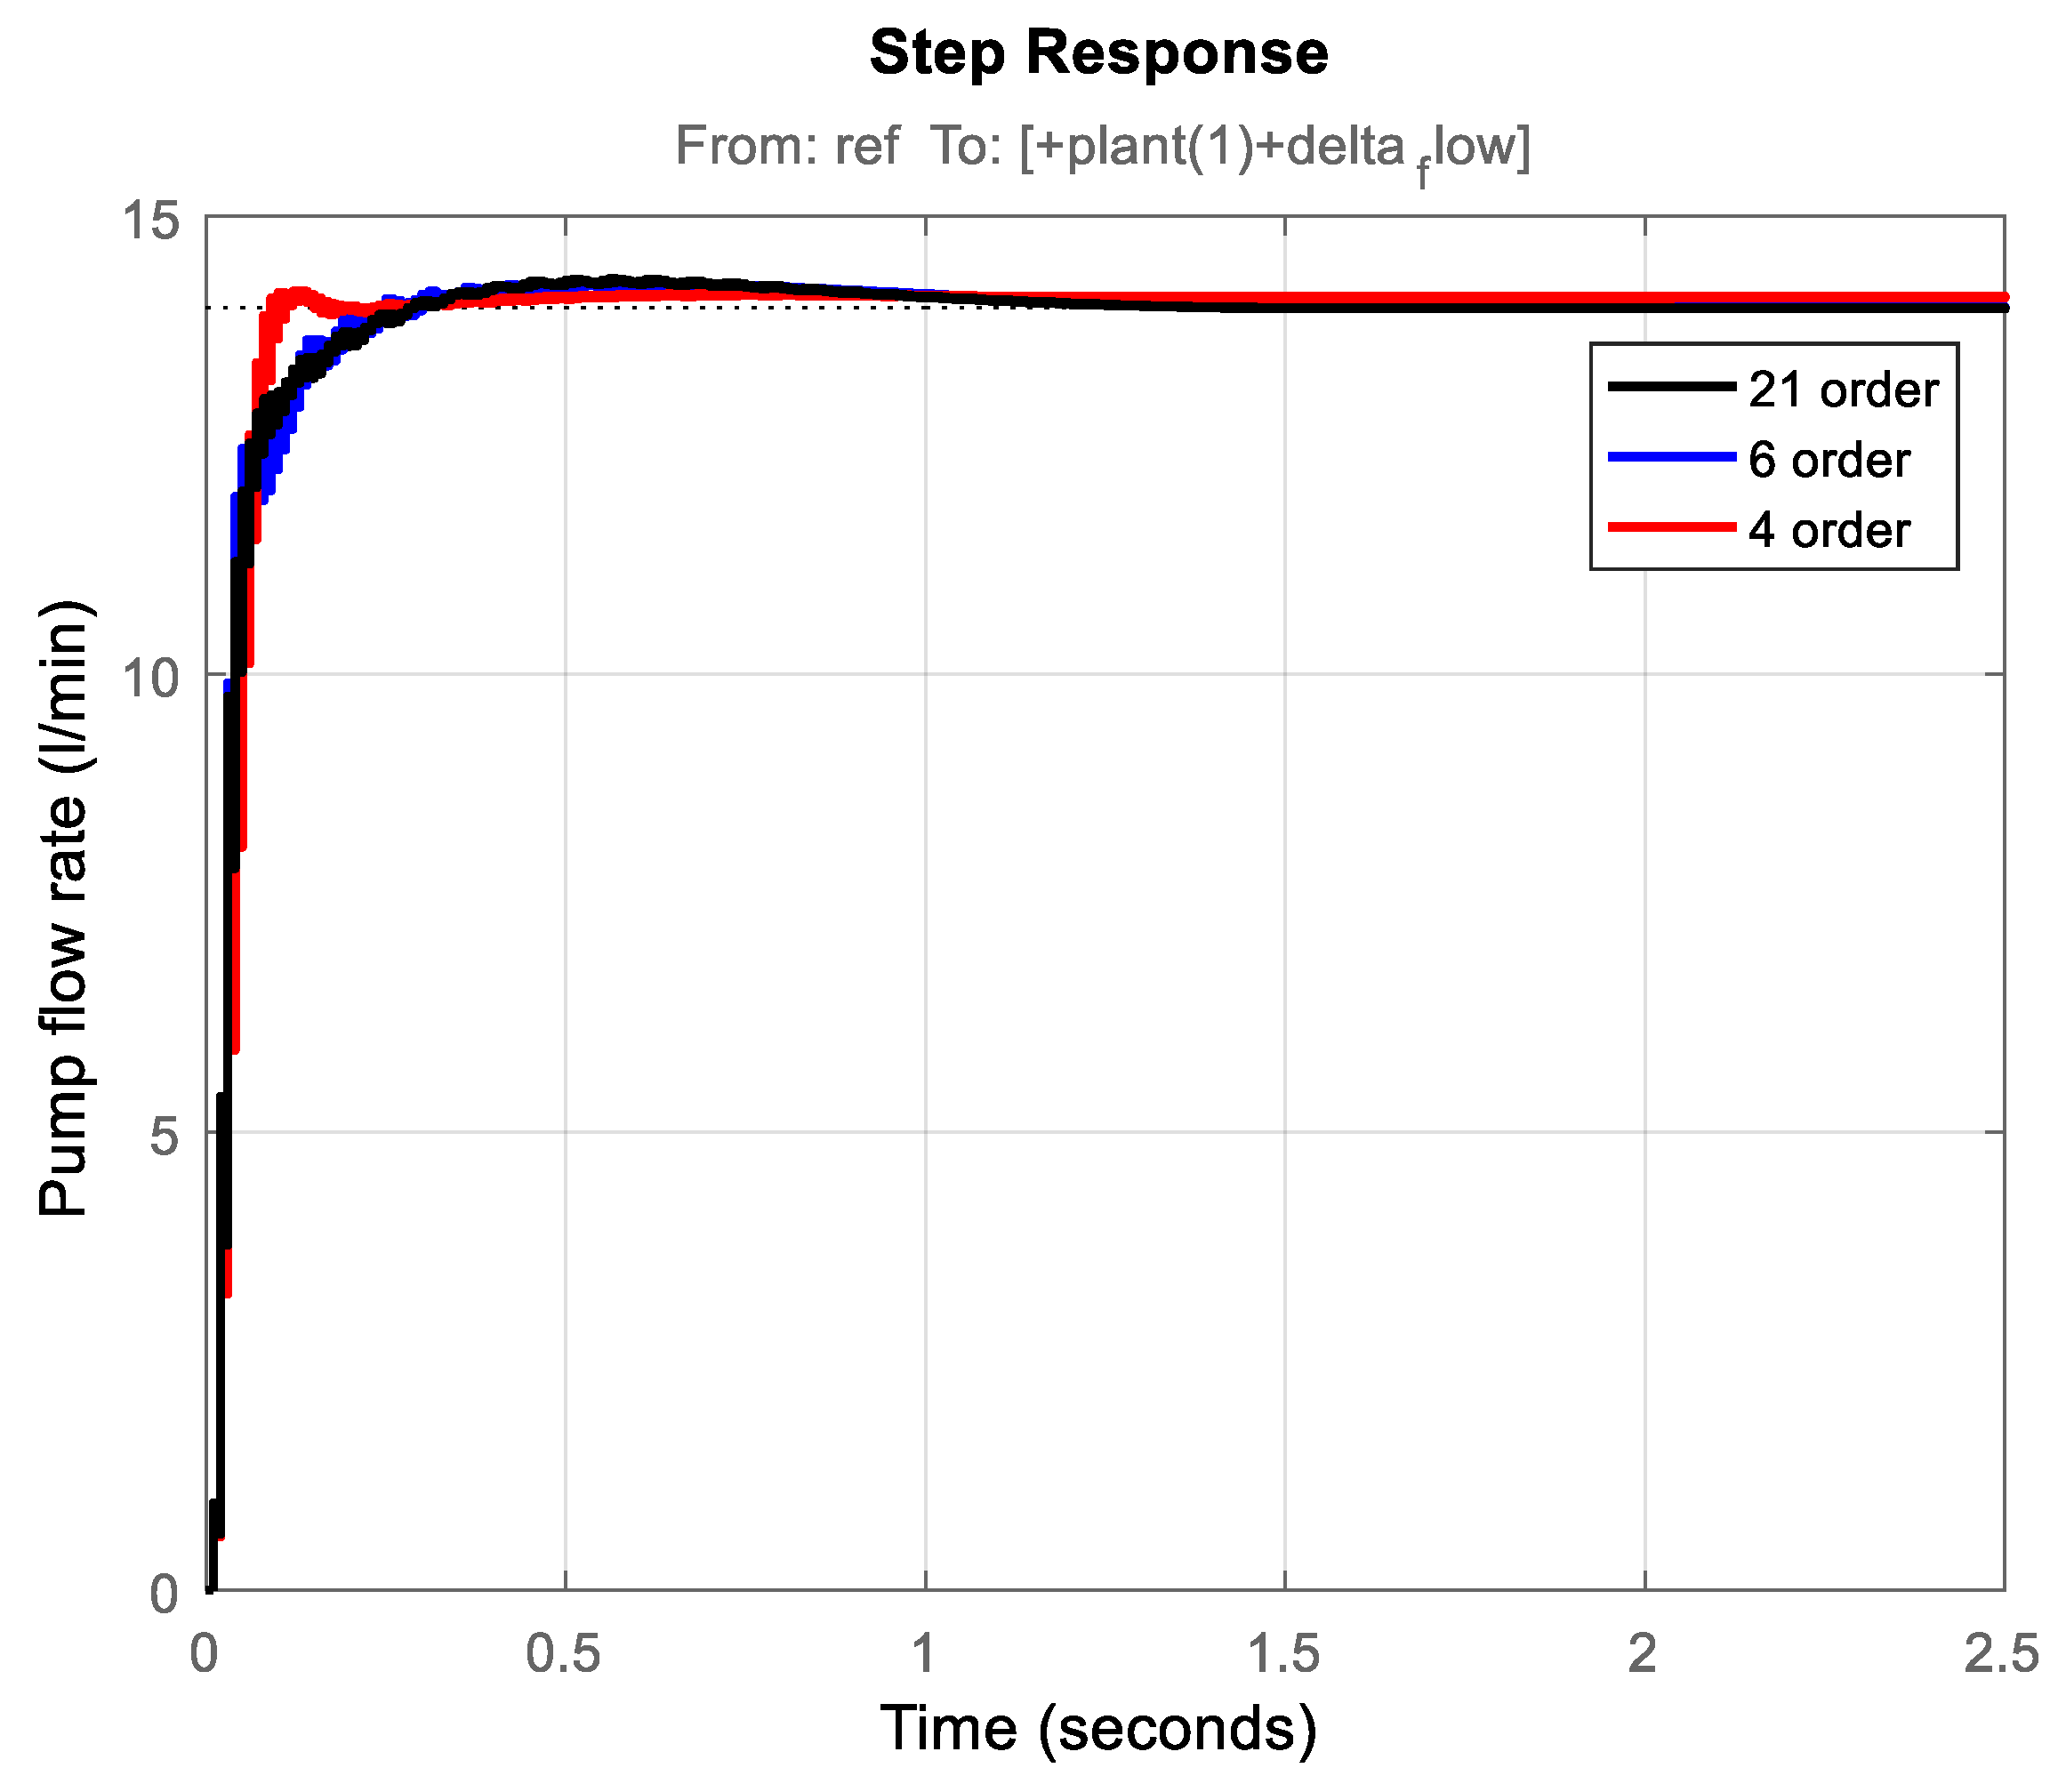
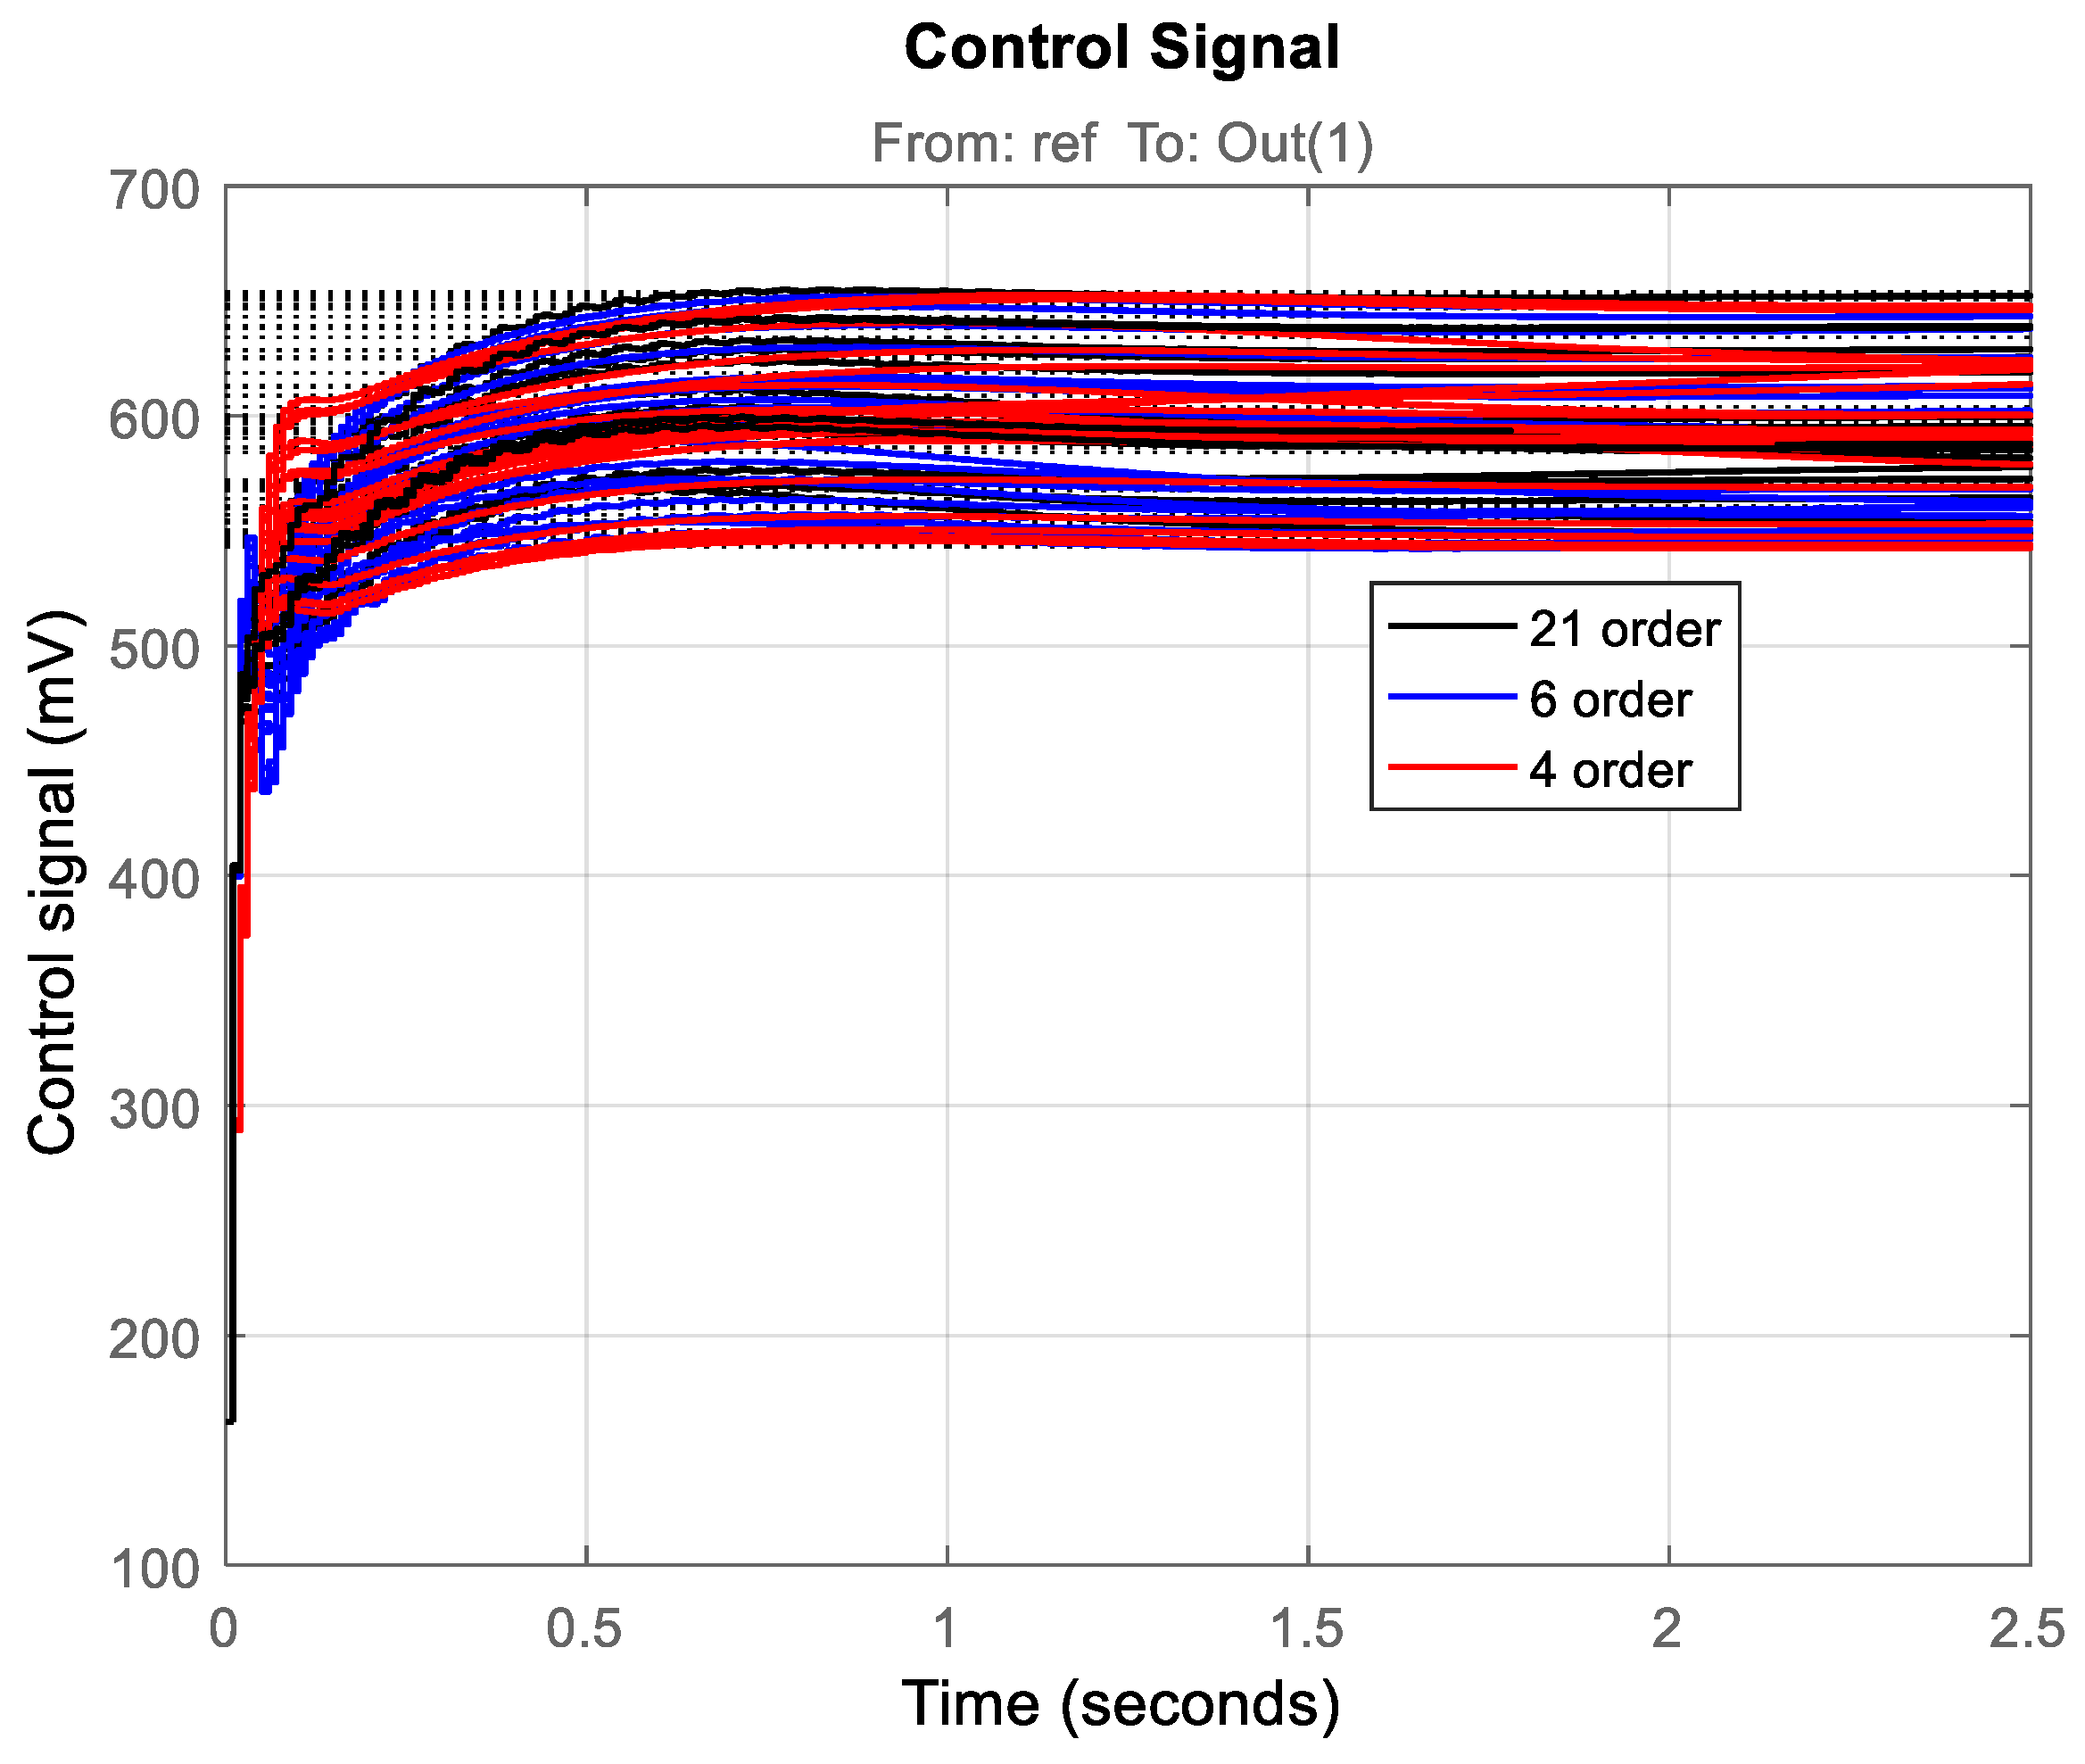
The closed-loop system’s transient responses and control signals evaluated for 30 randomly chosen samples of model uncertainty are depicted in Figure 20 and Figure 21, respectively. The response of the closed-loop system with a fourth-order controller is a little bit faster than the responses of another two control systems, but a small overshoot also occurred for the system with a fourth-order controller. The step responses are insensitive to model uncertainties, showing the robustness of closed-loop systems. The control signals for all systems and for all uncertainties have acceptable shapes. The maximal amplitude of all control signals is further from its limit of 1000 mV.

4. Experimental Test of the Robust μ-Controller

Controller implementation is based on the MC012-022 microcontroller (Figure 1) from Danfoss’ PLUS + 1 Controller Family. The MC012-022 is a compact and versatile microcontroller designed for use in mobile hydraulic applications. It features a 32-bit Cortex-M3 processor with 512 K internal flash memory, providing fast single-cycle processing speed, and supporting CAN (Controller Area Network) communication, making it suitable for distributed control systems in vehicles and machinery.
We have implemented a distributed control system that leverages the strengths of both real-time simulation and physical hardware. The core of this system is the mu-controller state-space realization running as a real-time Simulink® model on a host PC. The Danfoss MC012-022 microcontroller serves as the frontend interface between the physical world and the Simulink® model. It performs two crucial functions:
  • Sensor Data Acquisition: The MC012-022 collects sensor signals from the pressure transducer, proportional spool valve LVDT, and gear flow meter and transmits them to the Simulink® model running on the host PC.
  • Actuator Control: Upon receiving control signals generated by the Simulink® model, the MC012-022 processes these signals and converts them into the PWM output to drive the spool actuator.
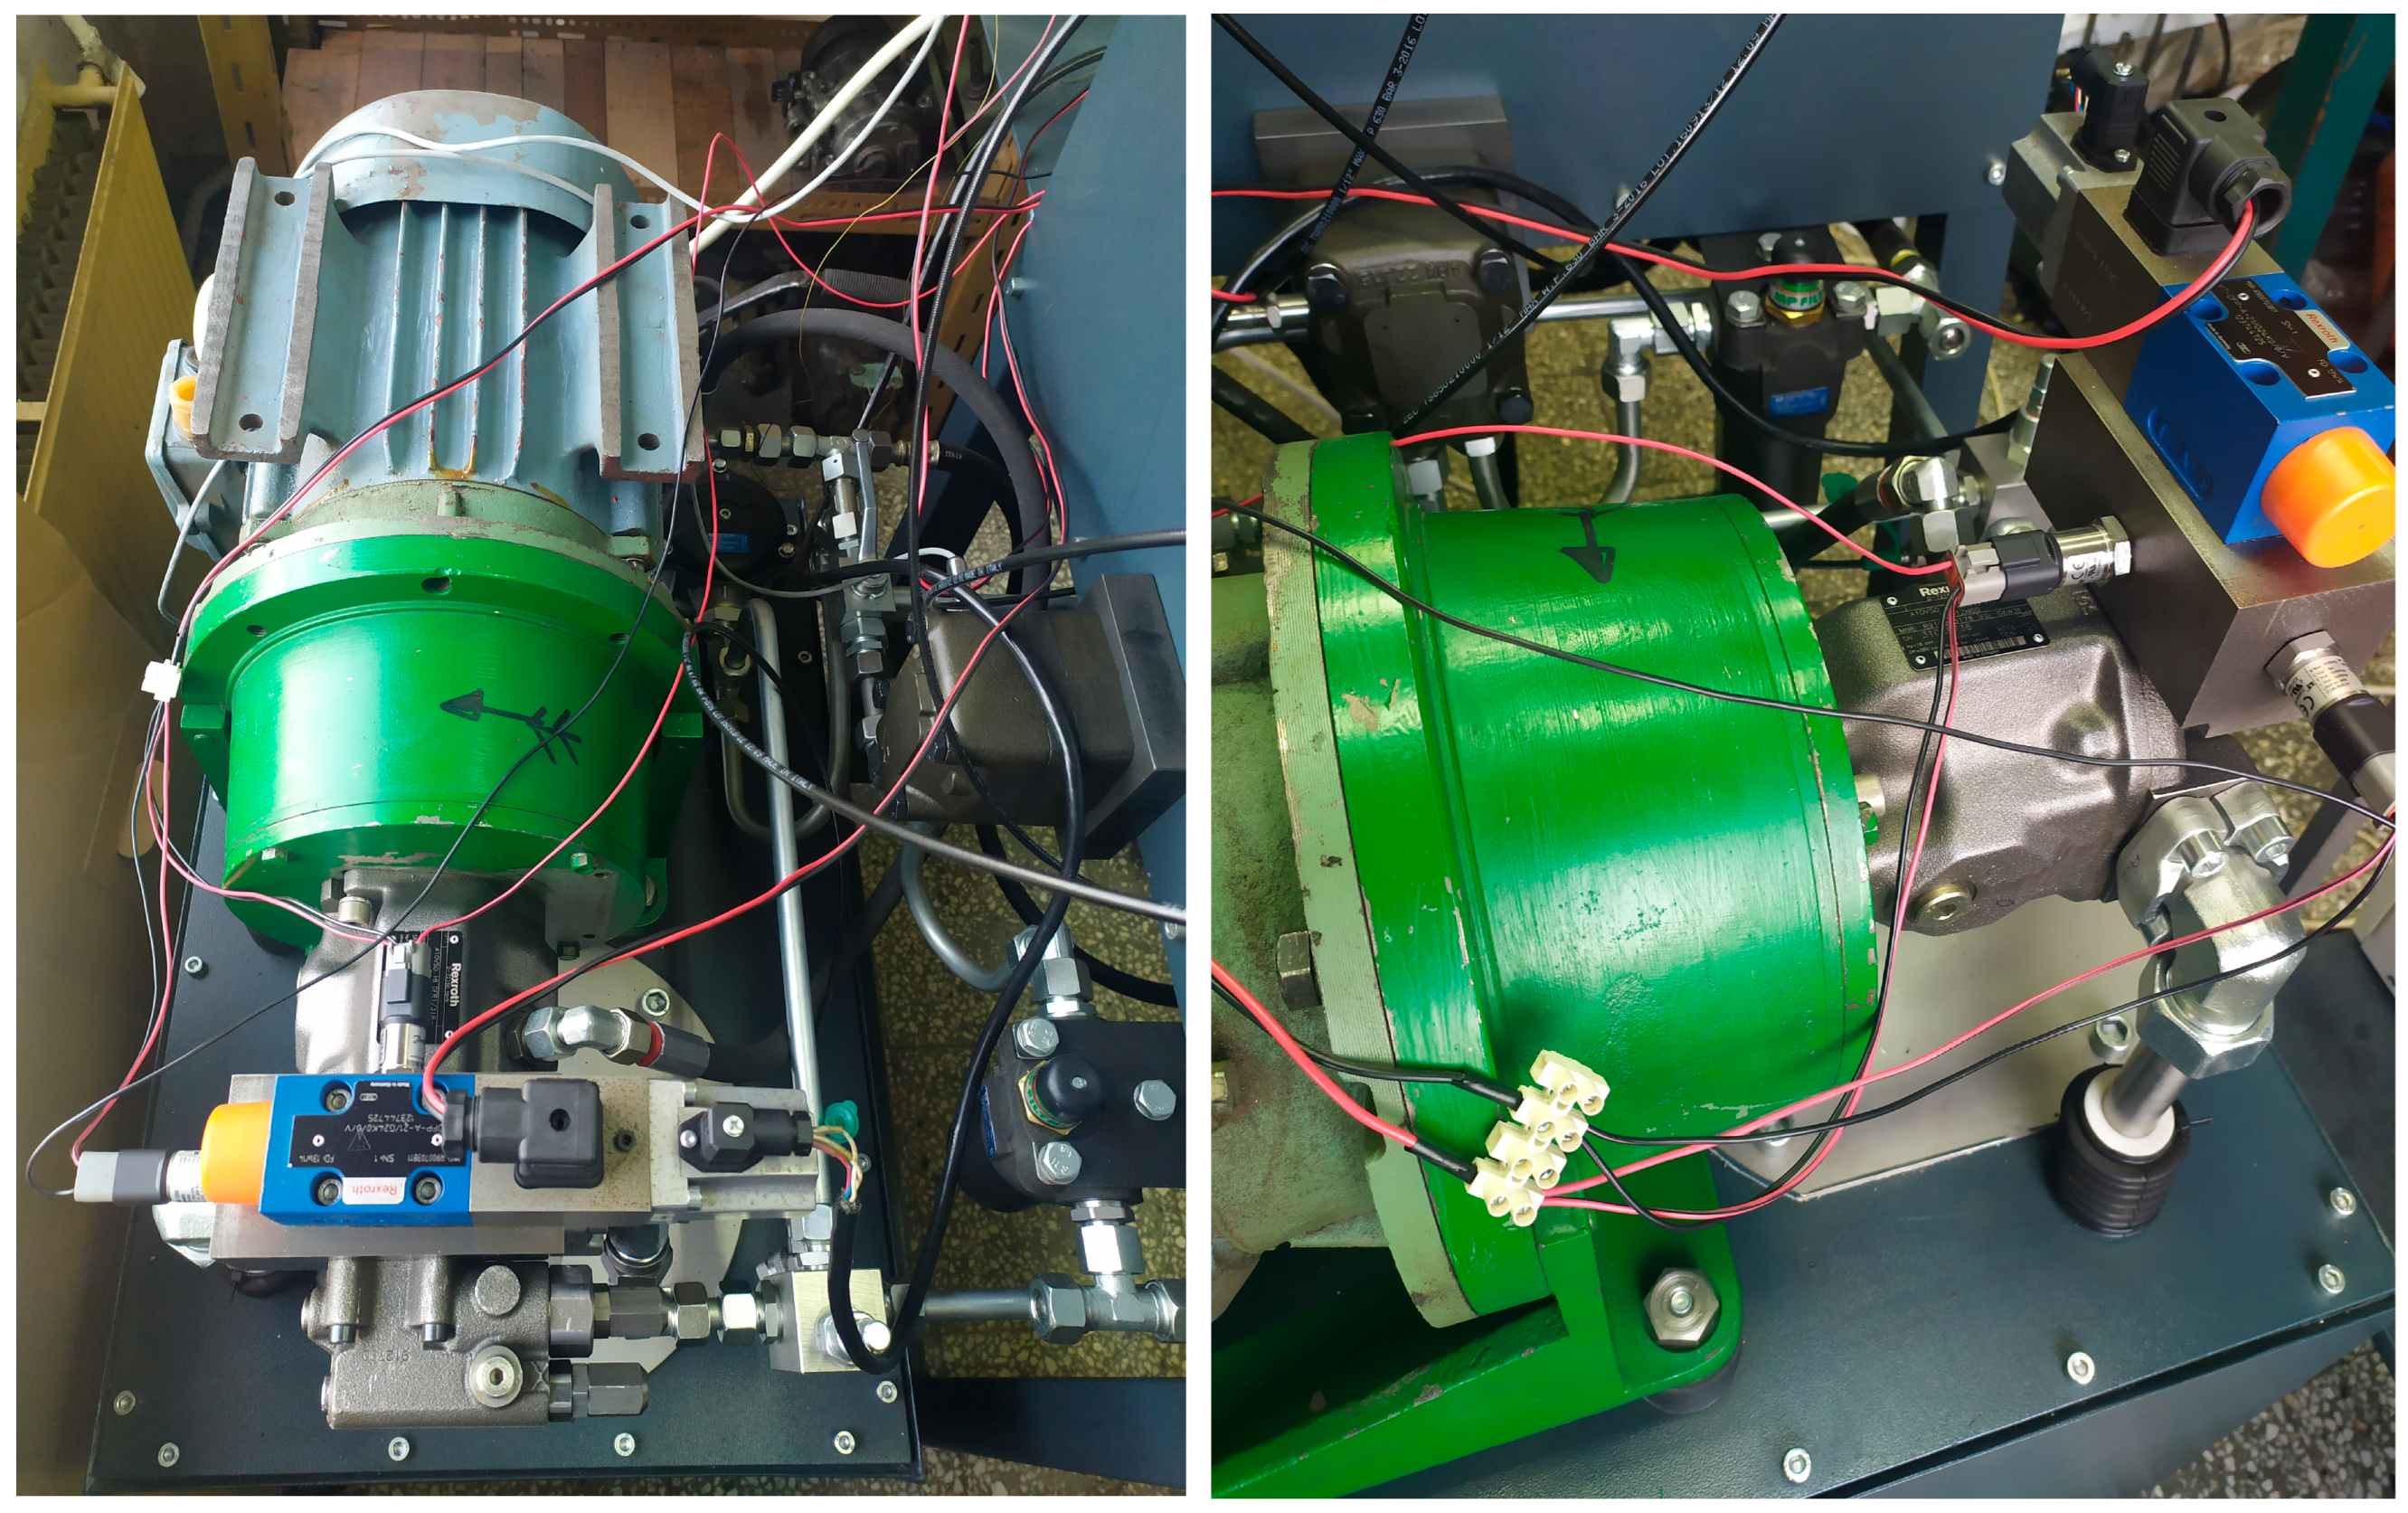
Real-time communication between the host PC and the MC012-022 is facilitated through a high-speed 1 MBs CAN interface and Kvaser® USB-CAN bridge, ensuring minimal latency in the control loop. The communication protocol is customized for the pump setup, including the exchange of sensor/actuator signals, metadata, and checksum. This setup enables us to rapidly iterate on control algorithms in Simulink® while maintaining a direct connection to the physical system, effectively creating a hardware-in-the-loop (HIL) testing environment. It allows for sophisticated control strategies to be developed and tested quickly, with the MC012-022 handling the critical task of interfacing with real-world sensors and actuators. The laboratory test setup is depicted in Figure 22.
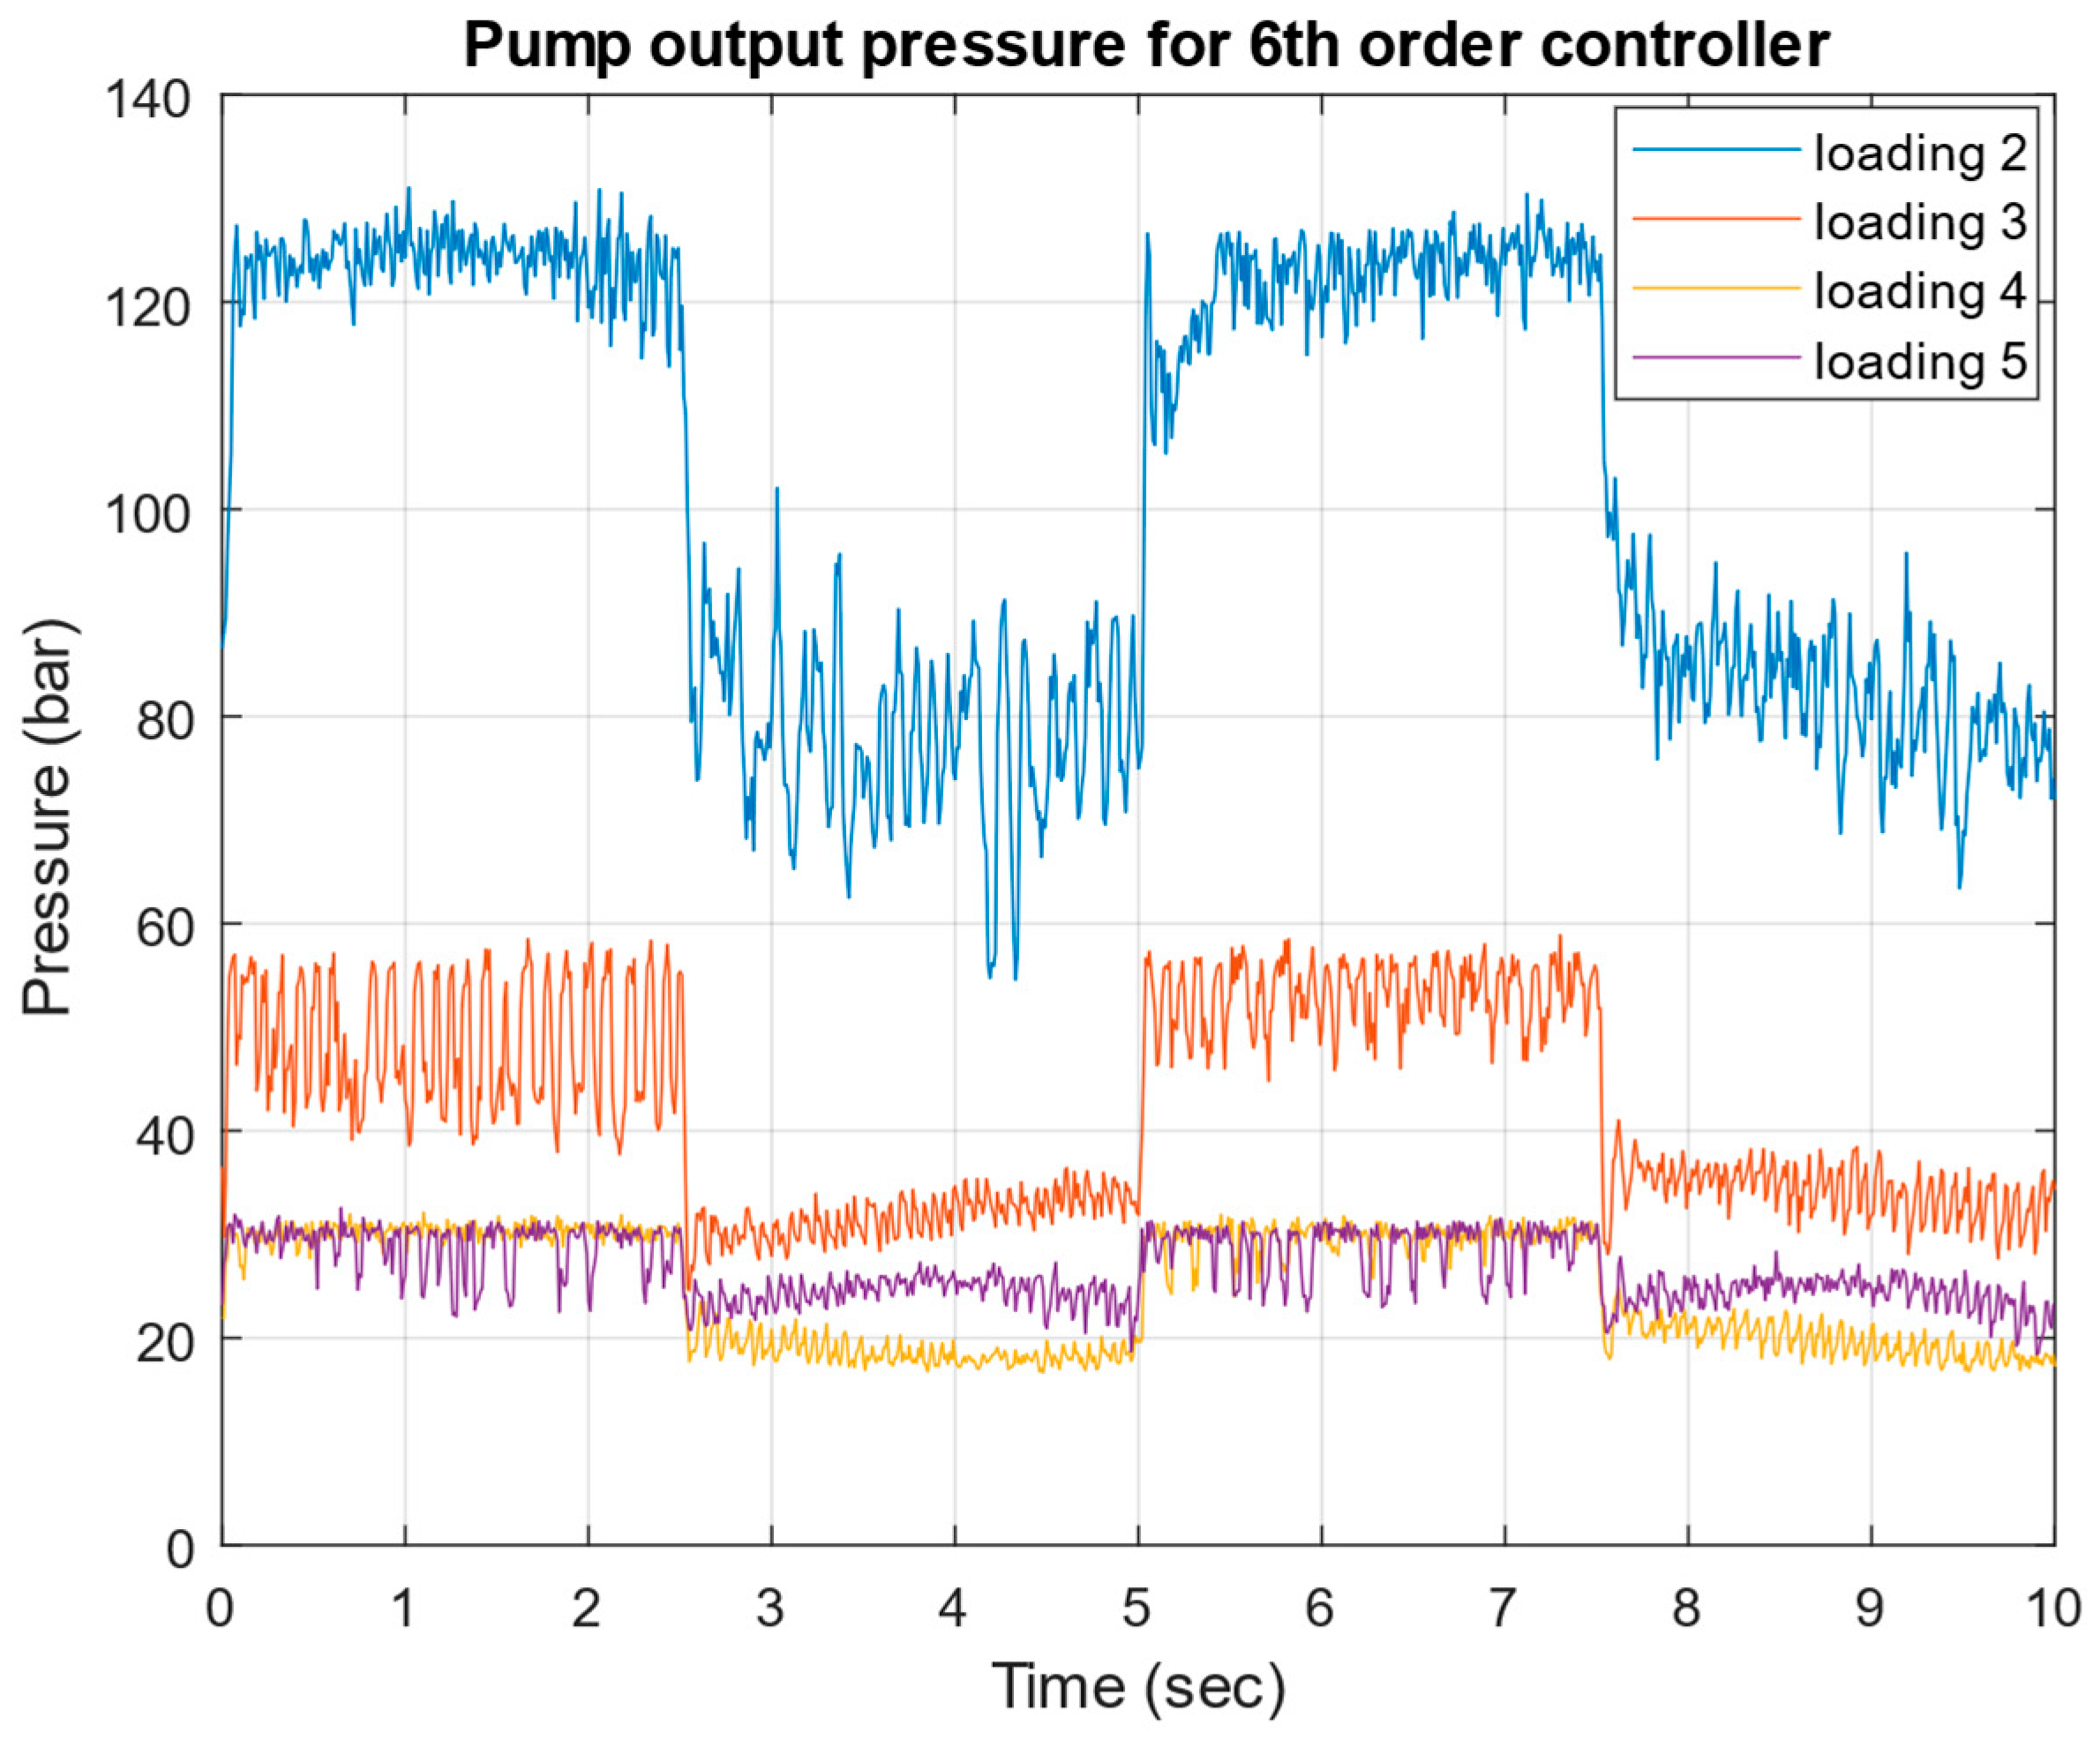
The experimental study of the system involves applying varying pressure disturbances to test its response. These disturbances are created by manually adjusting a throttle check valve, which restricts the pump outlet flow rate. The throttle valve is equipped with a precise scale calibrated in millimeters, allowing for accurate control of the throttling area in the valve. Four distinct loading steps are established, corresponding to throttle valve positions of 2, 3, 4, and 5 mm on the scale. Each of these positions results in a specific level of throttling area and, consequently, a different pressure load on the pump discharge port.
This approach enables a systematic evaluation of the system’s performance under different pressure conditions, providing valuable insights into its behavior and robustness across a range of operational scenarios.
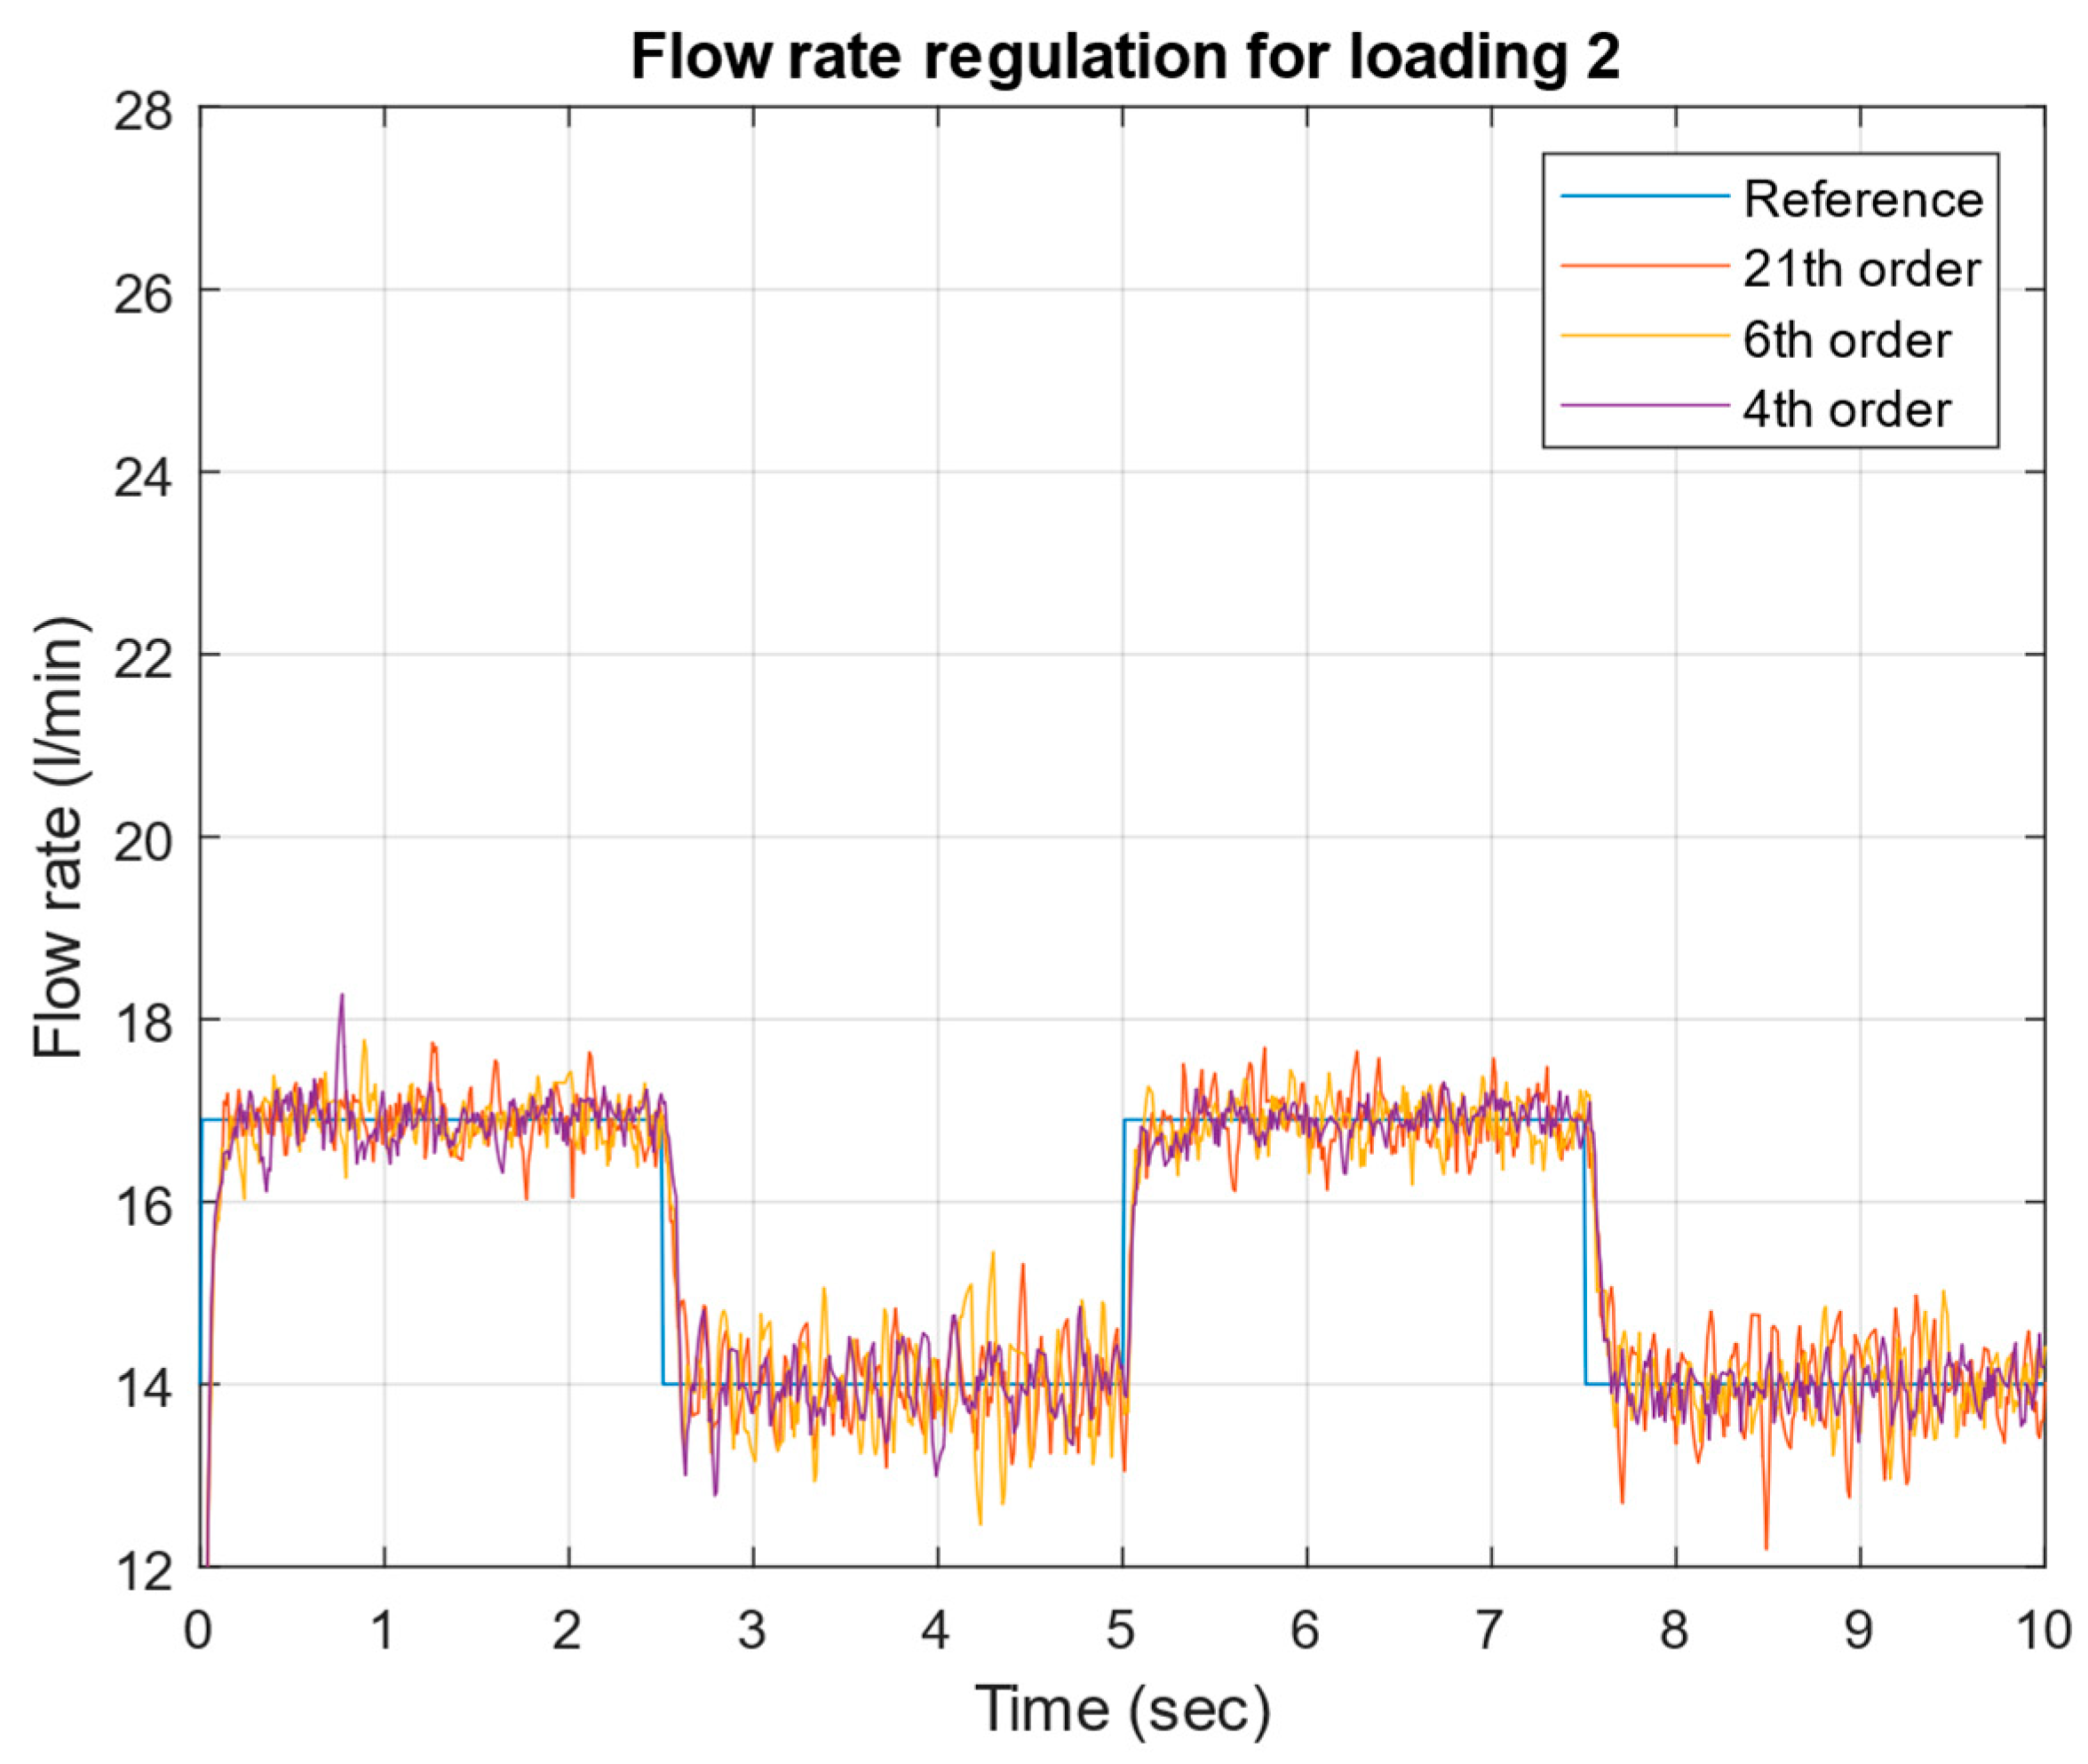
Figure 23 shows the flow rate regulation system’s response under the highest output loading conditions (loading 2), comparing different controller orders (21st, 6th, and 4th) against a reference signal. The system exhibits good tracking performance with step changes between approximately 17 L/min and 14 L/min. The settling time is approximately 0.2–0.3 s for all step changes, with minimal overshoot. All three controller orders demonstrate similar performance, suggesting a successful order reduction from the 21st to 4th order without significant performance degradation. The steady-state error is negligible, staying within ±0.5 L/min of the reference value. There is some noise in the measured flow rate, particularly visible in the sixth and fourth order responses, but it remains within acceptable bounds of approximately ±0.5 L/min peak-to-peak. The control system maintains stable operation, effectively handling both step-up and step-down flow rate transitions.
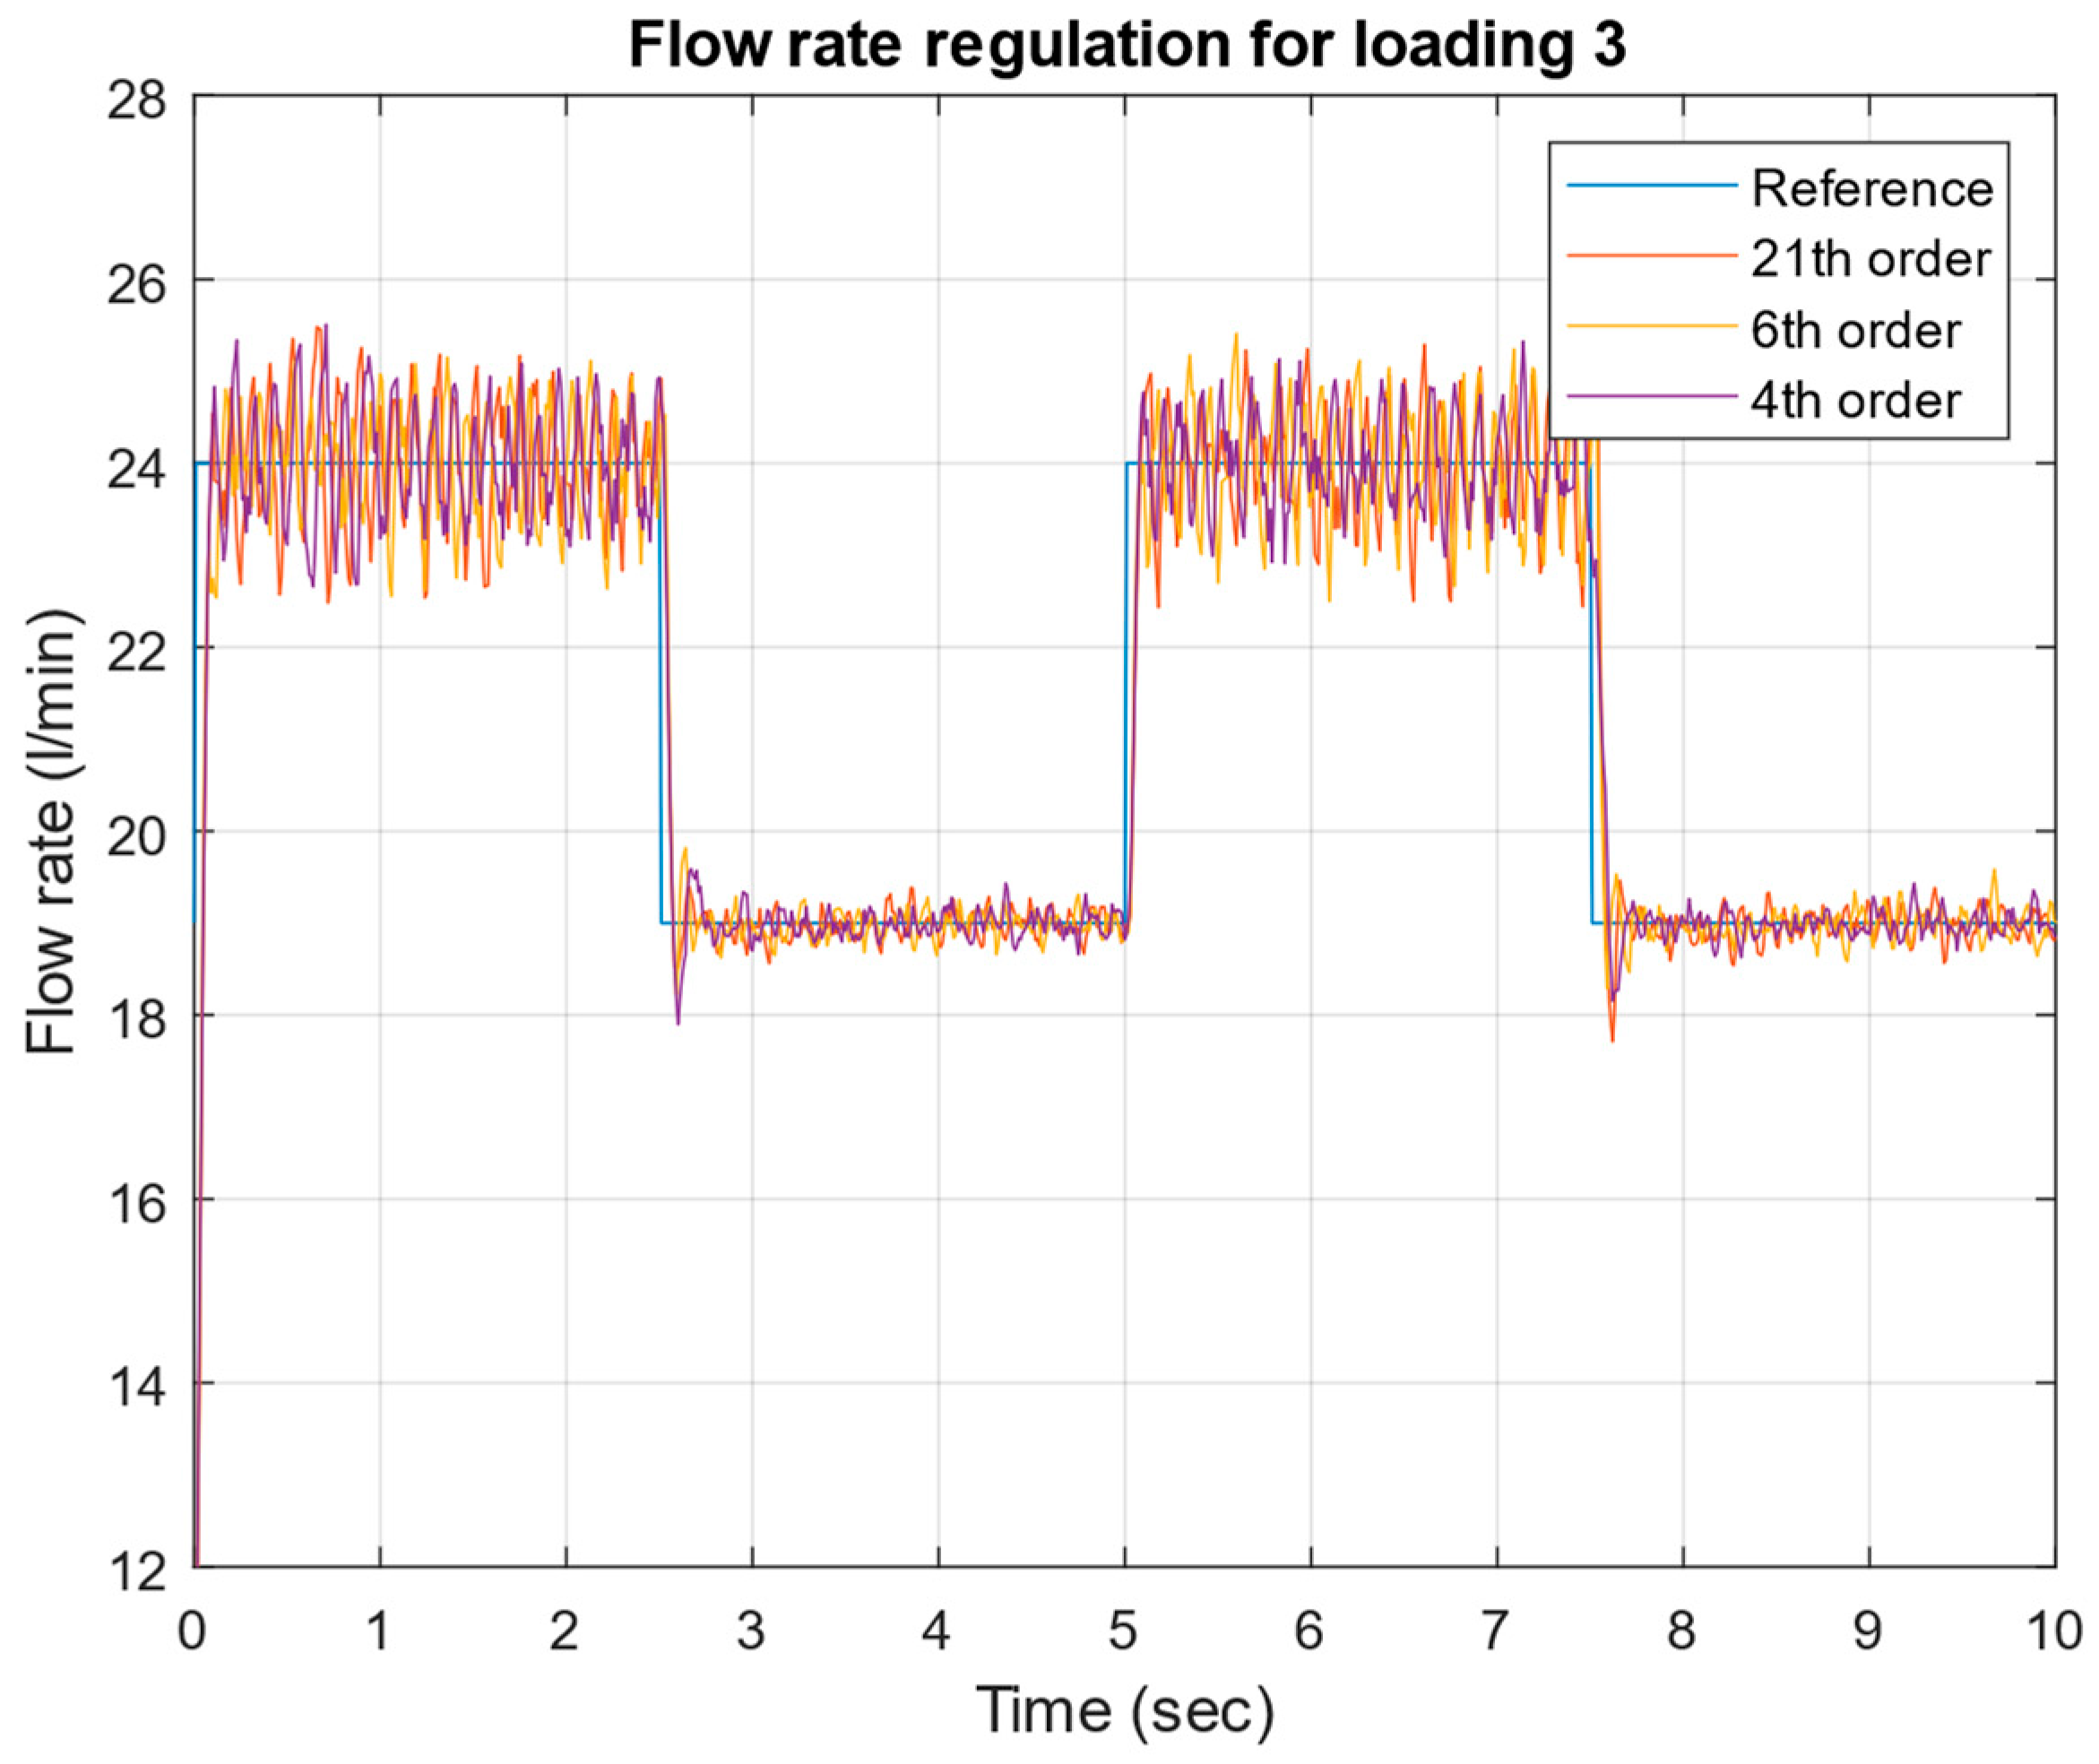
The flow rate regulation plot (Figure 24) for loading condition 3 demonstrates the system’s response at higher flow rates (between 19 and 24 L/min) compared to loading 2 (14–17 L/min), indicating lower resistance at the pump output. The settling time remains similar at approximately 0.2–0.3 s for all step changes, but there is noticeably more measurement noise in loading 3, with peak-to-peak variations of ±1 L/min compared to ±0.5 L/min in loading 2. All three controller orders (21st, 6th, and 4th) continue to demonstrate comparable performance, though the reduced-order controllers show slightly more oscillatory behavior in the steady-state regions. The larger flow rate variations in loading 3 suggest that the system becomes more sensitive to disturbances under lighter load conditions, though it maintains overall stability and acceptable tracking performance.
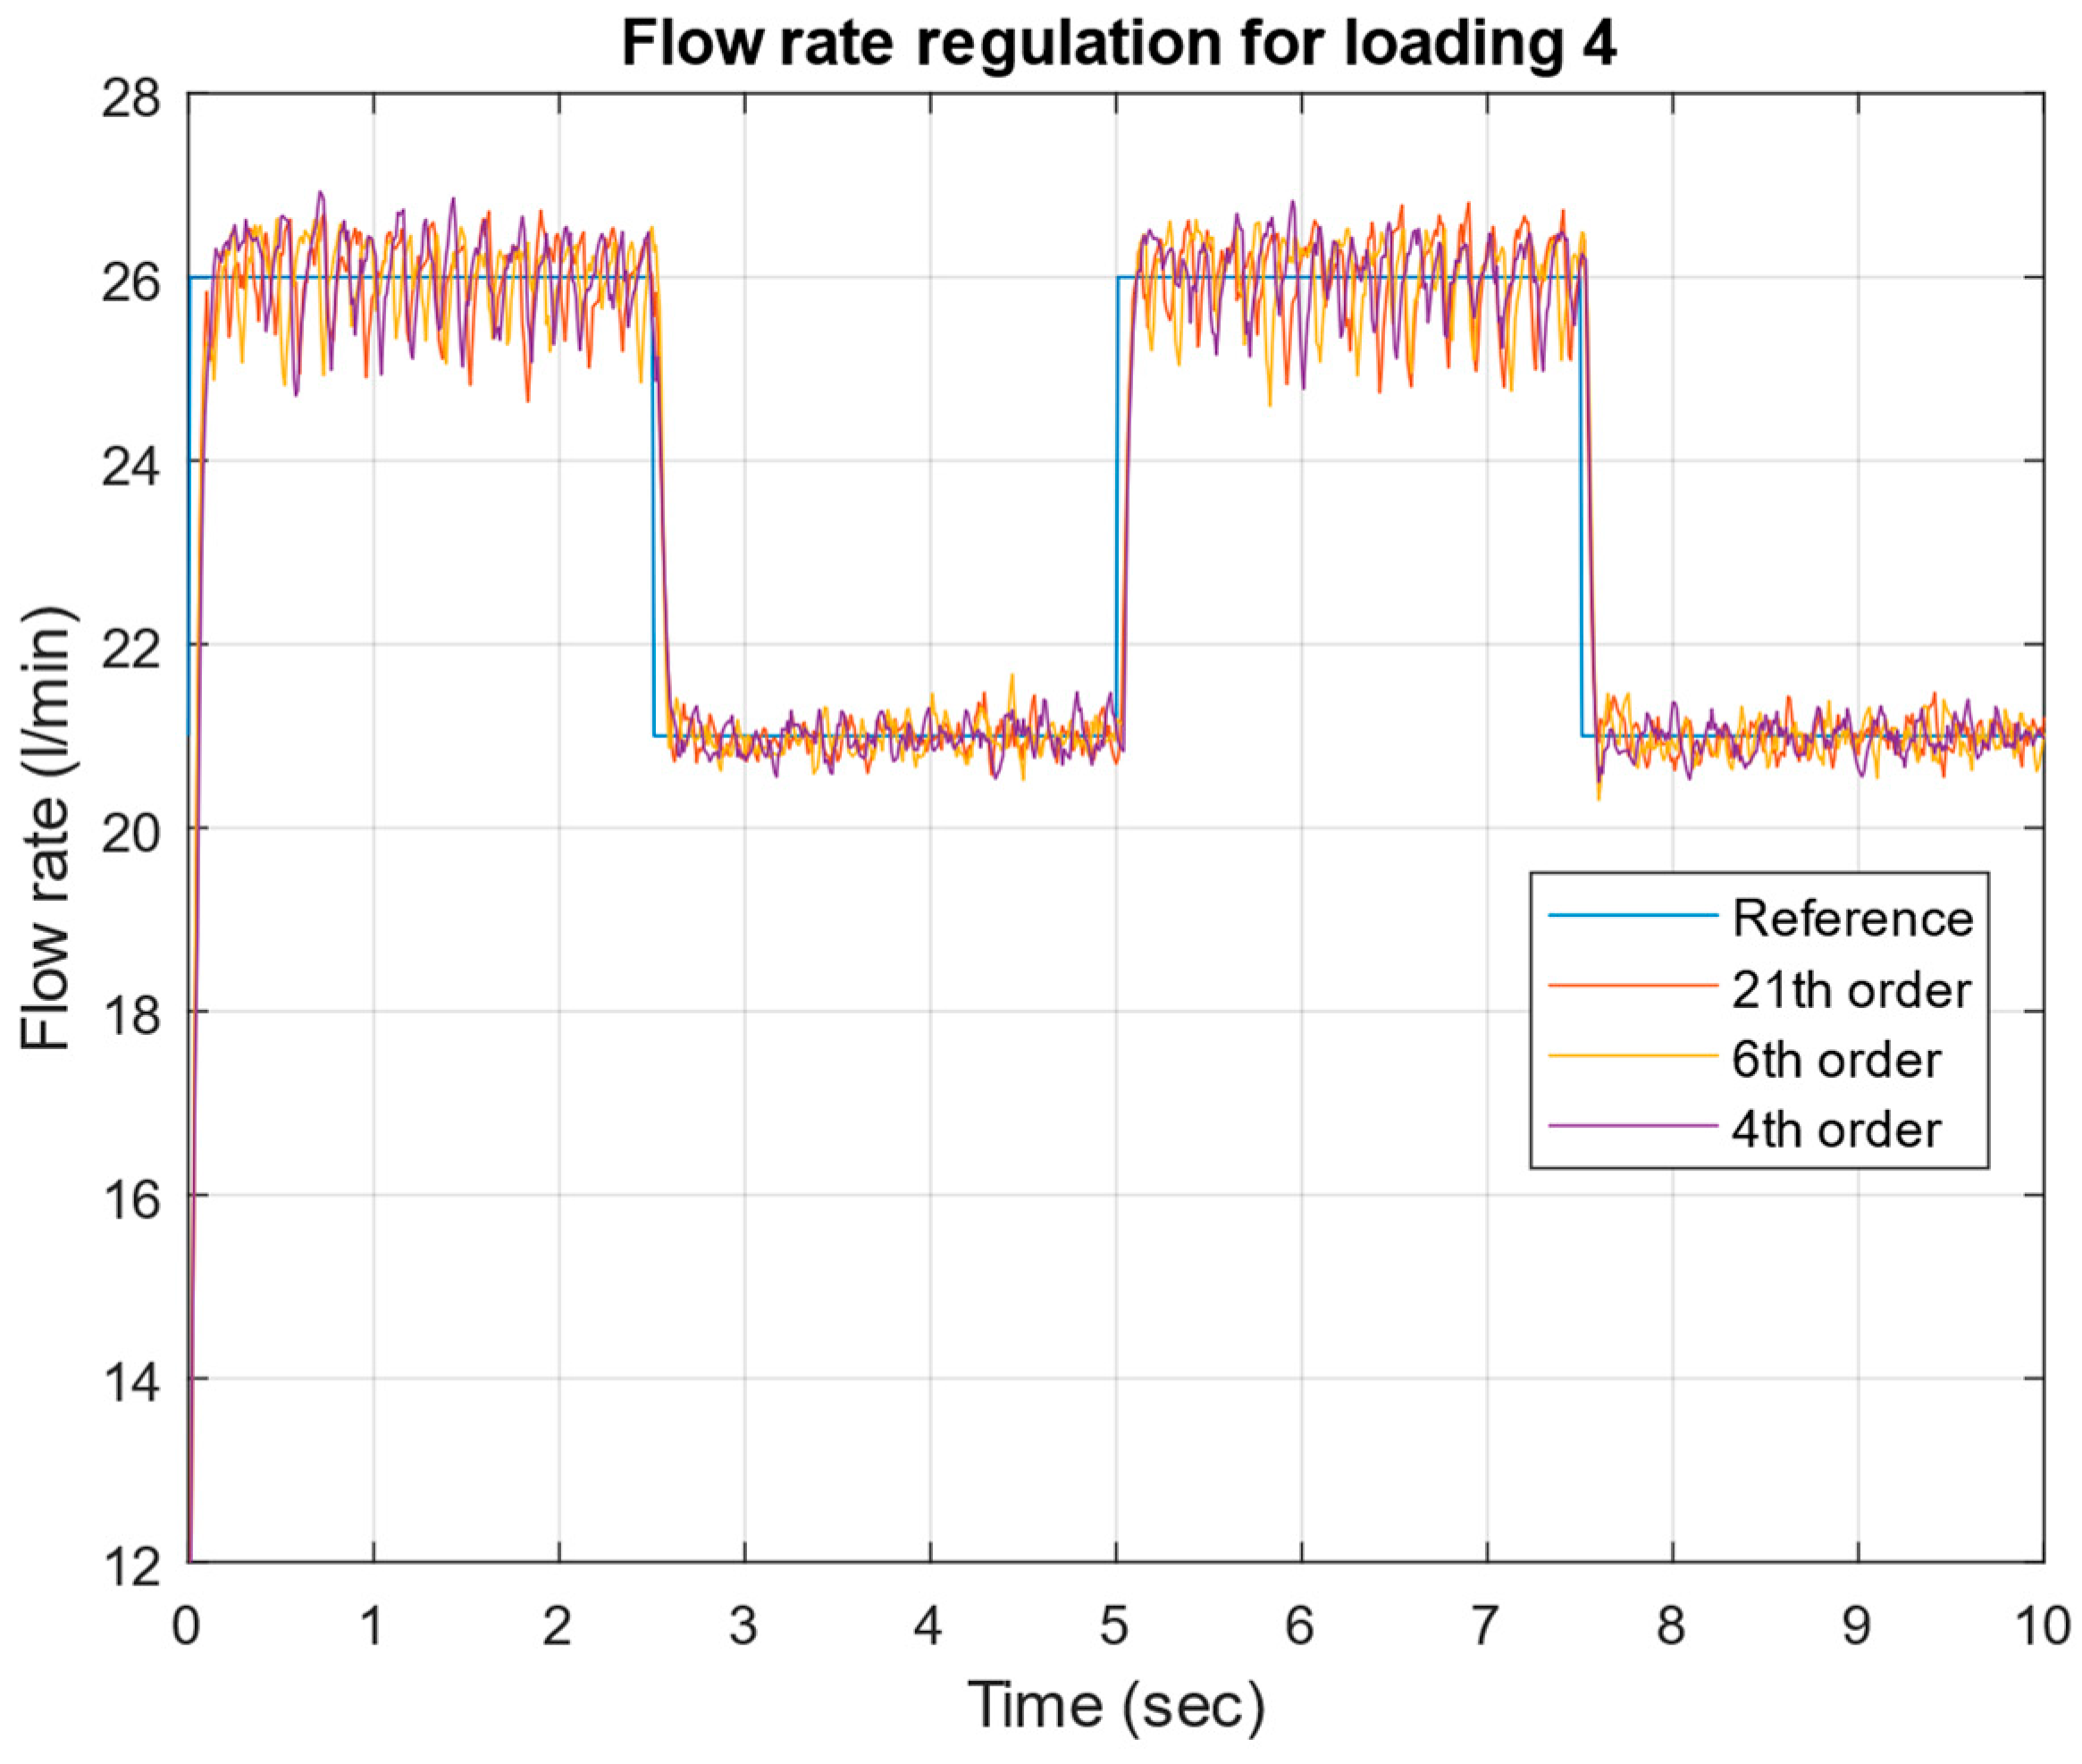
The flow rate regulation plot (Figure 25) for loading condition 4 shows operation at even higher flow rates (between 21 and 26 L/min) compared to loading 3 (19–24 L/min) and loading 2 (14–17 L/min), confirming progressively decreasing resistance at the pump output. The settling time remains consistent at approximately 0.2–0.3 s across all step changes, similar to previous loading conditions. However, loading 4 exhibits the most pronounced measurement noise among all cases, with peak-to-peak variations reaching ±1.5 L/min, compared to ±1 L/min in loading 3 and ±0.5 L/min in loading 2. All three controller orders (21st, 6th, and 4th) maintain similar tracking performance, though the reduced-order controllers show increased oscillatory behavior during the steady-state operation. This progressive increase in flow variations and oscillations from loading 2 through 4 demonstrates that the system becomes increasingly sensitive to disturbances as the output resistance decreases, though it still maintains fundamental stability and acceptable tracking capabilities throughout the test period.
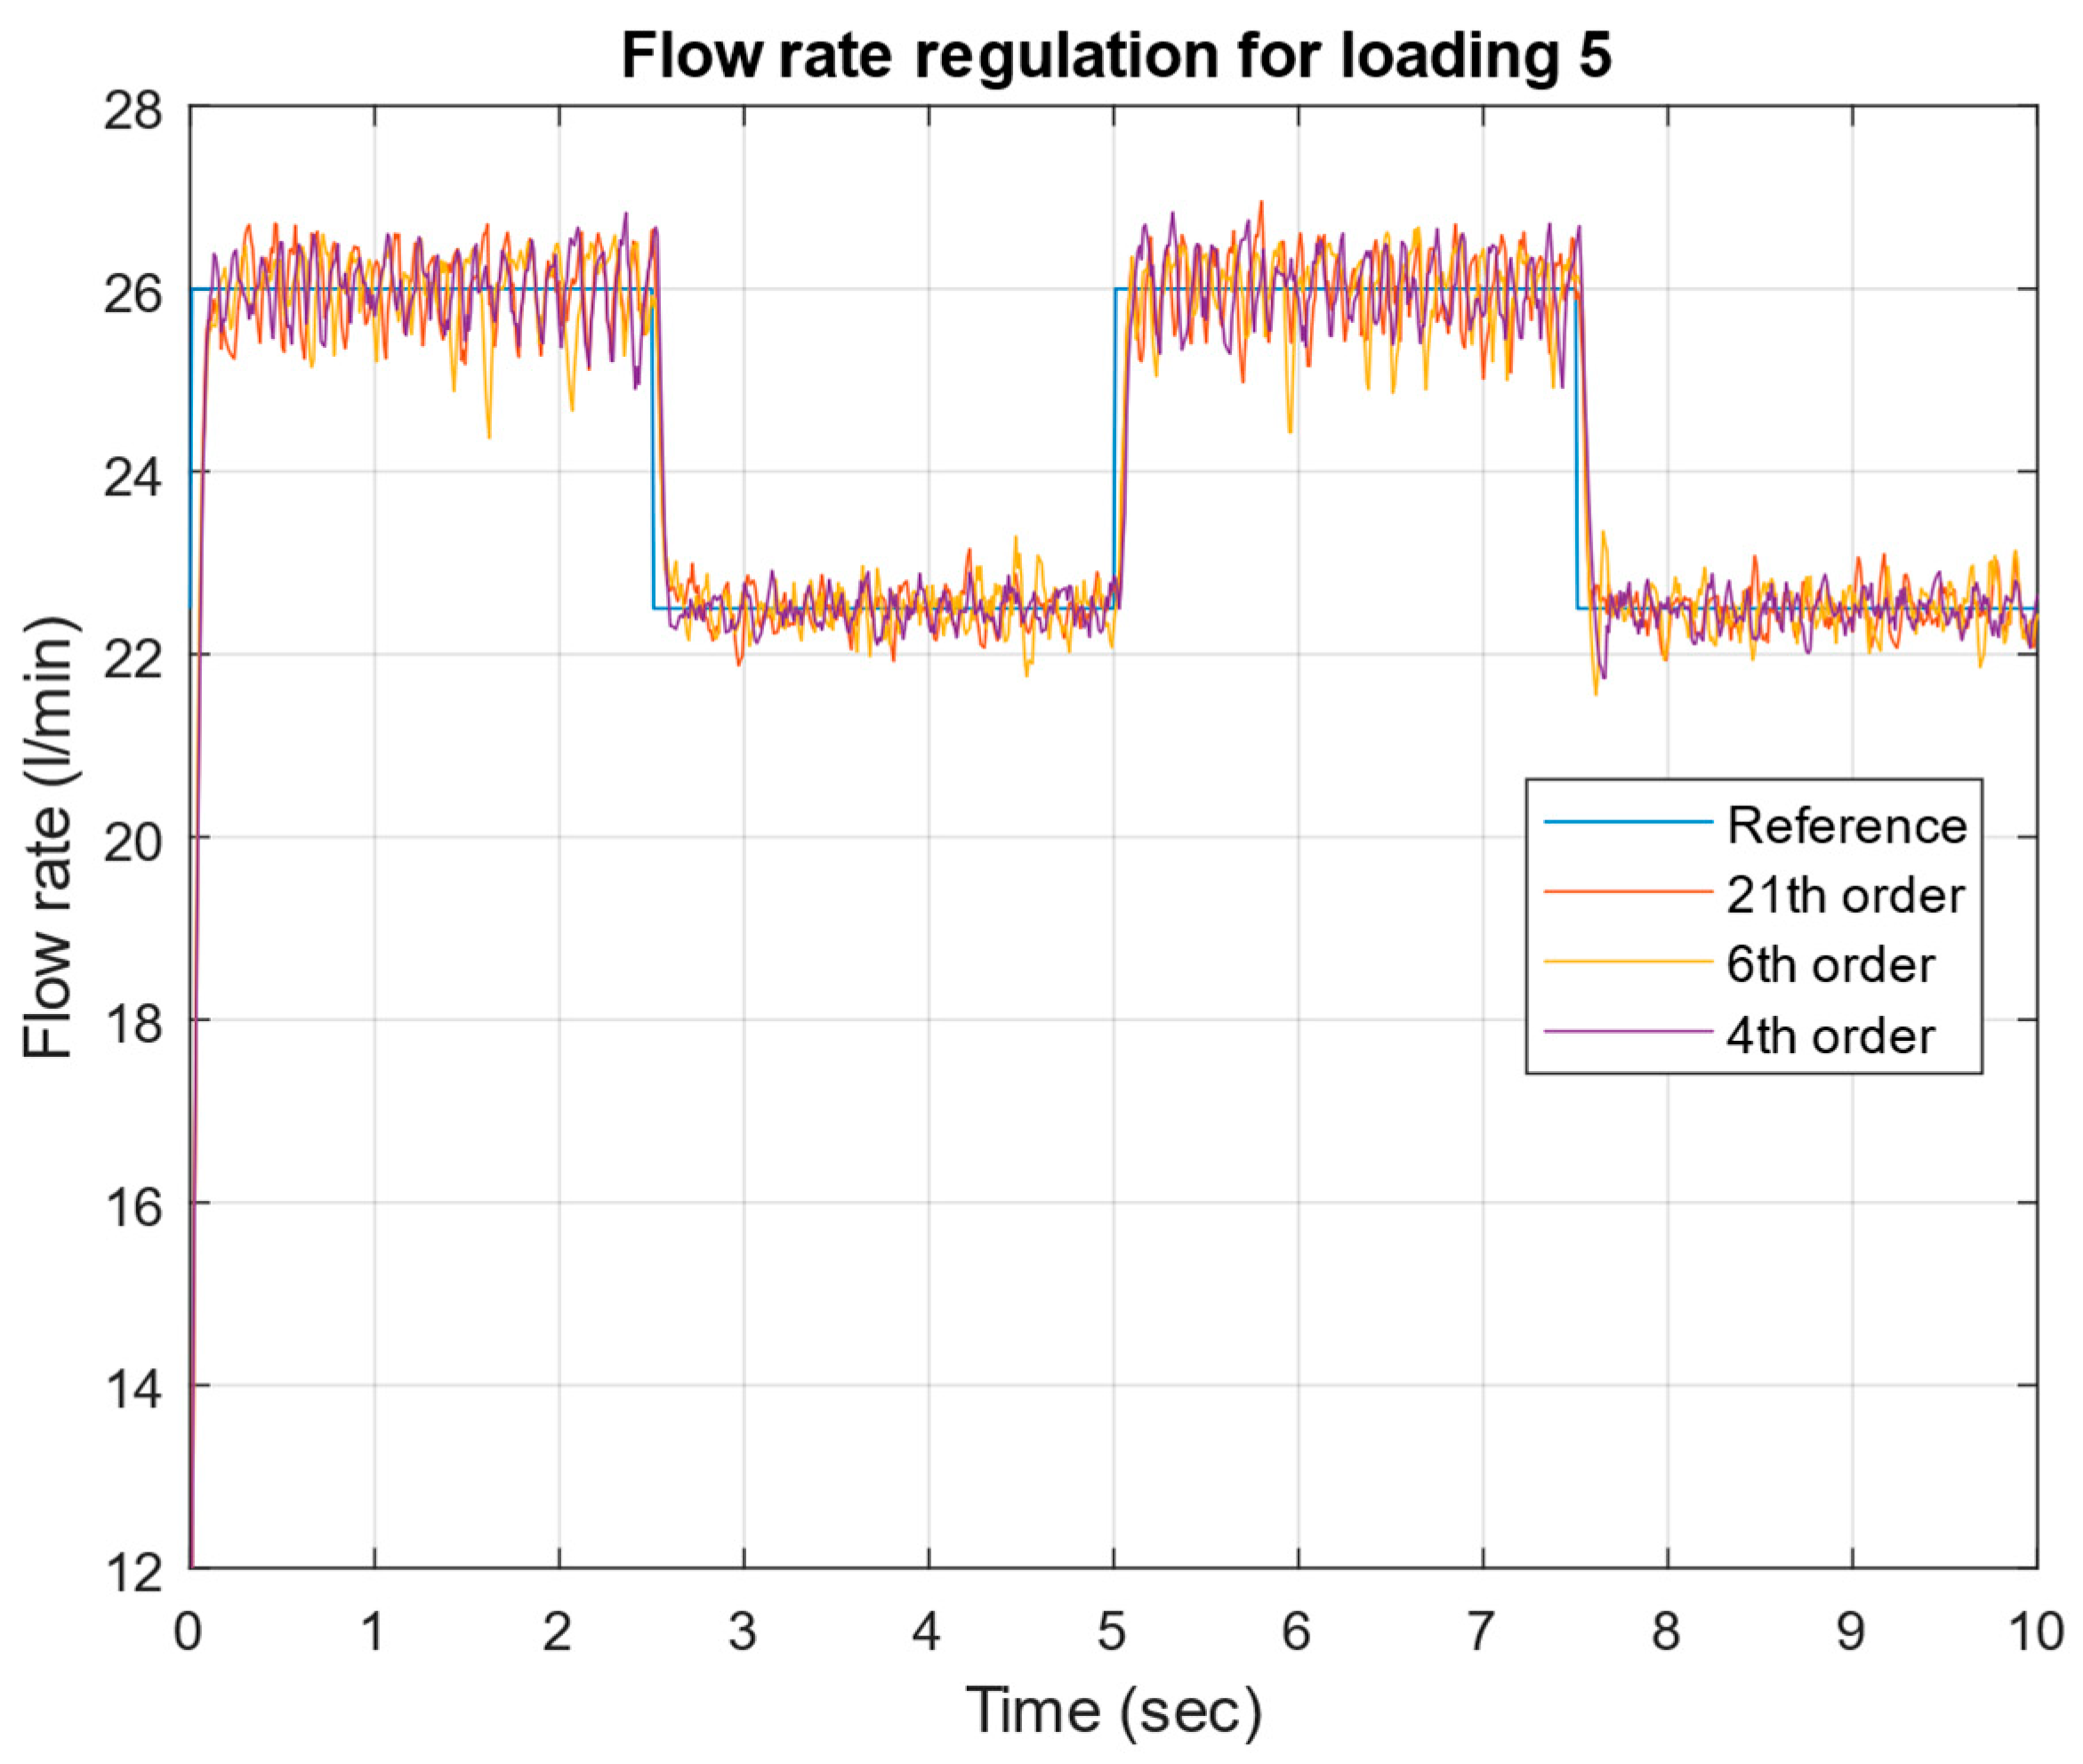
The flow rate regulation plot (Figure 26) for loading condition 5 operates at similar flow rates (22–26 L/min) to loading 4 but shows slightly improved stability despite having the least resistance at the pump output. The settling time remains consistent at approximately 0.2–0.3 s for all step changes, maintaining the performance seen in previous loading conditions. Interestingly, the measurement noise in loading 5 appears slightly reduced compared to loading 4, with peak-to-peak variations of approximately ±1.2 L/min, which breaks the trend of increasing noise seen from loading 2 through 4. All three controller orders (21st, 6th, and 4th) continue to demonstrate similar tracking performance, with the reduced-order controllers showing marginally less oscillatory behavior compared to loading 4, particularly in the higher flow rate regions. This unexpected improvement in stability under loading 5 suggests that the system might have reached a more favorable operating point despite having the lowest output resistance, though the overall performance characteristics remain within similar bounds to loading 4.
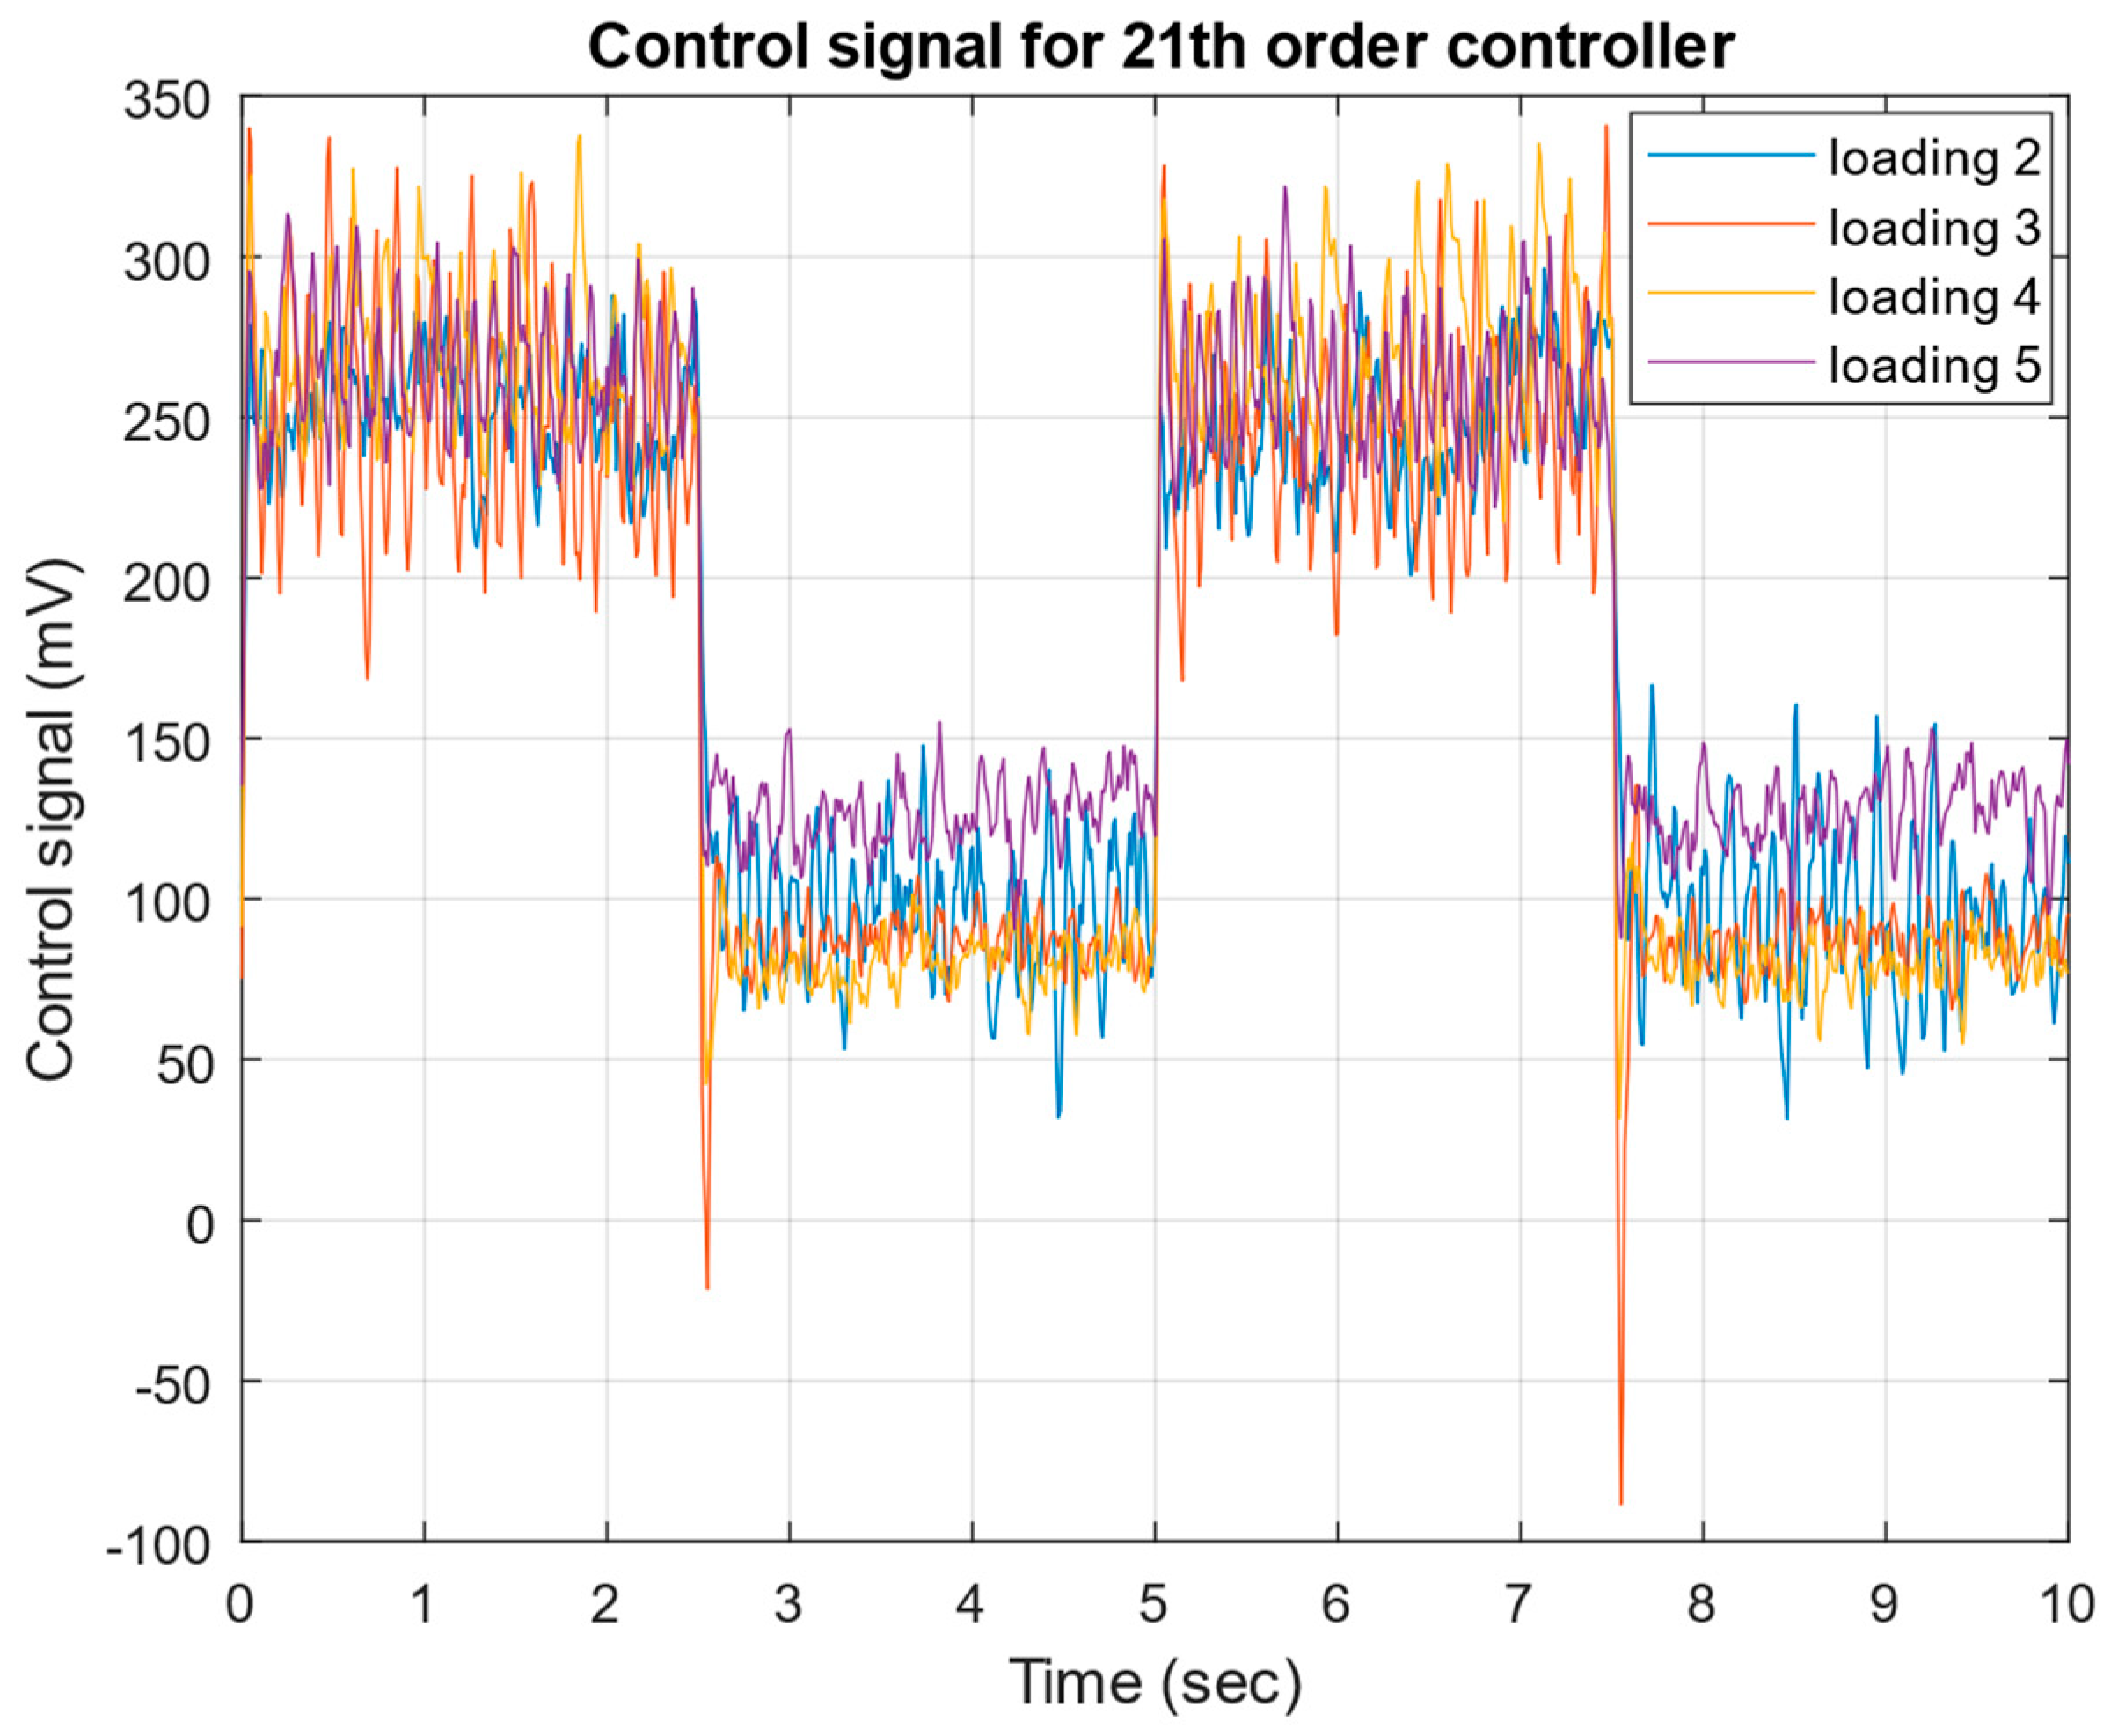
The control signal plot (Figure 27) for the 21st-order controller reveals the variations across different loading conditions, with voltage levels ranging from approximately 50 mV to 350 mV. During high-flow-rate periods, the control signal exhibits considerable noise, with peak-to-peak variations of about 150 mV, centered around 250–300 mV for all loading conditions. The signal shows sharp transients at flow rate transition points, including brief spikes reaching negative values. During lower-flow-rate periods, the control signal settles to a lower voltage range of approximately 80–150 mV with a reduced noise amplitude.
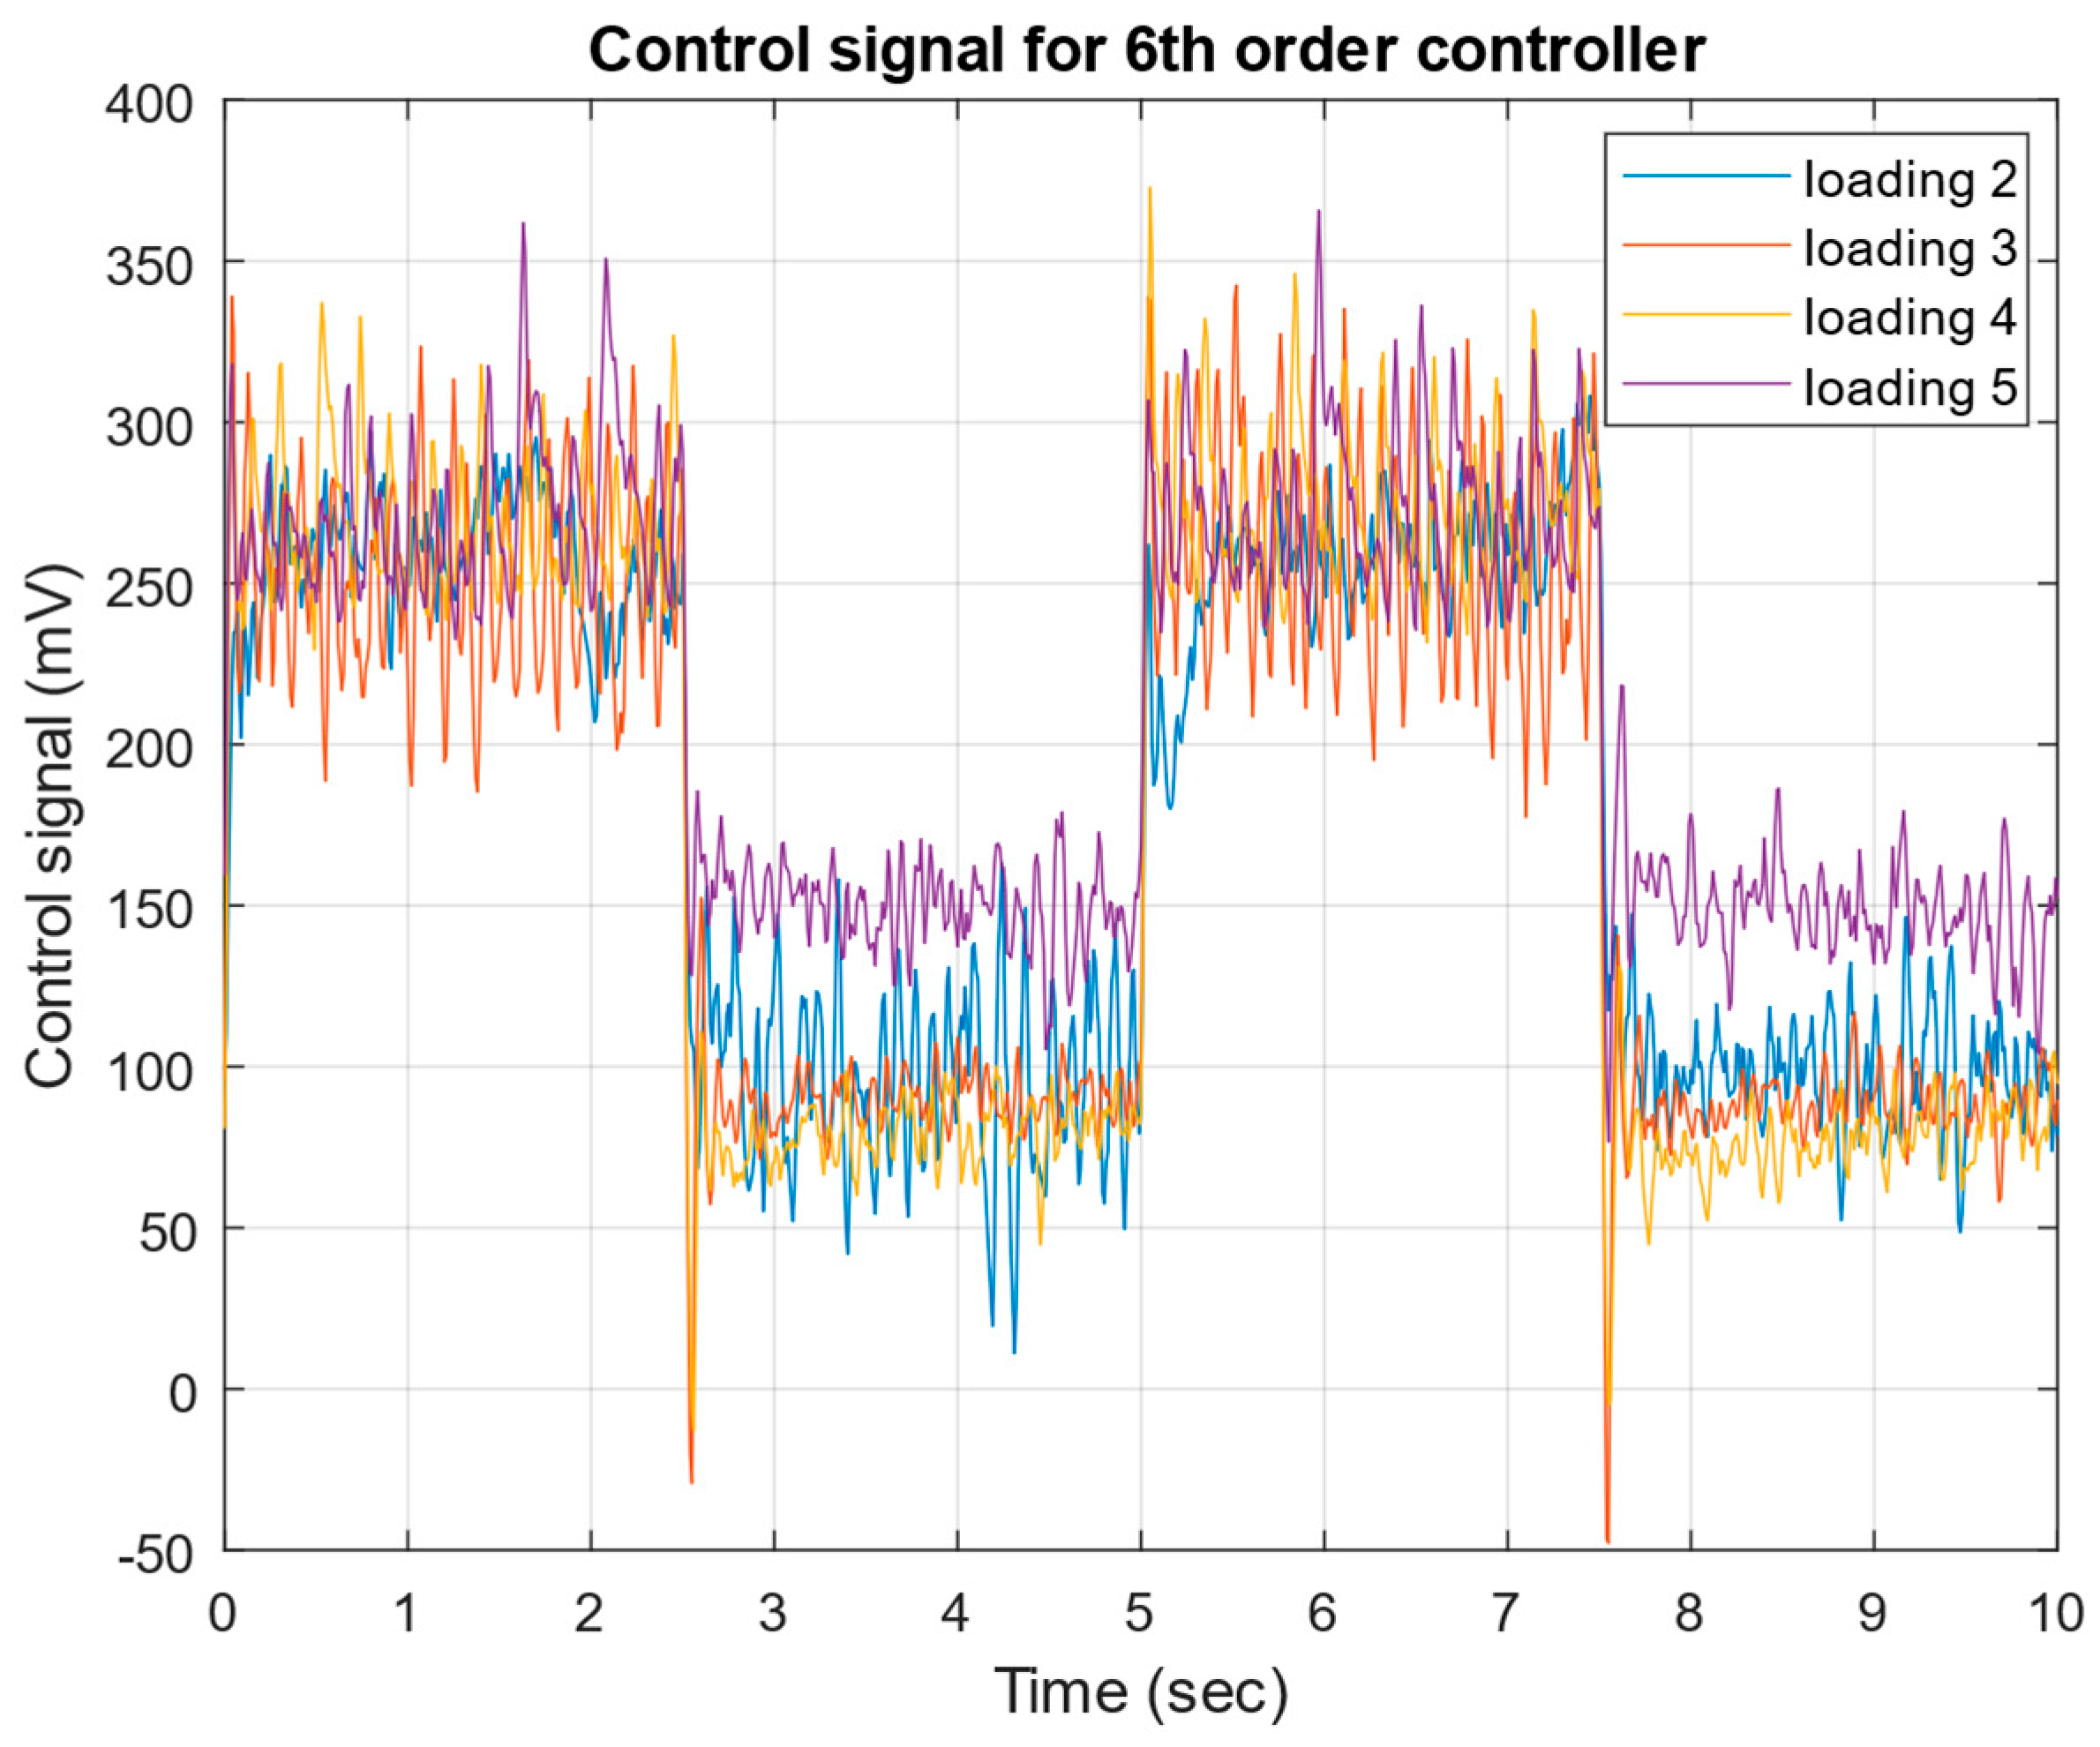
The control signal plot (Figure 28) for the 6th-order controller demonstrates similar overall behavior to the 21st-order controller but with notably higher peak-to-peak variations and more aggressive control actions. Both controllers operate in voltage ranges of approximately 50–350 mV, but the 6th-order controller exhibits more pronounced noise, particularly during high-flow-rate periods where variations reach up to 175 mV compared to the 21st order’s 150 mV. During lower-flow-rate periods, both controllers settle to similar voltage ranges (80–150 mV), but the sixth-order controller maintains higher noise amplitude throughout these periods. The loading conditions affect both controllers similarly, with loading 2 requiring the highest control effort and loadings 3–5 showing progressively lower average voltage levels. However, the sixth-order controller’s more aggressive behavior suggests that the order reduction has resulted in a slightly less smooth control action while maintaining comparable overall performance.
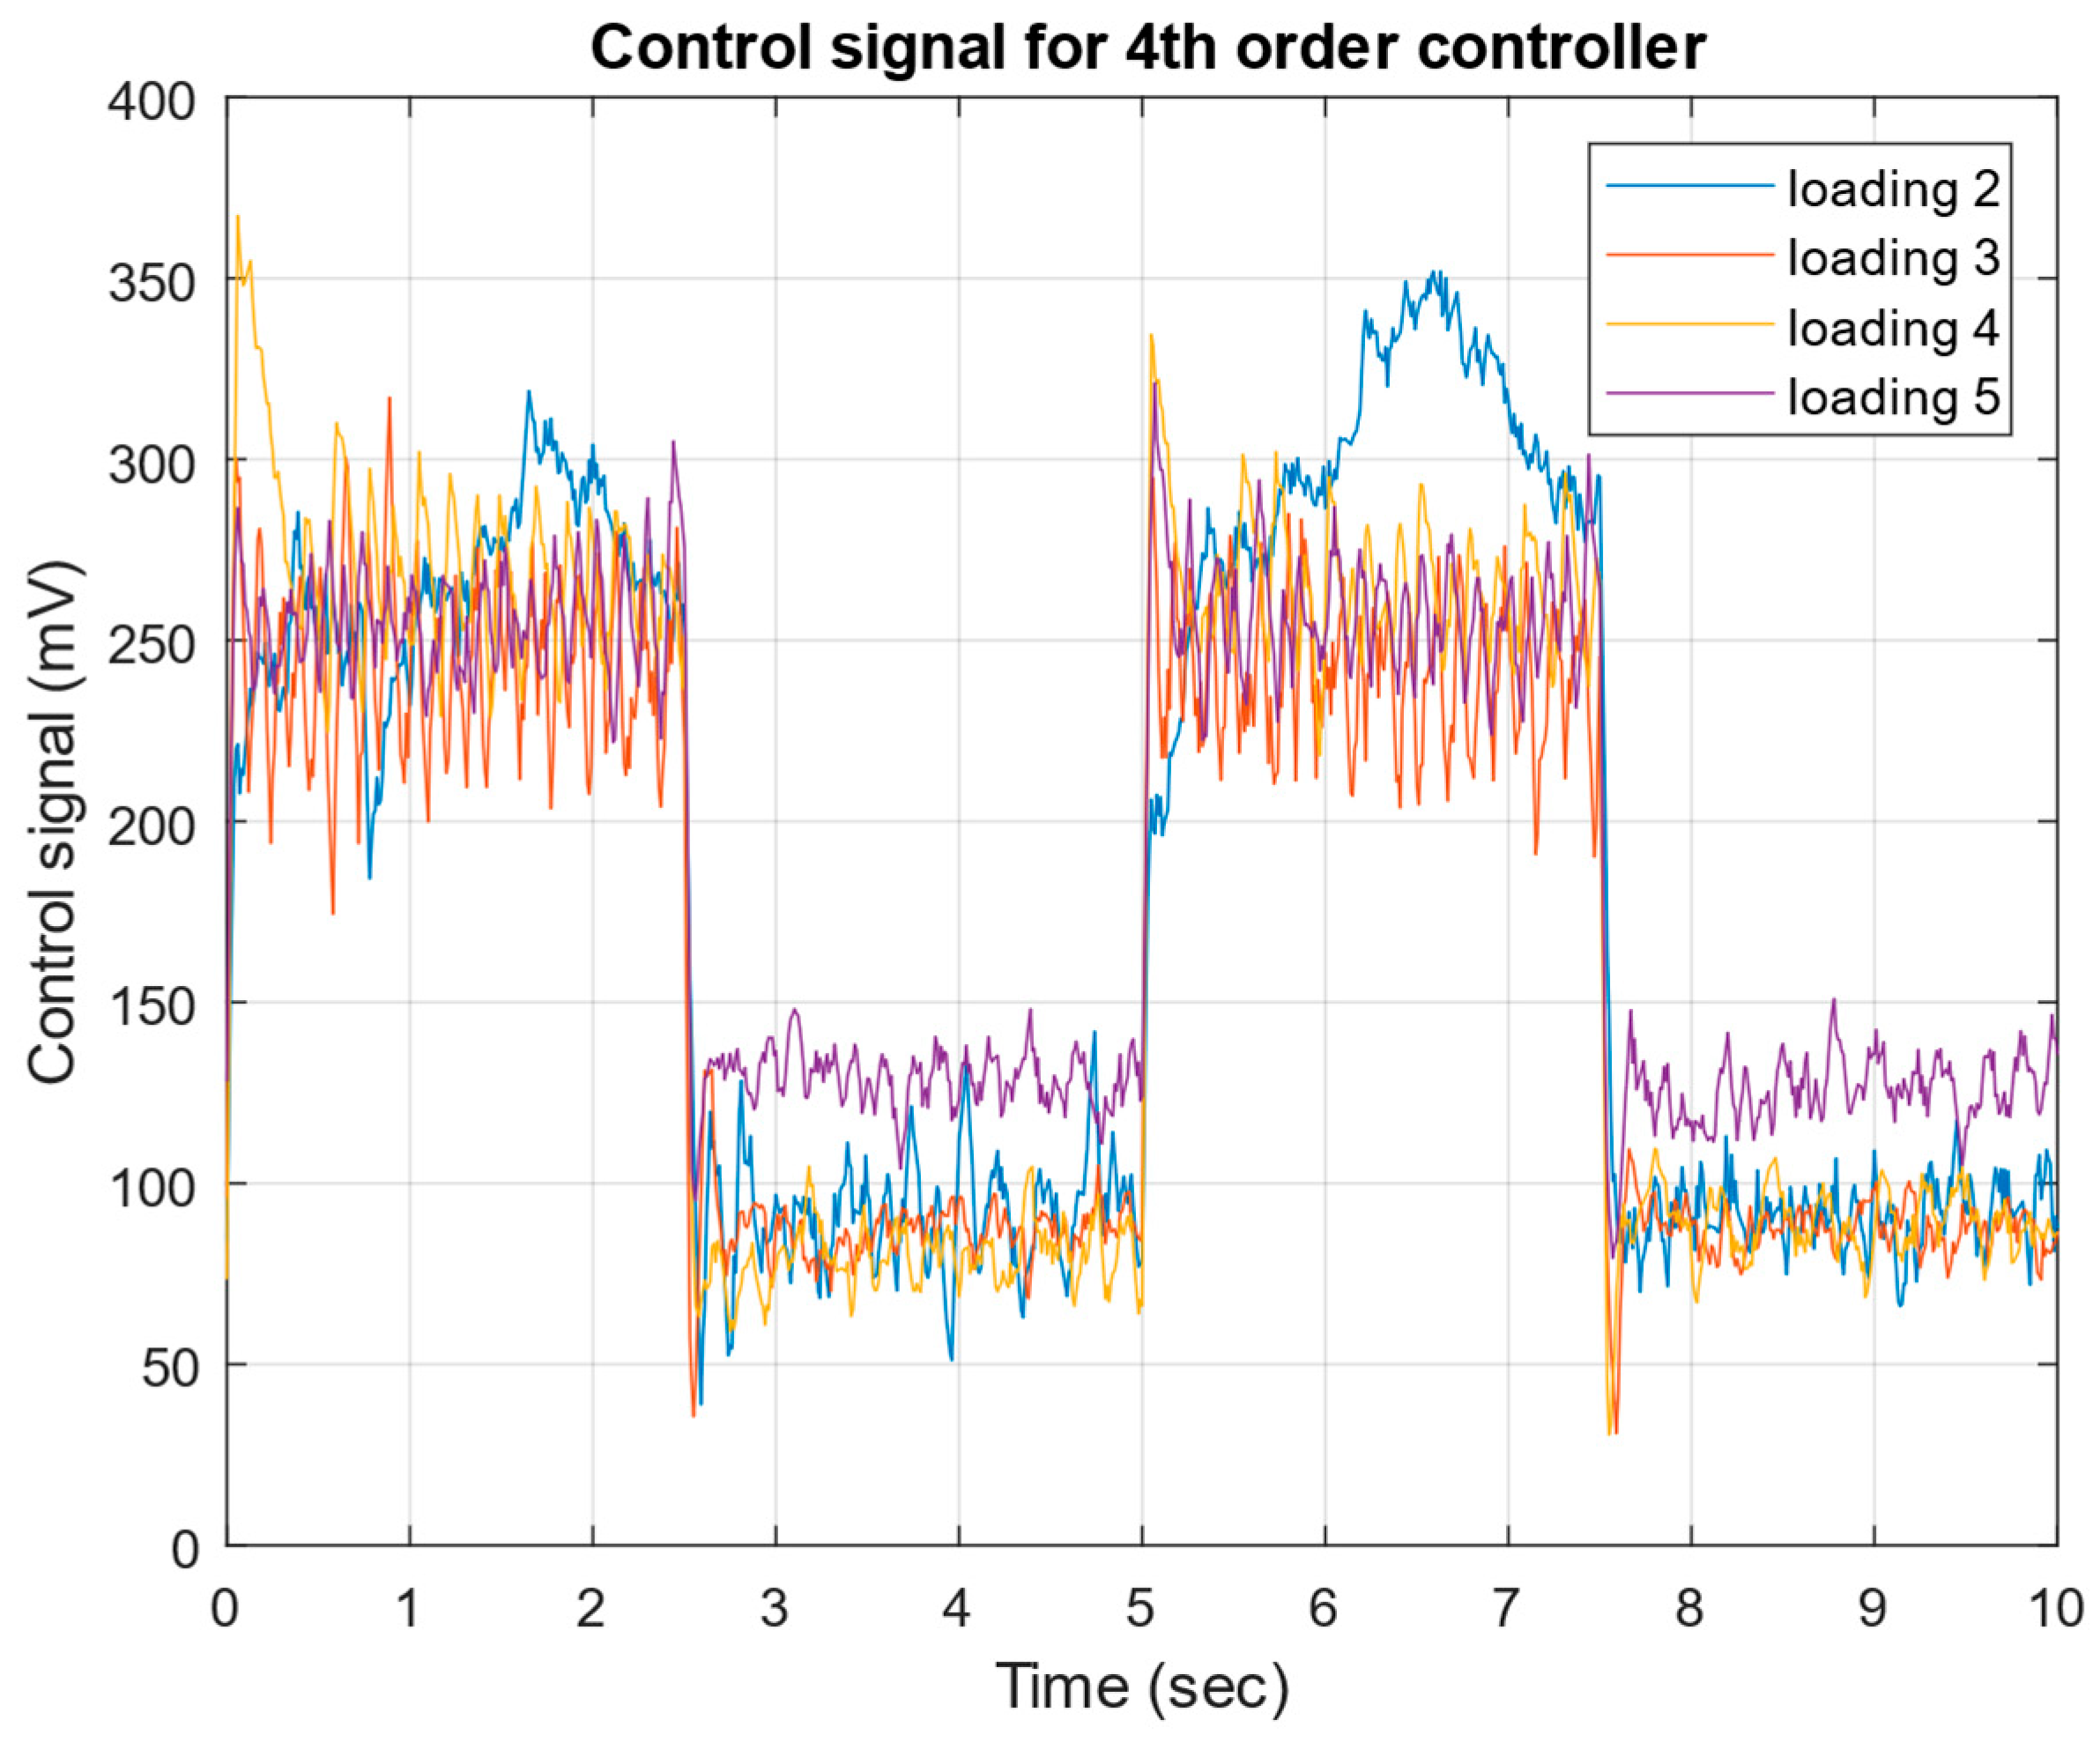
The fourth-order controller’s response (Figure 29) exhibits the most aggressive control behavior among all three controllers while maintaining the same general voltage range of 50–350 mV. Compared to the 6th- and 21st-order controllers, it shows notably higher peak-to-peak variations during high-flow-rate periods, particularly evident in loading 2, where the signal reaches up to 350 mV with more erratic fluctuations. The transient responses at flow rate changes display similar sharp negative spikes to the sixth-order controller, but with more pronounced overshoots, particularly visible in loading 2. During lower-flow-rate periods, while all controllers operate in the 80–150 mV range, the fourth-order controller demonstrates more persistent oscillations compared to its higher-order counterparts. The loading condition effects follow the same pattern as the other controllers, with loading 2 requiring the highest control effort, but the fourth-order controller shows less distinction between loadings 3–5 in terms of average voltage levels. This increased aggressive behavior and higher noise content in the control signal suggest that the further order reduction to fourth order has resulted in a more active control effort while still maintaining acceptable overall system performance.
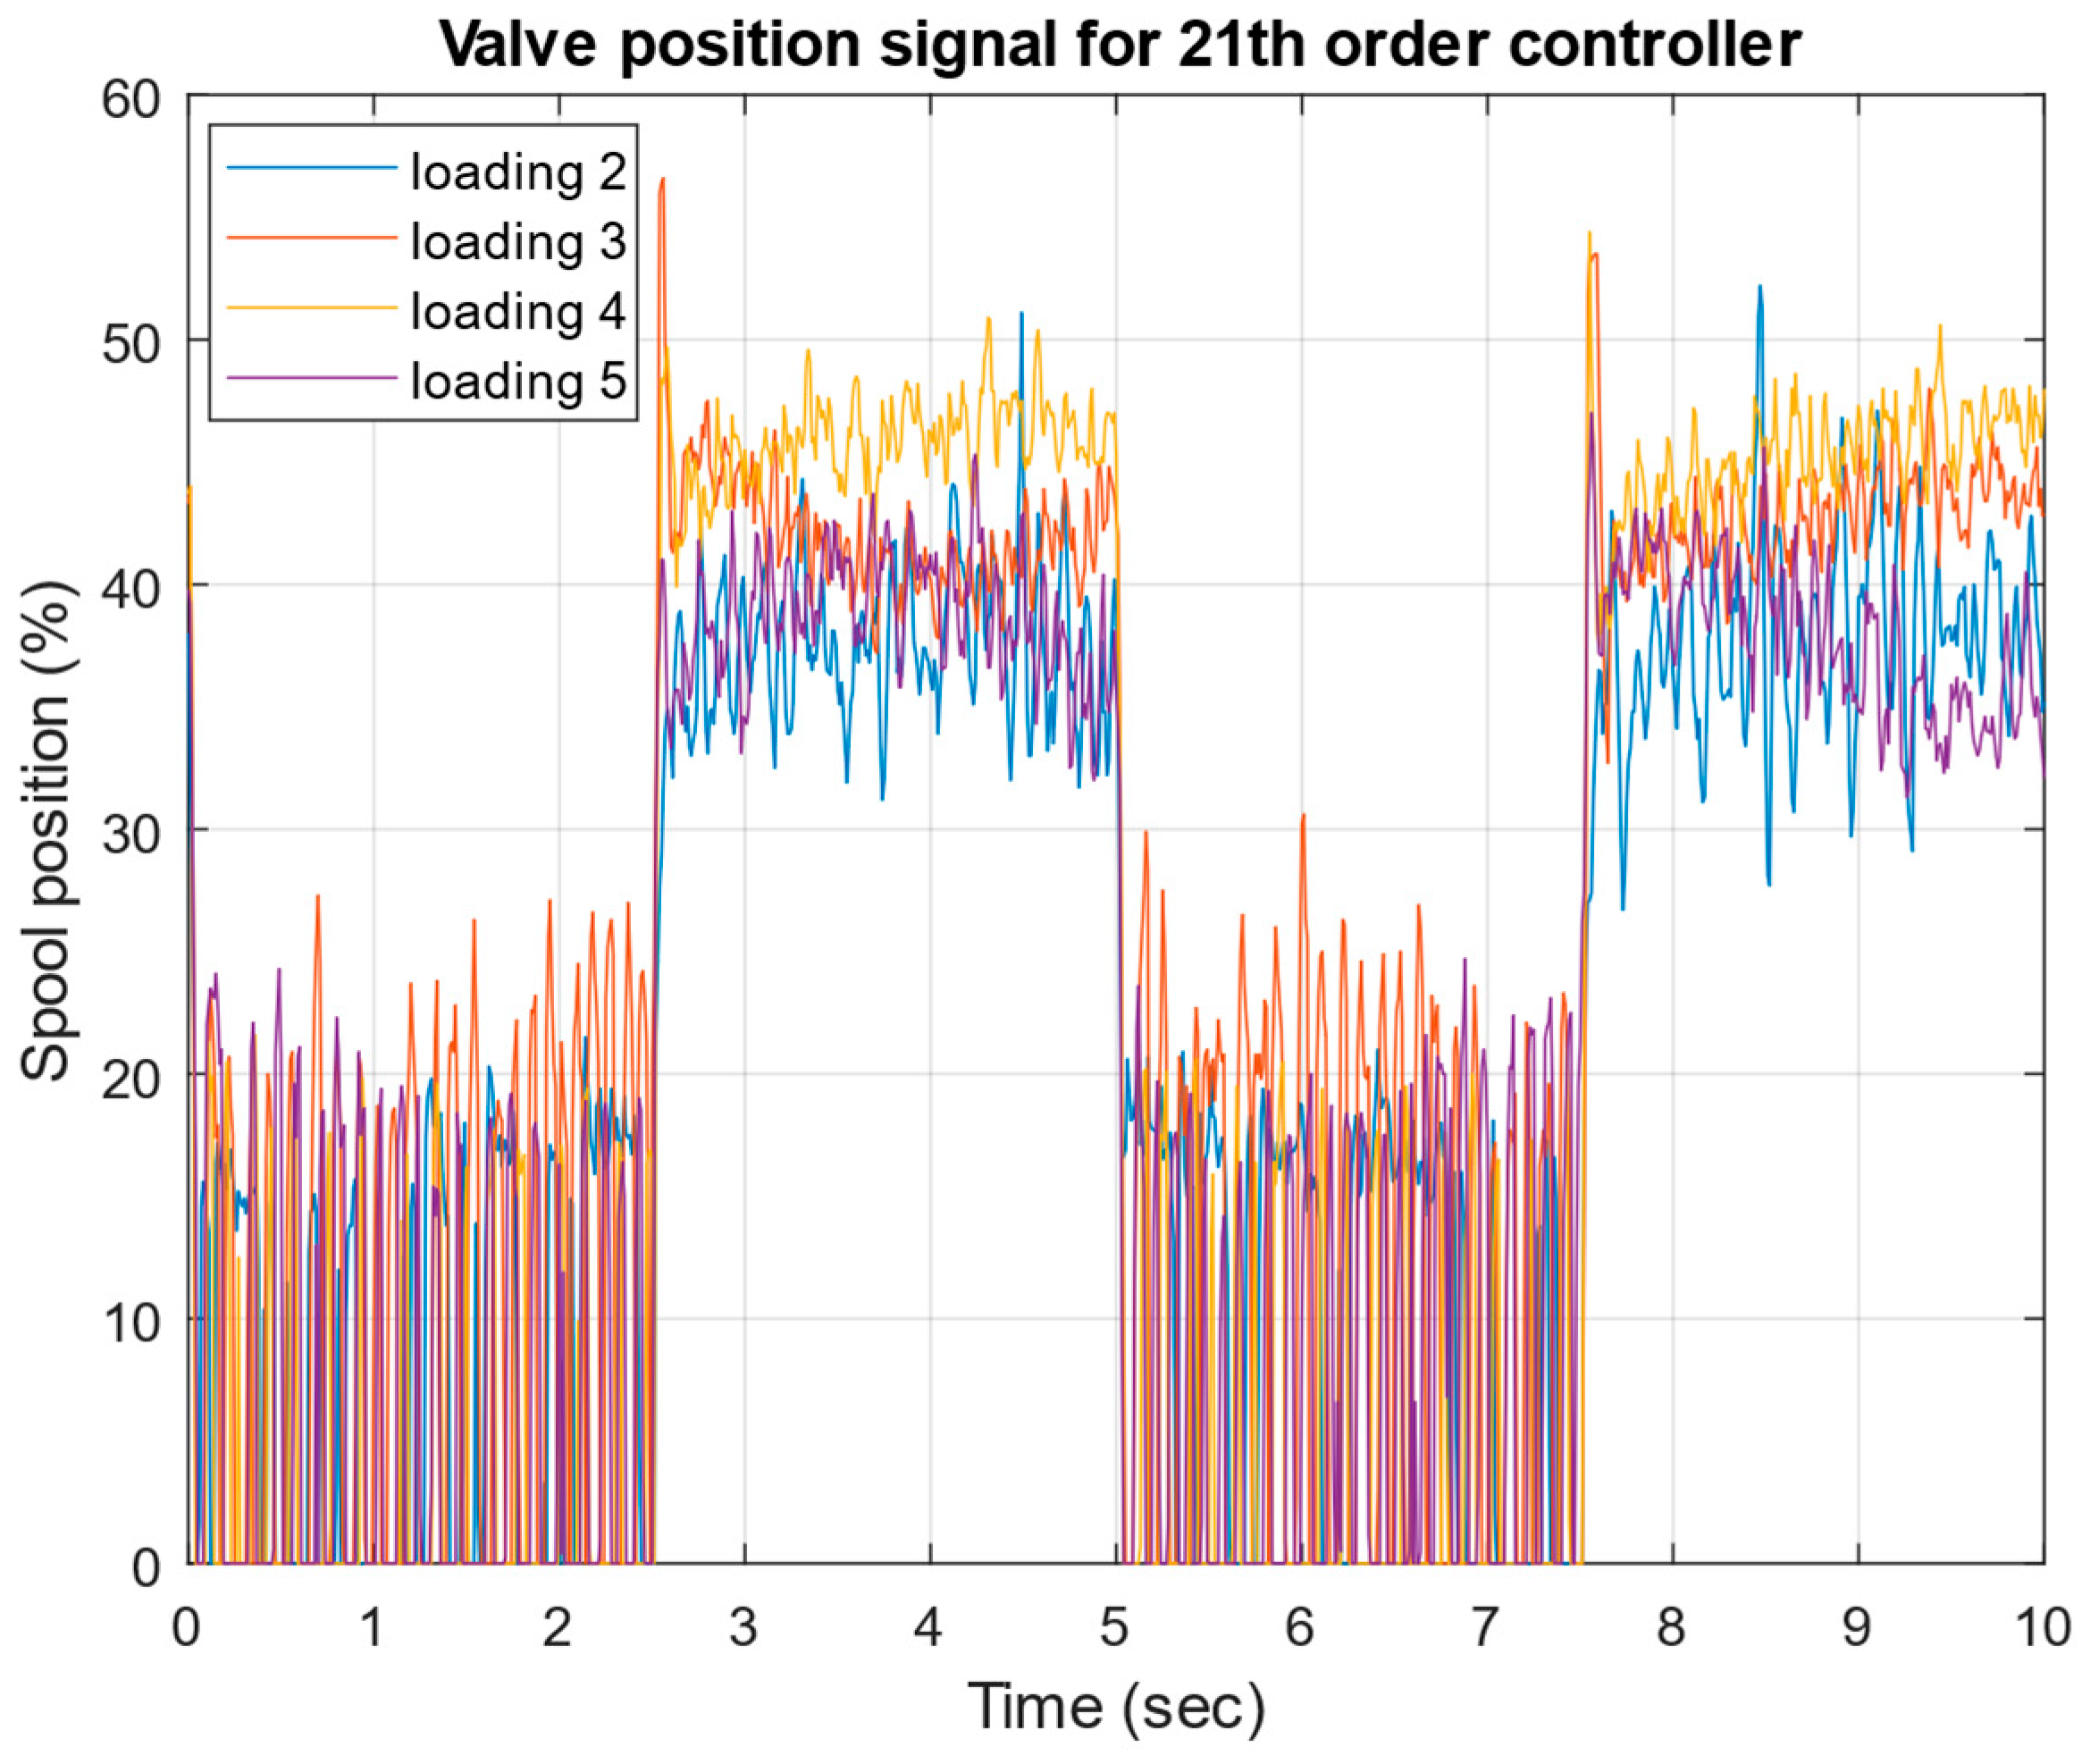
The valve position signal for the 21st-order controller (Figure 30) shows the physical movement of the spool valve, ranging between approximately 0 and 50% of its total stroke. The signal exhibits distinct operating regions corresponding to the flow rate demands, with higher positions (35–45%) during high-flow periods and lower positions (15–25%) during low-flow periods. The measurement noise is significant across all loading conditions, with loading 3 and 4 showing the highest peak-to-peak variations of about ±5%. Sharp transitions occur when the flow rate reference changes, demonstrating the rapid response of the valve to control signal changes. Loading 2 (highest resistance) generally operates at lower valve positions compared to loadings 3–5, indicating that less valve opening is needed to achieve the desired flow rate under higher resistance. The noise in the valve position signal correlates with the control signal variations seen previously, suggesting that the valve’s physical movement directly responds to the electronic amplifier’s output, though with some mechanical filtering evident in the response.
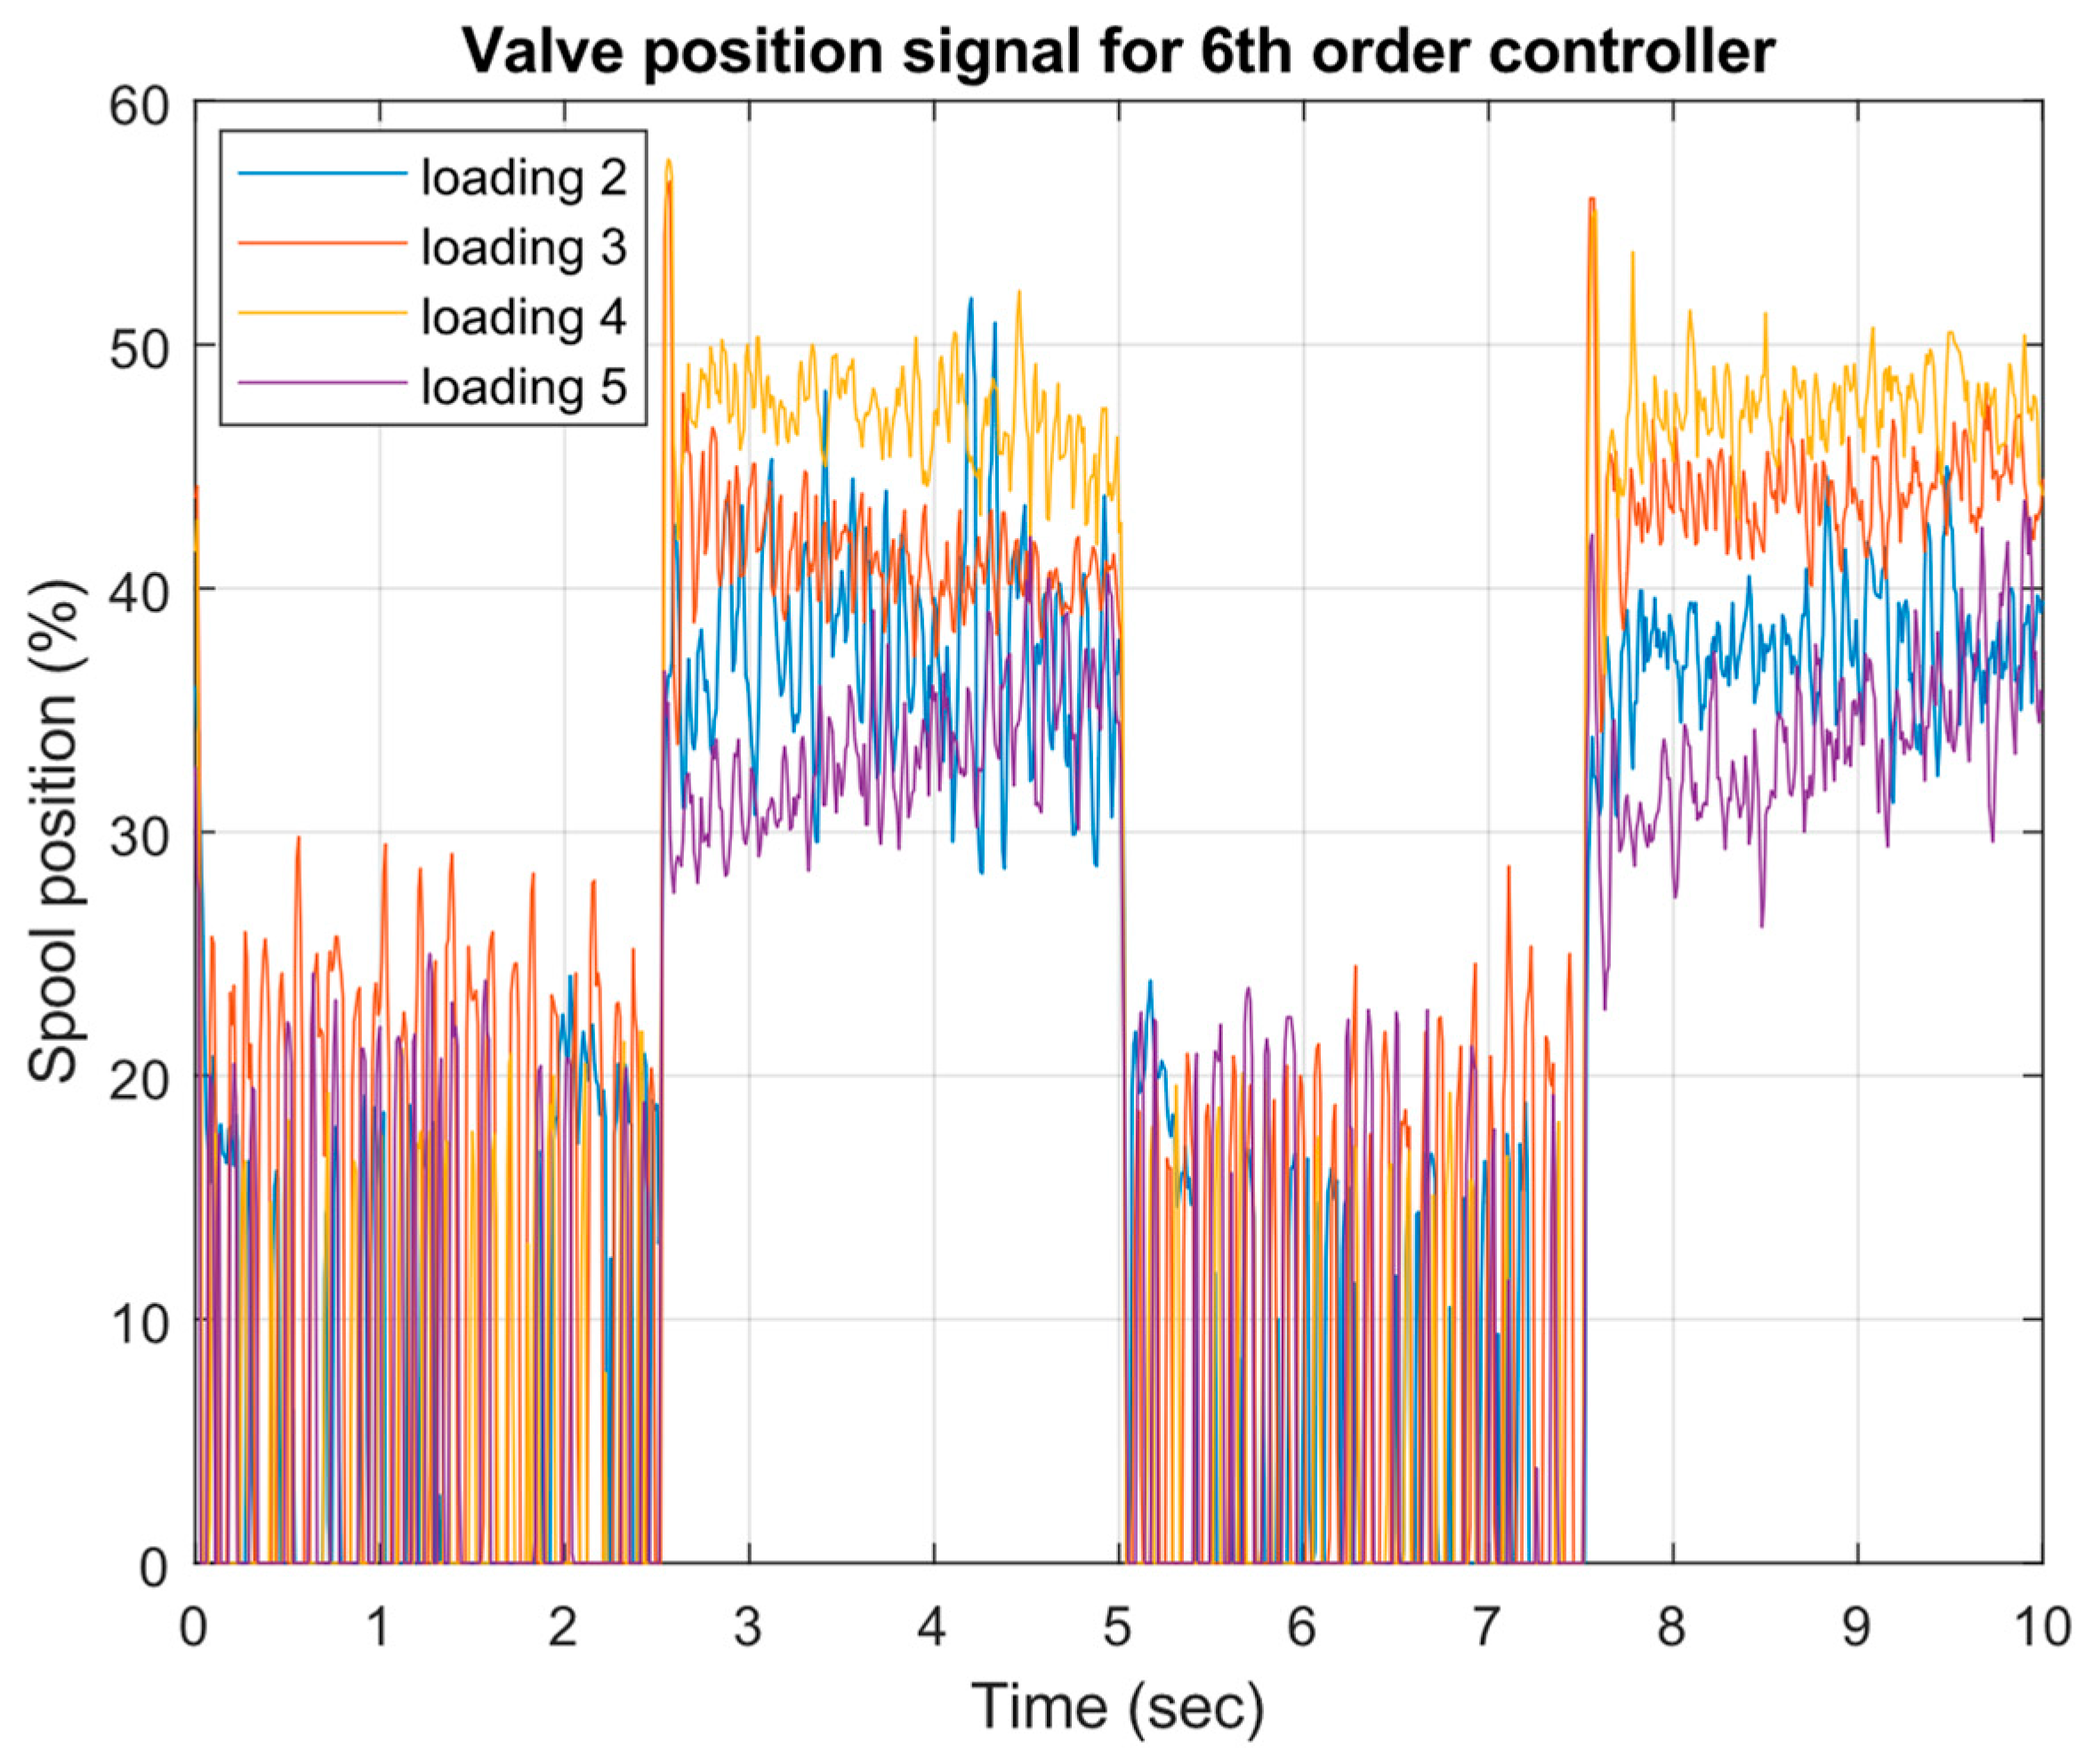
The valve position signal for the 6th-order controller (Figure 31) exhibits similar overall behavior to the 21st-order controller but with some notable differences in the response characteristics. Both controllers operate in the same range of approximately 0–50% valve stroke, with higher positions (35–45%) during high-flow periods and lower positions (15–25%) during low-flow periods. However, the 6th-order controller shows more pronounced variations in the signal, particularly evident in loading 3, where the peak-to-peak oscillations reach ±7%, compared to the ±5% seen in the 21st-order controller. The step transitions are equally sharp for both controllers, but the sixth-order controller demonstrates more persistent oscillations during steady-state operation, especially visible in loadings 3 and 4. The loading condition effects remain consistent between both controllers, with loading 2 operating at generally lower valve positions, but the sixth-order controller shows slightly more spread between the different loading conditions during high-flow periods. This increased variability in the valve position signal aligns with the more aggressive control signal behavior observed earlier for the sixth-order controller.
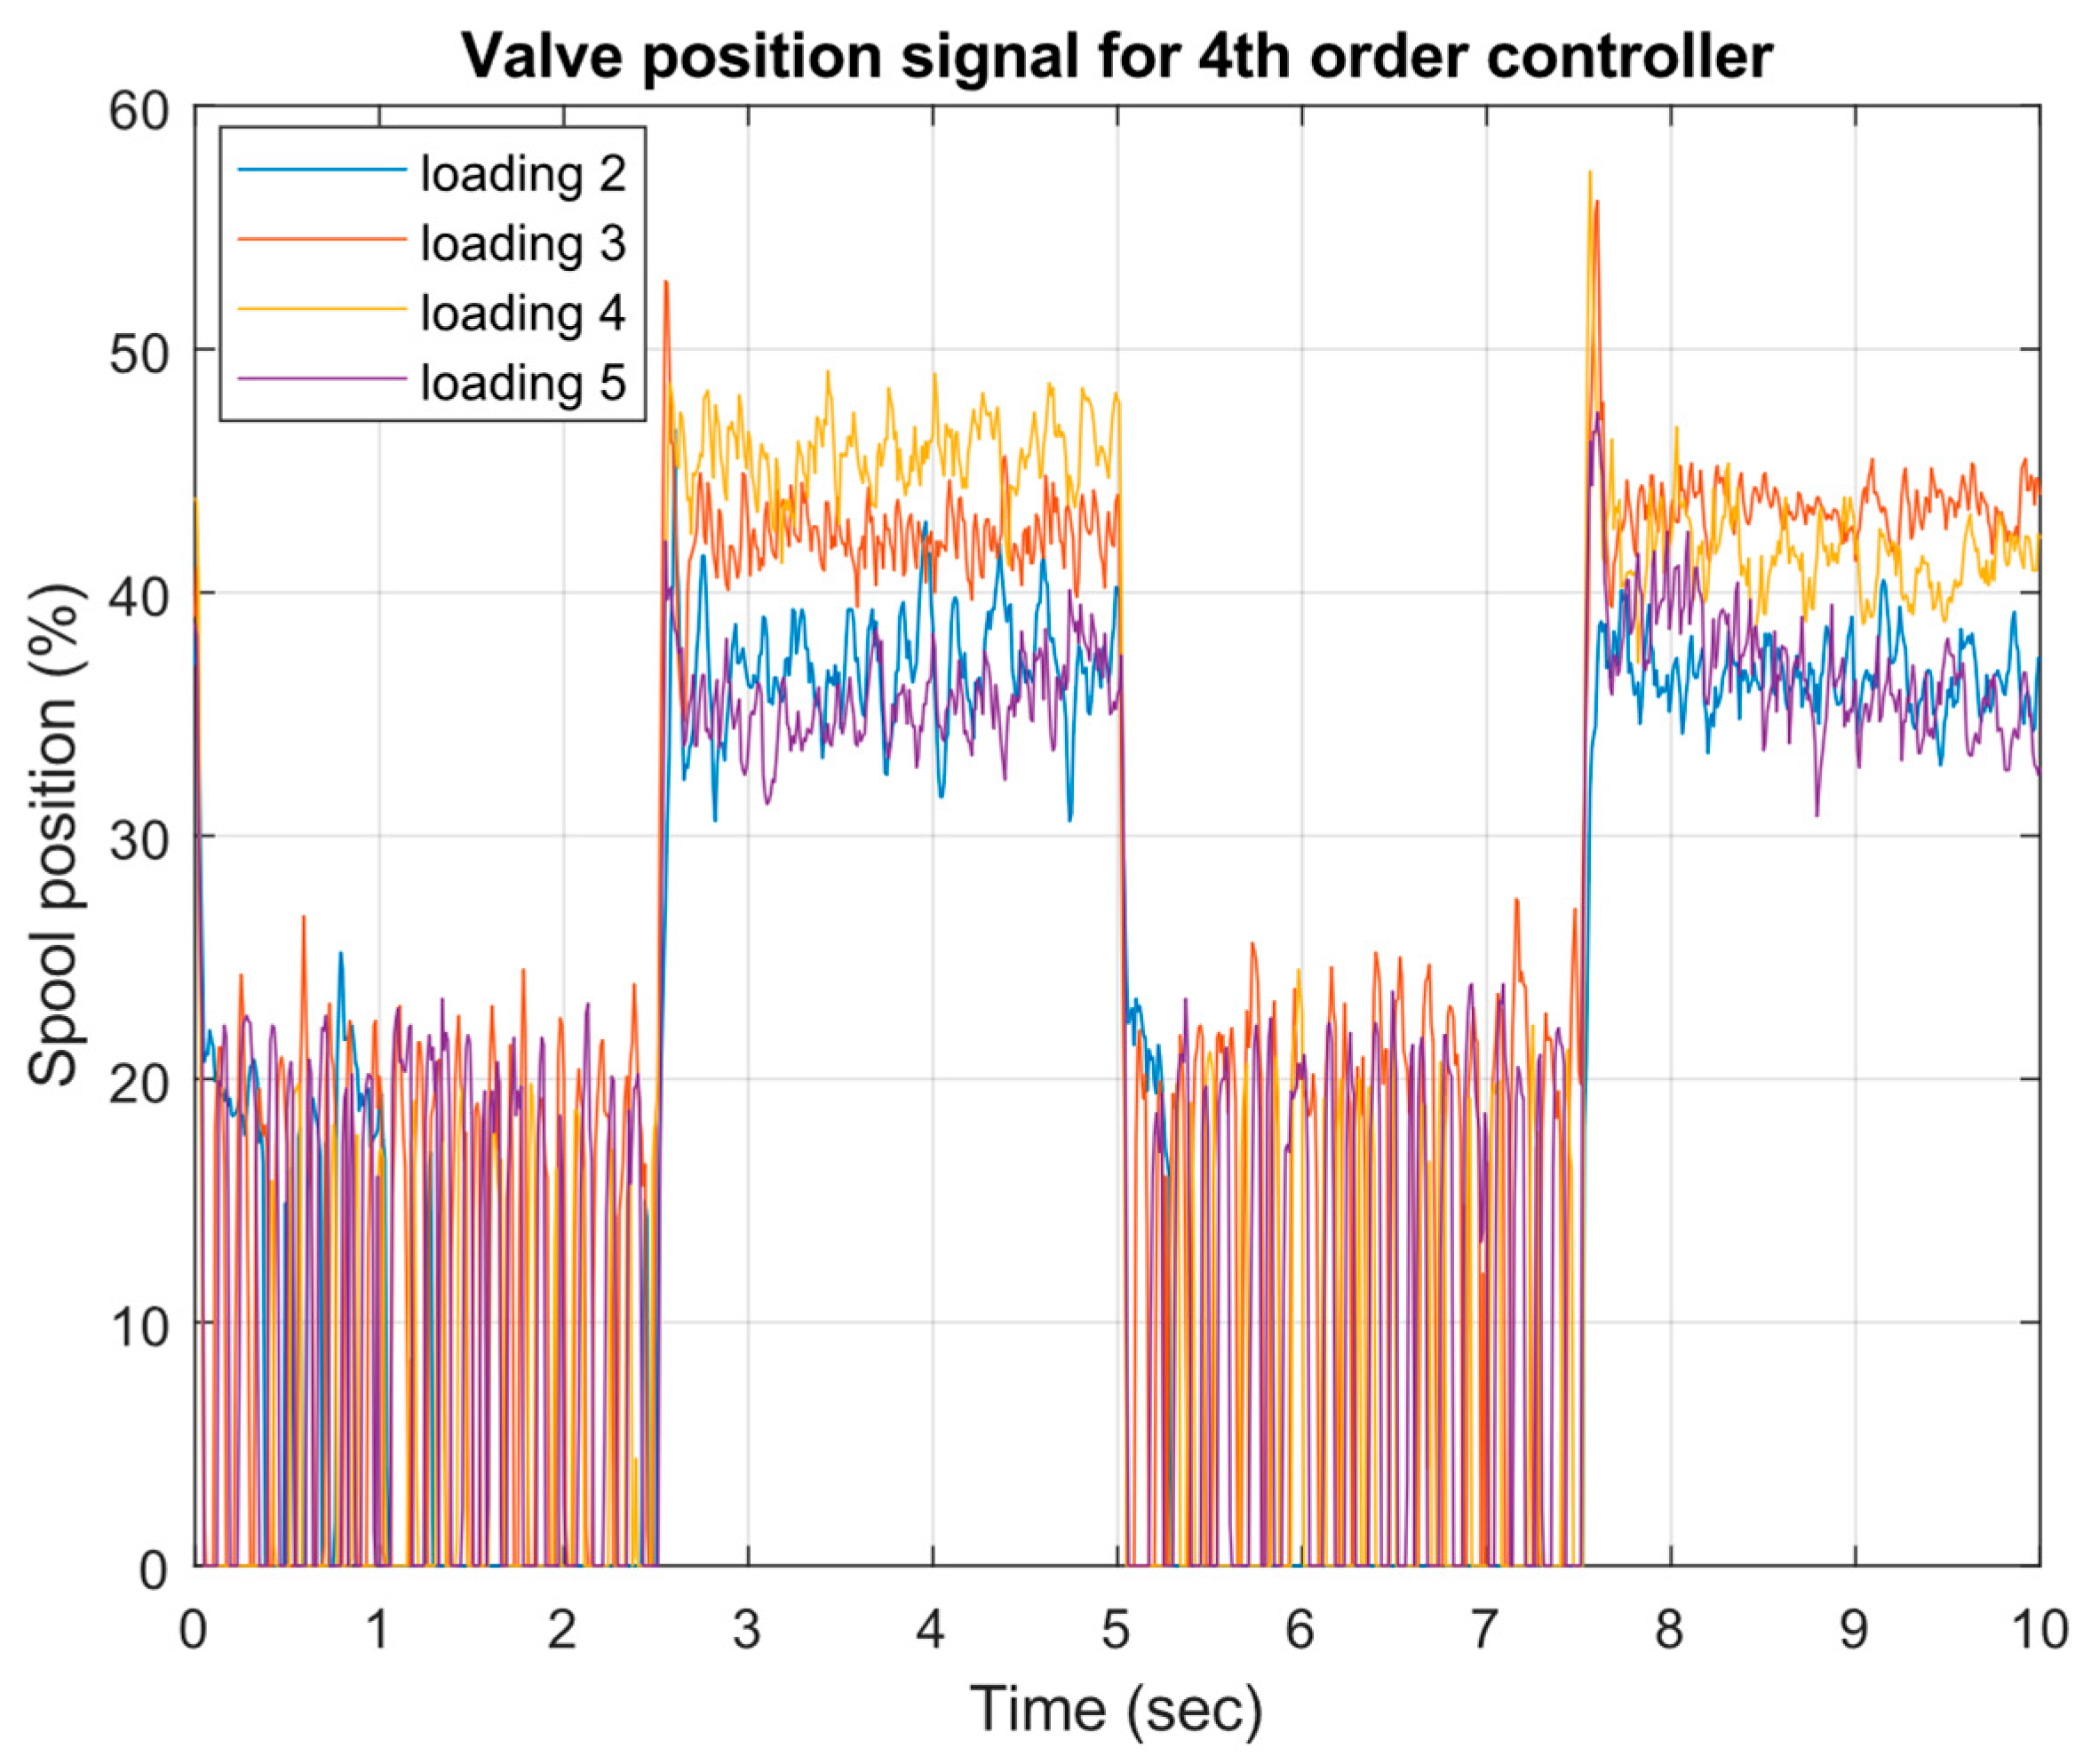
The spool valve position signal for the 4th-order controller (Figure 32) demonstrates the most stable response among all three controllers, with noticeably reduced noise compared to both of the 21st- and 6th-order implementations. While maintaining the same operating range of 0–50% valve stroke and similar position levels during high-flow (35–45%) and low-flow (15–25%) periods, the 4th-order controller exhibits smoother steady-state behavior with peak-to-peak variations of approximately ±4%, compared to ±5% for the 21st order and ±7% for the 6th-order controllers. The step transitions remain sharp and responsive but with less overshoot than seen in the other controllers. The separation between different loading conditions is more distinct and consistent with the fourth-order controller, particularly during high-flow periods. This improved stability is somewhat surprising given the more aggressive control signals observed earlier, suggesting that the mechanical system’s natural damping might be better utilized by the fourth-order controller’s characteristics.
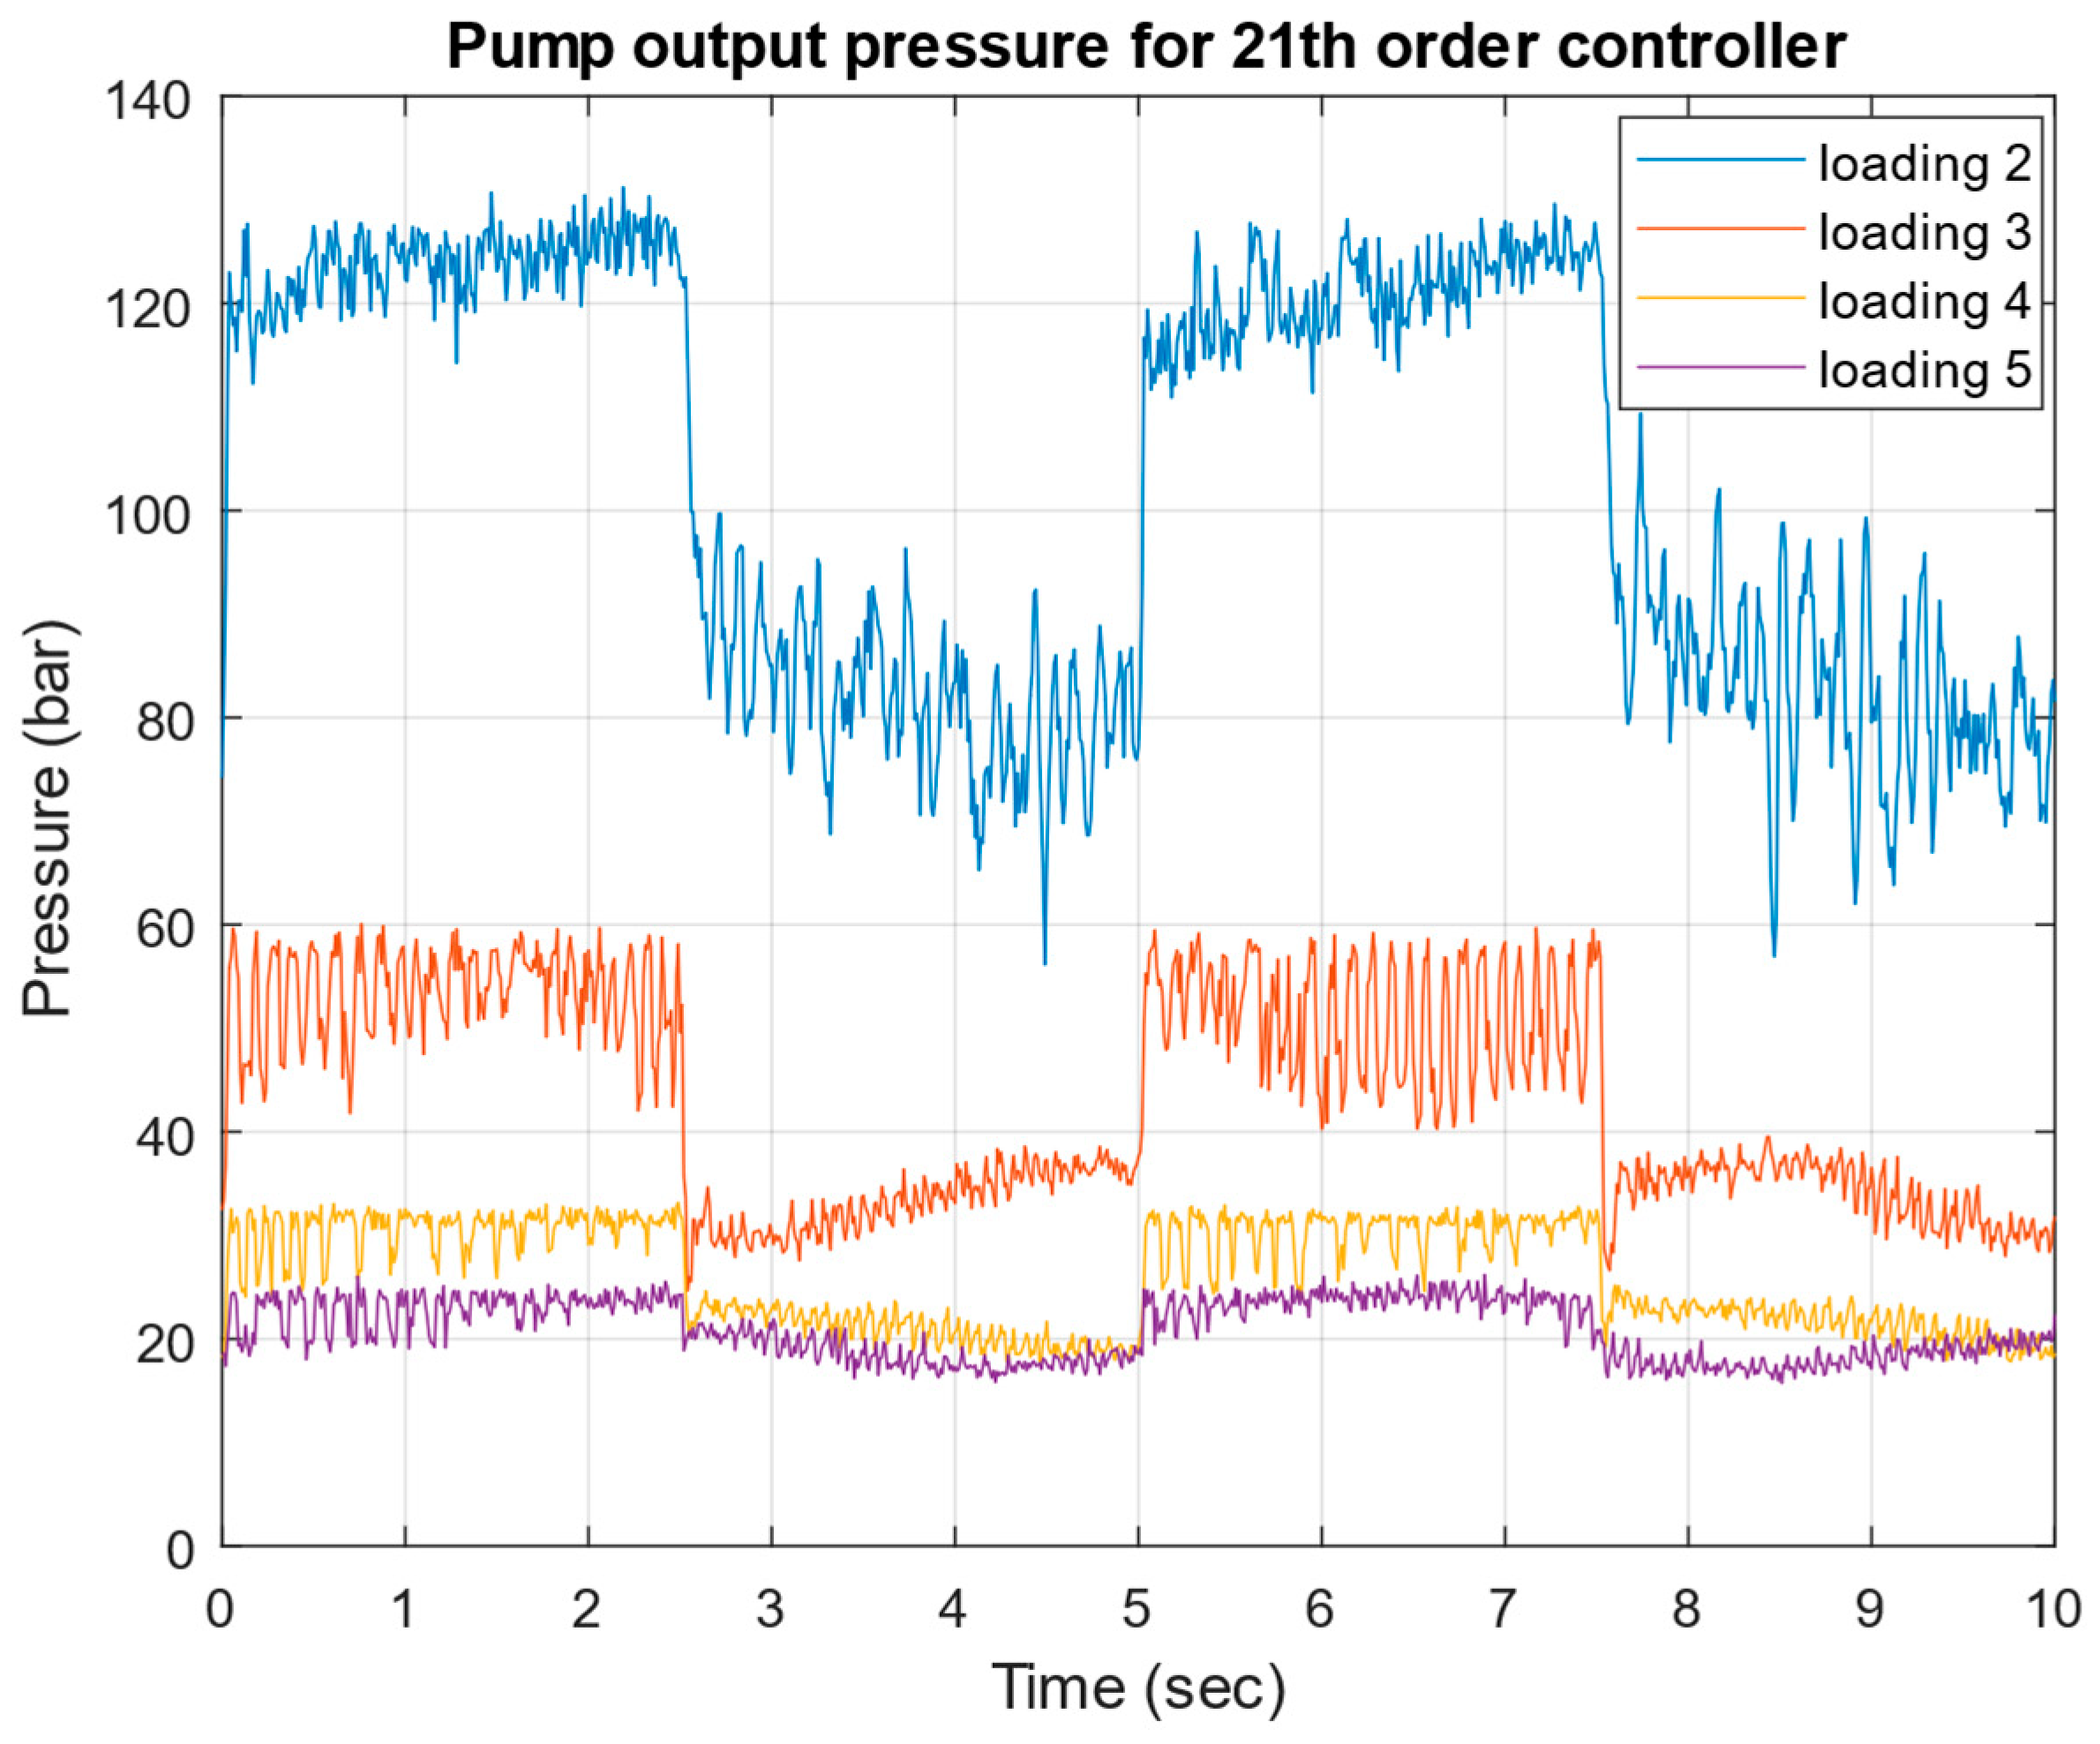
The pump output pressure for the 21st-order controller (Figure 33) exhibits distinct characteristics across different loading conditions, with loading 2 showing the highest-pressure levels around 120–125 bar, clearly limited by the relief valve operation. During high-flow periods, loading 2 demonstrates pressure oscillations of ±5 bar near the relief valve setting, while during low-flow periods, the pressure drops to 70–90 bar with increased oscillations of ±15 bar. Loading 3 operates at a significantly lower pressure range of 50–60 bar with ±5 bar oscillations, while loadings 4 and 5 show the lowest pressure levels at 25–35 bar and 20–25 bar, respectively, with minimal oscillations of ±2 bar. The pressure transitions show sharp changes, particularly noticeable in loading 2, where the pressure drops from the relief valve level to lower operating pressures. This pressure behavior aligns with the progressive decrease in system resistance from loading 2 to loading 5, where lower resistance results in lower operating pressures and reduced pressure oscillations.
The pump output pressure for the 6th-order controller (Figure 34) shows increased oscillations compared to the 21st-order controller while maintaining similar pressure levels across loading conditions. Loading 2 operates near the relief valve setting of 120 bar during high-flow periods with more pronounced oscillations of ±8 bar and drops to 70–90 bar during low-flow periods with larger pressure variations of ±20 bar. Loading 3 demonstrates more significant pressure fluctuations in the 40–60 bar range with ±10 bar oscillations, while loadings 4 and 5 maintain lower pressure levels at 25–35 bar and 20–25 bar, respectively, showing relatively smaller oscillations.
The pump output pressure for the fourth-order controller (Figure 35) shows similar pressure levels but with slightly improved stability compared to the sixth-order controller. Loading 2 operates near the relief valve setting of 120 bar during high-flow periods with pressure oscillations of ±6 bar and drops to 70–90 bar during low-flow periods with variations of ±15 bar. Loading 3 operates in the 40–60 bar range with reduced oscillations of ±8 bar compared to the sixth-order controller, while loadings 4 and 5 maintain steady operation at lower pressure levels of 25–35 bar and 20–25 bar, respectively. The pressure transitions at flow rate changes show similar characteristics to the sixth-order controller but with slightly less aggressive overshoots, particularly for loading 2. Despite having the lowest controller order, the pressure response demonstrates marginally better stability than the sixth-order controller while maintaining effective pressure regulation across all loading conditions.
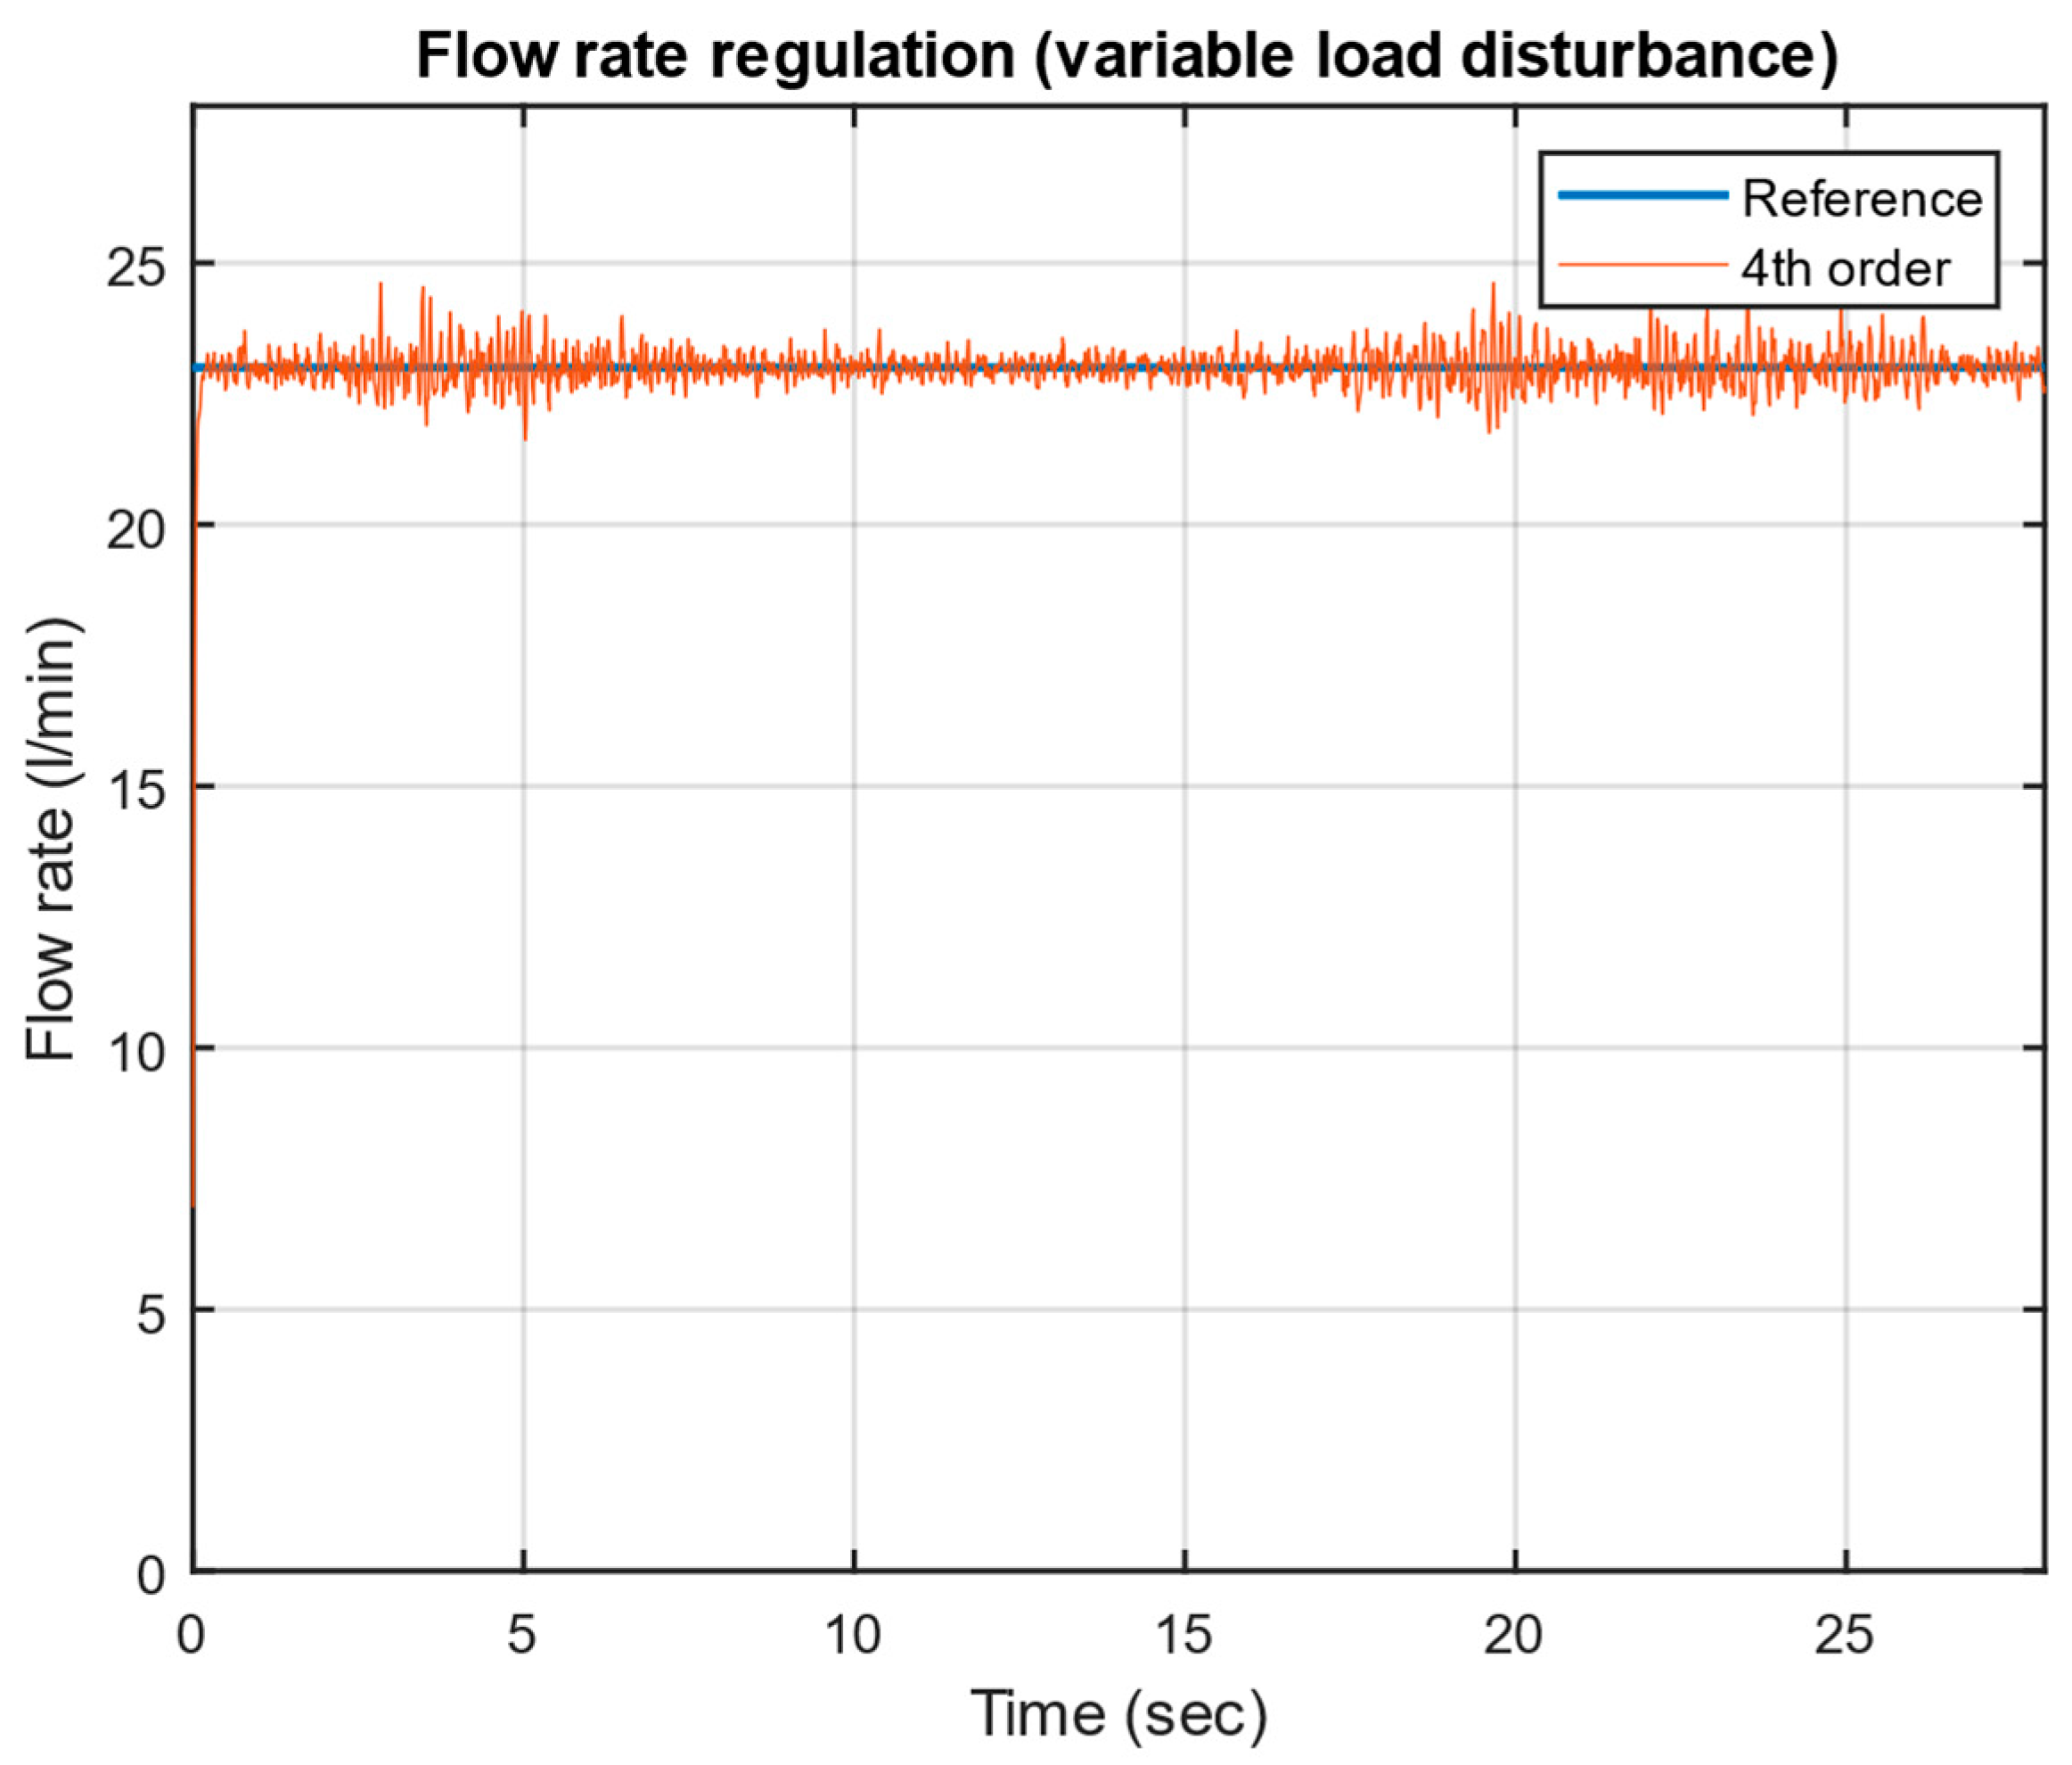
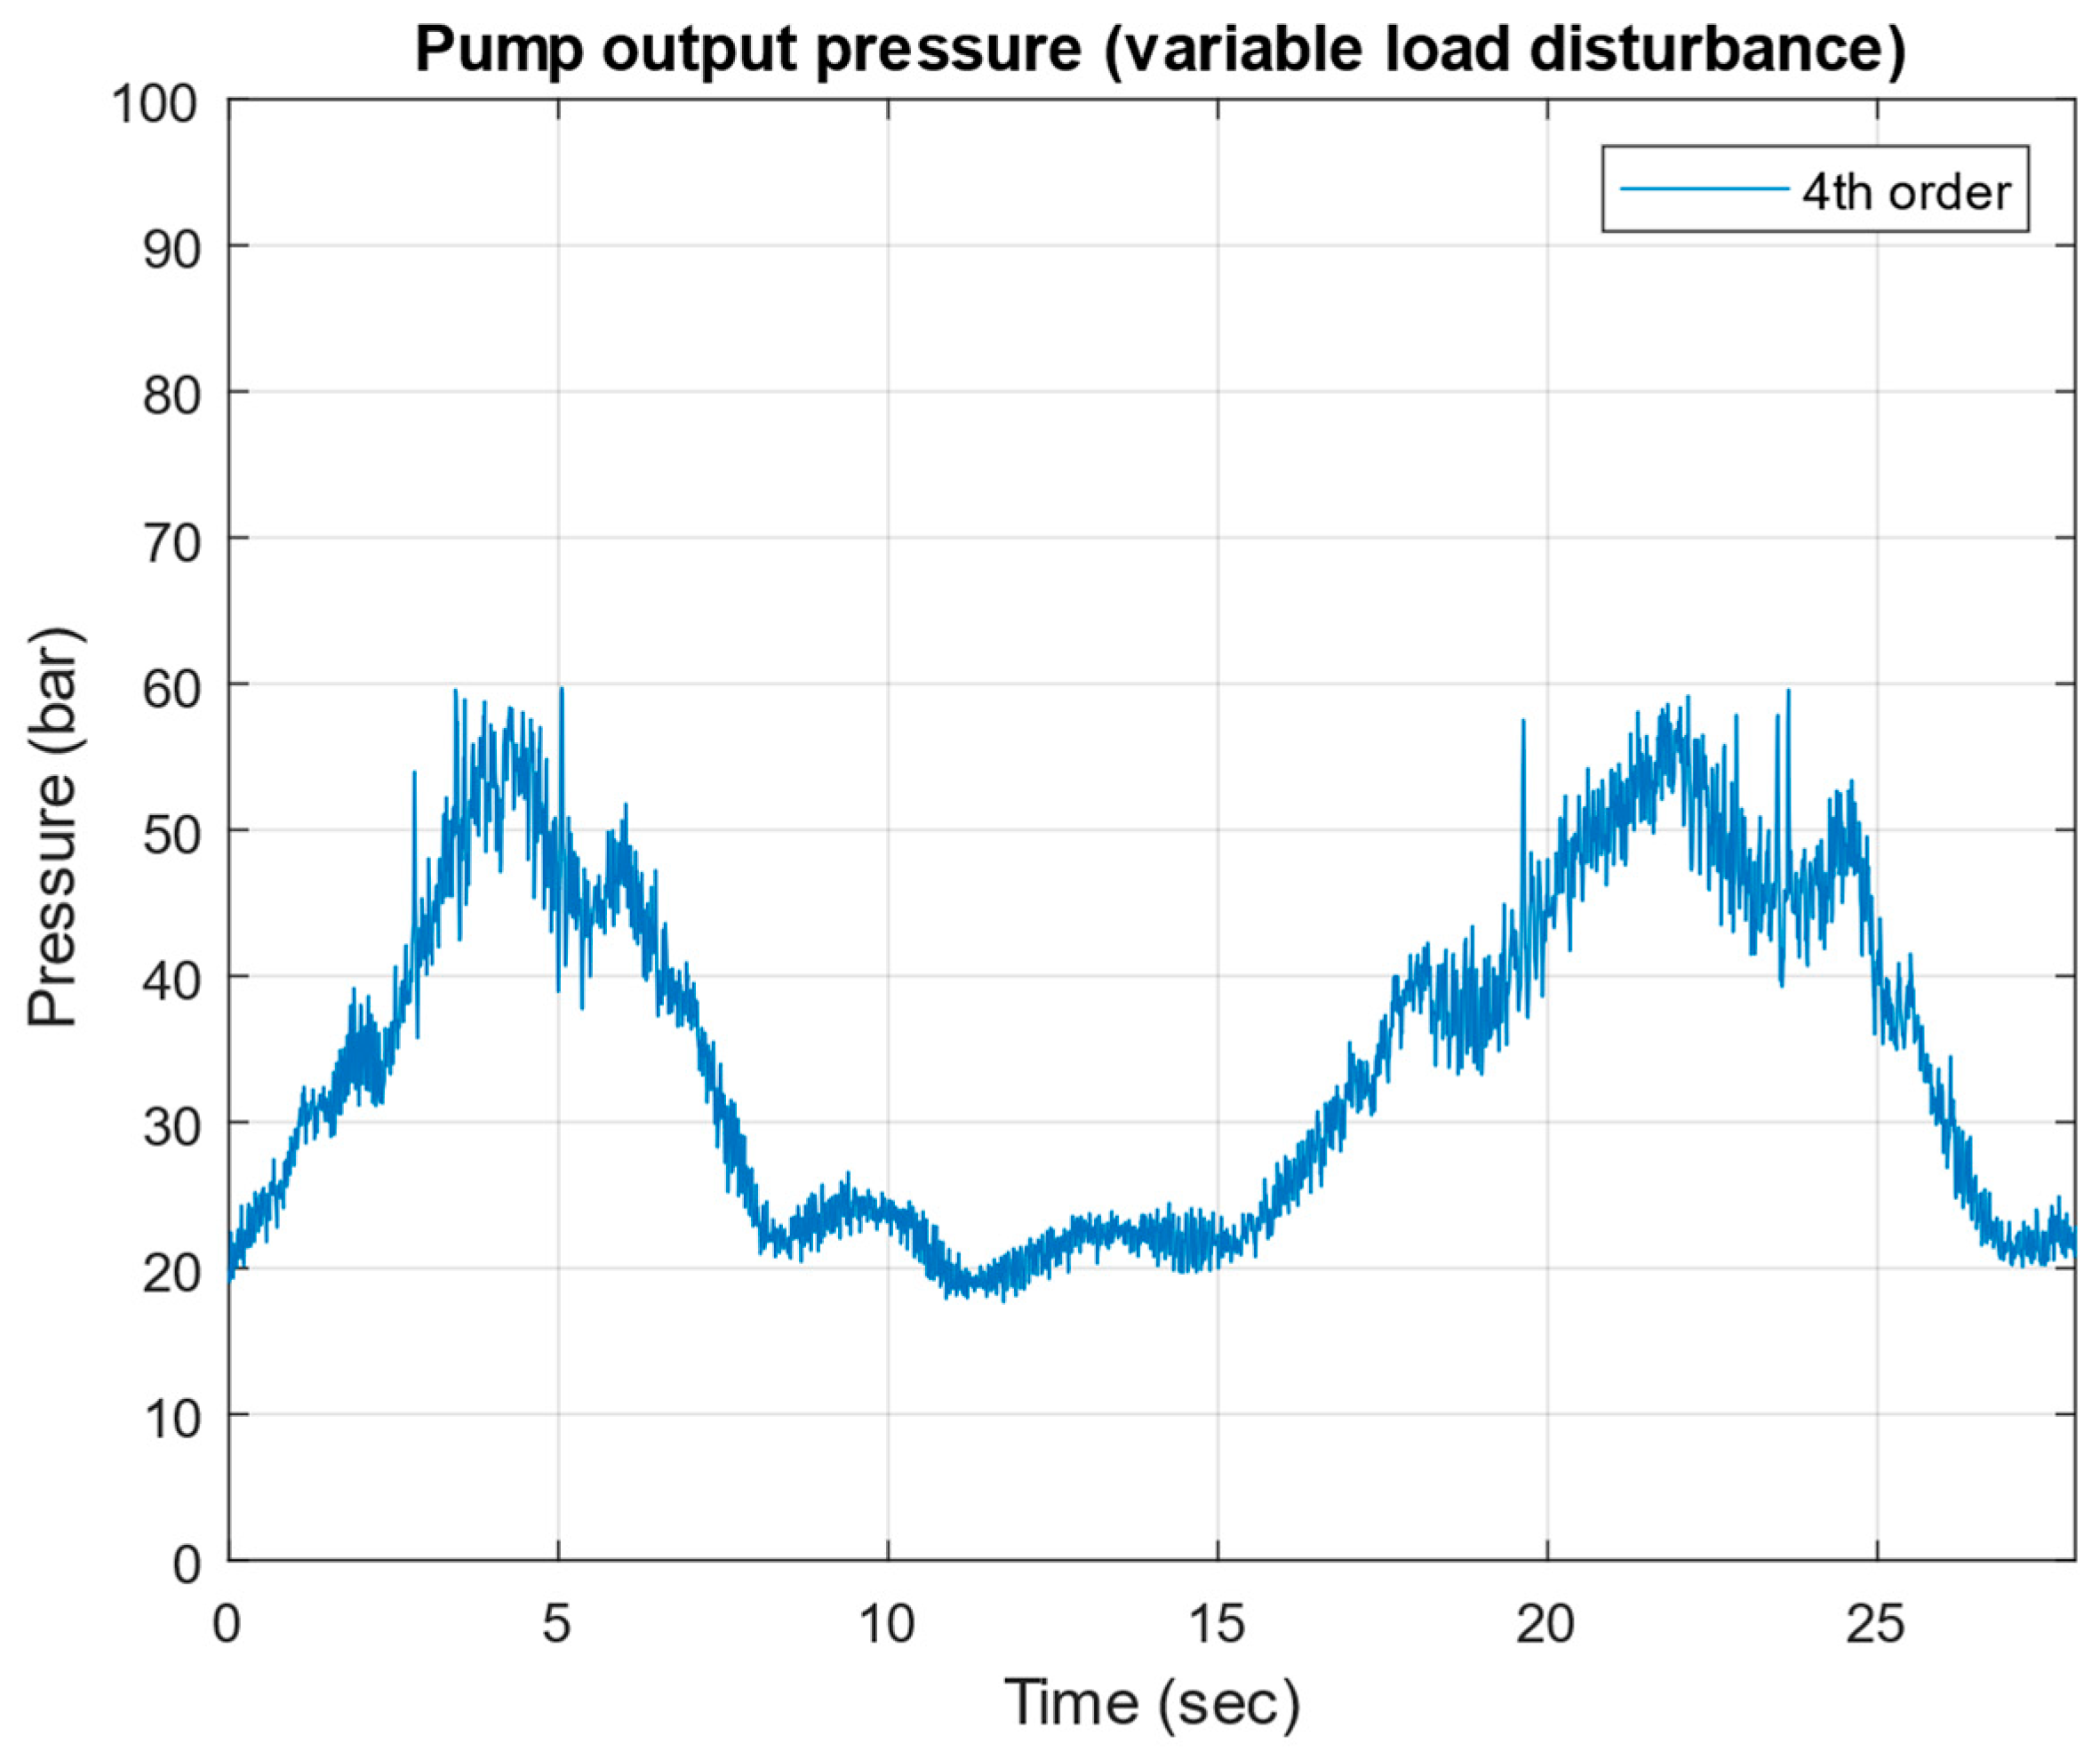
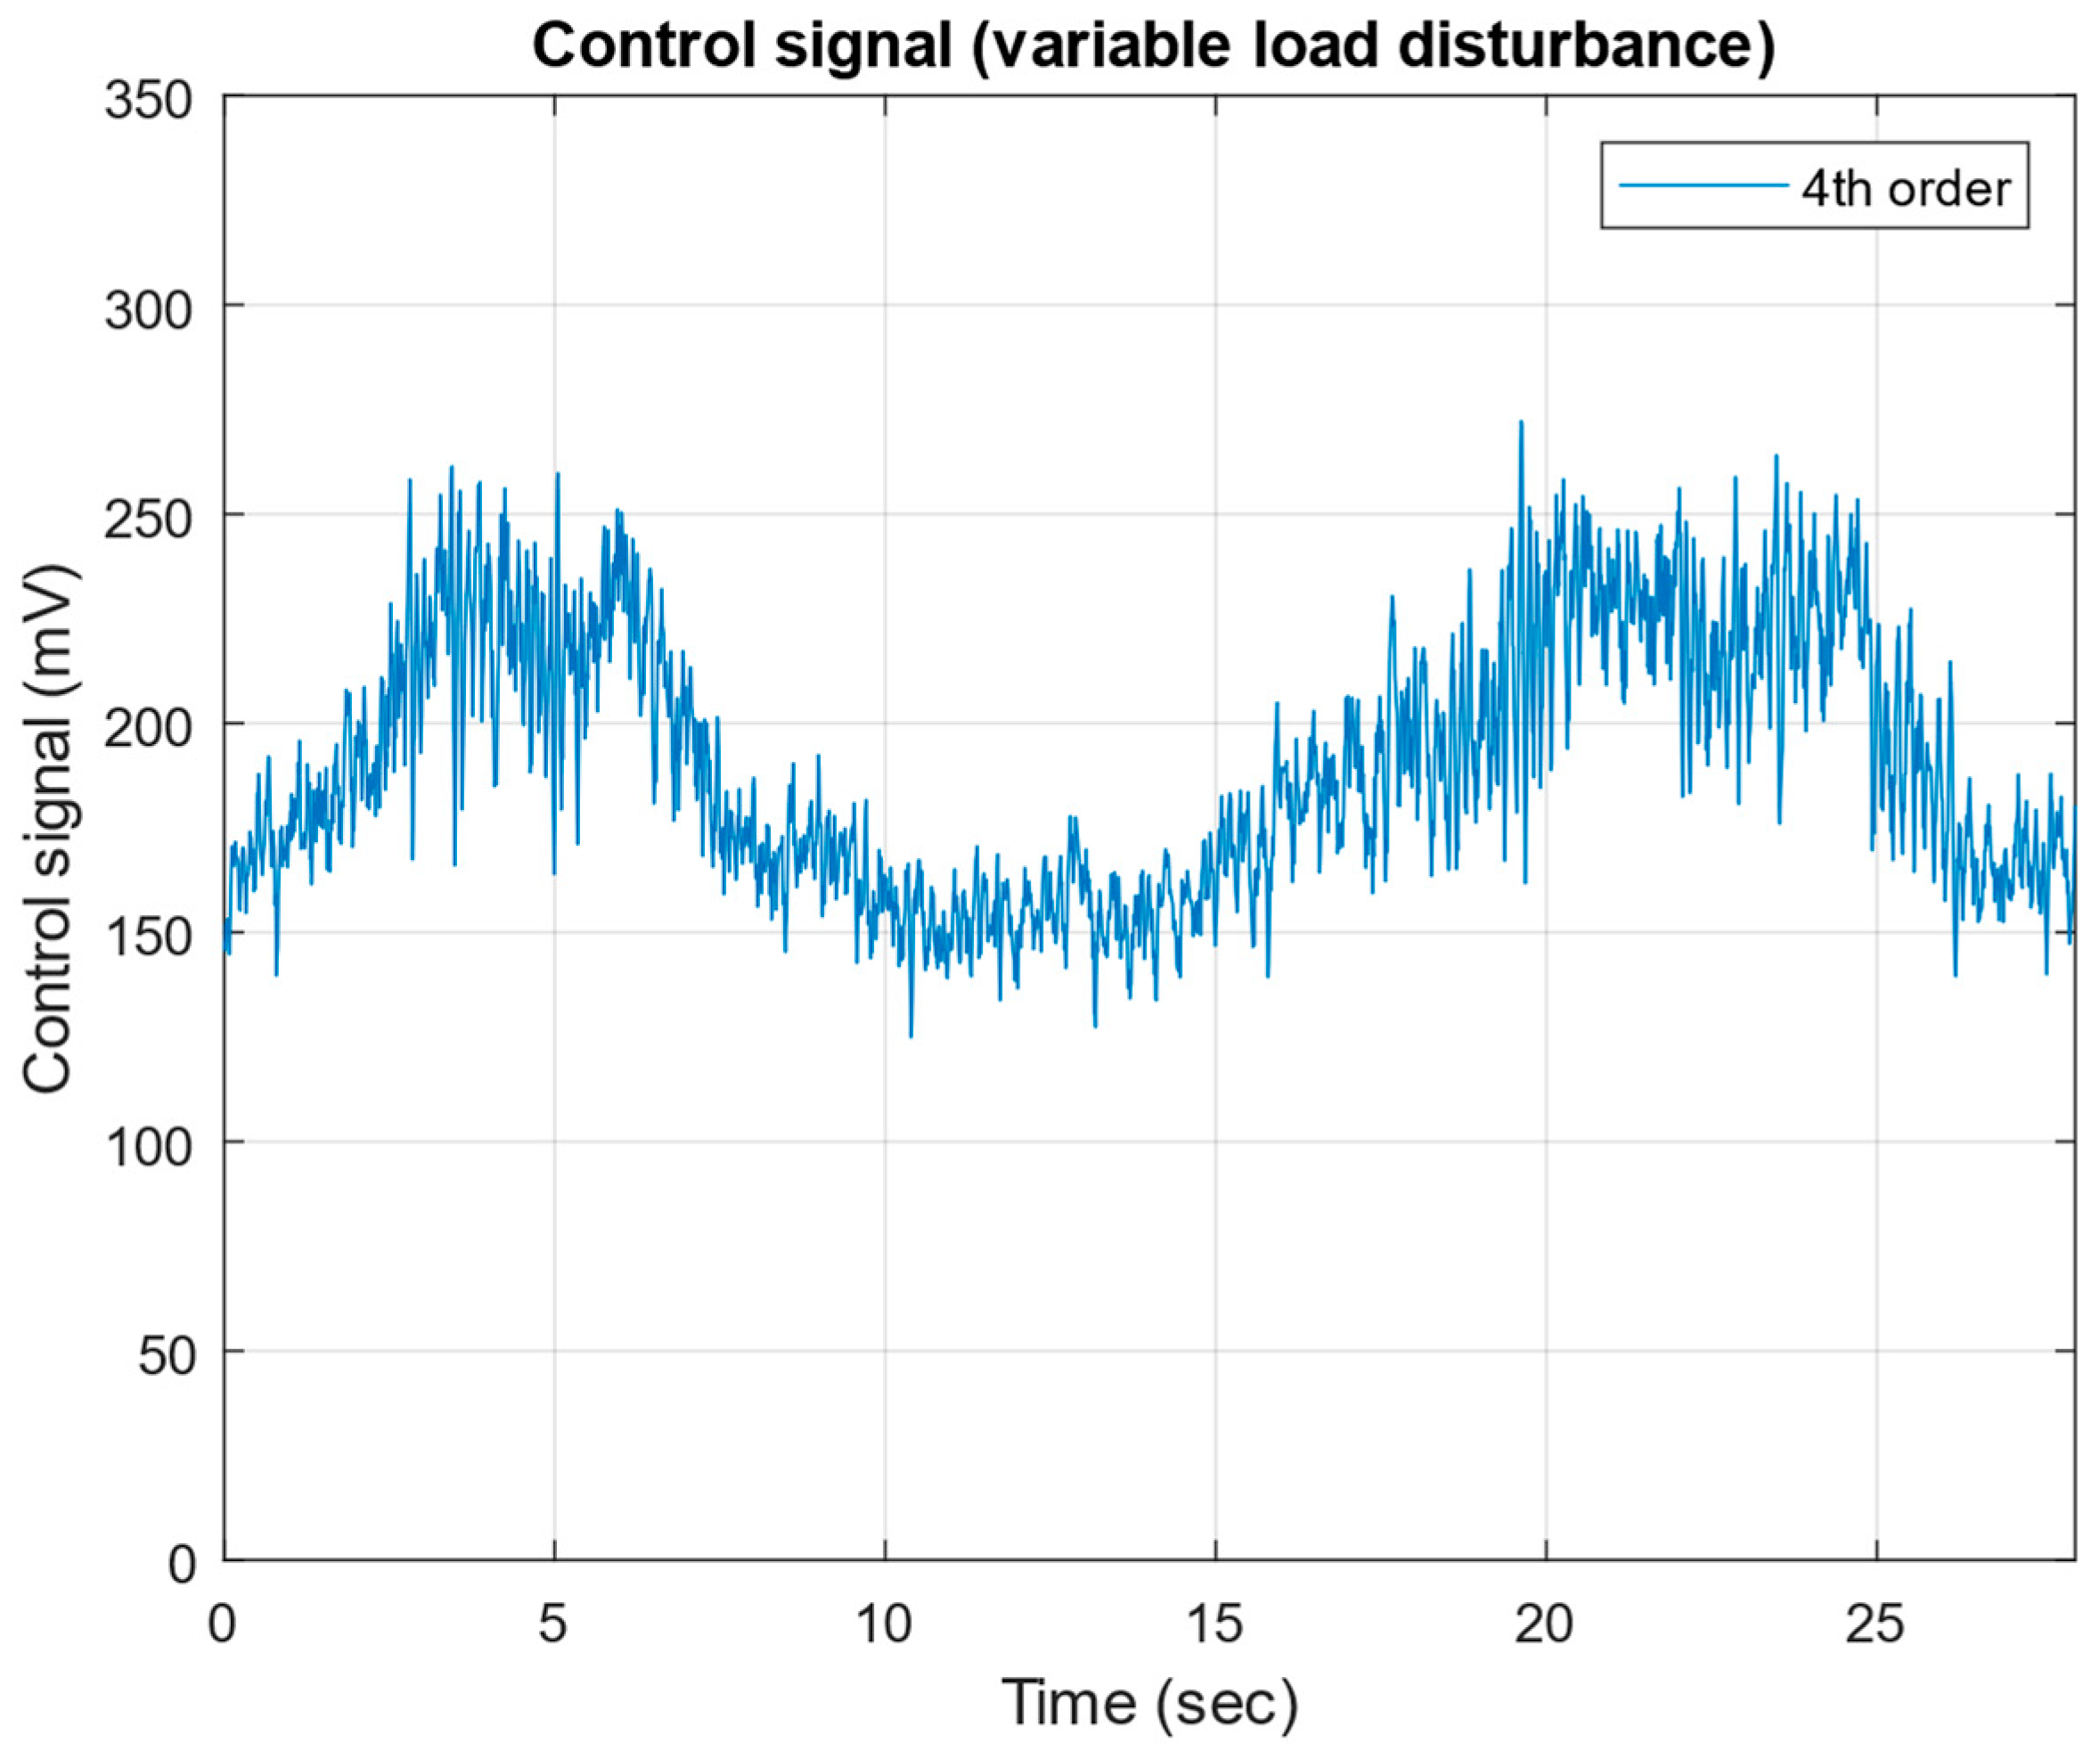
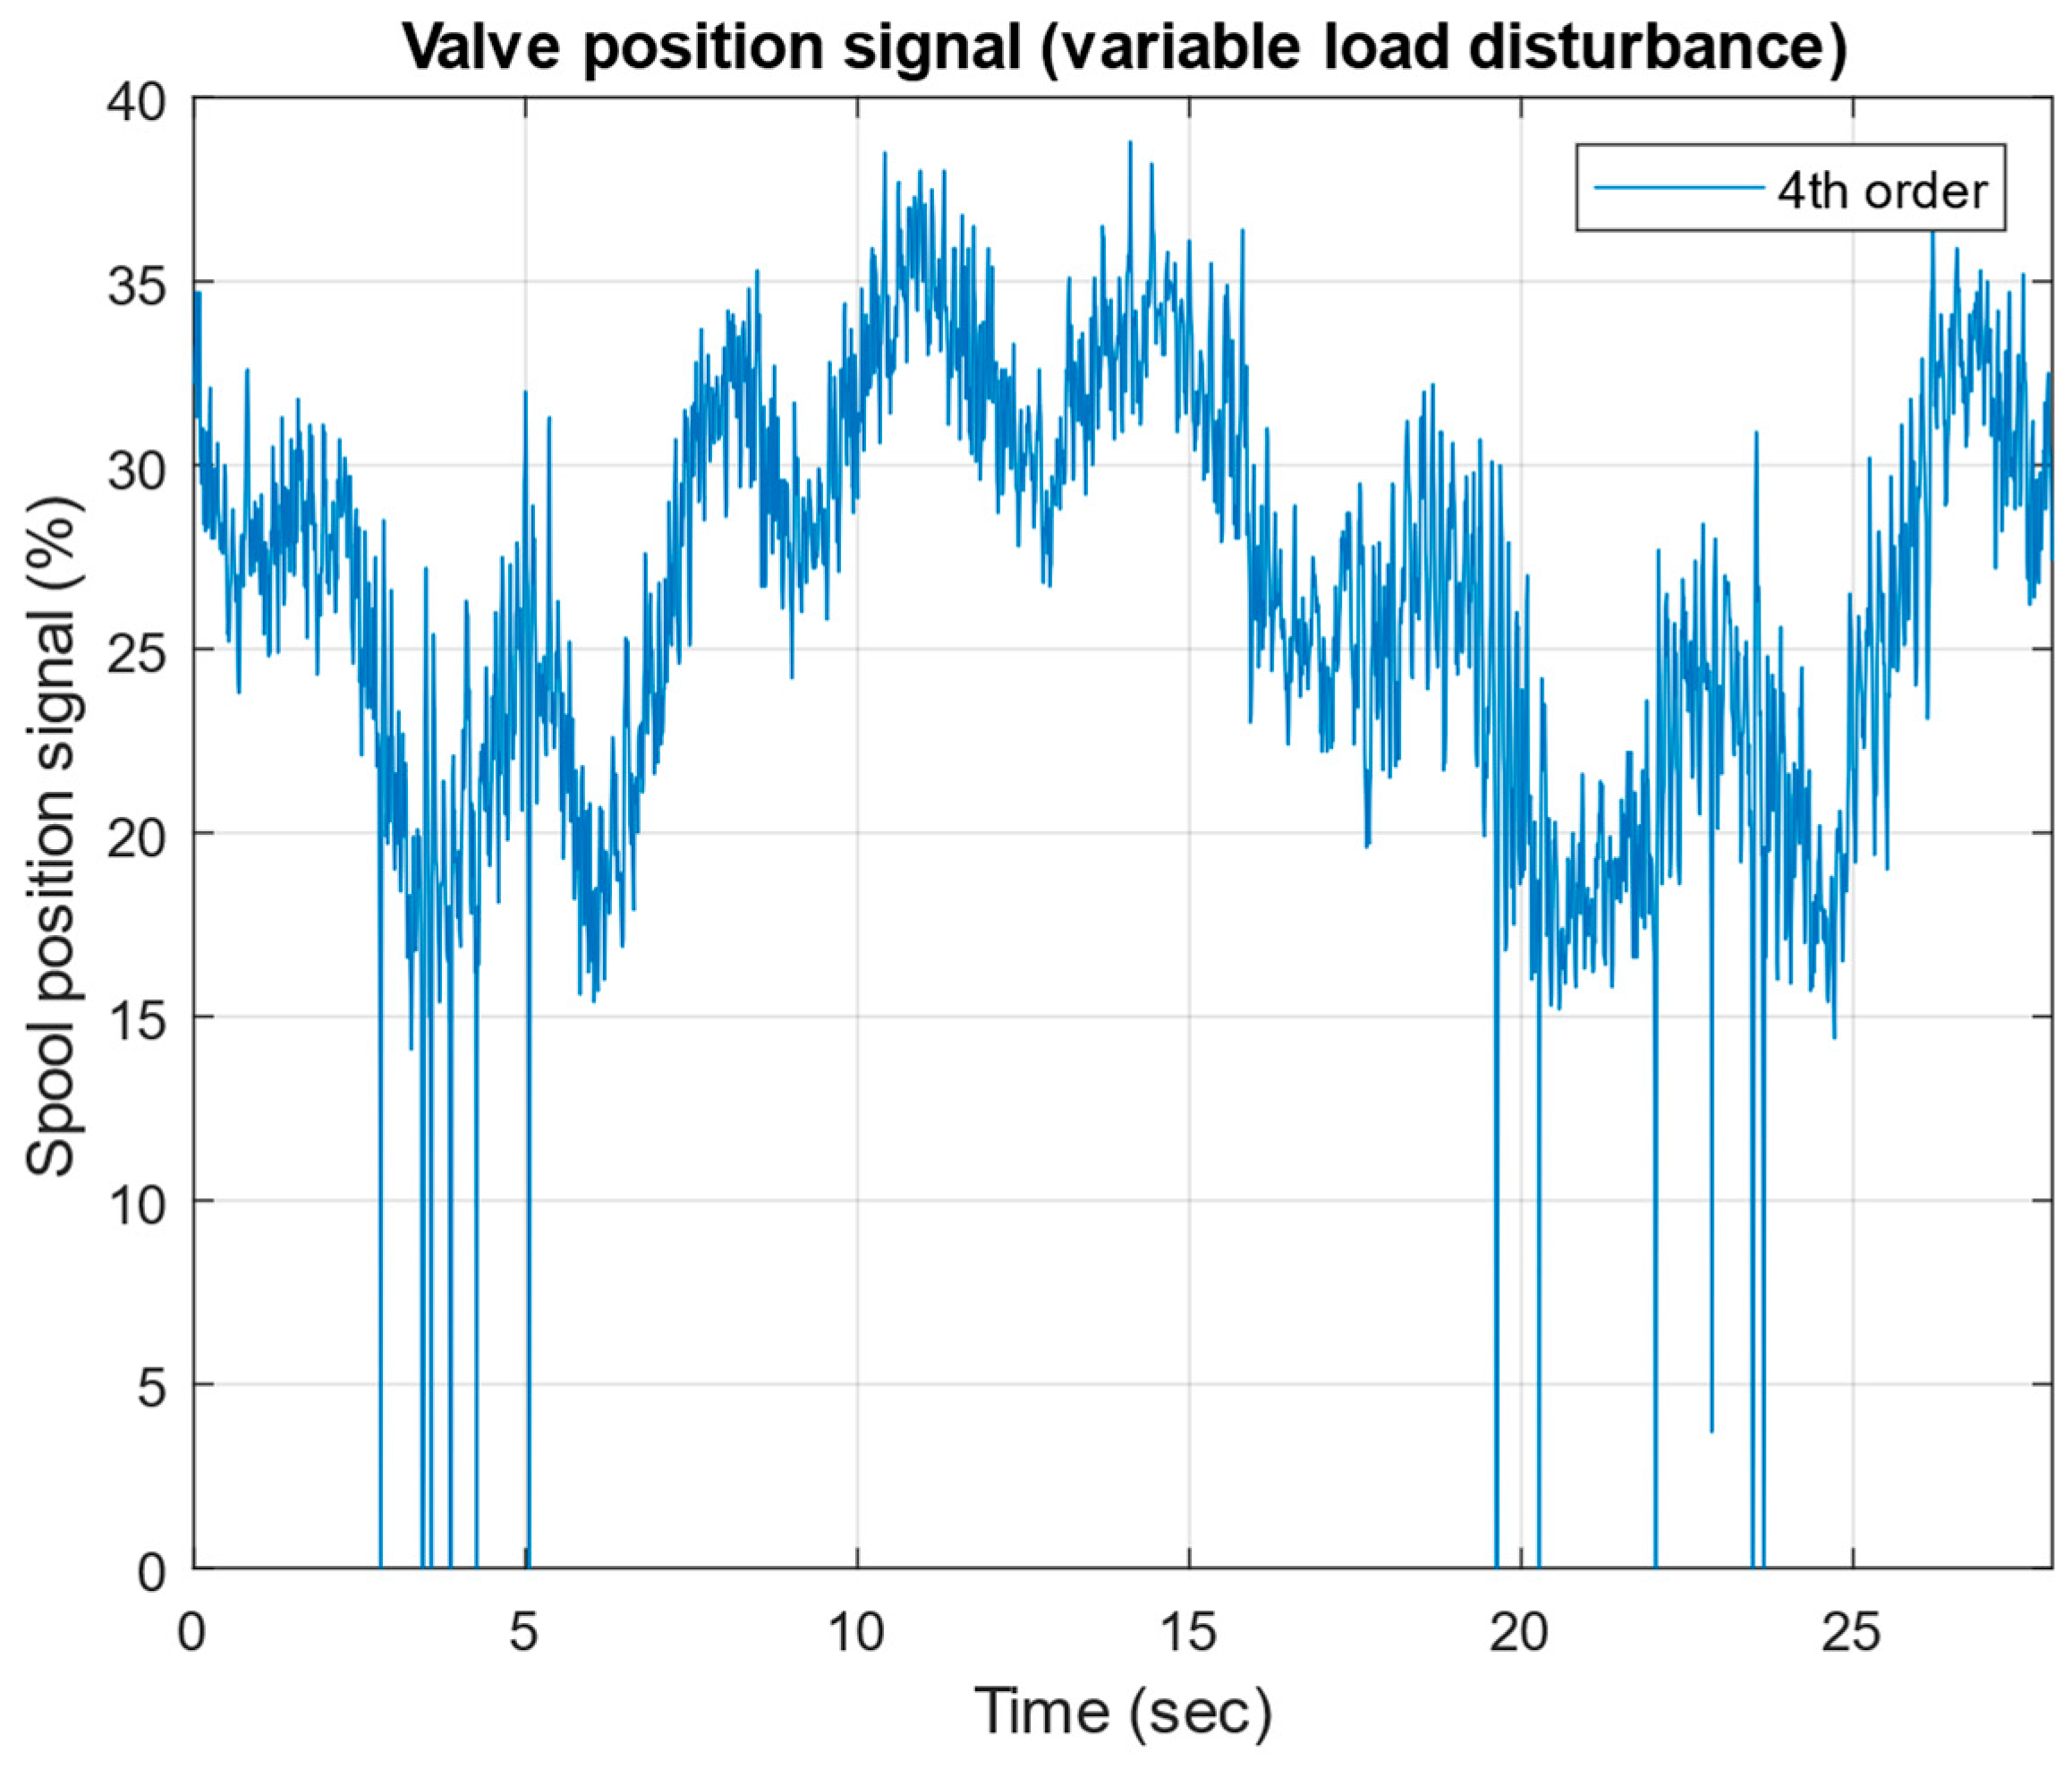
As can be seen from the experimental results, the 4th-order controller provides very good control performance, like that achieved with the 21st-order controller. In order to investigate the developed control system in a condition close to a real-world operation, an experiment with time-varying loading disturbance is performed. During the experiment, the flow rate reference has a constant value of 23 L/min, while the loading throttle valve is manually close from position 5 to position 3, and vice versa. In Figure 36, Figure 37, Figure 38 and Figure 39, the experimental results for the pump flow rate, output pressure, control signal, and proportional spool valve position are presented.
The analysis of the experimental results presented shows that the pump flow rate is insensitive to time-varying loading. In Figure 37, pump output pressure changes during various loading can be seen. At the same time, the controller is very fast, compensating for the deviation in the flow rate due to load (Figure 36). This is confirmed again in the control signal variations and proportional valve position presented in Figure 38 and Figure 39, respectively. It should be noted that when the control signal value increases, the spool valve is closed proportionally.

5. Conclusions

This study presents a novel approach for the robust control of axial piston pumps using a μ-controller design technique. The authors developed a laboratory test bench that enables the real-time control of an open-circuit axial piston pump via USB/CAN communication. The hydro-mechanical controller was replaced with an electro-hydraulic proportional valve controlled by an industrial microcontroller. A one-input, two-output model with multiplicative output uncertainty was estimated and validated from the experimental data at various loads using multivariable identification.
The μ-controller design was used to achieve robust stability and performance across a wide operating range. Controllers of the 21st, 6th, and 4th orders were implemented and compared experimentally under different loading conditions. All three controllers demonstrated a good flow rate tracking performance, with settling times of 0.2–0.3 s and minimal overshoot. The reduced-order controllers (6th and 4th) maintained a comparable performance to the full 21st-order controller, suggesting a successful order reduction. However, the lower-order controllers exhibited slightly more aggressive control actions and increased oscillations in the steady-state operation.
The experimental results showed that the control system maintained stability and acceptable tracking performance across various loading conditions, from high resistance (loading 2) to low resistance (loading 5). As the output resistance decreased, the system became more sensitive to disturbances, exhibiting increased flow rate variations and pressure oscillations. Despite this, all three controller orders demonstrated robustness in maintaining flow rate control. The fourth-order controller, surprisingly, showed the most stable valve position response, suggesting that the mechanical system’s natural damping may be better utilized by its characteristics. Overall, this study demonstrates the effectiveness of the μ-control approach for axial piston pumps and highlights the potential for implementing reduced-order controllers without significant performance degradation.
Future research directions could include the following: further investigation into the trade-offs between controller order reduction and performance, potentially exploring even lower-order controllers or alternative reduction techniques; the integration of adaptive control strategies to further improve performance across a wider range of operating conditions and disturbances; and the exploration of energy efficiency optimization techniques in conjunction with the robust control approach to enhance the overall system’s performance and sustainability.

Author Contributions

Conceptualization, A.M., T.S. and J.K.; methodology, J.K., A.M. and T.S.; software, J.K.; validation, A.M.; formal analysis, T.S., J.K. and A.M.; investigation, A.M., T.S. and J.K.; resources, A.M.; data curation, A.M.; writing—original draft preparation, T.S., A.M. and J.K.; writing—review and editing, J.K. and A.M.; visualization, A.M.; supervision, T.S.; project administration, A.M.; funding acquisition, T.S. All authors have read and agreed to the published version of the manuscript.

Funding

This work has been accomplished with financial support by the European Regional Development Fund within the Operational Programme “Bulgarian national recovery and resilience plan”, Procedure for direct provision of grants “Establishing of a network of research higher education institutions in Bulgaria”, under the Project BG-RRP-2.004-0005 “Improving the research capacity anD quality to achieve intErnAtional recognition and reSilience of TU-Sofia (IDEAS)”.

Data Availability Statement

When contacted, the authors can provide a particular dataset from the present article.

Conflicts of Interest

The authors declare no conflicts of interest.

References

  1. Findeisen, D.; Helduser, S. Ölhydraulik; Springer: Berlin/Heidelber, Germany, 2015. [Google Scholar]
  2. Skarpetis, M.G. Automatic Control of Hydraulic Systems; Nova Science Publishers Inc.: Hauppauge, NY, USA, 2023. [Google Scholar]
  3. Frankenfield, T. Using Industrial Hydraulics. In Rexroth Worldwide Hydraulics; Penton Publishing Inc.: New York, NY, USA, 1984. [Google Scholar]
  4. Tonyan, M. Electronically Controlled Proportional Valves; Marcel Dekker Inc.: New York, NY, USA, 1985. [Google Scholar]
  5. Ivantysyn, J.; Ivantysynova, M. Hydrostatic Pumps and Motors: Principles, Design, Performance, Modelling, Analysis, Control and Testing; Academia Books International: New Delhi, India, 2001. [Google Scholar]
  6. Manring, N. Fluid Power Pumps and Motors: Analysis, Design, and Control; McGraw-Hill Education: New York, NY, USA, 2013. [Google Scholar]
  7. Zhou, K.; Doyle, J. Robust and Optimal Control; Prentice Hall International: Upper Saddle River, NJ, USA, 1996. [Google Scholar]
  8. Petkov, P.; Slavov, T.s.; Kralev, J. Design of Embedded Robust Control Systems Using MATLAB®/Simulink®; IET Control: London, UK, 2018. [Google Scholar]
  9. Helian, B.; Mustalahti, P.; Mattila, J.; Chen, Z.; Yao, B. Adaptive robust pressure control of variable displacement axial piston pumps with a modified reduced-order dynamic model. Mechatronics 2022, 87, 102879. [Google Scholar] [CrossRef]
  10. Feng, Y.; Jian, Z.; Li, J.; Tao, Z.; Wang, Y.; Xue, J. Advanced Control Systems for Axial Piston Pumps Enhancing Variable Mechanisms and Robust Piston Positioning. Appl. Sci. 2023, 13, 9658. [Google Scholar] [CrossRef]
  11. Busquets, E.; Ivantysynova, M.; Handroos, H. Discontinuous projection-based adaptive robust control for displacement-controlled actuators. J. Dyn. Syst. Meas. Control Trans. ASME 2015, 137, 8. [Google Scholar] [CrossRef]
  12. Haggag, S.A. Robust control and modelling of a heavy equipment variable displacement pump hydraulic system. Int. J. Heavy Veh. Syst. 2011, 18, 288–302. [Google Scholar] [CrossRef]
  13. Guo, K.; Wei, J. Adaptive robust control of variable displacement pumps. In Proceedings of the American Control Conference, Washington, DC, USA, 17–19 June 2013. [Google Scholar]
  14. Park, S.; Lee, J.; Kim, J. Robust control of the pressure in a control-cylinder with direct drive valve for the variable displacement axial piston pump. Proc. Inst. Mech. Eng. Part I J. Syst. Control Eng. 2009, 223, 455–465. [Google Scholar] [CrossRef]
  15. Haack, S.; Meißelbach, A.; Bosch Rexroth, A.G. Industrial Hydraulics–Are we really on track concerning Industry 4.0? In Proceedings of the 11th International Fluid Power Conference, Aachen, Germany, 20–21 March 2018. [Google Scholar]
  16. Zhang, Q.; Kong, X.; Yu, B.; Ba, K.; Jin, Z.; Kang, Y. Review and Development Trend of Digital Hydraulic Technology. Appl. Sci. 2020, 10, 579. [Google Scholar] [CrossRef]
  17. Lu, W. Review of the Digital Hydraulics Technologies. Corso di laurea magistrale in Ingegneria Meccanica (Mechanical Engineering). Master’s Thesis, Politecnico di Torino, Torino, Italy, 2020. [Google Scholar]
  18. Hershberger, T. Mobile Hydraulics: Challenges and Opportunities: Equipment electrification will lead to an integrated approach. Hydraul. Pneum. 2020, 73, 20–25. [Google Scholar]
  19. Belan, H.C.; Locateli, C.C.; Lantto, B.; Krus, P.; de Negri, V.J. Digital secondary control architecture for aircraft application. In Proceedings of the 7th Workshop on Digital Fluid Power, Linz, Austria, 26–27 February 2015. [Google Scholar]
  20. Kordak, R. Hydrostatic Drives with Control of the Secondary Unit. In The Hydraulic Trainer Vol.6; Mannesmann Rexroth GmbH: Lohr a. Main, Germany, 1996; Volume 6. [Google Scholar]
  21. Sun, Z.; Zeng, Q.; Wan, L.; Xiao, Y. Dynamic Response Analysis of the Bi-Tandem Axial Piston Pump with Dual-Loop Positive Flow Control under Pressure Disturbance. Actuators 2023, 12, 260. [Google Scholar] [CrossRef]
  22. Khalil, M.K.B.; Yurkevich, V.D.; Svoboda, J.; Bhat, R.B. Implementation of single feedback control loop for constant power regulated swash plate axial piston pumps. Int. J. Fluid Power 2002, 3, 27–36. [Google Scholar] [CrossRef]
  23. Mitov, A.; Kralev, J.; Slavov, T.S.; Angelov, I. Design of Embedded Control System for Open Circuit Axial Piston Pump. In Proceedings of the 2022 22nd International Symposium on Electrical Apparatus and Technologies (SIELA), Bourgas, Bulgaria, 1–4 June 2022. [Google Scholar]
  24. Zeiger, G.; Akers, A. The Application of Linear Optimal Control Techniques to Axial Piston Pump Controller Design; SAE Technical Papers; SAE International: Warrendale, PA, USA, 1989. [Google Scholar]
  25. Lin, S.; Akers, A. Optimal control theory applied to pressure-controlled axial piston pump design. J. Dyn. Syst. Meas. Control Trans. ASME 1990, 112, 475–481. [Google Scholar] [CrossRef]
  26. Berg, H.; Ivantysynova, M. Design and testing of a robust linear controller for secondary controlled hydraulic drive. Proc. Inst. Mech. Eng. Part I J. Syst. Control Eng. 1999, 213, 375–385. [Google Scholar] [CrossRef]
  27. Zeiger, G.; Akers, A. Dynamic Analysis of an Axial Piston Pump Swashplate Control. Proc. Inst. Mech. Eng. Part I J. Syst. Control Eng. 1986, 200, 49–58. [Google Scholar] [CrossRef]
  28. Ljung, L. System Identification: Theory for the User, 2nd ed.; Prentice Hall: Hoboken, NJ, USA, 1999. [Google Scholar]
  29. Mitov, A.; Kralev, J.; Slavov, T.S. Identification of Variable Displacement Axial-Piston Pump with Proportional Valve Control. In Proceedings of the 14th International Scientific Conference on Aeronautics, Automotive, and Railway Engineering and Technologies, Sozopol, Bulgaria, 10–13 September 2022; Volume 3064. [Google Scholar]
  30. Bensaad, D.; Soualhi, A.; Guillet, F. A new leaky piston identification method in an axial piston pump based on the extended Kalman filter. Meas. J. Int. Meas. Confed. 2019, 148, 106921. [Google Scholar] [CrossRef]
  31. Koivumäki, J.; Mattila, J. Adaptive and nonlinear control of discharge pressure for variable displacement axial piston pumps. J. Dyn. Syst. Meas. Control Trans. ASME 2017, 139, 10. [Google Scholar] [CrossRef]
  32. Berg, H.; Ivantysynova, M. Robust closed loop speed and angular position control for variable displacement hydraulic motors supplied from a constant pressure mains system. Olhydraulik Und Pneum. 1999, 43, 405–410. [Google Scholar]
  33. Zhang, R.; Alleyne, A.; Prasetiawan, E. Modeling and H2/H MIMO control of an earthmoving vehicle powertrain. J. Dyn. Syst. Meas. Control Trans. ASME 2002, 124, 625–636. [Google Scholar] [CrossRef]
  34. Lennevi, J.; Palmberg, J.-O. Application and implementation of LQ design method for the velocity control of hydrostatic transmissions. Proc. Inst. Mech. Eng. Part I J. Syst. Control Eng. 1995, 209, 255–268. [Google Scholar] [CrossRef]
  35. Heybroek, K.; Larsson, J.; Palmberg, J.-O. Open Circuit Solution for Pump Controlled Actuators. In Proceedings of the 4th FPNI-PhD Symposium, Sarasota, FL, USA, 13–17 June 2006; pp. 27–40. [Google Scholar]
  36. Zhang, P.; Li, Y. Research on Control Methods for the Pressure Continuous Regulation Electrohydraulic Proportional Axial Piston Pump of an Aircraft Hydraulic System. Appl. Sci. 2019, 9, 1376. [Google Scholar] [CrossRef]
  37. Kemmetmüller, W.; Fuchshumer, F.; Kugi, A. Nonlinear pressure control of self-supplied variable displacement axial piston pumps. Control Eng. Pract. 2010, 18, 84–93. [Google Scholar] [CrossRef]
  38. Wei, J.; Guo, K.; Fang, J.; Tian, Q. Nonlinear supply pressure control for a variable displacement axial piston pump. Proc. Inst. Mech. Eng. Part I J. Syst. Control Eng. 2015, 229, 614–624. [Google Scholar] [CrossRef]
  39. Mitov, A.; Slavov, T.; Kralev, J. Comparison of Advanced Multivariable Control Techniques for Axial-Piston Pump. Processes 2024, 12, 1797. [Google Scholar] [CrossRef]
  40. Rexroth Bosch Group. Pressure and Flow Control System; Technical Data Sheet, RE 30630; Rexroth Bosch Group: Lohr am Main, Germany, 2015. [Google Scholar]
  41. Rexroth Bosch Group. Proportional Directional Valves, Direct Operated, with Electrical Position Feedback as Pilot Control Valve for Control Systems SY(H)DFE; Technical Data Sheet, RE 29016; Rexroth Bosch Group: Lohr am Main, Germany, 2019. [Google Scholar]
  42. Mitov, A.; Slavov, T.; Kralev, J. Rapid Prototyping of H Algorithm for Real-Time Displacement Volume Control of Axial Piston Pumps. Algorithms 2023, 16, 120. [Google Scholar] [CrossRef]
  43. Danfoss. Plus+1 Controllers MC012-020 and 022; Data Sheet, 11077167, Rev DA; Danfoss: Nordborg, Denmark, 2013. [Google Scholar]
  44. Ljung, L. System Identification Toolbox™ User’s Guide; The MathWorks Inc.: Natick, MA, USA, 2016. [Google Scholar]
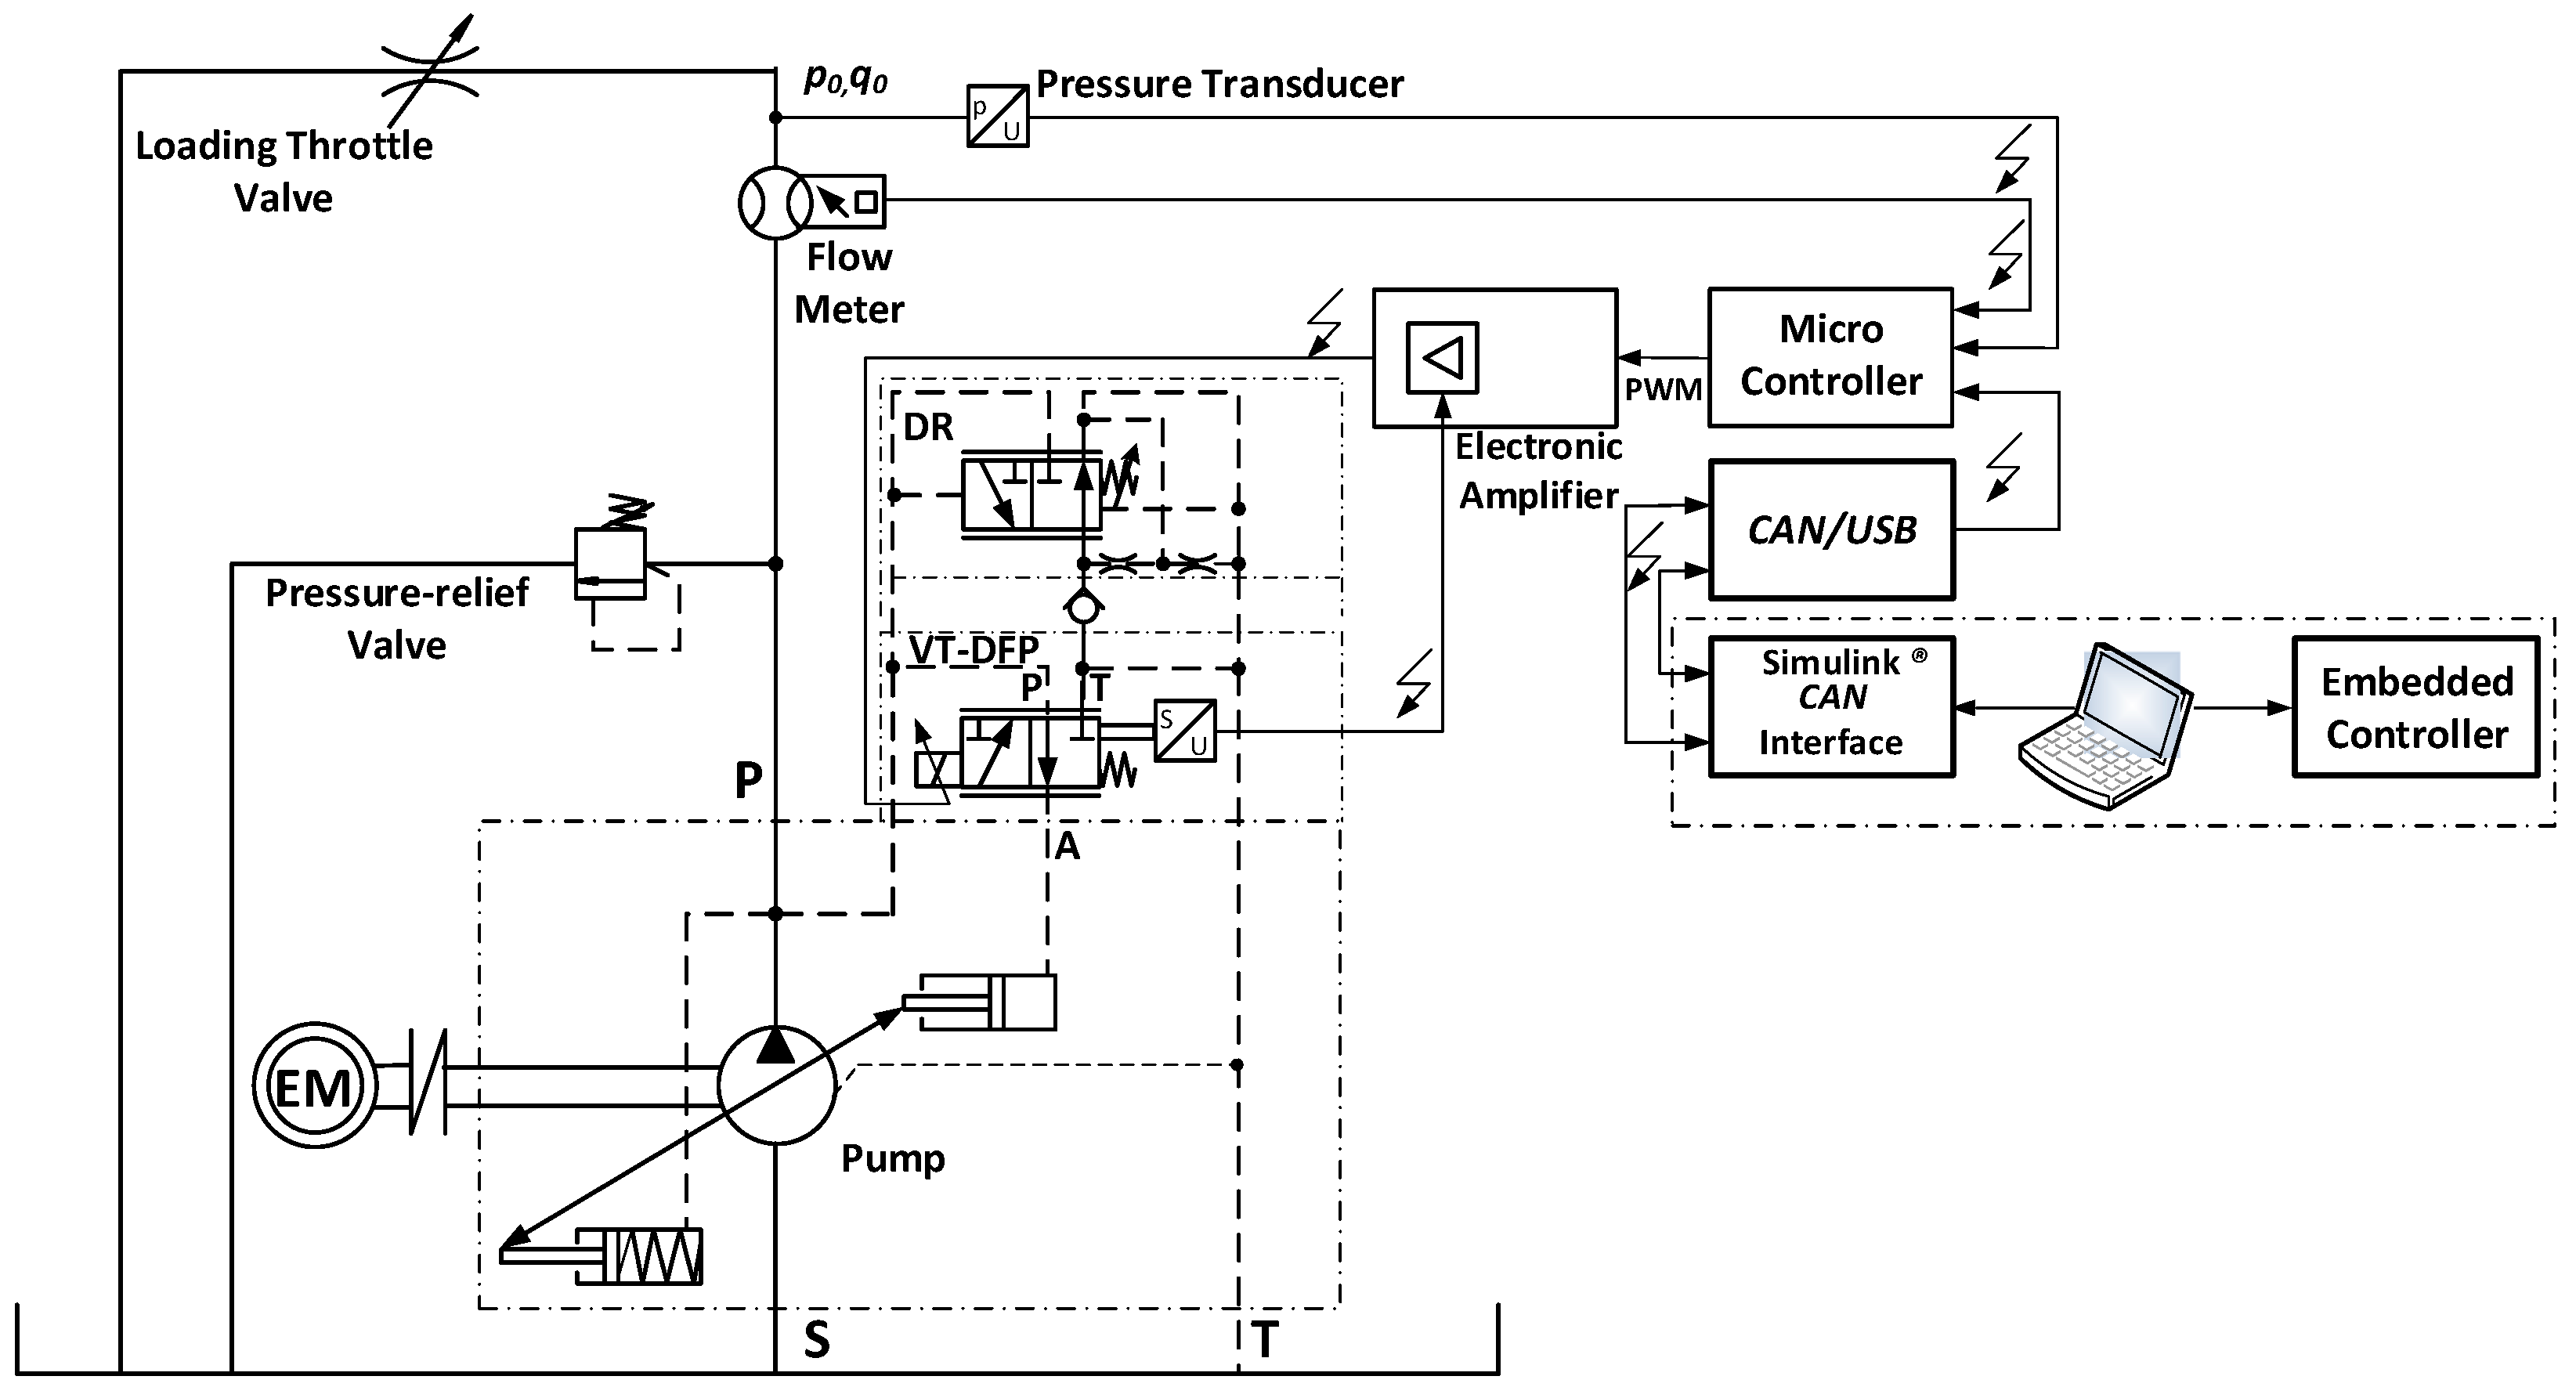
Figure 1. Hydraulic circuit diagram of the laboratory test bench.
Mathematics 13 00643 g001
Figure 2. Centered input–output data used for discrete time model estimation.
Mathematics 13 00643 g002
Figure 3. Comparison between measured outputs and simulated model outputs.
Mathematics 13 00643 g003
Figure 4. Autocorrelation and cross-correlation tests of residual errors.
Mathematics 13 00643 g004
Figure 5. Exact maximum perturbation and approximated one in pump flow rate channel.
Mathematics 13 00643 g005
Figure 6. Exact maximum perturbation and approximated one in pump pressure channel.
Mathematics 13 00643 g006
Figure 7. Thirty randomly chosen frequency responses of the estimated uncertain model with respect to the pump flow rate channel.
Mathematics 13 00643 g007
Figure 8. Thirty randomly chosen frequency responses of the estimated uncertain model with respect to the pump pressure channel.
Mathematics 13 00643 g008
Figure 9. Detailed structure scheme for μ-controller design.
Mathematics 13 00643 g009
Figure 10. Generalized structure of uncertain control system.
Mathematics 13 00643 g010
Figure 11. Structure of uncertain control system.
Mathematics 13 00643 g011
Figure 12. Singular values of μ -controllers.
Mathematics 13 00643 g012
Figure 13. Hankel singular values of designed μ -controller.
Mathematics 13 00643 g013
Figure 14. Singular values of full-order and reduced-order μ -controllers.
Mathematics 13 00643 g014
Figure 15. Upper bounds evaluated for robust stability test of closed-loop systems with full-order and reduced-order controllers.
Mathematics 13 00643 g015
Figure 16. Upper bounds evaluated for robust performance test of closed-loop systems with full-order and reduced-order controllers.
Mathematics 13 00643 g016
Figure 17. Output sensitivities of control systems with full-order and reduced-order controllers.
Mathematics 13 00643 g017
Figure 18. Complementary sensitivities of control systems with full-order and reduced-order controllers.
Mathematics 13 00643 g018
Figure 19. Control signal sensitivities of systems with full-order and reduced-order controllers.
Mathematics 13 00643 g019
Figure 20. Transient responses of systems with full-order and reduced-order controllers.
Mathematics 13 00643 g020
Figure 21. Control signal of systems with full-order and reduced-order controllers.
Mathematics 13 00643 g021
Figure 22. Laboratory test setup.
Mathematics 13 00643 g022
Figure 23. Flow rate experimental results with different order controller at loading condition 2.
Mathematics 13 00643 g023
Figure 24. Flow rate experimental results with different order controller at loading condition 3.
Mathematics 13 00643 g024
Figure 25. Flow rate experimental results with different order controller at loading condition 4.
Mathematics 13 00643 g025
Figure 26. Flow rate experimental results with different order controller at loading condition 5.
Mathematics 13 00643 g026
Figure 27. Control signal experimental results with 21st-order controller at different loading conditions.
Mathematics 13 00643 g027
Figure 28. Control signal experimental results with 6th-order controller at different loading conditions.
Mathematics 13 00643 g028
Figure 29. Control signal experimental results with 4th-order controller at different loading conditions.
Mathematics 13 00643 g029
Figure 30. Proportional valve position experimental results with 21st-order controller at different loading conditions.
Mathematics 13 00643 g030
Figure 31. Proportional valve position experimental results with 6th-order controller at different loading conditions.
Mathematics 13 00643 g031
Figure 32. Proportional valve position experimental results with 4th-order controller at different loading conditions.
Mathematics 13 00643 g032
Figure 33. Pump output pressure experimental results with 21st-order controller at different loading conditions.
Mathematics 13 00643 g033
Figure 34. Pump output pressure experimental results with 6th-order controller at different loading conditions.
Mathematics 13 00643 g034
Figure 35. Pump output pressure experimental results with 4th-order controller at different loading conditions.
Mathematics 13 00643 g035
Figure 36. Pump flow rate experimental results with 4th-order controller at varying loading conditions.
Mathematics 13 00643 g036
Figure 37. Pump output pressure experimental results with 4th-order controller at varying loading conditions.
Mathematics 13 00643 g037
Figure 38. Control signal experimental results with 4th-order controller at varying loading conditions.
Mathematics 13 00643 g038
Figure 39. Proportional valve position results with 4th-order controller at varying loading conditions.
Mathematics 13 00643 g039
Table 1. Summary of results from D-K iterations.
IterationAchieved γ μ PeakD-Scale OrderController Order
16.4621.7510019
20.6460.5900019
30.5640.5632221
40.5650.5630221
50.5710.5710221
Disclaimer/Publisher’s Note: The statements, opinions and data contained in all publications are solely those of the individual author(s) and contributor(s) and not of MDPI and/or the editor(s). MDPI and/or the editor(s) disclaim responsibility for any injury to people or property resulting from any ideas, methods, instructions or products referred to in the content.