Based on the mathematical model and the main network parameters of Company X and Company T, it is easy to see that the number of nodes and edges of Company T is significantly larger than that of Company X, which indicates that the supply chain network of Company T is more complex, and the collaboration and management of the enterprise nodes are relatively more difficult; while Company X, which has fewer nodes, may have a more concise network structure and a lower complexity of collaboration, but there may be a lack of information flow. The average path length of Company T is larger than that of Company X, which indicates that there may be greater delays in information flow and less efficient collaboration among nodes, while the shorter average path length indicates that Company X has a more compact network structure and faster information transfer. However, too short paths may lead to overdependence on core nodes, exposing them to greater loads and risks. Therefore, a better path length should strike a balance between information flow efficiency and network robustness. The clustering coefficient of Company T is slightly higher than that of Company X, which indicates that the collaboration between the enterprise nodes in its network is closer, and it has a stronger ability to share resources and exchange technology; while a lower clustering coefficient may imply that Company X’s network has poorer local connectivity and less efficient cooperation, but it may also make it have higher flexibility and decentralization characteristics. The number of eigenvalues of Company T is significantly higher than that of Company X, which indicates that its supply chain network has higher complexity and higher coordination costs, while the fewer eigenvalues of Company X may imply that its network is more likely to reach a synchronized state and has higher collaboration stability.
4.1.1. Optimize the Network Structure
The network coupling matrix L is one of the core elements of the supply chain network, reflecting the supply–demand cooperative relationship between the enterprises in the supply chain. The topology of the network directly determines the collaboration efficiency and synchronization ability of the supply chain. According to the complex network theory “structure determines function”, different network structures have different synchronization characteristics and dynamic characteristics of behavior; therefore, by optimizing the network structure, the supply chain collaboration ability can be fundamentally improved. Specific strategies include the following points.
First, one can reduce the average distance of the network and improve the clustering coefficient. The shorter the average distance of the network, the faster the information circulation and the more rapid the system response. At the same time, a higher clustering coefficient means that the nodes in the network are more closely connected to each other and the information dissemination is more efficient. In supply chain networks, the synchronization ability and information flow efficiency of the supply chain can be significantly improved by adjusting the connection method, shortening the average path length in the network and increasing the clustering coefficient between nodes. While maintaining the growth of the supply chain topology, the node connection scheme is preferred, and the clustering characteristics of the network are used to optimize the relationship between the nodes to ensure the high efficiency and low time lag of information exchange.
Second, one can optimize the eigenvalues of the node connection and coupling matrix. During the evolution of the supply chain network, the synchronization ability of the network will gradually decrease with the addition of new enterprises [
26]. In order to maintain the synchronization performance of the network, the optimal connection should be preferred when new enterprises join the network, i.e., to ensure that the cooperative relationship established between the newly joined enterprises and the existing enterprises in the supply chain can minimize the loss of synchronization performance of the system. This can be achieved by adjusting the second-largest eigenvalue of the coupling matrix L. When selecting new enterprises to establish cooperation with existing enterprises, priority is given to reducing the second-largest eigenvalue of the coupling matrix so as to enhance the synchronization of the supply chain as a whole.
Third, one can reduce the load of key nodes by reducing the maximum meson number. Excessive loads of key nodes in the supply chain may lead to a decrease in the synchronization efficiency of the system, especially in unexpected events, and the overload of key nodes may become a bottleneck and affect the operation of the whole network. Therefore, reducing the load of key nodes and lowering the maximum number of mediators in the network are important measures to optimize the synchronization of supply chain networks. By optimizing the node connections in the network, the load of key nodes is reasonably distributed to avoid the key nodes from becoming a single point of failure, so as to guarantee the stability and efficiency of the supply chain [
27]. Specifically, the following two optimization methods are given in this paper.
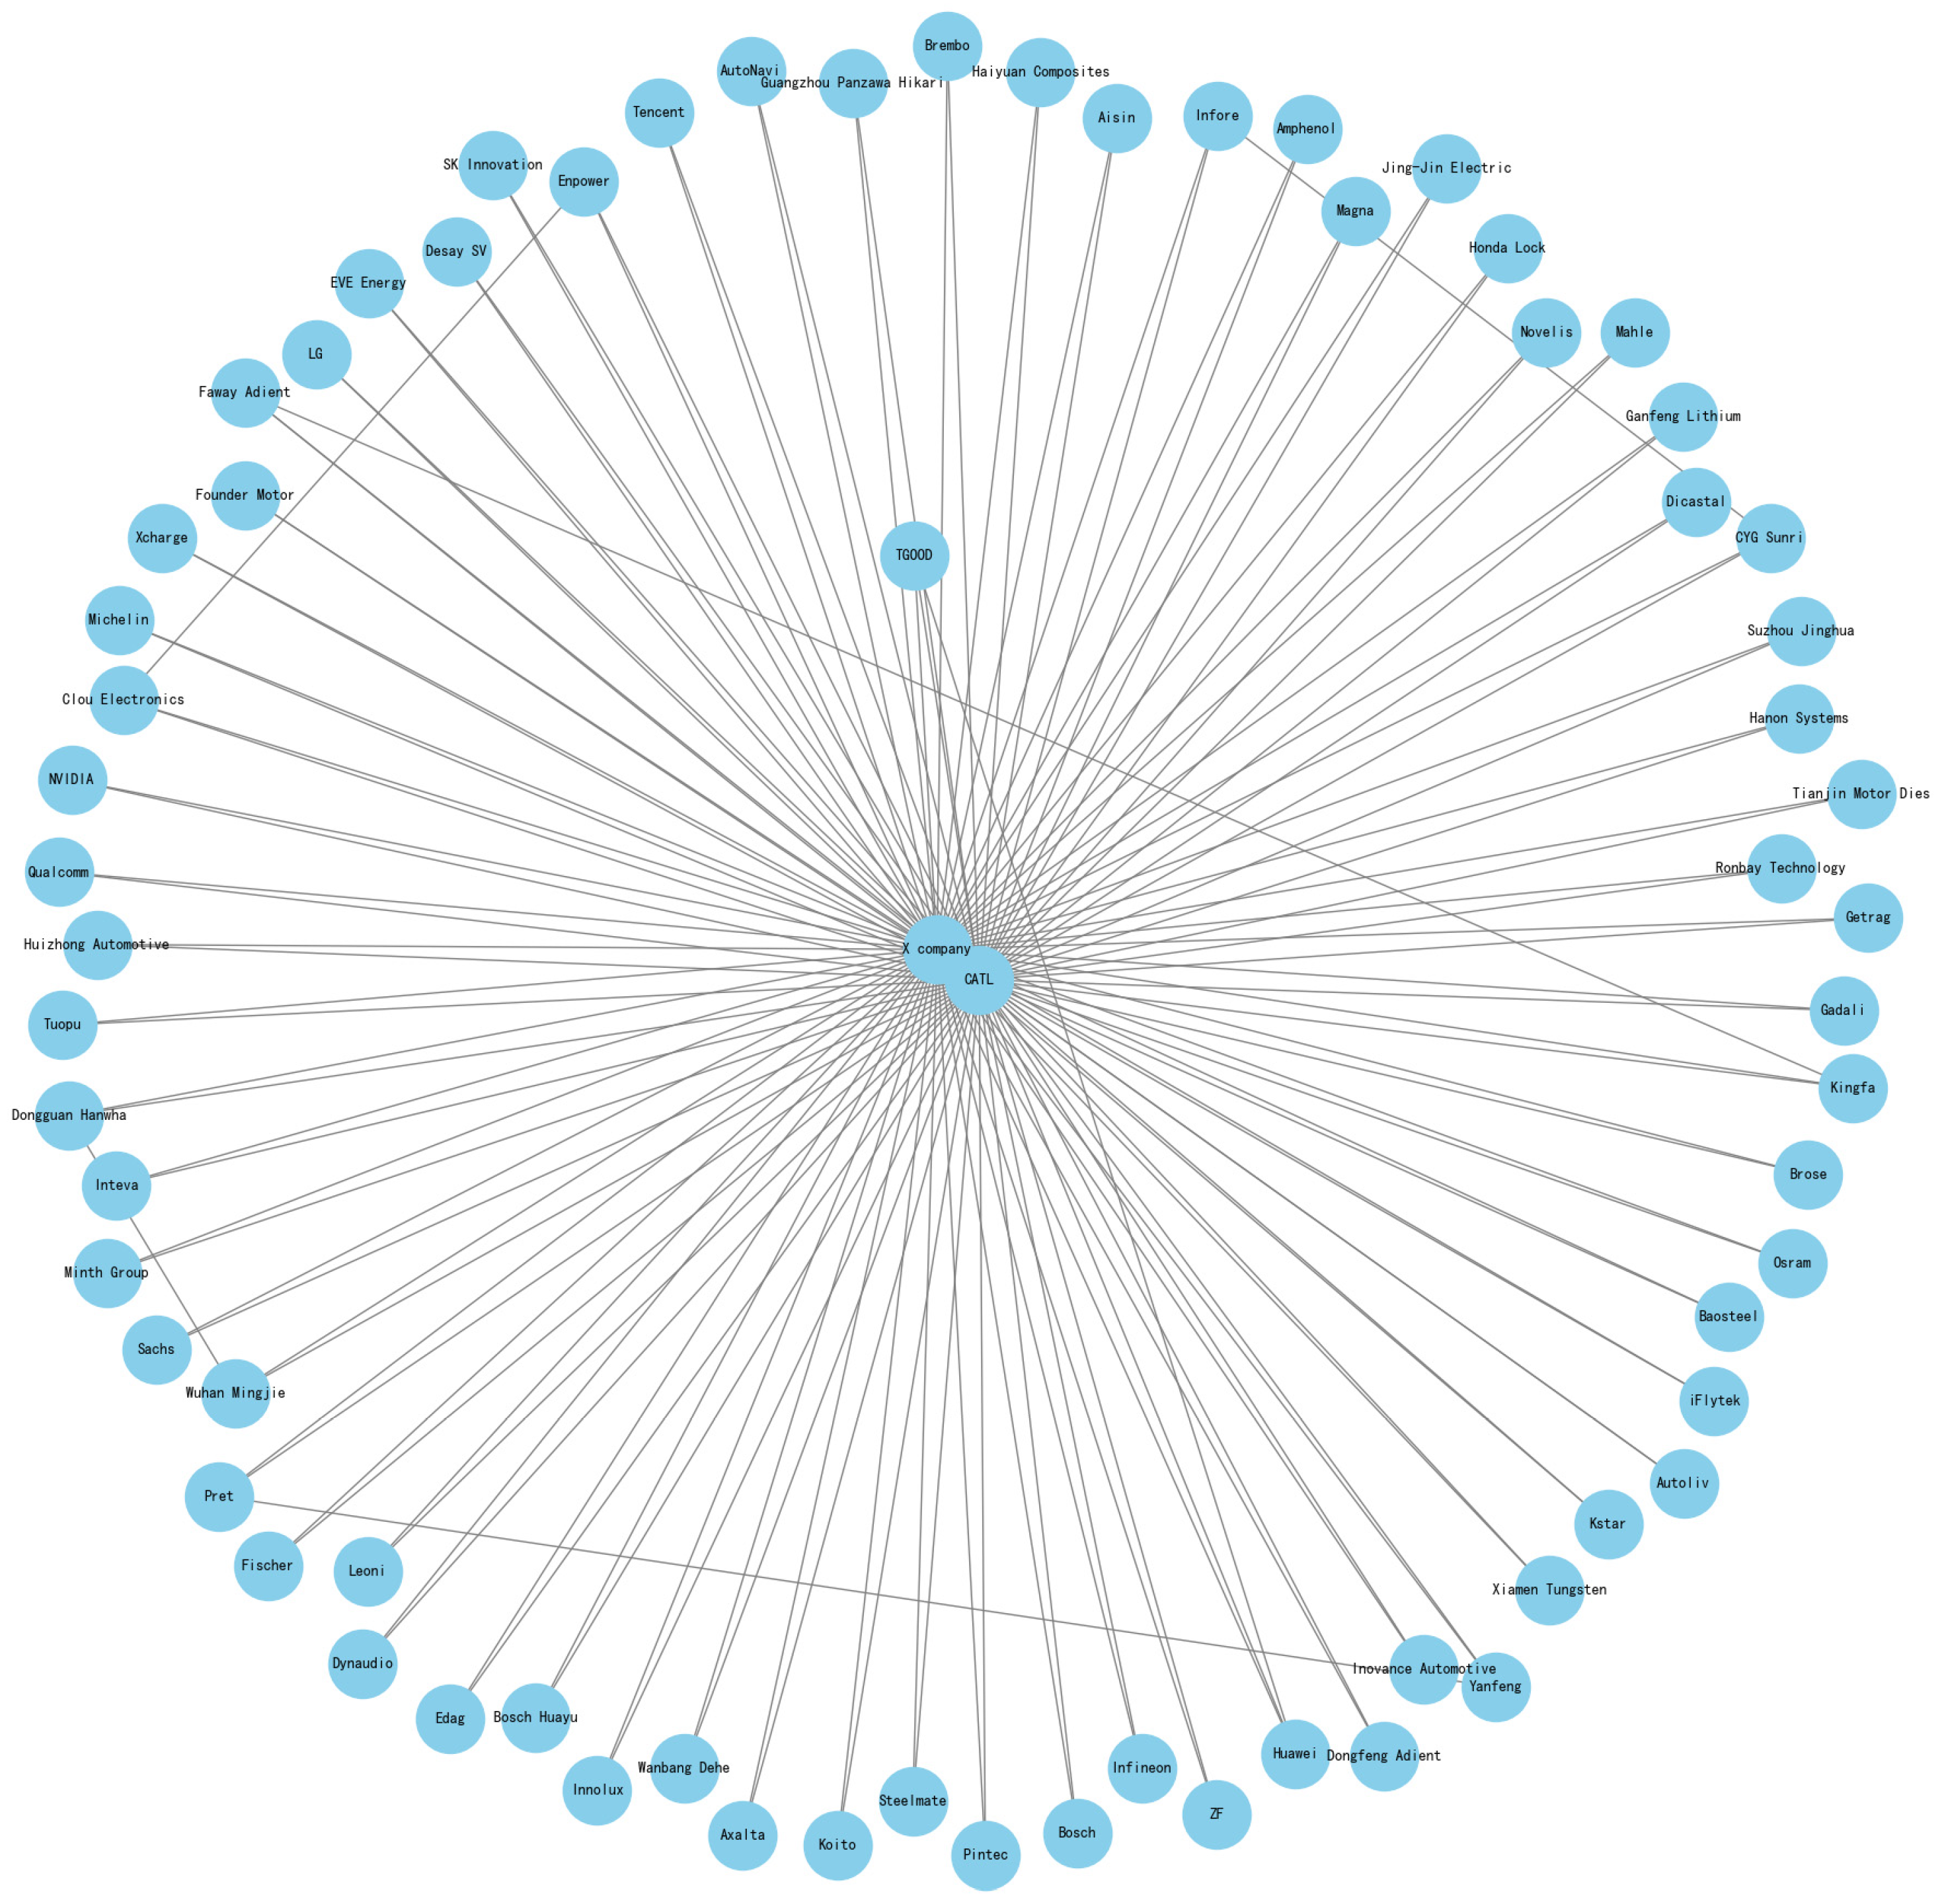
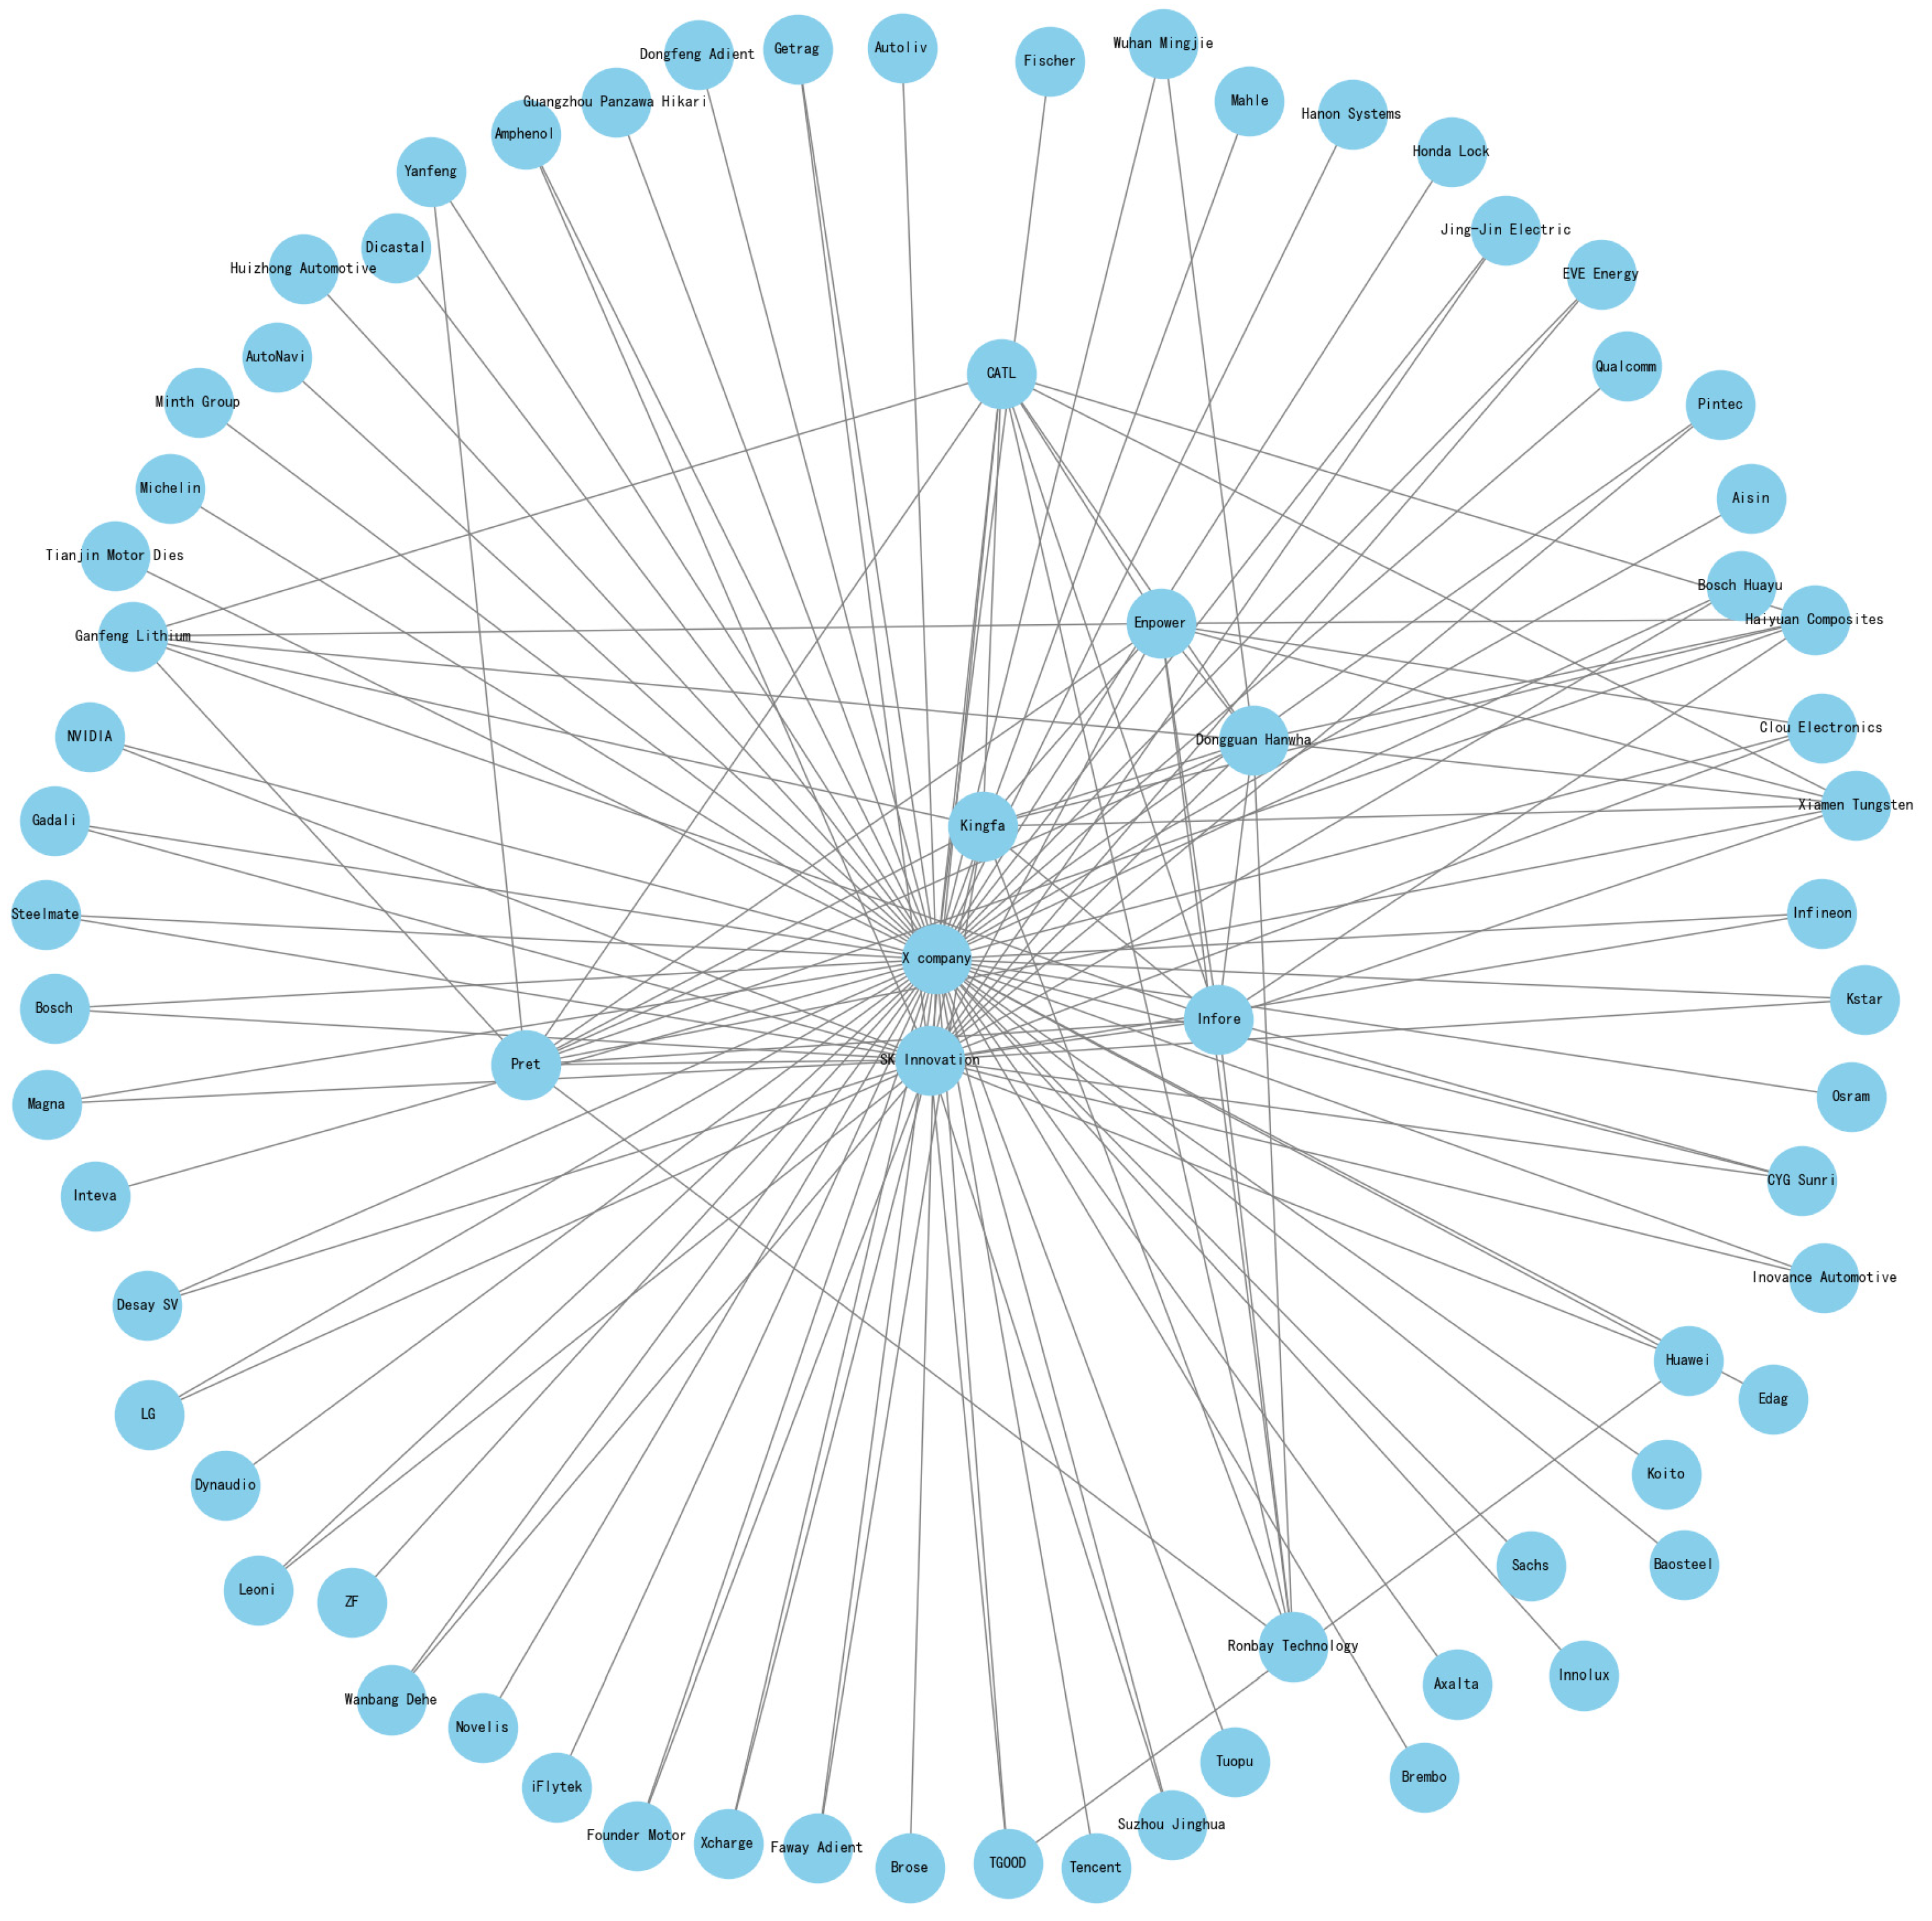
Optimization is carried out by optimizing nodes with low connectivity (degree < 3) with overloaded nodes with high connectivity (degree > 5) in order to reduce bottlenecks in the network. The constraint is that the two nodes must be currently unconnected to each other. The average path length of the corresponding network structure of Company X is 2.23, and the clustering coefficient is 0.06. The most heavily loaded node is “Company X”, which is “SK Korea”. The most heavily loaded node is “Company X”, which connects “SK Korea”, “Ningbo Rongbai”, “Changyuan Shenrui”, “Amphenol”, “Qunchuang” and “Company X”. “Company X”, “SK Korea”, “Ganfeng Lithium”, “Haiyuan Composites”, etc., are connected with “Ningde Times”. The average path length of the new network structure is 1.94, and the clustering coefficient is 0.97. The optimized network structure of Company X that corresponds to the network connection diagram is shown in
Figure 8.
The topological coupling matrix
of its network is stored according to the Compressed Sparse Row and the storage matrix is as follows:
The column index matrix is as follows:
The row start position index matrix is as follows:
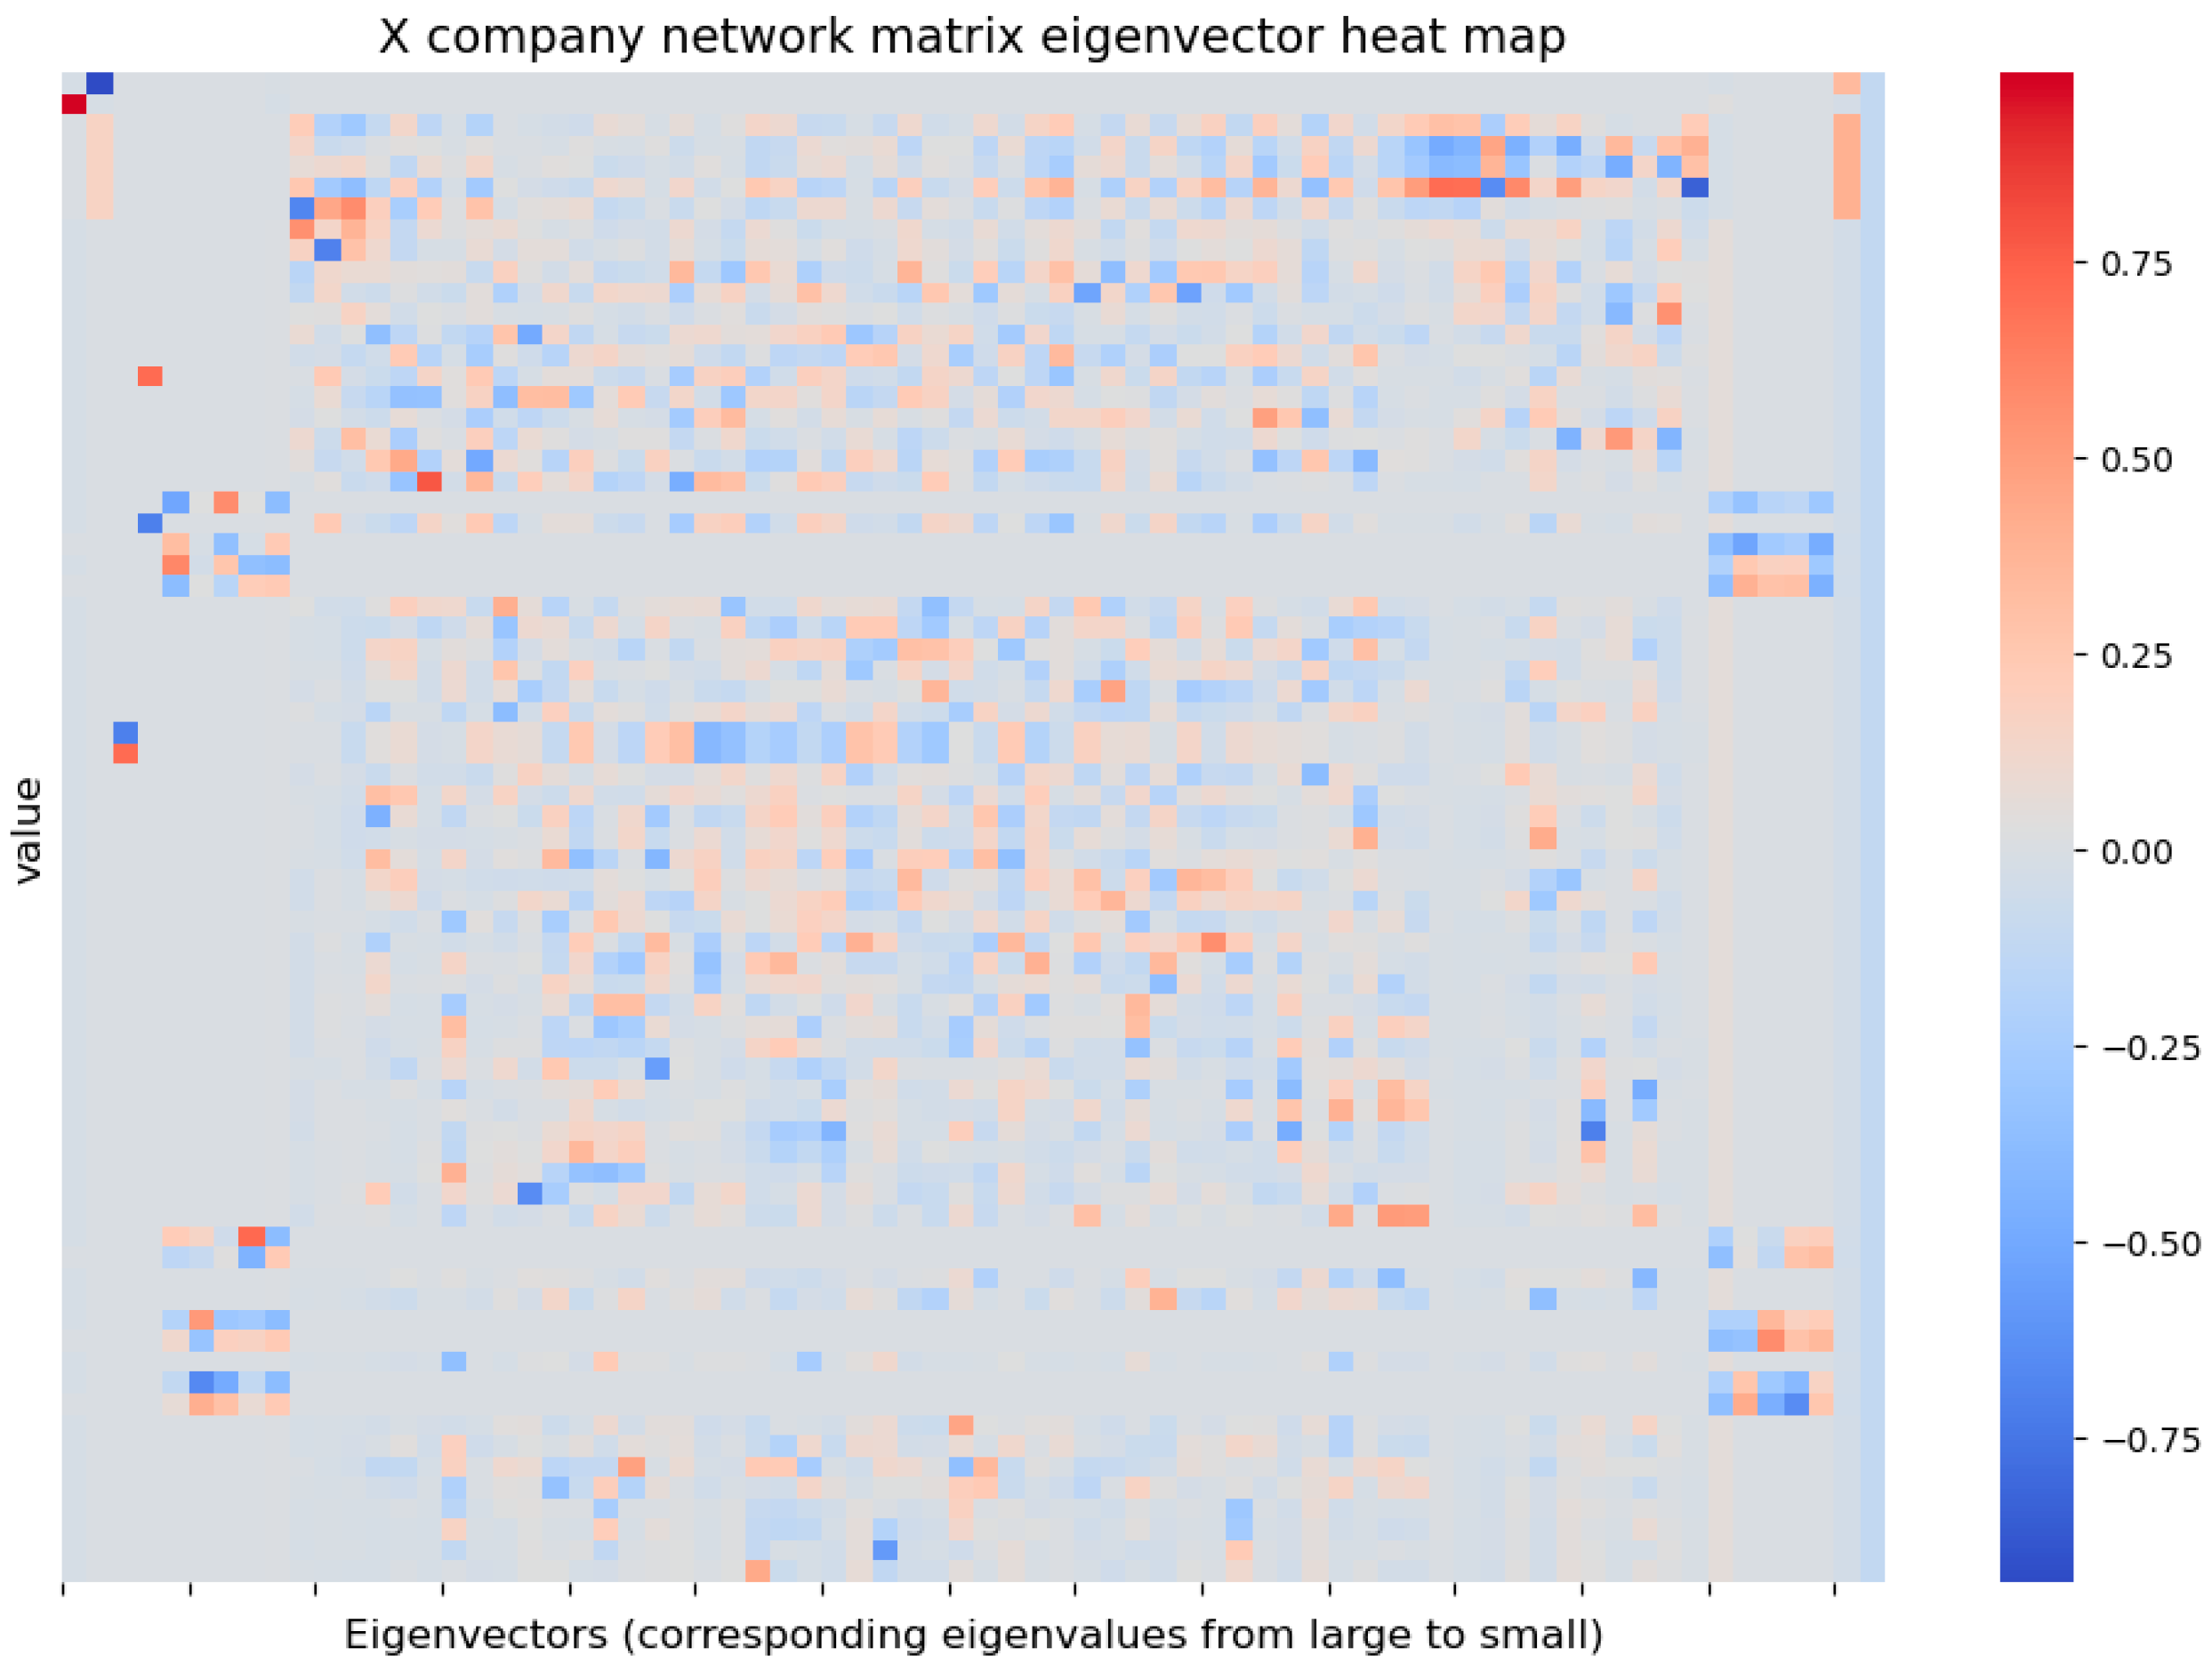
For the optimized topological coupling matrix of Company X’s network, the eigenvalues
−72,
−4,
−2 and
0 are obtained and the eigenvectors
are shown in
Figure 9.
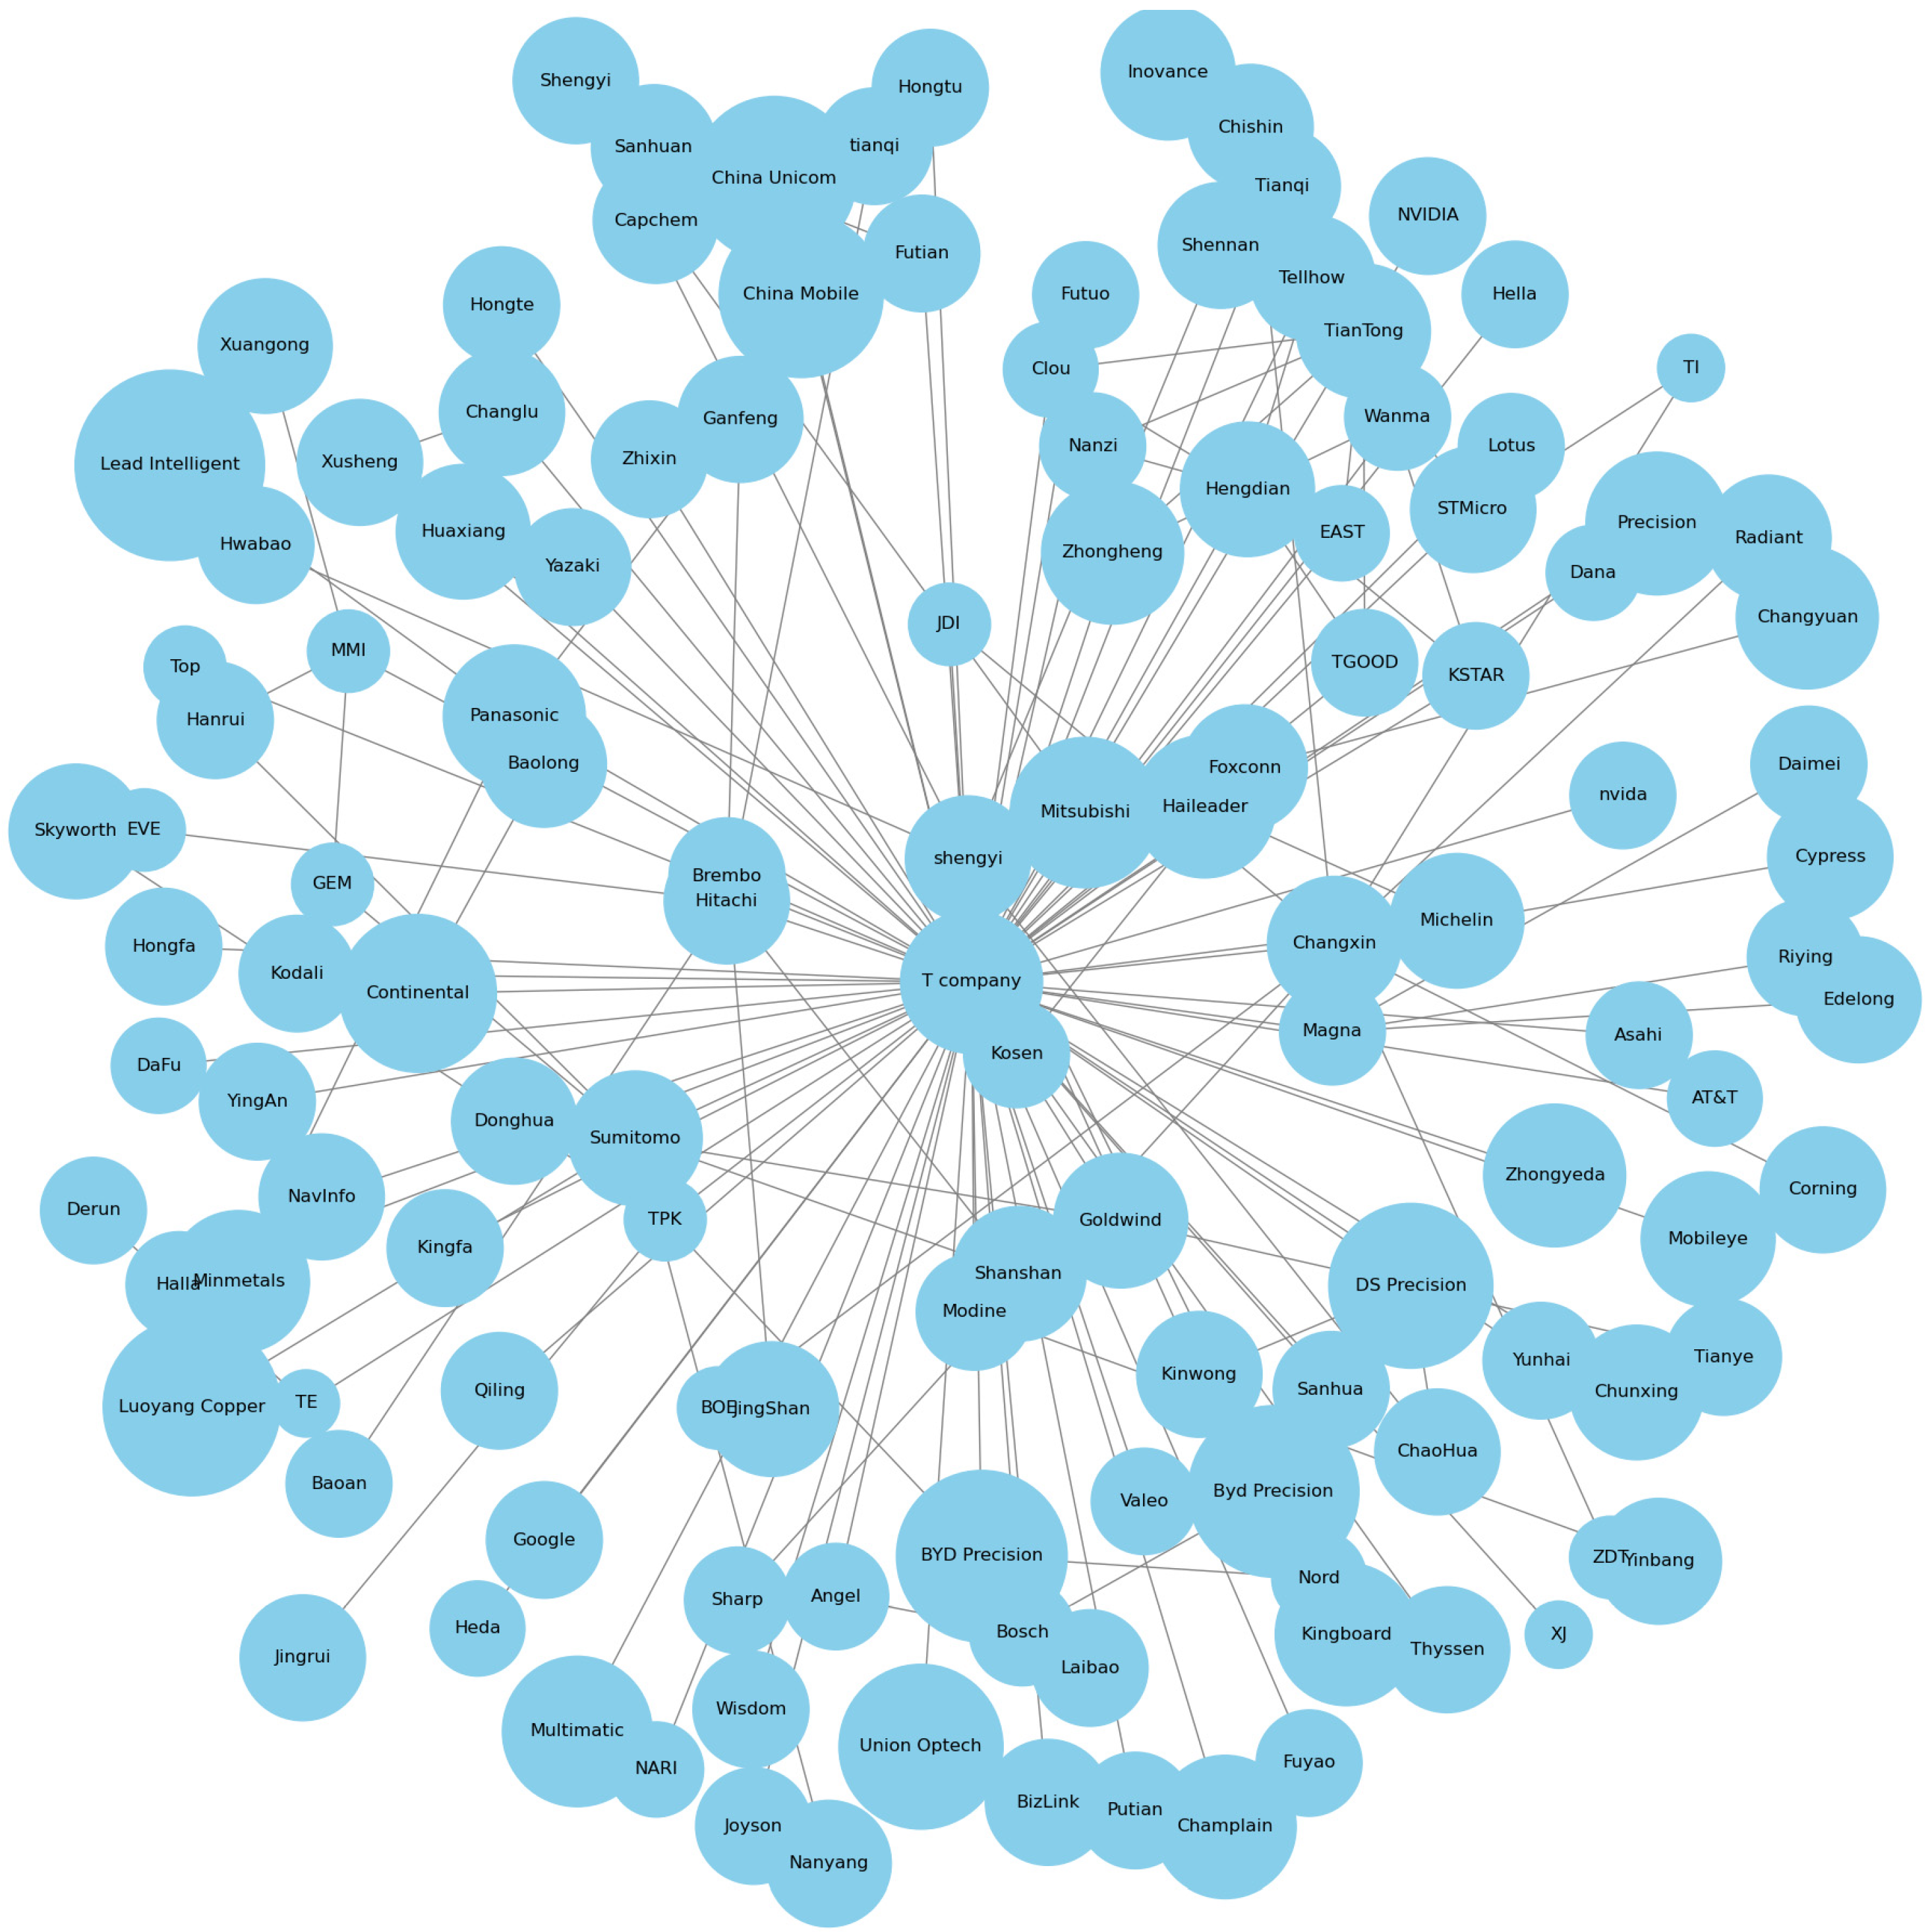
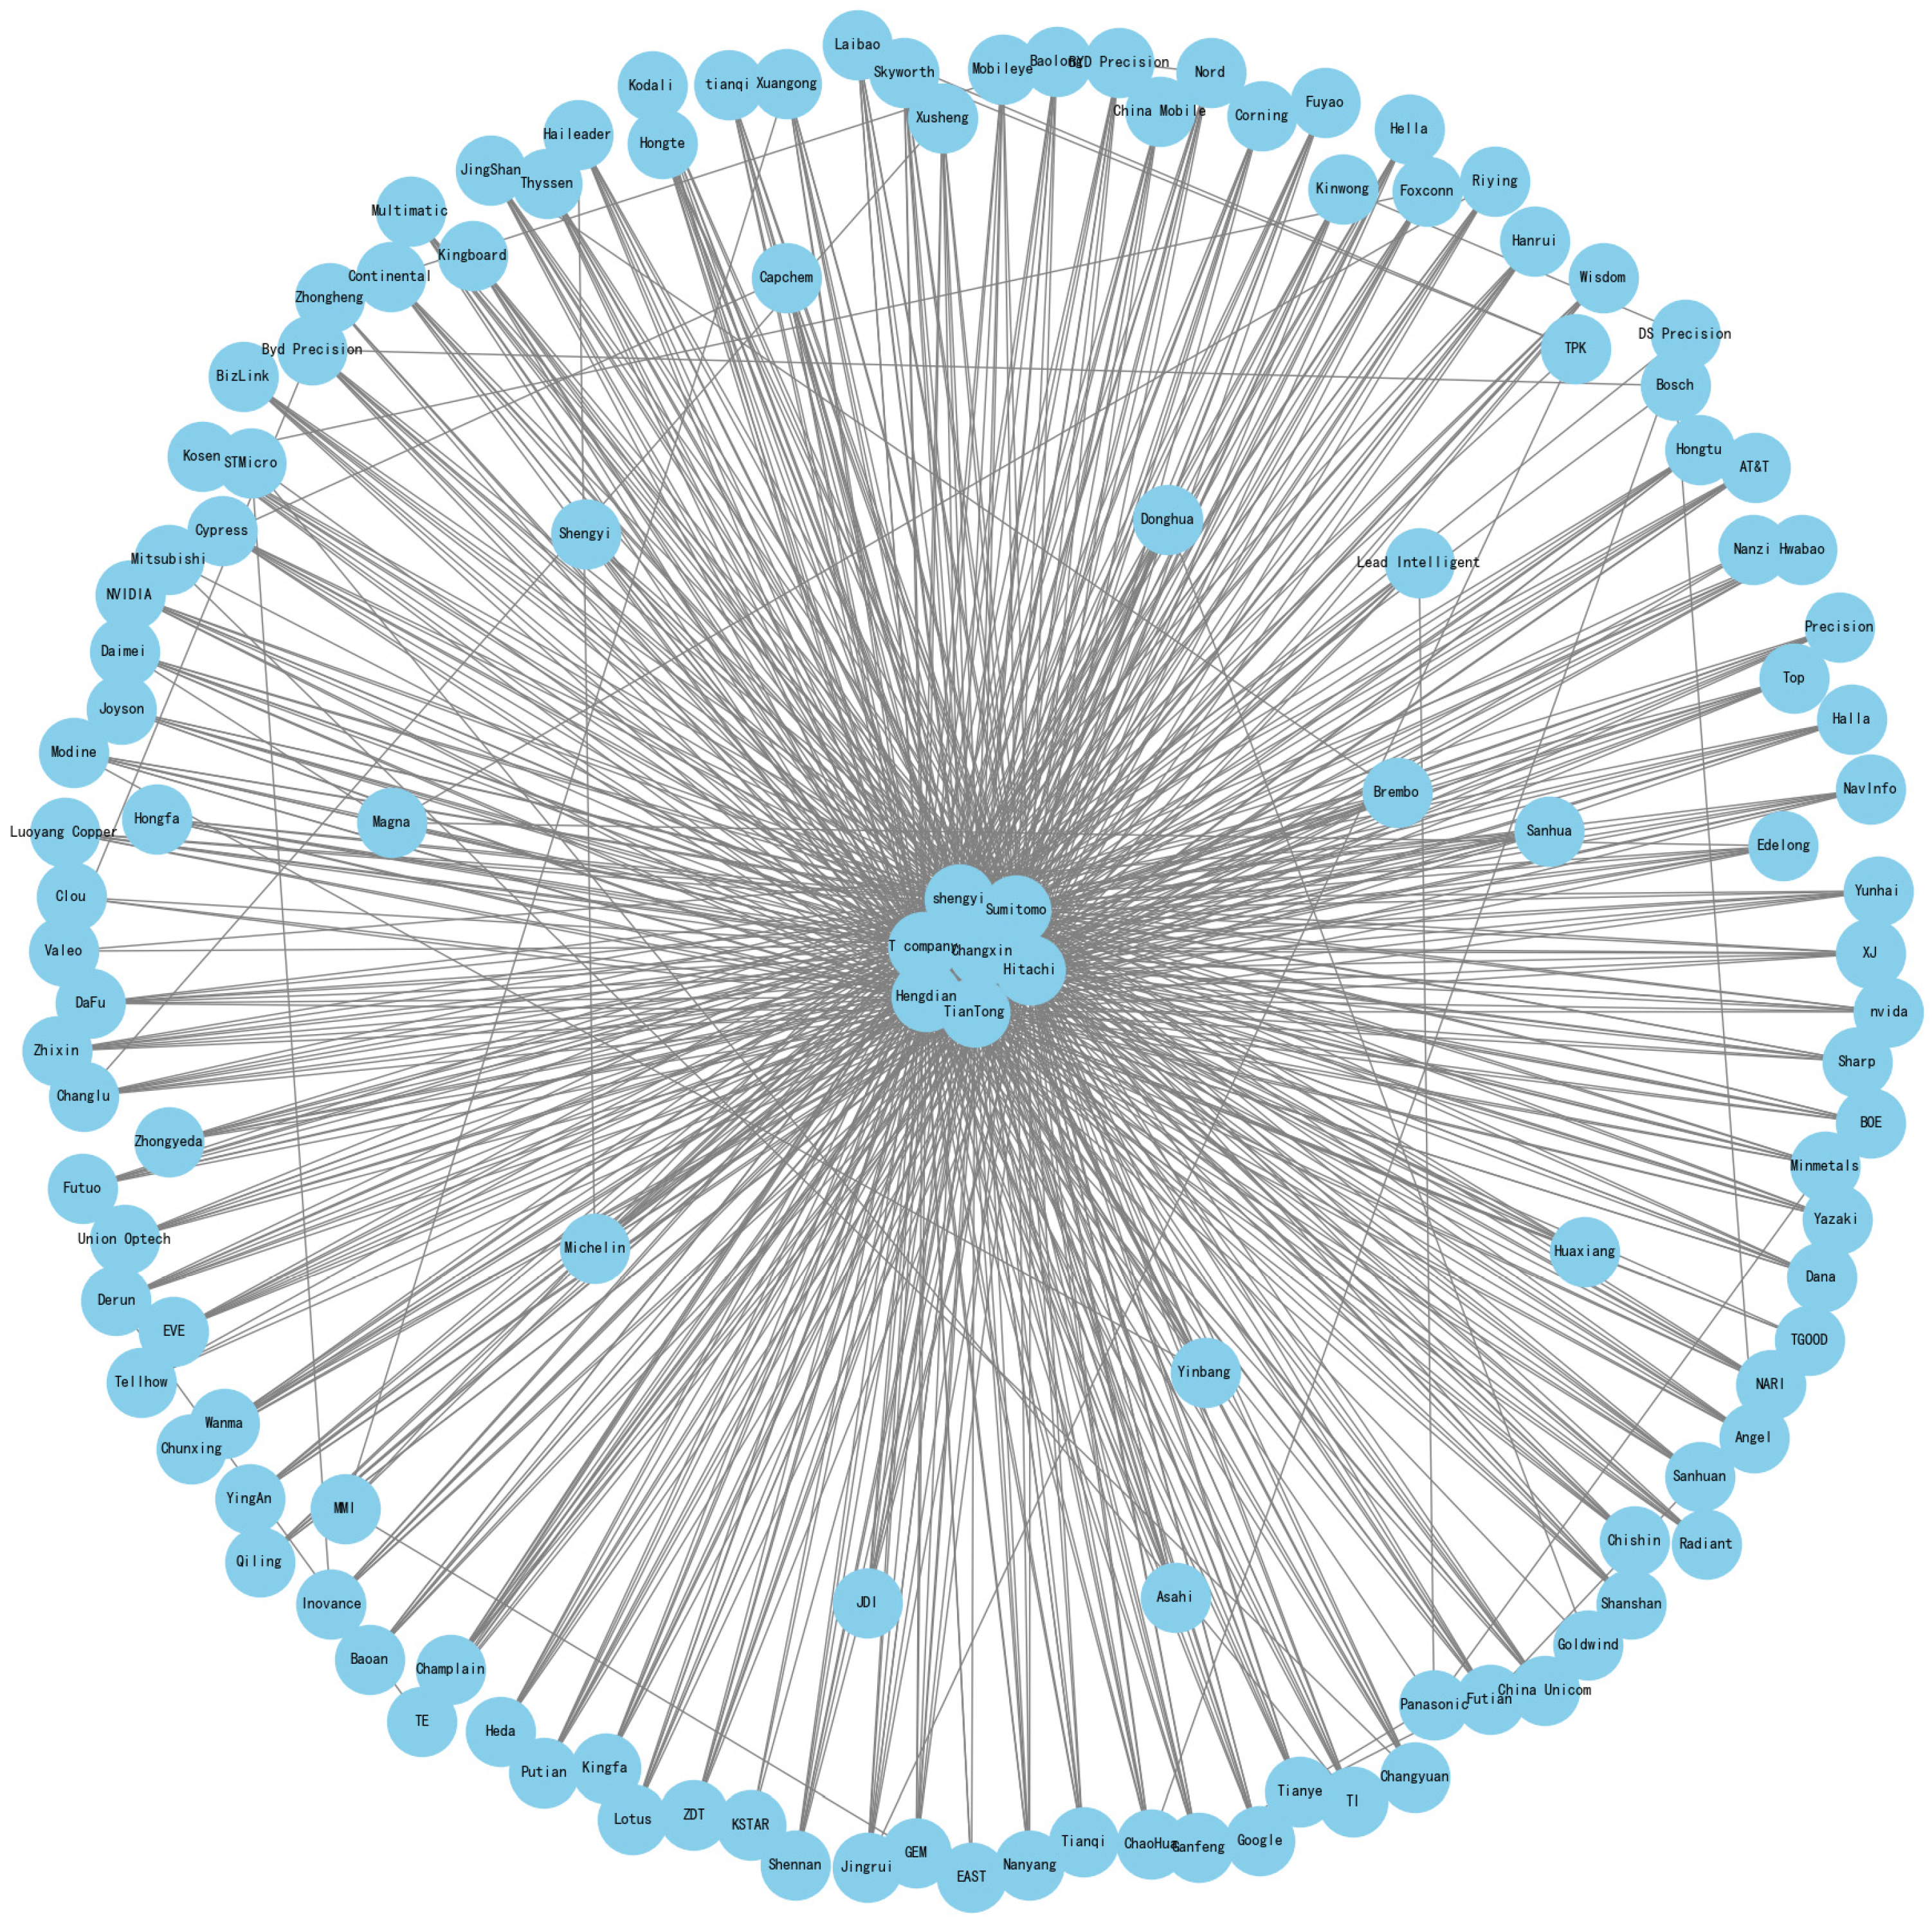
The average path length of the corresponding network structure of Company T is 2.67, and the clustering coefficient is 0.08. The bottlenecks in the network are reduced by optimizing the nodes with low connectivity or the nodes with high connectivity but heavy loads. The most heavily loaded nodes are “Company T”, “Changxin Technology” and “Hengdian Dongmag”, while the least connected nodes are “Minmetals Capital”, “Pioneer Capital”, “Pioneer Capital”, and “Hengdian Dongmag”. The nodes with the lowest connectivity are “Minmetals Capital”, “Pilot Intelligence” and “Luoyang Copper”. “Minmetals Capital”, “Pilot Intelligence”, “Ganfeng Lithium”, “Luoyang Copper”, “Grimme”, “China Baoan”, etc., are connected to “T-companies” and “Sanshan shares”. “Hebei Xuan Gong”, “Wada Industry”, etc., are connected to “Changxin Technology” and “Hitachi Chemical” and “Huden” to “Huden”. The average path length of the new network structure is 1.90, and the clustering coefficient is 0.28. The optimized network structure of Company T is shown in
Figure 10.
The topological coupling matrix
of its network is stored according to the Compressed Sparse Row, and the storage matrix and column index matrix are as follows, respectively:
The row start position index matrix is as follows:
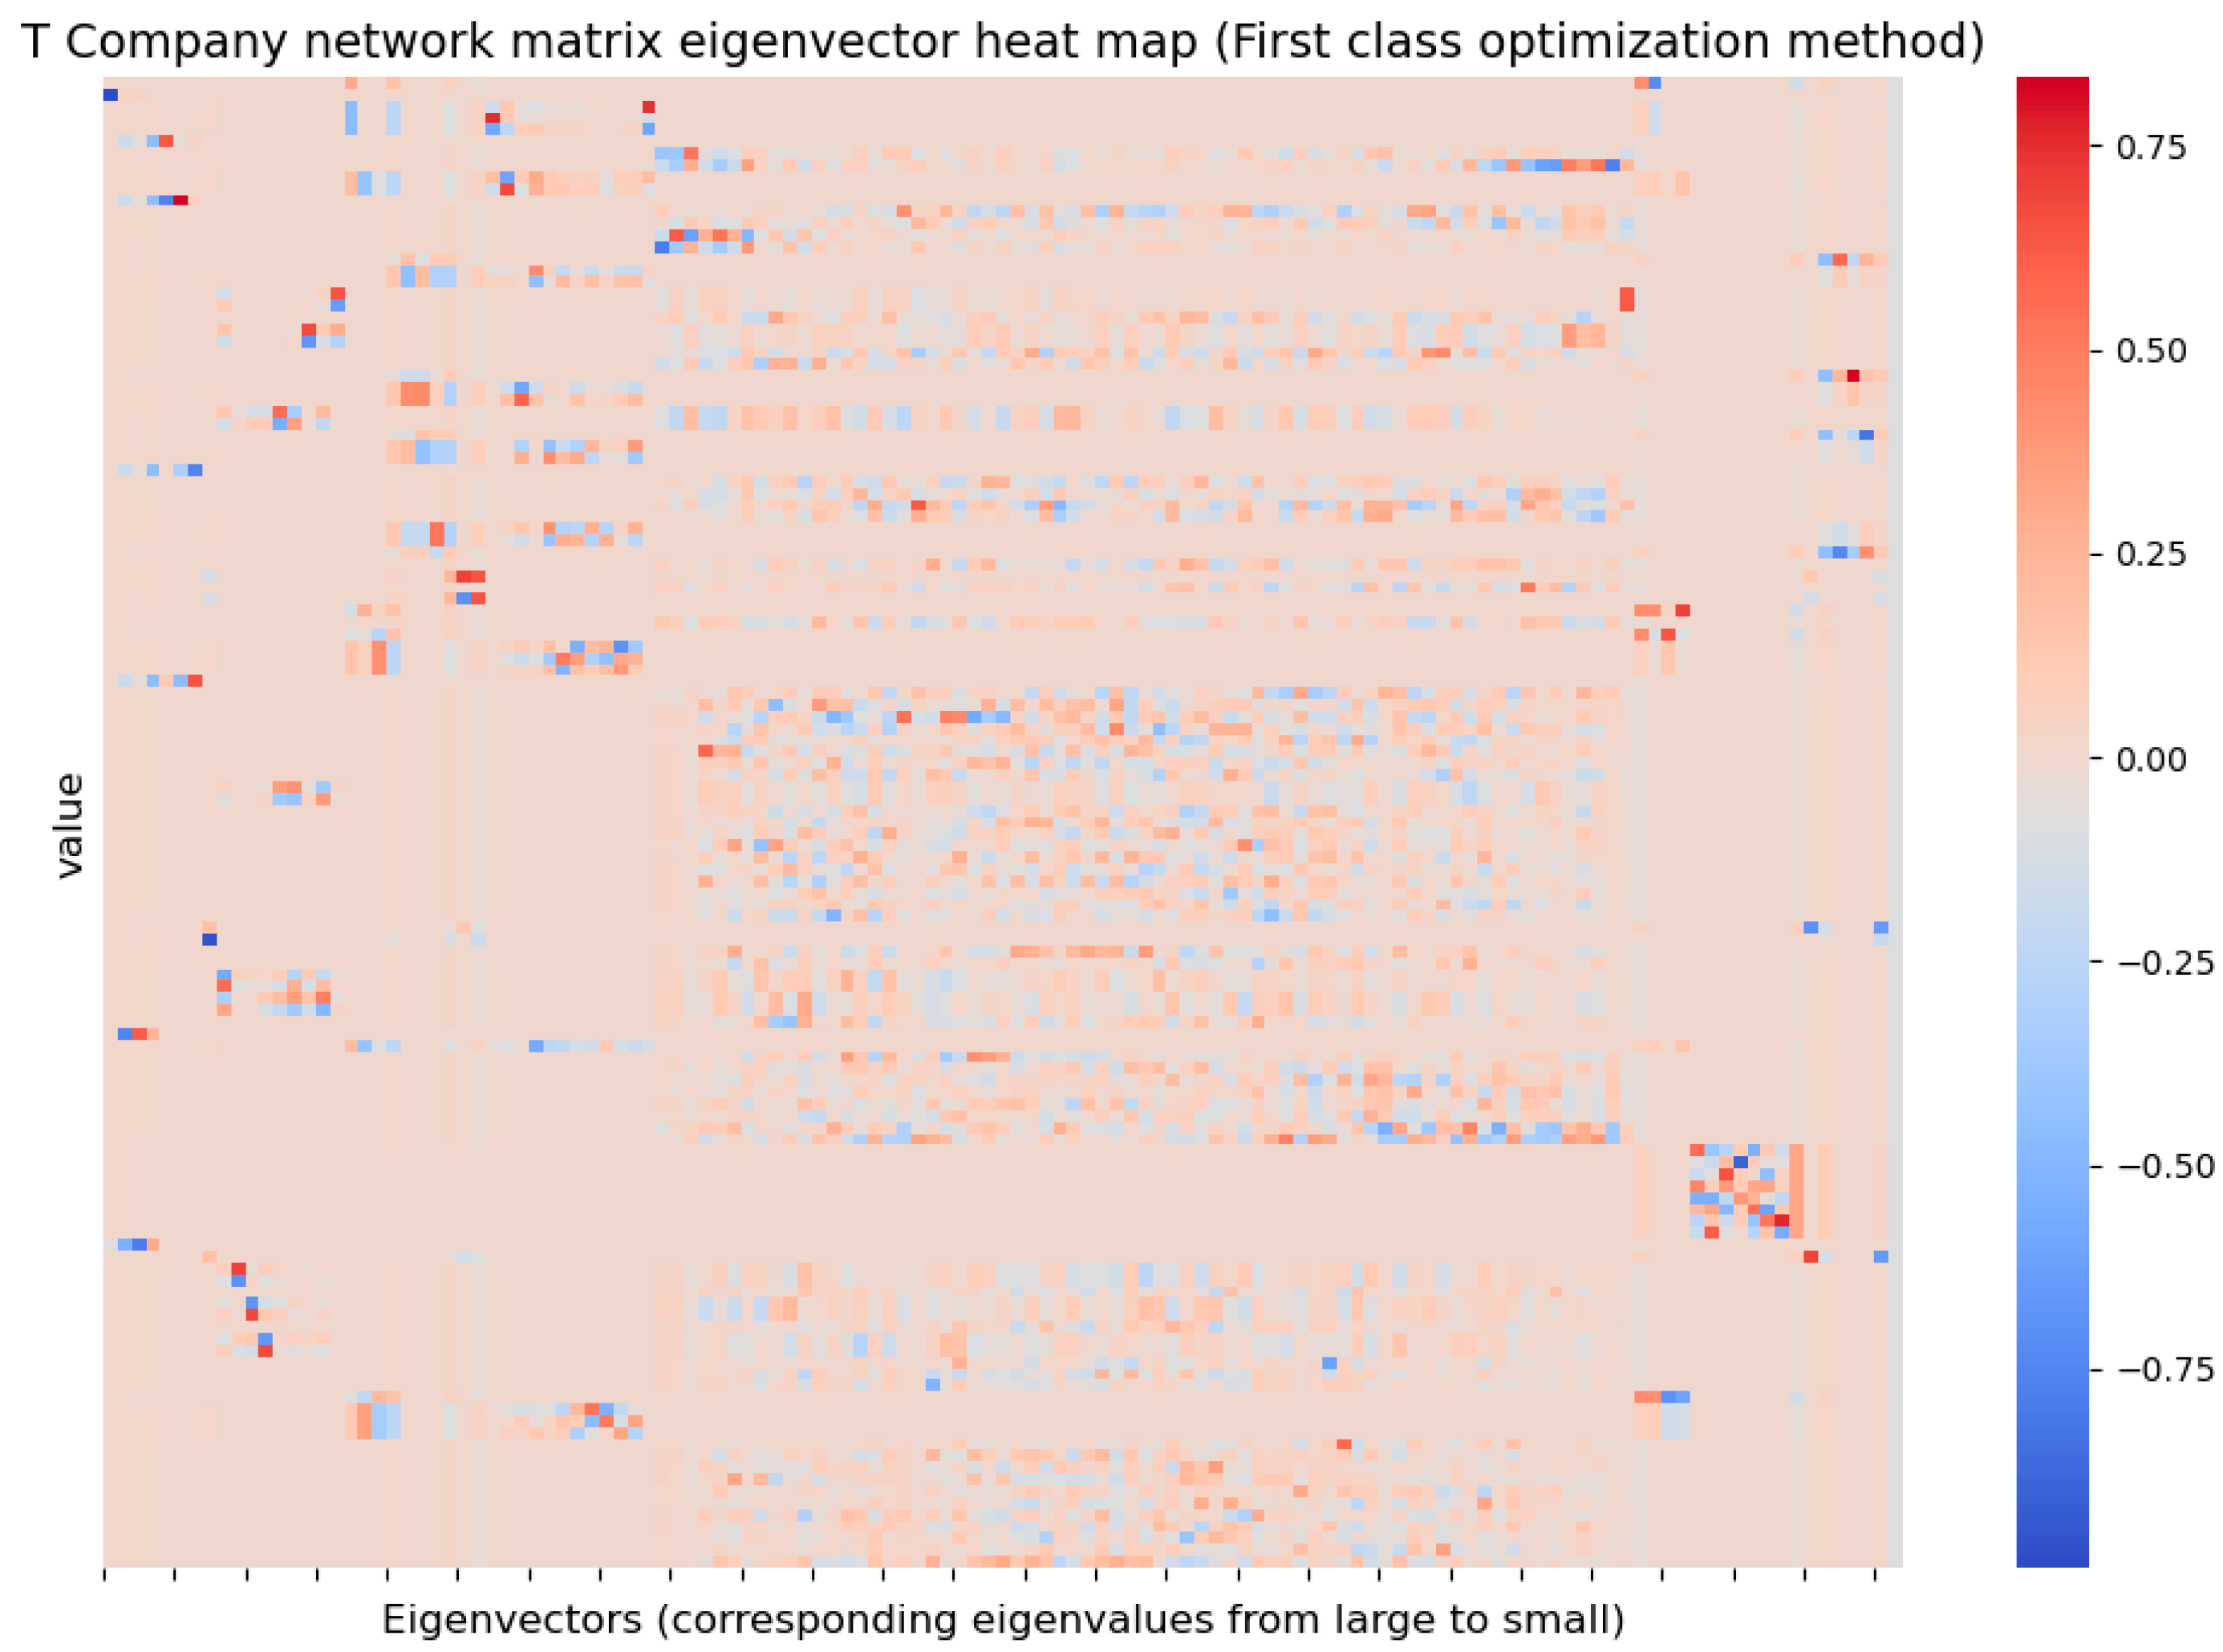
For the optimized topological coupling matrix of Company T’s network, the eigenvalues are
−126.06,
−113.68,
−110.40,
−105.87,
−9.34,
−9.00,
−8.64,
−8.25,
−8.00,
−7.00,
−3.35,
−3.00,
−2.68,
−2.52 and
0, and the eigenvector
is shown in
Figure 11.
The main parameters of the networks of Company X and Company T before and after optimization are shown in
Table 2. The number of nodes and the number of edges reflect the scale and complexity of the supply chain network, the average path length can reveal the coordination efficiency of the supply chain, the clustering coefficient reflects the closeness and cooperation density of the local nodes in the supply chain network, and the number of eigenvalues reflects the network synchronization.
By optimizing the nodes with low connectivity or nodes with high connectivity but heavy loads in the networks of Company X and Company T, i.e., increasing the number of edges of the nodes with low connectivity or nodes with heavy loads in the networks, the overall performance of the networks is improved. In the optimization of Company X, the addition of new edges further strengthens the influence of bridge nodes such as “Company X” and “Ningde Times”, making their role in the whole network more prominent. After optimization, the number of edges of Company X increases from 73 to 148, the average path length decreases from 2.23 to 1.94, the clustering coefficient increases from 0.06 to 0.97, and the number of eigenvalues decreases from 8 to 4. Similarly, in the optimization of Company T, the newly added edges further strengthen “Company T”, “Changxin Technology” and “Hengdian Dongmag”, etc. After optimization, the number of edges of Company T increases from 154 to 786, the average path length decreases from 2.67 to 1.90, the clustering coefficient increases from 0.08 to 0.28, and the number of eigenvalues decreases from 42 to 16. In addition, the number of eigenvalues decreases from 42 to 16.
After optimization, the number of edges of the two companies increases, which means that more cooperative relationships are added between the nodes of the companies in the supply chain network, and the connection density of the network increases significantly. The added connected edges make the local coupling degree of the network significantly stronger [
28], and the control ability of the high centrality nodes in the network to the surrounding nodes increases. Such changes indicate that the optimization process may have introduced more information sharing and collaborative mechanisms, which enhances the network’s collaborative ability and reduces the problems of information silos and unequal distribution of resources.
The decrease in the average path length of the two companies indicates that the intermediate steps required to reach from one node to another in the network have been reduced, and the transmission speed of information and resources has been significantly increased, and the overall efficiency of the supply chain has thus been strengthened, enabling it to respond more quickly to changes in the market demand and the environment, and to reduce the risks caused by delays in the transmission of information.
The increase in the clustering coefficient of the two companies indicates that the local connection between enterprises in the network is closer, and the collaborative relationship between enterprises is stronger. This network structure helps the information and technology sharing between enterprises, especially in complex decision-making and joint innovation, showing higher efficiency, and also improves the network’s risk-resistant ability, making the supply chain more resilient.
The reduction in the number of eigenvalues of the two companies indicates that the redundancy of the network is reduced, the structure is more centralized and efficient, the synchronization performance of the network is improved, and the difficulty of collaborative operation is reduced, and it also indicates that the network is more likely to reach a stable state of synergy, so that the optimization of the network can reduce the complexity of the supply chain management and improve the efficiency of the overall coordination.
During the optimization process, because the original network size of Company T is larger, it pays more attention to improving the connectivity and collaboration ability of the network by adding a large number of new edge connections in the optimization process, which leads to the growth of the number of edges and the final number of edges of Company T to be significantly higher than that of Company X. The company prefers to keep the network moderately connected, and the newly added edges are mainly concentrated between key nodes, focusing on precise optimization rather than large-scale connection increase.
Moreover, due to the high path length and low information flow efficiency of Company T, the path length is effectively shortened by adding a large number of new edges. In contrast, the original path length of Company X is already relatively short, so there is less room to shorten the path after optimization. Although the optimized path lengths of the two companies are very close to each other, indicating that both companies achieve high information flow efficiency and fast response capability after optimization, the optimization of Company T is larger.
Company X exhibits a high degree of clustering after optimization, indicating that the local cooperative relationship between enterprises in its supply chain network is extremely close, which helps to strengthen information sharing, resource complementation and technology synergy. The clustering coefficient of Company T, although also improved, is still much lower than that of Company X. This reflects that Company T pays more attention to the enhancement of global connectivity in the optimization process and pays insufficient attention to the close collaborative relationships of local nodes. Company T prefers to enhance efficiency through the improvement of connectivity in the overall network rather than the enhancement of local collaboration.
The absolute value of the number of eigenvalues of Company X is much smaller than that of Company T, indicating that the supply chain network of Company X tends to be more simplified and synchronized after optimization, and the overall collaboration difficulty is lower, which shows higher synchronization performance. Although the number of eigenvalues of Company T decreases significantly, due to the large number of nodes in Company T, the absolute value is still higher, which indicates that the network is still of high complexity and synchronization difficulty, and may need further optimization to improve collaboration efficiency.
In supply chain network optimization, targeted optimization strategies should be formulated according to the specific needs of enterprises and network characteristics. Taking Company X and Company T in this paper as an example, due to the differences in the scale, characteristics and optimization goals of the supply chain networks of the two companies, Company X pays more attention to improving the synchronization ability and local collaboration efficiency of the network through accurate local optimization and high clustering coefficient, and its network shows close and highly collaborative characteristics, while Company T tends to increase the global connectivity significantly to enhance the overall connectivity and fast response ability of the network, but the network scale itself is very large, and it is very complex and difficult to improve collaboration. Given its fast response capability, but large network size, the enhancement of local collaboration is relatively limited, and the degree of improvement in network synchronization is not as significant as that of Company X. In terms of practical application, Company X’s optimization strategy may be more suitable for scenarios that require high collaboration efficiency and close local cooperation, while Company T’s optimization strategy is more suitable for supply chain environments that are large in scale and need to respond quickly to market demands.
- 2.
Method 2: Adding connecting edges between nodes with long path lengths
Adding connecting edges to pairs of nodes with long path lengths reduces the average path length of the network. First, find out all the node pairs that are not directly connected and calculate the shortest path length of these node pairs. Second, sort the node pairs in descending order of path length and prioritize adding edges for the node pairs with the longest paths. Limit the number of added edges to 100 to avoid over-modifying the network structure. After the final addition of edges, the network characteristics are recalculated.
The average path length of the corresponding network structure of Company X is 2.23, and the clustering coefficient is 0.06. The average path length of the network structure of Company X is 2.23, and the clustering coefficient is 0.06. The average path length of the corresponding network structure of Company X is 2.23, and the clustering coefficient is 0.06. The “SK Korea”, “Ganfeng Lithium”, “Ningbo Rongbai” and so on are connected to “Infineon” and “Inconel”; “Dongguan Hanwha”, “Goldfarb” and so on are connected to “Pritchard”, “Pratt”, “Haiyuan Composites”, “Dongguan Hanwha”, “Encore” and “Xiamen Tungsten”. The average path length of the new network structure is 2.11, and the clustering coefficient is 0.16. The optimized network structure of Company X is shown in
Figure 12.
The topological coupling matrix
of its network is stored according to the Compressed Sparse Row and the storage matrix is as follows:
The column index matrix is as follows:
The row start position index matrix is as follows:
The eigenvalues are
−61.02,
−32.04,
−12.11,
−10.83,
−6.00,
−4.00,
−2.98,
−2.00,
−1.26,
−1.00,
−0.68 and
0, and the eigenvector
is obtained for the optimized topology coupling matrix for Company X’s network as shown in
Figure 13.
The average path length of the corresponding network structure of Company T is 2.67, and the clustering coefficient is 0.08. The nodes with longer paths are optimized by adding edges to reduce bottlenecks in the network. The nodes of “Sugo”, “Luoyang Copper”, “Coldray Cobalt” and “Greenpeace” are clustered with the nodes of “Minmetals Capital” and the nodes of “Cobalt” and “Greenpeace” are clustered with the nodes of “Cobalt” and “Greenpeace”. Nodes such as “Minmetals Capital” are connected to nodes such as “China Bao’an”, “Tianqi Lithium” and “YWL”. Nodes are connected to “Pilot Intelligence” and “Nanyang Science and Technology”, “Xinzhoubang” and “Changyuan Group”. The average path length of the new network structure is 2.41, and the clustering coefficient is 0.08. The optimized network structure of Company T corresponds to the network connectivity diagram shown in
Figure 14.
The topological coupling matrix
of its network is stored according to the Compressed Sparse Row, and the storage matrix and column index matrix are as follows, respectively:
The row start position index matrix is as follows:
The eigenvalues are
−81.01,
−46.09,
−12.11,
−44.00,
−17.19,
−11.08,
−7.63,
−5.61,
−4.80,
−4.34,
−3.93,
−3.62,
−3.39,
−3.00,
−2.74,
−2.24,
−1.98,
−1.70,
−1.38,
−1.00,
−0.45 and
0 and the eigenvector
is shown in
Figure 15.
The key parameter pairs of Company X and Company T networks in Optimization Method 2 are shown in
Table 3. By optimizing the node pairs with longer paths in the network of Company X and Company T, the path lengths between the key nodes in the network are reduced so as to improve the efficiency of information flow and the transfer speed of resources. After optimization, the number of edges of company X increases from 73 to 148, the average path length decreases from 2.23 to 2.11 and the clustering coefficient increases from 0.06 to 0.16, but the number of eigenvalues increases from 8 to 12. After optimization, the number of edges of Company T increases from 154 to 786, the average path length decreases from 2.67 to 2.41, the clustering coefficient remains unchanged, and the number of eigenvalues decreases from 42 to 22.
Similar to Method 1, in Method 2, the number of edges increases, the average path length decreases, the clustering coefficient of Company X increases, and the number of eigenvalues of Company T decreases after optimization in Company X and Company T. All of these indicate that the two companies have improved the overall collaborative efficiency and synchronization capability of the supply chain network through optimization, so that the supply chain network has a higher degree of flexibility, stability, and responsiveness after optimization.
However, the number of eigenvalues of Company X rises from 8 to 12, reflecting the increase in network complexity and the change in dynamic characteristic behavior brought about by the addition of new connected edges. During the optimization process, the distribution of edges and the increase in local connectivity create more local “subgroups” or dynamic patterns, which may lead to an increase in the difficulty of global synchronization and coordination while enhancing local collaboration. In addition, the increase in the number of eigenvalues also stems from the different focuses of the optimization objectives. This optimization mainly focuses on improving network connectivity and local collaboration, while the change in the eigenvalues is not a direct optimization objective, so the increase may be a by-product of the optimization process of other indicators. Although the increase in the number of eigenvalues reflects the complexity of synchronization to some extent, it does not diminish the improvement of overall network collaboration efficiency. The optimization results show the control of the trade-off relationship between local collaboration and global synchronization, while providing direction for further improvement of synchronization performance in the following.
Meanwhile, the clustering coefficient of Company T remains unchanged, which is closely related to the distribution mode of the newly added connecting edges. In the supply chain network optimization process, the change in the clustering coefficient mainly depends on whether the newly added edges are concentrated among local nodes to form a tighter triangular structure. In Optimization Method 2, Company T’s optimization strategy favors the increase in global connectivity, i.e., the newly added edges span more distances between different regions or groups of nodes to improve the connectivity and information flow efficiency of the overall network rather than to enhance the clustering of local nodes. Although this optimization improves the global collaboration ability and response speed of the network, it has not significantly affected the local connection density, so the clustering coefficient remains unchanged. This result reflects the difference in the orientation of the optimization objectives, focusing on shortening the average path length and reducing the global dynamic complexity, without prioritizing the adjustment of the local nodes’ collaboration tightness, which leads to no change in the clustering coefficients.
Both Method 1 and Method 2 reflect the same optimization objectives and characteristics in optimizing the supply chain network by increasing the connecting edges to improve the network structure, thus enhancing the overall performance of the supply chain. Both methods significantly increase the number of edges in the network and reduce the average path length, indicating that both methods enhance the information flow and resource transfer efficiency between nodes to different degrees, and both methods have an impact on the local and global characteristics of the network. Despite the different focuses of optimization, both of them show positive effects on the connectivity and dynamic behavior of supply chain networks by adjusting the network topology, indicating that they have consistent underlying logic and technical paths in optimizing network performance.
Method 1 aims to balance the load distribution and resource sharing of nodes in the network by establishing connecting edges between nodes with lower connectivity and nodes with higher loads, which significantly improves the local aggregation and the overall synergistic efficiency of the network. This optimization approach increases the clustering coefficients of both Company X and Company T by a large margin (from 0.06 to 0.97 for Company X, and from 0.08 to 0.28 for Company T), and at the same time effectively reduces the number of eigenvalues, reflecting the reduction in network complexity and synchronization difficulty. In contrast, Method 2 emphasizes the optimization of global connectivity and the improvement of information flow efficiency mainly by adding connecting edges between nodes with longer paths to shorten the average path length of the network. Since this method focuses more on global path adjustment than local collaboration enhancement, its improvement in clustering coefficients is more limited (from 0.06 to 0.16 for Company X, and the clustering coefficients are unchanged for Company T), and even triggers a rise in the number of eigenvalues in Company X, indicating that synchronization of the network has become more difficult. This difference shows the different orientations of the two methods in terms of optimization objectives and strategies: method 1 focuses on local collaboration and load balancing, which is suitable for enhancing the stability and robustness of the network; while method 2 is biased towards the optimization of global information flow, which is more suitable for enhancing the response speed and overall efficiency of the supply chain.
Based on the qualitative and quantitative analysis of Optimization Method 1 and Optimization Method 2, it is easy to see that the specific effect of supply chain network optimization depends largely on the setting of optimization objectives and the selection of optimization methods, and different strategies have their own advantages and disadvantages in strengthening local or global performance. Therefore, supply chain network optimization needs to seek a balance between local optimization and global optimization according to the characteristics of the network and the needs of enterprise objectives. Focusing only on local collaboration may lead to insufficient global efficiency, while focusing only on global connectivity may neglect local stability and risk resistance. The combined use of the two methods, or the selection of appropriate optimization strategies according to different scenarios, can help supply chain managers to improve overall efficiency while taking into account the stability and complexity control of the network, and ultimately achieve the organic combination of efficient supply chain operation and risk prevention and control. This goal-oriented optimization strategy selection provides a practical reference for the design and improvement of supply chain networks.
For enterprises, increasing the connecting edges in the network corresponds to the establishment of inter-enterprise cooperative relationships in reality. More direct connections between suppliers, manufacturers, distributors, etc., are established through electronic data exchange, information sharing platforms, and cooperation agreements to ensure that enterprises in different segments of the supply chain can exchange information, resources, and demands more efficiently, accurately transmit inventory, production progress, and demand changes to avoid information lags and errors, and be able to realize more rapid information flow and resource sharing, avoid information silos or collaboration bottleneck, optimize resource allocation, directly reduce ineffective communication and duplication of work and improve the overall efficiency of resource use, which in turn reduces operating costs and improves productivity. It also helps enterprises reduce the intermediate links of information transmission in the supply chain and shorten the path of information flow, which helps accelerate the decision-making process and enables enterprises to respond to market changes and customer needs in a shorter period of time. In response to emergencies or market fluctuations, even if a supplier has problems, the enterprise can quickly adjust the source of supply through the established additional cooperative relationship, reducing the dependence on a single supplier or partner. The nodes in the supply chain support and complement each other, improving the overall ability to adapt to external changes and avoiding the risks associated with supply chain disruptions.
4.1.2. Optimizing the Coupling Strength k and Time Lag
Coupling strength k and information time lag t are the key parameters of the edges in supply chain networks, which directly affect the efficiency of collaboration between enterprises and the speed of information transmission. Increasing the coupling strength k can enhance the close collaboration between enterprises and is conducive to the rapid dissemination and feedback of information, but too high a coupling strength may also lead to excessive dependence on the supply chain and reduce the independence of enterprises. The time lag t is the time required for information to be transmitted in the network, and too long a time lag reduces the efficiency of information exchange, so optimizing the coupling strength and time lag is the key to improving the synchronization capability of the supply chain. Specific strategies include the following:
Increasing the coupling strength can enhance collaboration and information sharing among enterprises in the supply chain and accelerate the decision-making and feedback process. However, too high a coupling strength may increase operational costs and lead to rapid loss of control of the entire supply chain when unexpected events occur. Therefore, the coupling strength should be kept at a moderate level to balance the cost and collaboration efficiency. While enhancing the coupling strength, it is necessary to consider the balance between cost and benefit to avoid the over-dependence and risk brought by too high coupling strength. The optimal coupling strength can be found by simulating the network behavior under different coupling strengths.
In practice, optimizing the coupling strength means adjusting the degree of cooperation and the frequency of information exchange among enterprises in the supply chain to achieve the best collaboration efficiency. By signing clear cooperation agreements with partners, enterprises can set reasonable delivery times, production schedules and inventory levels to optimize the coupling strength. Optimizing coupling strength can lead to more efficient collaboration between different parts of the supply chain. For example, by increasing the frequency of cooperation between suppliers and manufacturers to ensure more accurate information transfer and more timely inventory management, enterprises can ensure that each link in the supply chain can respond more quickly to changes in market demand by sharing data such as sales forecasts, production schedules and inventory levels.
- 2.
Reduce the time lag of information transfer
The time lag of information transfer t affects the speed of feedback and the efficiency of decision-making among enterprises. A short time lag can improve the speed of information flow and enhance the responsiveness of the supply chain. However, the shorter the information time lag, the better, because under the existing information technology conditions, the length of the time lag is limited by the network architecture and the level of technological development. By introducing advanced information technology, unnecessary time lag can be reduced and the speed and accuracy of information transmission can be improved. At the same time, the speed of information transmission and the reliability of information should be balanced to avoid information errors caused by too frequent updating of information.
In practice, optimizing the time lag refers to improving the real-time and accuracy of decision-making by reducing the delay in the information transmission process. Using big data analysis and artificial intelligence algorithms, enterprises can achieve more accurate demand forecasting and production scheduling, reducing the decision-making delay caused by time lag. Optimizing time lag can reduce the response time of decision-making by accelerating information transfer. Enterprises can obtain important information such as sales data, inventory status and production progress in real-time, so that they can make adjustments more quickly and avoid production interruptions or resource wastage due to information lag. For the fast-changing market, optimizing the time lag is especially important, which can help enterprises seize market opportunities, adjust the inventory quantity and supply chain scheduling in a timely manner, reduce the inventory cost and improve the utilization rate of resources, and avoid the backlog of inventory or supply chain rupture.
- 3.
Appropriately reduce the impact of time lag on enterprise independence
The time lag in the supply chain not only affects the speed of information transmission, but also may affect the independence of enterprises. When the time lag is too long, the information transfer is not timely, which may lead to excessive interference of the enterprise’s strategic decisions by external information, which is not conducive to the enterprise’s autonomy and production arrangements. The application of information technology should be improved to reduce the time lag in information feedback between enterprises, while avoiding excessive reliance on external information, thus maintaining the strategic independence of enterprises.
Enterprises can implement enterprise resource planning (ERP) systems, supply chain management (SCM) systems or advanced Internet of Things (IoT) technology to realize information sharing and real-time data updating in each link of the supply chain, reduce the impact of time lag on enterprise independence, and promote close cooperation and rapid response among enterprises.


 ,
, 


