Article

A New Multidimensional Computerized Testing Approach: On-the-Fly Assembled Multistage Adaptive Testing Based on Multidimensional Item Response Theory

1
College of Science, Beijing Forestry University, Beijing 100083, China
2
School of Educational Sciences, Hunan Institute of Science and Technology, Yueyang 414006, China
*
Author to whom correspondence should be addressed.
Mathematics 2025, 13(4), 594; https://doi.org/10.3390/math13040594
Submission received: 12 January 2025 / Revised: 4 February 2025 / Accepted: 5 February 2025 / Published: 11 February 2025

Abstract

:
Unidimensional on-the-fly assembled multistage adaptive testing (OMST), a flexible testing method, integrates the strengths of the adaptive test assembly of computerized adaptive testing (CAT) and the modular test administration of multistage adaptive testing (MST). Since numerous latent trait structures in practical applications are inherently multidimensional, extending the realm from unidimensional to multidimensional is necessary. Multidimensional item response theory (MIRT), a branch of mathematical and statistical latent variable modeling research, has an important position in the international testing field. Based on MIRT, this study proposes an approach of multidimensional OMST (OMST-M), and on-the-fly automated test assembly algorithms are proposed based on point estimation and confidence ellipsoid, respectively. OMST-M can effectively and flexibly measure multidimensional latent traits through stage-by-stage adaptive testing. The simulation results indicated that under different settings of latent trait structures, module lengths, and module contents, the OMST-M approach demonstrated good performance in terms of ability estimation accuracy and item exposure control. The empirical research revealed that the OMST-M approach was comparable to both multidimensional MST and CAT in ability estimation accuracy and exhibited remarkable flexibility in adjusting the length and content across its test stages. In summary, the proposed OMST-M features relatively high measurement accuracy, efficiency, convenient implementation, and practical feasibility.

1. Introduction

With the advanced development of computer and internet technologies, computerized adaptive testing (CAT) and multistage adaptive testing (MST) have been widely applied across multiple fields, such as psychometrics, educational measurement, and medical assessments [1,2,3,4,5]. CAT adapts at the item level, meaning that it selects each test item based on an examinee’s current estimated ability level during the test [6]. Compared with conventional paper-and-pencil tests, CAT provides more precise ability estimation using fewer items and offers high measurement precision for examinees at the two polar ends of the ability scale [7]. The widely-used CAT has several limitations, including the inability for examinees to review or revise their responses, and the risk that the abilities of certain examinees might be underestimated [8,9]. MST, which can implement modular test assembly, was developed decades ago [10,11]. MST consists of multiple parallel panels. Each panel contains several stages, each with modules of different difficulty levels. After completing a stage, the examinee is routed to the module of the next stage most suitable to the ability level [11,12,13]. Furthermore, within a stage, examinees have the opportunity to review and change their answers, which can alleviate their psychological stress [14,15]. The panels of MST are assembled via the automated test assembly (ATA) algorithm, which can control the nonstatistical constraints, including content specifications and enemy items, thereby assisting test developers in administering the test more effectively [16]. However, from the perspective of test security, the modules in MST are bundled into panels, which means that examinees taking the same path in the same panel receive exactly the same items, increasing the risk of item exposure [17]. Moreover, compared with CAT, the test length in MST is typically longer when the same level of ability estimation accuracy is achieved [7].
To address these problems with unidimensional MST approaches, Zheng and Chang (2015) pioneered on-the-fly assembled multistage adaptive testing (OMST) to improve adaptive design. This innovative approach integrates the strengths of CAT and MST while effectively addressing their limitations. In CAT, if a low-ability examinee guesses the answers to the first few items correctly, it may be difficult for the ability estimate to quickly return to the true value. OMST does not estimate the ability of examinees until each stage is completed and allows examinees to review and change their answers within each stage. This design mitigates the overestimation or underestimation of examinees’ abilities, alleviates the psychological stress they may experience during the test, and has advantages in large-scale assessments. For large-scale MST, test assembly is a complex task, and artificial review of all the assembled test forms is relatively expensive and cumbersome [17]. In contrast, the on-the-fly assembly of modules in OMST is more straightforward and can be easily achieved via computer algorithms. These dynamically assembled modules provide more information for each examinee and better measure examinees at the two polar ends of the ability scale. Additionally, it avoids the problem of item exposure caused by modules bundled in panels. Furthermore, OMST can adjust the length of each stage to meet the specific requirements of different tests, thereby enhancing the flexibility of the assessment [11].
Unidimensional item response theory (UIRT) is one of the core methodologies for several large-scale assessment programs globally. Examples of UIRT applications include the Organization for Economic Cooperation and Development (OECD) Program for International Student Assessment (PISA), the National Institutes of Health’s Patient Reported Outcomes Measurement Information System (PROMIS) initiative, and China’s new National Assessment of Basic Education Quality [18]. Most current MST and OMST studies rely on UIRT. However, UIRT is limited to a single dimension. In practice, many conceptual constructs in the social and behavioral sciences have multidimensional structures [19]. For example, the Armed Services Vocational Aptitude Battery (ASVAB) assesses examinees in four domains: arithmetic reasoning, word knowledge, paragraph comprehension, and math knowledge [20]. The Multiple Sclerosis International Quality of Life Questionnaire (MusiQoL) measures ten dimensions of patients’ lives [21]. The Resilience Measurement Scale (RESI-M) assesses Social Support, Family Support, and three other dimensions among family caregivers of children with cancer [22]. The validity of the test may be questioned if the latent trait structure does not align with the assumption of the model. Given the multidimensional complexity of conceptual constructs, it is necessary to use models that can effectively accommodate multidimensionality. To measure multidimensional latent traits more accurately, multidimensional item response theory (MIRT) has been proposed (e.g., Reckase (2009)) [23]. Compared with UIRT, MIRT can comprehensively reflect examinees’ multiple abilities [24]. Based on MIRT, many researchers have subsequently conducted extensive studies on multidimensional computerized adaptive testing (MCAT), including item selection strategies and stopping rules [20,25]. With respect to the multidimensional study of MST, the MST for multidimensional assessment (M-MST) proposed by Xu et al. (2022) is a newly published approach with further research value [26]. Although OMST performs well in unidimensional measurements, its applicability in multidimensional measurements remains to be fully validated.
Based on MIRT, this study proposes a multidimensional on-the-fly assembled multistage adaptive testing (OMST-M) approach, and two alternative on-the-fly automated test assembly algorithms based on ability point estimation and the ability confidence ellipsoid, respectively. The OMST-M approach inherits the advantages of unidimensional OMST, assembling modules on the fly based on examinees’ abilities. It measures the examinee’s abilities comprehensively and provides high measurement precision. OMST-M can conveniently control the quality and security of tests using on-the-fly automated test assembly algorithms and reduce the psychological stress experienced by examinees during the test process. In fields such as language ability measurement, Science, Technology, Engineering, and Mathematics (STEM) learning ability assessment, and professional skills measurement in human resource management, the authenticity and contextualization of test items have become a trend. The modular design of materials combined with multiple items is increasingly common in tests. Items with informative content more effectively measure examinees’ latent traits, but they present challenges for test administration. The flexibility of OMST-M supports modular design, meets complex testing needs, and offers valuable options for researchers and test developers. The two on-the-fly automated test assembly algorithms proposed in this study provide new ideas for multidimensional test assembly.
The subsequent sections of this paper are organized as follows. The second section introduces the framework and process of the OMST-M approach, detailing the on-the-fly automated test assembly algorithms for the OMST-M approach and aspects of test design. The third and fourth sections investigate the performance of the proposed approach in terms of ability estimation accuracy and item exposure control via simulation and empirical research. The fifth section summarizes the performance of the OMST-M approach, as demonstrated through simulations and empirical research, discussing its merits, recommendations for use, and future development prospects.

2. Methods

2.1. The OMST-M Framework: A Brief Overview

Figure 1 shows the flowchart for the proposed OMST-M framework. Like unidimensional OMST [17], the OMST-M is administered in stages. Some medium-difficulty modules are assembled before the test begins. Taking the ith examinee as an example, in the first stage of the test, the examinee was randomly assigned to a preassembled module. After all the items in the module are completed, the ability estimates of the ith examinee in the first stage, θ ^ i ( 1 ) , is calculated based on his responses, and the module for the second stage is assembled on the fly based on θ ^ i ( 1 ) . After the ith examinee completes the second stage, θ ^ i ( 2 ) is calculated based on the responses to all of the administered items, and a module for the next stage is assembled to match θ ^ i ( 2 ) . The iterative process continues until the predetermined test length is reached. Finally, the ith examinee is scored based on his responses to all of the administered items. The bottom-up strategy is applied to assemble the OMST-M framework.

2.2. Automated Test Assembly Algorithms and Test Design

2.2.1. Review of Previous Methods in MCAT and M-MST

The multidimensional two-parameter logistic model (M2PLM) is a popular dichotomous-response model in MIRT and is widely used in multidimensional testing research in psychometrics [27,28]. The probability of the ith examinee’s correct response to the jth item based on the M2PLM is given by Equation (1).
P j ( θ i ) = P ( U i j = 1 | θ i , a j , d j ) = exp ( a j θ i T + d j ) 1 + exp ( a j θ i T + d j ) ,
where U i j is the ith examinee’s response to the jth item, a j = ( a j 1 , .... , a j K ) represents the row vector of discrimination parameters of the jth item, d j represents the intercept parameter, and θ i = ( θ i 1 , , θ i K ) denotes the ability vector of the ith examinee. The difficulty parameter of the jth item is b j = d j k = 1 K ( a j k ) 2 . The Fisher information matrix (FIM) for the jth item at θ i is given by I j ( θ i ) = [ 1 P j ( θ i ) ] P j ( θ i ) ( a j T a j ) [29]. The FIM for the test with L0 items at θ i is calculated by I ( θ i ) = j = 1 L 0 I j ( θ i ) [25]. When a Bayesian estimation method such as expected a posteriori (EAP) is used for abilities, the covariance matrix for the abilities of the ith examinee after taking the test is ( I ( θ i ) + Σ 0 1 ) 1 , where Σ 0 is the covariance matrix of the prior distribution of θ [9].
An important transition from unidimensional to multidimensional testing is the change in the item Fisher information from a scalar to a matrix. Consequently, appropriately utilizing the FIM to select items during module assembly is a small challenge faced by multidimensional ATA algorithms [26,30]. In multidimensional testing, an effective way is to transform the FIM into a scalar, as the item selection strategies in MCAT do (e.g., D-optimality, A-optimality, Bayesian D-optimality, and Bayesian A-optimality) [9,29,31].
The NWADH algorithm is a classic heuristic method used to assemble MST [32]. Xu et al. (2022). combined the NWADH algorithm with D-optimality and A-optimality to propose modified NWADH algorithms for M-MST: NWADH-D and NWADH-A, respectively [26]. The detailed steps for the modified NWADH algorithms are as follows.
Step 1: the items in the item pool are sorted into three distinct sub-pools according to the three levels of the difficulty parameters: low difficulty, medium difficulty, and high difficulty. The segmentation criterion is as follows: the items with difficulty parameters ranging from −1 to 1 constitute the medium-difficulty sub-pool, those with parameters greater than 1 correspond to the high-difficulty sub-pool, and those with parameters less than −1 correspond to the low-difficulty sub-pool. Furthermore, the K-dimensional anchor vectors are assigned to each module of varying difficulties. For instance, the anchor vector for the medium-difficulty module is θ M = ( 0 ,     , 0 ) , the anchor vector for the low-difficulty module is θ L = ( 1 ,     , 1 ) , and the anchor vector for the high-difficulty module is θ H = ( 1 ,     , 1 ) .
Step 2: initially, calculate the FIM of each item within the sub-pool at the anchor vector of the corresponding difficulty module; then, the FIM is transformed using D-optimality and A-optimality, respectively. The corresponding transformations are presented as Equations (2) and (3), respectively.
f D ( I S y ( θ ) ) = det ( I S y ( θ ) ) ,
f A ( I S y ( θ ) ) = trace ( ( I S y ( θ ) ) 1 ) = det ( I S y ( θ ) ) k = 1 K det ( ( I S y ( θ ) ) k , k ) ,
where S y refers to the set of the selected y items, I S y ( θ ) denotes the FIM based on all the items in S y , and [ I S y ( θ ) ] [ k , k ] indicates the matrix that removes the kth row and kth column from I S y ( θ ) . The items in the sub-pool are ranked according to the values of Equations (2) or (3), and the highest M × Z items are selected for calculating the target information function (TIF), where M is the module size and Z is the number of the parallel panels. In this study, only Z parallel forms for the module with medium difficulty in the first stage were preassembled because the modules in the subsequent stages were assembled on the fly.
Step 3: W ability quadrature vectors, θ 1 ,     , θ W , are generated across Q discrete intersection points on each dimension to represent the range of the examinees’ abilities, W = Q K . Let S M , z denote the set of M items on the zth panel.
Calculate the TIFs for modules of different difficulties at θ 1 ,     , θ W . The TIFs corresponding to D-optimality and A-optimality are calculated based on Equations (4) and (5), respectively.
T D ( θ w ) = 1 Z × z = 1 Z det ( I S M , z ( θ w ) ) ,
T A ( θ w ) = 1 Z × z = 1 Z det ( I S M , z ( θ w ) ) k = 1 K det ( ( I S M , z ( θ w ) ) k , k ) ,
where w = 1 , , W .
Step 4: the set of the already selected x 1 items is defined as S x 1 , and the set of the items remaining in the sub-pool that can still be selected is defined as R x 1 . The absolute deviation of each item in R x 1 at each θ w is calculated for the two optimality criteria. The absolute deviation corresponding to the two optimality criteria is defined by Equations (6) and (7).
d j w D = | T D ( θ w ) M det ( I S x 1 ( θ w ) + I j ( θ w ) ) x | ,
d j w A = | T A ( θ w ) M 1 x × det ( I S x 1 ( θ w ) + I j ( θ w ) ) k = 1 K det ( ( I S x 1 ( θ w ) + I j ( θ w ) ) k , k ) | ,
where j R x 1 and where I S x 1 ( θ w ) is the FIM of all the items in S x 1 at θ w . The objective function is defined by Equation (8):
e j = ( 1 w = 1 W d j w x R x 1 w = 1 W d j w ) + H j .
where H j is the nonstatistical constraint objective function. If D-optimality is used, d j w is replaced by Equation (6), and if A-optimality is used, d j w is replaced by Equation (7). The xth item of the module is the one that maximizes e j .

2.2.2. An Automated Test Assembly Approach to Multidimensional On-the-Fly Multistage Adaptive Testing

NWADH-BD and NWADH-BA Algorithms. By incorporating weights into the NWADH-D and NWADH-A algorithms proposed by Xu et al. (2022) [26], the modified versions of the above two algorithms are named NWADH-BD and NWADH-BA, respectively, for the following design. Specifically, Bayesian D-optimality and Bayesian A-optimality are used in NWADH-BD and NWADH-BA, respectively, to transform the FIM. The transformations for the two optimality criteria, labeled Equations (9) and (10), are defined as follows:
f B D ( I S y ( θ ) ) = det ( I S y ( θ ) + Σ 0 1 ) ,
f B A ( I S y ( θ ) ) = det ( I S y ( θ ) + Σ 0 1 ) k = 1 K det ( ( I S y ( θ ) + Σ 0 1 ) k , k ) .
The corresponding TIFs are defined in Equations (11) and (12), respectively.
T B D ( θ w ) = 1 Z × z = 1 Z det ( I S M , z ( θ w ) + Σ 0 1 ) ,
T B A ( θ w ) = 1 Z × z = 1 Z det ( I S M , z ( θ w ) + Σ 0 1 ) k = 1 K det ( ( I S M , z ( θ w ) + Σ 0 1 ) k , k ) ,
where w = 1 , , W , and the absolute deviation is defined by the Equations (13) and (14):
d j w B D = | T B D ( θ w ) M det ( I S x 1 ( θ w ) + I j ( θ w ) + Σ 0 1 ) x | ,
d j w B A = | T B A ( θ w ) M 1 x × det ( I S x 1 ( θ w ) + I j ( θ w ) + Σ 0 1 ) k = 1 K det ( ( I S x 1 ( θ w ) + I j ( θ w ) + Σ 0 1 ) k , k ) | .
The weight g w is equal to the probability of the square with θ w as the center and a side length of 0.5 in the standard multivariate normal distribution; then, Equation (8) is transformed into Equation (15):
e j = ( 1 w = 1 W g w d j w x R x 1 w = 1 W g w d j w ) .
Note that the nonstatistical constraints in this study are controlled programmatically in the simulation, so the nonstatistical constraint objective function of the constraints is not included in Equation (15).
Considering that items are selected into modules one by one during test assembly, the algorithm proposed in this study does not directly select the M × Z items with the highest f B D or f B A values. Instead, it selects the Z items with the largest f B D or f B A values as the first items for the Z parallel forms for the module in Step 2. Then, starting from the first module, the item that maximizes the f B D or f B A value of the current module is selected one by one among the remaining items in the sub-pool to be added to the module until the given length is reached. The process is repeated until Z modules are assembled.
Two Alternative On-the-fly Automated Test Assembly (OATA) Algorithms Based on Ability Point Estimation and Ability Confidence Ellipsoid. This study proposes two algorithms for assembling the modules in the OMST-M approach, excluding the first stage, which are based on ability point estimation and the ability confidence ellipsoid, respectively.
The OATA algorithm based on ability point estimation is introduced below. The steps for selecting the xth item of the module in the tth stage of OMST-M using ability point estimation are as follows ( t = 2 , , T ).
Step 1: calculate I S ( t 1 ) ( θ ^ i ( t 1 ) ) and I S x 1 ( θ ^ i ( t 1 ) ) . I S ( t 1 ) ( θ ^ i ( t 1 ) ) is the FIM based on the set of all the items in the administered t 1 stages (denoted by S ( t 1 ) ) and I S x 1 ( θ ^ i ( t 1 ) ) is the FIM based on the set of x 1 selected items in the tth stage (denoted by S x 1 ). θ ^ i ( t 1 ) is the ith examinee’s ability estimates after completing the t 1 stages.
Step 2: select the xth item for the current module from the sub-pool according to the following equations, where Bayesian D-optimality corresponds to Equation (16), and Bayesian A-optimality corresponds to Equation (17).
j B D = arg max j R x 1 { det ( I S ( t 1 ) ( θ ^ i ( t 1 ) ) + I S x 1 ( θ ^ i ( t 1 ) ) + I j ( θ ^ i ( t 1 ) ) + Σ 0 1 ) } ,
j B A = arg max j R x 1 { det ( I S ( t 1 ) ( θ ^ i ( t 1 ) ) + I S x 1 ( θ ^ i ( t 1 ) ) + I j ( θ ^ i ( t 1 ) ) + Σ 0 1 ) k = 1 K det ( I S ( t 1 ) ( θ ^ i ( t 1 ) ) + I S x 1 ( θ ^ i ( t 1 ) ) + I j ( θ ^ i ( t 1 ) ) + Σ 0 1 ) k , k } ,
where x = 1 , , M , and note that when x = 1 , I S x 1 ( θ ^ i ( t 1 ) ) is a zero matrix.
The OATA algorithm based on the ability confidence ellipsoid is introduced below. Note that θ ^ i ( t 1 ) ~ N ( θ i , ( I S ( t 1 ) ( θ i ) + Σ 0 1 ) 1 ) , so the confidence region of K-dimensional θ ^ i ( t 1 ) is a solid ellipsoid. Beginning at the center θ ^ i ( t 1 ) , the kth axis of the confidence ellipsoid can be expressed as Equation (18):
± λ k K ( τ 1 ) τ ( τ K ) F K , τ K ( α ) e k ,
where τ = card ( S ( t 1 ) ) is the total item number of the administered t 1 stages, and F K , τ K ( α ) is the ( 100 α ) th percentile of the F K , τ K distribution, and note that λ k and e k are the kth eigenvalue and corresponding eigenvector of the sample covariance matrix of θ i , respectively [33].
The steps for selecting the xth item of the module in the tth stage of OMST-M using the ability confidence ellipsoid are as follows.
Step 1: calculate the axes of the confidence ellipsoid based on θ ^ i ( t 1 ) . The three points that divide the longest axis into four equal segments and the two endpoints of the longest axis are selected as the following nodes: θ ^ i 1 ( t 1 ) ,   , θ ^ i p * ( t 1 ) .
Step 2: calculate I S ( t 1 ) ( θ ^ i p ( t 1 ) ) of S ( t 1 ) and I S x 1 ( θ ^ i p ( t 1 ) ) of S x 1 at each θ ^ i p ( t 1 ) , where p = 1 , , p * .
Step 3: select the xth item for the module in the tth stage from the sub-pool according to the following equations, where Bayesian D-optimality and Bayesian A-optimality correspond to Equations (19) and (20), respectively.
j B D = arg max j R x 1 { 1 p * × p = 1 p * det ( I S ( t 1 ) ( θ ^ i p ( t 1 ) ) + I S x 1 ( θ ^ i p ( t 1 ) ) + I j ( θ ^ i p ( t 1 ) ) + Σ 0 1 ) } ,
j B A = arg max j R x 1 { 1 p * × p = 1 p * det ( I S ( t 1 ) ( θ ^ i p ( t 1 ) ) + I S x 1 ( θ ^ i p ( t 1 ) ) + I j ( θ ^ i p ( t 1 ) ) + Σ 0 1 ) k = 1 K det ( I S ( t 1 ) ( θ ^ i p ( t 1 ) ) + I S x 1 ( θ ^ i p ( t 1 ) ) + I j ( θ ^ i p ( t 1 ) ) + Σ 0 1 ) k , k } .
where x = 1 , , M , and note that when x = 1 , I S x 1 ( θ ^ i p ( t 1 ) ) is a zero matrix.

2.2.3. Test Design of OMST-M

Item Pool Stratification Strategy. The OMST-M approach employs the item pool stratification strategy in its on-the-fly assembly module to increase test efficiency and control item exposure. The difficulty parameters of the items are converted into the corresponding dimensional difficulty parameters, and the transformation equation is denoted by Equation (21).
  b j k = b j | | a j | | a j k K ,
where | | a j | | is the L2-norm of a j , and b j k is the difficulty parameter of the jth item on the kth dimension. The criteria for stratifying the item pool based on b j k are as follows. First, the item with a j k 0 is composed of the kth dimension sub-pool. Then, the items whose kth dimension difficulty parameters match the kth dimension ability estimates are kept in the sub-pool. The detailed matching rules are as follows: θ i k < 1 matches b j k < 1 , θ i k > 1 matches b j k > 1 , and 1 < θ i k < 1 matches 1 < b j k < 1 . After the sub-pools of all the dimensions are stratified, they are merged to obtain the sub-pool for the on-the-fly assembled module.
A Randomly Selected Strategy. To avoid excessive usage of items that provide more information, before selecting the item to add to the module, the f B D or f B A values of the items are sorted in descending order, then an item is randomly selected from the G items with the highest values to add to the module. The strategy effectively lowers the item exposure rate without significantly compromising measurement precision, implementing effective control of item exposure during the test.

3. Simulation

To investigate the performance of the OMST-M approach, the following three simulation studies were carried out with different test designs. The simulation programs were written in R (version 4.3.1), primarily utilizing the mirt and mirtCAT packages [34,35].

3.1. General Specifications

The true abilities of a sample of 1000 examinees were simulated from the multivariate normal distribution M V N ( 0 , Φ ) . The item pool consisted of 1500 items based on the M2PLM. The item discrimination parameters were drawn from U ( 0.7 , 2.3 ) , and the item difficulty parameters were drawn from N ( 0 , 1.3 ) . The examinees’ abilities were estimated via the EAP. For each condition in the study, 50 replications were conducted. The examinees’ abilities in each dimension were divided into five groups according to four points: −1.39, −0.47, 0.28, and 1.18. In the OATA algorithm with an ability confidence ellipsoid, the quantile of the F-distribution affects the size of the confidence ellipsoid, which can affect module assembly. Before the simulation, a pilot study was conducted to investigate the selection of different quantiles of the F-distribution. In the pilot study, the design and sample size of the test were consistent with the simulation study, and 5 replications were conducted. The results indicate that the accuracy of the test is greater when the quantile of the F-distribution decreases with increasing number of stages, meaning that the confidence level decreases as the test progresses. Curve fitting was conducted for the quantiles of the F-distribution settings that performed better in the pilot study, and the fit was better when the S-curve and the power function were used. Note that the functions listed below are mere examples, and in practical applications, the parameter values are certainly not restricted to those specified here. In the simulation, the fitting function of the quantiles of the F-distribution with different settings is as follows. For the two-dimensional latent traits, the quantile of the tth stage, F t = e 3.7 + 3.5 t 1 was assigned in the short test, and F t = ( t 1 ) 1.9 or F t = e 4 + 4 t 1 were assigned in the long test. For the four-dimensional or higher latent traits, F t = e 2.4 + 2.6 t 1 was assigned in the short test, and F t = ( t 1 ) 1.1 or F t = e 2 + 3 t 1 were assigned in the long test, where t = 2 , , T . The number of parallel forms for the module in the first stage was set to 10, and the size of the item set for the randomly selected strategy was 20. The values of Q were 13 and 3 in the two-dimensional and four-dimensional tests, respectively.

3.2. Evaluation Criteria

Ability Estimation Accuracy. The absolute mean error (AME), root mean square error (RMSE), and mean value of the correlation among the estimated abilities and the true abilities in each dimension (CORmean) are used to evaluate the ability estimation accuracy of the examinees. The calculation equations are shown in Equations (22)–(24):
  A M E = 1 N × K × i = 1 N k = 1 K | θ ^ i k θ i k | ,
  R M S E = 1 N × K × i = 1 N k = 1 K ( θ ^ i k θ i k ) 2 ,
  C O R m e a n = 1 K × k = 1 K ρ θ ^ . k , θ . k ,
where N is the number of examinees, K is the number of ability dimensions, and ρ θ ^ . k , θ . k is the correlation coefficient between the estimated and true values of the abilities on the kth dimension.
Item Exposure Indices. The maximum item exposure rate (ERmax), Chi-square statistic of item exposure ( χ 2 ) [36], and test overlap rate (TOR) [25,37] are calculated by the following equations to evaluate the item exposure control:
  E R max = max j = 1 , , J { E R j } ,
  χ 2 = j = 1 J [ E R j E ( E R j ) ] 2 E ( E R j ) ,
  T O R = N × j = 1 J ( E R j ) 2 ( N 1 ) × L 1 N 1 ,
where E R j = v j / N denotes the exposure rate of the jth item, and v j is the number of times the jth item has been used. E ( E R j ) = L / J , which is the expected exposure rate of the jth item. Additionally, L represents the test length, and J is the number of items in the item pool.

3.3. Study 1

The objective of Study 1 was to validate the effectiveness of the OMST-M approach and two OATA algorithms across various test settings. In Study 1, the following conditions were considered: (i) dimensionality: two-dimensional and four-dimensional; (ii) test length: a short test comprising four stages, each with six items, and a long test comprising nine stages, each with five items; (iii) correlations among abilities: with correlation coefficients of 0, 0.3, 0.6, and 0.8; (iv) the FIM transformation method: uses Bayesian D-optimality and Bayesian A-optimality; and (v) OATA algorithms: APE is used for simplicity to represent ability point estimation, whereas ACE represents the ability confidence ellipsoid.
The item pool setting was designed similarly to the approaches used in the studies by Tu et al. (2018) and Xu et al. (2022) [25,26]. Specifically, the items belonged to two content categories, and four items were enemy items. In each simulation, four items were randomly designated enemy items, and 1500 samples were randomly drawn, each being assigned a value of either 1 or 2, representing different content categories for the items. In the two-dimensional test, the items had three item-trait patterns (including assessing the first dimension, assessing the second dimension, and assessing both dimensions) and 500 items in each pattern. In the four-dimensional test, the items had fifteen item-trait patterns (including assessing one dimension, assessing two dimensions, assessing three dimensions, and assessing all four dimensions), each containing 100 items. The prior covariance matrix for abilities was assumed to be the identity matrix. The nonstatistical constraints were set in the OMST-M module. In the initial stage of the test, there was at least one item measuring each dimension. Only one enemy item was allowed within the same module, and up to three items measuring each content category were permitted.
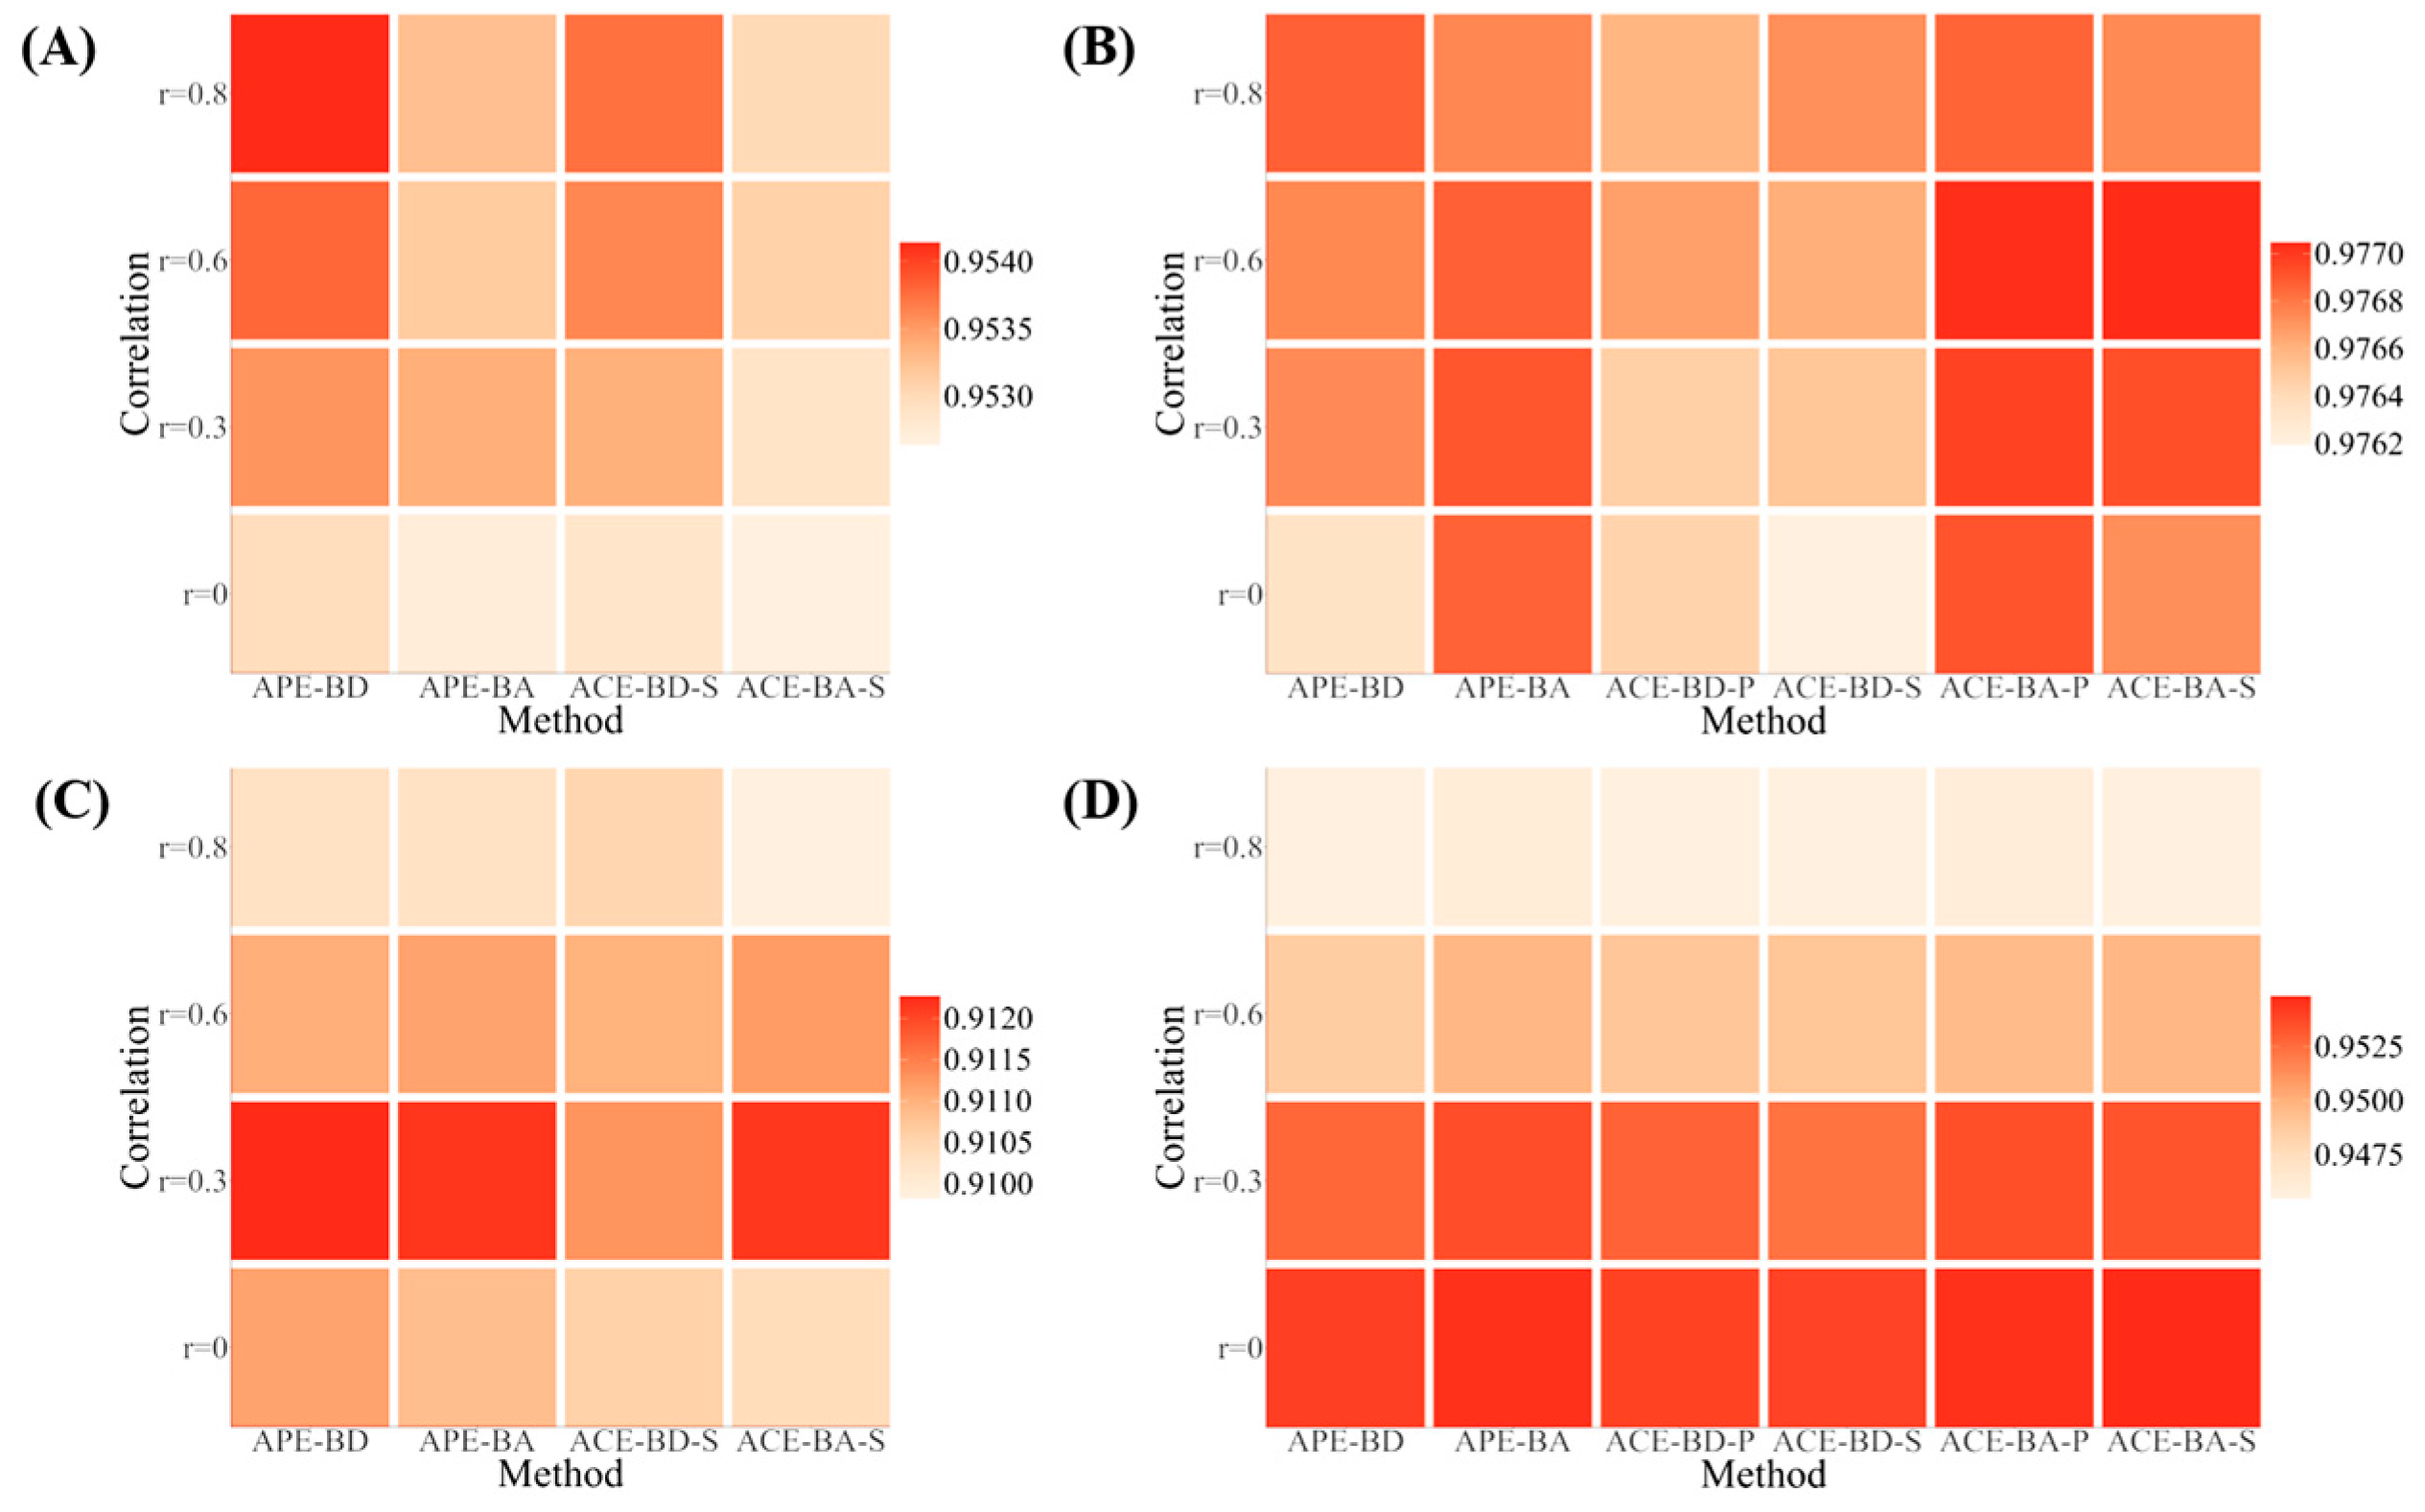
Table 1 shows the results of the RMSE and AME for the two OATA algorithms under different test settings in Study 1, where APE and ACE represent OATA algorithms based on ability point estimation and ability confidence ellipsoid, respectively, BD and BA represent FIM transformation methods using Bayesian D-optimality and Bayesian A-optimality, respectively, P and S represent fitting the quantiles of the F-distribution via the power function and the S-curve, respectively. Figure 2 shows the heatmap of the CORmean values. The results indicated that the two OATA algorithms exhibited high estimation accuracy across all the settings. The ability estimation accuracy improved when the number of test dimensions was reduced or the test length was extended. In most cases, Bayesian D-optimality was more advantageous for the short tests, whereas Bayesian A-optimality performed better for the long tests. The differences in ability estimation accuracy were minimal under different correlation levels. This finding suggested that the ability correlation level had little effect on the ability estimation accuracy of the OMST-M approach. Compared with the two OATA algorithms, the algorithm based on the ACE had slightly higher ability estimation accuracy in most test settings of the long test, whereas the algorithm based on APE had better performance in the short test.
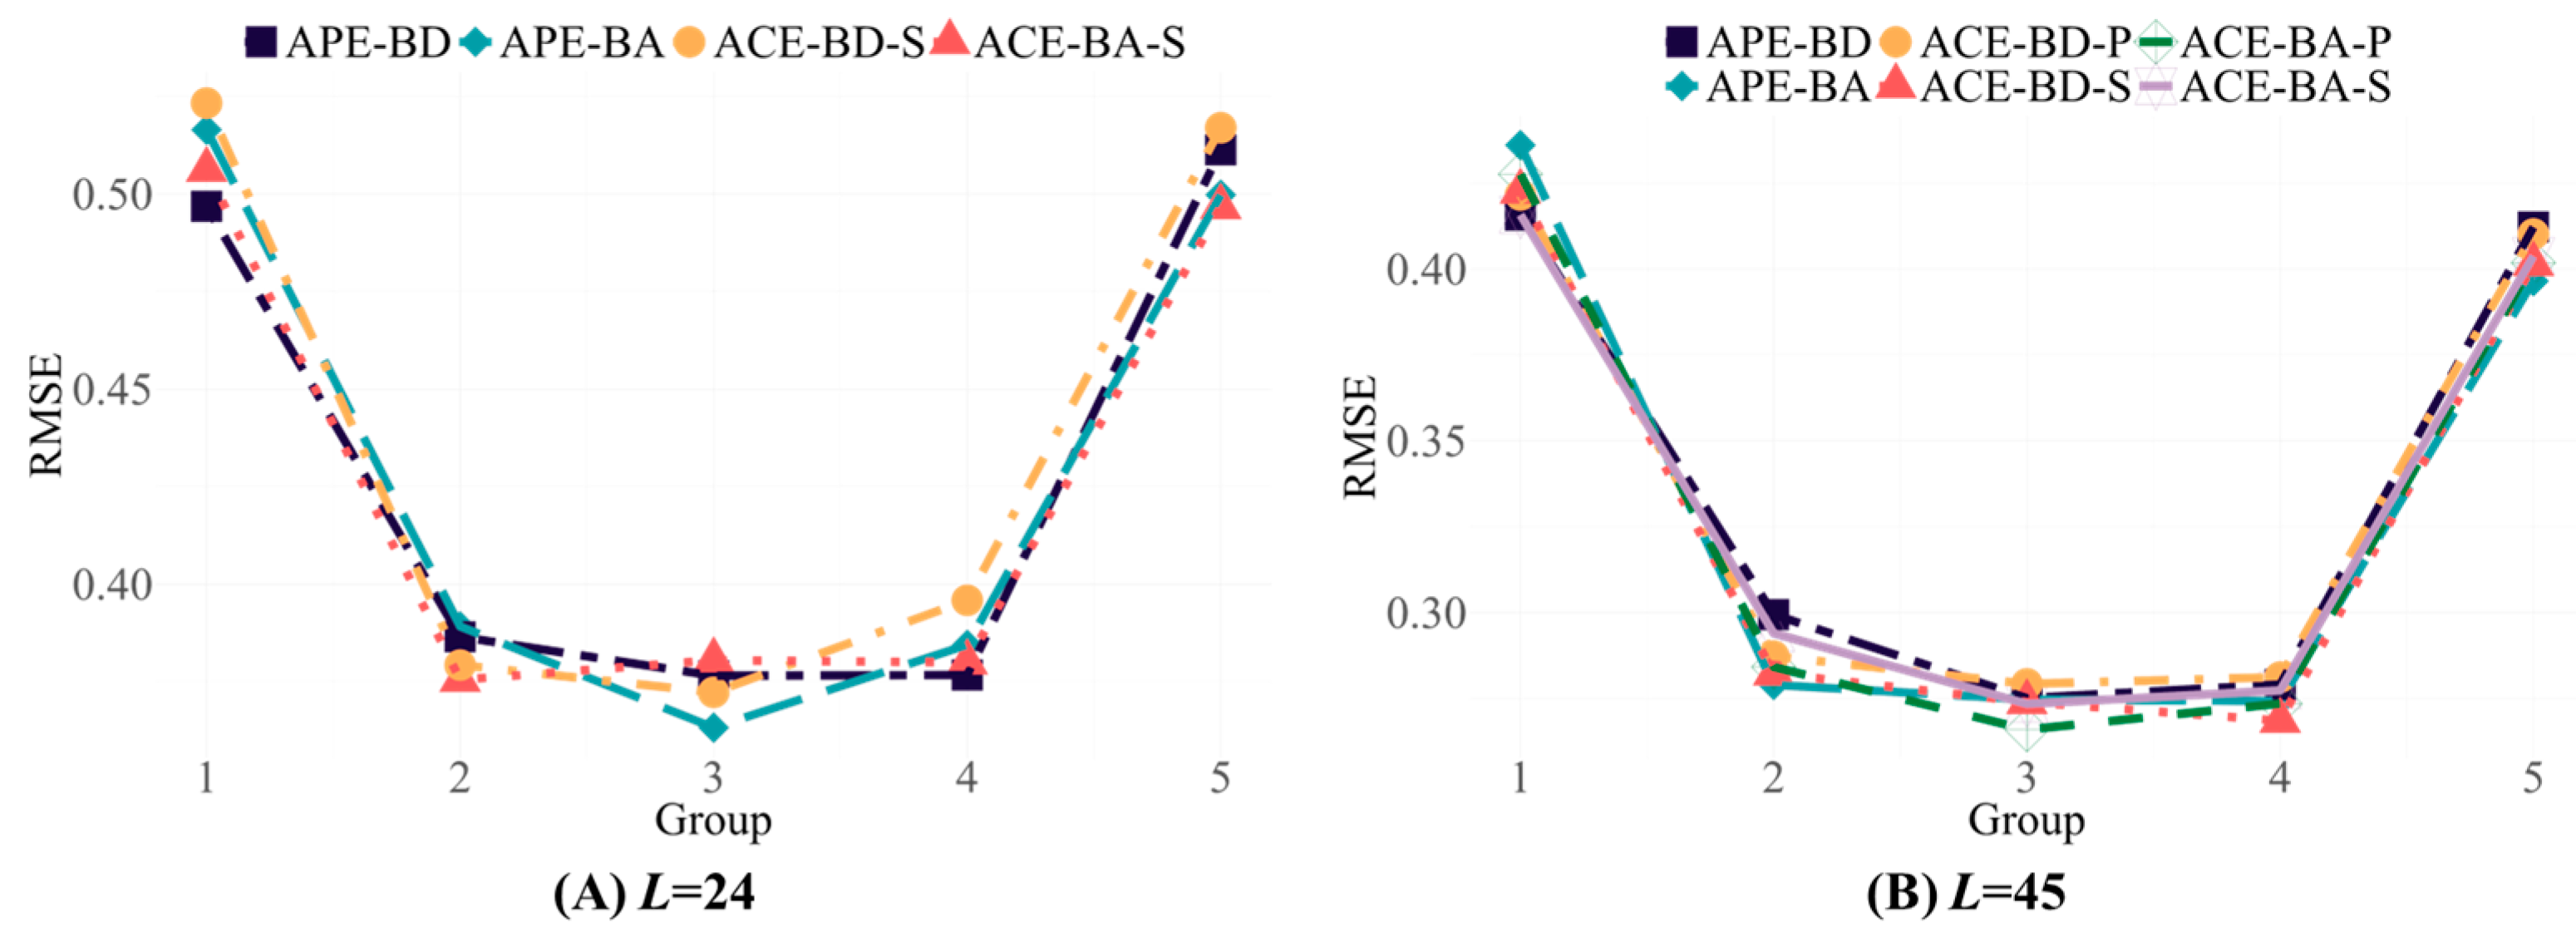
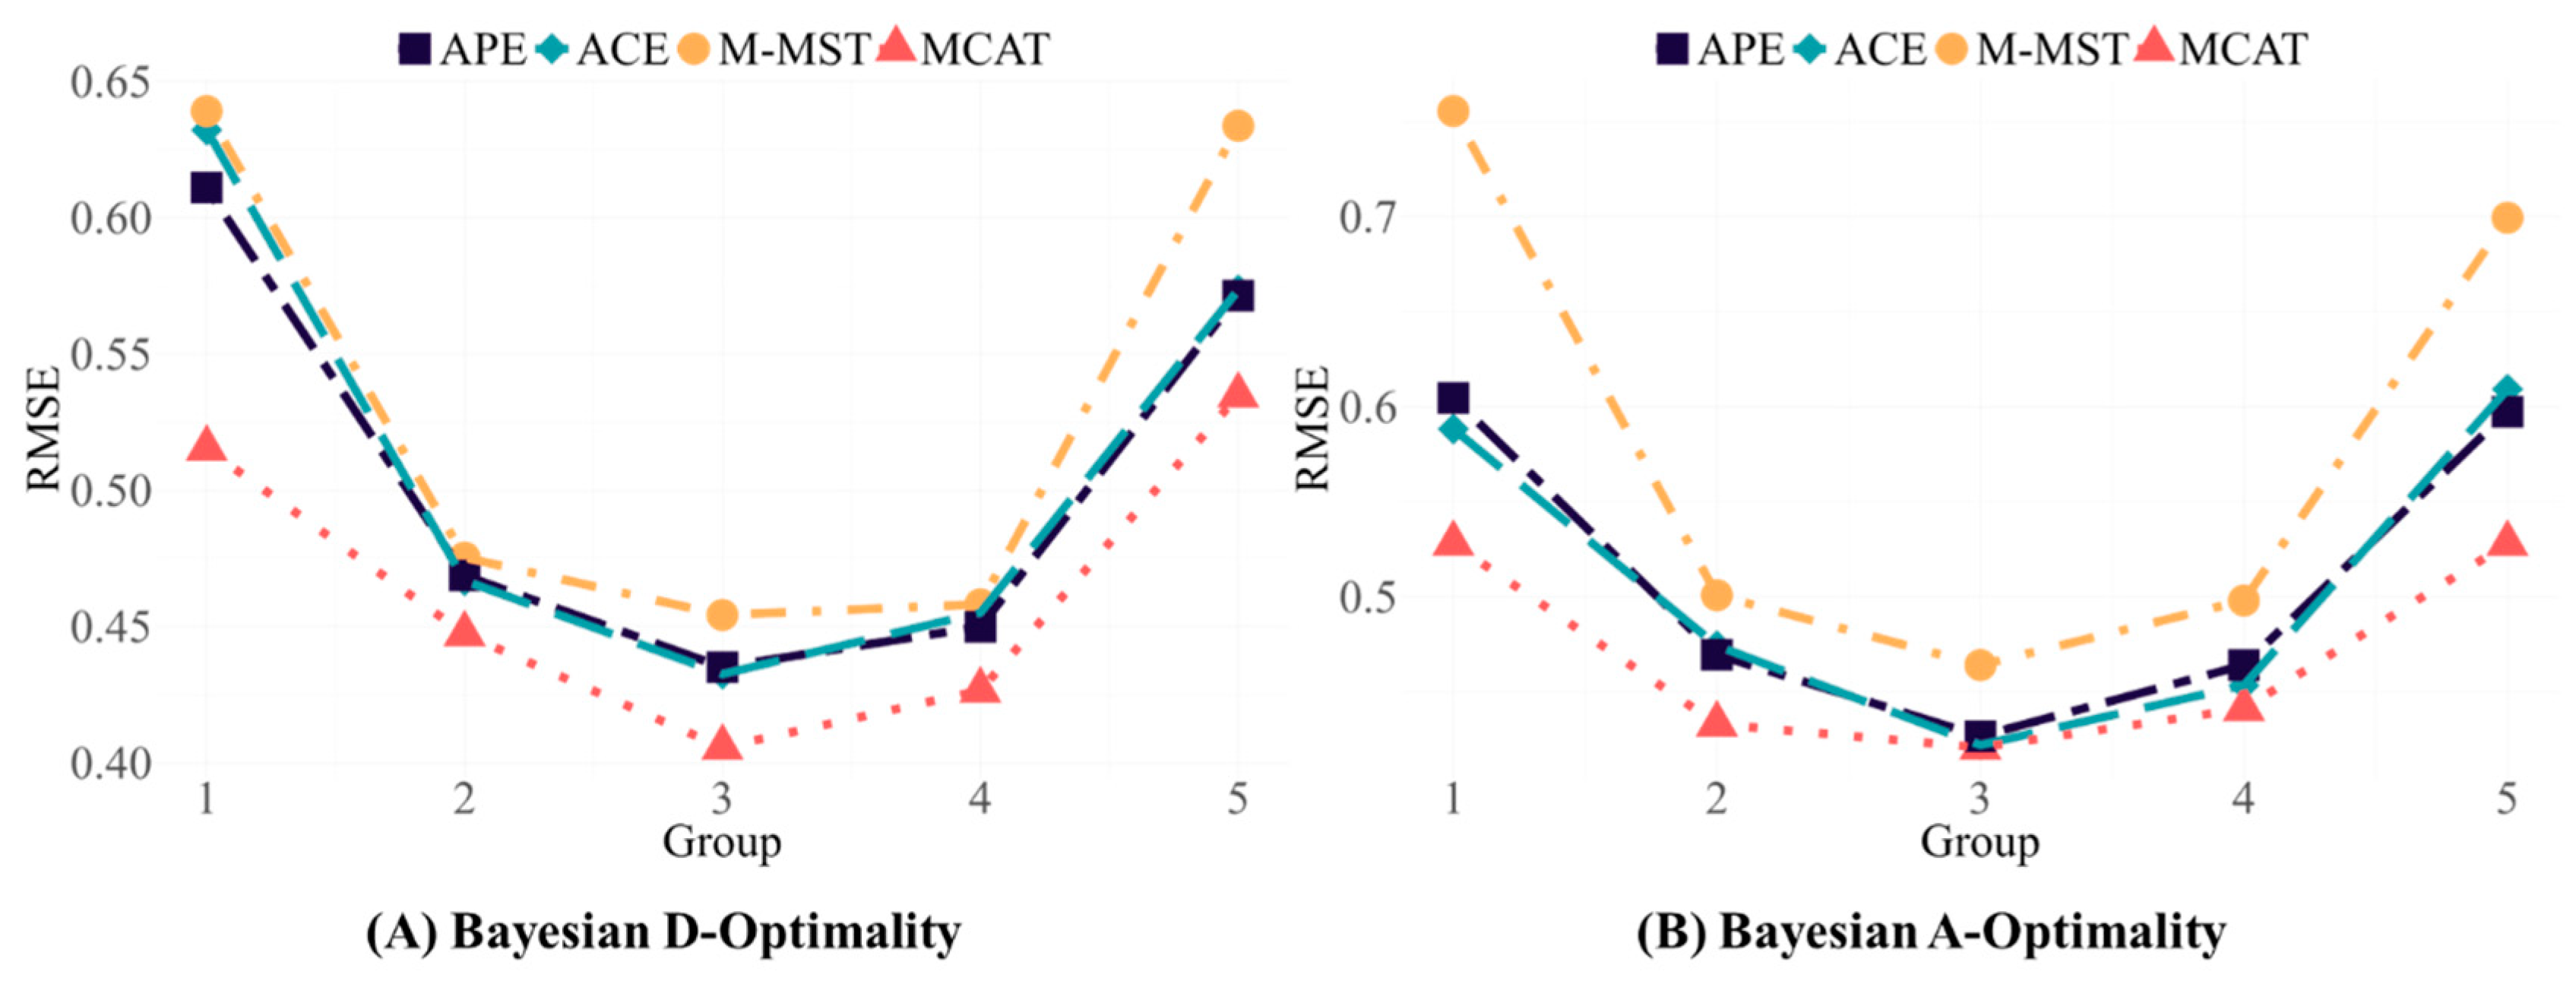
Given the similar results across the different test settings, we chose the four-dimensional test with r = 0.6 to explore the performance of OMST-M in more detail. Examinees’ abilities were grouped by each dimension, with Group 1 to Group 5 representing progressively higher levels of ability. The RMSEs for each dimension within each group were calculated, and then the average RMSEs across all the dimensions in each group were taken. Figure 3 shows the performance of the two OATA algorithms for the examinees with different ability levels, where the X-axis represents five groups of examinees with different ability levels. When the algorithms based on APE and the ACE were employed, the RMSEs for the medium-ability group were consistently lower than those for the low- and high-ability groups.
Table 2, Table 3 and Table 4 present the performance in item exposure control under different test settings. The item exposure control improved when the number of test dimensions was expanded, and it slightly decreased when the test length was extended. The correlation among abilities affected item exposure control: higher correlation levels led to more effective item exposure control. In most cases, when Bayesian A-optimality was used, the ERmax, χ 2 , and TOR values were lower, indicating better item exposure control. However, Bayesian D-optimality had lower values of χ 2 and TOR at high ability correlation levels (r = 0.6, r = 0.8) in the two-dimensional long tests. Under different test settings, the two OATA algorithms made little difference in terms of item exposure control.

3.4. Study 2

In practice, module lengths may need to be flexibly adjusted to match specific evaluation objectives. To investigate the flexibility of OMST-M in adjusting the module lengths in the test, Study 2 was conducted on the basis of Study 1. In Study 2, the number of ability dimensions was four, and the correlation level was r = 0.6. The content and enemy item settings were identical to those in Study 1, featuring two content categories and four enemy items. The test consisted of 30 items arranged in six stages. The first stage had 5 items, and the next five stages had 3, 4, 5, 6, and 7 items. Each stage requires at least one item from each content category, and enemy items should not be in the same module.
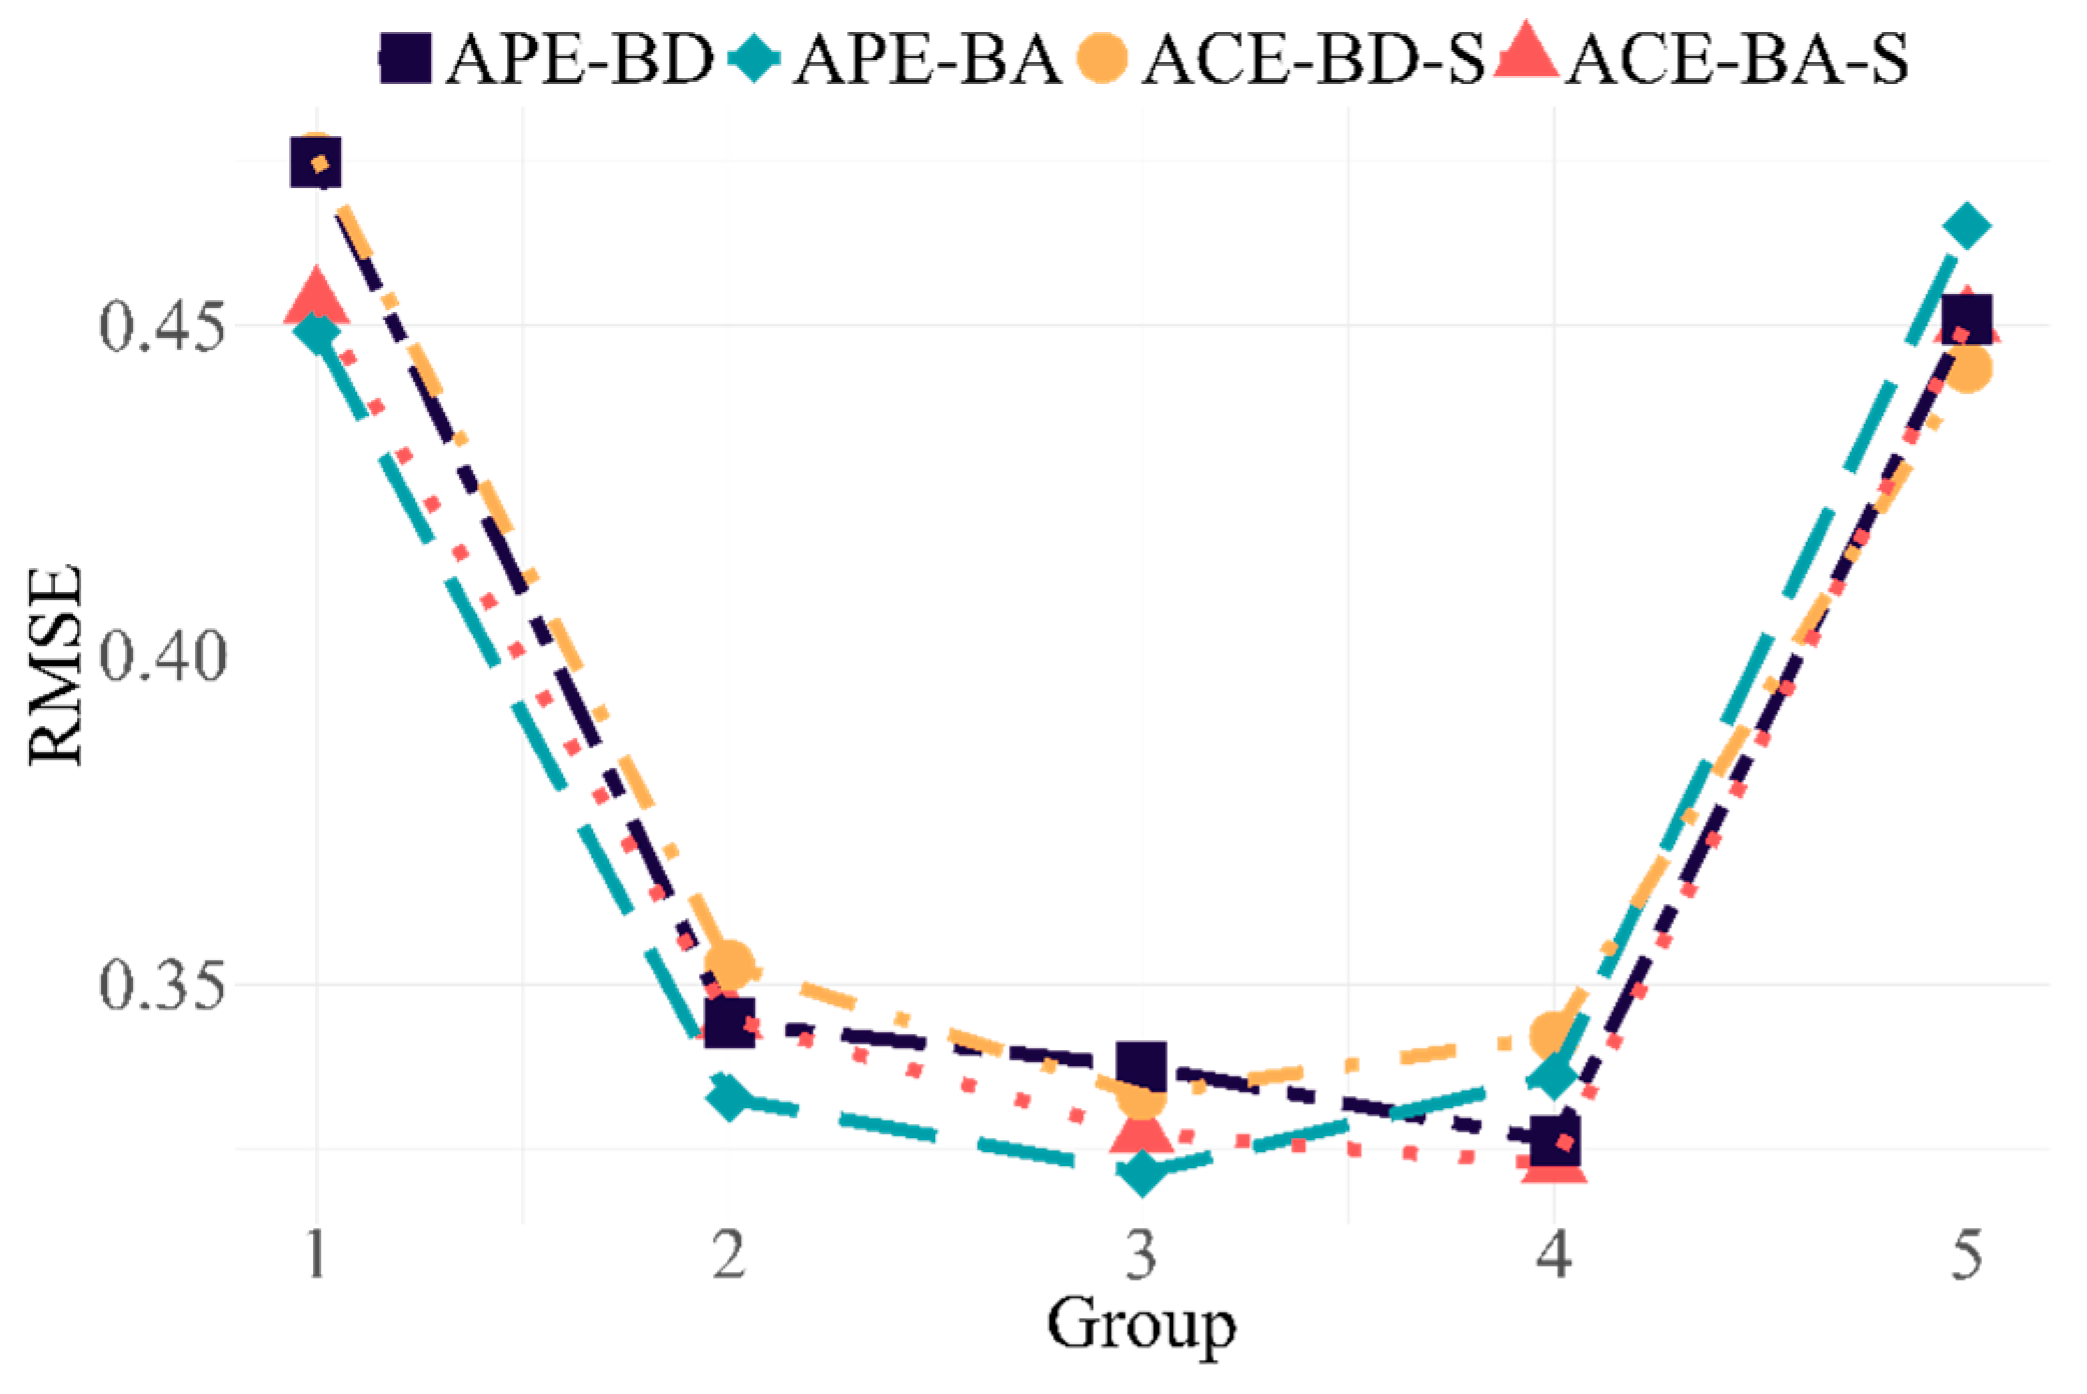
The results of Study 2 are presented in Table 5. The OMST-M approach had good measurement performance in the test with a nonfixed stage length. The ability estimation accuracy of the two OATA algorithms was comparable, with minimal differences observed. The Bayesian A-optimality outperformed the Bayesian D-optimality in terms of ability estimation accuracy and item exposure control, and it was consistent with the result observed during the four-dimensional long test in Study 1. Figure 4 shows the performance of the two OATA algorithms for examinees with different ability levels in this study. The results were consistent with those of Study 1. The two algorithms had higher ability estimation accuracy for examinees with medium-ability levels.
Study 2 demonstrated one advantage of OMST-M over M-MST. M-MST using the NWADH-A or NWADH-D algorithm needs to compute the TIFs for modules with different difficulties before assembling tests, and the value of the TIF is related to the difficulty and module length. Therefore, owing to the varying module lengths at each stage, a large number of TIFs needs to be computed. Furthermore, since the modules in M-MST are preassembled, the length cannot be adjusted once the test starts. The OMST-M approach effectively solves that problem. The dynamically assembled modules match the ability levels of the examinees and permit flexible adjustment of the module length without extra computations.

3.5. Study 3

Some vocational aptitude tests and educational assessments have strict requirements for test content. For example, in the ASVAB, each examinee must complete four categories of content: arithmetic reasoning, word knowledge, paragraph comprehension, and math knowledge [20,38]. When administering such tests, it is important to adjust the content of each stage in accordance with specific test goals. Study 3 aimed to further demonstrate the flexibility of the OMST-M approach: it permitted adjustments to the test content on the basis of the developer’s requirements, thereby satisfying the needs of assessments in various fields.
The typical test design in Study 1 was selected for Study 3. The test lengths were 24 items for the short one and 45 items for the long one. The short test consisted of four stages, whereas the long test had nine stages. The number of ability dimensions was four, and the correlation among these abilities was r = 0.6. The parameter settings of the items were the same as those in Study 1, whereas the settings of the content and the enemy items were different. In Study 3, the 1500 items in the item pool were divided into nine content categories, with 300 items in Content 1 and 150 items in each of the other contents. Additionally, two items in each content category were designated enemy items.
In Study 3, each stage included different content categories. In the two tests with different lengths, the first stage of the test used items from Content 1; in the short test, three categories of content were randomly assigned from the remaining eight categories, and items from these three categories were used sequentially in subsequent stages; in the long test, items from Content 2 through Content 8 were used sequentially in subsequent stages.
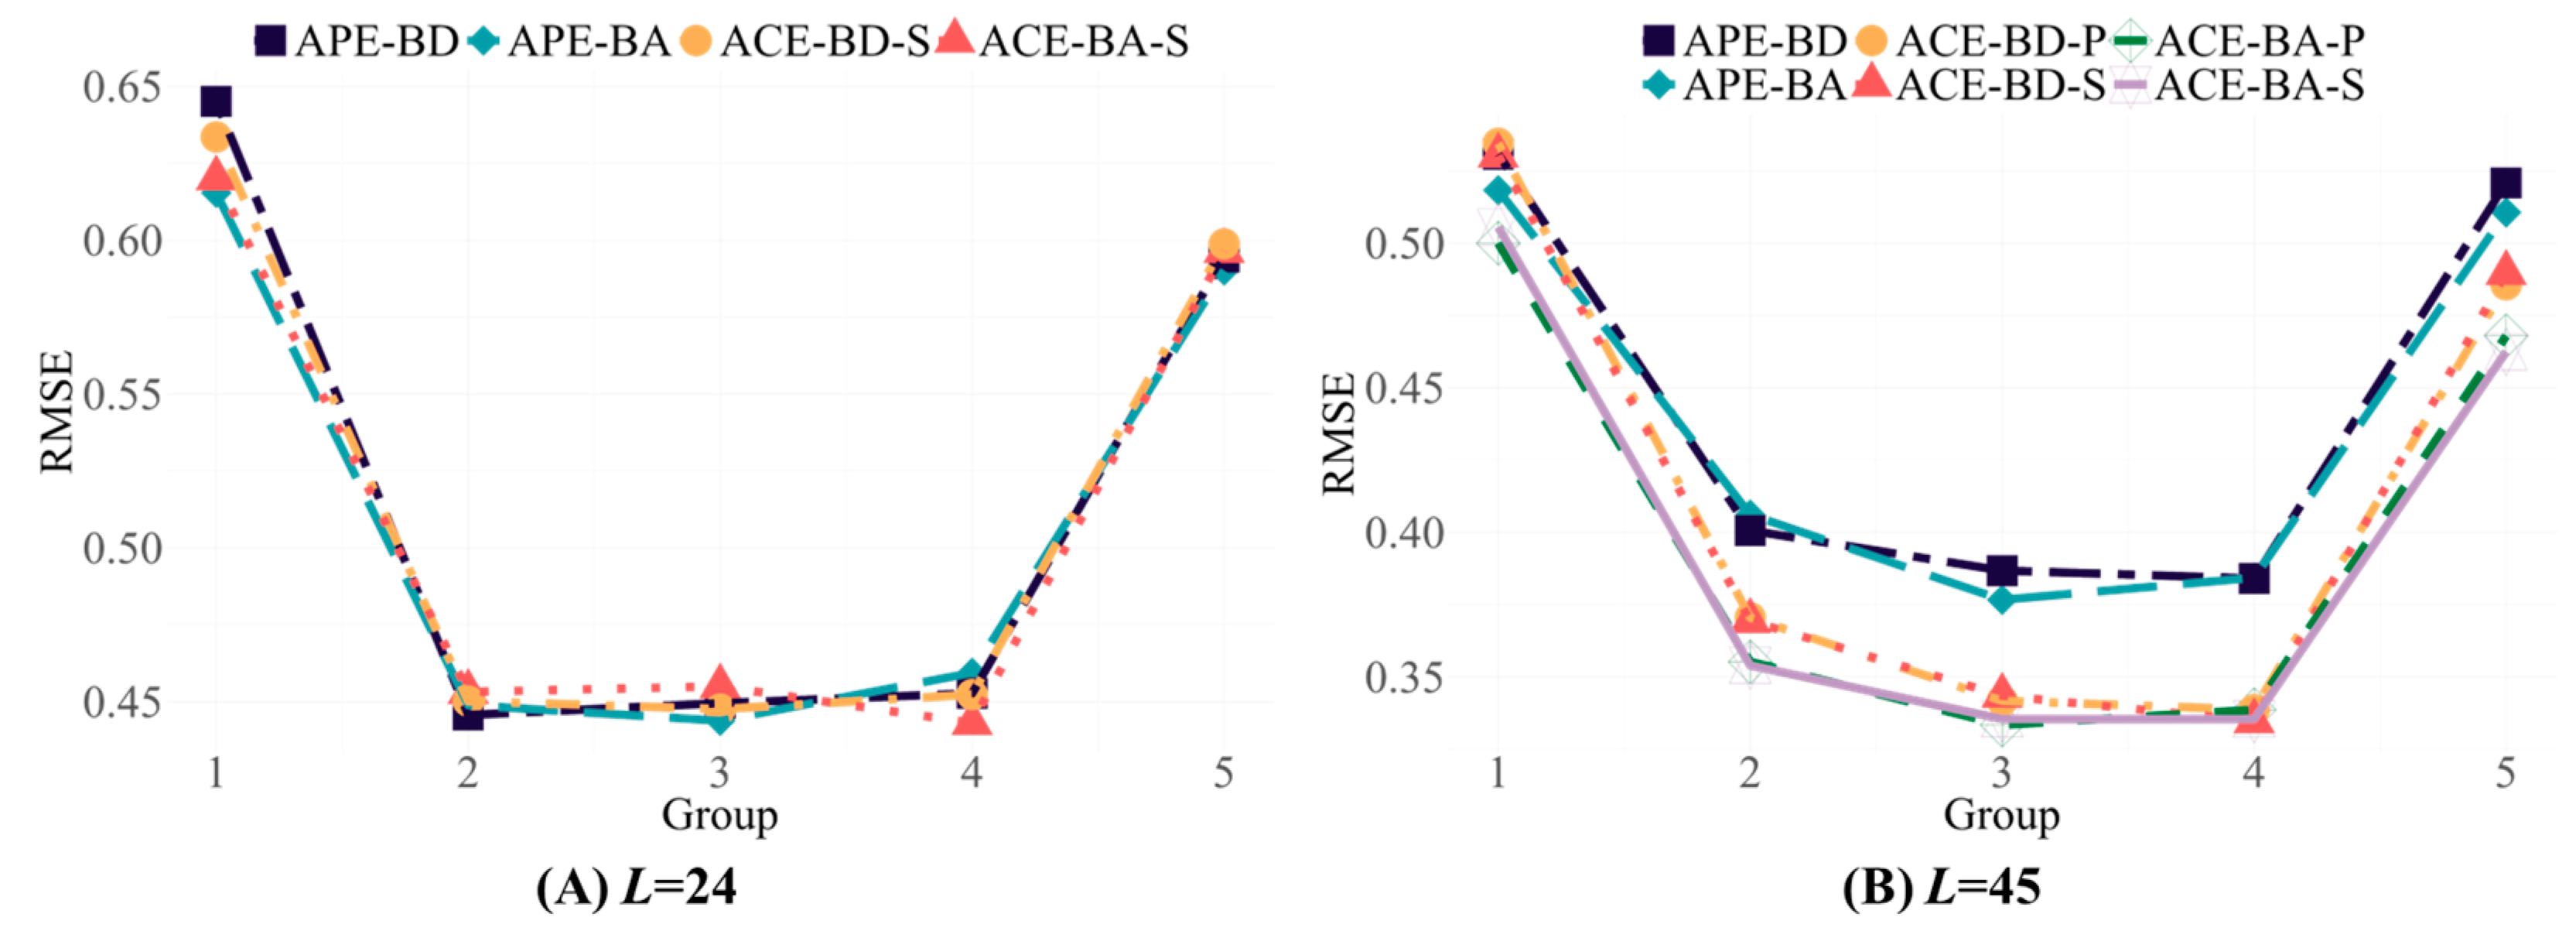
The performance of the OMST-M approach in terms of ability estimation accuracy and item exposure control under the test design of Study 3 is shown in Table 6. The results showed that the two OATA algorithms performed well in the new test design, indicating that the OMST-M approach effectively meets the requirements for content adjustments in tests. Specifically, the variation in ability estimation accuracy with test length was consistent with the results of Study 1, where the longer the test length was, the higher the ability estimation accuracy. Among the two FIM transformation methods, Bayesian A-optimality achieved higher ability estimation accuracy in different length tests. To further investigate the performance differences between the two OATA algorithms, the ability estimation accuracy was compared under the Study 3 design. The ability estimation accuracy of the algorithm based on the ACE was higher, especially in long tests. Unlike those in Study 1, the lengths of the tests extended, whereas the values of ERmax, χ 2 and TOR decreased. The possible reason for this result was that only items in three content categories were used in the short test, resulting in an imbalance in the use of items in the item pool and slightly larger values for the three indices of the item exposure control. Figure 5 illustrates the ability estimation accuracy of the two OATA algorithms across examinees with different ability levels in Study 3. The results indicated that the two algorithms in the OMST-M approach still had higher ability estimation accuracy for the mid-ability examinees, and the algorithm based on the ACE had slightly higher ability estimation accuracy for all ability level groups under the long test than did the algorithm based on APE.

4. Empirical Research

To verify the applicability of the OMST-M and OATA algorithms in empirical scenarios, four analyzed data for the fields of educational measurement, psychometrics, and medical measurements from the previous literature were selected for empirical research.
Considering that the size of the item pool in general practical tests was not very large, the number of parallel panels was set to two, the size of the item set with the highest f B D or f B A value was five items, and the item pool stratification was not included in the module assembly in the empirical research. The number of examinees was 1000, and the ability parameters were drawn from a multivariate normal distribution. The evaluation criteria were the same as those used in the simulation.
A comparison of the OMST-M approach with MCAT and M-MST was conducted on the first three data used in the empirical research. The initial stage module assembly in OMST-M and all stages in M-MST were assembled via the NWADH-BD and NAWDH-BA algorithms, and the item selection strategies in MCAT were performed via Bayesian A-optimality and Bayesian D-optimality, which were implemented via the mirtCAT package.

4.1. Data 1: A Large-Scale English Listening Comprehension Test of Third-Year High School Students in China

The Data 1 was chosen from the fitted information in the study of M-MST by Xu et al. (2022) [26]. To evaluate the performance of M-MST in a realistic scenario, the data for that research were collected from a large-scale English listening comprehension test of third-year high school students in China. The test consisted of 180 multiple-choice items that measured students’ comprehension ability and auditory processing ability. Xu et al. (2022) [26] calibrated the item parameters via the two-dimensional M2PLM from the mirt package and provided descriptive statistics for 180 item parameters. In this study, an item pool consisting of 180 items was simulated via M2PLM based on the descriptive statistics of the item parameters given by Xu et al. (2022) [26]. a j 1 was drawn from N ( 0.909 , 0.548 2 ) , a j 2 was drawn from N ( 0.903 , 0.511 2 ) , and b j was drawn from N ( 0.009 , 2.220 2 ) . The correlation among abilities was set to the medium correlation level: r = 0.6. The test consisted of three stages, each of which had five items.
Table 7 presents the measurement performance of OMST-M, MCAT, and M-MST based on Data 1. The results revealed that the estimation accuracy of OMST-M was better than that of M-MST and slightly worse than that of MCAT. The OMST-M approach performed well on the educational measurement data. The two OATA algorithms also performed well in realistic scenarios. The Bayesian D-optimality had greater estimation accuracy, which was consistent with the Bayesian D-optimality performance in the short tests in Study 1. For the performance of item exposure control, Bayesian D-optimality was better. The item exposure control of OMST-M performed slightly worse than MCAT did, possibly because there were only two parallel forms for the module in the initial stage of the OMST-M approach, which were used more often, resulting in an imbalanced use of the items in the item pool.
Figure 6 shows the performance of the three testing approaches across examinees with different ability levels. The RMSEs of the three testing approaches were lower for the mid-ability examinees than for the low- or high-ability examinees. Comparing the three testing approaches, the OMST-M approach had higher ability estimation accuracy than M-MST for all groups of examinees with different ability levels. The results illustrated the problem with the design of M-MST to a certain extent: the number of module difficulty levels was limited within M-MST, which could lead to a mismatch where higher-ability examinees are assigned to modules that are less challenging than their ability levels, and lower-ability examinees are directed to modules that are more difficult for them. The OMST-M approach could compensate for the inaccuracy in ability estimation of M-MST to some extent for examinees at the two extreme ends of the ability scale.

4.2. Data 2: Measurement of Psychological Resilience in Chinese Civil Aviation Pilots

The Data 2 was obtained from the fitted information in the study on the measurement of psychological resilience in Chinese civil aviation pilots by Zhao et al. (2024), who used factor analysis to derive two-factor resilience psychological frameworks labeled “Decisiveness” and “Adaptability” [39]. The item parameters were calibrated based on the multidimensional graded response model (MGRM). In this study, the M2PLM was used to simulate the item pool based on the range of item parameters calibrated in the study by Zhao et al. (2024) [39]. a j 1 was drawn from U ( 1.775 , 2.276 ) , and a j 2 was drawn from U ( 1.718 , 2.707 ) . In this study, the minimum and maximum values of the difficulty parameters calibrated by Zhao et al. (2024) [39] were taken for simulation. b j was drawn from U ( 4.014 , 2.118 ) . Each item was measured in only one dimension, and the correlation coefficient between the two dimensions was 0.6. There were 500 items in the item pool, and 250 items were measured in each dimension. The test had three stages, all of which had five items.
Table 8 shows the measurement performance of the three testing approaches based on Data 2. The proposed OMST-M approach outperforms M-MST in terms of both ability estimation accuracy and item exposure control. The performance of the OATA algorithms was closer. A comparison of the two FIM transformation methods revealed that Bayesian D-optimality had greater estimation accuracy and slightly worse item exposure control in the test based on Data 2.

4.3. Data 3: A Resilience Measurement Scale

The Data 3 was drawn from the fitted information in the study by Jiménez et al. (2023), who collected data on the Resilience Measurement Scale (RESI-M) in family caregivers of children with cancer, tested the five-factor structure of the RESI-M via the full-information confirmatory MIRT graded response model, and estimated item parameters. The RESI-M measures examinees’ strength and self-confidence, social competence, family support, social support, and structure. The ability correlation matrix was 1.000 0.745 0.732 0.401 0.593 0.745 1.000 0.558 0.432 0.710 0.732 0.558 1.000 0.638 0.449 0.401 0.432 0.638 1.000 0.568 0.593 0.710 0.449 0.568 1.000 [22].
The item parameters were similarly designed on the basis of the minimum and maximum values of the difficulty parameters estimated in the study by Jiménez et al. (2023) [22]. Specifically, a j 1 was drawn from U ( 1.41 , 3.29 ) , a j 2 was drawn from U ( 1.60 , 2.96 ) , a j 3 was drawn from U ( 1.90 , 4.81 ) , a j 4 was drawn from U ( 3.14 , 4.88 ) , a j 5 was drawn from U ( 1.59 , 2.30 ) , and b j was drawn from U ( 3.36 , 1.74 ) . There were 500 items in the item pool, and 100 items were measured in each dimension. The test had five stages, all of which had six items.
Table 9 shows the results of the tests based on Data 3. The testing approaches were ranked by ability estimation accuracy in descending order: OMST-M, M-MST, and MCAT. Each item in Data 3 was designed to measure only one dimension. To obtain a comprehensive assessment of all latent traits, constraints were imposed on the dimensions measured by the items in the first stage of the OMST-M approach and M-MST, ensuring that each dimension was adequately covered. The constraint was not applied in the MCAT implemented via the mirtCAT function, which could result in fewer items measuring certain latent traits of examinees, leading to lower estimation accuracy of these latent traits and ultimately reducing the overall ability estimation accuracy of MCAT. For Data 3, the OMST-M approach outperformed the other two testing approaches in terms of ability estimation accuracy and item exposure control. This suggested that OMST-M maintained an advantage when handling relatively higher-dimensional, structurally complex data.

4.4. Data 4: A Schizophrenia Quality of Life Questionnaire

The Data 4 was drawn from the fitted information in the study of MCAT developed by Michel et al. (2018) on the basis of the schizophrenia quality of life questionnaire. Michel et al. (2018) collected data from 517 patients on the schizophrenia quality of life questionnaire (SQoL), validated the eight-factor structure of the SQoL via factor analysis, and calibrated the parameters of the 41 items via the MGRM. The parameter calibration was implemented via the MH-RM method in the mirt package [40]. The test measures self-esteem, resilience, autonomy, sentimental life, physical well-being, relationships with family, relationships with friends, and psychological well-being in schizophrenic patients. The ability correlation matrix was 1.00 0.70 0.30 0.38 0.70 1.00 0.30 0.50 0.30 0.30 1.00 0.37 0.38 0.50 0.37 1.00 0.59 0.63 0.55 0.58 0.75 0.77 0.63 0.73 0.24 0.26 0.24 0.31 0.52 0.50 0.44 0.54 0.59 0.75 0.24 0.52 0.63 0.77 0.26 0.50 0.55 0.63 0.24 0.44 0.58 0.73 0.31 0.54 1.00 0.75 0.68 0.69 0.75 1.00 0.63 0.69 0.68 0.63 1.00 0.57 0.69 0.69 0.57 1.00 .
In this study, the range of item parameters calibrated in Michel et al.’s [40] study was used to simulate the Data 4 item pool via the M2PLM. The discrimination parameter settings were as follows: a j 1 was drawn from U ( 1.442 , 2.359 ) , a j 2 was drawn from U ( 1 . 506 , 2 . 826 ) , a j 3 was drawn from U ( 1 . 706 , 3 . 378 ) , a j 4 was drawn from U ( 1 . 535 , 2 . 775 ) , a j 5 was drawn from U ( 1 . 58 , 1 . 988 ) , a j 6 was drawn from U ( 1 . 254 , 2 . 553 ) , a j 7 was drawn from U ( 1 . 137 , 3 . 376 ) , and a j 8 was 2.314. The difficulty parameters b j were drawn from U ( 2 . 54 , 1 . 65 ) . There were 800 items in the item pool, and 100 items were measured in each dimension. The test consisted of nine stages, with the first stage having nine items and each of the remaining eight stages having three items. The goal of the SQoL was to measure examinees comprehensively in as short a test as possible and to minimize examinees’ burden while ensuring measurement precision; therefore, the design of Study 3 was used. There was at least one item measuring each dimension in the initial stage to ensure comprehensiveness. The items in each of the subsequent stages measured only one dimension, the eight stages measured different dimensions to ensure ability estimation accuracy on each dimension, and the stage length was set to three to shorten the length of the entire test and reduce patient burden.
Since the design of Data 4 was specifically intended to demonstrate the advantages and characteristics of OMST-M in flexibly adjusting content at each stage, the OMST-M approach in this study was not compared with traditional MCAT or M-MST. Taking into account the findings of Study 3, the power function for fitting the quantiles of the F-distribution within the ACE was employed for the relatively long test based on Data 4. The results in Table 10 show that the OMST-M approach could be well adapted to complex tests and flexibly adjusted according to the test requirements. Data 4 contained eight-dimensional data, which further illustrated that the OMST-M approach was still effective in higher-dimensional tests and had high ability estimation accuracy. Comparing the two OATA algorithms, the algorithm based on APE slightly outperformed the algorithm based on the ACE in terms of ability estimation accuracy and item exposure control. These results differed from those of Study 3. The test in Study 3 was within-item multidimensional, whereas the test based on Data 4 was between-item multidimensional. The difference in item-trait patterns might be the reason why the results of the two tests were different. The results indicated that item-trait patterns might impact the estimation accuracy. The ability estimation accuracy was greater when Bayesian A-optimality was used, and item exposure control was slightly worse.

5. Conclusions and Discussion

This study proposes multidimensional on-the-fly assembled multistage adaptive testing based on the M2PLM (OMST-M). The novel testing approach overcomes some challenges faced by previous approaches to address the complexities of test designs in multidimensional assessments. The core innovation of OMST-M lies in its integration of the strengths of CAT and MST, fortified by the benefits of MIRT. Two OATA algorithms are proposed for OMST-M, which enable on-the-fly adaptation on the basis of the examinees’ abilities and test requirements, ensuring that the test is both efficient and accurate in measuring the examinees’ abilities. The adaptability and versatility of the OMST-M approach, coupled with the precision of the OATA algorithms based on APE and the ACE, ensure its broad utility in various test settings. The OMST-M enables flexible, modular design frameworks, effectively addressing the growing demand for contextually-grounded test items in adaptive testing systems. This research provides educators, psychologists, and researchers with a new tool for comprehensive and accurate ability measurement.
The findings from both the simulation and the empirical research are summarized as follows. Firstly, the OMST-M approach and the two OATA algorithms exhibited high ability estimation accuracy. Specifically, in the four-dimensional test of Study 1, the RMSEs ranged from 0.41 to 0.42 in the short test and from 0.29 to 0.33 in the long test. Secondly, the OMST-M approach had a good performance in item exposure control. In the four-dimensional long test of Study 1, the maximum item exposure rate was less than 0.5, and the TOR values were less than 0.15, indicating that the item pool stratification and the randomly selected strategy in the set of items with the highest f B D or f B A values could effectively control item exposure to ensure test security. Thirdly, the results of the empirical research showed that for groups of examinees with different ability levels, the OMST-M approach had higher ability estimation accuracy than the M-MST did, and the OMST-M approach outperformed the MCAT by a small margin on the Resilience Measurement Scale (RESI-M). Compared with M-MST and MCAT, OMST-M also has a unique advantage in test administration and flexibility, and can well support a variety of complex test designs. Fourthly, from the test design and performance of Studies 2 and 3, it can be concluded that the OMST-M approach can flexibly adjust the content and length of each stage to meet diverse testing needs and has relatively high application value.
Suggestions for the application of the OMST-M approach include the following. Firstly, using Bayesian A-optimality in long tests (e.g., the test with 45 items in Study 1) and Bayesian D-optimality in short tests (e.g., the test with 24 items in Study 1). The results of the Empirical Research further validate this suggestion. In the studies based on Data 1 and Data 2, where the test lengths are both 15 items, the ability estimation accuracy is higher for the tests using Bayesian D-optimality. Whereas in the studies based on Data 3 and Data 4, where the test lengths are 30 and 33 items, the ability estimation accuracy is higher in most cases for tests using Bayesian A-optimality. The results of Study 1 indicated that the OATA algorithms using Bayesian A-optimality demonstrated superior estimation accuracy and better item exposure control in the long test. Secondly, Study 1 revealed that when the OATA algorithm based on the ACE was used, different quantiles of the F-distribution settings significantly affected the measurement precision of the test. Choosing appropriate quantile settings can improve the effectiveness of the OATA algorithm based on the ACE, leading to improved measurement accuracy. The current study used power functions and S-curves to fit the quantiles through pilot study attempts, which performed better. The suggested principle for setting is that the quantile of the F-distribution decreases as the stage progresses. If there is a desire to explore whether the measurement precision using the OATA algorithm based on the ACE can continue to be improved, other functions can be tried, or a specialized systematic study can be conducted in the future. Thirdly, by analyzing the results of the tests with different numbers of stages in Studies 1 and 3, it is suggested that the OATA algorithm based on the ACE be used in tests with a relatively high number of stages (e.g., the long test consisting of nine stages in Study 1). When the algorithm based on the ACE is used, the setting of quantiles that decrease with the progress of the stage has high measurement precision. The setting of the quantile above gradually decreases the range of the confidence ellipse to approach the true ability value. Therefore, in the test with more stages, the confidence ellipse will shrink to the range closer to the true ability value, which makes the items in the on-the-fly assembly modules more closely match the examinee’s ability level and improves the ability estimation accuracy. Fourthly, in practical applications, the length and nonstatistical constraints of each stage in the test need to be designed in conjunction with the structure of the latent trait (e.g., the number of latent trait dimensions and the item-trait patterns) and the content characteristics of the test, an example of which is the schizophrenia quality of life questionnaire in the empirical research. The item-trait pattern in that test is between-item multidimensional. The test length of the first stage should not be less than the number of latent trait dimensions, and each dimension should be measured by at least one item so that the first stage can provide a comprehensive initial measurement of the examinees’ latent traits. Finally, Equation (18) shows that when the OATA algorithm based on the ACE is used, the number of completed items needs to be greater than the number of dimensions of the latent trait; otherwise, the confidence ellipsoid for ability estimation cannot be calculated. In the initial stages of some tests, when the number of completed items does not meet the requirements, the OATA algorithms based on APE and the ACE can be flexibly combined; specifically, the algorithm based on APE is used when the number of completed items does not exceed the number of dimensions, and the algorithm based on the ACE is used when the number of completed items satisfies Equation (18).
This paper has demonstrated the strengths of the OMST-M approach through three simulation studies. Study 1 revealed that the OMST-M approach had high ability estimation accuracy and good item exposure control across multiple test settings (numbers of dimensionalities, correlations among abilities, and test lengths), indicating good generalizability. In Study 2, the length of each stage in the test was not a fixed value, demonstrating the flexibility of the OMST-M approach. Study 3 further explores the adaptability of OMST-M, with the module of each stage measuring different contents. The OMST-M approach effectively implements the content control of test and modular design, both of which are consistent with the needs of practical applications, for instance, in examining students’ learning of different units of knowledge and examining different aspects of job candidates’ abilities. M-MST can also implement the above two test designs, but a large number of modules needs to be preassembled before the test starts. M-MST using modified NWADH algorithms requires calculating TIFs for modules of different lengths, contents, and difficulties, which significantly increases the complexity and workload of the test administration. In contrast, the OMST-M approach can flexibly adjust the test content and stage lengths during the test process via the proposed OATA algorithms without many additional computations. M-MST is a valuable modular test design approach for assessing multiple latent traits. On the basis of its inspiration, the OMST-M approach developed in this paper can provide more flexibility in test assembly than can M-MST to some extent.
In summary, the OMST-M approach meets the needs of multidimensional assessment by providing comprehensive information on multiple latent traits and offering high measurement precision of examinees’ abilities. The OMST-M approach inherits the advantages of M-MST, flexibly addressing various nonstatistical constraints (e.g., enemy items do not appear within the same stage, maximum number of items per content category) via the OATA algorithms to control test content and quality. Additionally, the OMST-M approach can effectively control item exposure, enhancing test security. In the OMST-M approach, examinees can freely review and change their answers within each stage, reducing psychological stress. In addition to its ability to effectively administer tests, the design of OMST-M further enhances testing efficiency and accuracy by dynamically assembling modules on the basis of examinees’ ability levels. The design of OMST-M allows test organizers to flexibly adjust test difficulty, length, and content during the testing process and assemble modules related to specific complex tasks, making it adaptable to complex testing scenarios and meeting the needs of multiple fields, such as educational measurement and psychometrics.
In large-scale international assessments such as the Programme for the International Assessment of Adult Competencies and PISA, relying on the same test setting (e.g., examinees with different native languages use the same item pool) is impractical because of differences between country and intra-country groups [41]. To address these challenges, the OMST-M approach provides flexibility in adjusting the lengths, content, and sub-pools used for the assembly of modules, as demonstrated in Studies 2 and 3. In practical applications, OMST-M addresses the challenge of adjusting module difficulty for diverse examinee groups by assembling modules on the fly on the basis of individual ability levels. These on-the-fly assembled modules make the OMST-M approach less impacted by variations in examinee groups, significantly reducing the complexity and workload of test administration. This flexibility of the OMST-M approach is particularly beneficial in educational and vocational assessments, where the ability to tailor tests to examinees is crucial. For example, in a reading ability test, an item pool consisting of items with different contents and difficulties can be constructed in advance for a given passage of text. During the test, modules based on the text can be assembled on the fly according to the examinees’ ability levels. In the STEM learning ability measurement, the item pool consists of several sub-pools, each of which includes a passage of textual material of the new knowledge content and several related items, which are aimed at examining the examinee’s mastery of the new knowledge. During the test, a passage of textual material is provided to the examinee at each stage, and the module for that stage is assembled in the sub-pool corresponding to the material. The more correct answers an examinee provides, the greater his mastery of new knowledge and learning ability.
In addition, an important direction for future applications of the OMST-M approach is digital teaching. The rapid progress of information technology has facilitated knowledge acquisition. With the popularization of diverse electronic devices, individuals can easily access online learning platforms, resulting in profound changes in teaching methods. Digital teaching enhances the flexibility and accessibility of education by allowing learning to occur beyond traditional classroom boundaries, breaking the temporal and spatial constraints of educational resources [42]. However, one potential challenge faced by the mode of education is the difficulty for educators in capturing the immediate feedback of each learner intuitively. This presents challenges for educators in quickly adjusting the depth and breadth of teaching content and customizing individualized instructional strategies on the basis of students’ learning progress, comprehension ability, and interest preferences. The OMST-M approach effectively addresses this critical challenge in digital teaching. Educators can use the OMST-M approach to develop tests adaptable to different types of teaching content, accurately understand each student’s knowledge mastery in a timely manner, and carry out more targeted teaching. Students can use tests to measure their abilities at any time and clarify their learning directions [18]. In the future, with the further development of the current OMST-M and the updating approach of its item pool, the proposed approach may play a more significant role in multidimensional assessments.
This current study can be strengthened in the following aspects. Firstly, it should be noted that the study presented the performance under multiple basic designs of the OMST-M approach, which can be varied in several aspects. In order to more fully utilize the strengths of the various adaptive tests, future study may also be carried out to combine the OMST-M approach with MCAT appropriately. A possible reasonable design is to shrink the length of each stage successively to achieve a smooth transition from the OMST-M approach to MCAT, similarly to the research of Wang et al. (2016), in which this was named HCAT [11]. Secondly, note that the item selection and test termination strategies may have potential overfitting risks. For instance, the problem was discussed for MCAT by Segall (1996) [9]. The risks may stem directly from the inherent limitations of item selection strategies, as well as potentially from several design aspects in the adaptive testing framework. In practical application, the following measures can help reduce the risks for the OMST-M approach to a certain extent: ensuring a sufficiently large item pool and diverse items; appropriate exposure control strategies to limit item reuse; the more precise control over test length based on practical specific measurement objectives; reasonable setting of the prior distribution for Bayesian item-selection indices. Note that for the prior distribution, the studies in this paper adopted an identity matrix as the prior covariance matrix. If more reliable information can be obtained, the prior distribution can be adjusted accordingly. For instance, practical test administration may consider analyzing the previous information or preliminary measuring before large-scale assessments. Thirdly, the proposed algorithms used Bayesian A-optimality or Bayesian D-optimality for FIM transformation, and other possible alternative FIM transformation methods in the OMST-M can be further explored [26]. As the reviewers’ suggestions, the hybrid use of the above two indices in tests, such as setting Bayesian D-optimality for the first stage and later changing to Bayesian A-optimality, is also a direction worth exploring, and detailed evaluations of how the algorithms adapt and perform across different stages of the test could be explored in the future. Fourthly, the proposed two test assembly algorithms based on APE and the ACE can be further modified. The current test assembly algorithm based on the ACE utilized the information at the five nodes on the longest axis of the confidence ellipsoid. One suggestion for improving the test assembly algorithms based on the ACE worth considering is to use the integral of the information function over the confidence ellipsoid to assemble the modules [11]. The quantile of the F-distribution setting significantly impacts the final result of the test assembly algorithms based on the ACE. Therefore, exploring appropriate quantile settings represents a critical research direction. Fifthly, the OATA algorithm proposed for the OMST-M approach is heuristic, so future research could explore mathematical programming approaches in the OMST-M module assembly [17]. Sixthly, the item pool serves as the foundation of an adaptive test, making regular updating essential for maintaining test accuracy and reliability. Consequently, exploring how to appropriately replenish items within the framework of OMST-M is important for sustaining the test system in long-term operation. It is a noticeable problem that the number of ability quadrature vectors in NWADH-BD and NWADH-BA increases rapidly with the increase of the number of dimensions of the test. The use of random multivariate samples could be considered to address this problem in high-dimensional tests in future research. Additionally, since some tests involve polytomous-scored items, extending OMST-M to be constructed based on MIRT models such as the MGRM and the multidimensional generalized partial credit model could further promote its application [43,44]. At the same time, extending OMST-M to cognitive diagnosis situations could be considered [45]. Furthermore, simulation and empirical research were conducted for examinees with a normal ability distribution. In practical tests, the ability distribution of the examinees does not necessarily follow a normal distribution. Note that a skewed ability level distribution in the examinee group can increase the number of low- or high-level examinees, potentially decreasing ability estimation accuracy when the proposed method is used [46]. For examinees with skewed ability distributions, the validity of OMST-M may be further explored in the future. Finally, research on artificial neural networks has broad applications across diverse fields and can potentially offer promising avenues for enhancing ability estimation accuracy and multidimensional assessments. By integrating neural network models with OMST-M in the future, the measurement effectiveness and versatility of psychometric data analysis may be significantly amplified [47].

Author Contributions

Conceptualization, J.L., J.S. and Y.L.; Methodology, J.L. and M.S.; Computing codes, J.L.; Writing—original draft, J.L., J.S., M.S., Y.L. and C.C.; Writing—review & editing, J.L., J.S., M.S., Y.L. and C.C. All authors have read and agreed to the published version of the manuscript.

Funding

This work was supported by the National Natural Science Foundation of China (No. 11701029), the National Social Science Fund of China (20CSH075), and the Key Project of the “14th Five-Year Plan” Education Science Planning of Hunan Province (XJK22AJC002).

Data Availability Statement

The data presented in this study are available on request from the corresponding author. The data are not publicly available due to privacy or ethical restrictions.

Acknowledgments

We would like to thank the editors and the reviewers for their insightful comments and valuable suggestions.

Conflicts of Interest

The authors declare no competing interests.

Abbreviations

The following abbreviations are used in this manuscript:
OMSTOn-the-fly assembled multistage adaptive testing
MIRTMultidimensional item response theory
CATComputerized adaptive testing
MSTMultistage adaptive testing
ATAAutomated test assembly
UIRTUnidimensional item response theory
MCATMultidimensional computerized adaptive testing
M-MSTMultidimensional multistage adaptive testing
OMST-MMultidimensional on-the-fly assembled multistage adaptive testing
OATAOn-the-fly automated test assembly
FIMFisher information matrix
APEAbility point estimation
ACEAbility confidence ellipsoid

References

  1. Chang, H.-H. Psychometrics behind computerized adaptive testing. Psychometrika 2015, 80, 1–20. [Google Scholar] [CrossRef]
  2. Stucky, B.D.; Edelen, M.O.; Sherbourne, C.D.; Eberhart, N.K.; Lara, M. Developing an item bank and short forms that assess the impact of asthma on quality of life. Respir. Med. 2014, 108, 252–263. [Google Scholar] [CrossRef] [PubMed]
  3. Theunissen, M.H.C.; Eekhout, I.; Reijneveld, S.A. Computerized adaptive testing to screen pre-school children for emotional and behavioral problems. Eur. J. Pediatr. 2024, 183, 1777–1787. [Google Scholar] [CrossRef] [PubMed]
  4. Achtyes, E.D.; Halstead, S.; Smart, L.; Moore, T.; Frank, E.; Kupfer, D.J.; Gibbons, R. Validation of computerized adaptive testing in an outpatient nonacademic setting: The VOCATIONS trial. Psychiatr. Serv. 2015, 66, 1091–1096. [Google Scholar] [CrossRef]
  5. Harrison, P.M.C.; Collins, T.; Müllensiefen, D. Applying modern psychometric techniques to melodic discrimination testing: Item response theory, computerised adaptive testing, and automatic item generation. Sci. Rep. 2017, 7, 3618. [Google Scholar] [CrossRef] [PubMed]
  6. Cheng, Y.; Chang, H.-H. The maximum priority index method for severely constrained item selection in computerized adaptive testing. Br. J. Math. Stat. Psychol. 2009, 62, 369–383. [Google Scholar] [CrossRef]
  7. Hendrickson, A. An NCME instructional module on multistage testing. Educ. Meas. Issues Pract. 2007, 26, 44–52. [Google Scholar] [CrossRef]
  8. Chang, H.-H.; Ying, Z. To weight or not to weight? Balancing influence of initial items in adaptive testing. Psychometrika 2008, 73, 441–450. [Google Scholar] [CrossRef]
  9. Segall, D.O. Multidimensional adaptive testing. Psychometrika 1996, 61, 331–354. [Google Scholar] [CrossRef]
  10. Luecht, R.M. Computer-assisted test assembly using optimization heuristics. Appl. Psychol. Meas. 1998, 22, 224–236. [Google Scholar] [CrossRef]
  11. Wang, S.; Lin, H.; Chang, H.-H.; Douglas, J. Hybrid computerized adaptive testing: From group sequential design to fully sequential design. J. Educ. Meas. 2016, 53, 45–62. [Google Scholar] [CrossRef]
  12. Yan, D.; Von Davier, A.A.; Lewis, C. Computerized Multistage Testing: Theory and Applications; Chapman and Hall/CRC: New York, NY, USA, 2014. [Google Scholar]
  13. Van Der Linden, W.J.; Breithaupt, K.; Chuah, S.C.; Zhang, Y. Detecting differential speededness in multistage testing. J. Educ. Meas. 2007, 44, 117–130. [Google Scholar] [CrossRef]
  14. Wang, C.; Chen, P.; Jiang, S. Item calibration methods with multiple subscale multistage testing. J. Educ. Meas. 2020, 57, 3–28. [Google Scholar] [CrossRef]
  15. Zheng, Y.; Nozawa, Y.; Gao, X.; Chang, H.-H. Multistage Adaptive Testing for a Large-Scale Classification Test: The Designs, Automated Heuristic Assembly, and Comparison with Other Testing Modes; ACT, Inc.: Lowa City, lA, USA, 2012. [Google Scholar]
  16. Luo, X.; Kim, D. A top-down approach to designing the computerized adaptive multistage test. J. Educ. Meas. 2018, 55, 243–263. [Google Scholar] [CrossRef]
  17. Zheng, Y.; Chang, H.-H. On-the-fly assembled multistage adaptive testing. Appl. Psychol. Meas. 2015, 39, 104–118. [Google Scholar] [CrossRef]
  18. Chang, H.-H.; Wang, C.; Zhang, S. Statistical applications in educational measurement. Annu. Rev. Stat. Its Appl. 2021, 8, 439–461. [Google Scholar] [CrossRef]
  19. Cai, L.; Choi, K.; Hansen, M.; Harrell, L. Item response theory. Annu. Rev. Stat. Its Appl. 2016, 3, 297–321. [Google Scholar] [CrossRef]
  20. Yao, L. Comparing the performance of five multidimensional CAT selection procedures with different stopping rules. Appl. Psychol. Meas. 2013, 37, 3–23. [Google Scholar] [CrossRef]
  21. Michel, P.; Baumstarck, K.; Ghattas, B.; Pelletier, J.; Loundou, A.; Boucekine, M.; Auquier, P.; Boyer, L. A multidimensional computerized adaptive short-form quality of life questionnaire developed and validated for multiple sclerosis: The MusiQoL-MCAT. Medicine 2016, 95, e3068. [Google Scholar] [CrossRef]
  22. Jiménez, S.; Moral de la Rubia, J.; Varela-Garay, R.M.; Merino-Soto, C.; Toledano-Toledano, F. Resilience measurement scale in family caregivers of children with cancer: Multidimensional item response theory modeling. Front. Psychiatry 2023, 13, 985456. [Google Scholar] [CrossRef]
  23. Reckase, M.D. Multidimensional Item Response Theory; Springer: New York, NY, USA, 2009. [Google Scholar]
  24. Yao, L. Reporting valid and reliable overall scores and domain scores. J. Educ. Meas. 2010, 47, 339–360. [Google Scholar] [CrossRef]
  25. Tu, D.; Han, Y.; Cai, Y.; Gao, X. Item selection methods in multidimensional computerized adaptive testing with polytomously scored items. Appl. Psychol. Meas. 2018, 42, 677–694. [Google Scholar] [CrossRef] [PubMed]
  26. Xu, L.; Wang, S.; Cai, Y.; Tu, D. The automated test assembly and routing rule for multistage adaptive testing with multidimensional item response theory. J. Educ. Meas. 2022, 58, 538–563. [Google Scholar] [CrossRef]
  27. Reckase, M.D. The difficulty of test items that measure more than one ability. Appl. Psychol. Meas. 1985, 9, 401–412. [Google Scholar] [CrossRef]
  28. Veldkamp, B.P.; van der Linden, W.J. Multidimensional adaptive testing with constraints on test content. Psychometrika 2002, 67, 575–588. [Google Scholar] [CrossRef]
  29. Mulder, J.; van der Linden, W.J. Multidimensional adaptive testing with optimal design criteria for item selection. Psychometrika 2009, 74, 273–296. [Google Scholar] [CrossRef] [PubMed]
  30. Debeer, D.; van Rijn, P.W.; Ali, U.S. Multidimensional test assembly using mixed-Integer linear programming: An application of Kullback–Leibler information. Appl. Psychol. Meas. 2020, 44, 17–32. [Google Scholar] [CrossRef]
  31. Van der Linden, W.J.; Glas, C.A. Elements of Adaptive Testing; Springer: New York, NY, USA, 2010. [Google Scholar]
  32. Luecht, R.M.; Nungester, R.J. Some practical examples of computer-adaptive sequential testing. J. Educ. Meas. 1998, 35, 229–249. [Google Scholar] [CrossRef]
  33. Johnson, R.A.; Wichern, D.W. Applied Multivariate Statistical Analysis; Pearson: Upper Saddle River, NJ, USA, 2007. [Google Scholar]
  34. Chalmers, R. Philip. Mirt: A Multidimensional Item Response Theory Package for the R Environment. J. Stat. Softw. 2012, 48, 1–29. [Google Scholar] [CrossRef]
  35. Chalmers, R. Philip. Generating Adaptive and Non-Adaptive Test Interfaces for Multidimensional Item Response Theory Applications. J. Stat. Softw. 2016, 71, 1–38. [Google Scholar] [CrossRef]
  36. Chang, H.-H.; Ying, Z. a-Stratified multistage computerized adaptive testing. Appl. Psychol. Meas. 1999, 23, 211–222. [Google Scholar] [CrossRef]
  37. Chen, S.-Y.; Ankenmann, R.D.; Spray, J.A. The relationship between item exposure and test overlap in computerized adaptive testing. J. Educ. Meas. 2003, 40, 129–145. [Google Scholar] [CrossRef]
  38. Su, Y.-H.; Huang, Y.-L. Using a Modified Multidimensional Priority Index for Item Selection Under Within-Item Multidimensional Computerized Adaptive Testing. In Quantitative Psychology Research; Springer: Cham, Switzerland, 2015; pp. 227–242. [Google Scholar]
  39. Zhao, Y.; Zhu, K.; Zhang, J.; Liu, Z.; Wang, L. Exploring the measurement of psychological resilience in Chinese civil aviation pilots based on generalizability theory and item response theory. Sci. Rep. 2024, 14, 1856. [Google Scholar] [CrossRef]
  40. Michel, P.; Baumstarck, K.; Lancon, C.; Ghattas, B.; Loundou, A.; Auquier, P.; Boyer, L. Modernizing quality of life assessment: Development of a multidimensional computerized adaptive questionnaire for patients with schizophrenia. Qual. Life Res. 2018, 27, 1041–1054. [Google Scholar] [CrossRef] [PubMed]
  41. Yamamoto, K.; Shin, H.J.; Khorramdel, L. Multistage adaptive testing design in international large-scale assessments. Educ. Meas. Issues Pract. 2018, 37, 16–27. [Google Scholar] [CrossRef]
  42. Bond, M.; Marín, V.I.; Dolch, C.; Bedenlier, S.; Zawacki-Richter, O. Digital transformation in German higher education: Student and teacher perceptions and usage of digital media. Int. J. Educ. Technol. High. Educ. 2018, 15, 48. [Google Scholar] [CrossRef]
  43. Cui, C.; Wang, C.; Xu, G. Variational estimation for multidimensional generalized partial credit model. Psychometrika 2024, 89, 929–957. [Google Scholar] [CrossRef]
  44. Yao, L.; Schwarz, R.D. A multidimensional partial credit model with associated item and test statistics: An application to mixed-format tests. Appl. Psychol. Meas. 2006, 30, 469–492. [Google Scholar] [CrossRef]
  45. Chang, Y.-P.; Chiu, C.-Y.; Tsai, R.-C. Nonparametric CAT for CD in educational settings with small samples. Appl. Psychol. Meas. 2019, 43, 543–561. [Google Scholar] [CrossRef] [PubMed]
  46. Guo, H.; Johnson, M.S.; McCaffrey, D.F.; Gu, L. Practical Considerations in Item Calibration With Small Samples Under Multistage Test Design: A Case Study. ETS Res. Rep. Ser. 2024, 2024, 1–21. [Google Scholar] [CrossRef]
  47. Ma, H.; Zeng, Y.; Yang, S.; Qin, C.; Zhang, X.; Zhang, L. A novel computerized adaptive testing framework with decoupled learning selector. Complex Intell. Syst. 2023, 9, 5555–5566. [Google Scholar] [CrossRef]
Figure 1. The basic framework of the OMST-M. θ ^ i is the ability estimates of the ith examinee after completing the test.
Mathematics 13 00594 g001
Figure 2. Heatmap of CORmean in Study 1. (A) Two-Dimensional Short Test; (B) Two-Dimensional Long Test; (C) Four-Dimensional Short Test; (D) Four-Dimensional Long Test.
Mathematics 13 00594 g002
Figure 3. Average RMSEs of five ability groups using two algorithms in Study 1. (A) L = 24. (B) L = 45.
Mathematics 13 00594 g003
Figure 4. Average RMSEs of five ability groups for different algorithms in Study 2.
Mathematics 13 00594 g004
Figure 5. Average RMSEs of five ability groups for different algorithms in Study 3. (A) L = 24. (B) L = 45.
Mathematics 13 00594 g005
Figure 6. Average RMSEs of five ability groups for different algorithms on Data 1. (A) Bayesian D-optimality. (B) Bayesian A-optimality.
Mathematics 13 00594 g006
Table 1. Values of AME and RMSE for different test settings in Study 1.
DimensionCriterionLengthMethodAbility Correlation
r = 0r = 0.3r = 0.6r = 0.8
2AME24APE-BD0.24060.23910.23840.2377
APE-BA0.24110.23960.24000.2398
ACE-BD-S0.24050.23950.23860.2386
ACE-BA-S0.24140.24080.24010.2401
45APE-BD0.17220.17070.17100.1707
APE-BA0.17030.17000.17020.1706
ACE-BD-P0.17160.17170.17110.1715
ACE-BD-S0.17270.17180.17120.1711
ACE-BA-P0.17000.16990.16980.1705
ACE-BA-S0.17050.17000.16970.1709
RMSE24APE-BD0.30380.30240.30200.3012
APE-BA0.30450.30290.30390.3038
ACE-BD-S0.30410.30290.30260.3025
ACE-BA-S0.30470.30440.30410.3046
45APE-BD0.21670.21520.21550.2151
APE-BA0.21430.21440.21480.2154
ACE-BD-P0.21630.21640.21580.2164
ACE-BD-S0.21740.21620.21600.2158
ACE-BA-P0.21410.21410.21400.2150
ACE-BA-S0.21490.21430.21390.2156
4AME24APE-BD0.32660.32390.32450.3248
APE-BA0.32700.32430.32410.3250
ACE-BD-S0.32770.32550.32440.3246
ACE-BA-S0.32820.32410.32430.3255
45APE-BD0.23700.23880.24360.2472
APE-BA0.23560.23640.24110.2464
ACE-BD-P0.23760.23790.24240.2474
ACE-BD-S0.23700.23960.24230.2475
ACE-BA-P0.23540.23640.24160.2465
ACE-BA-S0.23520.23740.24100.2475
RMSE24APE-BD0.41240.41100.41520.4175
APE-BA0.41310.41100.41430.4168
ACE-BD-S0.41360.41320.41520.4169
ACE-BA-S0.41410.41100.41410.4177
45APE-BD0.29980.30470.31790.3274
APE-BA0.29810.30200.31450.3259
ACE-BD-P0.30030.30410.31680.3275
ACE-BD-S0.30040.30580.31670.3276
ACE-BA-P0.29810.30200.31520.3262
ACE-BA-S0.29750.30260.31450.3273
Table 2. Values of ERmax for different test settings in Study 1.
DimensionLengthMethodAbility Correlation
r = 0r = 0.3r = 0.6r = 0.8
224APE-BD0.43180.42860.42590.4262
APE-BA0.37940.37550.37300.3731
ACE-BD-S0.43340.43070.42730.4248
ACE-BA-S0.37630.37440.37480.3733
45APE-BD0.48050.47600.47180.4687
APE-BA0.47090.46760.46590.4634
ACE-BD-P0.47950.47800.47340.4706
ACE-BD-S0.48090.47800.47290.4686
ACE-BA-P0.47010.46780.46530.4622
ACE-BA-S0.47150.46730.46530.4621
424APE-BD0.40710.39290.38540.3810
APE-BA0.29820.29420.29090.2914
ACE-BD-S0.40880.39550.38680.3832
ACE-BA-S0.29870.29400.29130.2903
45APE-BD0.46530.43990.42240.4178
APE-BA0.39590.38070.36960.3622
ACE-BD-P0.46880.44180.42300.4185
ACE-BD-S0.46460.44000.42230.4150
ACE-BA-P0.39800.38000.37100.3645
ACE-BA-S0.39680.38080.37010.3620
Table 3. Values of χ 2 for different test settings in Study 1.
DimensionLengthMethodAbility Correlation
r = 0r = 0.3r = 0.6r = 0.8
224APE-BD169.4106164.9954161.2483159.2423
APE-BA145.6447142.9836141.3401140.4945
ACE-BD-S170.2012165.6403161.5834159.5222
ACE-BA-S145.3449143.2589141.5709140.5201
45APE-BD218.7603212.6216206.6847202.6580
APE-BA214.4596211.0808208.0882206.1588
ACE-BD-P219.1643213.2400206.8136202.9938
ACE-BD-S219.0680213.0171206.8542202.9952
ACE-BA-P214.3578211.1364208.0437205.9295
ACE-BA-S214.4445211.1243207.9785205.9838
424APE-BD137.8563124.4740116.9640113.2593
APE-BA98.718091.653587.303285.1963
ACE-BD-S139.7436125.7477117.7077113.9465
ACE-BA-S99.524892.545187.951185.7268
45APE-BD181.1263156.1218140.9700133.6089
APE-BA146.5193132.2581122.7577117.8514
ACE-BD-P180.3679155.8114140.2023132.9502
ACE-BD-S175.8449151.6775136.7156129.6231
ACE-BA-P147.8735133.1405123.3656118.3707
ACE-BA-S145.5385131.5690121.7714116.8047
Table 4. Values of TOR for different test settings in Study 1.
DimensionLengthMethodAbility Correlation
r = 0r = 0.3r = 0.6r = 0.8
224APE-BD0.12810.12510.12260.1213
APE-BA0.11220.11040.10930.1088
ACE-BD-S0.12860.12560.12280.1215
ACE-BA-S0.11200.11060.10950.1088
45APE-BD0.17500.17090.16700.1643
APE-BA0.17210.16990.16790.1666
ACE-BD-P0.17530.17130.16700.1645
ACE-BD-S0.17520.17120.16710.1645
ACE-BA-P0.17210.16990.16790.1665
ACE-BA-S0.17210.16990.16780.1665
424APE-BD0.10700.09810.09310.0906
APE-BA0.08090.07620.07330.0719
ACE-BD-S0.10830.09890.09360.0911
ACE-BA-S0.08140.07680.07370.0722
45APE-BD0.14990.13320.12310.1182
APE-BA0.12680.11730.11090.1077
ACE-BD-P0.14940.13300.12260.1178
ACE-BD-S0.14640.13020.12030.1155
ACE-BA-P0.12770.11790.11140.1080
ACE-BA-S0.12620.11680.11030.1070
Table 5. Ability estimation accuracy and item exposure control indices in Study 2.
MethodAMERMSE C O R m e a n E R m a x χ 2 TOR
APE-BD0.28690.36880.93040.3974131.33720.1067
APE-BA0.28550.36670.93100.3303105.38230.0893
ACE-BD-S0.28660.36850.93050.3955133.25560.1079
ACE-BA-S0.28560.36680.93100.3317105.06000.0891
Table 6. Ability estimation accuracy and item exposure control indices in Study 3.
LengthMethodAMERMSE C O R m e a n E R m a x χ 2 TOR
24APE-BD0.38170.48480.87770.6471236.45010.1728
APE-BA0.37900.48050.88000.7698308.71840.2210
ACE-BD-S0.38030.48320.87850.6471237.98450.1738
ACE-BA-S0.37890.48050.87990.7698310.69670.2224
45APE-BD0.32690.41970.90990.5629148.72370.1283
APE-BA0.32410.41620.91140.7527206.51850.1668
ACE-BD-P0.29850.38580.92410.5993160.53480.1362
ACE-BD-S0.29850.38580.92410.5993160.17430.1359
ACE-BA-P0.29460.38030.92620.7585222.68670.1776
ACE-BA-S0.29440.38030.92620.7585222.46360.1775
Table 7. Test performance based on Data 1.
MethodAMERMSE C O R m e a n E R m a x χ 2 TOR
OMST-MAPE-BD0.38080.48180.87891.000068.17950.4616
APE-BA0.38560.48670.87611.000070.34990.4736
ACE-BD-S0.38280.48430.87761.000068.30150.4622
ACE-BA-S0.38790.48390.87761.000069.96410.4715
MCATBD0.35620.44800.89640.863056.52390.3968
BA0.36330.45310.89450.935060.18550.4171
M-MSTBD0.40110.50240.86711.000057.62110.4029
BA0.43260.54430.84201.000061.04850.4219
Table 8. Test performance based on Data 2.
MethodAMERMSE C O R m e a n E R m a x χ 2 TOR
OMST-MAPE-BD0.28590.36480.93211.0000168.66480.3667
APE-BA0.29370.37600.92781.0000140.54640.3104
ACE-BD-S0.28530.36210.93311.0000167.20720.3638
ACE-BA-S0.29910.38130.92561.0000140.83590.3110
MCATBD0.27190.34310.94040.5020100.38860.2300
BA0.27160.34410.93990.470095.15870.2195
M-MSTBD0.30960.39390.92041.0000172.39910.3742
BA0.32650.41570.91101.0000152.60640.3345
Table 9. Test performance based on Data 3.
MethodAMERMSE C O R m e a n E R m a x χ 2 TOR
OMST-MAPE-BD0.30000.42270.90691.0000141.62430.3426
APE-BA0.30670.41930.90880.6690122.85160.3050
ACE-BD-S0.31600.43820.89951.0000144.40500.3482
ACE-BA-S0.30470.42020.90830.6660123.57480.3065
MCATBD0.47820.58470.83190.8570162.53990.3845
BA0.47470.58110.83370.7790144.93140.3492
M-MSTBD0.33690.44350.89761.0000176.94220.4133
BA0.34260.44750.89551.0000200.16460.4598
Table 10. Test performance based on Data 4.
MethodAMERMSE C O R m e a n E R m a x χ 2 TOR
APE-BD0.42070.54950.83691.0000112.06260.1204
APE-BA0.42060.54780.83811.0000115.51400.1248
ACE-BD-P0.42170.54980.83671.0000112.15510.1206
ACE-BA-P0.42120.54820.83781.0000115.36570.1246
Disclaimer/Publisher’s Note: The statements, opinions and data contained in all publications are solely those of the individual author(s) and contributor(s) and not of MDPI and/or the editor(s). MDPI and/or the editor(s) disclaim responsibility for any injury to people or property resulting from any ideas, methods, instructions or products referred to in the content.

