
Bi-Partitioned Feature-Weighted K-Means Clustering for Detecting Insurance Fraud Claim Patterns


Abstract
1. Introduction
2. Related Works
3. Methods
3.1. Classical K-Means
3.2. Distinguishing BPW K-Means from Fuzzy Clustering: Principles, Performance, and Applications
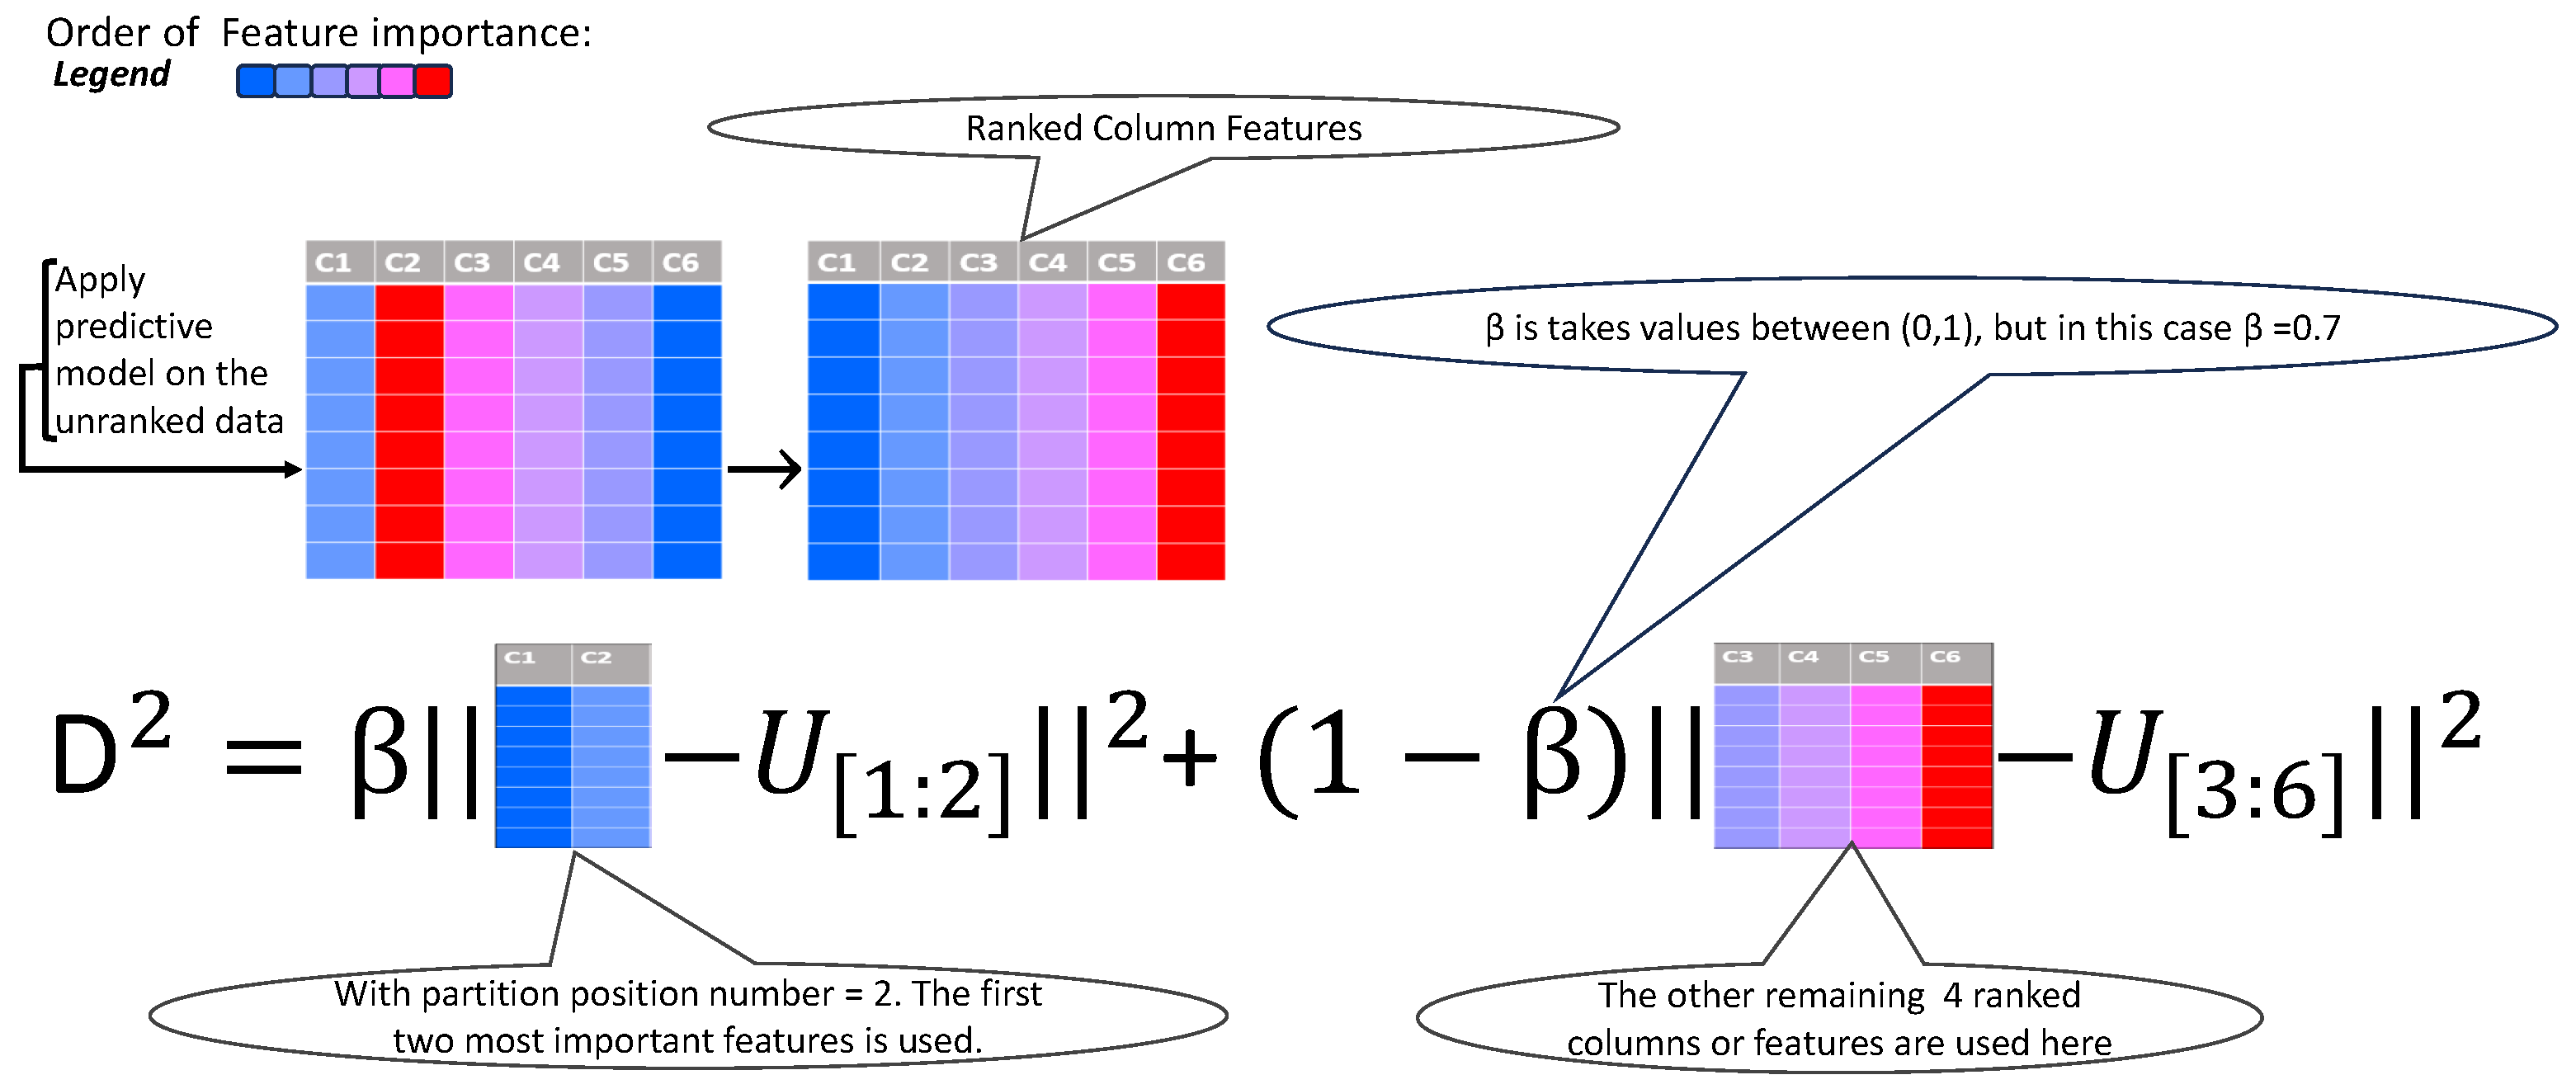
3.3. Bi-Partition Weighted K-Means
| Algorithm 1. The bi-partition weighted K-means algorithm for clustering |
then continue:
|
3.4. Clustering Performance Metrics
3.4.1. Rand Index (RI)
3.4.2. Adjusted Rand Index (ARI)
3.4.3. Algorithms for Measuring and Validating Clustering Quality Metrics
| Algorithm 2. Accuracy function used for measuring the accuracy of clusters. |
|
| Algorithm 3. Validation method for clustering performance metrics. |
|
4. Exploratory Analysis of Insurance Fraud Claims: Insights and Feature Rankings
5. Clustering Performance of BPW -Means vs. Classical -Means on the Insurance Fraud Claims Dataset: Ranked vs. Unranked Features
5.1. Empirical Analysis of Optimal and Bi-Partition Number Pairing
Output 1:
 Clustering Performance of the BPW K-Means Algorithm on
      the Insurance Fraud Claims Dataset---Ranked Features

Confusion Matrix and Statistics

Parameter Values Used:
Beta = 0.9, Bi-Partition Number = 1


  Fraudulent Non-Fraudulent
 1 44       3
 2 5 42

 Overall Statistics

        Accuracy: 0.9149
         95% CI: (0.8392, 0.9625)
  No Information Rate: 0.5213
  P-Value [Acc > NIR]: <2e-16

         Kappa: 0.8298

 McNemar's Test P-Value: 0.7237

      Sensitivity: 0.8980
      Specificity: 0.9333
     Pos Pred Value: 0.9362
     Neg Pred Value: 0.8936
       Precision: 0.9362
         Recall: 0.8980
           F1: 0.9167
       Prevalence: 0.5213
     Detection Rate: 0.4681
  Detection Prevalence: 0.5000
   Balanced Accuracy: 0.9156
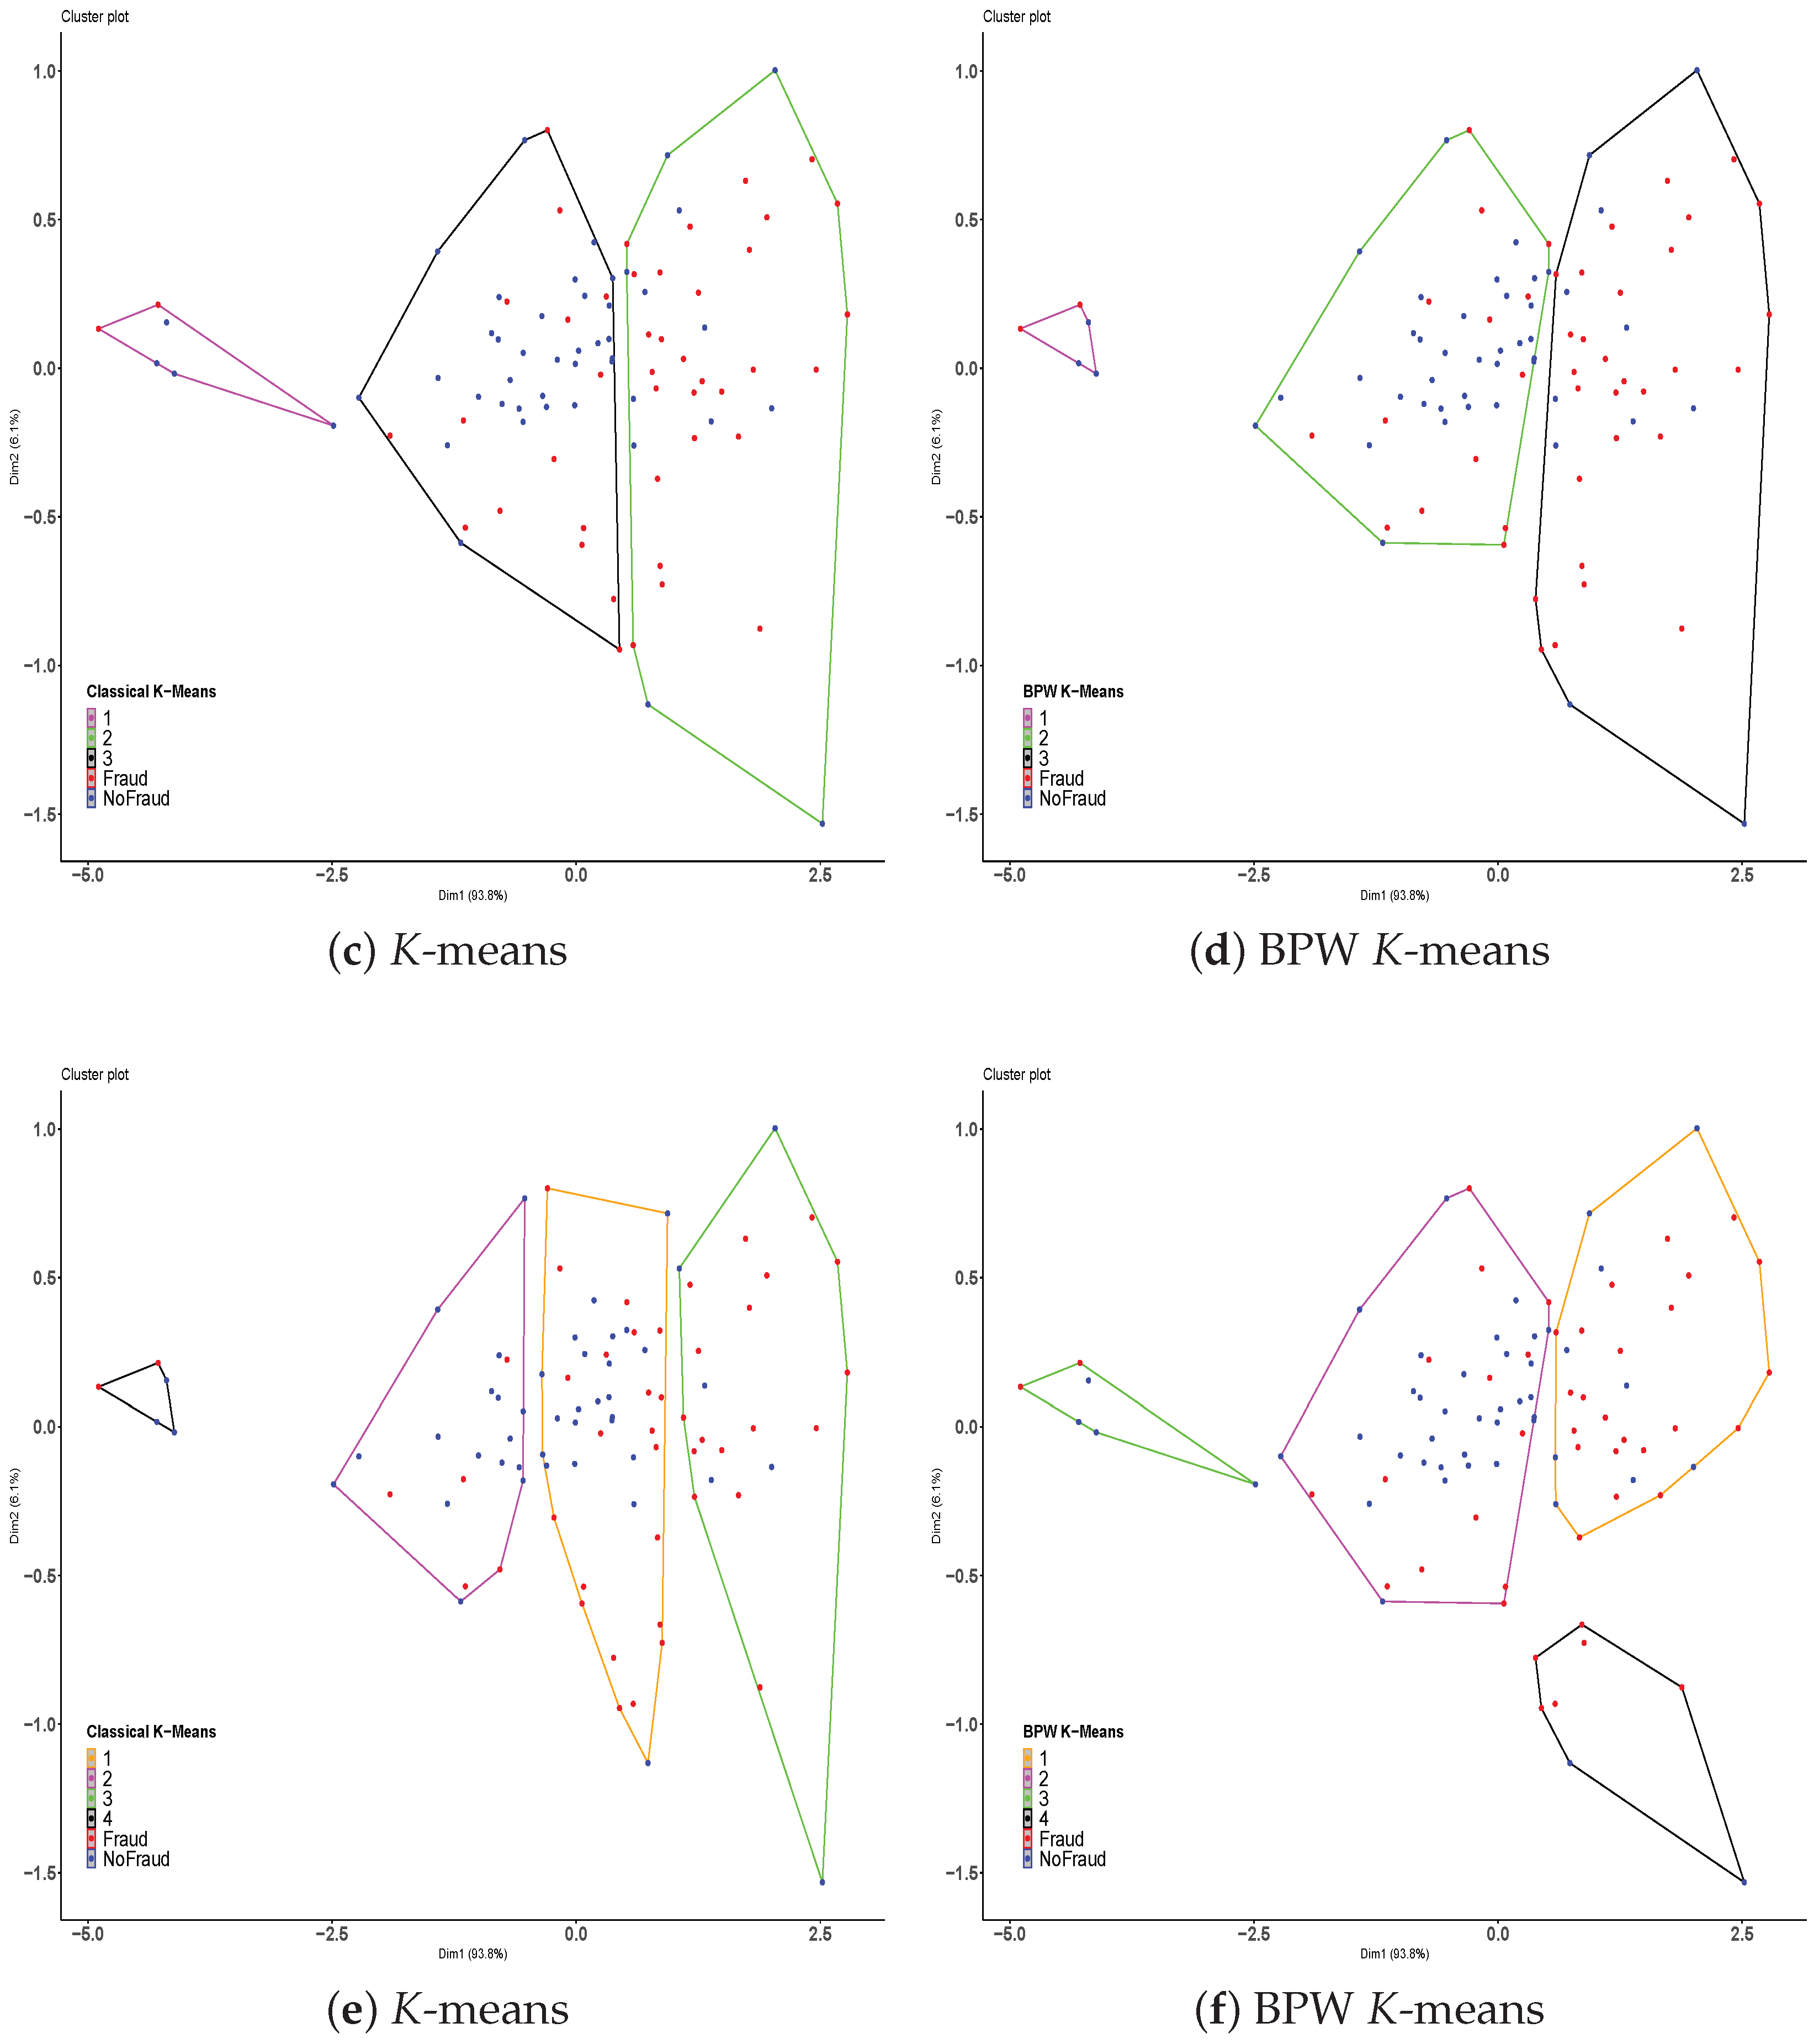
5.2. Classical K-Means and BPW K-Means Clustering of Insurance Claims
5.3. Comparative Evaluation of Clustering Performance: BPW K-Means vs. Classical K-Means Across Different Cluster Groupings
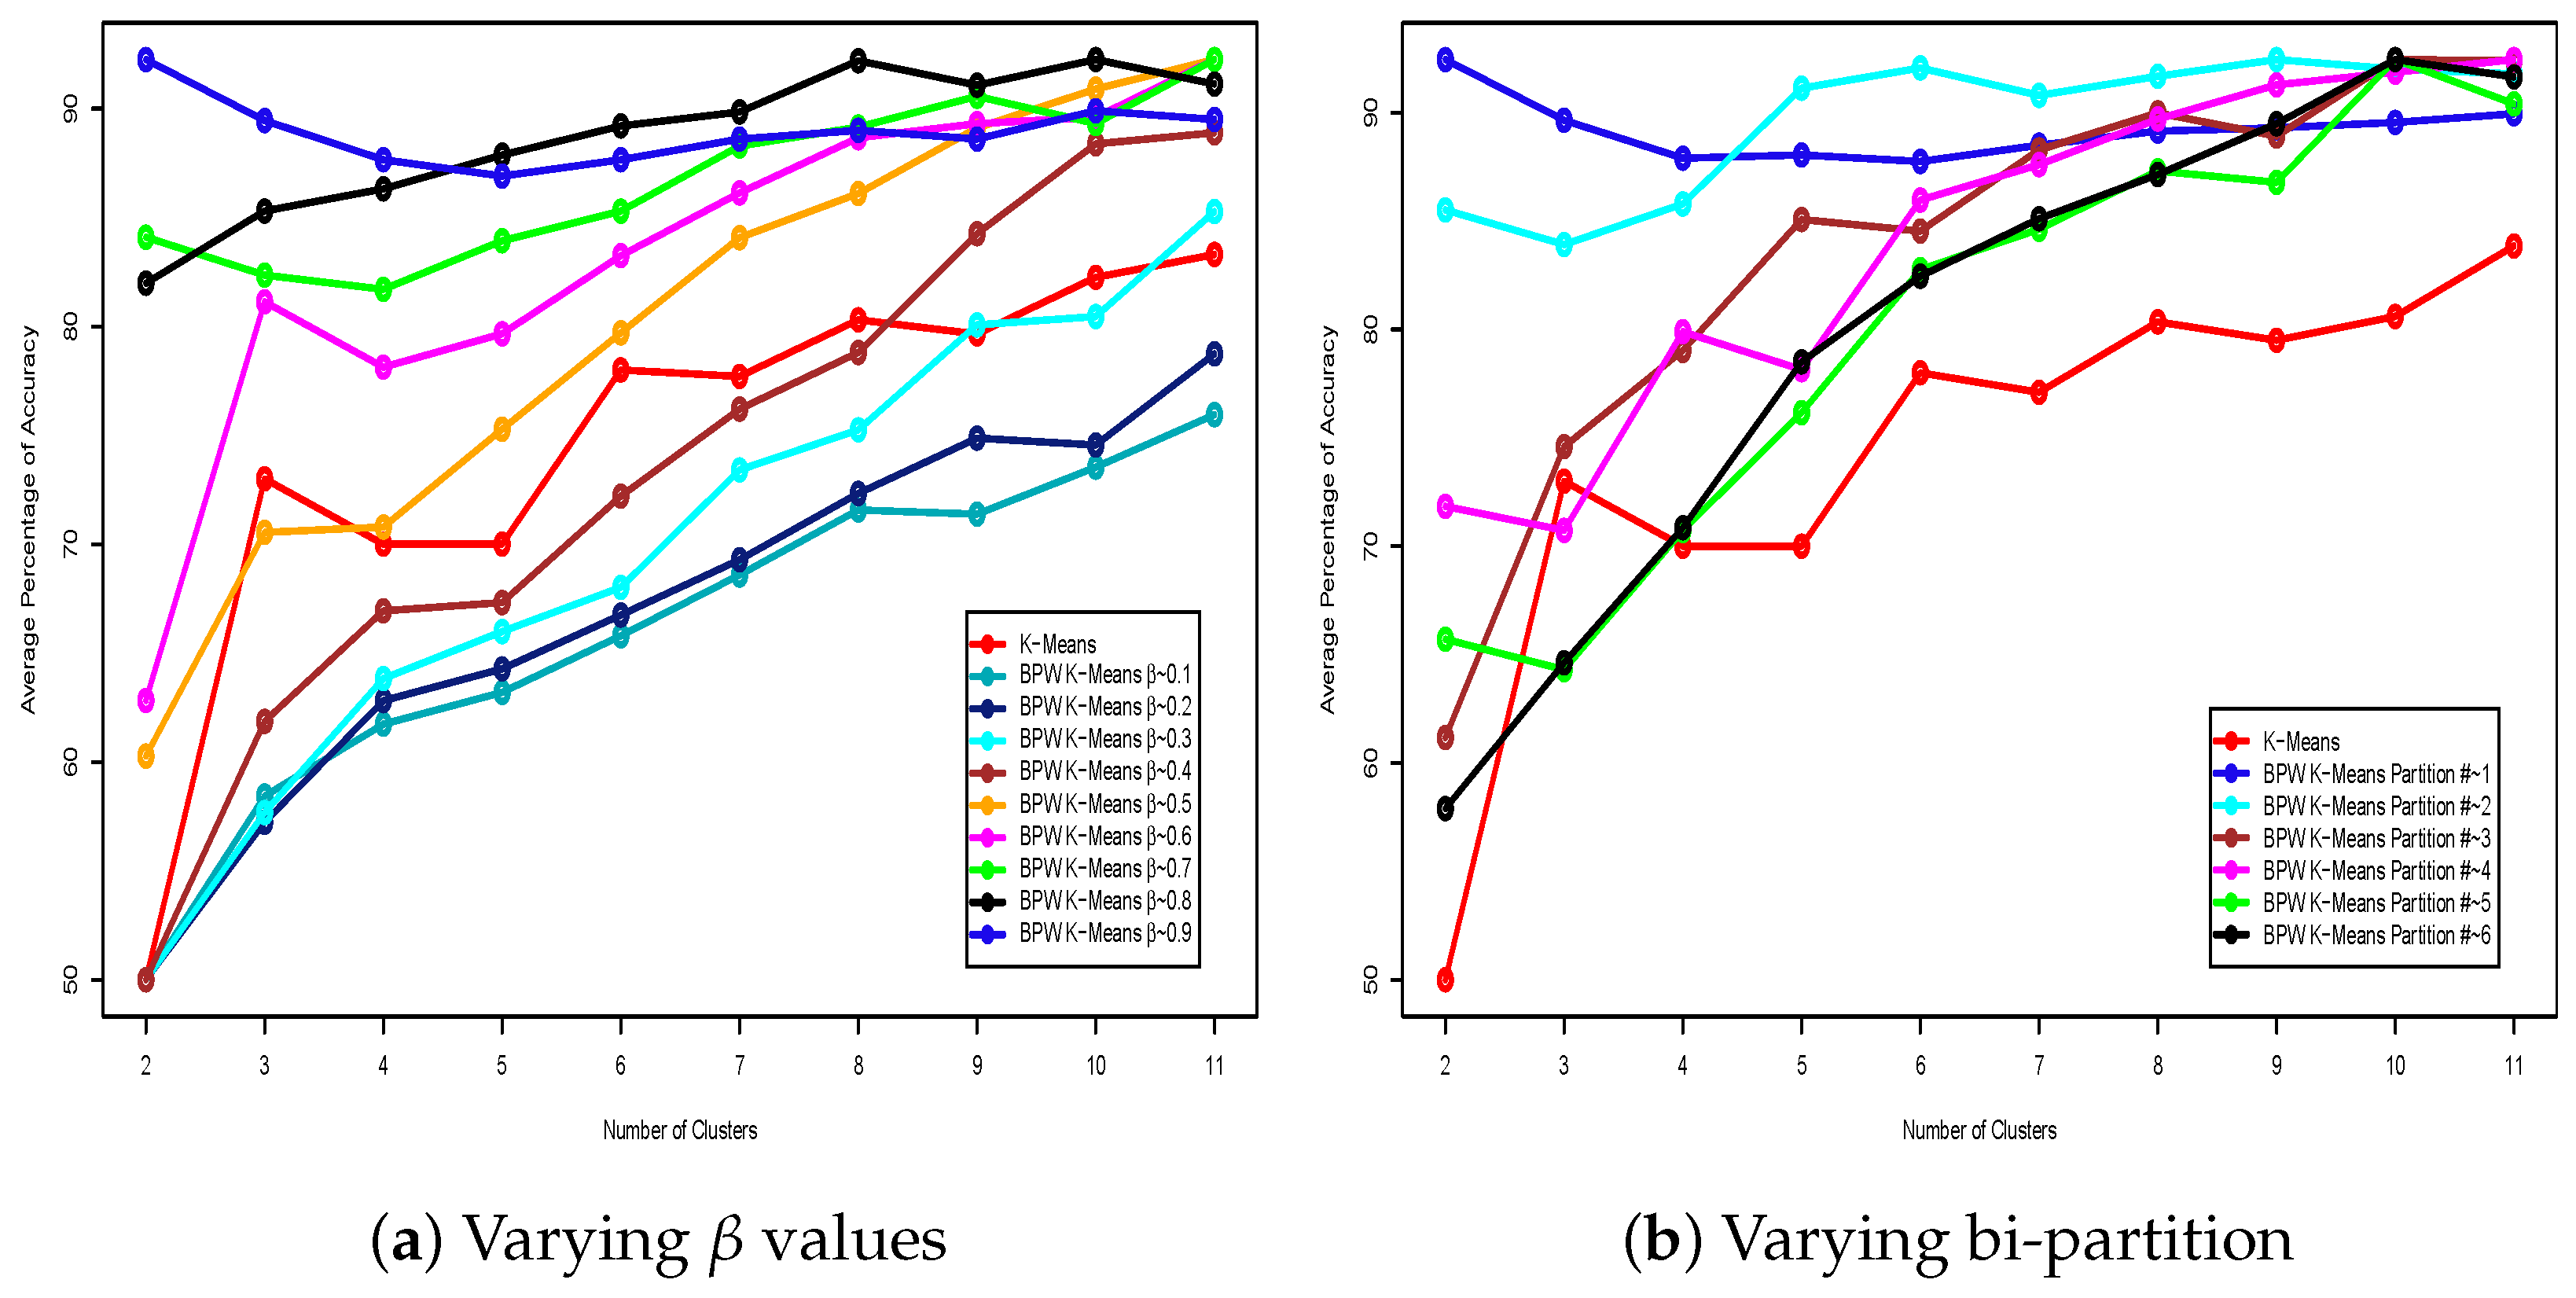
5.3.1. Analysis of Clustering Performance with Bi-Partition Number Fixed at 1
5.3.2. Analysis of Clustering Performance with Value Fixed at 0.9
6. Practical Implications and Applications of the BPW -Means Algorithm
7. Application of Clustering Methods to Other Datasets
7.1. Clustering Performance of BPW K-Means vs. Classical K-Means on the Iris Dataset: Ranked vs. Unranked Features
Output 2: Clustering Performance of the BPW K-Means Algorithm on
         the Iris Dataset---Ranked Features

Confusion Matrix and Statistics

Parameter Values Used:
Beta = 0.9, Bi-Partition Number = 1


  setosa versicolor virginica
 1 50     0     0
 2 0    48     2
 3 0     4 46

Overall Statistics

        Accuracy: 0.96
         95% CI: (0.915, 0.9852)
  No Information Rate: 0.3467
  P-Value [Acc > NIR]: < 2.2e-16

         Kappa: 0.94

 McNemar's Test P-Value: NA

Statistics by Class:

            Class:1 Class:2 Class:3
Sensitivity      1.0000  0.9231  0.9583
Specificity      1.0000  0.9796  0.9608
Pos Pred Value     1.0000  0.9600  0.9200
Neg Pred Value     1.0000  0.9600  0.9800
Precision       1.0000  0.9600  0.9200
Recall         1.0000  0.9231  0.9583
F1           1.0000  0.9412  0.9388
Prevalence       0.3333  0.3467  0.3200
Detection Rate     0.3333  0.3200  0.3067
Detection Prevalence  0.3333  0.3333  0.3333
Balanced Accuracy   1.0000  0.9513  0.9596
7.2. Clustering Performance of the BPW K-Means vs. Classical K-Means on the Sirtuin6 Dataset: Ranked vs. Unranked Features
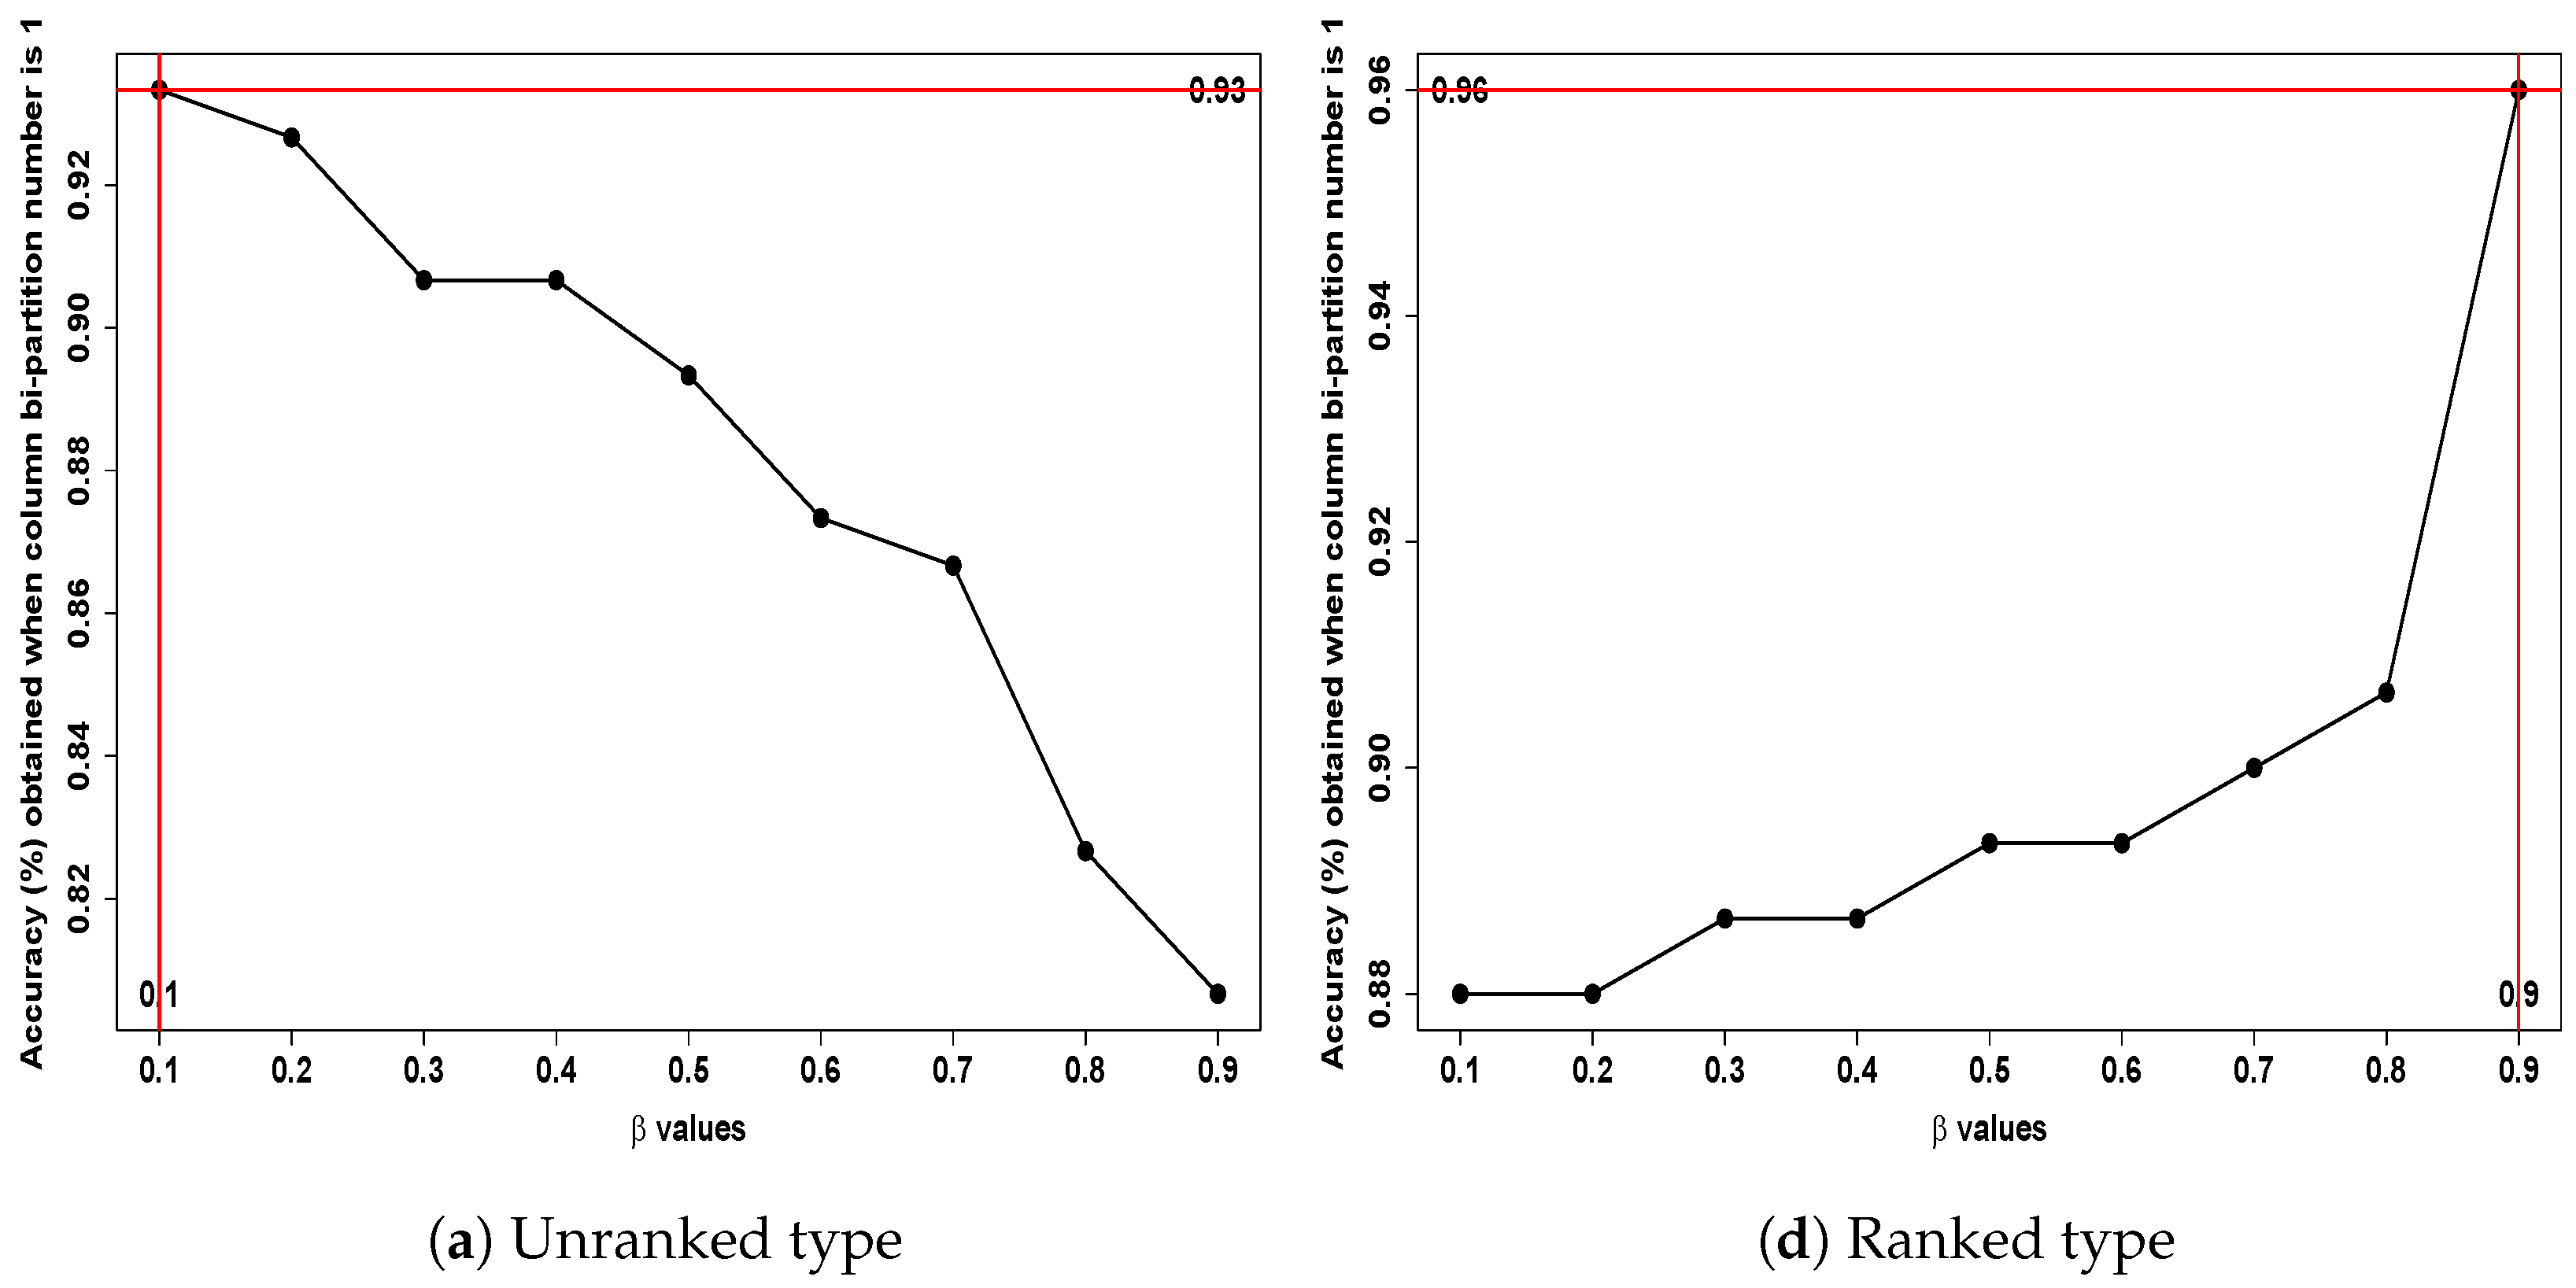
- First row: In Figure 12a, the BPW K-means achieved an optimal accuracy of 79% with the pair = 0.8 and bi-partition number = 1 for the unranked data type (left column). Similarly, in Figure 12f, the ranked data type (right column) achieved the highest accuracies with values of 0.2 and 0.3, paired with the same bi-partition number 1. These pairs achieved a potential optimal accuracy of 81%.
- Second row: In Figure 12b, the unranked data type achieved an optimal pair with = 0.1 and bi-partition number = 2, leading to a potential accuracy of 82%. Likewise, in Figure 12g, the ranked data type achieved optimal accuracies of 81% using values of 0.2 and 0.3 paired with bi-partition number = 2.
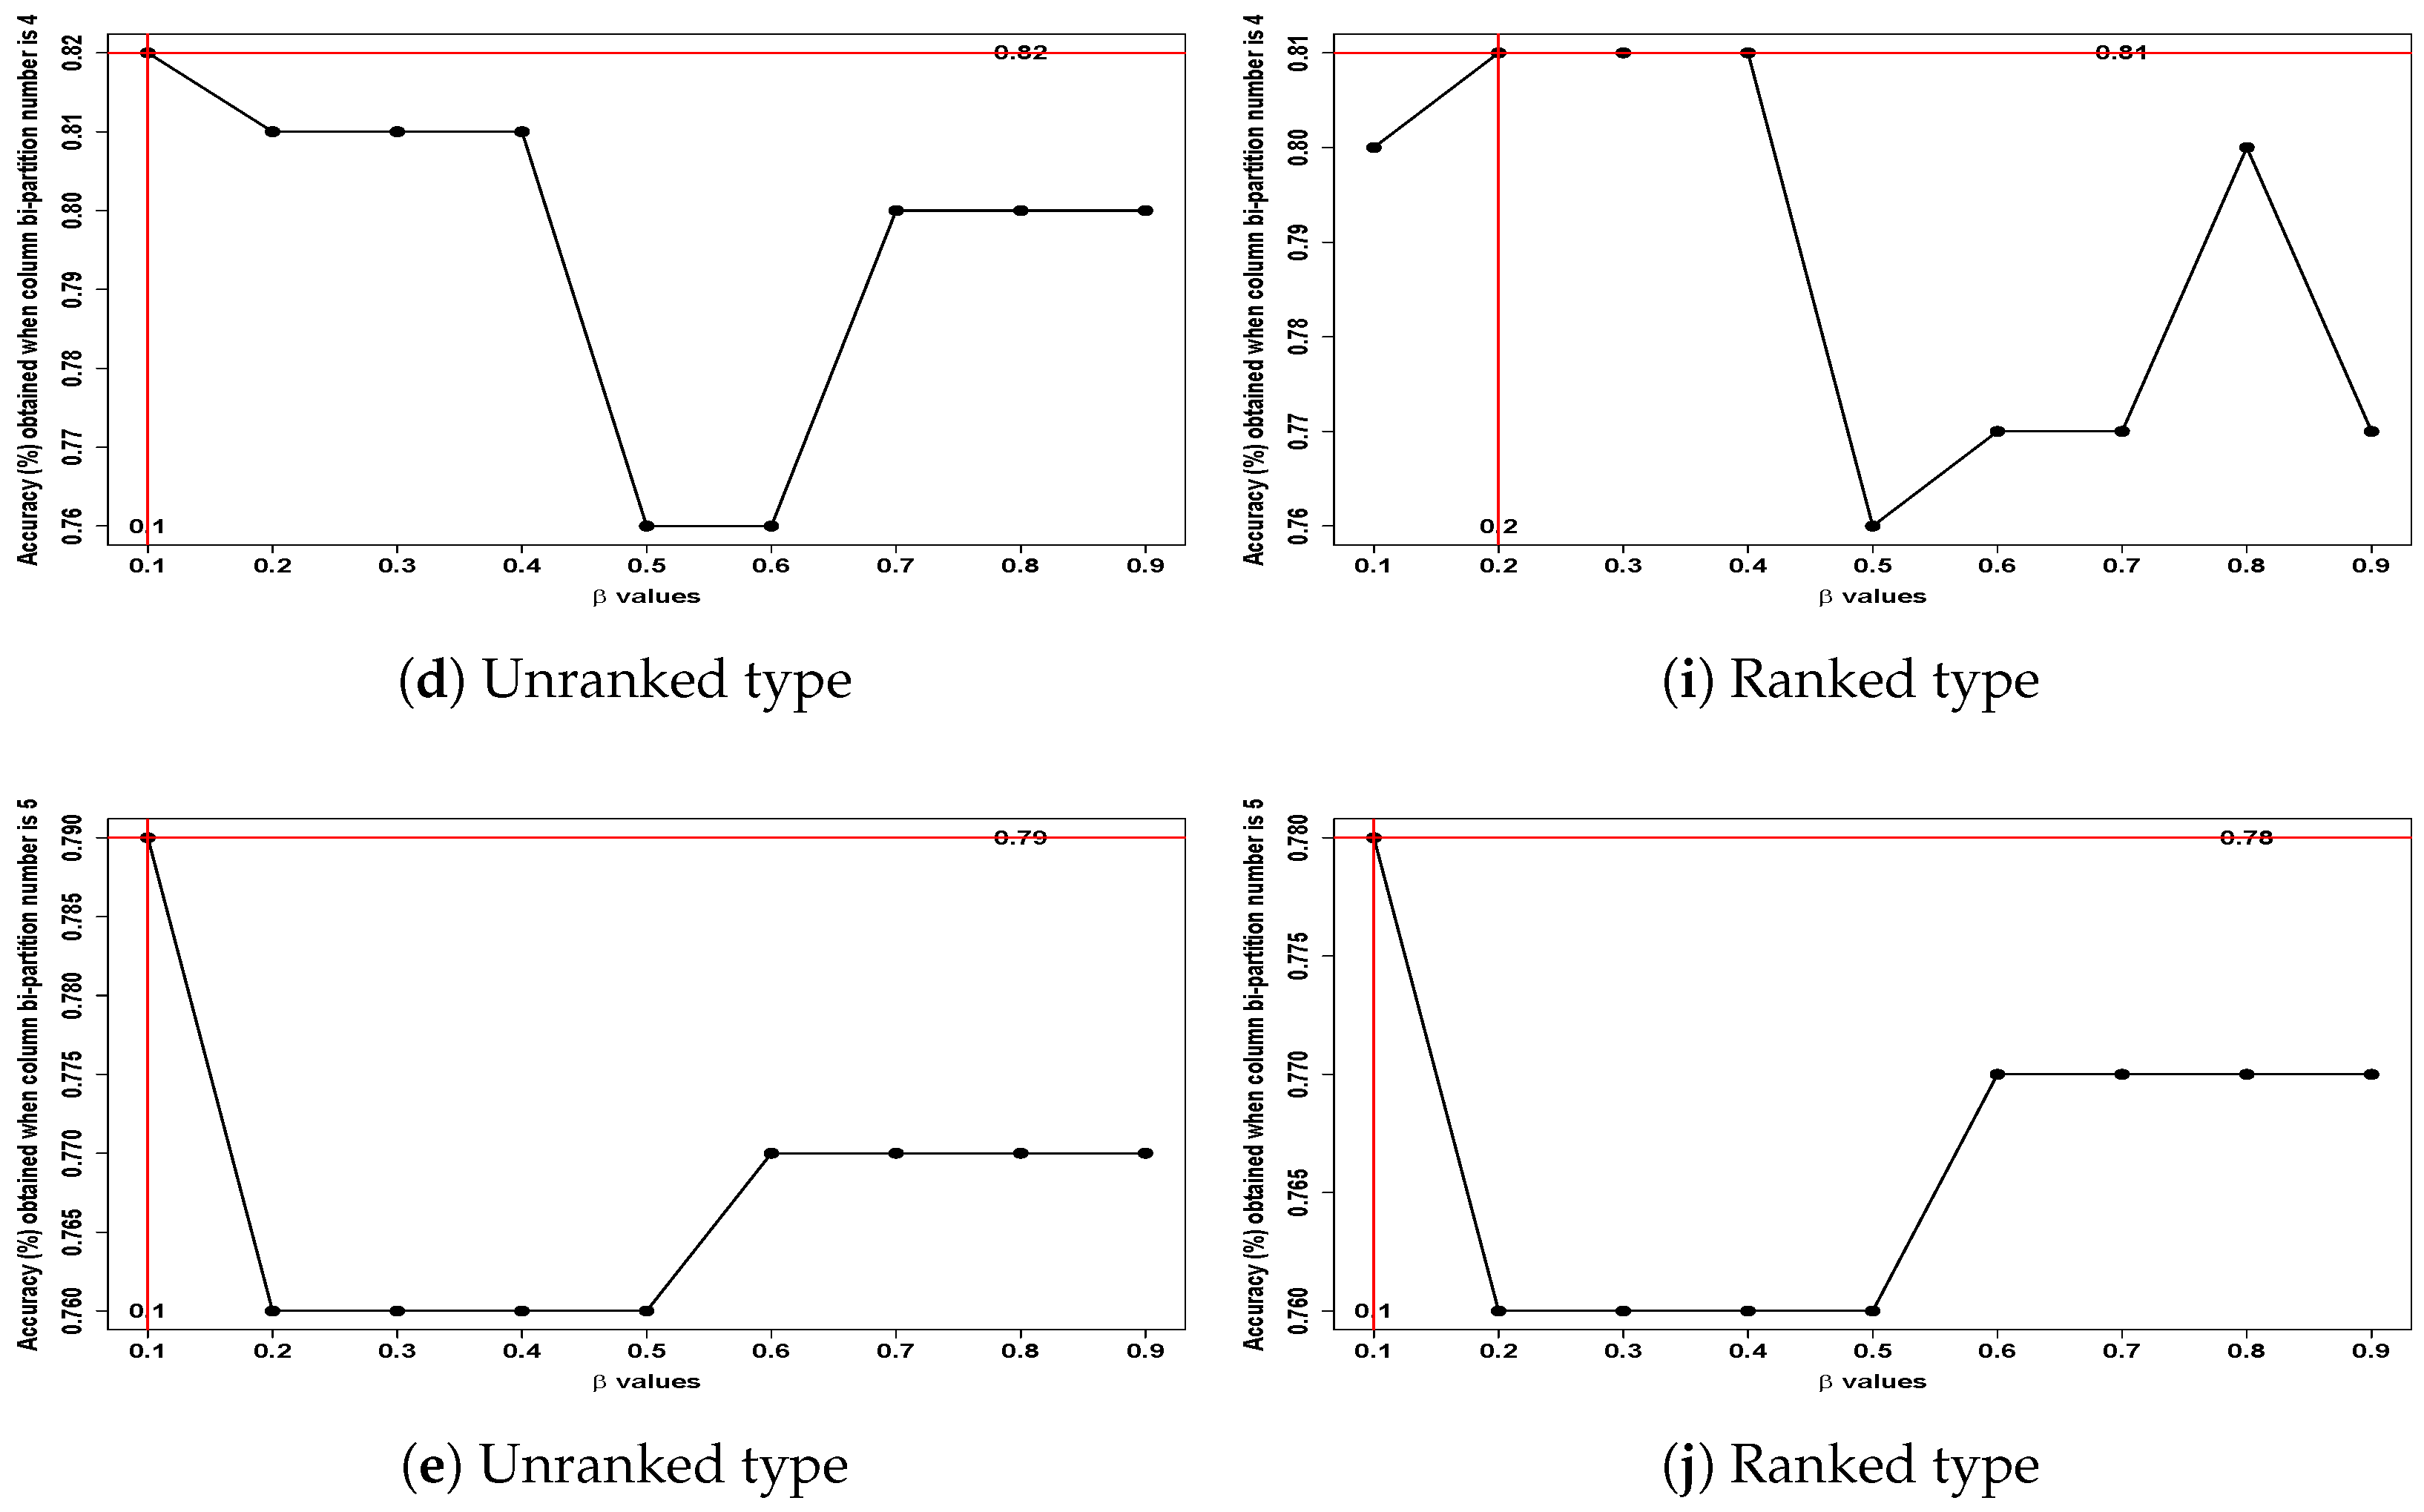
- Fourth row: In Figure 12d, the BPW K-means achieved a potential optimal accuracy of 82% for the unranked data type with the pair = 0.1 and bi-partition number = 4. For the ranked data type (Figure 12i), values of 0.2, 0.3, and 0.4 paired with bi-partition number = 4 achieved a slightly lower accuracy of 81%.
- Fifth row: Figure 12e,j exhibit similar patterns, where the BPW K-means algorithm achieved potential optimal accuracies of 79% and 78%, respectively, using = 0.1 and bi-partition number = 5 for both ranked and unranked data types.
Output 3: Clustering Performance of the BPW K-Means Algorithm on
         the Sirtuin6 Dataset---Ranked Features

Confusion Matrix and Statistics

Parameter Values Used:
Beta = 0.1, Bi-Partition Number = 3

  Low BFE High BFE
 1 41      9
 2 9 41

 Overall Statistics

        Accuracy: 0.82
         95% CI: (0.7305, 0.8897)
  No Information Rate: 0.5
  P-Value [Acc > NIR]: 3.074e-11

         Kappa: 0.64

 McNemar's Test P-Value: 1

      Sensitivity: 0.82
      Specificity: 0.82
     Pos Pred Value: 0.82
     Neg Pred Value: 0.82
       Precision: 0.82
         Recall: 0.82
           F1: 0.82
       Prevalence: 0.50
     Detection Rate: 0.41
  Detection Prevalence: 0.50
   Balanced Accuracy: 0.82
7.3. Clustering Performance of the BPW K-Means vs. Classical K-Means on the Wholesale Customers Dataset: Ranked vs. Unranked Features
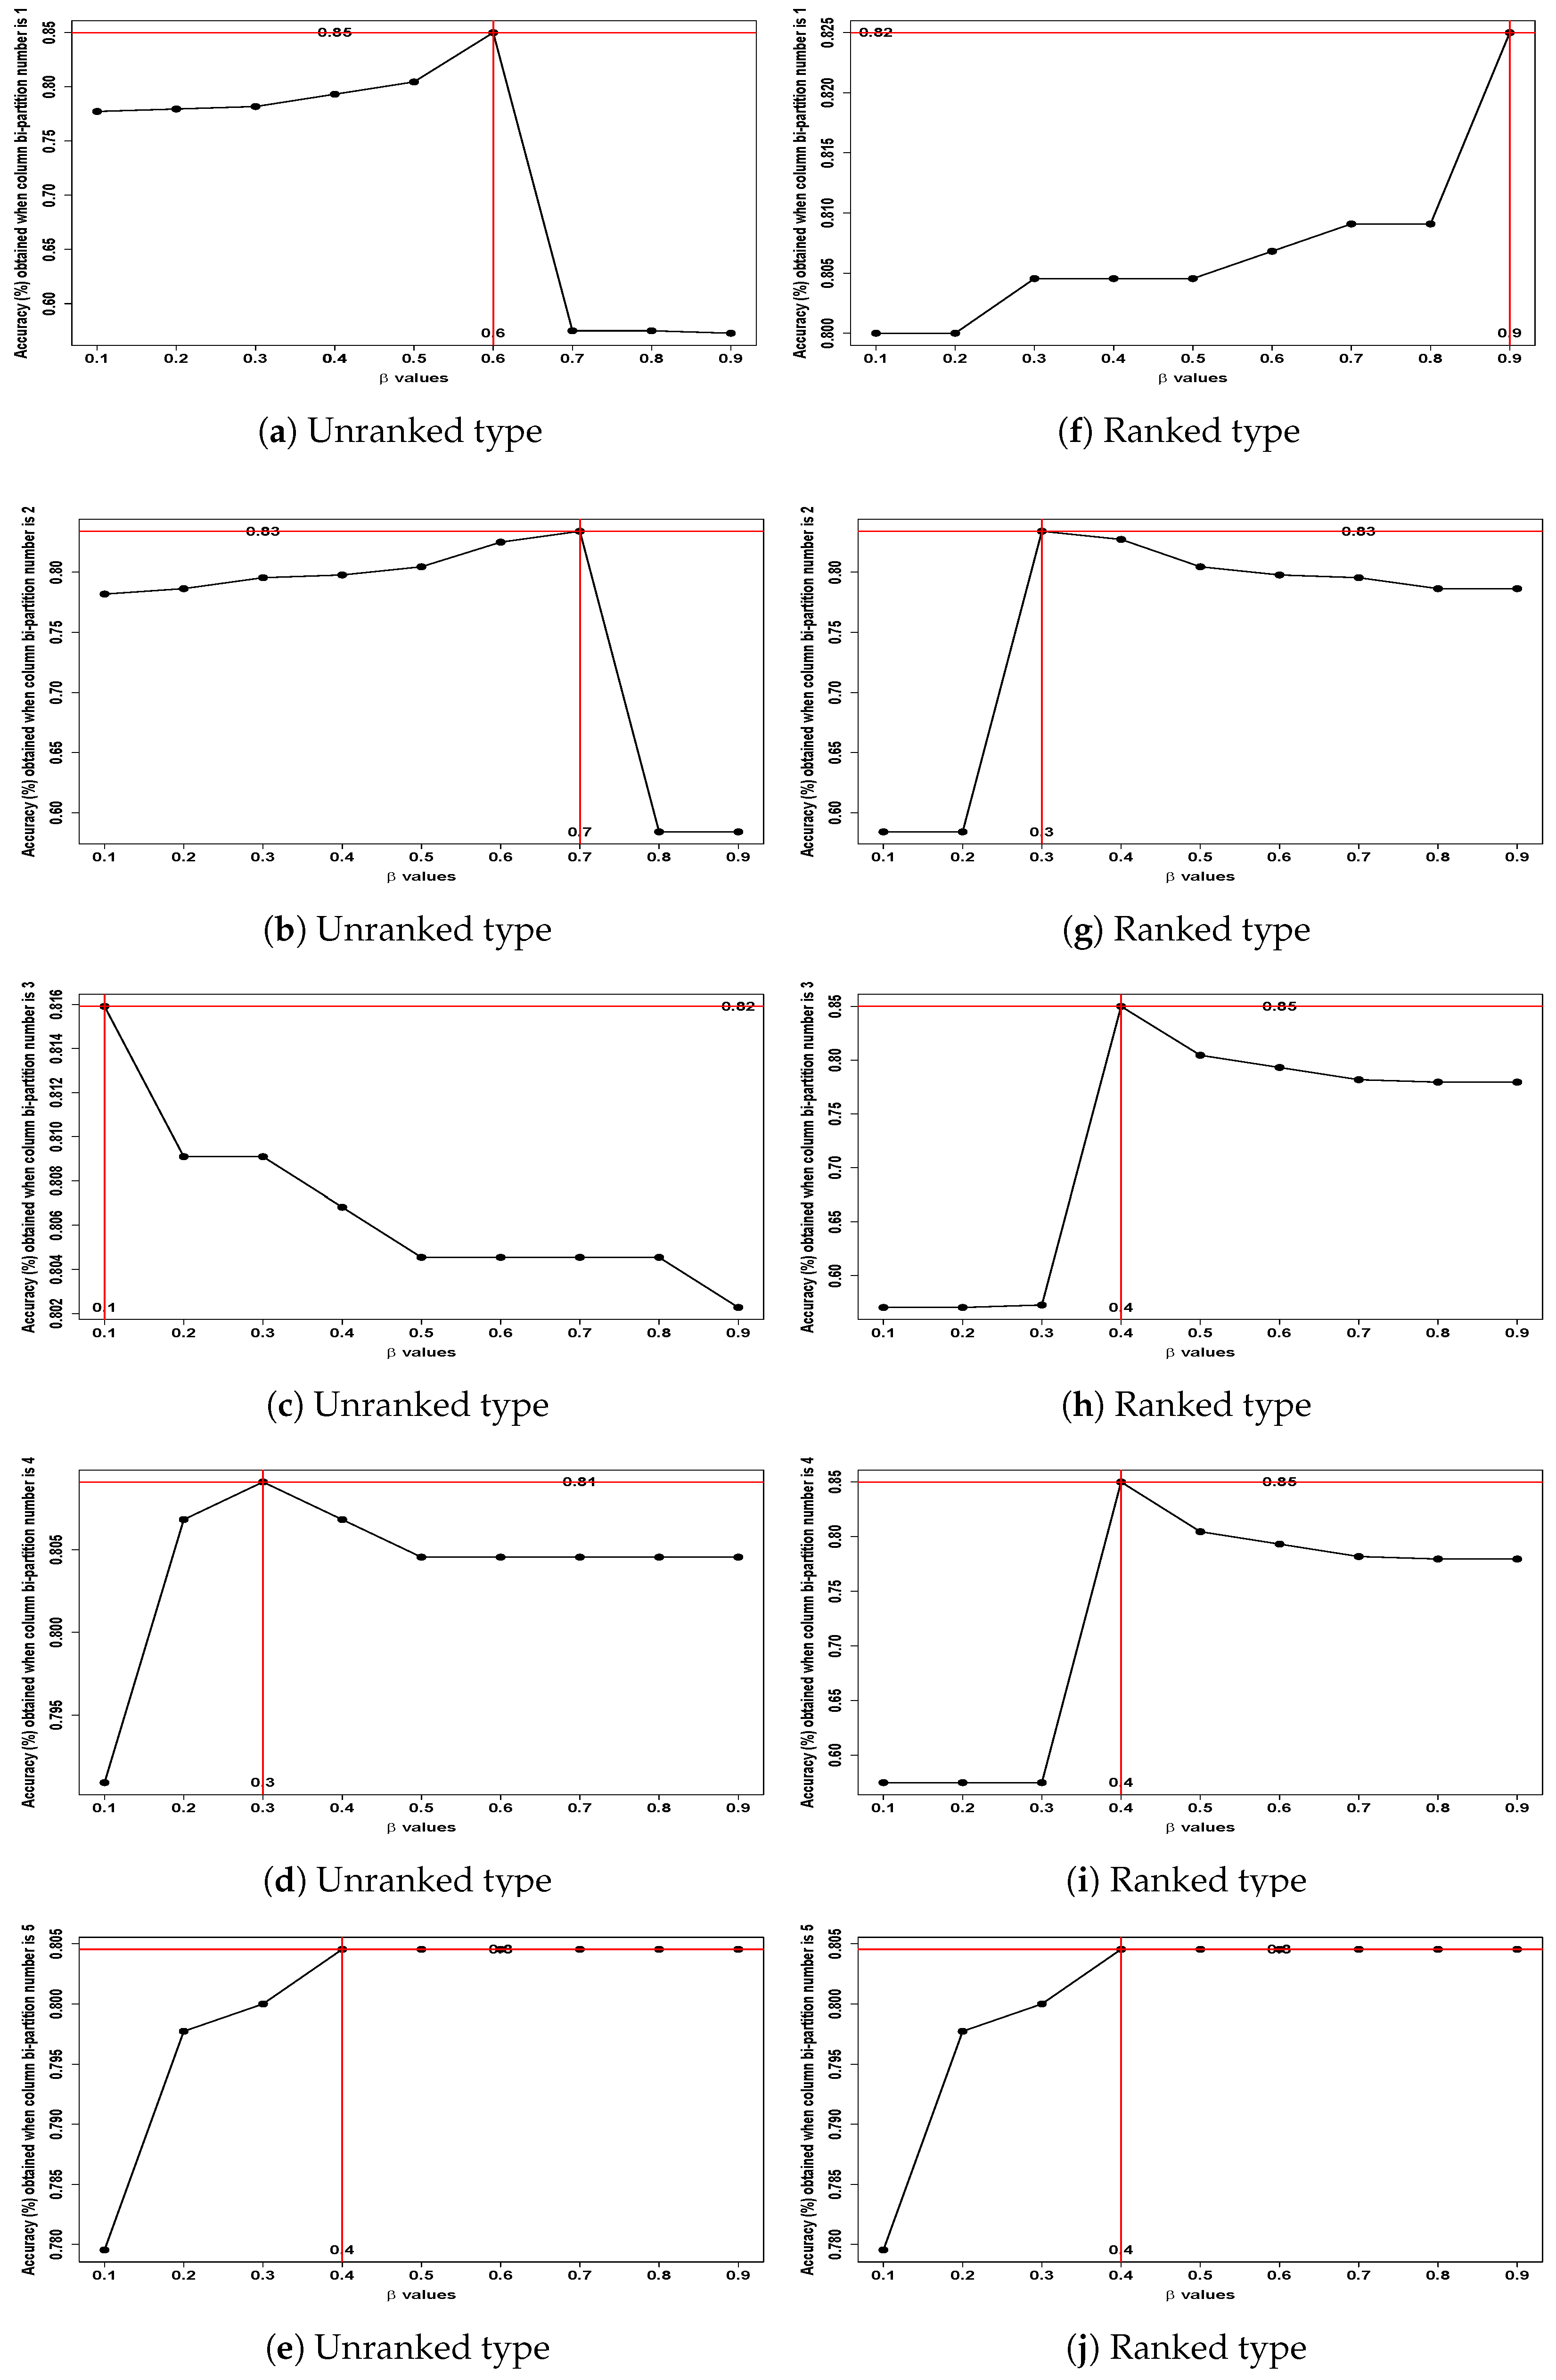
- First row: From Figure 13a,f, the unranked dataset achieved a potential optimal accuracy of 85% with the pair ( = 0.6, bi-partition number = 1), while the ranked dataset achieved a potential accuracy of 82% with the pair ( = 0.9, bi-partition number = 1).
- Second row: In Figure 13b,g, the BPW K-means achieved an accuracy of 83% for both the unranked and ranked datasets, with the optimal pair ( = 0.7, bi-partition number = 2) for the unranked dataset and ( = 0.3, bi-partition number = 2) for the ranked dataset.
Output 4: Clustering Performance of the BPW K-Means Algorithm on
       the Wholesale Customers Dataset---Ranked Features

Confusion Matrix and Statistics

Parameter Values Used:
Beta = 0.4, Bi-Partition Number = 3


   Horeca   Retail
 1 288     10
 2  56 86


  Overall Statistics

        Accuracy: 0.85
         95% CI: (0.8132, 0.8821)
  No Information Rate: 0.7818
  P-Value [Acc > NIR]: 0.0001987

         Kappa: 0.6251

 McNemar's Test P-Value: 3.04e-08
      Sensitivity: 0.8372
      Specificity: 0.8958
     Pos Pred Value: 0.9664
     Neg Pred Value: 0.6056
       Precision: 0.9664
         Recall: 0.8372
           F1: 0.8972
       Prevalence: 0.7818
     Detection Rate: 0.6545
  Detection Prevalence: 0.6773
   Balanced Accuracy: 0.8665
8. Conclusions and Future Work
Author Contributions
Funding
Data Availability Statement
Acknowledgments
Conflicts of Interest
Appendix A
Output A1: Clustering Performance of the BPW K-Means Algorithm on
       the Insurance Fraud Claims Dataset---Unranked Features

Confusion Matrix and Statistics

Parameter Values Used:
Beta = 0.9, Bi-Partition Number = 1

  Fraudulent Non-Fraudulent
 1 44       3
 2 5 42

 Overall Statistics

        Accuracy: 0.9149
         95% CI: (0.8392, 0.9625)
  No Information Rate: 0.5213
  P-Value [Acc > NIR]: <2e-16

         Kappa: 0.8298

 McNemar's Test P-Value: 0.7237

      Sensitivity: 0.8980
      Specificity: 0.9333
     Pos Pred Value: 0.9362
     Neg Pred Value: 0.8936
       Precision: 0.9362
         Recall: 0.8980
           F1: 0.9167
       Prevalence: 0.5213
     Detection Rate: 0.4681
  Detection Prevalence: 0.5000
   Balanced Accuracy: 0.9156
Output A2: Clustering Performance of the BPW K-Means Algorithm on
       the Insurance Fraud Claims Dataset---Unranked Features

Confusion Matrix and Statistics

Parameter Values Used:
Beta = 0.9, Bi-Partition Number = 2

  Fraudulent Non-Fraudulent
 1 44       3
 2 4 43

 Overall Statistics

        Accuracy: 0.9255
         95% CI: (0.8526, 0.9695)
  No Information Rate: 0.5106
  P-Value [Acc > NIR]: <2e-16

         Kappa: 0.8511

 McNemar's Test P-Value: 1

      Sensitivity: 0.9167
      Specificity: 0.9348
     Pos Pred Value: 0.9362
     Neg Pred Value: 0.9149
       Precision: 0.9362
         Recall: 0.9167
           F1: 0.9263
       Prevalence: 0.5106
     Detection Rate: 0.4681
  Detection Prevalence: 0.5000
   Balanced Accuracy: 0.9257
Output A3: Clustering Performance of the BPW K-Means Algorithm on
       the Insurance Fraud Claims Dataset---Unranked Features

Confusion Matrix and Statistics

Parameter Values Used:
Beta = 0.9, Bi-Partition Number = 3

  Fraudulent Non-Fraudulent
 1 45       2
 2 5 42

 Overall Statistics

        Accuracy: 0.9255
         95% CI: (0.8526, 0.9695)
  No Information Rate: 0.5319
  P-Value [Acc > NIR]: <2e-16

         Kappa: 0.8511

 McNemar's Test P-Value: 0.4497

      Sensitivity: 0.9000
      Specificity: 0.9545
     Pos Pred Value: 0.9574
     Neg Pred Value: 0.8936
       Precision: 0.9574
         Recall: 0.9000
           F1: 0.9278
       Prevalence: 0.5319
     Detection Rate: 0.4787
  Detection Prevalence: 0.5000
   Balanced Accuracy: 0.9273
Output A4: Clustering Performance of the Classical K-Means
       Algorithm on the Insurance Fraud Claims Dataset---Ranked
       Features

Confusion Matrix and Statistics

Parameter Values Used:
Beta = NA, Bi-Partition Number = NA


  Fraudulent Non-Fraudulent
 1 5       42
 2 5 42

 Overall Statistics

         Accuracy: 0.5
         95% CI: (0.3951, 0.6049)
  No Information Rate: 0.8936
  P-Value [Acc > NIR]: 1

         Kappa: 0

 McNemar's Test P-Value: 1.512e-07

      Sensitivity: 0.50000
      Specificity: 0.50000
     Pos Pred Value: 0.10638
     Neg Pred Value: 0.89362
       Precision: 0.10638
         Recall: 0.50000
           F1: 0.17544
       Prevalence: 0.10638
     Detection Rate: 0.05319
  Detection Prevalence: 0.50000
   Balanced Accuracy: 0.50000
Output A5: Clustering Performance of the BPW K-Means Algorithm
         on the Iris Dataset---Ranked Features

Confusion Matrix and Statistics

Parameter Values Used:
Beta = 0.9, Bi-Partition Number = 2


  setosa versicolor virginica
 1 50     0     0
 2 0    50     0
 3 0     8 42

Overall Statistics

        Accuracy: 0.9467
         95% CI: (0.8976, 0.9767)
  No Information Rate: 0.3867
  P-Value [Acc > NIR]: < 2.2e-16

         Kappa: 0.92

 McNemar's Test P-Value: NA

Statistics by Class:

            Class:1 Class:2 Class:3
Sensitivity      1.0000  0.8621  1.0000
Specificity      1.0000  1.0000  0.9259
Pos Pred Value     1.0000  1.0000  0.8400
Neg Pred Value     1.0000  0.9200  1.0000
Precision       1.0000  1.0000  0.8400
Recall         1.0000  0.8621  1.0000
F1           1.0000  0.9259  0.9130
Prevalence       0.3333  0.3867  0.2800
Detection Rate     0.3333  0.3333  0.2800
Detection Prevalence  0.3333  0.3333  0.3333
Balanced Accuracy   1.0000  0.9310  0.9630
Output A6: Clustering Performance of the BPW K-Means Algorithm
         on the Iris Dataset---Ranked Features

Confusion Matrix and Statistics

Parameter Values Used:
Beta = 0.9, Bi-Partition Number = 3


  setosa versicolor virginica
 1 50     0     0
 2 0    48     2
 3 0    14 36

Overall Statistics

        Accuracy: 0.8933
         95% CI: (0.8326, 0.9378)
  No Information Rate: 0.4133
  P-Value [Acc > NIR]: < 2.2e-16

         Kappa: 0.84

 McNemar's Test P-Value: NA

Statistics by Class:

            Class:1 Class:2 Class:3
Sensitivity      1.0000  0.7742  0.9474
Specificity      1.0000  0.9773  0.8750
Pos Pred Value     1.0000  0.9600  0.7200
Neg Pred Value     1.0000  0.8600  0.9800
Precision       1.0000  0.9600  0.7200
Recall         1.0000  0.7742  0.9474
F1           1.0000  0.8571  0.8182
Prevalence       0.3333  0.4133  0.2533
Detection Rate     0.3333  0.3200  0.2400
Detection Prevalence  0.3333  0.3333  0.3333
Balanced Accuracy   1.0000  0.8757  0.9112
Output A7: Clustering Performance of the Classical K-Means
         Algorithm on the Iris Dataset---Ranked Features

Confusion Matrix and Statistics

Parameter Values Used:
Beta = NA, Bi-Partition Number = NA


  setosa versicolor virginica
 1 50     0     0
 2 0    48     2
 3 0    14 36

Overall Statistics

        Accuracy: 0.8933
         95% CI: (0.8326, 0.9378)
  No Information Rate: 0.4133
  P-Value [Acc > NIR]: < 2.2e-16

         Kappa: 0.84

 McNemar's Test P-Value: NA

Statistics by Class:

            Class:1 Class:2 Class:3
Sensitivity      1.0000  0.7742  0.9474
Specificity      1.0000  0.9773  0.8750
Pos Pred Value     1.0000  0.9600  0.7200
Neg Pred Value     1.0000  0.8600  0.9800
Precision       1.0000  0.9600  0.7200
Recall         1.0000  0.7742  0.9474
F1           1.0000  0.8571  0.8182
Prevalence       0.3333  0.4133  0.2533
Detection Rate     0.3333  0.3200  0.2400
Detection Prevalence  0.3333  0.3333  0.3333
Balanced Accuracy   1.0000  0.8757  0.9112
Output A8: Clustering Performance of the BPW K-Means Algorithm
        on the Iris Dataset---Unranked Features

Confusion Matrix and Statistics

Parameter Values Used:
Beta = 0.1, Bi-Partition Number = 1


  setosa versicolor virginica
 1 50     0     0
 2 0    50     0
 3 0    10 40

Overall Statistics

        Accuracy: 0.9333
         95% CI: (0.8808, 0.9676)
  No Information Rate: 0.4
  P-Value [Acc > NIR]: < 2.2e-16

         Kappa: 0.9

 McNemar's Test P-Value: NA

Statistics by Class:

            Class:1 Class:2 Class:3
Sensitivity      1.0000  0.8333  1.0000
Specificity      1.0000  1.0000  0.9091
Pos Pred Value     1.0000  1.0000  0.8000
Neg Pred Value     1.0000  0.9000  1.0000
Precision       1.0000  1.0000  0.8000
Recall         1.0000  0.8333  1.0000
F1           1.0000  0.9091  0.8889
Prevalence       0.3333  0.4000  0.2667
Detection Rate     0.3333  0.3333  0.2667
Detection Prevalence  0.3333  0.3333  0.3333
Balanced Accuracy   1.0000  0.9167  0.9545
Output A9: Clustering Performance of the BPW K-Means Algorithm
         on the Iris Dataset---Unranked Features

Confusion Matrix and Statistics

Parameter Values Used:
Beta = 0.1, Bi-Partition Number = 2


  setosa versicolor virginica
 1 50     0     0
 2 0    50     0
 3 0     8 42

Overall Statistics

        Accuracy: 0.9467
         95% CI: (0.8976, 0.9767)
  No Information Rate: 0.3867
  P-Value [Acc > NIR]: < 2.2e-16

         Kappa: 0.92

 McNemar's Test P-Value: NA

Statistics by Class:

            Class:1 Class:2 Class:3
Sensitivity      1.0000  0.8621  1.0000
Specificity      1.0000  1.0000  0.9259
Pos Pred Value     1.0000  1.0000  0.8400
Neg Pred Value     1.0000  0.9200  1.0000
Precision       1.0000  1.0000  0.8400
Recall         1.0000  0.8621  1.0000
F1           1.0000  0.9259  0.9130
Prevalence       0.3333  0.3867  0.2800
Detection Rate     0.3333  0.3333  0.2800
Detection Prevalence  0.3333  0.3333  0.3333
Balanced Accuracy   1.0000  0.9310  0.9630
Output A10: Clustering Performance of the BPW K-Means Algorithm
         on the Iris Dataset---Unranked Features

Confusion Matrix and Statistics

Parameter Values Used:
Beta = 0.1, Bi-Partition Number = 3


  setosa versicolor virginica
 1 50     0     0
 2 0    48     2
 3 0     4 46

Overall Statistics

        Accuracy: 0.96
         95% CI: (0.915, 0.9852)
  No Information Rate: 0.3467
  P-Value [Acc > NIR]: < 2.2e-16

         Kappa: 0.94

 McNemar's Test P-Value: NA

Statistics by Class:

            Class:1 Class:2 Class:3
Sensitivity      1.0000  0.9231  0.9583
Specificity      1.0000  0.9796  0.9608
Pos Pred Value     1.0000  0.9600  0.9200
Neg Pred Value     1.0000  0.9600  0.9800
Precision       1.0000  0.9600  0.9200
Recall         1.0000  0.9231  0.9583
F1           1.0000  0.9412  0.9388
Prevalence       0.3333  0.3467  0.3200
Detection Rate     0.3333  0.3200  0.3067
Detection Prevalence  0.3333  0.3333  0.3333
Balanced Accuracy   1.0000  0.9513  0.9596
Output A11: Clustering Performance of the BPW K-Means Algorithm
        on the Sirtuin6 Dataset---Unranked Features

Confusion Matrix and Statistics

Parameter Values Used:
Beta = 0.1, Bi-Partition Number = 2


  Low BFE High BFE
 1 41      9
 2 9 41

 Overall Statistics

        Accuracy: 0.82
         95% CI: (0.7305, 0.8897)
  No Information Rate: 0.5
  P-Value [Acc > NIR]: 3.074e-11

         Kappa: 0.64

 McNemar's Test P-Value: 1

      Sensitivity: 0.82
      Specificity: 0.82
     Pos Pred Value: 0.82
     Neg Pred Value: 0.82
       Precision: 0.82
         Recall: 0.82
           F1: 0.82
       Prevalence: 0.50
     Detection Rate: 0.41
  Detection Prevalence: 0.50
   Balanced Accuracy: 0.82
Output A12: Clustering Performance of the Classical K-Means
        Algorithm on the Sirtuin6 Dataset---Ranked Features

Confusion Matrix and Statistics

Parameter Values Used:
Beta = NA, Bi-Partition Number = NA


  Low BFE High BFE
 1 44      6
 2 18 32

 Overall Statistics

        Accuracy: 0.76
         95% CI: (0.6643, 0.8398)
  No Information Rate: 0.62
  P-Value [Acc > NIR]: 0.002122

         Kappa: 0.52

 McNemar's Test P-Value: 0.024745

      Sensitivity: 0.7097
      Specificity: 0.8421
     Pos Pred Value: 0.8800
     Neg Pred Value: 0.6400
       Precision: 0.8800
         Recall: 0.7097
           F1: 0.7857
       Prevalence: 0.6200
     Detection Rate: 0.4400
  Detection Prevalence: 0.5000
   Balanced Accuracy: 0.7759
Output A13: Clustering Performance of the BPW K-Means Algorithm on
       the Wholesale Customers Dataset---Unranked Features

Confusion Matrix and Statistics

Parameter Values Used:
Beta = 0.6, Bi-Partition Number = 2


  Horeca   Retail
 1 293     5
 2 72 70

 Overall Statistics

        Accuracy: 0.825
         95% CI: (0.7862, 0.8594)
  No Information Rate: 0.8295
  P-Value [Acc > NIR]: 0.6291

         Kappa: 0.5433

 McNemar's Test P-Value: 5.419e-14

      Sensitivity: 0.8027
      Specificity: 0.9333
     Pos Pred Value: 0.9832
     Neg Pred Value: 0.4930
       Precision: 0.9832
         Recall: 0.8027
           F1: 0.8839
       Prevalence: 0.8295
     Detection Rate: 0.6659
  Detection Prevalence: 0.6773
   Balanced Accuracy: 0.8680
Output A14: Clustering Performance of the Classical K-Means
       Algorithm on the Wholesale Customers Dataset---Ranked
       Features

Confusion Matrix and Statistics

Parameter Values Used:
Beta = NA, Bi-Partition Number = NA


  Horeca   Retail
 1 247     51
 2 128 14

 Overall Statistics

        Accuracy: 0.5932
         95% CI: (0.5456, 0.6395)
  No Information Rate: 0.8523
  P-Value [Acc > NIR]: 1

         Kappa: -0.0845

 McNemar's Test P-Value: 1.343e-08

      Sensitivity: 0.65867
      Specificity: 0.21538
     Pos Pred Value: 0.82886
     Neg Pred Value: 0.09859
       Precision: 0.82886
         Recall: 0.65867
           F1: 0.73403
       Prevalence: 0.85227
     Detection Rate: 0.56136
  Detection Prevalence: 0.67727
   Balanced Accuracy: 0.43703
References
- McCaffery, K. Financial Services Regulatory Authority of Ontario. Automobile Insurance. 2023. Available online: https://insurance-portal.ca/article/large-number-of-ontario-drivers-believe-auto-insurance-fraud-is-prevalent/ (accessed on 10 November 2023).
- Lekha, K.C.; Prakasam, S. Data mining techniques in detecting and predicting cyber crimes in banking sector. In Proceedings of the 2017 International Conference on Energy, Communication, Data Analytics and Soft Computing (ICECDS), Chennai, India, 1–2 August 2017; pp. 1639–1643. [Google Scholar]
- Nassar, O.A.; Al Saiyd, N.A. The integrating between web usage mining and data mining techniques. In Proceedings of the 2013 5th International Conference on Computer Science and Information Technology, Amman, Jordan, 27–28 March 2013; pp. 243–247. [Google Scholar]
- Kowshalya, G.; Nandhini, M. Predicting fraudulent claims in automobile insurance. In Proceedings of the 2018 Second International Conference on Inventive Communication and Computational Technologies (ICICCT), Coimbatore, India, 20–21 April 2018; pp. 1338–1343. [Google Scholar]
- Patel, D.K.; Subudhi, S. Application of extreme learning machine in detecting auto insurance fraud. In Proceedings of the 2019 International Conference on Applied Machine Learning (ICAML), Bhubaneswar, India, 25–26 May 2019; pp. 78–81. [Google Scholar]
- Óskarsdóttir, M.; Ahmed, W.; Antonio, K.; Baesens, B.; Dendievel, R.; Donas, T.; Reynkens, T. Social network analytics for supervised fraud detection in insurance. Risk Anal. 2022, 42, 1872–1890. [Google Scholar] [CrossRef] [PubMed]
- Bodaghi, A.; Teimourpour, B. Automobile insurance fraud detection using social network analysis. In Applications of Data Management and Analysis: Case Studies in Social Networks and Beyond; Springer: Berlin/Heidelberg, Germany, 2018; pp. 11–16. [Google Scholar]
- Ho, T.K. Random decision forests. In Proceedings of the 3rd International Conference on Document Analysis and Recognition, Montreal, QC, Canada, 14–16 August 1995; Volume 1, pp. 278–282. [Google Scholar]
- Kaggle Dataset. Vehicle Insurance Claim Fraud Detection. 2021. Available online: https://www.kaggle.com/datasets/aashishjhamtani/automobile-insurance (accessed on 17 May 2023).
- Kelly, M.; Longjohn, R.; Nottingham, K. The UCI Machine Learning Repository. 2023. Available online: https://archive.ics.uci.edu (accessed on 18 December 2024).
- Nian, K.; Zhang, H.; Tayal, A.; Coleman, T.; Li, Y. Auto insurance fraud detection using unsupervised spectral ranking for anomaly. J. Financ. Data Sci. 2016, 2, 58–75. [Google Scholar] [CrossRef]
- Yang, J.; Chen, K.; Ding, K.; Na, C.; Wang, M. Auto insurance fraud detection with multimodal learning. Data Intell. 2023, 5, 388–412. [Google Scholar] [CrossRef]
- Ming, R.; Abdelrahman, O.; Innab, N.; Ibrahim, M.H.K. Enhancing fraud detection in auto insurance and credit card transactions: A novel approach integrating CNNs and machine learning algorithms. PeerJ Comput. Sci. 2024, 10, e2088. [Google Scholar] [CrossRef]
- Wongpanti, R.; Vittayakorn, S. Enhancing Auto Insurance Fraud Detection Using Convolutional Neural Networks. In Proceedings of the 2024 21st International Joint Conference on Computer Science and Software Engineering (JCSSE), Phuket, Thailand, 19–22 June 2024; pp. 294–301. [Google Scholar]
- Nti, I.K.; Adu, K.; Nimbe, P.; Nyarko-Boateng, O.; Adekoya, A.F.; Appiahene, P. Robust and resourceful automobile insurance fraud detection with multi-stacked LSTM network and adaptive synthetic oversampling. Int. J. Appl. Decis. Sci. 2024, 17, 230–249. [Google Scholar] [CrossRef]
- Wei, S.; Lee, S. Financial anti-fraud based on dual-channel graph attention network. J. Theor. Appl. Electron. Commer. Res. 2024, 19, 297–314. [Google Scholar] [CrossRef]
- Van Driel, H. Financial fraud, scandals, and regulation: A conceptual framework and literature review. In Business History; Taylor and Francis Group: Abingdon, UK, 2019. [Google Scholar]
- Schrijver, G.; Sarmah, D.K.; El-Hajj, M. Automobile Insurance Fraud Detection Using Data Mining: A Systematic Literature Review. In Intelligent Systems with Applications; Elsevier: Amsterdam, The Netherlands, 2024; p. 200340. [Google Scholar]
- Government of Ontario. Ontario Automobile Insurance Anti-Fraud Task Force: Groupe de Travail Antifraude de L’Assurance-Automobile de L’Ontario, Canadian Electronic Library. Canada. Business History. 2012. Available online: https://canadacommons.ca/artifacts/1201133/ontario-automobile-insurance-anti-fraud-task-force/1754253/ (accessed on 8 August 2024).
- Nobel, S.N.; Sultana, S.; Singha, S.P.; Chaki, S.; Mahi, M.J.N.; Jan, T.; Barros, A.; Whaiduzzaman, M. Unmasking Banking Fraud: Unleashing the Power of Machine Learning and Explainable AI (XAI) on Imbalanced Data. Information 2024, 15, 298. [Google Scholar] [CrossRef]
- Urunkar, A.; Khot, A.; Bhat, R.; Mudegol, N. Fraud Detection and Analysis for Insurance Claim using Machine Learning. In Proceedings of the 2022 IEEE International Conference on Signal Processing, Informatics, Communication and Energy Systems (SPICES), Phuket, Thailand, 19–22 June 2022; Volume 1, pp. 406–411. [Google Scholar]
- Soua, M.; Kachouri, R.; Akil, M. Improved Hybrid Binarization based on Kmeans for Heterogeneous document processing. In Proceedings of the 2015 9th International Symposium on Image and Signal Processing and Analysis (ISPA), Zagreb, Croatia, 7–9 September 2015; pp. 210–215. [Google Scholar]
- Thiprungsri, S.; Vasarhelyi, M.A. Cluster Analysis for Anomaly Detection in Accounting Data: An Audit Approach. Int. J. Digit. Account. Res. 2011, 11, 69–84. [Google Scholar] [CrossRef] [PubMed]
- Pearson, K. LIII. On lines and planes of closest fit to systems of points in space. London Edinb. Dublin Philos. Mag. J. Sci. 1901, 2, 559–572. [Google Scholar] [CrossRef]
- Hotelling, H. Analysis of a complex of statistical variables into principal components. J. Educ. Psychol. 1933, 24, 417. [Google Scholar] [CrossRef]
- Comon, P. Independent component analysis, a new concept? Signal Process. 1994, 36, 287–314. [Google Scholar] [CrossRef]
- Hyvärinen, A.; Oja, E. Independent component analysis: Algorithms and applications. Neural Netw. 2000, 13, 411–430. [Google Scholar] [CrossRef] [PubMed]
- He, X.; Cai, D.; Niyogi, P. Laplacian score for feature selection. Adv. Neural Inf. Process. Syst. 2005, 18, 1–8. [Google Scholar]
- Peng, H.; Long, F.; Ding, C. Feature selection based on mutual information criteria of max-dependency, max-relevance, and min-redundancy. IEEE Trans. Pattern Anal. Mach. Intell. 2005, 27, 1226–1238. [Google Scholar] [CrossRef] [PubMed]
- Breiman, L. Random forests. Mach. Learn. 2001, 45, 5–32. [Google Scholar] [CrossRef]
- Kira, K.; Rendell, L.A. The feature selection problem: Traditional methods and a new algorithm. In Proceedings of the 10th National Conference on Artificial Intelligence, San Jose, CA, USA, 12–16 July 1992; pp. 129–134. [Google Scholar]
- Kononenko, I. Estimating attributes: Analysis and extensions of RELIEF. In Proceedings of the European Conference on Machine Learning, Catania, Italy, 6–8 April 1994; pp. 171–182. [Google Scholar]
- Robnik-Šikonja, M.; Kononenko, I. Theoretical and empirical analysis of ReliefF and RReliefF. Mach. Learn. 2003, 53, 23–69. [Google Scholar] [CrossRef]
- Hartigan, J.A.; Wong, M.A. Algorithm AS 136: A k-means clustering algorithm. J. R. Stat. Society Ser. C (Appl. Stat.) 1979, 28, 100–108. [Google Scholar] [CrossRef]
- Lloyd, S. Least squares quantization in PCM. IEEE Trans. Inf. Theory 1982, 28, 129–137. [Google Scholar] [CrossRef]
- MacQueen, J. Some methods for classification and analysis of multivariate observations. Berkeley Symp. Math. Statist. Prob. 1967, 1, 281–297. [Google Scholar]
- Wang, S.; Sun, Y.; Bao, Z. On the efficiency of k-means clustering: Evaluation, optimization, and algorithm selection. arXiv 2020, arXiv:2010.06654. [Google Scholar] [CrossRef]
- D’urso, P.; Massari, R. Fuzzy clustering of mixed data. Inf. Sci. 2019, 505, 513–534. [Google Scholar] [CrossRef]
- Qian, Y.; Yao, S.; Wu, T.; Huang, Y.; Zeng, L. Improved Selective Deep-Learning-Based Clustering Ensemble. Appl. Sci. 2024, 14, 719. [Google Scholar] [CrossRef]
- Gan, L.; Allen, G.I. Fast and interpretable consensus clustering via minipatch learning. PLoS Comput. Biol. 2022, 18, e1010577. [Google Scholar] [CrossRef] [PubMed]
- Rand, W.M. Objective criteria for the evaluation of clustering methods. J. Am. Stat. Assoc. 1971, 66, 846–850. [Google Scholar] [CrossRef]
- Hubert, L.; Arabie, P. Comparing partitions. J. Classif. 1985, 2, 193–218. [Google Scholar] [CrossRef]
- Fisher, R.A. Iris. UCI Machine Learning Repository. In Proceedings of the Fifth Berkeley Symposium on Mathematical Statistics and Probability, Volume II, Part II: Probability Theory; University of California Press: Berkeley, CA, USA, 1936. [Google Scholar] [CrossRef]
- Tardu, M.; Rahim, F. Sirtuin6 Small Molecules. UCI Machine Learning Repository. RAIRO Oper. Res. 2016. [Google Scholar] [CrossRef]
- Cardoso, M. Wholesale Customers. UCI Machine Learning Repository. 2013. Available online: https://archive.ics.uci.edu/dataset/292/wholesale+customers (accessed on 1 January 2025). [CrossRef]


| Data Column Bi-Partition Number: BPW K-Means | ||||||||||||
|---|---|---|---|---|---|---|---|---|---|---|---|---|
| Feature Bi-Partition Unranked | ||||||||||||
| Average Accuracy | ||||||||||||
| 1 | 2 | 3 | 4 | 5 | 6 | |||||||
| 0.1 | 0.50 | 0.00 | 0.50 | 0.00 | 0.50 | 0.00 | 0.53 | 0.01 | 0.52 | 0.01 | 0.54 | 0.02 |
| 0.2 | 0.50 | 0.00 | 0.50 | 0.00 | 0.50 | 0.00 | 0.50 | 0.00 | 0.52 | 0.01 | 0.51 | 0.00 |
| 0.3 | 0.50 | 0.00 | 0.50 | 0.00 | 0.50 | 0.00 | 0.50 | 0.00 | 0.52 | 0.01 | 0.50 | 0.00 |
| 0.4 | 0.50 | 0.00 | 0.50 | 0.00 | 0.50 | 0.00 | 0.58 | 0.05 | 0.58 | 0.05 | 0.58 | 0.05 |
| 0.5 | 0.58 | 0.05 | 0.58 | 0.05 | 0.57 | 0.05 | 0.58 | 0.05 | 0.58 | 0.05 | 0.58 | 0.05 |
| 0.6 | 0.63 | 0.12 | 0.62 | 0.10 | 0.61 | 0.09 | 0.60 | 0.08 | 0.57 | 0.05 | 0.57 | 0.05 |
| 0.7 | 0.77 | 0.17 | 0.68 | 0.16 | 0.60 | 0.14 | 0.63 | 0.09 | 0.58 | 0.05 | 0.58 | 0.05 |
| 0.8 | 0.83 | 0.17 | 0.63 | 0.28 | 0.59 | 0.16 | 0.64 | 0.13 | 0.62 | 0.09 | 0.57 | 0.06 |
| 0.9 | 0.89 | 0.05 | 0.70 | 0.29 | 0.60 | 0.19 | 0.63 | 0.14 | 0.64 | 0.09 | 0.56 | 0.06 |
| Classical K-Mean Result | ||||||||||||
| Mean Standard Deviation | ||||||||||||
| Data Column Bi-Partition Number: BPW K-Means | ||||||||||||
|---|---|---|---|---|---|---|---|---|---|---|---|---|
| Feature Bi-Partition Unranked | ||||||||||||
| Average Accuracy | ||||||||||||
| 1 | 2 | 3 | 4 | 5 | 6 | |||||||
| 0.1 | 0.50 | 0.00 | 0.50 | 0.00 | 0.60 | 0.00 | 0.50 | 0.00 | 0.50 | 0.00 | 0.51 | 0.00 |
| 0.2 | 0.50 | 0.00 | 0.50 | 0.00 | 0.61 | 0.00 | 0.62 | 0.00 | 0.50 | 0.00 | 0.54 | 0.00 |
| 0.3 | 0.50 | 0.00 | 0.50 | 0.00 | 0.59 | 0.00 | 0.62 | 0.00 | 0.62 | 0.00 | 0.61 | 0.00 |
| 0.4 | 0.50 | 0.00 | 0.50 | 0.00 | 0.61 | 0.00 | 0.62 | 0.00 | 0.62 | 0.00 | 0.61 | 0.00 |
| 0.5 | 0.61 | 0.00 | 0.61 | 0.00 | 0.61 | 0.00 | 0.61 | 0.00 | 0.61 | 0.00 | 0.61 | 0.00 |
| 0.6 | 0.78 | 0.00 | 0.23 | 0.00 | 0.61 | 0.00 | 0.61 | 0.00 | 0.61 | 0.00 | 0.61 | 0.00 |
| 0.7 | 0.85 | 0.00 | 0.80 | 0.00 | 0.77 | 0.00 | 0.60 | 0.00 | 0.50 | 0.00 | 0.61 | 0.00 |
| 0.8 | 0.00 | 0.00 | 0.78 | 0.00 | 0.76 | 0.00 | 0.50 | 0.00 | 0.61 | 0.00 | ||
| 0.9 | 0.00 | 0.00 | 0.78 | 0.00 | 0.73 | 0.00 | 0.50 | 0.00 | 0.61 | 0.00 | ||
| Classical K-Mean Result | ||||||||||||
| Mean Standard Deviation | ||||||||||||
| Data Column Bi-Partition Number: BPW K-Means | ||||||||||||
|---|---|---|---|---|---|---|---|---|---|---|---|---|
| Feature Bi-Partition Unranked | ||||||||||||
| Average Rand Index Average Adjusted Rand Index | ||||||||||||
| 1 | 2 | 3 | 4 | 5 | 6 | 1 | 2 | 3 | 4 | 5 | 6 | |
| 0.1 | 0.49 | 0.49 | 0.49 | 0.50 | 0.50 | 0.50 | 0.00 | 0.00 | 0.00 | 0.00 | 0.00 | 0.00 |
| 0.2 | 0.49 | 0.49 | 0.49 | 0.49 | 0.50 | 0.49 | 0.00 | 0.00 | 0.00 | 0.00 | 0.00 | 0.00 |
| 0.3 | 0.49 | 0.49 | 0.49 | 0.49 | 0.50 | 0.49 | 0.00 | 0.00 | 0.00 | 0.00 | 0.00 | 0.00 |
| 0.4 | 0.49 | 0.49 | 0.49 | 0.52 | 0.52 | 0.52 | 0.00 | 0.00 | 0.00 | 0.04 | 0.04 | 0.04 |
| 0.5 | 0.52 | 0.52 | 0.52 | 0.52 | 0.52 | 0.52 | 0.04 | 0.04 | 0.04 | 0.04 | 0.04 | 0.04 |
| 0.6 | 0.65 | 0.65 | 0.64 | 0.64 | 0.52 | 0.52 | 0.30 | 0.30 | 0.28 | 0.28 | 0.04 | 0.04 |
| 0.7 | 0.74 | 0.76 | 0.73 | 0.65 | 0.52 | 0.52 | 0.49 | 0.52 | 0.46 | 0.30 | 0.05 | 0.05 |
| 0.8 | 0.84 | 0.84 | 0.84 | 0.73 | 0.60 | 0.52 | 0.69 | 0.69 | 0.69 | 0.46 | 0.19 | 0.05 |
| 0.9 | 0.84 | 0.74 | 0.65 | 0.52 | 0.69 | 0.49 | 0.30 | 0.05 | ||||
| Classical K-Mean Result | ||||||||||||
| RI = 0.52 ARI = 0.05 | ||||||||||||
| Data Column Bi-Partition Number: BPW K-Means | ||||||||||||
|---|---|---|---|---|---|---|---|---|---|---|---|---|
| Feature Bi-Partition Unranked | ||||||||||||
| Average Rand Index Average Adjusted Rand Index | ||||||||||||
| 1 | 2 | 3 | 4 | 5 | 6 | 1 | 2 | 3 | 4 | 5 | 6 | |
| 0.1 | 0.49 | 0.49 | 0.50 | 0.50 | 0.49 | 0.49 | 0.00 | 0.00 | 0.01 | 0.01 | 0.01 | 0.01 |
| 0.2 | 0.49 | 0.49 | 0.50 | 0.50 | 0.50 | 0.50 | 0.00 | 0.00 | 0.01 | 0.01 | 0.01 | 0.00 |
| 0.3 | 0.49 | 0.49 | 0.50 | 0.50 | 0.50 | 0.51 | 0.00 | 0.00 | 0.01 | 0.01 | 0.01 | 0.02 |
| 0.4 | 0.49 | 0.49 | 0.51 | 0.51 | 0.51 | 0.51 | 0.00 | 0.00 | 0.02 | 0.03 | 0.03 | 0.02 |
| 0.5 | 0.51 | 0.51 | 0.51 | 0.51 | 0.51 | 0.51 | 0.03 | 0.03 | 0.03 | 0.03 | 0.03 | 0.03 |
| 0.6 | 0.56 | 0.55 | 0.51 | 0.51 | 0.51 | 0.51 | 0.12 | 0.11 | 0.03 | 0.03 | 0.03 | 0.03 |
| 0.7 | 0.69 | 0.60 | 0.58 | 0.51 | 0.49 | 0.51 | 0.37 | 0.21 | 0.17 | 0.02 | 0.00 | 0.03 |
| 0.8 | 0.79 | 0.70 | 0.60 | 0.55 | 0.50 | 0.51 | 0.58 | 0.40 | 0.19 | 0.11 | 0.01 | 0.03 |
| 0.9 | 0.59 | 0.56 | 0.49 | 0.51 | 0.19 | 0.12 | 0.00 | 0.03 | ||||
| Classical K-Mean Result | ||||||||||||
| RI = 0.49 ARI = 0.004 | ||||||||||||
Disclaimer/Publisher’s Note: The statements, opinions and data contained in all publications are solely those of the individual author(s) and contributor(s) and not of MDPI and/or the editor(s). MDPI and/or the editor(s) disclaim responsibility for any injury to people or property resulting from any ideas, methods, instructions or products referred to in the content. |
© 2025 by the authors. Licensee MDPI, Basel, Switzerland. This article is an open access article distributed under the terms and conditions of the Creative Commons Attribution (CC BY) license (https://creativecommons.org/licenses/by/4.0/).
Share and Cite
Combert, F.K.; Xie, S.; Lawniczak, A.T. Bi-Partitioned Feature-Weighted K-Means Clustering for Detecting Insurance Fraud Claim Patterns. Mathematics 2025, 13, 434. https://doi.org/10.3390/math13030434
Combert FK, Xie S, Lawniczak AT. Bi-Partitioned Feature-Weighted K-Means Clustering for Detecting Insurance Fraud Claim Patterns. Mathematics. 2025; 13(3):434. https://doi.org/10.3390/math13030434
Chicago/Turabian StyleCombert, Francis Kwaku, Shengkun Xie, and Anna T. Lawniczak. 2025. "Bi-Partitioned Feature-Weighted K-Means Clustering for Detecting Insurance Fraud Claim Patterns" Mathematics 13, no. 3: 434. https://doi.org/10.3390/math13030434
APA StyleCombert, F. K., Xie, S., & Lawniczak, A. T. (2025). Bi-Partitioned Feature-Weighted K-Means Clustering for Detecting Insurance Fraud Claim Patterns. Mathematics, 13(3), 434. https://doi.org/10.3390/math13030434