Abstract
This study employs physical experiments and the RFPA3D numerical method to investigate the fracture evolution of rocks containing a central hole with symmetrically arranged double cracks (seven inclination angles β) under biaxial compression. The results demonstrate that peak stress and strain exhibit nonlinear increases with rising β. Tensile–shear failure dominates at lower angles (β = 0–60°), characterized by secondary crack initiation at defect tips and wing/anti-wing crack development at intermediate angles (β = 45–60°). At higher angles (β = 75–90°), shear failure prevails, governed by crack propagation along hole walls. When β exceeds 45°, enhanced normal stress on crack planes suppresses mode II propagation and secondary crack formation. Elevated lateral pressures (15–20 MPa) significantly alter failure patterns by redirecting the maximum principal stress, causing cracks to align parallel to this orientation and driving anti-wing cracks toward specimen boundaries. Three-dimensional analysis reveals critical differences between internal and surface fracture propagation, highlighting how penetrating cracks around the hole crucially impact stability. This study provides valuable insights into complex fracture mechanisms in defective rock masses, offering practical guidance for stability assessment in underground mining operations where such composite defects commonly occur.
Keywords:
rock mechanics; biaxial compression; combined defect rock; fracture evolution; numerical simulation MSC:
00A71
1. Introduction
Natural rock masses are not completely homogeneous; under long-term geological structural movements and external forces, they develop numerous internal defects such as joints, cracks, and cavities. In human engineering activities, such as tunnel excavations, mineral resource extraction, underground energy storage, and slope reinforcement, these engineered rock masses inevitably experience complex stress states, and their mechanical behavior significantly differs from that of intact rocks [1,2,3]. The defects within the rock mass, particularly composite defects like cavities and pre-existing cracks, can substantially alter the stress distribution around them, becoming points of stress concentration, which in turn can induce crack initiation, propagation, and penetration, ultimately leading to structural instability and failure of the rock mass. Therefore, an in-depth study of the fracture mechanisms in rocks containing pre-existing defects is crucial for accurately assessing the stability of rock engineering, predicting geological hazards (such as rock bursts and collapses), and optimizing engineering designs, thus holding significant practical engineering importance.
Our understanding of crack growth in rocks with defects has advanced significantly, with research progressing from the study of isolated defect types to more complex, interactive systems. Initial studies primarily focused on single-type defects, either crack-like or cavity-like. In the case of crack-like defects, experimental work on specimens containing single, double, or triple fractures has elucidated the evolution patterns of tension–shear cracks and the complete process from crack initiation to coalescence [4,5,6]. Under combined dynamic–static loading conditions, it has been observed that inclined cracks at specific angles can severely compromise the mechanical performance of granite, leading to failure modes such as oblique shear failure [7]. Concurrently, research on cavity-like defects has utilized numerical simulations and experiments to analyze the stress distribution around irregular holes and the propagation of cracks between cavities, revealing key energy dissipation mechanisms [8,9]. While these studies on isolated defect types provide a crucial foundation, natural rocks often contain coexisting holes and fractures whose interaction introduces greater complexity. This has spurred investigations into composite defect systems. Studies on non-intersecting configurations, involving holes and multiple cracks, have shown that crack initiation is highly influenced by the dip angles of the flaw [10,11]. However, as shown in Figure 1, holes and fractures can sometimes exhibit intersecting characteristics. For these intersecting defects, the crack aggregation process and associated mechanical behavior have been characterized, with direct shear testing quantifying the interactions and highlighting the significant influence of crack inclination and cavity geometry [12,13]. Furthermore, it has been demonstrated that the coupling between pre-existing holes and persistent joints governs strength degradation and crack propagation by redistributing stress concentrations [14]. A key finding from models containing a central hole with edge cracks is that increasing the crack inclination angle promotes shear crack dominance, ultimately inducing shear failure [15].
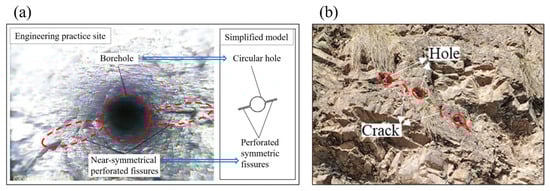
Figure 1.
Examples of rocks with intersecting combined defects. (a) From Gou et al. [10], (b) From Luan et al. [11].
Numerical methods can simulate crack formation and coalescence in brittle materials well. The finite element method (FEM) has become the mainstream computational tool in rock mechanics research due to its unique advantages in handling material nonlinearity, heterogeneity, and complex boundaries [16]. RFPA (Realistic Failure Process Analysis) is a finite element numerical method developed by Tang [17]. The program models material heterogeneity using the Weibull distribution and calibrates element strength through iterative trial-and-error, matching numerical peak stresses with experimental results. This modeling approach effectively reproduces the inherent heterogeneity characteristics of rock materials by randomly assigning its parameters like elastic modulus and strength. Compared to traditional fracture mechanics methods, the core advantage of RFPA lies in its independence from pre-defined failure paths: crack initiation is entirely triggered by the local stress state, allowing for the spontaneous evolution of complex fracture networks. This approach has been validated in numerous rock failure modeling studies [16,18,19,20,21,22], particularly achieving significant breakthroughs in three-dimensional crack propagation modeling [16]. The RFPA3D version reconstructs the three-dimensional defect systems of specimens such as diorite and granite, accurately replicating the dynamic crack propagation processes observed in experiments. The three-dimensional simulations provide a more realistic representation of the crack propagation and failure behaviors observed in experiments [22,23].
Despite these advancements, a critical gap remains in the systematic understanding of fracture mechanisms for intersecting hole–crack composite defects under biaxial compression, which represents a more realistic stress state for many deep geological engineering applications. Currently, the majority of existing research focuses on uniaxial loading conditions. While notable studies have begun to explore biaxial loading—such as Tang et al. [22], who analyzed strain and stress field evolutions, and Ji et al. [24], who revealed surface strain fields for defects at specific angles—their work has not provided a systematic analysis of crack aggregation patterns and their mechanical implications across a comprehensive range of pre-crack inclination angles. Moreover, due to inherent limitations in experimental observation techniques, the dynamic distribution patterns of the internal three-dimensional stress fields around holes and fractures remain largely unclear. To address these limitations, this study employs a combined approach of physical experiments and advanced three-dimensional numerical simulation. We systematically investigate the fracture evolution of rocks containing a central circular hole and symmetrical edge cracks under biaxial compression, covering seven different flaw inclination angles. The primary innovation of this research lies in the use of three-dimensional numerical simulation to visually and dynamically reveal the entire process of stress field evolution, thereby elucidating the complete mechanism of crack initiation, propagation, and coalescence from a three-dimensional perspective. This work aims to deepen the understanding of fracture mechanisms in rock masses with complex defects and provide theoretical support for establishing more precise instability criteria in rock engineering.
2. Methods
2.1. Experimental Method
2.1.1. Sample Features and Naming Conventions
The red sandstone samples were obtained from a tunnel in Guangdong Province, China. The specimens exhibit a dark red color and are primarily composed of quartz (35–45%) and feldspar (15–20%). Its measured physical properties include a P-wave velocity of approximately 3150 m/s and a density of 2.6 g/cm3. Mechanically, it has a Young’s modulus of 5.46 GPa, a Poisson’s ratio of 0.26, a uniaxial compressive strength of 31.97 MPa, and a tensile strength of 3.29 MPa. The derived strength parameters from these tests are a cohesion of 10.20 MPa and an internal friction angle of 34.95°. They were processed into rectangular parallelepipeds with dimensions of 100 mm × 50 mm × 100 mm (length × width × height). A regular circular hole was machined at the center of each intact specimen. Subsequently, a pair of symmetrically inclined pre-existing flaws were created emanating from the central hole using water jet cutting, resulting in composite defect specimens. The specimens prepared in this study were categorized into three configurations (see Figure 2), all under a constant confining pressure of 5 MPa. The specific details are as follows: (1) Intact samples-used for parameter calibration, totaling one sample. (2) Single circular hole samples-used for parameter calibration, totaling one sample. (3) Samples with composite defects (central hole and flaws)-used to investigate the influence of flaw inclination angles on the fracture process. This group included seven different flaw inclination angles (0°, 15°, 30°, 45°, 60°, 75°, and 90°), totaling seven samples. In summary, this experimental study involved a total of nine red sandstone specimens.
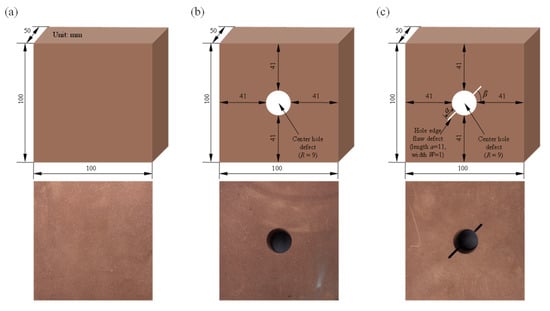
Figure 2.
Specific configurations of the samples: (a) intact sample, (b) sample with a hole defect, and (c) sample with combined defects of a central circular hole and symmetrical double cracks at hole edge.
The naming convention of the sample starts with “P,” representing the lateral pressure, followed by the value “5” to indicate a lateral pressure of 5 MPa, followed by “H,” suggesting the existence of circular hole defects. “F” designates the presence of predefined cracks, followed by a value indicating the crack inclination angle. Additionally, “I” represents an intact specimen. For example, P5HF15 signifies a lateral pressure of 5 MPa, containing circular hole defects and predefined cracks, with a crack inclination angle of 15°.
2.1.2. Experimental System and Procedure
The experimental system primarily consists of RYL-600 rock shear rheometer (Produced by Changchun Chaoyang Test Instrument Co., Ltd., Changchun, Jilin Province, China) and a Digital Image Correlation (DIC) measurement system (experimental system schematic diagram see Figure 3). This system is capable of performing uniaxial, biaxial, and conventional triaxial compression tests. The experimental procedure is as follows: First, an axial preloading force of 2 kN is applied to the specimen to ensure stable contact. Subsequently, a lateral stress of 5 MPa is applied at a rate of 100 N/s. Finally, an axial load is applied at a displacement control rate of 0.12 mm/min until the specimen fails. The DIC system includes a high-definition camera and a white light source, which synchronously captures images of the specimen’s surface at a frequency of 10 Hz. To perform DIC analysis, a random speckle pattern is first applied to the specimen’s surface. Regions of Interest (ROI) are then selected, focusing on areas that include holes and edge cracks. By analyzing the grayscale distribution of the subsets of images before and after deformation and using the Zero Normalized Cross-Correlation (ZNCC) for matching calculations, the full-field displacement and strain data are ultimately obtained. The calculation ROI area measures 80 × 80 mm2, with an image resolution of 1136 × 1136 pixels. Each pixel represents an area of approximately 0.005 mm2, and the size of a single speckle should be at least around 100 pixels to maintain good contrast. This system achieves precise synchronization and correlation between the deformation process and mechanical data.
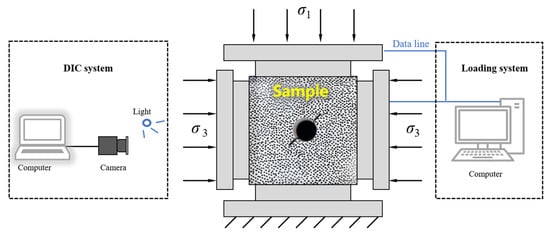
Figure 3.
Experimental system schematic diagram (including DIC).
2.2. Numerical Method
Physical experiments can effectively observe surface crack propagation in rock specimens, but they face challenges in accurately and comprehensively capturing the real-time distribution and evolution of internal dynamic stress fields, particularly around flaw tips (such as maximum/minimum principal stresses and shear stresses). In contrast, numerical simulation can construct three-dimensional numerical specimens corresponding to the experimental ones. Through computational analysis, it intuitively reveals the stress-driven mechanisms behind crack initiation and propagation, thereby explaining the causes of different crack patterns from a mechanical essence perspective. Furthermore, altering experimental conditions (e.g., loading rate, boundary conditions) and specimen parameters often involves high costs. Numerical simulation, however, facilitates convenient parametric studies. It allows for systematic and isolated variation in specific parameters (such as flaw inclination or confining pressure), thereby clarifying the influence of individual factors on crack propagation behavior. This enhances the quantitative understanding of the relationship between crack paths and key controlling parameters. This study employs three-dimensional numerical simulation to investigate the real-time distribution and evolution of the stress field throughout the failure process of specimens containing composite defects under seven different flaw inclination angles. Additionally, it explores the crack propagation process in these composite defect specimens under varying confining pressures (0, 5, 10, 15, and 20 MPa).
2.2.1. Introduction to RFPA Numerical Method
The core innovation of RFPA lies in the integration of statistical damage theory with nonlinear mechanics to characterize the failure behavior of rock masses [16,20,23,25,26]. This approach employs probability distribution functions (e.g., Weibull distribution, see Equation (1)) to assign stochastic mechanical properties to mesoscopic elements, effectively reflecting the intrinsic heterogeneity of rock masses and their resultant macroscopic nonlinear mechanical responses. Within the RFPA modeling framework, materials are discretized into numerous isotropic, linear–elastic mesoscopic elements. These elements initially exhibit linear elasticity, damage-free behavior, and isotropy. Using the modified Mohr–Coulomb criterion to determine whether the microelement has fractured (see Figure 4). In the compressive domain (first quadrant), elements undergo brittle softening when reaching the peak compressive stress σcm (i.e., uniaxial compressive strength), with strength decaying to residual stress σcr. In the tensile domain (third quadrant), failure is governed by exceeding the maximum tensile strain εtm threshold, followed by strain jump to residual value εtr upon damage initiation. Notably, RFPA employs an “elastic damage” modeling strategy to achieve continuous characterization of material degradation-element stiffness progressively degrades with damage evolution rather than undergoing instantaneous failure. This treatment significantly enhances numerical stability while providing crucial technical means for revealing acoustic emission characteristics and catastrophic precursors during rock fracture processes.
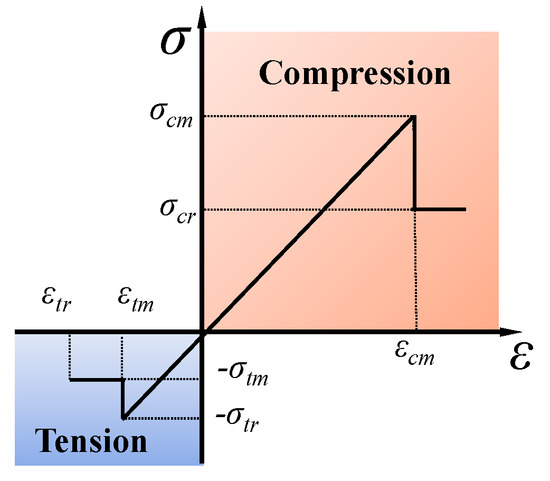
Figure 4.
Stress–strain relationship of the meso-element.
Rock is a naturally heterogeneous material, and the mechanical properties (such as strength and elastic modulus) of its mesoscopic components exhibit inherent randomness and statistical distribution characteristics. Numerous researchers have demonstrated that the Weibull distribution is reliable for describing the heterogeneity of brittle materials like rock. The RFPA method, initially proposed by Tang and developed over many years, incorporates heterogeneity using the Weibull distribution [20,23,25,26]. This approach has been widely validated by numerous studies as effective for simulating the macroscopic nonlinear mechanical behavior and complex fracture processes of rock. Consequently, with reference to the work of Tang et al., this study considers the mesomechanical properties of the rock in the numerical model to conform to a Weibull distribution. The Weibull distribution function is defined as follows:
where u is a given mechanical property (such as peak strength, Young’s modulus, Poisson’s ratio, etc.), u0 is the scaling parameter, and m is defined as the homogeneity index. As the homogeneity index m increases, the material becomes homogeneous.
In the RFPA framework under displacement-controlled loading, each computational cycle initiates with a prescribed displacement increment. The nodal displacements and elemental stress components are computed sequentially. Failed elements are identified through the aforementioned damage criterion, triggering stiffness degradation and subsequent stress redistribution. This iterative process continues until no new damage propagation occurs. Following this, an additional displacement increment is applied to proceed with the next stress computation phase. The procedure repeats cyclically until macroscopic fracture permeates the entire model.
2.2.2. Modeling Process and Numerical Simulation Parameters
The model establishment was divided into three steps: The first step involved dividing a specimen with dimensions of length × width × height = 100 mm × 50 mm × 100 mm into 2,000,000 hexahedral meso-elements (200 × 100 × 200), the size of each mesoscopic element is a cube with an edge length of 0.5 mm. To ensure the reliability of the results, we conducted a systematic mesh sensitivity analysis. Specifically, we performed simulations using three different mesh densities with element sizes of 1 mm, 0.5 mm, and 0.25 mm, respectively. The results demonstrated that when the mesh was refined from 0.5 mm to 0.25 mm, the variations in key outcomes of interest-such as peak load, elastic modulus, and final displacement-were less than 2%. This indicates that the solution has essentially converged at a mesh size of 0.5 mm or finer. Therefore, the selected mesh size of 0.5 mm is capable of providing a converged and reliable solution. The second step consisted of deleting a portion of the meso-elements (effectively reducing the elastic modulus of these elements to 1 × 10⁻⁶ Pa and displaying them in black to resemble pre-existing defects. This approach ensures continuous numerical calculations for easier convergence while effectively observing the fracture process in the numerical model) and constructing predefined cracks and pore defects as needed. The third step involved setting boundary conditions: the entire upper surface is fixed, lateral pressure is applied on both sides, and an axial compressive displacement is applied from bottom to top at a loading rate of 0.02 mm/step (which can be considered as static loading on the specimen). The loading is continued until the specimen exhibits fracture instability. Since the RFPA3D meso-elements are best represented as hexahedra for ease of computation and high accuracy, the edges of the defects in the model were not smooth but serrated. The numerical model uses a trial-and-error method for parameter calibration, taking a complete specimen as an example. The main mesoscopic parameters of the numerical simulation elements are shown in Table 1. The numerical simulation specimens consisted of the following: one intact specimen, one specimen containing a single hole, and seven specimens with composite defects at different flaw inclination angles (all these nine specimens were under a confining pressure of 5 MPa). Additionally, specimens with composite defects containing 45° flaws under four other confining pressures (0, 10, 15, and 20 MPa) were also modeled.

Table 1.
Numerical model parameters.
In the study, the heterogeneity index m for both the elastic modulus and peak strength is set to 3, a value derived from the literature indicating that this number can effectively reflect the yielding process of rocks [24,25,26]. For the remaining parameters, the elastic modulus and peak strength are determined through inversion based on the results of physical tests, while the Poisson’s ratio and internal friction angle are directly adopted from experimentally measured values. To clearly demonstrate the crack formation, growth, and development processes of the rock mass, the gravity of the rocks was not considered. Experiments were first conducted on intact specimens and those containing a single hole, comparing the results with those of experimental data to validate the accuracy of the numerical samples utilized, with the geometries of the three configurations generated by RFPA3D shown in Figure 5.
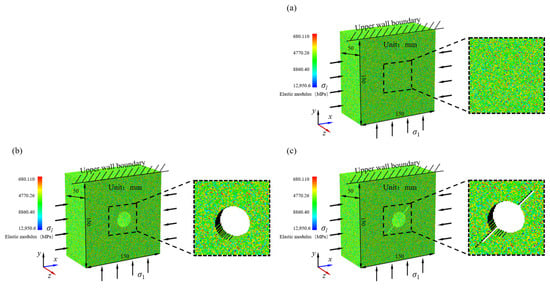
Figure 5.
RFPA3D numerical specimens: (a) intact sample, (b) sample with a hole defect, and (c) sample with combined defects of a central circular hole and symmetrical double cracks at hole edge (taking a crack angle of 45° as a case in point).
Key material parameters for samples were calibrated using experimental data, with specimen numbers designated as P5I, P5H and P5HF45. Figure 6 presents the stress–strain curves of three types of specimens and compares and analyzes the experimental data with the RFPA3D simulation. In Figure 6, the dashed lines convey the numerical simulation results, whereas the solid lines indicate the findings from the experiments. Figure 6 reveals a notable similarity between the simulated stress–strain behavior of the numerical models and experimental counterparts. It is calculated that peak stress of the experiment’s specimens P5I, P5H and P5HF45 are 43.48, 36.41 and 30.94 MPa, respectively. The numerical results were 43.41, 35.70 and 28.75 MPa, yielding relative errors of −0.17%, −1.95%, and −7.07%, respectively. The elastic modulus from the experiments results, which were 5.46, 4.60, and 4.52 GPa, while the numerical results were 5.60, 5.00 and 4.50 GPa, with relative errors of 2.56%, 8.70%, and −0.44%, respectively. The strain values at peak stress from the experimental results, which were 12.13 × 10⁻³, 11.19 × 10⁻³ and 11.97 × 10⁻³, compared to numerical results of 9.40 × 10⁻³, 7.80 × 10⁻³ and 7.20 × 10⁻³, resulting in relative errors of −22.50%, −30.29%, and −39.86%, respectively. The three parameters closely align with the experimental results, suggesting that the simulation outcomes are satisfactory. The peak stress of defective specimens is lower than that of intact specimens.
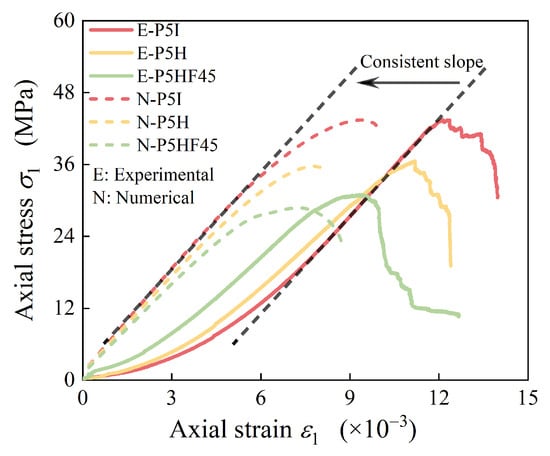
Figure 6.
Comparison of numerical and experimental results of stress–strain curves for three types of specimens.
Figure 7 compares the compressive failure morphologies of specimens P5I, P5H, and P5HF45 between experimental and RFPA3D numerical tests, demonstrating remarkable consistency. For the P5I specimen, the numerical results reveal a uniformly distributed crack network, with notable tensile–shear failure. In contrast, although the physical experiments also exhibit tensile–shear failure, the crack distribution is uneven. This discrepancy is attributed to the micro-particle conditions of the actual specimen. For the P5H specimen, both the physical and numerical simulation results show significant shear deformation of the holes, and the crack propagation direction extends laterally in both cases. Both physical experiments and numerical simulations on the P5HF45 specimen observed the coalescence of AW cracks and hole rupture, resulting in a final tensile–shear failure mode. The propagation morphology of the lateral tensile–shear cracks was similar in both cases. However, certain discrepancies persist between physical experiments and RFPA3D numerical simulations. This difference is permissible. Overall, the analysis demonstrates that the RFPA3D model not only accurately replicates the geometric features of macroscopic fracture patterns for different specimens but also characterizes the experimental failure mechanisms from the perspectives of crack density distribution and deflection of propagation paths. This effectively validates the synergy and reliability of numerical simulations and physical experiments in the study of rock fracture behavior.
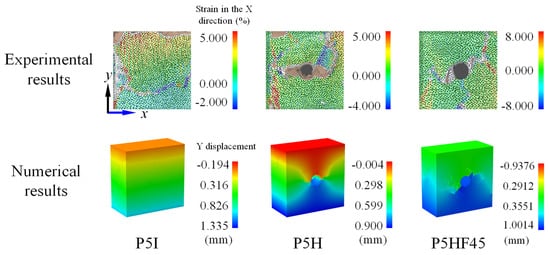
Figure 7.
Final fracture characteristics for three specimens: comparison of experimental results with RFPA3D numerical results.
The strain in real rocks is a result of continuous nonlinear deformation contributed by the initiation, stable growth, and coalescence of numerous micro-cracks. In the RFPA model, each element behaves elastically until it reaches a strength threshold, after which its stiffness immediately degrades. This often leads to the simulated stress–strain curve being closer to linear before the peak, resulting in an underestimation of the accumulated nonlinear deformation (strain). In terms of mechanical parameters and fracture modes, the differences between the simulation results and experimental data fall within the range of normal errors. Such discrepancies typically arise from changes in simulation conditions and may still occur even after the micro-parameters have been calibrated [27,28]. As mentioned earlier, after determining the micro-parameters, this simulation introduces pre-existing defects, such as circular holes and edge cracks, by removing certain elements in the complete numerical model. It is important to note that the Weibull distribution used in the numerical model is merely a simplified representation of the highly complex heterogeneous structure of the rock, making it challenging to accurately replicate the true micro-structure of specific specimens. Therefore, it is unrealistic to expect the numerical simulation results to perfectly match the experimental data.
3. Stress Intensity Factors for Symmetrical Inclined Double Cracks at the Circular Hole Edge Under Biaxial Compression
According to fracture mechanics theory, stress intensity factors for symmetrical inclined double cracks at the circular hole edge can be calculated under remote uniaxial tension σy:
where a is the crack length, and fI, fII denote the dimensionless stress intensity factors for modes I and II, respectively.
Based on Mohr circle stress relationship, the equivalent stress applied to the crack due to biaxial compression is presented as follows:
where , and τ denote the x- and y-direction normal stress components and shear stress, respectively, applied to the crack within the new coordinate system.
In Equation (3), the influence of mode I (opening type crack) and mode II (sliding type crack) cracks on fracture initiation is addressed. The other two stress components indicate that, under biaxial compression, the crack tip experiences both compressive stress and shear stress τ, with the shear stress being negative in the coordinate system shown in Figure 8. From Equation (3), when σx and σy are known, the shear stress magnitude exhibits a critical dependence on the oblique crack’s inclination angle β. To visually display the relationship between β and the equivalent stress at the crack tip, this relationship is illustrated in Figure 9. From Figure 9, β ranges from 0° to 90°; as β increases, the shear stress increases at first before decreasing, and reaching a peak value (also the highest value) at β = 45°. At both β = 0° and β = 90°, the shear stress is zero. Meanwhile, the compressive stress gradually decreases with increasing β, attaining its peak value at β = 0°. At β = 0° and β = 90°, the compressive stress is related only to the axial stress and lateral stress, respectively. At β = 0°, the compressive stress is maximized (equal to axial stress σy), while the shear stress concurrently reaches its minimum value, making fracture of the specimen more difficult and resulting in a higher peak stress. Conversely, when β = 90°, the compressive stress is at its minimum (equal to lateral stress σx), while the shear stress concurrently reaches its minimum value. However, the axial stress suppresses axial shear failure of the specimen, again making fracture more difficult and keeping the peak stress high. The compressive stress slope relative to y-directional stress exhibits an initial decrease followed by an increase with rising β. At β = 45°, the maximum shear stress makes the specimen containing pre-existing cracks more prone to fracture, leading to generally lower peak stress. However, due to the unclear degree of impact that compressive and shear stresses have on fracture, it remains undetermined at which inclination angle the oblique crack is most likely to fracture, a question that could be explored through combined experimental–numerical approaches.
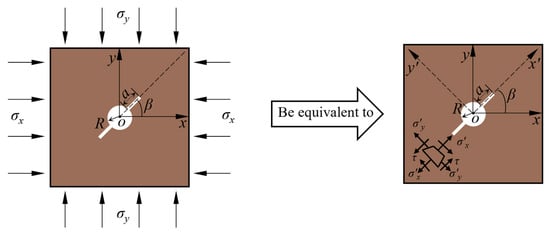
Figure 8.
A schematic diagram of the equivalent stress at the crack tip of a biaxial compression crack.
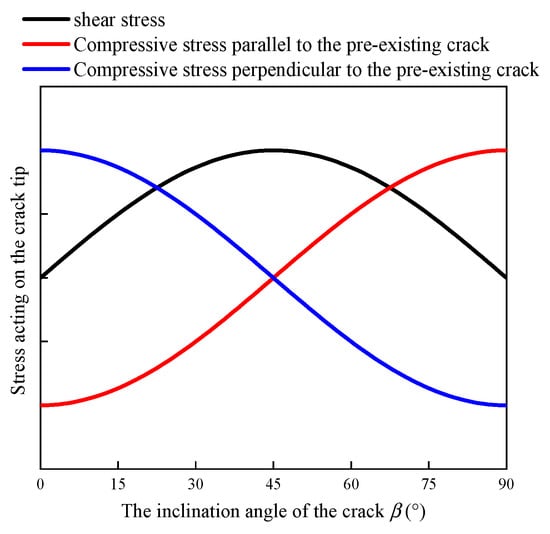
Figure 9.
The relationship between the inclination angle β (0–90°) of oblique cracks and equivalent stress.
Under biaxial compression testing conditions, the y-direction represents the axial loading direction, with stress gradually increasing, while the x-direction stress (considered as lateral pressure) remains constant and relatively low. Usually, cases in which the stress in the y-direction is inferior to that in the x-direction are not considered, as the specimen would be subjected to lower stress and remain relatively stable. When σy > σx, both equivalent compressive and shear stresses exhibit linear proportionality to increasing σy. To intuitively demonstrate this increasing trend, we assume that the lateral pressure σx (x-direction stress) is 5 MPa, while the axial stress σy (y-direction stress) ranges from one to ten times the lateral pressure. The relationship between the equivalent compressive stress and shear stress, as y-direction stress increases, is plotted for crack inclination angles β of 0–90°, see Figure 10. According to Figure 10a, at β = 0° and β = 90°, the shear stress is zero. At β = 15° and 75°, the shear stress increases with y-direction stress at consistent slopes. Similarly, at β = 30° and 60°, the shear stress increases with y-direction stress at a greater slope than that at β = 15° and 75°. At β = 45°, the slope for the increase in shear stress with y-direction stress is at its maximum, indicating that during loading, the shear stress experienced by the crack tip at β = 45° is not only the highest but also has the greatest rate of increase. Additionally, as β increases slightly (e.g., from 0° to 15°), the slope for the increase in shear stress with y-direction stress grows quickly, highlighting the tendency for oblique cracks to initiate secondary cracks. From Figure 10b, when β = 0°, the compressive stress reaches its maximum value, typically resulting in a higher peak stress in the specimen. However, the specimen’s peak stress is governed by the competing interplay between normal and shear stresses throughout crack nucleation and propagation. When β > 45°, according to Equation (3) and Figure 10b,c, the compressive stress parallel to the crack direction exceeds that perpendicular to the crack direction, which causes a change in the principal stress direction. This inhibits the occurrence of mode II cracks, making it more difficult for the crack tip to initiate wing cracks, anti-wing cracks, or oblique secondary cracks.
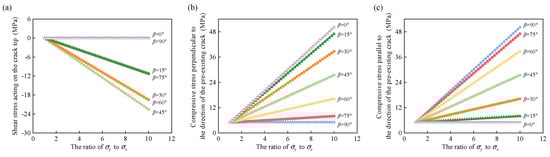
Figure 10.
The relationship between the equivalent stress and σy/σx for different inclination angles β (0–90°) of the oblique cracks at the hole edge (assuming σx = 5 MPa and σy/σx ranging from 1 to 10): (a) equivalent shear stress, (b) equivalent compressive stress perpendicular to crack, and (c) equivalent compressive stress parallel to crack.
Substituting Equation (3) into Equation (2), stress intensity factors for symmetrical inclined double cracks at the circular hole edge can be calculated under remote biaxial compression.
The factor fI can be obtained using Bowie’s [29] approximation equation, and fII can be derived from Hsu’s [30] approximation equation. Further discussion on this is beyond the scope of this paper.
4. Mechanical Properties of Combined Defect Specimens
4.1. Stress–Strain Curve and Peak Stress
Figure 11 presents the stress–strain curves of red sandstone with various crack inclination angles under experimental conditions. From Figure 11, the curves of specimens with different crack inclination angles generally exhibit similar characteristics and undergo nearly identical stages: initial pore compression, linear elastic deformation (accompanied by crack initiation and stable propagation), unstable crack propagation leading to peak strength, and post-peak behavior culminating in failure. The elastic modulus across specimens with different crack inclinations shows little variation. In contrast, the crack inclination angle exerts a significant influence on the peak strength of the specimens. In summary, the crack inclination angle is a critical factor controlling the mechanical response. It directly affects key parameters such as peak strength and the crack initiation stress, while the general shape of the stress–strain curve consistently reflects the typical brittle failure process of red sandstone.
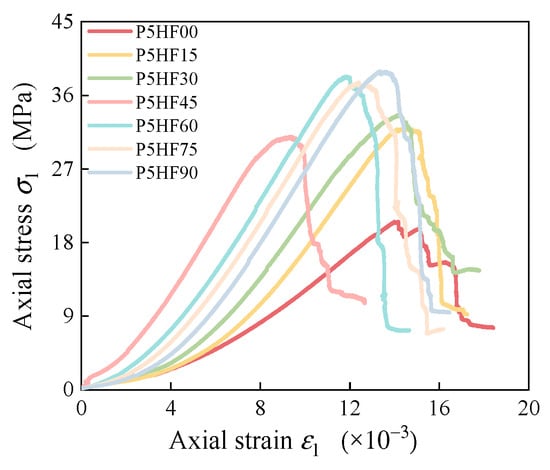
Figure 11.
Stress–strain curves of red sandstone with combined defects under different fracture inclinations.
Figure 12 shows the peak stress of combined defect samples. From Figure 12a, the peak stresses of the composite defect samples with prefabricated crack inclination angles β of 0–90° are 20.56, 31.90, 33.64, 30.99, 38.33, 37.59, and 38.98 MPa, respectively (experimental results). As β increases, the peak stress of the composite defect samples increases nonlinearly. There is a decline when the inclination angle is 45°. From Figure 12b, the peak stresses of the combined defect specimens at lateral pressures of 0, 5, 10, 15, and 20 MPa are 25.07, 28.75, 30.02, 30.73, and 30.04 MPa, respectively (numerical simulation results). As the lateral pressure increases, there is a nonlinear trend of increasing peak stress. However, the increase in lateral pressure significantly promotes lateral cracking in the specimens, which results in the peak stress not increasing substantially with rising lateral pressure.
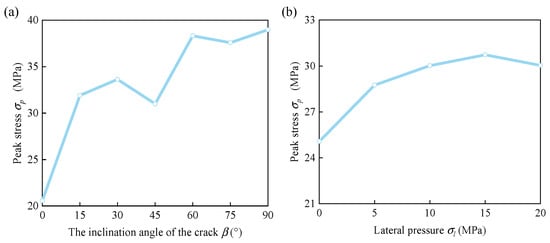
Figure 12.
Peak stress of combined defect specimens (a) with varying preset crack angles and (b) with varying lateral pressure.
4.2. Fracture Morphology
Rocks containing a single prefabricated crack and those containing a single hole, respectively, generate four types (OS: oblique secondary crack, QS: quasi-coplanar secondary crack, W: wing crack, AW: anti-wing crack) and three types (S: shear crack, T: tensile crack, F: far-field crack) of cracks under uniaxial compression. Figure 13 illustrates the fracture morphology of composite defect samples with seven different prefabricated crack inclination angles (β). The different colors in the figure represent distinct displacement values, which are not displayed here as they are unrelated to the fracture morphology. From Figure 13, specimen P5HF00 develops tensile cracks along the superior and inferior margins of the hole, as well as W cracks, AW cracks, and OS cracks emanating from the prefabricated crack tip, with OS cracks dominating the fracture. As β increases, specimen P5HF15 exhibits the same four types of cracks, with OS and W cracks being the dominant fractures. Specimen P5HF30 does not show any AW cracks and introduces shear cracks, with fractures primarily resulting from the merging of OS cracks and shear cracks. Specimens P5HF45 and P5HF60 do not exhibit tensile cracks above and below the hole, with fractures mainly dominated by oblique secondary cracks. Specimens P5HF75 and P5HF90 rarely exhibit W and AW cracks, as the increase in β leads to increased compressive stress at the crack tips, with fractures primarily caused by the propagation of shear cracks on the sidewall of the hole. Specimen P5HF90 shows a fracture morphology similar to that of P5H (Figure 7), containing numerous shear cracks that propagate in an X-shaped pattern, as the crack tip direction experiences significant compressive stress and minimal shear stress, making crack initiation nearly undetectable. Starting from an inclination angle of 45°, the fracture morphology of combined defect specimens shows no tensile cracks along the superior and inferior margins of the hole, as the increased inclination angle provides space for strain concentration, making the initiation of tensile cracks more difficult.
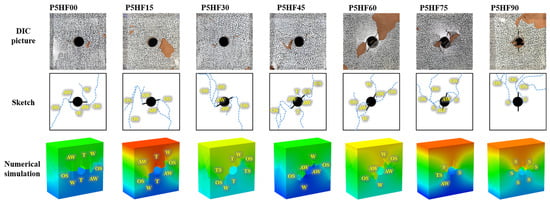
Figure 13.
Fracture morphologies of combined defect specimens at different crack inclination angles. OS: oblique secondary crack, QS: quasi-coplanar secondary crack, W: wing crack, AW: anti-wing crack, S: shear crack, T: tensile crack, TS: tensile–shear crack. The different colors in the figure represent distinct displacement values, which are not displayed here as they are unrelated to the fracture morphology. The same below.
The fracture morphologies of five combined defect specimens with a 45° inclination angle under different lateral pressures are shown in Figure 14. From Figure 14, specimen P0HF45 exhibits W cracks and AW cracks emanating from the crack defect tips, as well as remote TS cracks, with W cracks and TS cracks dominating the fractures. As the lateral pressure increases, specimen P5HF45 includes W cracks, AW cracks, and OS cracks originating from the crack defect tips, with the dominant fractures being the OS and W cracks. Under higher lateral pressures (specimens P10HF45 and P20HF45), fracture morphology transitions to exclusively AW and OS cracks, with complete absence of wing cracks. The fractures primarily originate from the propagation of the OS cracks towards both sides of the samples. As lateral pressure rises, the fracture morphology of the composite defect samples containing 45° inclined cracks shows certain changes. The higher the lateral pressure, the more pronounced the tendency of the specimens to expand laterally. This is because at excessively high lateral pressures, the combined defect specimens with a 45° inclination angle exhibit central symmetry, which often leads to a change in maximum principal stress direction, and cracks propagate parallel to this direction, driving anti-wing cracks toward specimen boundaries.
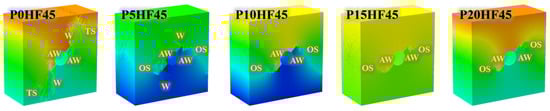
Figure 14.
The fracture morphology of combined defect specimens with a 45° inclination angle under different lateral pressures.
5. Characteristics of Crack Initiation and Propagation
5.1. Crack Initiation Site
Figure 15 illustrates the crack initiation sites of the combined defect specimens containing different prefabricated crack inclination angles β. The different colors in the figure represent distinct displacement values, which are not displayed here as they are unrelated to the fracture morphology. When 0° ≤ β ≤ 60°, the crack initiation site in the composite defect samples is at crack defect tips. However, at β = 75° and 90°, the crack initiation sites are located on the sidewall of the hole or at the shoulders of the hole. This indicates that changes in the prefabricated crack inclination angle β dictates fracture nucleation sites in the composite defect samples, and the elevated compressive stress at the pre-existing crack tip when β = 75° and 90°.
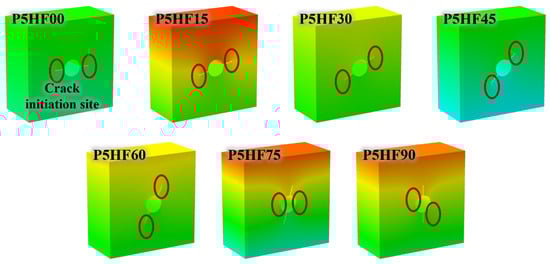
Figure 15.
The crack initiation sites of the combined defect samples containing different prefabricated crack inclination angles β. The red circle represents the crack initiation site.
Figure 16 illustrates the crack initiation sites of combined defect specimens under different lateral pressures. From Figure 16, when the lateral pressure changes, the crack initiation site for the combined defect sample with 45° inclined cracks is consistently at the crack defect tips. The higher the lateral pressure, the more pronounced the tendency of the samples to expand laterally. Because under higher lateral pressures (15 and 20 MPa), maximum principal stress direction shifts. Cracks propagate parallel to this direction, driving anti-wing cracks toward specimen boundaries.

Figure 16.
Crack initiation sites in combined defect specimens under different lateral pressures.
The observation of crack initiation locations in this study, as influenced by the inclination angle β of the pre-existing cracks, reveals that the underlying mechanism is primarily a decisive transformation in the dominant stress field surrounding the defects caused by changes in the angle. When the angle is low (0° ≤ β ≤ 60°), the tip of the pre-existing crack becomes a critical stress concentration zone, where the stress state is a mixed-mode of tensile and shear. As shown in Figure 9 and Figure 10, the equivalent stress analysis indicates that significant shear stress drives the sliding of the crack surfaces, resulting in strong tensile stress concentration at the wing of the crack tip, which preferentially initiates wing cracks or anti-wing cracks. However, as the β angle increases to 75° and 90°, the normal compressive stress acting on the crack surfaces sharply increases, as depicted in Figure 10b,c. This “clamping effect” greatly suppresses the relative sliding of the crack surfaces and the propagation of Mode II cracks, causing the stress concentration to shift from the crack tip to the side walls of the central hole. This shift results in a deflection of the maximum principal stress direction, ultimately leading to the initiation of shear cracks on the side walls of the hole, which dominate the subsequent failure process.
5.2. Crack Propagation
Figure 17 illustrates the secondary crack development processes in combined defect samples with varying crack inclination angles. It includes four types of diagrams, the maximum and minimum principal stress field, the axial displacement field, and the micro-fracture accumulation evolution, with each type featuring eight corresponding key stress moments. Stress and displacement contours are systematically positioned in the top-left corner of their corresponding field diagrams. In the micro-fracture accumulation evolution diagram, each sphere represents an individual micro-fracture event, and the sphere’s diameter is proportional to the energy released during mesoscale element fracture. Red spheres denote compressive shear micro-fracture events, while blue spheres represent tensile micro-fracture events.
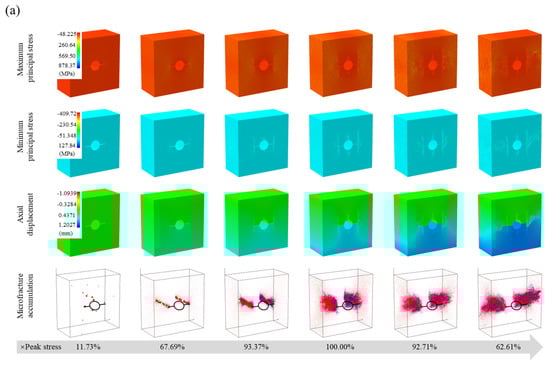
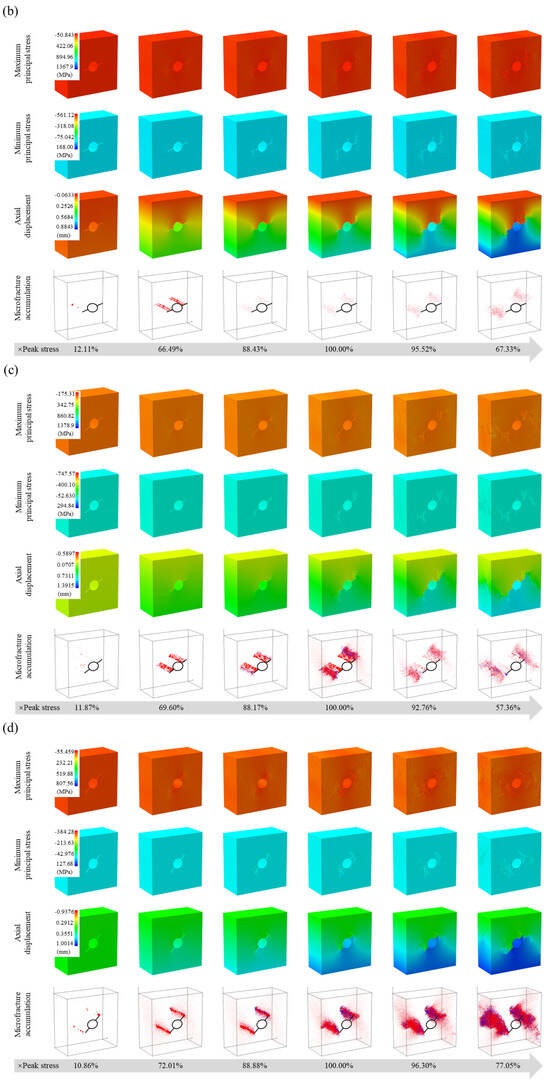
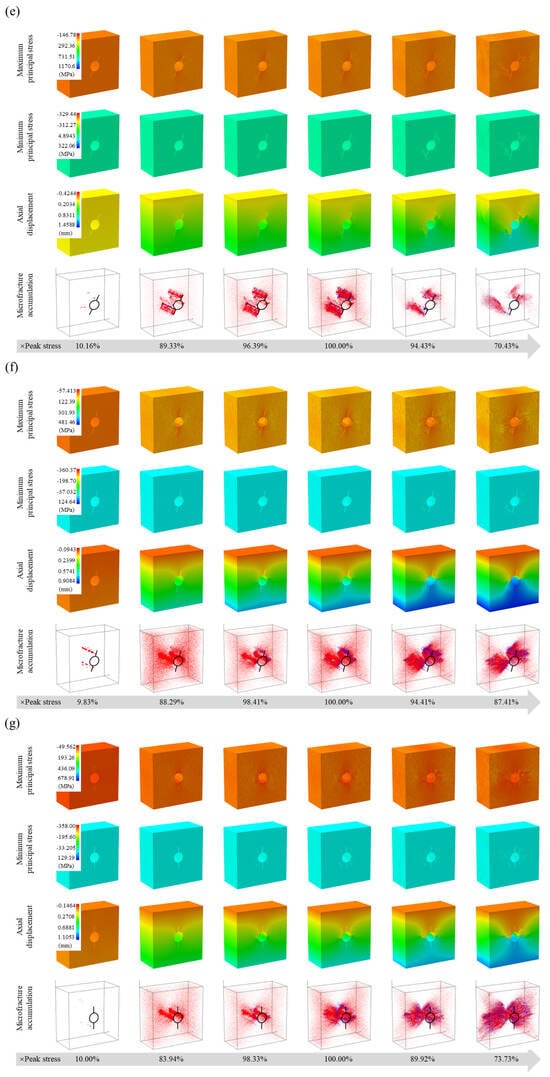
Figure 17.
Crack propagation characteristics and stress concentration patterns in combined defect specimens with varying prefabricated crack angles: (a) β = 0°, (b) β = 15°, (c) β = 30°, (d) β = 45°, (e) β = 60°, (f) β = 75°, and (g) β = 90°. In the micro-fracture accumulation diagrams, each small sphere represents an individual micro-fracture event, the sphere’s diameter is proportional to the energy released. Red spheres and blue spheres represent compressive shear and tensile micro-fracture events, respectively. The same below.
From Figure 17a, when β = 0°, the axial stress σ1 is 11.73% of the peak stress σp, the stress and displacement distribution in the sample is relatively uniform, without significant stress concentration, though random micro-fracture events can be observed. At σ1 = 67.69% σp, there is a noticeable stress concentration in the specimen, and macroscopic cracks develop both above and below the crack defect tips. The accumulation of micro-fracture events shows a limited number of tensile micro-fracture and a large quantity of compressive shear micro-fracture events around the crack defect tips. When σ1 = 93.37% σp, both the maximum and minimum principal stresses become concentrated near the secondary cracks originating from the crack tips. Each of the two crack defect tips generates W cracks and AW cracks, while tensile cracks develop above and below the hole (as tensile micro-fracture events occur in these regions). The axial displacement field begins to show non-uniformity, with displacement boundary lines appearing at the secondary cracks and crack defect tips. A significant accumulation of micro-fracture events occurs at crack defect tips, indicating the propagation of macroscopic cracks. As the sample reaches the peak stress, the W and AW cracks originating from the crack defect tips further propagate, and new OS cracks are initiated at the crack defect tips. The non-uniformity of the axial displacement field increases, and the accumulation of micro-fracture events continues. When σ1 = 62.61% σp, after the peak stress, accumulated micro-fracture events increases significantly, displaying a macroscopic fracture surface dominated by the OS cracks emanating from the pre-crack’s tips. The specimen’s ultimate failure mode predominantly manifests as a tension–shear composite fracture, with the maximum and minimum principal stress diagrams revealing significant stress concentration around the macroscopic cracks (the deep yellow zones within the stress diagram). Figure 17b,c illustrate the crack propagation process in composite defect samples containing 15° and 30° inclined cracks. The fracture evolution in these two specimens is comparable to that of the combined defect sample with 0° inclined cracks, beginning with the initiation of W or AW cracks at the crack defect tips, followed by the emergence of tensile cracks above and below the hole, and ultimately resulting in the development of OS cracks from crack defect tips, forming a macroscopic shear fracture plane that leads to sample instability and failure.
Figure 17d illustrates the fracture evolution in a composite defect sample containing 45° inclined cracks. At σ1 = 10.86% σp, the stress and displacement distribution within the sample is fairly uniform, without significant stress concentration, and only a few random micro-fracture events occur. When σ1 = 72.01% σp, there is a noticeable stress concentration in the specimen, and macroscopic cracks appear above and below the crack defect tips, manifesting as W cracks and AW cracks. The accumulated micro-fracture diagram indicates a limited number of tensile micro-fractures and a lot of compressive shear micro-fractures at the pre-crack’s tips. At σ1 = 88.88% σp, both the maximum and minimum principal stresses show clear concentration near the W cracks and AW cracks that emerge from the crack defect tips. There is a higher accumulation of tensile crack events at these tips as well. The axial displacement field begins to exhibit non-uniformity, with a significant accumulation of micro-fracture events at the W and AW cracks, indicating the extension of macroscopic cracks. When the sample reaches the peak stress, the W cracks and AW cracks initiated from crack defect tips further propagate, and new OS cracks also emerge from the tips. The non-uniformity of the axial displacement field increases, creating displacement boundary lines at the secondary cracks and pre-cracks, with tensile micro-fracture events continuing to accumulate significantly, although compressive shear micro-fracture events outnumber the tensile ones. At σ1 = 77.05% σp, following the peak stress, the W cracks and AW cracks from the pre-crack’s tips continue to extend towards the upper and lower boundaries of the sample, while new QS cracks also appear. The accumulation of micro-fracture events increases substantially, indicating a macroscopic fracture surface dominated by two OS cracks emanating from the crack defect tips. The specimen’s ultimate failure mode is predominantly tensile–shear fracture, with the maximum and minimum principal stress diagrams revealing significant stress concentration around the macroscopic cracks (the deep yellow regions in the stress diagram). Furthermore, given that the entire specimen is essentially three-dimensional, it is evident from the side view of the specimen that the internal structure exhibits tensile–shear fracture. Figure 17e showcases the crack propagation process in a combined defect sample with 60° inclined cracks. The crack propagation process is comparable to that of the combined defect sample containing 45° inclined cracks, beginning with the initiation of W or AW cracks at the crack defect tips, followed by the propagation of OS cracks from these tips, forming a macroscopic shear fracture plane that leads to sample instability and failure. Across the whole fracture process, no tensile cracks develop above or below the hole.
Figure 17f presents the crack development processes in a combined defect sample containing 45° inclined cracks. At σ1 = 9.83% σp, the stress and displacement distribution within the sample is fairly uniform, with only a few random micro-fracture events occurring. When σ1 = 88.29% σp, there is a noticeable stress concentration in the specimen, and macroscopic cracks appear on the sidewall of the hole, manifesting as shear cracks. The accumulated micro-fracture diagram indicates that there are very few tensile micro-fractures and a lot of compressive shear micro-fractures on the walls of the hole. At σ1 = 98.41% σp, the two principal stress fields show significant concentration around the left and right walls and the shoulders of the hole, with a higher accumulation of tensile micro-fracture events in these areas. The axial displacement field begins to exhibit non-uniformity, although macroscopic cracks have not yet penetrated through. At peak stress, macroscopic shear cracks are observed on the sidewall of the hole. The non-uniformity of the axial displacement field increases further, leading to the formation of displacement boundary lines defined by secondary cracks and pre-existing cracks, with a significant accumulation of tensile micro-fracture events within the specimen, though compressive shear micro-fracture events outnumber the tensile ones. At σ1 = 87.41% σp, after reaching the peak stress, the shear cracks originating from the sidewall of the hole continue to extend towards the specimen’s left and right boundaries. An AW crack emanates from the lower crack defect tip and extends upward, merging with the shear crack that emerges from the left wall of the hole. The accumulation of micro-fracture events in the sample increases significantly, and the macroscopic fracture plane is dominated by the shear cracks emanating from the sidewall of the hole, leading to a final fracture mode characterized by shear failure, with principal stress diagrams showing significant stress concentration around the macroscopic cracks. Figure 17g illustrates the crack propagation process in a combined defect sample containing 90° inclined cracks. The fracture evolution in this sample is comparable to that of the combined defect sample containing 75° inclined cracks, beginning with the initiation of shear cracks on the sidewall of the hole, followed by the emergence of shear cracks at the shoulders of the hole. As axial loading progresses, these shear cracks gradually propagate, culminating in a fracture mode characterized by shear failure. However, in the combined defect sample containing 90° inclined cracks, all cracks are shear cracks, whereas the combined defect sample containing 75° inclined cracks also features AW cracks and OS cracks. The failure mode of the sample with 90° inclined cracks closely resembles that of samples with a single hole.
Based on the above, the fracture progression and failure patterns of combined defect samples with inclined cracks at different angles are inconsistent. When β = 0°, 15°, and 30°, the initial cracks are W cracks or AW cracks at the crack defect tips, followed by tensile cracks below and above the holes. The failure pattern is predominantly controlled by OS cracks initiated from the crack defect tips. When β = 45° and 60°, the initial cracks are W cracks or AW cracks at the crack defect tips, followed by OS cracks initiated from the crack defect tips. The fracture morphology is largely dominated by OS cracks originating from the crack defect tips. When β = 75° and 90°, the initial cracks are shear cracks on the sidewall of the holes, and the failure pattern is dominated by shear cracks, ultimately resulting in shear failure. This variation arises because the shear and compressive stresses at crack defect tips change with the prefabricated crack inclination angles. When β > 45°, the shear stress at the crack defect tip decreases with the increasing crack inclination angle, while the compressive stress parallel to the crack defect gradually increases. This change in stress conditions suppresses the occurrence of mode II cracks, making it increasingly difficult for the crack defect tip to initiate W cracks, AW cracks, or OS cracks. Notably, when β = 90°, the shear stress at crack defect tip is minimized and the compressive stress parallel to the crack direction is maximized. As a result, no secondary cracks (including W, AW, or OS cracks) are initiated at the crack defect tips, making the failure pattern nearly identical to that of samples with a single hole. gradually suppressing the propagation of mode II cracks, making it difficult for secondary cracks to initiate at crack tips.
Figure 18 presents the secondary crack propagation process in combined defect specimens containing prefabricated cracks with a 45° inclination angle under different lateral pressures. It includes four different types of visualizations: the maximum and minimum principal stress field, the axial displacement field, and the evolution of micro-fracture accumulation, each illustrating eight corresponding critical stress moments. From Figure 18a, when lateral pressure is zero, at σ1 = 8.04%σp, the stress and displacement distribution are relatively uniform without significant stress concentration. However, numerous accumulated tensile micro-fracture events can be observed at the prefabricated crack tip. When σ1 = 35.89%σp, a noticeable stress concentration occurs, with micro-fractures appearing above and below the prefabricated crack tip. The accumulated micro-fracture diagram shows a lot of tensile micro-fractures and fewer shear micro-fractures at the crack tip. At σ1 = 97.27%σp, both the minimum and maximum principal stresses concentrate around the secondary cracks originating from the crack tips. Each crack defect tip generates W cracks and AW cracks. The axial displacement field begins to show non-uniformity, establishing a displacement boundary line along the secondary and prefabricated cracks. A significant accumulation of micro-fracture events appears at the prefabricated cracks tip, indicating micro-fracture propagation. As the specimen reaches peak stress, the W cracks and AW cracks extending from the crack defect tips further propagate, while new OS cracks emerge from the crack defect tips. The non-uniformity of the axial displacement field intensifies, and tensile micro-fracture events occur at the loading direction of the specimen, suggesting the emergence of new far-field tensile–shear cracks. At σ1 = 89.41%σp, after reaching peak stress, a significant accumulation of micro-fracture events occurs, revealing a macro-fracture surface dominated by two OS cracks and far-field tensile–shear cracks emanating from the crack defect tips. The sample’s ultimate failure mode predominantly manifests as a tension–shear composite fracture, with the maximum and minimum principal stress diagrams indicating significant stress concentration (the deep yellow areas in the principal stress diagram).
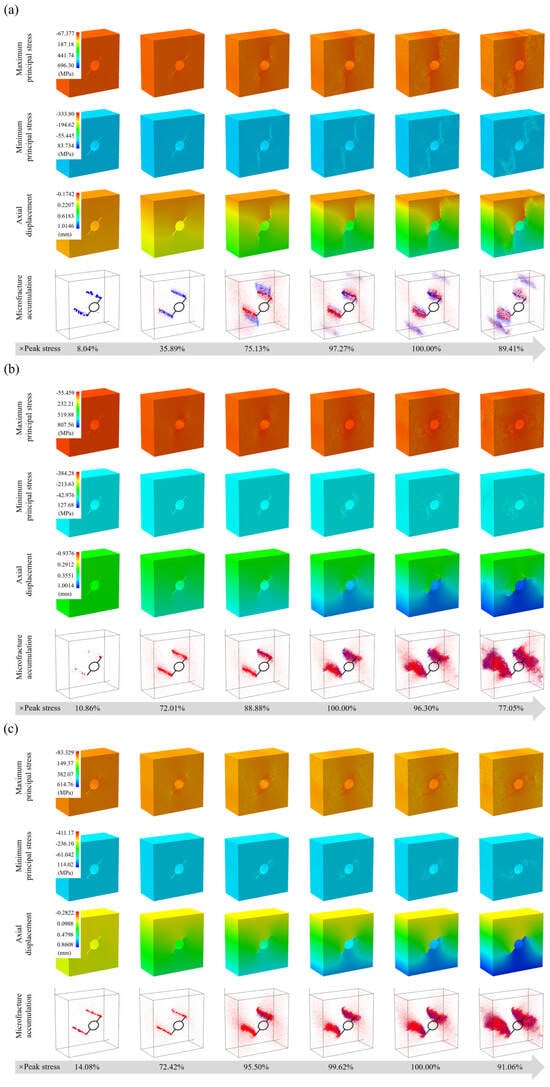
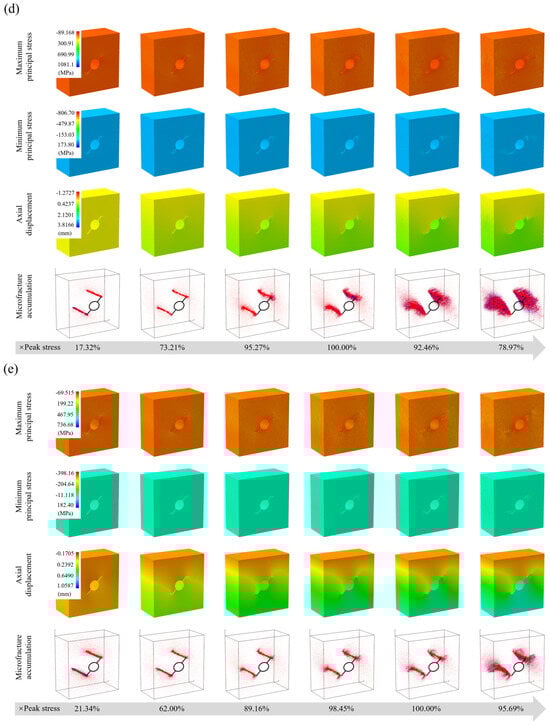
Figure 18.
Crack propagation characteristics and stress concentration patterns in combined defect specimens with varying lateral pressures: (a–e) σl = 0, 5, 10, 15, and 20 MPa, respectively.
Figure 18b,c illustrate the crack propagation processes in composite defect specimens with lateral pressures of 5 and 10 MPa, respectively. The crack propagation processes for these two specimens are similar. Initially, W cracks or AW cracks originate at the crack defect tips, followed by the extension of OS cracks originating from the crack defect tips, resulting in the formation of a macro-shear fracture surface, which leads to specimen instability and failure. In contrast to Figure 18a, when the lateral pressure exceeds zero, the overall occurrence of tensile micro-fracture in the composite defect specimens is significantly reduced, and no far-field tensile–shear cracks are observed. However, the macro-fracture surfaces in both cases are predominantly characterized by the OS cracks originating from the crack defect tips.
Figure 18d,e show the crack propagation processes in composite defect specimens subjected to lateral pressures of 15 and 20 MPa, respectively. The crack propagation processes for these two specimens are similar. Initially, AW cracks emerge at the crack defect tips, followed by the extension of OS cracks originating from these tips towards the lateral boundaries, resulting in the formation of a macro-shear fracture plane, leading to specimen instability and failure. In comparison to Figure 18a–c, under higher lateral pressures (15 and 20 MPa), the composite defect specimens do not exhibit wing cracks or far-field tensile–shear cracks. However, the macro-fracture surfaces are still predominantly characterized by the OS cracks emanating from the crack defect tips. With the increased lateral pressure, the direction of secondary crack growth in the composite defect samples gradually shifts towards the lateral pressure direction. Because under higher lateral pressures, maximum principal stress direction shifts. Cracks propagate parallel to this direction, driving anti-wing cracks toward specimen boundaries.
6. Discussion
6.1. Implications of the 3D Simulation for Understanding the Fracture Process
Although the numerical simulation results in this study closely match the physical results during parameter calibration, certain discrepancies in mechanical parameters and fracture modes may arise due to the intersecting and concentrated nature of the composite defects. These differences can be ascribed to the insufficient consideration of the hole and crack defects in the numerical model [27,31]. Such discrepancies are normal errors that occur when changes are made to other simulation conditions. Minor differences still exist after micro-parameter calibration [27], so materials and defects cannot be perfectly represented in numerical models. Therefore, it is unrealistic to expect that numerical simulations will fully align with experimental results. In RFPA, the grid density directly affects the level of detail in describing the material’s heterogeneity. A coarser grid represents a material model with a higher degree of “homogenization” resulting in a blurred distribution of internal defects, which may not accurately simulate complex crack branching and interactions. A finer grid can more precisely depict the distribution of micro-defects within the material, potentially allowing for the simulation of more complex damage patterns. In this context, the grid size essentially defines the resolution of the material’s microstructure. Therefore, in RFPA, the grid size can be viewed as a model parameter related to the characteristic dimensions of the internal structure of the material. The goal of the model is not to pursue a traditional “mesh-independent solution,” but rather to seek statistically stable and physically reasonable solutions when the grid size can reasonably reflect the true heterogeneity characteristics of the material being studied. Thus, we primarily focus on the similarities in elastic modulus, peak strength, and fracture models in relation to experimental results. From the results, the RFPA numerical simulations align well with the physical experimental findings.
Figure 19 presents a comparison of the final fracture morphologies of composite defect specimens from Ji et al. [24] and this study. From Figure 19, the numerical results for the fracture morphologies of the combined defect samples with 30°, 45°, and 60° inclined cracks closely align with the experimental results. For instance, in specimen P5HF30, both the numerical and experimental results show that the fracture is predominantly characterized by secondary cracks emanating from the prefabricated cracks tips and far field tensile–shear cracks. Additionally, there is a tensile failure region above the hole in the specimen. For specimens P5HF45 and P5HF60, the numerical and experimental results indicate that the fractures are primarily dominated by secondary cracks originating from the prefabricated cracks tips and wing cracks, with no tensile failure regions observed above the holes in these specimens.
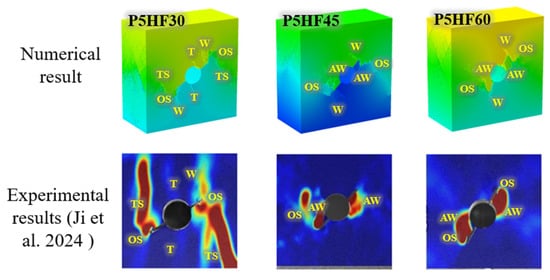
Figure 19.
Comparison of numerical results (this study) and experimental results (from [24]) of fracture morphologies for the combined defect samples with 30°, 45°, and 60° inclined cracks. The different colors in the figure represent distinct displacement values, which are not displayed here as they are unrelated to the fracture morphology.
As previously mentioned, even in a planar model, the crack penetration and the fracture of the specimen remain three-dimensional. Therefore, this study employs a three-dimensional numerical model. Ji et al. [24] confirmed this assertion by conducting CT scans at cross-sections located at 1/4, 1/2, and 3/4 of the specimen’s thickness. Using the visualization advantages of numerical simulations, this study presents the fracture morphologies of composite defect specimens with seven different prefabricated crack inclination angles at six equally spaced cross-sections, specifically at 1/5, 2/5, 3/5, and 4/5 of the specimen’s thickness, as well as the front and back surfaces, illustrated in Figure 20. From Figure 20, it is evident that the fracture morphologies of each specimen differ across the various cross-sections. For instance, at β = 0°, slice 1 shows that the crack has not extended to the boundary, while slices 2–5 indicate crack propagation reaching both left and right boundaries. At β = 15°, slices 2–4 reveal that the prefabricated crack below does not generate any wing cracks, whereas the other three slices exhibit the presence of wing cracks. At β = 30°, slice 2 demonstrates that the OS cracks originating from the prefabricated cracks above and below extend to the boundary, while slices 1 and 6 do not. At β = 45°, slice 2 shows a significant number of cracks, while slices 1 and 5 display relatively fewer cracks. At β = 60°, slices 2–4 illustrate that the secondary cracks have extended to the boundary, while slices 1 and 6 do not. At β = 75°, slice 3 exhibits a considerable number of cracks, while the other slices show relatively fewer cracks. Lastly, at β = 90°, slice 4 reveals a large number of cracks, whereas the other slices remain relatively sparse. Moreover, there are notable differences in the fracture patterns among different slices. These variations suggest that crack propagation is often three-dimensional; thus, determining the fracture pattern solely based on the specimen’s surface is inadequate. Cracks are prone to initiate from the side walls of holes (which can be viewed as tunnels) and may lead to rock collapse. Meanwhile, the internally penetrating cracks revealed by three-dimensional analyses are critical to overall instability. This highlights the need for engineers, when assessing tunnel stability, to go beyond mere surface displacement monitoring and to fully consider the risks associated with the propagation of concealed internal fractures. Consequently, this necessitates the development of more effective support schemes, such as targeted reinforcement of potential internal separations.
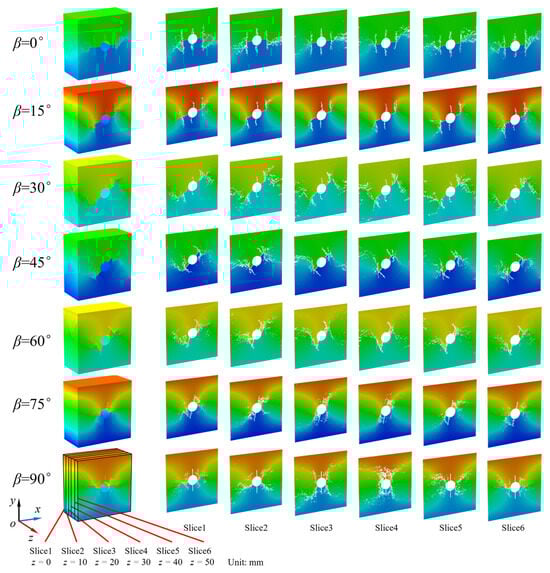
Figure 20.
The fracture morphologies at six equally spaced cross-sections along the thickness direction for combined defect samples with inclined cracks at different angles under 5 MPa lateral pressure. The different colors in the figure represent distinct displacement values, which are not displayed here as they are unrelated to the fracture morphology.
6.2. Comparative Analysis of Fracture Morphologies Between Combined and Single Defects
The composite defect specimens in this study, which incorporate both holes and cracks, have distinct characteristics; specifically, the two types of defects intersect, and the two prefabricated cracks are collinear and of equal length. This configuration corresponds to crack propagation radially from circular voids during hydraulic fracturing, as well as scenarios in underground engineering involving tunnels and mining roadways that contain through-going joint fractures. Obviously, the fracture morphology of the composite defect specimens significantly differs from that of specimens containing a single type of defect. By comparing the fracture patterns and processes of simple defect specimens with those of the composite defect specimens, this study aims to provide a more profound insight into the fracture behavior in composite defect samples.
Section 2.2.2 presents the fracture morphologies of complete samples and samples with a hole under 5 MPa lateral pressure. This section conducts numerical experiments on samples with different defects to compare the fracture morphologies and processes of four distinct specimen types. Figure 21 illustrates the fracture morphologies of four different configurations of specimens under 5 MP lateral pressure, and the prefabricated cracks inclination angles are all 45°. From Figure 21, the intact specimen exhibits a relatively uniform crack distribution, predominantly consisting of tensile–shear cracks. The sample with a hole defect exhibits tensile cracks at both the top and bottom of the hole, as well as shear cracks along the sidewall of the hole. In contrast, the specimen with a prefabricated crack contains a wider variety of crack types, primarily driven by OS cracks and W cracks originating from the prefabricated crack tips. This behavior is somewhat comparable to that observed in the composite defect specimens with symmetrical inclined double cracks along the circular hole edge. However, the composite defect specimens exhibit concentrated defects, leading to wing cracks originating from the crack defect tips that propagate towards the hole. This propagation can easily result in the fracture of the hole, detachment of the hole walls, or even the dislodgment of the hole’s bulk. Scenarios in underground engineering, such as tunnels and roadways containing through-going joint fractures, can be likened to the behavior of composite defect specimens. The fracturing in these specimens often leads to the instability of the holes, necessitating careful monitoring of crack propagation. It is recommended that in engineering practice, the conditions of joint fractures be thoroughly investigated and appropriate reinforcement measures be implemented to mitigate the impact of these fractures on tunnels, roadways, and other structures, thereby enhancing the stability of the surrounding rock mass.
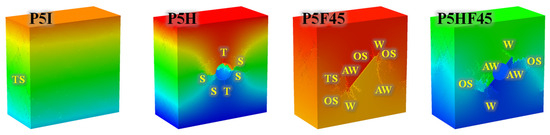
Figure 21.
Fracture morphologies for four different configurations of specimens under 5 MPa lateral pressure. The different colors in the figure represent distinct displacement values, which are not displayed here as they are unrelated to the fracture morphology.
7. Conclusions
This study reveals the effects of symmetrical inclined double cracks at the circular hole edge of rocks with combined defects on their strength and crack formation, as analyzed through fracture mechanics theory. Additionally, RFPA3D numerical methods are employed to elucidate the fracture evolution and crack aggregation patterns of rocks with a hole and symmetrical double cracks at the hole edge. The findings contribute to the optimization of support and reinforcement in underground mining roadways. The conclusions are as follows:
- (1)
- Increasing the crack inclination angle β induces nonlinear increases in both specimen peak stress and strain, while the elastic modulus shows a trend of initially slightly decreasing followed by gradually increasing. When β is 60°, 75°, and 90°, the elastic modulus is nearly consistent. When β is 75° and 90°, the strain at peak stress increases a lot. As the lateral pressure increases, there is a nonlinear trend of increasing peak stress of composite defect samples containing 45° inclined cracks, with relatively minor changes in both the elastic modulus and strain at peak stress.
- (2)
- When β = 0°, 15°, and 30°, the formation of the failure mode is dominated by oblique secondary cracks emanating from crack defect tips and far-field tensile–shear cracks, resulting in a tensile–shear failure pattern. The initial crack is characterized by wing cracks or anti-wing cracks at the crack defect tips, followed by tensile cracks formed below and above the hole. When β = 45° and 60°, the failure mode is similarly dominated by oblique secondary cracks from the crack defect tips, also exhibiting a tensile–shear failure pattern. The initial cracks are also wing cracks or anti-wing cracks at the crack defect tips, followed by oblique secondary cracks that emanate from these tips. When β = 75° and 90°, the final failure mode transitions to shear failure, primarily controlled by shear cracks along the hole walls. The initial cracks are shear cracks at the hole walls.
- (3)
- As the lateral pressure changes, the crack initiation site for the combined defect sample with 45° inclined cracks is consistently at the crack defect tips. Meanwhile, there is a more pronounced tendency of the specimens to expand laterally. Moreover, under high lateral pressures (15 and 20 MPa), wing cracks do not appear. This is because at excessively high lateral pressures, the combined defect samples with a 45° inclination angle exhibit central symmetry, which often leads to a change in the maximum principal stress direction, and cracks propagate parallel to this direction, driving anti-wing cracks toward specimen boundaries.
- (4)
- The three-dimensional numerical simulation realistically represents the overall fracture behavior of the specimens. Engineering practice necessitates rigorous through-crack propagation surveillance adjacent to hole-type defects, particularly under crack orientations deviating significantly from the maximum principal stress direction (>45°). When assessing tunnel stability, it is necessary to go beyond mere surface displacement monitoring and to fully consider the risks associated with the propagation of concealed internal fractures. Consequently, this necessitates the development of more effective support schemes, such as targeted reinforcement of potential internal separations.
Author Contributions
Conceptualization, D.Z. and L.Z.; methodology, J.Z.; formal analysis, X.J. and A.J.; resources, D.Z., J.Z. and S.G.; data curation, L.Z., X.J. and A.J.; writing—original draft preparation, L.Z.; writing—review and editing, F.Z., S.G. and Z.C. All authors have read and agreed to the published version of the manuscript.
Funding
This research was funded by the National Natural Science Foundation of China, grant number 52074116 and 51804113; and the Hunan Provincial Department of Education Science Research Outstanding Youth Project, grant number 23B0476. The financial supports are greatly appreciated.
Data Availability Statement
Data are contained within the article.
Conflicts of Interest
Author Shurong Guo was employed by the company China Railway Guangzhou Group Co., Ltd., Station Building Construction Headquarters. Author Zhiping Chen was employed by the company Guangdong Environmental Research Institute Co., Ltd. Author Futian Zhang was employed by the company China First Highway Engineering Co., Ltd. Ninth Engineering Co., Ltd. The remaining authors declare that the research was conducted in the absence of any commercial or financial relationships that could be construed as a potential conflict of interest.
References
- Ma, Z.Y.; Zuo, J.P.; Zhu, F.; Liu, H.Y.; Xu, C.Y. Non-orthogonal Failure Behavior of Roadway Surrounding Rock Subjected to Deep Complicated Stress. Rock Mech. Rock Eng. 2023, 56, 6261–6283. [Google Scholar] [CrossRef]
- Liu, Q.; Zhao, Y.; Tang, L.; Liao, J.; Wang, X.; Tan, T.; Chang, L.; Luo, S.; Wang, M. Mechanical characteristics of single cracked limestone in compression-shear fracture under hydro-mechanical coupling. Theor. Appl. Fract. Mech. 2022, 119, 103371. [Google Scholar] [CrossRef]
- Zuo, J.; Ma, Z. Asymmetric deformation and failure behavior of roadway subjected to different principal stress based on biaxial tests. Tunn. Undergr. Space Technol. 2025, 155, 106174. [Google Scholar] [CrossRef]
- Aliabadian, Z.; Sharafisafa, M.; Tahmasebinia, F.; Shen, L.M. Experimental and numerical investigations on crack development in 3D printed rock-like specimens with pre-existing flaws. Eng. Fract. Mech. 2021, 241, 107396. [Google Scholar] [CrossRef]
- Zheng, M.H.; Liang, Y.P.; Staat, M.; Li, Q.G.; Li, J.B. Discontinuous fracture behaviors and constitutive model of sandstone specimens containing non-parallel prefabricated fissures under uniaxial compression. Theor. Appl. Fract. Mech. 2024, 131, 104373. [Google Scholar] [CrossRef]
- Cui, J.; Zhang, Y.L.; Jiang, Q.; Lu, P.; Xie, P.; Duan, S.S. Laboratory investigation on the failure characteristics of rock-like materials with fully closed non-persistent joints. Theor. Appl. Fract. Mech. 2022, 122, 103598. [Google Scholar] [CrossRef]
- Dai, B.; Zhao, G.; Zhang, L.; Liu, Y.; Zhang, Z.; Luo, X.; Chen, Y. Energy Dissipation of Rock with Different Parallel Flaw Inclinations under Dynamic and Static Combined Loading. Mathematics 2022, 10, 4082. [Google Scholar] [CrossRef]
- Zhang, Q.; Zhang, X.P.; Yang, S.Q. A numerical study of acoustic emission characteristics of sandstone specimen containing a hole-like flaw under uniaxial compression. Eng. Fract. Mech. 2021, 242, 107430. [Google Scholar] [CrossRef]
- Ma, W.B.; Chen, Y.L.; Yi, W.; Guo, S.C. Investigation on crack evolution behaviors and mechanism on rock-like specimen with two circular-holes under compression. Theor. Appl. Fract. Mech. 2022, 118, 103222. [Google Scholar] [CrossRef]
- Gou, H.; Shi, P.; Wan, Z.; Xiong, L.; Fan, B.; Zhen, Z. Numerical Analysis of Perforated Symmetric Fissures on Mechanical Properties of Hole-Containing Sandstone. Applied Sciences 2023, 13, 8780. [Google Scholar] [CrossRef]
- Luan, H.; Liu, K.; Ge, D.; Han, W.; Zhou, Y.; Wang, L.; Zhang, S. Fracture Behavior and Cracking Mechanism of Rock Materials Containing Fissure-Holes Under Brazilian Splitting Tests. Applied Sciences 2025, 15, 5592. [Google Scholar] [CrossRef]
- Yang, S.Q.; Huang, Y.H.; Tian, W.L.; Zhu, J.B. An experimental investigation on strength, deformation and crack evolution behavior of sandstone containing two oval flaws under uniaxial compression. Eng. Geol. 2017, 217, 35–48. [Google Scholar] [CrossRef]
- Liu, S.; Liu, H.D.; Liu, H.N.; Xia, Z.G.; Zhao, Y.W.; Zhai, J.Y. Numerical simulation of mesomechanical properties of limestone containing dissolved hole and persistent joint. Theor. Appl. Fract. Mech. 2022, 122, 103572. [Google Scholar] [CrossRef]
- Han, W.; Jiang, Y.J.; Luan, H.J.; Du, Y.T.; Zhu, Y.G.; Liu, J.K. Numerical investigation on the shear behavior of rock-like materials containing fissure-holes with FEM-CZM method. Comput. Geotech. 2020, 125, 103670. [Google Scholar] [CrossRef]
- Wang, Y.X.; Zhang, H.; Lin, H.; Zhao, Y.L.; Liu, Y. Fracture behaviour of central-flawed rock plate under uniaxial compression. Theor. Appl. Fract. Mech. 2020, 106, 102503. [Google Scholar] [CrossRef]
- Wong, R.H.C.; Lin, P. Numerical study of stress distribution and crack coalescence mechanisms of a solid containing multiple holes. Int. J. Rock Mech. Min. Sci. 2015, 79, 41–54. [Google Scholar] [CrossRef]
- Tang, C.A. Numerical Simulation of Progressive Rock Failure and Associated Seismicity. Int. J. Rock Mech. Min. Sci. 1997, 34, 249–261. [Google Scholar] [CrossRef]
- Tang, C.A.; Wong, R.H.C.; Chau, K.T.; Lin, P. Modeling of compression-induced splitting failure in heterogeneous brittle porous solids. Eng. Fract. Mech. 2005, 72, 597–615. [Google Scholar] [CrossRef]
- Wang, S.Y.; Sloan, S.W.; Sheng, D.C.; Tang, C.A. Numerical analysis of the failure process around a circular opening in rock. Comput. Geotech. 2012, 39, 8–16. [Google Scholar] [CrossRef]
- Wong, R.H.C.; Lin, P.; Tang, C.A. Experimental and numerical study on splitting failure of brittle solids containing single pore under uniaxial compression. Mech. Mater. 2006, 38, 142–159. [Google Scholar] [CrossRef]
- Zhu, W.C.; Liu, J.; Tang, C.A.; Zhao, X.D.; Brady, B.H. Simulation of progressive fracturing processes around underground excavations under biaxial compression. Tunn. Undergr. Space Technol. 2005, 20, 231–247. [Google Scholar] [CrossRef]
- Tang, L.; Tang, C.a.; Cheng, L.; Duan, W.; Chen, X.; Liu, Q. Fracture process of a simplified laboratory model for a cross-fault tunnel with rigid reinforcement rings: Experimental and numerical insights. Tunn. Undergr. Space Technol. 2025, 157, 106289. [Google Scholar] [CrossRef]
- Lin, P.; Wong, R.H.C.; Tang, C.A. Experimental study of coalescence mechanisms and failure under uniaxial compression of granite containing multiple holes. Int. J. Rock Mech. Min. Sci. 2015, 77, 313–327. [Google Scholar] [CrossRef]
- Ji, P.X.; Viegas, G.; Zhang, Q.B. Mechanical and fracturing characteristics of defected rock-like materials under biaxial compression. Int. J. Rock Mech. Min. Sci. 2024, 176, 105692. [Google Scholar] [CrossRef]
- Tang, C.A.; Tang, S.B.; Gong, B.; Bai, H.M. Discontinuous deformation and displacement analysis: From continuous to discontinuous. Sci. China Technol. Sci. 2015, 58, 1567–1574. [Google Scholar] [CrossRef]
- Tang, C.A.; Webb, A.A.G.; Moore, W.B.; Wang, Y.Y.; Ma, T.H.; Chen, T.T. Breaking Earth’s shell into a global plate network. Nat. Commun. 2020, 11, 3621. [Google Scholar] [CrossRef]
- Ji, P.Q.; Zhang, X.P.; Zhang, Q. A new method to model the non-linear crack closure behavior of rocks under uniaxial compression. Int. J. Rock Mech. Min. Sci. 2018, 112, 171–183. [Google Scholar] [CrossRef]
- Cho, N.; Martin, C.D.; Sego, D.C. A clumped particle model for rock. Int. J. Rock Mech. Min. Sci. 2007, 44, 997–1010. [Google Scholar] [CrossRef]
- Bowie, O.L. Analysis of an infinite plate containing radial cracks originating at the boundary of an internal circular hole. J. Math. Phys. 1956, 35, 60–71. [Google Scholar] [CrossRef]
- Hsu, Y.C. The infinite sheet with cracked cylindrical hole under inclined tension or in-plane shear. Int. J. Fract. 1975, 11, 571–581. [Google Scholar] [CrossRef]
- Huang, Y.H.; Yang, S.Q.; Tian, W.L. Cracking process of a granite specimen that contains multiple pre-existing holes under uniaxial compression. Fatigue Fract. Eng. Mater. Struct. 2019, 42, 1341–1356. [Google Scholar] [CrossRef]


Disclaimer/Publisher’s Note: The statements, opinions and data contained in all publications are solely those of the individual author(s) and contributor(s) and not of MDPI and/or the editor(s). MDPI and/or the editor(s) disclaim responsibility for any injury to people or property resulting from any ideas, methods, instructions or products referred to in the content. |
© 2025 by the authors. Licensee MDPI, Basel, Switzerland. This article is an open access article distributed under the terms and conditions of the Creative Commons Attribution (CC BY) license (https://creativecommons.org/licenses/by/4.0/).