Abstract
This study revisits a recently proposed member of the truncated positive family of distributions, referred to as the positively truncated Student’s-t distribution. The distribution retains the structure of the classical Student’s-t distribution while explicitly incorporating a kurtosis parameter, yielding a flexible three-parameter formulation that governs location, scale, and tail behavior. A closed-form quantile function is derived, allowing a novel reparameterization based on the pth quantile and thereby facilitating integration into quantile regression models. The analytical tractability of the quantile function also enables efficient random number generation via the inverse transform method, which supports a comprehensive simulation study demonstrating the strong performance of the proposed estimators, particularly for the degrees-of-freedom parameter. The entire methodology is implemented in the tpn package for the R software. Finally, two real-data applications involving PM2.5 measurements—one without covariates and another with covariates—highlight the model’s robustness and its ability to capture heavy-tailed behavior.
MSC:
62E10; 62E15; 62E17
1. Introduction
The analysis of environmental phenomena, such as atmospheric pollution, is of critical importance, particularly regarding the concentration of fine particulate matter (PM2.5), which comprises particles with an aerodynamic diameter smaller than 2.5 m. This type of particulate matter poses a significant threat to human health, as it can penetrate deeply into the respiratory tract, reach the pulmonary alveoli, and even enter the bloodstream.
Numerous studies in the scientific literature have examined the adverse effects of PM2.5. For example, Castro et al. [1] investigated the relationship between PM2.5 concentrations and hospitalizations for decompensated heart failure (HF) in hospitals participating in the National Heart Failure Registry across the metropolitan area. Their findings indicate that HF patients, particularly those with a history of diabetes mellitus and/or hypertension, are more vulnerable to PM2.5 exposure.
Similarly, Fernández et al. [2] examined the prevalence of chronic obstructive pulmonary disease (COPD) and its association with PM2.5 exposure. Furthermore, Busch et al. [3] investigated the impact of this pollutant on mortality among older adults, while Matus and Oyarzún [4] assessed its effect on hospitalizations due to respiratory diseases in children. Together, these studies underscore the increasing emphasis on understanding and mitigating the health risks associated with air pollution.
In Latin America, Chile stands out as one of the countries with the highest levels of air pollution. According to Alvarez et al. [5] and the 2024 World Air Quality Report by IQAir, Chile ranks 62nd out of 138 countries in terms of fine particulate matter (PM2.5) pollution. Osorno, along with five other Chilean cities, is among the 15 most polluted in the region. In response to this situation, the Chilean government has implemented various decontamination plans since 2014 aimed at reducing environmental impacts. These measures include firewood-use restrictions, subsidies for cleaner heating systems, and initiatives to improve household thermal efficiency.
Since PM2.5 pollution levels can be highly variable, influenced by factors such as industrial activity, meteorological conditions, and seasonal fluctuations, it is necessary to apply flexible statistical methods to achieve more accurate characterization and inference. In this context, probabilistic models that can accommodate outliers and extreme observations are particularly valuable. Therefore, this paper proposes a modeling framework that captures these features by accounting for the heavy-tailed behavior and substantial dispersion typically observed in PM2.5 data.
The literature also includes several statistical studies that employ quantile regression as an analytical tool. For instance, Yang and Wu [6] developed a neural network model based on quantile regression to predict PM2.5 concentrations. Wu et al. [7] used this approach to analyze the distributional effects of PM2.5’s environmental components on male sperm quality. Similarly, Cao et al. [8] applied quantile regression in a study investigating the relationship between PM2.5 pollution and lung cancer mortality in China. Collectively, these studies underscore the effectiveness of quantile regression in capturing variation across the entire response distribution, thereby providing a deeper and more comprehensive understanding of the underlying phenomena.
Truncated distributions serve as ad hoc models for situations in which the range of a continuous or discrete random variable is restricted to a specific interval, excluding values outside that domain. Such models are particularly useful when data are partially observed or constrained by experimental design or natural censoring [9,10]. The appropriate application of truncated distributions improves parameter estimation and statistical inference in the presence of biased or incomplete data [11,12]. In this work, we focus on models supported on the positive real line. This study introduces a new probabilistic model based on the Truncated Positive Symmetric (TPS) family [13], a class of distributions derived from symmetric density functions centered at zero and truncated to yield distributions supported on the positive real line. Several well-known distributions arise as special cases of the TPS family. When g is the density of the normal distribution, the positive truncated normal (PTN) distribution is obtained. Likewise, if g corresponds to the density of the Laplace, Cauchy, or logistic distributions, the positive truncated Laplace (PTLa), positive truncated Cauchy (PTC), and positive truncated logistic (PTLo) distributions are obtained, respectively. This formulation allows for the construction of a broad class of positive-support distributions by adjusting only two parameters. The main strength of the TPS family lies in its ability to combine a location shift and truncation applied to a symmetric density, producing a flexible structure capable of representing both asymmetry and scale variability in the data.
Inspired by this structure, Gómez et al. [14] developed a computational package for this family, facilitating the generation of distributions suitable for practical applications. It is particularly useful in contexts that require positive support, such as modeling contamination levels, durations, or waiting times. However, a limitation of the original TPS family is its inability to directly control kurtosis, i.e., the heaviness of the distribution’s tails. This limitation is especially relevant in scenarios involving extreme events or outliers, which frequently occur in environmental pollution during critical episodes.
In this work, we propose an extension of the TPS family that uses the Student’s-t distribution as its base function. This symmetric distribution includes a degrees-of-freedom parameter, , which directly controls kurtosis. The resulting model provides simultaneous control over scale, asymmetry (shape), and kurtosis within a closed-form probability density function (pdf), offering a clear advantage over alternative approaches such as the Slash distribution or models with empirically specified tails [15,16,17]. Moreover, these properties facilitate the integration of the model within a quantile regression framework.
Given this context, it is essential to employ a distribution model that accurately captures both the heavy tails and skewness of PM2.5 data to produce reliable forecasts. Existing models applied to similar datasets in Asia generally fit average values well but fail to adequately account for extreme events [18,19,20]. The model proposed in this work aims to enhance understanding of pollution patterns, anticipate critical episodes, and inform the design of effective public policies, particularly those focused on protecting vulnerable populations, including children, the elderly, and individuals with respiratory conditions.
The remainder of this paper is organized as follows. In Section 2, we introduce the proposed distribution, the Truncated Positive Student’s-t (TPT) distribution, and discuss several key properties of the model. Section 3 describes the inference procedures, including a percentile-based estimation method and the derivation of the observed Fisher information matrix. In Section 4, we present a reparameterization of the model in terms of a quantile and detail its software implementation within the tpn package. Section 5 presents a simulation study to evaluate the performance of maximum likelihood (ML) estimators in finite samples. In Section 6, we apply the proposed models to two real-world datasets, both with and without covariates. Finally, Section 7 provides concluding remarks.
2. The TPT Distribution
Truncated distributions are well-studied in the statistical literature due to their relevance for modeling bounded data. Early works by [10,21] and investigated the theoretical properties of truncated models, while [22] provided computational tools for their implementation, including routines in R via the LaplacesDemon package. These contributions established both the general form of truncated probability models and their key analytical properties.
Building on this framework, we define the TPT distribution as the positive truncation of the standard Student’s-t distribution. To ensure consistency with the truncated positive normal (TPN) model within the TPS family, we adopt the parametrization in terms of , , and , where represents a scale parameter, a location parameter, and the degrees-of-freedom parameter controlling tail heaviness.
Definition 1.
To be more specific, let Y be a continuous random variable. We say that Y follows a Truncated Positive Student’s-t distribution, denoted by , if its probability density function (pdf) is given by
The cumulative distribution function (cdf) is given by
and the hazard function is given by
Here, and denote the pdf and cdf of the Student’s-t distribution with ν degrees of freedom, respectively.
Remark 1.
Using the CDF of the Student’s-t distribution, it is possible to obtain an expression equivalent to Equation (1), valid for , given by
where denotes the hypergeometric function.
Figure 1 presents the pdf, cdf, and hazard function for the TPT model, considering various values of . The TPT model can exhibit heavier tails in the pdf compared to the TPN model, while the hazard function may assume more bell-shaped forms. Furthermore, we observe that, for specific values of , the pdf increases more gradually at specific points. This behavior arises because the TPT model, due to its heavy tails, converges more slowly to its limiting values, although all functions eventually tend toward one as z increases.
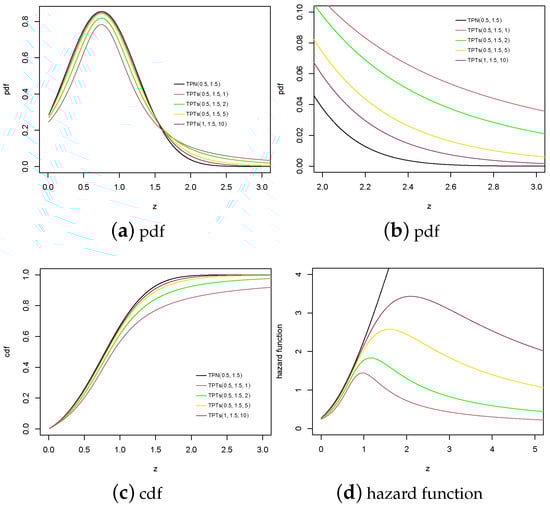
Figure 1.
Pdf, cdf and hazard function for the model with different combinations for .
Observation 1.
The following distributions are special cases of the TPT distribution.
- TPTTPN.
- TPTHT, the half-Student’s-t distribution [23].
- TPTHN, the half-normal distribution [24].
Figure 2 summarizes the relationships among the TPT and its particular cases. Note that the TPT model includes some known models in the literature, such as the TPN, TPC, HT, and HN distribution.
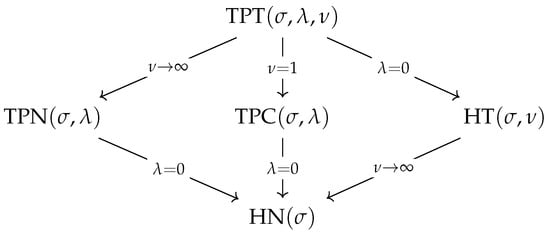
Figure 2.
Particular cases of TPT distribution.
2.1. Quantile Function
Truncated distributions admit quantile functions that can be directly derived from the cdf of the baseline distribution. In the case of the TPT distribution, the quantile function follows immediately from the general definition of a quantile for truncated models (see, e.g., [10]). It is presented here for completeness and consistency with the formulation of the model.
Definition 2.
Let . Then, the quantile function of Y is given by
where denotes the quantile function of the Student’s-t distribution with ν degrees of freedom.
Remark 2.
From the quantile function, the main quartiles of the TPT distribution can be written as
- 1.
- First quartile:
- 2.
- Median:
- 3.
- Third quartile:
These expressions follow directly from the definition of the quantile function.
2.2. Moments
The moments of the TPT distribution have been previously derived by [25], who provided closed-form expressions for general truncation limits and location parameter . In this subsection, we restate the corresponding results for the specific case of the Truncated Positive Student’s-t (TPT) distribution by setting , , and .
Definition 3.
Let . The k-th non-central moment of Y is given by
where and denotes that the expectation is taken in relation to . The moment exists only if . On the other hand, the non-central moments of can be computed as
For instance, the two first non-central moments are reduced to
- 1.
- 2.
where .
2.3. Skewness and Kurtosis Coefficients
The TPT model exhibits heavier tails than other models. However, the traditional kurtosis coefficient (defined in terms of moments) for the TPT model exists only for . Therefore, in the range where the model acts better (where it produces the heaviest tails, i.e., ), the comparison is not possible. Due to this feature, studying the behavior of the kurtosis (and skewness) coefficient requires an alternative approach, such as those proposed below. A classical measure of skewness was introduced by MacGillivray [26], and is given by
In particular, the MacGuillevray skewness measurement can efficiently describe the effect of the parameter on asymmetry. Figure 3 presents the asymmetry coefficient for different values of and .
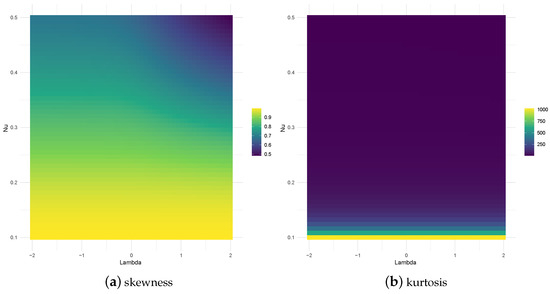
Figure 3.
Heat plots of the MacGillivray skewness coefficient and the Moors kurtosis coefficient for model y .
The kurtosis of the TPT distribution can also be studied using the Moors kurtosis coefficient [27] given by
It can be seen in [27] that for large values of (6), the distribution has heavy tails, while for small values, the model exhibits lighter tails. Figure 3 illustrates the behavior of the Moors kurtosis coefficient for the TPT distribution.
Table 1 shows the values produced by our model for the Moor kurtosis and skewness coefficients by MacGuillevray. Note that the skewness and kurtosis coefficients of the TPT model are increased when is small.

Table 1.
MacGuillevray skewness and the Moors kurtosis coefficients for different values of .
2.4. Rényi Entropy
Rényi entropy is a measure of the uncertainty associated with a random variable. This measure is fundamental in several fields, including ecology and statistics, where it serves as an index of diversity. Rényi entropy is defined as follows.
Proposition 1.
Let . The Rényi entropy of order α for Y is given by
where and denotes the incomplete beta function.
2.5. TPT Heavy-Tailed Distribution
The newly generated distribution is based on the Student’s-t distribution, which is heavy-tailed. We know that any probability distribution, specified by its cdf F(t), is a heavy right-tailed distribution (see Rolski et al. [28]) if
The following result demonstrates that the TPT distribution is heavy-tailed and right-skewed.
Proposition 2.
The cdf of the random variable is a heavy right-tailed distribution.
Proof.
Because the initial limit is of the indeterminate form , applying L’Hopital’s Rule to the upper limit and substituting Equation (9), we have that
Again, applying L’Hopital’s rule, we obtain
□
3. Parameter Estimation
In this section, we present two methods for estimating the parameters of the TPT model. The first method is percentile-based, and the second is the maximum likelihood (ML) approach.
3.1. A Method Based on Percentiles
The motivation for this estimator is that it yields a model whose percentiles p align with the observed data, as represented by the empirical distribution. According to Klugman et al. [29], we introduce the following definitions.
Definition 4.
A percentile-matching estimate of is any solution of the p equations
where arbitrarily chosen percentiles. From the definition of percentile, the equations can also be written as:
Definition 5.
The smoothed empirical estimate of a percentile is calculated as
where and . Here, [·] indicates the greatest integer function and are the order statistics from the sample.
For our particular problem, we choose the 25th, 50th, and 75th percentiles. The smoothed empirical estimates are obtained using the following system of equations
These equations must be solved by using mathematical software, such as the function nleqslv available in R 4.5.2 software [30].
3.2. ML Estimation
Given a random sample of size n from , the log-likelihood function is given by
Therefore, the score function assumes the form , where
where , , , and . The ML estimator of , denoted by , can be obtained by solving the likelihood equations , where is a vector of length 3 containing zeros. Numerical methods, such as the Newton-Raphson procedure, can be employed to solve these equations. Alternatively, other optimization techniques, including the method proposed by MacDonald [31], may also be applied.
3.3. Observed Fisher Information Matrix
The asymptotic variance of , can be estimated by the Fisher information matrix defined as , where is the log-likelihood function of the TPTs model given in (12). Under the regularity conditions [32].
where denotes convergence in distribution and denotes the standard trivariate normal distribution. The elements of the matrix are given by , , and so on. Explicitly, we have
where and and denote the digamma and trigamma functions, respectively.
In practice, it is not possible to obtain a closed-form expression for the expected value of the previous terms. However, the covariance matrix of the MLEs, , can be consistently estimated by , where denotes the observed information matrix, which is computed as follows.
The asymptotic variances of , , and are estimated by the diagonal elements of , and their standard errors by the square root of the asymptotic variances.
4. TPT Model in a Quantile Regression Framework
Now, we introduce the TPT distribution for a quantile regression scheme. In this approach, the regression model is proposed to describe the conditional quantile of the response variable. Given the simple form of the quantile function for the TPT distribution, the model can be reparameterized in terms of its p-th quantile, denoted .
Let . Then, the PDF for the reparameterized TPT (henceforth, RTPT) model is given by
where , , and .
The cdf of the RTPT model is given by
4.1. The Heterogeneous Case
Let the quantile of interest. Assume that, for each observation, the p-th quantile of the distribution can be explained by a set of k covariates, say , . We assume that . For , the median regression is obtained as a particular case. The quantile of the distribution is linked with the covariates as
where is a k-dimensional vector of unknown regression parameters () and is a link function, which is continuous, invertible and at least twice differentiable. We consider the specific case , which is the most common function used to link a linear predictor for positive parameters.
4.2. Estimation
In the quantile regression model context for the RTPT distribution, the log-likelihood function for is given by
The ML estimators of can be obtained maximizing with respect to . Under mild regularity conditions and when the sample size n is large, the asymptotic distribution of the ML estimator is approximately multivariate normal (of dimension ) and variance covariance matrix where
is the expected Fisher information matrix. Note that there is no closed-form expression for the matrix . Nevertheless, as shown in [33], the estimated observed Fisher information matrix given by
is a consistent estimator of the expected Fisher information matrix . Therefore, for large k, we can replace by .
4.3. Computational Implementation
The simulation studies and practical applications were carried out using functions implemented in the R software, specifically in the tpn [14] package. This package provides tools for parameter estimation and regression under the TPT model, facilitating both empirical analysis and model-based inference.
To estimate with the tpn package, install the package in R.
- 1
- Install and load the necessary packages:
1 install.packages("tpn") 2 library(tpn) - 2
- Load your data into R, specifying y as the response variable, x as the matrix of covariates (may not be specified, indicating the case without covariates), and use the est.tpt function to obtain the ML estimator for the TPT model, along with their standard errors, in addition to the AIC and BIC criteria.
1 est.tpt(y, x, q=0.5) In this notation, q is the modelled quantile.
5. Simulation
In this section, we conduct a simulation study to assess the performance of the maximum likelihood (ML) estimators for the TPT model. Estimates are obtained using the function est.tpt described in Section 4.3. Additionally, Algorithm 1 outlines a procedure for generating random values from the TPT model, based on the inverse transform method.
| Algorithm 1 Simulating values from the distribution |
|
The package tpn also includes the function rtpt to draw values from the TPT model with specified parameters.
In the simulation study, we consider the parameter values , , and . Sample sizes of are used. For each combination of , , , and n, 1000 replicates are generated, and the corresponding ML estimates and standard errors are computed using the est.tpt function. Table 2 summarizes the results, reporting the estimated bias (Bias), the mean standard error (SE), the root mean squared error (RMSE), and the empirical coverage probability (CP) for the 95% asymptotic confidence intervals.
Table 2.
Bias, SE, RMSE and 95% CP for the ML estimators in the TPT distribution.
As the sample size increases, the bias, SE, and RMSE decrease, indicating that the ML estimators exhibit desirable properties even in finite samples. Furthermore, the SE and RMSE converge as n grows, suggesting that the standard errors are accurately estimated. With respect to the coverage probabilities (CPs), they remain close to the nominal level of 0.95, supporting the appropriateness of the normal approximation for inference on the ML estimators.
Observation 2.
The literature on estimating the degrees of freedom parameter () of the Student’s t distribution highlights the substantial challenges associated with this task. In contrast, in our model, the maximum likelihood (ML) estimation of exhibits relatively stable behavior. Nevertheless, potential difficulties in analyzing this parameter remain, as discussed by Lange et al. [34], and have also been noted in other studies, such as Gómez et al. [35], which examines the estimation of from order statistics.
6. Application
In this section, we analyze a cross-sectional dataset obtained from the National Air Quality Information System (SINCA) of the Chilean Ministry of the Environment, which is publicly available at https://sinca.mma.gob.cl/index.php (accessed on 22 September 2025). The dataset consists of validated measurements from 39 monitoring stations across Chile on 20 June 2025, including concentrations of PM2.5 () and SO2 (). Unlike previous studies based on time series data, which are often affected by strong autocorrelation, this station-based snapshot mitigates temporal dependence issues. This design enables analysis of the joint distribution of pollutants at a specific point in time. Table 3 summarizes the descriptive statistics for SO2, revealing its heavy-tailed nature and the presence of extreme values.
Table 3.
Summary statistics for SO2 concentrations () across 39 monitoring stations in Chile on 20 June 2025.
The main objective of this analysis is to fit the truncated positive t (TPT) model to explain PM2.5 levels in terms of SO2 concentrations, focusing on the upper quantiles of the conditional distribution. This approach is motivated by the importance of upper-tail behavior for environmental policy, as extreme pollutant concentrations are directly associated with critical air-quality episodes. Previous studies (e.g., Nakamura et al. [36]) have shown that geographical and meteorological conditions in southern Chile, such as thermal inversions during the autumn and winter months, exacerbate pollutant accumulation and trigger such critical episodes. Consequently, employing heavy-tailed regression models, such as the RTPT, provides valuable insights to support policy decisions aimed at mitigating severe air pollution.
6.1. Univariate Analysis
In this first step, we analyze the distributional behavior of the SO2 variable obtained from 39 monitoring stations in Chile on 20 June 2025, the first day of the winter season. Each observation corresponds to a valid pair of PM2.5 and SO2 values from the same station; however, this section focuses exclusively on SO2. Table 3 summarizes the main descriptive statistics. The results reveal pronounced skewness and exceptionally high kurtosis, suggesting that the distribution of SO2 exhibits heavy tails and contains extreme observations.
Figure 4 presents the boxplot and violin plot for the SO2 data. The plots clearly illustrate the influence of extreme values on the overall distribution. Given its heavy-tailed nature, we fitted several three-parameter models to better capture its underlying distributional characteristics. Specifically, we considered the truncated positive Normal (TPN), the truncated positive t (TPT), and the Generalized Gamma (GG) distributions. According to the Akaike Information Criterion (AIC) [37], the TPT distribution provides the best fit among the candidates, achieving a lower AIC value than both the baseline TPN and the flexible GG model. This result confirms that incorporating the additional shape parameter in the TPT distribution enhances its ability to model heavy tails while preserving the truncated structure. The corresponding parameter estimates are reported in Table 4.
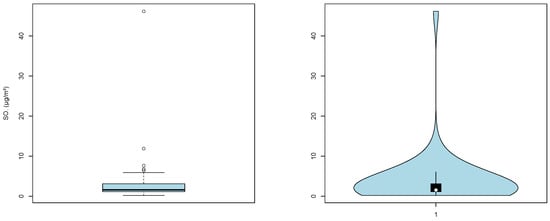
Figure 4.
Boxplot of SO2 concentrations (left panel) and violin plot of SO2 concentrations (right panel).
Table 4.
Estimated parameters (with standard errors in parentheses) for the fitted models of SO2.
In summary, the results indicate that the TPT distribution provides the best overall fit among the models considered. Relative to the TPN distribution, the inclusion of the additional shape parameter in the TPT model enables more flexible modeling of the heavy-tailed behavior observed in the SO2 data. Likewise, compared with the GG distribution, the TPT achieves an effective trade-off between goodness of fit and parsimony, reinforcing its suitability within the family of truncated positive models. Figure 5 displays the Q–Q plots for the three candidate models, confirming that the TPT distribution aligns most closely with the empirical quantiles and provides a robust characterization of the observed SO2 concentrations.
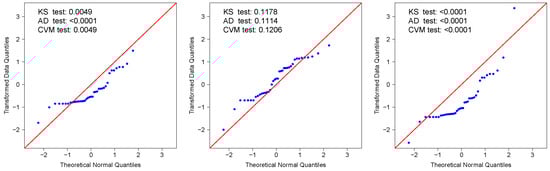
Figure 5.
QQ-plots of SO2 concentrations for three fitted models: TPN (left panel), TPT (center panel), and GG (right panel).
6.2. Quantile Regression
In the second step, we examine the conditional distribution of PM2.5 as a function of SO2 concentrations using a quantile regression approach based on the truncated positive t model (RTPT). The analysis focuses on the 80th percentile (), which holds particular relevance for environmental policy. According to Chilean regulations (D.S. N° 12/2011 of the Ministry of the Environment), the 80th percentile of PM2.5 serves as a reference threshold for identifying critical pollution episodes. Therefore, this choice allows for a precise evaluation of how SO2 concentrations influence PM2.5 levels in the upper tail of the distribution, corresponding to high-risk scenarios for public health.
The estimated conditional quantile model is given by
where denotes the scale parameter at quantile p, while and are additional shape parameters of the TPT distribution. Parameter estimates and their standard errors are reported in Table 5.
Table 5.
Parameter estimates (with standard errors in parentheses) and confidence interval (CI) for the RTPT quantile regression model at .
The positive coefficient of indicates that higher SO2 levels are associated with increased PM2.5 concentrations at the 80th percentile. In practical terms, this implies that as air quality conditions approach critical pollution episodes, SO2 contributes to explaining the rise in PM2.5 levels within the upper tail of the distribution. Although the estimated coefficient is relatively small (0.039), its effect becomes more pronounced at elevated SO2 concentrations, underscoring the importance of controlling sulfur dioxide emissions to mitigate severe fine particulate matter pollution episodes.
The shape parameters and offer additional insight into the data’s distributional features: they indicate moderately heavy tails, consistent with the presence of extreme values observed in the SO2 sample. This finding further supports the suitability of the RTPT model over traditional regression approaches that assume light-tailed residuals.
The adequacy of the RTPT model was assessed using a set of diagnostic tools. Figure 6 presents the Q–Q plot, likelihood displacement, and generalized Cook’s distance. Panel (a) indicates that the residuals closely follow the theoretical quantiles of the standard normal distribution and remain within the confidence bands, suggesting that the RTPT specification adequately captures the conditional distribution of PM2.5 given SO2. Panels (b) and (c) identify potentially influential observations, with station #32 emerging as the most influential according to Cook’s distance. Overall, these diagnostic results confirm that the RTPT model provides a robust fit, even in the presence of extreme observations. Finally, Figure 7 presents the estimated 80th quantile of PM2.5 as a function of SO2 concentrations for the city of Osorno. In the Chilean context, this estimate can be interpreted as the threshold used to declare an environmental alert in the city.
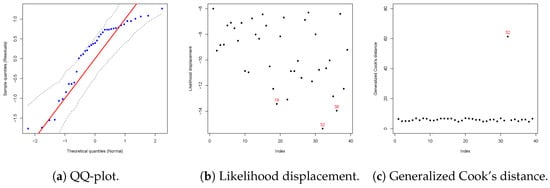
Figure 6.
Diagnostic plots for the RTPT regression model at the 80th percentile (). Panel (a) shows the quantile residuals, indicating that the model adequately captures the distributional characteristics. Panel (b) presents the likelihood displacement, identifying potentially influential observations, with some stations exerting greater influence on the model fit. Panel (c) displays generalized Cook’s distance, highlighting the most influential points, with observation #32 being the most prominent.
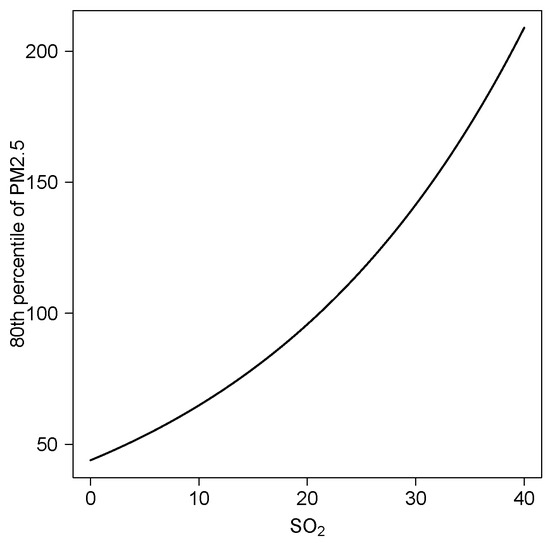
Figure 7.
Estimation of the 80th quantile for PM2.5 in Osorno in terms of SO2.
In summary, the quantile regression results indicate that the impact of SO2 becomes more pronounced under high-pollution scenarios, emphasizing the importance of jointly monitoring both pollutants. By focusing on the 80th percentile, the model provides insights into the factors driving the most severe episodes, precisely where public policy interventions can achieve the greatest effect.
7. Conclusions
This paper introduces the positively truncated Student’s-t distribution, a flexible model derived from the class of truncated distributions. It features separate parameters for scale, shape, and tail heaviness, allowing effective modeling of asymmetric and heavy-tailed data. Closed-form expressions for key analytical properties including the cumulative distribution, hazard function, quantiles, entropy, and moments are derived, which enables efficient random number generation via the inverse transform method. A quantile-based reparameterization is proposed to facilitate applications in quantile regression. Empirical analyses, both with and without covariates, demonstrate that the proposed distribution provides a superior fit and greater robustness than existing alternatives, particularly for high-kurtosis data. Future research could explore incorporating random effects and applying the model within a cure rate framework.
Author Contributions
Conceptualization, H.J.G., K.I.S. and D.I.G.; Methodology, H.J.G., K.I.S. and D.I.G.; Software, D.I.G. and T.M.M.; Formal analysis, K.I.S., D.I.G. and T.M.M.; Investigation, H.J.G., K.I.S. and P.E.L.; Writing—original draft, H.J.G., K.I.S., D.I.G., P.E.L. and T.M.M.; Writing—review & editing, H.J.G., K.I.S., D.I.G., P.E.L. and T.M.M.; Funding acquisition, H.J.G. and P.E.L. All authors have read and agreed to the published version of the manuscript.
Funding
This research was partially supported by the MINEDUC-UA project (code ANT 22991), during a research stay of K.I.S. at the Universidad Católica de Temuco.
Data Availability Statement
The data presented in this study are openly available in Sistema de Información Nacional de Calidad del Aire at https://sinca.mma.gob.cl/index.php (accessed on 22 September 2025).
Conflicts of Interest
The authors declare no conflicts of interest.
References
- Castro, P.; Vera, J.; Cifuentes, L.; Wellenius, G.; Verdejo, H.; Sepúlveda, L.; Vukasovic, J.; Llevaneras, S. Polución por material particulado fino (PM 2.5) incrementa las hospitalizaciones por insuficiencia cardíaca. Rev. Chil. Cardiol. 2010, 29, 3. [Google Scholar] [CrossRef]
- Fernández, R.; Peña, R.; Bravo-Alvarado, J.; Maisey, K.R.; Reyes, E.P.; Ruiz-Plaza De Los Reyes, D.; Márquez-Reyes, R. Prevalence Distribution of Chronic Obstructive Pulmonary Disease (COPD) in the City of Osorno (Chile) in 2018, and Its Association with Fine Particulate Matter PM2.5 Air Pollution. Atmosphere 2024, 15, 482. [Google Scholar] [CrossRef]
- Busch, P.; Rocha, P.; Jin Lee, K.; Cifuentes, L.A.; Hui Tai, X. Short-term exposure to fine particulate pollution and elderly mortality in Chile. Commun. Earth Environ. 2024, 5, 469. [Google Scholar] [CrossRef]
- Matus, P.; Oyarzún, M. Impacto del material particulado aéreo (MP2,5) sobre las hospitalizaciones por enfermedades respiratorias en niños: Estudio de caso-control alterno. Rev. Chil. Pediatr. 2019, 90, 166–174. [Google Scholar] [CrossRef] [PubMed]
- Álvarez Escobar, B.; Castillo Farina, P.; Navarro-Riffo, J.; Muñoz Muñoz, C.; Boso Gaspar, A. Comportamientos de autoprotección frente a la contaminación del aire y factores psicosociales, Temuco, Chile. Rev. Int. Contam. Ambient 2022, 38, 11–26. [Google Scholar] [CrossRef]
- Yang, S.; Wu, H. A novel PM2.5 concentration probability density prediction model combines the least absolute shrinkage and selection operator with quantile regression. Nature 2022, 29, 78265–78291. [Google Scholar] [CrossRef]
- Wu, H.S.; Yu, X.L.; Wang, Q.L.; Zeng, Q.H.; Chen, Y.L.; Lv, J.Y.; Wu, Y.; Zhou, H.W.; Zhang, H.F.; Liu, M.; et al. Beyond the mean: Quantile regression to differentiate the distributional effects of ambient PM2.5 constituents on sperm quality among men. Chemosphere 2021, 285, 131496. [Google Scholar] [CrossRef]
- Cao, Q.L.; Rui, G.Q.; Liang, Y. Study on PM2.5 pollution and the mortality due to lung cancer in China based on a geographic weighted regression model. BMC Public Health 2018, 18, 925. [Google Scholar] [CrossRef]
- Cohen, C. Truncated and Censored Samples: Theory and Applications, 1st ed.; CRC Press: Boca Raton, FL, USA, 1991. [Google Scholar]
- Johnson, N.; Kotz, S.; Balakrishnan, N. Continuous Univariate Distribution; Wiley: New York, NY, USA, 1994; Volume 1. [Google Scholar]
- Tallis, G.M. The Moment Generating Function of the Truncated Multi-Normal Distribution. J. R. Stat. Soc. Ser.-B-Methodol. 1961, 23, 223–229. [Google Scholar] [CrossRef]
- Gómez, H.J.; Santoro, K.I.; Ayma, D.; Cortés, I.E.; Gallardo, D.I.; Magalhães, T.M. A New Generalization of the Truncated Gumbel Distribution with Quantile Regression and Applications. Mathematics 2024, 12, 1762. [Google Scholar] [CrossRef]
- Gómez, H.J.; Santoro, K.I.; Barranco-Chamorro, I.; Venegas, O.; Gallardo, D.I.; Gómez, H.W. A Family of Truncated Positive Distributions. Mathematics 2023, 11, 4431. [Google Scholar] [CrossRef]
- Gallardo, D.I.; Gómez, H.J.; Gómez, Y.M. tpn: Truncated Positive Normal Model and Extensions. R Package Version 1.12. Available online: https://CRAN.R-project.org/package=tpn (accessed on 22 September 2025).
- Olmos, N.M.; Osvaldo, V.; Gómez, Y.M.; Iriarte, Y.A. Confluent hypergeometric slashed-Rayleigh distribution: Properties, estimation and applications. J. Comput. Appl. Math. 2020, 328, 112548. [Google Scholar] [CrossRef]
- Reyes, J.; Iriarte, Y.A. A New Family of Modified Slash Distributions with Applications. Mathematics 2023, 11, 3018. [Google Scholar] [CrossRef]
- Gomez, Y.M.; Mateluna, D.I.G.; Castro, M.D. A regression model for positive data based on the slashed half-normal distribution. Revstat Stat. J. 2021, 19, 553–573. [Google Scholar]
- Nourmohammad, E.; Rashidi, Y. Ground data analysis for PM2.5 Prediction using predictive modeling techniques. J. Air Pollut. Health 2025, 10, 61–82. [Google Scholar] [CrossRef]
- Wei, Q.; Chen, Y.; Zhang, H.; Jia, Z.; Yang, J.; Niu, B.; Xu, Z. PM2.5 concentration prediction using a whale optimization algorithm-based hybrid deep learning model in Beijing, China. Environ. Res. 2025, 371. [Google Scholar] [CrossRef]
- Wei, Q.; Chen, Y.; Zhang, H.; Jia, Z.; Yang, J.; Niu, B. Simulation and prediction of PM2.5 concentrations and analysis of driving factors using interpretable tree-based models in Shanghai, China. Environ. Res. 2025, 270. [Google Scholar] [CrossRef]
- DePriest, D.J. Using the singly truncated normal distribution to analyze satellite data. Commun. Stat.-Theo. Methods 1983, 12, 263–272. [Google Scholar] [CrossRef]
- Nadarajah, S.; Kotz, S. R Programs for Computing Truncated Distributions. J. Stat. Softw. 2006, 16, 1–8. [Google Scholar] [CrossRef]
- Psarakis, S.; Panaretoes, J. The folded t distribution. Commun. Stat.-Theory Methods 2007, 19, 2717–2734. [Google Scholar] [CrossRef]
- Leone, F.C.; Nelson, L.S.; Nottingham, R.B. The folded normal distribution. Technometrics 1961, 3, 543–550. [Google Scholar] [CrossRef]
- Kim, H.J. Moments of truncated Student-t distribution. J. Korean Stat. Soc. 2008, 37, 81–87. [Google Scholar] [CrossRef]
- MacGillivray, H.L.; Balanda, K.P. The Relationships Between Skewness and Kurtosis. Aust. J. Stat. 1988, 30, 319–337. [Google Scholar] [CrossRef]
- Moors, J.J. A quantile alternative for kurtosis. J. R. Stat. Soc. Ser. 1988, 37, 25–32. [Google Scholar] [CrossRef]
- Rolski, T.; Schmidli, H.; Schmidt, V.; Teugel, J. Stochastic Processes for Insurance and Finance; John Wiley & Sons: Hoboken, NJ, USA, 1999. [Google Scholar]
- Klugman, S.A.; Panjer, H.H.; Willmot, G.E. Loss Models: From Data to Decisions, 4th ed.; Wiley: New York, NY, USA, 1998. [Google Scholar]
- R Core Team. R: A Language and Environment for Statistical Computing; R Foundation for Statistical Computing: Vienna, Austria, 2021; Available online: https://www.R-project.org/ (accessed on 22 September 2025).
- MacDonald, I.L. Does Newton-Raphson really fail? Stat. Methods Med. Res. 2014, 23, 308–311. [Google Scholar] [CrossRef]
- Pranab, K.S.; Singer, J.M.; de Lima, A.C.P. From Finite Sample to Asymptotic Methods in Statistics; Cambridge University Press: Cambridge, UK, 2010. [Google Scholar]
- Lindsay, B.G.; Li, B. On second-order optimality of the observed Fisher information. Ann. Stat. 1997, 25, 2172–2199. [Google Scholar] [CrossRef]
- Lange, K.L.; Little, R.J.; Taylor, J. Robust Statistical Modeling Using the t Distribution. J. Am. Stat. Assoc. 1989, 83, 291–309. [Google Scholar] [CrossRef]
- Gómez, H.W.; Torres, F.J.; Bolfarine, H. Large-Sample Inference for the Epsilon-Skew-t Distribution. Commun. Stat. Methods. 2007, 36, 73–81. [Google Scholar] [CrossRef]
- Nakamura, A.; Nakatani, N.; Maruyama, F.; Noda, J. Characteristics of PM2.5 pollution in Osorno, Chile: Ion chromatography and meteorological data analyses. Atmosphere 2022, 13, 168. [Google Scholar] [CrossRef]
- Akaike, H. Information theory and an extension of the maximum likelihood principle. In 2nd International Symposium on Information Theory; Petrov, B.N., Csáki, F., Eds.; Akadémiai Kiadó: Budapest, Hungary, 1973; pp. 267–281. [Google Scholar]


Disclaimer/Publisher’s Note: The statements, opinions and data contained in all publications are solely those of the individual author(s) and contributor(s) and not of MDPI and/or the editor(s). MDPI and/or the editor(s) disclaim responsibility for any injury to people or property resulting from any ideas, methods, instructions or products referred to in the content. |
© 2025 by the authors. Licensee MDPI, Basel, Switzerland. This article is an open access article distributed under the terms and conditions of the Creative Commons Attribution (CC BY) license (https://creativecommons.org/licenses/by/4.0/).