Abstract
In order to study how the production network, energy network, and carbon trading network interact with each other in the process of distributed energy sharing in industrial parks under the carbon emissions trading mechanism, this paper constructs a supernetwork model of distributed energy sharing in industrial parks by using variational inequality, analyzes the behavioral patterns of each participant in the pursuit of their own interests and their impact on the equilibrium state of the network, and obtains the conditions for the network to reach an equilibrium state. Then, the projection correction algorithm is applied to solve the model in equilibrium, and the optimal decisions of product trading volume, distributed energy low carbon level, and carbon trading are obtained. Finally, through numerical examples, the influence of the carbon cap and carbon trading price on the network equilibrium decision is analyzed. The results show that the government’s elevation of the carbon emission cap for enterprises will reduce the enthusiasm for distributed energy sharing in industrial parks and expand the polarization of enterprise profits. A higher carbon trading price will increase the carbon trading cost of enterprises, which has a negative impact on distributed energy sharing in industrial parks.
Keywords:
industrial parks; distributed energy sharing; carbon emissions trading mechanism; network equilibrium MSC:
91B74; 90B10
1. Introduction
With carbon neutrality gradually becoming a global consensus, governments and all sectors of society are actively taking actions to mitigate the impacts of climate change and promote the green transformation of the economy and society. The industrial park is an important carrier of regional economic development, and its energy consumption pattern and carbon emission level play a key role in realizing the goal of regional carbon neutrality [1]. There are many enterprises in industrial parks with a large energy demand, and the traditional centralized energy supply method often struggles to meet the diversified and low-carbon energy demand of enterprises [2]. In recent years, significant technological breakthroughs have been achieved in new energy equipment such as photovoltaic and wind power generation. Enterprises are gradually adopting distributed energy instead of traditional energy to reduce carbon emissions. However, distributed energy equipment is subject to the enterprise’s own energy consumption requirements and natural conditions, there is still a certain amount of time idling in the energy supply as well as energy redundancy, and there is still room to improve the utilization efficiency of the energy system [3]. Distributed energy sharing, as an innovative energy utilization mode, can integrate and optimize the local distributed energy resources of industrial parks through technical means such as microgrids, achieve efficient energy utilization, and reduce corporate carbon emissions [4].
At the same time, carbon neutrality is gradually becoming a shared global goal, with governments around the world formulating corresponding low-carbon policies, including carbon subsidies, carbon trading, and carbon taxes [5]. Among these, market-based carbon trading systems are widely regarded as an effective method for controlling carbon emissions [6]. The core of this mechanism lies in treating carbon emission rights as a scarce resource, allowing enterprises to buy, sell, and trade in the carbon market, and through economic incentives, encouraging enterprises to reduce carbon emissions and promote green and low-carbon development [7]. Under the joint action of a carbon emissions trading mechanism and distributed energy sharing model, the industrial park network composed of core enterprises and supporting enterprises expands from a single production network to a supernetwork structure containing a production network, energy network, and carbon trading network. The interdependence and interaction between multiple networks have transformed the production decisions of enterprises from single-objective decisions to complex decisions with multi-objective attributes. In this case, the challenge of realizing the equilibrium of production flow, energy flow, and carbon trading flow is a realistic problem that enterprises need to solve. Accordingly, this paper establishes a distributed energy sharing supernetwork model for industrial parks under the carbon emissions trading mechanism, solves the network equilibrium decision of enterprises, and systematically analyzes the influence of the carbon limit and carbon trading price on the equilibrium strategy of the distributed energy sharing network of industrial parks. Although existing research has made significant progress in the balancing of supply chain networks and carbon trading mechanisms, most of them have focused on single networks or two-tier structures, such as production carbon trading and energy trading. There is no study that systematically integrates the triple supernetwork structure of production networks, energy networks, and carbon trading networks, especially in the context of distributed energy sharing in industrial parks. To fill that gap, this paper constructs a supernetwork model for distributed energy sharing in industrial parks under the carbon trading mechanism, solves the optimal product trading volume, low-carbon energy level, and carbon trading decisions in the network equilibrium state, and systematically analyzes the impact of a carbon cap and carbon trading prices on the low-carbon energy level and system profits. Specifically, this article aims to answer the following questions:
- (1)
- What are the conditions for reaching network equilibrium for distributed energy sharing in industrial parks under a carbon emissions trading mechanism?
- (2)
- Under network equilibrium conditions, what is the most ideal level of low-carbon energy, product trading volume, and trading prices for park enterprises?
- (3)
- What is the impact of a carbon emission cap allocated to enterprises by the government on the network equilibrium decisions of distributed energy sharing in industrial parks?
- (4)
- How does the carbon trading price in the carbon trading market affect the network equilibrium decisions of distributed energy sharing in industrial parks?
The main contributions of this paper are reflected in the following aspects. Firstly, we expanded the traditional supply chain network into a supernetwork structure with triple coupling of production, energy, and carbon trading, and introduced heterogeneous enterprise roles including core enterprises and supporting enterprises to construct a distributed energy sharing network equilibrium model for industrial parks, thereby more truly reflecting the decision-making interaction among enterprises in industrial parks under the carbon trading mechanism. Secondly, by applying the variational inequality theory, we not only depicted the interaction relationships among enterprises in a multi-layer network but also clearly revealed the intrinsic mechanism of interaction between key policy variables such as carbon quotas and carbon trading prices and micro-level enterprise decision-making variables such as output and low-carbon energy levels. Furthermore, with the goal of achieving the equilibrium of enterprise production flow, energy flow, and carbon trading flow, the projection correction algorithm is adopted to solve the equilibrium state of the hypernetwork, as verified through numerical examples to analyze the influence of carbon emission limits and carbon trading prices on the equilibrium decision of the network. Finally, we provided the government and park managers with directly operational management insights, clearly stating that when formulating policies, carbon quotas and carbon trading prices should be considered in a coordinated manner, and the regulation of high-emission enterprises should be strengthened to avoid the occurrence of negative effects, thereby achieving the synergy of economic and environmental benefits.
The organizational structure of the rest of this article is as follows. In Section 2, we review and synthesize the related literature. In Section 3, we present the problem description and model assumptions. Section 4 analyzes the equilibrium conditions of the distributed energy sharing network for industrial parks. Section 5 constructs an industry park distributed energy sharing network equilibrium model and solves the model. Section 6 provides a numerical example and analyzes the solution results of the example. Section 7 draws conclusions.
2. Literature Review
The carbon emissions trading mechanism is a key measure for promoting low-carbon, green, and sustainable economic development. In recent years, scholars have conducted a large number of studies on the impact of a carbon emissions trading mechanism on carbon emission reduction [8]. Zhang analyzed Chinese city data from 2004 to 2015 through robust econometric methods and found that the carbon trading policy in pilot areas reduced carbon emissions by about 16.2% [9]. Wang et al. utilized panel data from 30 Chinese provinces and municipalities spanning 2008–2018 to assess the impact of carbon trading policies on achieving carbon neutrality through a combination of control group methods and difference-in-differences analysis [10]. Wu et al. employed the data envelopment analysis method to examine the impact of carbon emissions trading schemes on carbon emission efficiency in the steel industry. Results indicate that carbon emission efficiency in pilot provinces implementing emissions trading has significantly improved by 5% [11]. Du et al. found that the pilot policy of low-carbon cities can effectively enhance the ecological efficiency of the region through the key path of driving green technological innovation [12]. In addition, some scholars have researched the production decision-making problem of enterprises under the carbon emissions trading mechanism. Yu et al. examined the effects of carbon pricing and overconfidence on the decision-making and profits of supply chain members, and the carbon trading price is found to be effective in guiding emission reductions under the rational state of low-cost manufacturers, but fails after the abatement cost increases [13]. Fan et al. reveal the association between carbon trading price uncertainty and enterprises’ incentives to invest in clean technology, emphasizing the importance of uncertainty in carbon policy design [14]. Li et al. analyzed two competing low-carbon supply chains under a carbon trading mechanism, finding that carbon quota systems struggle to effectively drive emissions reductions—raising carbon trading prices is the key [15]. Wang et al. constructed a two-channel low-carbon supply chain network equilibrium model incorporating risk-averse retailers. Findings indicate that raising carbon trading prices effectively incentivizes firms to increase carbon reduction rates and profit from selling carbon allowances [16]. Xu et al. developed a Stackelberg game model to analyze market dynamics under three scenarios, exploring the impact of carbon trading mechanisms on green innovation production in manufacturing enterprises [17]. The above-mentioned research, through empirical and game models, has effectively verified the effectiveness of the carbon trading mechanism in macro emission reduction and micro decision-making of enterprises. However, its analytical framework mostly focuses on the direct interaction between policies and corporate behaviors, failing to fully incorporate the collaborative emission reduction paths achieved among enterprises through distributed energy sharing, and less consideration is given to the impact of the complex network interactions thus formed on the system equilibrium.
On this basis, some other scholars have paid attention to the important role of the carbon emissions trading mechanism in the energy field. In the study of renewable energy investment decision-making, Chen et al. established a renewable energy investment decision model for utility companies under three carbon cap-and-trade mechanisms and analyzed its impact on investment decision-making [18]. Wei et al. constructed a two-level electricity supply chain game model and compared the optimal solutions under the grandfather carbon cap mechanism and the benchmark carbon cap mechanism [19]. Yan et al. took the renewable energy industry in China as an example to explore the impacts of a carbon trading mechanism on the investment decision, carbon emissions, consumer surplus, and social welfare of power companies, and found that the hybrid carbon trading scheme is optimal [20]. In terms of energy optimization decision-making research, Meng et al. studied the two-level supply chain operation decision-making problem under different carbon trading policies based on energy performance contracts [21]. Fu et al. established a dynamic differential game model for distributed energy sharing within industrial clusters under a quota trading mechanism, analyzing the impact of the quota trading mechanism on distributed energy sharing decisions in industrial parks [22]. Wu et al., based on the perspective of energy producer and seller, used a mixed-integer programming method with game equilibrium to solve the low-carbon energy trading process in the community under the cap-and-trade mechanism [23]. He et al. proposed a multi-objective optimization model for long-term planning of regional power systems based on renewable energy generation portfolio standards and carbon cap-and-trade mechanisms [24]. In the study of optimal energy scheduling, Zhang et al. incorporated the carbon trading mechanism into the optimal scheduling model of virtual power plants and proposed a self-concluding variational particle swarm optimization algorithm, which effectively improved the utilization rate of renewable energy sources [25]. Gao et al. incorporated demand response into a tiered carbon trading mechanism, providing economically optimal low-carbon dispatch solutions for integrated energy systems [26]. Huo et al. examined the impact of seasonal variations on carbon trading mechanisms, establishing a stepwise carbon pricing model and proposing a novel quota allocation method to achieve low-carbon economic dispatch [27]. The above-mentioned research has deeply applied the carbon trading mechanism to the investment, operation, and dispatching of the energy system, which has significant practical guiding significance. However, most of the existing models are centralized decision-making or two-party games, lacking a balanced analysis of the distributed energy sharing network composed of multiple heterogeneous enterprise entities that simultaneously cover the flows of products, energy, and the carbon cap. As a result, it is difficult to reveal the decision-making interaction and overall emergence patterns within industrial parks.
Nowadays, under the dual role of a carbon trading mechanism and distributed energy sharing, the relationships within industrial parks are becoming more and more complex, and enterprises need to make optimal decisions on production, energy, and low carbon to reduce risks [28]. The network equilibrium model, as a tool to describe the interaction and equilibrium state of each node in the network, has been widely used in supply chain research. Liu et al. constructed a closed-loop supply chain network equilibrium model based on the dual objectives of profit maximization and carbon emission minimization, solving it using an improved projection contraction algorithm [29]. Wan et al. considered consumer low-carbon preferences and altruistic behavior among agents across tiers in dual-channel hotel supply chains, establishing a network equilibrium model grounded in variational inequalities. They employed an improved projection gradient algorithm to determine system equilibrium conditions and optimal decisions [30]. Jiang et al. established a multi supply chain under the condition of network equilibrium. The effects of the network structure on enterprises’ earnings, total trade flows, and overall social welfare were investigated [31]. Fargetta et al. examined the impact of temporal variations on the supply chain network equilibrium and proposed a sustainable closed-loop supply chain network equilibrium model based on a time-dependent framework, and analyzed the optimal behaviors of each decision-maker and the conditions for the equilibrium of the closed-loop supply chain network [32]. On this basis, some scholars have extended the single-network equilibrium to form a multi-network equilibrium model. In the study of equilibrium problems in energy and transportation networks, Ni used finite-dimensional variational inequalities to establish a network equilibrium model for car rental market competition based on non-cooperative game theory, which is able to analyze the network equilibrium of diverse driver types, multi-demand zones, and differentiated online car rental platforms [33]. Xie et al. constructed a network equilibrium model based on the distribution network and the transportation network in order to capture the traffic flow, queue, and tariffs’ time-varying characteristics [34]. Chen et al. constructed a network equilibrium model to examine the interactions between electric vehicle drivers’ travel plans, analyzing how charging and rest behaviors influence fatigue costs [35]. Li et al. proposed a stochastic rescue network with a finite path capacity and established an equilibrium model for the network based on cumulative prospect theory, which reduces the disaster response cost [36]. In the study of the equilibrium problem of an energy network and carbon trading network, Zhang constructed a network equilibrium model based on a product trading sub-network and carbon trading sub-network, and researched the impact of the carbon cap and price on the closed-loop supply chain network [37]. It can be seen that the network equilibrium model provides a powerful modeling tool for analyzing complex systems with multiple agents and multiple levels. However, existing research has not yet simultaneously integrated production networks, energy networks, and carbon trading networks to construct a three-party coupled hyper-network equilibrium framework, in order to describe how enterprises in industrial parks make collaborative decisions among production, energy, and carbon markets in the context of distributed energy sharing.
In summary, the existing literature has conducted extensive research on the equilibrium problem in supply chain networks, laying a solid foundation. However, previous studies have mostly focused on single production networks and multi-network structures with two layers of networks superimposed, without simultaneously considering the factors of products, energy, and carbon trading. There are also few studies analyzing the impact of carbon trading mechanisms on the equilibrium decision-making of distributed energy sharing networks in industrial parks. Furthermore, most of the existing models assume that enterprises are homogeneous, ignoring the power differences between core enterprises and supporting enterprises in carbon trading. In the actual production and operation process of distributed energy sharing in industrial parks, there is often an interaction between the energy network, the production network, and the carbon trading network. Heterogeneous enterprises within the park have different decision-making goals. Existing research is still in a blank stage in solving the multi-network equilibrium problem of distributed energy sharing in industrial parks with heterogeneous enterprises. To clearly demonstrate the positioning and innovation of this research, in Table 1, this paper is compared with recent related studies from dimensions such as the number of network layers, inclusion of carbon trading, solution methods, characterization of dynamic behaviors, and improvements presented in this work.

Table 1.
Summary of research differences.
Therefore, this paper introduces the network equilibrium theory into the study of industrial park distributed energy sharing research, and describes the industrial park network as a supernetwork structure composed of a production network, energy network, and carbon trading network from the perspective of heterogeneous members within the industrial park. The network equilibrium model is constructed based on the theory of variational inequality, and the conditions for the decision-makers of each party and the network system to reach the equilibrium state are obtained. Finally, the model is solved by the projection correction algorithm to explore the influence of the carbon emissions trading mechanism on energy sharing and optimal profit decision-making, so as to provide support for the decision-making of industrial park producers.
3. Problem Description and Model Assumptions
3.1. Description of the Problem
The distributed energy sharing network of the industrial park constructed in this paper is a three-level supernetwork structure consisting of I supporting enterprises, J core enterprises, and K demand markets in the industrial park, including a product network, energy network, and carbon trading network, as shown in Figure 1 In the product network, the supporting enterprises provide production materials and semi-finished products for the core enterprises, which sell the products to the end market through production and processing. Under the carbon emissions trading mechanism, the government allocates a free initial carbon quota to each enterprise. When the actual carbon emissions of the enterprise are greater than the carbon quota, the enterprise can buy carbon quota in the carbon trading market, and vice versa, the enterprise can sell the carbon quota. In order to reduce carbon trading costs, enterprises adopt distributed low-carbon energy sources and cooperate with upstream and downstream enterprises in distributed energy sharing through the energy sharing service platform to reduce carbon emissions. Enterprises also consider the decisions of competitors and upstream and downstream enterprises when making decisions, and the decision-makers at each level compete with each other to achieve the Nash equilibrium.
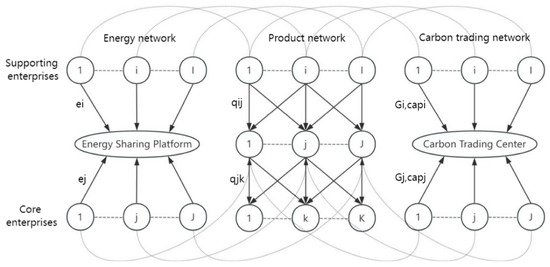
Figure 1.
Schematic diagram of distributed energy sharing supernetwork for industrial parks.
3.2. Model Assumptions
Assumption 1.
In industrial parks, many supporting enterprises provide standardized intermediate products or basic raw materials for core enterprises, and these products have a high degree of consistency in physical properties or functions. Therefore, referring to Xiao et al. on the setting of the supply chain network equilibrium problem [39], it is assumed that the types of products traded between core and supporting enterprises in the industrial park are the same and interchangeable. The products are produced on demand and supply and demand equilibrium is considered. Assume that the supply of products from supporting enterprises to the core enterprises is , the price of products is , the production cost is , and the transaction cost is ; the supply of products from the core enterprises to the demand market is , the price of products is , the production cost is , and the transaction cost is ;
Assumption 2.
Enterprises invest in distributed low-carbon energy individually and share energy only with upstream and downstream cooperative enterprises to reduce carbon emissions and improve product competitiveness. Assuming that the distributed low-carbon energy level of the supporting enterprises is , the cost is , and the impact coefficient of the low-carbon energy level on the emission reduction per unit of product is ; the distributed low-carbon energy level of the core enterprises is , the cost is , and the impact coefficient of the low-carbon energy level on the emission reduction per unit of product is .
Assumption 3.
Referring to the assumption of Chen et al. on the carbon emissions trading mechanism [18], the government allocates a carbon cap to enterprises based on their initial carbon emissions. If initial emissions exceed the cap, enterprises must purchase additional carbon allowances from the carbon trading market. The carbon trading price is an exogenous variable, influenced by the climate and environment, policy orientation, and the supply-and-demand relationship at the macro level. Assuming that the initial carbon emission of supporting enterprises is , the carbon limit is ; the initial carbon emission of core enterprises is , the carbon limit is , and the carbon trading price is . Supporting enterprises are usually the purchasers of a carbon cap, while core enterprises, due to their dominant position and higher low-carbon levels, often become the sellers of the cap, trading the excess cap to supporting enterprises. The carbon trading center can regulate carbon trading volumes to ensure balanced carbon transaction flows.
Assumption 4.
To bring the model more in line with the actual management context, this paper introduces a policy constraint on the upper limit of carbon cap sales: To prevent the core enterprises from overly relying on the profit from the selling cap and neglecting emission reduction, it is stipulated that the quota available for sale by the core enterprises shall not exceed the annual surplus.
Assumption 5.
Each cost and production function in the model is a continuously differentiable convex function [40].
The parameters used in the model and their specific meanings are shown in Table 2.
Table 2.
Notations and definitions.
4. Analysis of Equilibrium Conditions of Distributed Energy Sharing Network in Industrial Park
4.1. Optimal Decision Behavior and Equilibrium Conditions for Supporting Enterprises
In a competitive environment, the production cost of supporting enterprises in an industrial park is not only related to their own output, but also related to the output of their peer supporting enterprises. The production cost function of the supporting enterprises is , where is a vector with dimensions of , and the transaction cost between the supporting enterprise and the core enterprise is . We assume that both the production cost and transaction cost functions about exhibit the properties of convexity and continuous differentiability, and that the revenue can be obtained by supplying products to the core enterprise. The low-carbon energy level of the supporting enterprise is , and the initial carbon emission per unit of product is . By sharing distributed energy with the core enterprise, the carbon emission per unit of product can be reduced by , and the difference between the actual carbon emission and the carbon cap needs to be purchased at the price of in the carbon market. The supporting enterprise makes decisions on and , and the objective function of profit maximization for the supporting enterprise is
The constraints indicate that the actual carbon emissions of the supporting enterprises are higher than the government carbon limit. The non-cooperative Nash game is played between the supporting enterprises, and since the production cost function and the transaction cost function are convex functions with respect to the trading volume of the products, the objective of profit maximization with respect to all the supporting enterprises can be described in the form of the following variational inequality (i.e., for solving the problem of , so that it is satisfied):
where is the equilibrium price reached between the supporting enterprises and the core enterprises, and is the Lagrange multiplier corresponding to Constraint (2).
4.2. Optimal Decision Behavior and Equilibrium Conditions for Core Enterprise
The core enterprise purchases raw materials or semi-finished products from the supporting enterprise to produce the product and sells it to the demand market . The transaction cost between the core enterprise and the supporting enterprises is , and the production cost function of the core enterprise is , where is a vector with dimensions of . The transaction cost when the core enterprise sells its products to the demand market is , assuming that the production cost and transaction cost functions are continuously differentiable convex functions about , and that the revenue can be obtained by selling products to the demand market. The low-carbon energy level of the core enterprises is , the initial carbon emissions per unit of product produced are , the government allocates carbon cap to each core enterprise, and the core enterprises can reduce carbon emissions per unit of product by through distributed energy sharing with supporting enterprises. Due to the dominant position of core enterprises in the process of distributed energy sharing in industrial parks, they can obtain a higher level of low-carbon energy and carbon emission cap. Assuming that the actual carbon emissions of core enterprises under distributed energy sharing are always lower than the carbon cap allocated by the government, the difference between the actual carbon emissions and the carbon cap can be sold at the price of in the carbon market to benefit from the carbon trading. The core enterprise makes decisions on and , and the objective function of profit maximization for the core enterprise is
The first constraint indicates that the actual carbon emission of the core enterprises is smaller than government-allocated carbon cap; the second constraint indicates the logistic equilibrium condition of the core enterprises and the supporting enterprises, where denotes the conversion rate of raw materials of the core enterprises. Since the production cost function and transaction cost function are both convex functions about the volume of product transactions, the objective of profit maximization about all core enterprises can be described as the following form of variational inequality (i.e., for solving , so that it is satisfied):
where is the equilibrium price reached between the core enterprise and the demand market, and and are the Lagrange multipliers corresponding to Constraint (5).
4.3. Optimal Decision Behavior and Equilibrium Conditions in Demand Markets
Demand in the market is a function of the price of the product . Since consumer markets are competitive, market demand is related not only to the price of the product in the demand market but also to the price of the product in other demand markets. Consumers incur transaction costs when purchasing the core enterprise’s product , assuming that the demand function and the transaction cost function are continuously differentiable convex functions. Under the assumption of perfect competition and the spatial price equilibrium condition, a transaction occurs only when the price accepted in the demand market is equal to the sum of the core enterprise’s pricing for the market and the transaction costs, and the equilibrium condition for the demand market is
Then, the objective function of the demand market in equilibrium can be described in the form of the following variational inequality (i.e., for solving , so that it is satisfied):
4.4. Optimal Decision Behavior and Equilibrium Conditions for Carbon Trading Centers
According to the assumption, in the carbon trading network of industrial parks, core enterprises are the supply side of carbon trading and supporting enterprises are the demand side. Core enterprises and supporting enterprises carry out carbon emissions trading in the carbon trading center. The carbon trading center collects transaction fees from both parties in accordance with a certain transaction rate and generates a certain transaction cost ; assuming that the benefit function and cost function of the carbon trading center are continuously differentiable convex functions, the optimal objective function of the carbon trading center is
The constraints indicate the equilibrium between the supply and demand of carbon trading flows of core and supporting enterprises, at which time the optimal equilibrium decisions of both parties can be described in the form of the following variational inequality (i.e., for solving , so that it is satisfied):
where is the optimal equilibrium distributed energy low-carbon level of core and supporting enterprises, and is the Lagrange multiplier corresponding to Constraint (11).
5. Construction and Solution of the Network Equilibrium Model
The whole industry park distributed energy sharing supernetwork can be in equilibrium only when the product output , the transaction price , and the distributed energy low carbon level among the participants of each layer in the industry park distributed energy sharing network satisfy the sum of the above four variational inequalities. Then, the decision of the equilibrium of the distributed energy sharing network of industrial parks can be equated to the solution of the following variational inequality (i.e., to solve , so that it is satisfied):
Referring to the study of Liu et al. [29], we use the projection correction algorithm to solve the equilibrium model of the distributed energy sharing network of industrial parks under the carbon emissions trading mechanism. The projection correction algorithm has the advantages of strong convergence and suitability for high-dimensional non-smooth problems. Compared with heuristic methods such as the genetic algorithm and particle swarm algorithm, the projection correction algorithm has stricter mathematical guarantees and a faster convergence speed when solving convex optimization and equilibrium problems. Especially when dealing with variational inequality problems with constraints, this algorithm can effectively ensure the feasibility and stability of the solution. The solution process can be described using the following form of standard variational inequality:
- i.e., solving , such that
Among them,
Each component in represents the function derived from the part following the multiplication sign in Equation (13), and the symbol represents the inner product of the N-dimensional Euclidean space.
During the iterative process of the projection correction algorithm, all constraints are processed through the Lagrange multiplier method. Specifically, we incorporate the constraints into the framework of variational inequalities and ensure that the solutions after each iteration satisfy the constraints through a multiplier update mechanism. The advantage of this method lies in transforming the original constrained problem into an unconstrained problem for solution, while ensuring the feasibility and convergence of the understanding.
The specific algorithm for the projection correction solution is as follows:
Step 1: Initialization. Assume that the iteration step satisfies , and the number of iterations: . L is the Lipschitz constant. Set the initial value and the tolerance .
Step 2: Iterative calculation. Solve the following variational inequality problem for :
Step 3: Correct the calculation. Solve the following variational inequality problem for :
Step 4: Convergence check. If , terminate the loop; otherwise, make and return to step 2 to continue the iteration.
All cost functions and demand functions in this model are defined as continuously differentiable convex functions. Under this condition, the operator corresponding to the variational inequality problem satisfies pseudo-monotonicity and Lipschitz continuity, thereby ensuring the global convergence of the projection correction algorithm. In the numerical experiments, the average number of iterations of the examples was 255 times, which proved the good computational efficiency of the algorithm. The computational complexity of this algorithm is mainly related to the variable dimension and the inner product calculation of each iteration. The algorithm demonstrated good scalability for the scale of the industrial park in this study.
The existence and uniqueness of equilibrium are detailed in Appendix A.
6. Numerical Example Analysis
6.1. Numerical Examples
To conduct a detailed analysis of the impact of carbon emission limits and carbon trading prices under the carbon trading mechanism on the equilibrium strategy of distributed energy sharing networks in industrial parks, this paper investigates the distributed energy sharing platform in Suzhou Industrial Park and the Shanghai Environment and Energy Exchange, obtaining cost parameters for distributed energy sharing in some industrial parks and national carbon emission rights trading data. Taking this as a reference, in combination with the relevant provisions of China’s carbon trading policies, and referring to Yang et al.’s numerical simulation research on the equilibrium of the supply chain network under the carbon trading mechanism [38], the relevant cost functions and parameters are reasonably set, and numerical case analysis is conducted. We explore the balanced decision-making of members in the distributed energy sharing network of industrial parks under different circumstances, and we provide a reference for the distributed energy sharing decision-making of industrial parks under the carbon trading mechanism.
In this paper, a distributed energy sharing supernetwork model of an industrial park consisting of two supporting enterprises, two core enterprises, two demand markets, and one carbon trading center is constructed with the following parameter settings as well as a cost function and demand function.
Parameter settings are
The production cost function for core and supporting enterprises is
The transaction cost function is
The distributed energy cost function is
The market demand function is
The carbon trading center cost function is
6.2. Analysis of Numerical Results
The model is solved using the projection correction algorithm, which is programmed using MATLAB R2016a with an iterative step size of 0.01. The program converges the equilibrium results after 255 iterations to a point through which the vector information of the optimal solution can be derived. Table 3 shows the equilibrium results.
Table 3.
Results of optimal equilibrium decision-making by parties.
The equilibrium results show that the low-carbon level of distributed energy of core enterprises is slightly higher than that of supporting enterprises, indicating that core enterprises have more advantages in energy sharing. The profits of core enterprises are higher than those of supporting enterprises, indicating that under the carbon trading mechanism, core enterprises can obtain higher profits by sharing distributed energy in industrial parks and selling carbon emission rights. However, supporting enterprises are in a disadvantaged position in carbon trading, and relevant policies should pay attention to the carbon cost pressure on supporting enterprises.
6.3. Impact of Carbon Emission Cap on Network Equilibrium
The following analysis examines how changes in the carbon cap for core enterprises and supporting enterprises affect various variables and the profits of all parties involved. In the case of fixing other parameters unchanged, by changing the carbon cap of supporting enterprises (200,250,300,350), the equilibrium results of each variable are obtained, as shown in Table 4.
Table 4.
Sensitivity analysis of carbon emission cap for supporting enterprises.
As can be seen from Table 4, as the carbon emission cap allocated to supporting enterprises by the government rises, the volume of product trading and the market price of the products rise, but the distributed energy low-carbon level of supporting enterprises decreases, the profit of core enterprises increases, the profit of supporting enterprises decreases, and the total profit of the system also decreases. This suggests that the government’s raising of the carbon emission cap for supporting enterprises, while boosting product output, reduces the incentive for supporting enterprises to engage in distributed energy sharing, affects the distributed energy low-carbon level of supporting enterprises, increases the actual carbon emissions per unit of product, and forces supporting enterprises to buy more carbon emission credits from the core enterprise, which negatively affects the profits of the supporting enterprises and the total profits of the system. This phenomenon suggests that the government should appropriately strengthen carbon emission controls on high-emission supporting enterprises, which will not only improve their distributed energy low-carbon levels but also help to improve the profitability of the entire system.
The equilibrium results for each variable are obtained by varying the carbon cap of the core enterprises (350,400,450,500) while fixing the other parameters constant, as shown in Table 5.
Table 5.
Sensitivity analysis of carbon emission cap for core enterprises.
As can be seen from Table 5, when the carbon emission cap allocated by the government to the core enterprises rises, the volume of products traded and the market price rise, but the low-carbon level of distributed energy of the core enterprises decreases, the profits of the core enterprises increase, the profits of the supporting enterprises decrease, and the total profits of the system also decrease. This suggests that the government’s raising of the carbon cap for core enterprises will similarly reduce the profits of supporting enterprises. This is due to the fact that as the government relaxes the carbon emission limits on core enterprises, the carbon cap available for sale in carbon trading by core enterprises also increases, thus reducing the incentive for distributed energy sharing by core enterprises. Through the equilibrium constraints of carbon trading, core enterprises will gain higher profits through carbon trading, while supporting enterprises will have lower profits due to increased carbon trading costs. It can be seen that if the government relaxes the carbon emission constraints on core enterprises too much, it will exacerbate the polarization of the profits of core and supporting enterprises and negatively affect the total profits of the system.
Figure 2, Figure 3 and Figure 4, respectively, examine the impact of the corporate carbon cap on the profits of core enterprises, supporting enterprises, and the overall system.
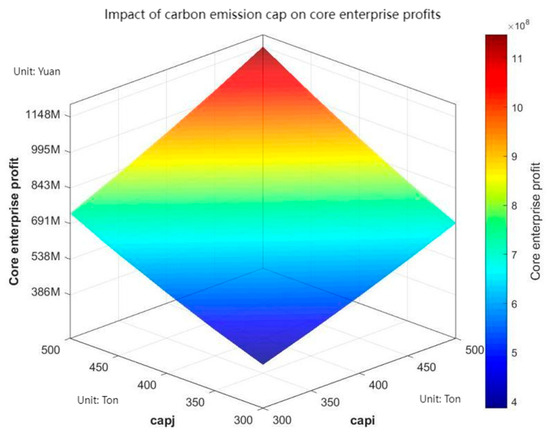
Figure 2.
Impact of carbon emission cap on core enterprise profits.
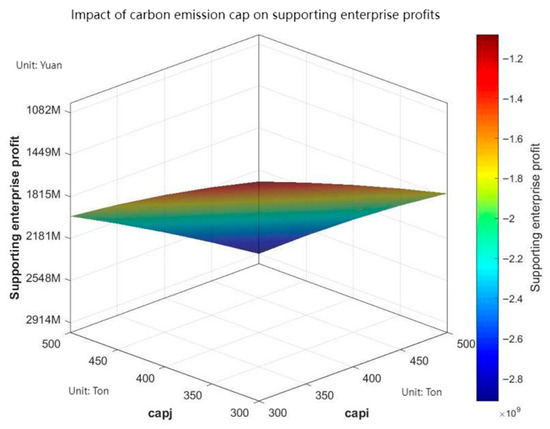
Figure 3.
Impact of carbon emission cap on supporting enterprise profits.
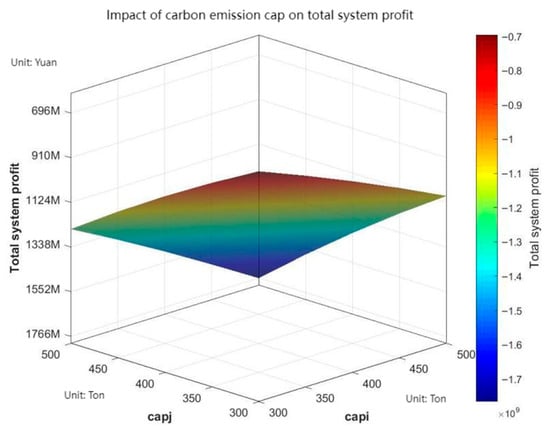
Figure 4.
Impact of carbon emission cap on total system profit.
Figure 2 shows that as both core and supporting enterprises’ carbon caps increase, the core enterprise’s profits also rise. This indicates that raising either the core enterprise’s or supporting enterprises’ carbon cap positively impacts the core enterprise’s profits. This occurs because the core enterprise holds a more advantageous position in carbon trading, enabling it to generate greater returns by adjusting its carbon cap sales strategy.
Figure 3 reveals that supporting enterprises’ profits exhibit a continuous downward trend as their own carbon cap increases. Furthermore, when the core enterprise’s carbon cap rises, supporting enterprises’ profits decrease further. This signifies that supporting enterprises face dual profit pressures within the carbon emissions trading mechanism.
The results in Figure 4 indicate that the system’s total profit declines as both core and supporting enterprises’ carbon caps increase. This further validates the conclusions from Table 4 and Table 5, confirming that excessively lenient carbon emission cap policies hinder the overall economic efficiency of distributed energy sharing networks within industrial parks. In summary, when formulating carbon emission cap policies, governments must strike a balance between promoting industrial development and safeguarding the overall system efficiency. This approach prevents excessive adjustments to individual enterprises’ carbon caps from negatively impacting the balanced development of the entire network.
6.4. Impact of Carbon Trading Prices on Network Equilibrium
The carbon trading price is an exogenous variable formed under the market-based trading of carbon trading centers. In the following, we analyze the impact of the price change in carbon trading on the trading volume of products, energy low-carbon level, and profit of each core and supporting enterprise in the industrial park. In the case of fixing other parameters unchanged, when changing the carbon trading price (2.5, 5, 7.5, 10), the equilibrium results of each variable are obtained, as shown in Table 6.
Table 6.
Sensitivity analysis of carbon trading prices.
As can be seen from Table 6, as the carbon trading price rises, the product trading volume and product price, the distributed energy low-carbon level of core and supporting enterprises, the profits of both parties, and the total profit of the system all show different degrees of decline. This shows that a higher carbon trading price will increase the carbon trading cost of enterprises, reduce the enthusiasm for enterprise production, and have a negative impact on the distributed energy sharing of industrial parks, which in turn affects the profits of enterprises and the total profits of the system. It can be seen that too high a carbon trading price is not conducive to the development of distributed energy sharing in industrial parks, and is also not conducive to the normal operation of the production network of industrial parks. The government should regulate the carbon trading market according to the actual situation, and guide the carbon trading price in a reasonable range through the formulation of policies and measures, so as to activate the carbon trading market and at the same time ensure the normal operation and profit level of enterprises.
7. Conclusions
This paper constructs an equilibrium model for distributed energy sharing networks in industrial parks by employing the variational inequality method. The model is based on the hypernetwork structure formed by production networks, energy networks, and carbon trading networks comprising core enterprises and supporting enterprises within the industrial park. The product trading volume and distributed energy low-carbon level decision-making when the core enterprises and supporting enterprises of the park act as the supplier and buyer of carbon trading, respectively, are explored, and the conditions for the decision-makers of each party and the network system to reach an equilibrium state are further obtained. The model is solved by using variational inequality and a projection correction algorithm, and the effects of the changes in the main parameters in the model on the network equilibrium are analyzed through numerical examples. The main conclusions are as follows:
- (1)
- Although the government’s raising of the carbon emission cap for supporting enterprises will raise the trading volume and market price of products, as well as the profits of core enterprises, it will reduce the low-carbon level of distributed energy among supporting enterprises, decrease the profits of supporting enterprises, and lower the overall system profit. When the carbon emission cap of the supporting enterprises was raised from 200 to 350, the profit decreased from −11.576 billion to −16.88 billion. As a result, the total system profit deteriorated. This suggests that the government’s elevation of the carbon emission cap for supporting enterprises will reduce the enthusiasm of supporting enterprises for distributed energy sharing, affect the low-carbon level of distributed energy of supporting enterprises, increase the actual carbon emissions per unit of product, force supporting enterprises to buy more carbon emission cap from the core enterprises, widen the polarization of enterprises’ profits, and negatively affect the supporting enterprises’ profits and the system’s total profits.
- (2)
- The government’s raising of the carbon emission cap for core enterprises will raise the trading volume and market price of products, as well as the profits of core enterprises, but it will likewise lower the low-carbon level of distributed energy of core enterprises, the supporting enterprises’ profits, and the system’s total profits. This suggests that the government’s elevation of the carbon emission cap for core enterprises will lead to an increasing carbon cap available for sale in carbon trading by core enterprises, thereby reducing the incentive for core enterprises’ distributed energy sharing. Through the equilibrium constraint of carbon trading, core enterprises will gain higher profits through carbon trading, while supporting enterprises will have lower profits due to increased carbon trading costs, which in turn widens the polarization of enterprises’ profits and negatively affects total system profits.
- (3)
- The increase in carbon trading price will lead to different degrees of decline in product trading volume and product price, distributed energy low-carbon level of core enterprises and supporting enterprises, profits of both parties, and total system profits. When the carbon trading price rose from 2.5 CNY per ton to 10 CNY per ton, the product trading volume, energy low-carbon level, and profits of core and supporting enterprises all showed a monotonous downward trend, and the total system profit decreased by 37.1%. This indicates that a higher carbon trading price will increase the carbon trading cost of enterprises, reduce the enthusiasm for enterprise production, and have a negative impact on the distributed energy sharing of industrial parks, which in turn affects the profits of enterprises as well as the total profits of the system.
The model and its conclusions in this article are mainly applicable to industrial parks that have a foundation for centralized energy management (such as microgrids). In these scenarios, the infrastructure and coordination mechanism for energy sharing are more complete, making the interaction behaviors described by the model more practically feasible. Based on the above findings, the following management implications can be summarized: Firstly, the government should strengthen the carbon emission control on high-emission supporting enterprises, which not only improves the low-carbon level of their distributed energy but also helps to improve the profitability of the whole system. Secondly, numerical analysis indicates that the carbon quota ratio between core enterprises and supporting enterprises should not exceed 1.8; otherwise, it will intensify the polarization of profits. The government should strengthen the carbon emission constraints on the core enterprises, so as to prevent the polarization of profit distribution between the core and supporting enterprises from negatively affecting the system’s total profit. Finally, too high a carbon trading price is not conducive to distributed energy sharing in industrial parks. In the case of this article, when the carbon trading price is within the range of 5 to 7.5 CNY per ton, it can not only maintain a certain incentive for emission reduction but also will not overly suppress the production enthusiasm of enterprises. The government should guide the carbon trading price to lie in a reasonable range.
The model constructed in this study is a static equilibrium model, which does not take into account the dynamic process of the evolution of carbon trading prices, energy demand, and technological levels over time. This simplified processing helps to clarify the basic interaction mechanisms among the three types of networks at the initial stage. Future research can further introduce multi-period dynamic frameworks, combined with stochastic optimization or differential game methods, to analyze long-term carbon trading strategies and energy sharing paths, so as to more comprehensively reflect the decision-making behaviors that change over time in the real system.
Author Contributions
Conceptualization, H.F. and X.W.; Methodology, Y.Z.; Software, W.Y.; Validation, H.F. and X.W.; Formal Analysis, H.F.; Investigation, W.Y.; Resources, Y.Z.; Data Curation, H.F.; Writing—Original Draft, Y.Z.; Writing—Review and Editing, H.F. and X.W.; Visualization, H.F.; Supervision, H.F.; Project Administration, X.W.; Funding Acquisition, W.Y. All authors have read and agreed to the published version of the manuscript.
Funding
This research was funded by the Liaoning Provincial Science and Technology Joint Program (Grant 2024-BSLH-236).
Data Availability Statement
The original contributions presented in this study are included in the article. Further inquiries can be directed to the corresponding author.
Conflicts of Interest
The authors declare no conflicts of interest.
Appendix A
The original problem mainly concerns the existence and uniqueness of the equilibrium solutions for Equations (3), (7), (10) and (13), which is equivalent to the following formulation.
Consider a vector function on a convex closed set in the n-dimensional Euclidean real number space, where . It is known that . For all ,
First, consider the projection onto in the bounded, compact, convex subset of the finite-dimensional real space . That is, there exists a such that . The projection relationship can be defined as
Here, is the projection operator. Let be a minimizing sequence approaching . That is, there exists a large integer such that for ,
where d represents the distance. Take and as two minimizing sequences in both approaching . By the parallelogram law, we have . Since K is convex, and , it follows that . From , we know . Combining these, we get . Furthermore, when , , so in this case, we also have . This indicates that there exists a in such that the sequence in converges to when . The uniqueness of can be proven by assuming convergence to two distinct points and , leading to a contradiction. Regarding Lipschitz continuity, based on the above conclusion and referring to correlational research [38], it is known that if and only if , ,
From the necessary and sufficient condition of (A2) and (A4), it follows that if and only if is a solution of the variational inequality (A1), then for any real number , we have
According to the fixed point theorem and easily proven from (A4), is Lipschitz continuous with a Lipschitz constant of 1. This consequently guarantees the existence of a solution.
For the uniqueness of the solution, let . Based on the convexity assumption, we have and . Adding these two inequalities yields . Clearly, if a strict inequality holds, the function is strictly monotonic. Subsequently, assuming are two solutions of the original equation and substituting them into the above two equations leads to a conclusion that contradicts strict monotonicity, thus proving the uniqueness of the solution.
References
- Sovacool, B.K.; Geels, F.W.; Iskandarova, M. Industrial Clusters for Deep Decarbonization. Science 2022, 378, 601–604. [Google Scholar] [CrossRef]
- Zhu, D.; Yang, B.; Wu, Y.; Deng, H.; Dong, Z.; Ma, K.; Guan, X. Joint Trading and Scheduling Among Coupled Carbon-Electricity-Heat-Gas Industrial Clusters. IEEE Trans. Smart Grid 2023, 15, 3152–3164. [Google Scholar] [CrossRef]
- Gilani, M.A.; Kazemi, A.; Ghasemi, M. Distribution System Resilience Enhancement by Microgrid Formation Considering Distributed Energy Resources. Energy 2020, 191, 116442. [Google Scholar] [CrossRef]
- Han, X.; Sun, L.; Tao, Y.; Zhao, J.; Wang, G.; Yuan, D. Distributed Energy-Sharing Strategy for Peer-to-Peer Microgrid System. J. Energy Eng. 2020, 146, 04020033. [Google Scholar] [CrossRef]
- Guo, X.; Xiao, B. Effects of China’s Low-Carbon Policy Under Stochastic Shocks—A Multi-Agent DSGE Model Analysis. Environ. Sci. Pollut. Res. 2023, 30, 65177–65191. [Google Scholar] [CrossRef]
- Liu, B.; Ding, C.J.; Hu, J.; Su, Y.; Qin, C. Carbon Trading and Regional Carbon Productivity. J. Clean. Prod. 2023, 420, 138395. [Google Scholar] [CrossRef]
- Wang, Z.; Wu, Q. Carbon Emission Reduction and Product Collection Decisions in the Closed-Loop Supply Chain with Cap-and-Trade Regulation. Int. J. Prod. Res. 2020, 59, 4359–4383. [Google Scholar] [CrossRef]
- Zhang, W.; Li, G.; Guo, F. Does Carbon Emissions Trading Promote Green Technology Innovation in China? Appl. Energy 2022, 315, 119012. [Google Scholar] [CrossRef]
- Zhang, Y.; Li, S.; Luo, T.; Gao, J. The Effect of Emission Trading Policy on Carbon Emission Reduction: Evidence from an Integrated Study of Pilot Regions in China. J. Clean. Prod. 2020, 265, 121843. [Google Scholar] [CrossRef]
- Wang, X.; Huang, J.; Liu, H. Can China’s Carbon Trading Policy Help Achieve Carbon Neutrality? the Five-Sphere Integrated Plan Perspective. J. Environ. Manag. 2022, 305, 114357. [Google Scholar] [CrossRef]
- Wu, R.; Tan, Z.; Lin, B. Does Carbon Emission Trading Scheme Really Improve the CO2 Emission Efficiency? Steel Industry. Energy 2023, 277, 127743. [Google Scholar] [CrossRef]
- Du, M.; Antunes, J.; Wanke, P.; Chen, Z. Ecological Efficiency Assessment Under the Construction of Low-Carbon City: A Perspective of Green Technology Innovation. J. Environ. Plan. Manag. 2021, 65, 1727–1752. [Google Scholar] [CrossRef]
- Yu, J.; Sun, L. Supply Chain Emission Reduction Decisions, Considering Overconfidence under Conditions of Carbon Trading Price Volatility. Sustainability 2022, 14, 15432. [Google Scholar] [CrossRef]
- Fan, X.; Chen, K.; Chen, Y.-J. Is Price Commitment a Better Solution to Control Carbon Emissions and Promote Technology Investment? Manag. Sci. 2023, 69, 325–341. [Google Scholar] [CrossRef]
- Li, F.; Yang, Y.; Zhang, W.; Li, J. A Study on the Co-Opetition Game Between Low-Carbon Supply Chains Under Carbon Cap-and-Trade Policy. Manag. Decis. Econ. 2025, 46, 2986–2999. [Google Scholar] [CrossRef]
- Wang, H.; Lin, C. The Dual-Channel Low-Carbon Supply Chain Network Equilibrium with Retailers’ Risk Aversion Under Carbon Trading. Sustainability 2025, 17, 2557. [Google Scholar] [CrossRef]
- Xu, Y.; Dong, C.; Zhang, B.; Gong, M.; Wang, X. The synergistic effect of carbon trading and green credit on manufacturing enterprises’ production decisions and sustainability performance. Int. Rev. Econ. Finance 2025, 103, 104519. [Google Scholar] [CrossRef]
- Chen, W.; Chen, J.; Ma, Y. Renewable Energy Investment and Carbon Emissions under Cap-and-Trade Mechanisms. J. Clean. Prod. 2021, 278, 123341. [Google Scholar] [CrossRef]
- Wei, C.; Zhang, L.; Du, H. Impact of Cap-and-Trade Mechanisms on Investments in Renewable Energy and Marketing Effort. Sustain. Prod. Consum. 2021, 28, 1333–1342. [Google Scholar] [CrossRef]
- Yan, Y.; Sun, M.; Guo, Z. How do Carbon Cap-and-Trade Mechanisms and Renewable Portfolio Standards Affect Renewable Energy Investment? Energy Policy 2022, 165, 112938. [Google Scholar] [CrossRef]
- Meng, C.; Zhang, R.; Liu, B. Energy Performance Contracting in a Supply Chain under Cap-and-Trade Regulation and Carbon Tax Policy. Int. Trans. Electr. Energy Syst. 2022, 2022, 1716380. [Google Scholar] [CrossRef]
- Fu, H.; Song, L. Differential Game Model of Distributed Energy Sharing in Industrial Clusters Based on the Cap-and-Trade Mechanism. IEEE Access 2023, 11, 67707–67721. [Google Scholar] [CrossRef]
- Wu, C.; Chen, X.; Hua, H.; Yu, K.; Gan, L.; Shen, J.; Ding, Y. Peer-to-Peer Energy Trading Optimization for Community Prosumers Considering Carbon Cap-and-Trade. Appl. Energy 2024, 358, 122611. [Google Scholar] [CrossRef]
- He, Y.; Zeng, Z.; Liao, N. Multi-Objective Optimization of Regional Power Generation Mix Considering Both Carbon Cap-and-Trade Mechanisms and Renewable Portfolio Standards. Renew. Energy 2024, 231, 120937. [Google Scholar] [CrossRef]
- Zhang, L.; Liu, D.; Cai, G.; Lyu, L.; Koh, L.H.; Wang, T. An Optimal Dispatch Model for Virtual Power Plant that Incorporates Carbon Trading and Green Certificate Trading. Int. J. Electr. Power Energy Syst. 2022, 144, 108558. [Google Scholar] [CrossRef]
- Gao, L.; Yang, S.; Chen, N.; Gao, J. Integrated Energy System Dispatch Considering Carbon Trading Mechanisms and Refined Demand Response for Electricity, Heat, and Gas. Energies 2024, 17, 4705. [Google Scholar] [CrossRef]
- Huo, S.; Li, Q.; Pu, Y.; Xie, S.; Chen, W. Low Carbon Dispatch Method for Hydrogen-Containing Integrated Energy System Considering Seasonal Carbon Trading and Energy Sharing Mechanism. Energy 2024, 308, 132794. [Google Scholar] [CrossRef]
- Wang, Z. Evaluation and Application of Port Industrial Upgrading Based on Global Value Chain of Complex Network. J. Coast. Res. 2020, 110, 231–234. [Google Scholar] [CrossRef]
- Liu, Y.; Zhang, G. Closed-Loop Supply Chain Network Equilibrium Strategy Model with Environmental Protection Objectives. Chin. J. Popul. Resour. Environ. 2020, 18, 251–261. [Google Scholar] [CrossRef]
- Wan, X.; Jiang, B.; Li, Q.; Hou, X. Dual-Channel Environmental Hotel Supply Chain Network Equilibrium Decision under Altruism Preference and Demand Uncertainty. J. Clean. Prod. 2020, 271, 122595. [Google Scholar] [CrossRef]
- Jiang, T.; Lin, Y.; Nguyen, T. Market Equilibrium in Multi-tier Supply Chain Networks. Nav. Res. Logist. 2021, 69, 355–370. [Google Scholar] [CrossRef]
- Fargetta, G.; Scrimali, L.R.M. A Sustainable Dynamic Closed-Loop Supply Chain Network Equilibrium for Collectibles Markets. Comput. Manag. Sci. 2023, 20, 19. [Google Scholar] [CrossRef]
- Ni, L.; Chen, C.; Wang, X.; Chen, X. Modeling Network Equilibrium of Competitive Ride-Sourcing Market with Heterogeneous Transportation Network Companies. Transp. Res. Part C Emerg. Technol. 2021, 130, 103277. [Google Scholar] [CrossRef]
- Xie, S.; Xu, Y.; Zheng, X. On Dynamic Network Equilibrium of a Coupled Power and Transportation Network. IEEE Trans. Smart Grid 2021, 13, 1398–1411. [Google Scholar] [CrossRef]
- Chen, Z.; Deng, Y.; Xie, C.; Guan, C.; Pan, T. Network Equilibrium of Battery Electric Vehicles Considering Drivers’ Resting Behavior. Transp. Res. Part C Emerg. Technol. 2023, 155, 104305. [Google Scholar] [CrossRef]
- Li, C.; Zhang, W.; Yee, H.M.; Yang, B. Optimal Decision of a Disaster Relief Network Equilibrium model. AIMS Math. 2023, 9, 2657–2671. [Google Scholar] [CrossRef]
- Zhang, G.; Zhang, X.; Sun, H.; Zhao, X. Three-Echelon Closed-Loop Supply Chain Network Equilibrium under Cap-and-Trade Regulation. Sustainability 2021, 13, 6472. [Google Scholar] [CrossRef]
- Yang, Y.; Xu, X. Production and Carbon Emission Abatement Decisions Under Different Carbon Policies: Supply Chain Network Equilibrium Models with Consumers’ Low-Carbon Awareness. Int. Trans. Oper. Res. 2023, 31, 2734–2764. [Google Scholar] [CrossRef]
- Xiao, Y.-X.; Zhang, R.-Q. Supply chain Network Equilibrium Considering Coordination Between After-Sale Service and Product Quality. Comput. Ind. Eng. 2022, 175, 108848. [Google Scholar] [CrossRef]
- Peng, Y.; Chen, B.; Veglianti, E. Platform Service Supply Chain Network Equilibrium Model with Data Empowerment. Sustainability 2022, 14, 5419. [Google Scholar] [CrossRef]
Disclaimer/Publisher’s Note: The statements, opinions and data contained in all publications are solely those of the individual author(s) and contributor(s) and not of MDPI and/or the editor(s). MDPI and/or the editor(s) disclaim responsibility for any injury to people or property resulting from any ideas, methods, instructions or products referred to in the content. |
© 2025 by the authors. Licensee MDPI, Basel, Switzerland. This article is an open access article distributed under the terms and conditions of the Creative Commons Attribution (CC BY) license (https://creativecommons.org/licenses/by/4.0/).