Article

Research on the Condition Assessment Method for Marine Diesel Generators Considering the Effects of Fouling and Dust Deposition

1
School of Naval Architecture, Ocean and Energy Power Engineering, Wuhan University of Technology, Wuhan 430063, China
2
School of Mechanical and Electronic Engineering, Wuhan University of Technology, Wuhan 430070, China
*
Author to whom correspondence should be addressed.
Mathematics 2025, 13(23), 3767; https://doi.org/10.3390/math13233767
Submission received: 3 November 2025 / Revised: 20 November 2025 / Accepted: 20 November 2025 / Published: 24 November 2025

Abstract

To address the heat transfer degradation caused by fouling and dust accumulation on the stator windings of marine diesel generators, this study proposes a health condition assessment method based on the convective heat transfer coefficient. A numerical analysis model was developed using the Ansys Fluent platform to systematically investigate the effects of ambient temperature, load power, and fouling layer thickness on the stator winding temperature and convective heat transfer coefficient. The results demonstrate that the convective heat transfer coefficient is highly sensitive to variations in fouling layer thickness. On this basis, a health assessment model centered on the convective heat transfer coefficient was established and validated using experimental data from diesel generator tests. The results show that the proposed model accurately captures the performance degradation process and enables quantitative classification of operating states, including healthy, sub-healthy, degraded, and abnormal conditions. This research provides a feasible theoretical foundation and technical approach for the intelligent monitoring and condition evaluation of marine diesel generators, offering significant engineering value for enhancing the efficiency and reliability of marine power systems.

1. Introduction

1.1. Research Purpose and Significance

The development of intelligent ships relies heavily on the integration and application of advanced technologies such as big data, the Internet of Things, and artificial intelligence within ship systems. A stable and sufficient power supply serves as the fundamental prerequisite and guarantee for achieving such intelligent operations [1,2,3]. Compared with other forms of power generation, marine diesel generators offer notable advantages, including strong fuel adaptability, convenient operation and maintenance, and stable power output. Consequently, they are widely employed in various types of vessels, such as commercial ships, passenger ships, and offshore engineering equipment [4,5].
During load operation of marine diesel generators, the stator windings generate Joule losses due to the electrical current, which are continuously released as heat. This heat is transferred through conduction and convection within the generator components and surrounding air, establishing a stable temperature field.
In the typical operating environment of marine diesel generators, the relative humidity of the air is generally maintained at a high level, particularly under specific maritime weather conditions [6,7]. High-humidity environments significantly accelerate the fouling and dust deposition on the stator windings. On one hand, water molecules in the humid air form a thin film on the winding surface, enhancing the adhesion of suspended particles. On the other hand, this water film acts as an electrolytic medium, promoting the dissolution, migration, and directional deposition of soluble contaminants. Over extended operation, suspended particles and soluble pollutants aggregate and solidify under the mediation of the water film, ultimately forming a dense and complex composite fouling layer on the stator surface. The presence of a composite fouling layer introduces a significant thermal resistance between the stator windings and the environment, substantially reducing convective heat transfer efficiency [8].
Under stable load conditions, the rapid formation and densification of fouling layers in high-humidity environments hinder the convective dissipation of Joule heat generated by the stator windings, leading to a continuous rise in their temperature. As the winding temperature increases, the electrical resistance of the coils rises approximately linearly, which in turn increases the Joule losses, forming a positive feedback loop of “temperature rise ~ resistance increase ~ enhanced Joule loss ~ further temperature rise” [9]. Prolonged operation under elevated temperatures can accelerate insulation aging, cause cracking, and even lead to winding short circuits or burnout, thereby severely compromising the operational reliability and service life of marine diesel generators.
Currently, the reliability maintenance of marine diesel generators predominantly relies on a combined approach of scheduled maintenance and condition-based maintenance. Under this scheme, maintenance is carried out at predetermined intervals, and when the monitored temperature of the stator windings exceeds a predefined threshold, the generator is shut down to clean the outer fouling layer of the windings. However, this approach has limited adaptability: scheduled maintenance cannot account for individual unit differences, and condition-based maintenance is purely a threshold-triggered reactive measure. Consequently, the operational status of the equipment often lags behind its actual degradation process, failing to meet the requirements for early warning and intelligent maintenance [10,11,12,13].
Therefore, for marine diesel generator stator windings, conducting a systematic study on the quantitative relationship and dynamic evolution between fouling layer thickness and convective heat transfer coefficient is a critical prerequisite for overcoming the limitations of current lagging maintenance strategies. By integrating the coupling relationship between fouling thickness and convective heat transfer coefficient with operational monitoring parameters and health assessment methods, a degradation-based state evaluation model can be established. Such a model provides a precise theoretical foundation for the development of intelligent maintenance strategies for marine diesel generators and offers significant engineering value in enhancing operational efficiency and system reliability.

1.2. Related Works

The heat dissipation of diesel generator stator windings primarily relies on forced convection driven by centrifugal fans. Numerical simulation methods, particularly those based on computational fluid dynamics, have been widely applied to investigate the underlying heat transfer mechanisms and to evaluate performance [14,15,16]. Pirooz et al. [17] developed a comprehensive airflow prediction model for axially cooled generators, enabling quantitative estimation of cooling gas flow rates. Hyowon et al. [18] optimized generator coolers based on material thermal properties, balancing corrosion resistance with heat transfer efficiency. Bersch et al. [19] conducted a parametric study using a simplified generator model, proposing a method to optimize heat transfer performance through vent positioning and establishing a quantitative relationship between vent locations and temperature peaks.
Regarding fouling processes and their impact on heat transfer efficiency, Han et al. [20] simulated particle deposition under turbulent flow conditions, demonstrating the applicability of a coupled Eulerian model for predicting particle deposition in pipes and fouling on heat transfer surfaces. Berce et al. [8] systematically investigated crystallization fouling in heat exchangers and its mechanisms affecting heat transfer performance. Inamdar et al. [21], through experimental studies on finned heat exchangers, found that dust deposition significantly reduces the heat transfer coefficient and quantitatively analyzed the associated performance degradation rate.
In summary, significant progress has been made in CFD-based modeling and in understanding the mechanisms by which fouling and dust accumulation impair heat transfer efficiency. However, existing numerical models have not yet fully elucidated the quantitative relationship between stator winding fouling thickness and convective heat transfer coefficients, nor have the findings been applied to the operational health assessment of generators.

1.3. Innovation and Contribution

To enhance the maintenance and operational reliability of generator systems under complex working conditions, this study investigates the impact of fouling thickness gradients on convective heat transfer performance and proposes a health state assessment method based on the convective heat transfer coefficient. The main innovations of this work are as follows:
(1)
A numerical analysis model was developed that comprehensively considers the dynamic evolution of fouling and its effect on convective heat transfer performance, revealing the quantitative relationship between stator winding fouling thickness, stator temperature, and convective heat transfer coefficient under different operating conditions.
(2)
Based on the analysis of the degradation process of generator convective heat transfer performance, a health state assessment model was established, using the convective heat transfer coefficient as the criterion for defining the health state space, thereby enabling accurate evaluation of the generator’s operational condition.
The remainder of this paper is organized as follows: Section 2 analyzes the effects of different combinations of ambient temperature and load power on the relationship between fouling thickness and convective heat transfer coefficient; Section 3 defines the health state space of the generator based on the convective heat transfer coefficient and proposes the assessment model; Section 4 compares and discusses the numerical results with experimental data; Section 5 summarizes the main conclusions and outlines future research directions.

2. Numerical Analysis Model

2.1. Three-Dimensional Model

As the core device for electromechanical energy conversion, a generator system consists of the stator, rotor, bearings, centrifugal fan, excitation system, and rotating rectifier assembly, among other components. During the construction of a three-dimensional model, the high geometric complexity poses significant challenges for full-scale modeling, including difficulties in handling geometric topology and conflicts between mesh resolution and computational efficiency.
Based on computational fluid dynamics and heat transfer theory, sensitivity analysis and multi-physics simulations indicate that components such as bearing supports, the rotating rectifier assembly, and the electrical control cabinet have a relatively minor influence on the internal flow field and convective heat transfer performance of the stator windings. To balance model accuracy and computational efficiency, a model simplification strategy was adopted in accordance with similarity theory and the principle of equivalent substitution. Key geometric features and boundary conditions were retained, while the rotating rectifier assembly was treated as a modular equivalent, bearing supports were simplified as mechanical constraint boundaries, and the electrical control cabinet was represented as a thermal wall boundary. The resulting three-dimensional digital model of the generator is shown in Figure 1.
Assuming the fouling layer is continuous and uniform, and that the heat conduction can be approximated as one-dimensional steady-state, the thermal resistance of the fouling layer can be expressed as shown in Equation (1).
R f = δ k f
In the above equation, R f denotes the equivalent thermal resistance of the fouling layer, k f represents the thermal conductivity of the fouling material, and δ is the equivalent thickness of the fouling layer.
Due to the lack of direct measurements of fouling layer thickness on generator stator windings in the literature, this study employs a parametric approach to estimate the equivalent thickness. The method is based on thermal resistance network theory, treating the fouling layer as a one-dimensional steady-state thermal resistance with an equivalent thickness and thermal conductivity. By considering realistic contamination levels and material properties, this approach effectively captures the impact of fouling deposition on the thermal performance of the stator windings.
Under severe contamination, the equivalent thermal resistance of the fouling layer can reach 5 × 10 4   m 2 · K / W , while dense fouling composed of oil, dust, and salt crystals can have a thermal conductivity up to 1.0   W / m · K . Based on these values, the fouling layer thickness is considered within the range of 0     μ m , 500     μ m , covering conditions from light to heavy contamination and low to high thermal conductivity. Figure 1a–f illustrate the 3D models of stator coils enveloped by fouling layers of different thicknesses.

2.2. Numerical Simulation

2.2.1. Boundary Conditions

In the numerical simulation of convective heat transfer in generator stator coils, a pressure-based steady-state solver was employed. To accurately represent the flow characteristics in the open space, the inlet and outlet were specified as a pressure inlet and pressure outlet, respectively.
For the heat transfer boundaries, the surfaces of the stator coils and fouling layers were modeled as no-slip walls. The internal heat generation of the coils was simulated as a volumetric heat source to represent the Joule heating effect. The interface between the coils and fouling layer was set as a thermal coupling boundary to ensure continuous heat flux transfer across the interface. The outer surface of the fouling layer was defined as a convective heat transfer boundary, with surface roughness incorporated to determine the equivalent thermal resistance using empirical correlations.
During initialization, the entire domain was set to the ambient temperature as the initial condition. Boundary conditions were maintained constant throughout the iterative solution to ensure consistency between the simulation parameters and actual operating conditions.

2.2.2. Mesh Generation and Sensitivity Analysis

To accurately capture the physical characteristics of both the solid stator coil structure and the surrounding airflow under different fouling layer thicknesses, an unstructured meshing technique was employed to discretize the computational domain.
According to boundary layer theory and the characteristics of turbulent fluctuations, when air flows through key regions such as the inlet, cooling ducts, and outlet, geometric discontinuities and variations in flow constraints can induce flow separation, vortex formation, and boundary layer thickness changes. Driven by the centrifugal fan’s rotation, the airflow exhibits a typical forced convection pattern, resulting in steep gradients in the velocity, pressure, and temperature fields.
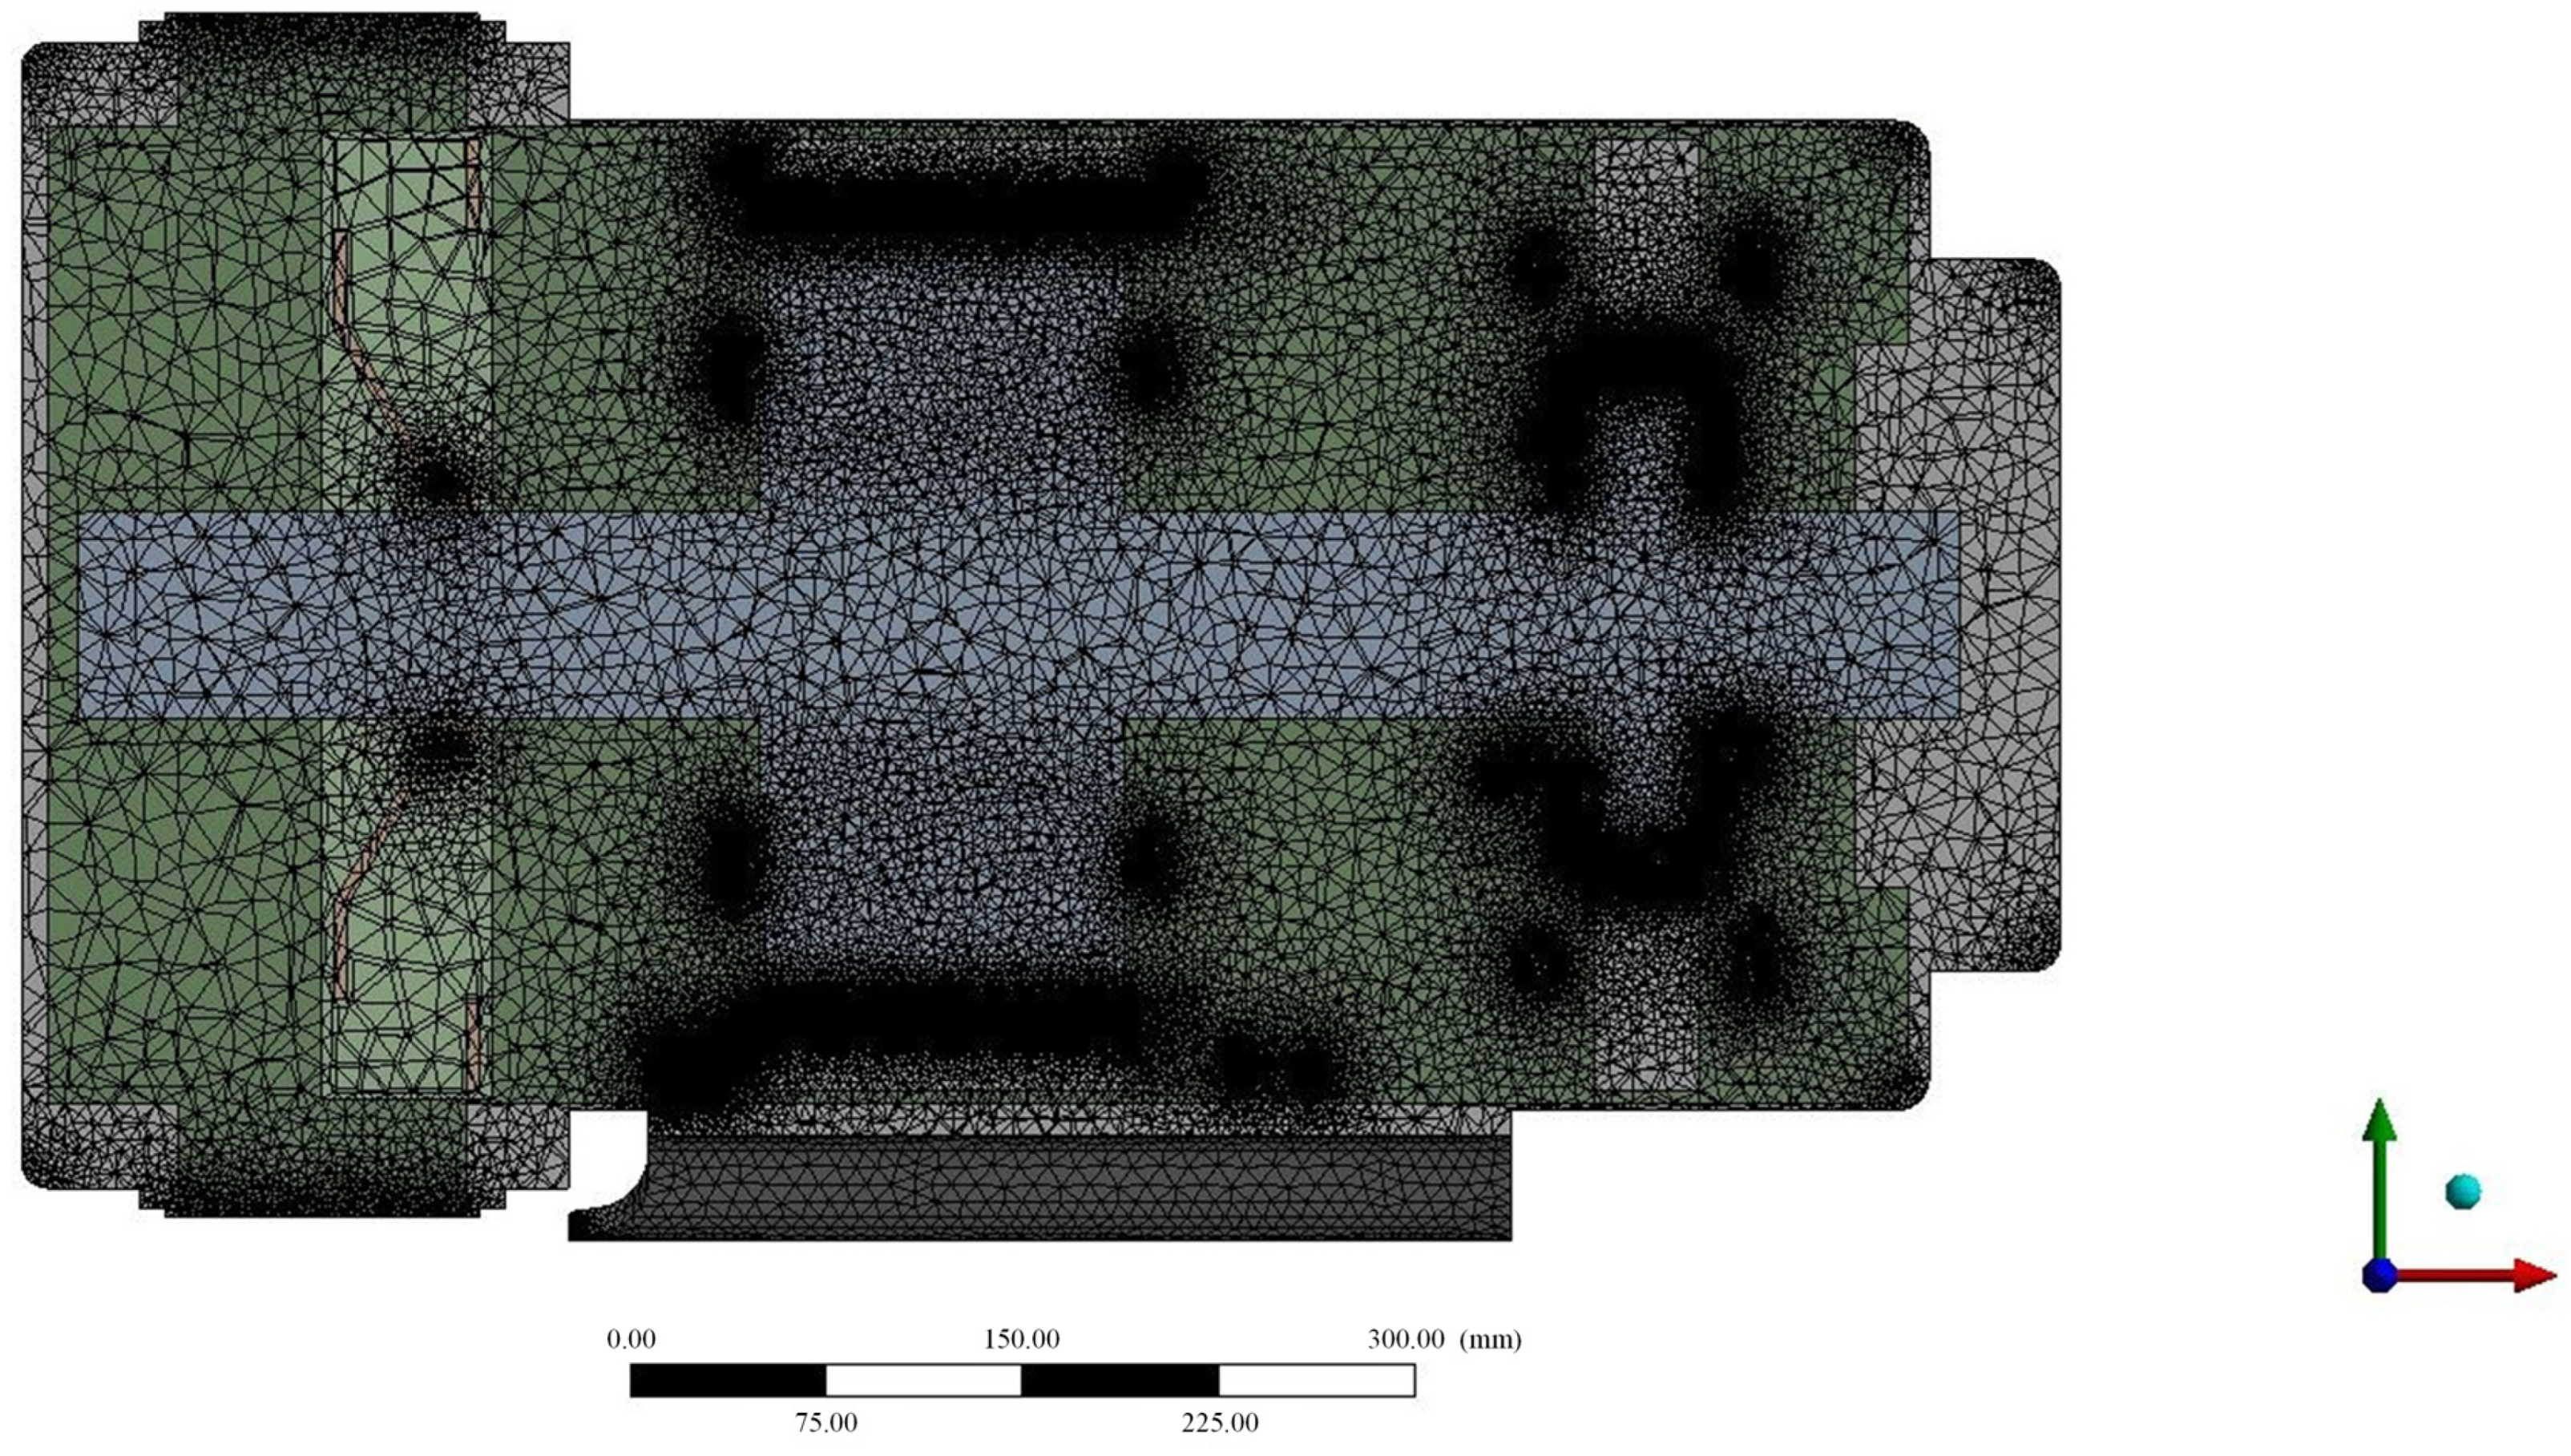
To effectively resolve the velocity and temperature gradients within the turbulent boundary layer and to accurately describe the complex heat transfer coupling between the fluid and solid domains, local mesh refinement using tetrahedral elements was applied to these critical flow regions and adjacent solid walls. Figure 2 illustrates the internal cross-sectional mesh distribution of the generator.
According to the principles of mesh sensitivity analysis in computational fluid dynamics, a progressive mesh refinement approach was adopted to balance computational accuracy and efficiency. For the six three-dimensional models described above, this method was applied to determine the optimal mesh configuration, as summarized in Table 1.
In this section, the S S T   k ω model is employed. Under consistent boundary conditions, computational domains with varying mesh element counts are discretized to investigate the influence of mesh density on simulation results.
As the primary heat-generating component of the generator system, the stator coil’s convective heat transfer performance is evaluated using the Nusselt number as the key criterion for mesh sensitivity analysis.
N u = h · l λ
In Equation (2), N u denotes the Nusselt number, h represents the convective heat transfer coefficient, l is the characteristic length, and λ refers to the thermal conductivity of the fluid.
h = P S _ C u A · T
In Equation (3), P S _ C u represents the copper loss power of the stator winding, A denotes the heat transfer area, and T is the temperature difference between the stator winding and the ambient environment.
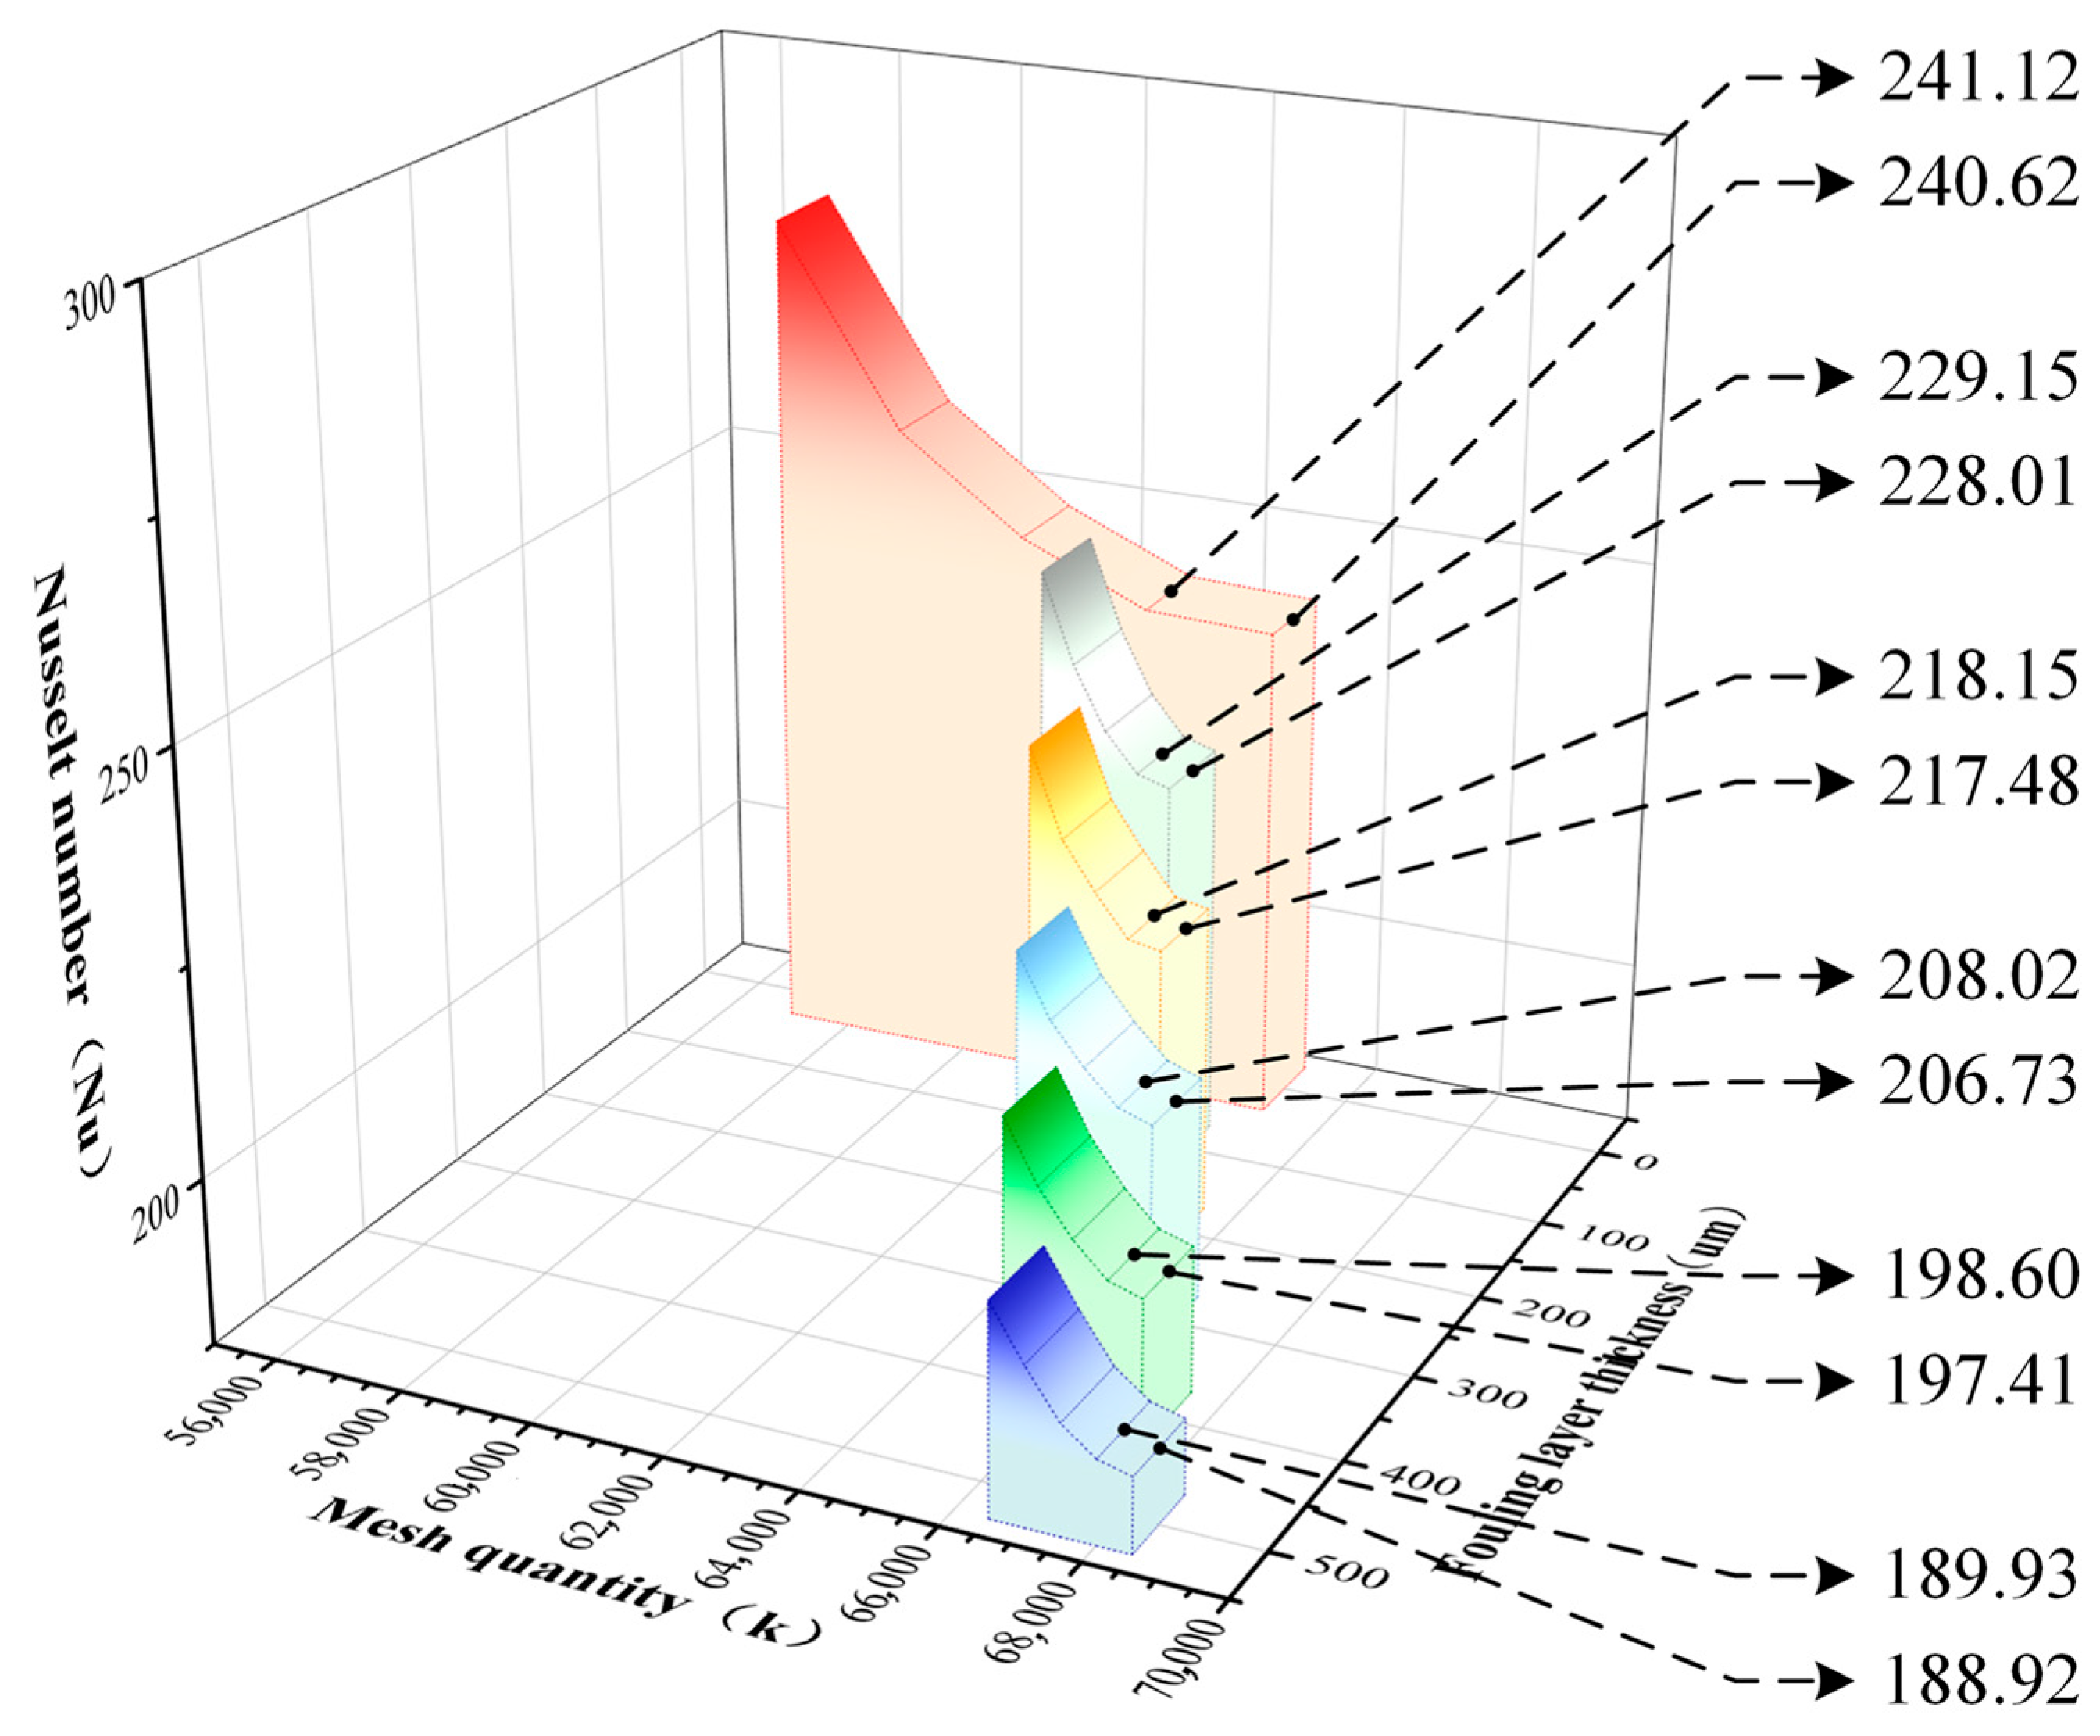
Figure 3 illustrates the results of the mesh sensitivity analysis. For models with fouling layer thicknesses of 0 μm, 100 μm, 200 μm, 300 μm, 400 μm, 500 μm, the calculated values exhibited an asymptotic convergence trend when the mesh numbers reached 63,000 k, 64,000 k, 65,000 k, 66,000 k, 67,000 k, 68,000 k, respectively. At this point, the turbulent boundary layer within the computational domain was effectively resolved. Further mesh refinement resulted in fluctuation amplitudes of less than 1%, which, according to the theory of mesh convergence, satisfies the accuracy requirements for numerical simulations in the field of engineering thermophysics.
Considering both computational accuracy and efficiency, this study adopted the above mesh configurations 63,000 k to 68,000 k elements for the six models with fouling thicknesses ranging from 0 μm to 500 μm, to conduct a detailed numerical analysis of the generator’s convective heat transfer characteristics.

2.2.3. Viscous Model and Accuracy Verification

In the thermal simulation of a diesel generator housing, it is essential to comprehensively consider the capability of the viscosity model to characterize wall heat transfer, rotational flow, and complex turbulent structures.
When alternating current flows through the stator windings, significant copper losses are generated. The narrow flow channels surrounding the stator core result in locally high heat flux densities, where the Reynolds number lies within the transitional regime, and temperature gradients are primarily concentrated within the thermal boundary layer. The intricate geometry of the windings and stator core subjects the boundary layer to a periodic adverse pressure gradient, inducing flow separation and reattachment, thereby altering the local heat transfer characteristics. Moreover, the strong turbulence driven by the centrifugal fan exhibits pronounced anisotropy under the influence of the radial pressure gradient, making the traditional isotropic assumption inadequate for accurate flow characterization.
Consequently, the appropriate selection of a viscosity model is critical to reliably capturing the flow field characteristics and ensuring the accuracy of the numerical simulation.
The flow of air as a fluid follows the principles of mass, momentum, and energy conservation. For turbulent flow, the additional transport effects caused by turbulence fluctuations must be described using appropriate turbulence transport equations.
Mass conservation states that the increase in mass within a fluid element over a unit time is equal to the net mass flowing into the element during the same time interval. The mass conservation equation is given in Equation (4).
ρ t + ρ u x + ρ v y + ρ w z = 0
In this equation, ρ denotes the fluid density, t represents time, and u   , v   , and w are the velocity components in the x   , y , and z directions, respectively.
Momentum conservation indicates that the rate of change of momentum within a fluid element is equal to the sum of all external forces acting on it. The momentum conservation equations are shown in Equation (5).
ρ u t + ρ u   u x + ρ u   v y + ρ u   w z = x μ u x + y μ u y + z μ u z p x + F x ρ v t + ρ v   u x + ρ v   v y + ρ v   w z = x μ v x + y μ v y + z μ v z p y + F y ρ w t + ρ w   u x + ρ w   v y + ρ w   w z = x μ w x + y μ w y + z μ w z p z + F z
In the above equations, p represents the pressure acting on the fluid element, μ is the dynamic viscosity, and F x   , F y   , and F z denote the body forces applied to the fluid element.
Energy conservation states that the rate of increase in energy within a fluid element is equal to the net heat flux entering the element plus the work done on the element by body forces and surface forces. The energy conservation equation is given in Equation (6).
ρ T t + ρ u T x + ρ v T y + ρ w T z = S T + x k c p T x + y k c p T y + z k c p T z
In the above equations, T denotes the thermodynamic temperature, k is the thermal conductivity of the fluid, c p represents the specific heat capacity, and S T is the viscous dissipation term.
In a three-dimensional Cartesian coordinate system, the general governing equations of the S S T   k ω model consist of the transport equations for the turbulent kinetic energy ( k ) and the specific dissipation rate ( ω ). The governing equations for k and ω are expressed as Equation (7).
k t + U i k x i = 1 ρ x j μ + μ t σ k k x j + 1 ρ P k β * k ω ω t + U i ω x i = 1 ρ x j μ + μ t σ ω ω x j + 1 ρ P ω β ω 2 + 2 1 F 1 σ ω 2 1 ω k x j ω x j
In the above equations, k t and ω t represent the time-dependent terms, describing the temporal variations of k and ω , respectively. The terms U i k x i and U i ω x i denote the convective terms, which describe the transport processes of k and ω due to fluid motion.
The source term representing “production” is denoted by S P   , and the production terms for the turbulent kinetic energy k and the specific dissipation rate ω are given in Equation (8).
S P , k = 1 ρ P k S P , ω = 1 ρ P ω
The source term representing “dissipation” is denoted by S D   , and the dissipation terms for k and ω are presented in Equation (9).
S D , k = β * k ω S D , ω = β ω 2 + 2 1 F 1 σ ω 2 1 ω k x j ω x j
The symbol D   denotes the diffusion term, and the diffusion terms for k and ω are shown in Equation (10).
D k = 1 ρ x j μ + μ t σ k k x j D ω = 1 ρ x j μ + μ t σ ω ω x j
The S S T   k ω model incorporates the advantages of both the k ω and k ε models through the introduction of the blending function F 1 . Near the wall, it behaves like the k ω model, while in the free-stream region, it approaches the k ε model.
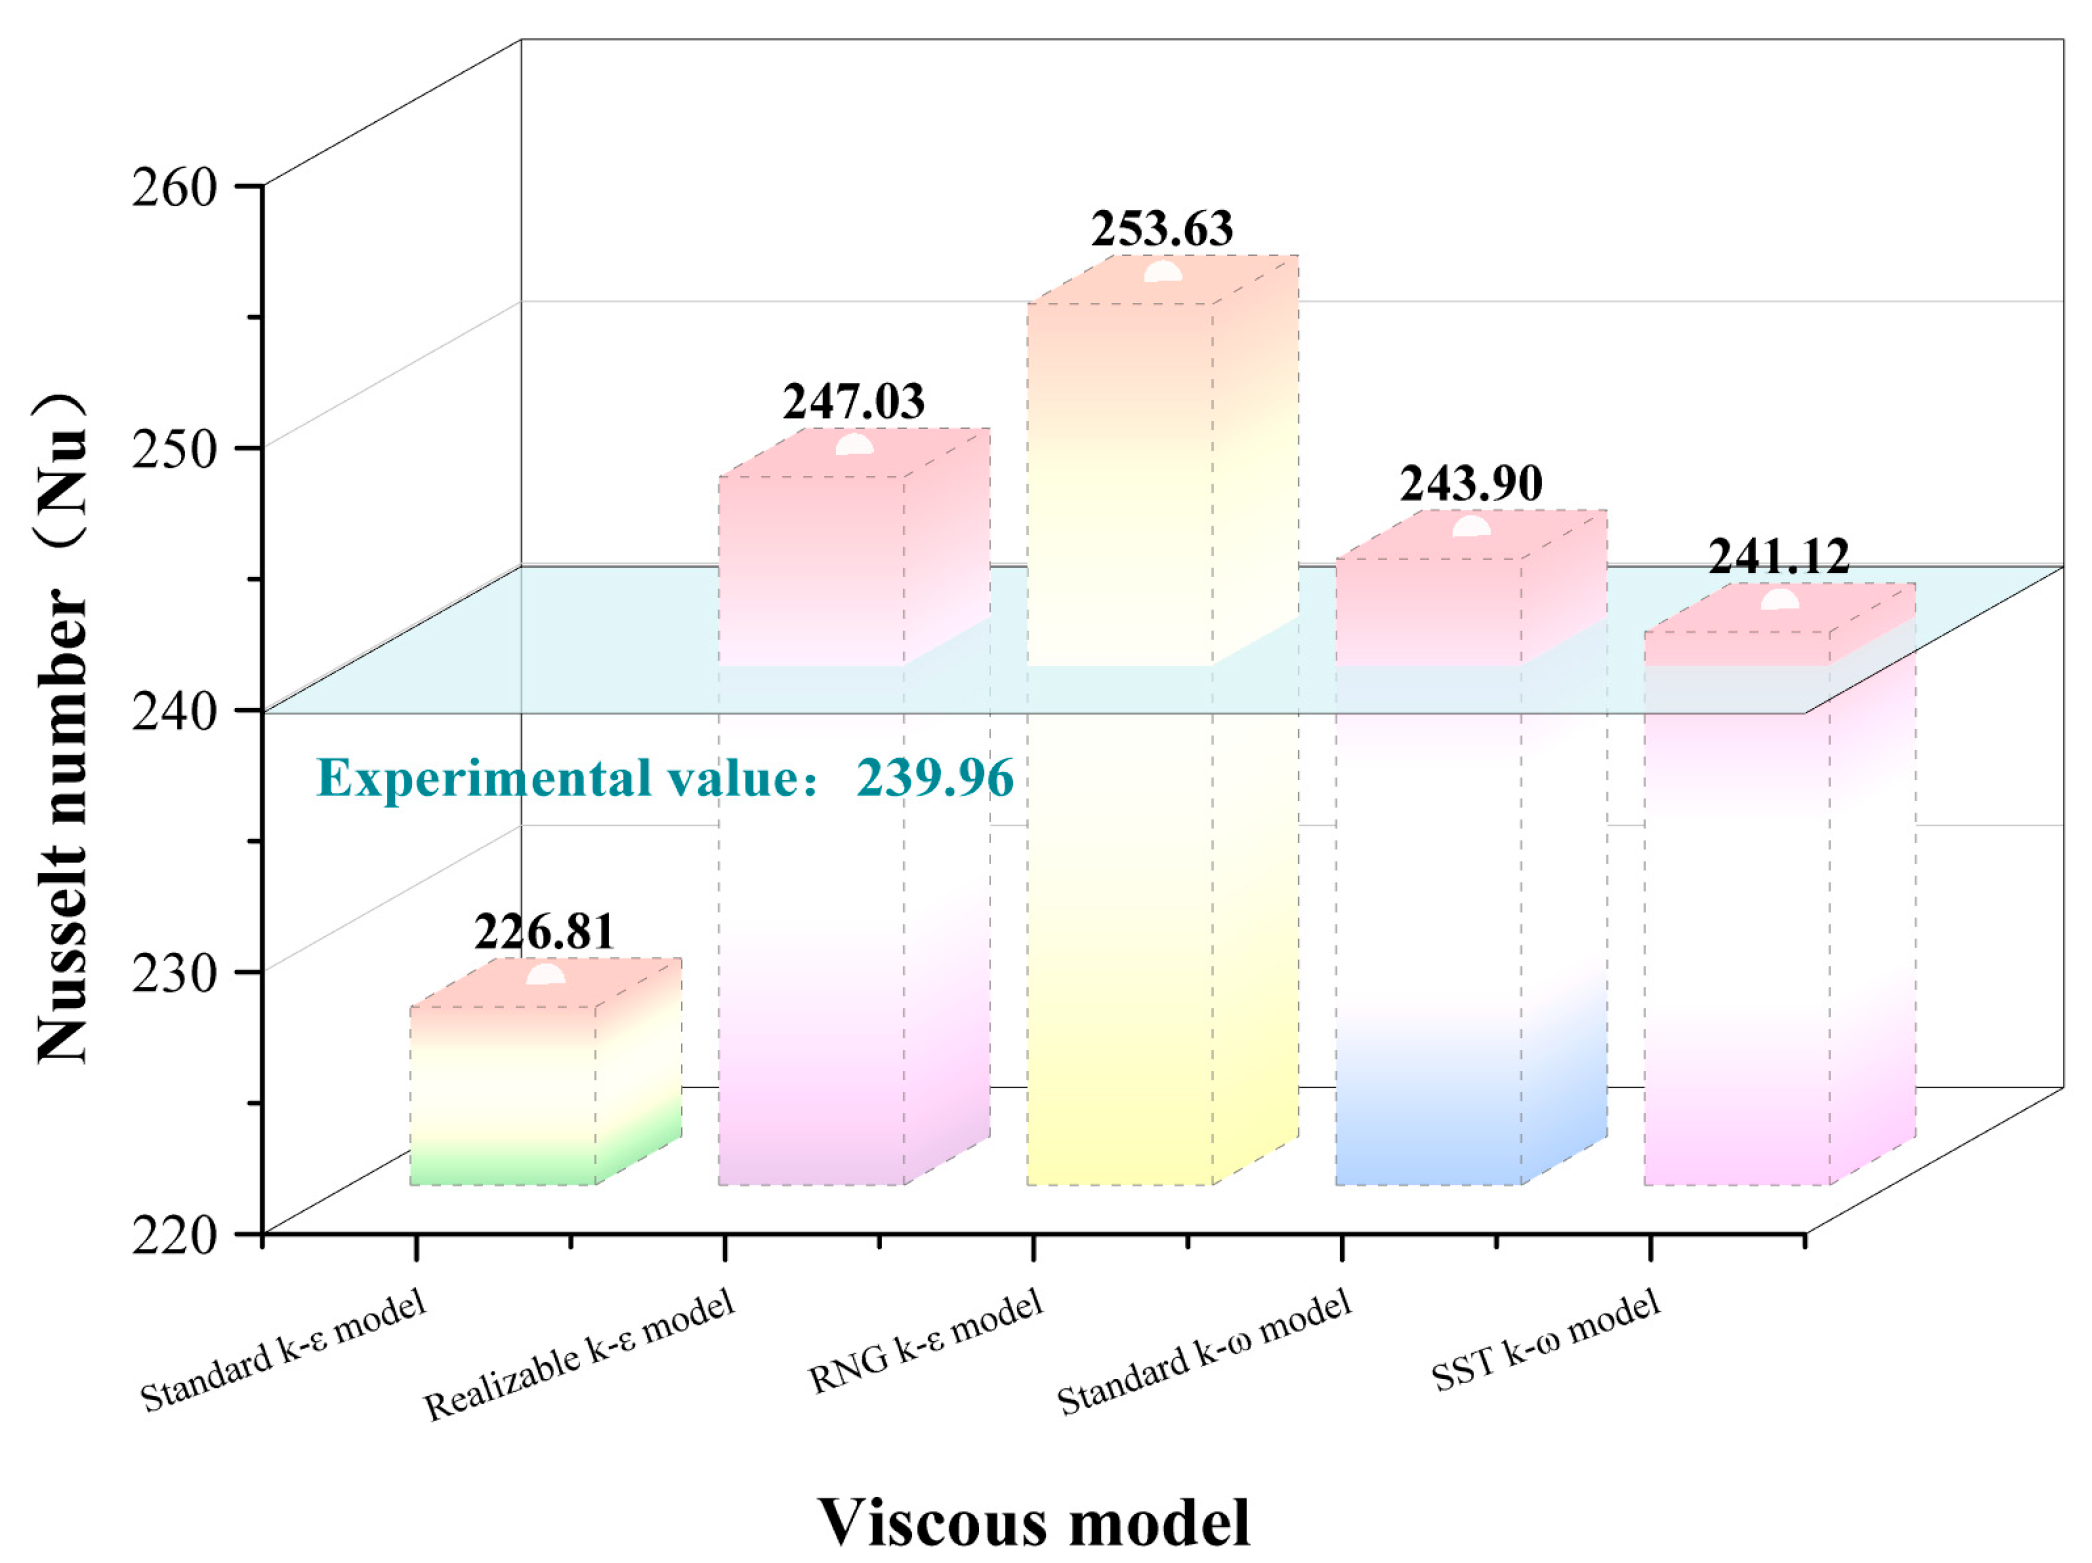
To verify the applicability of the S S T   k ω model in the numerical analysis of convective heat transfer characteristics of the generator, five turbulence models—namely, the standard k ε model, Realizable k ε model, RNG k ε model, standard k ω model, and SST k ω model—were employed for comparative analysis. Under the operating condition of an ambient temperature of 25 °C and a load power of 60 KW, a discretization scheme with 6.3 million mesh elements was adopted to ensure the consistency of boundary conditions. The accuracy of each turbulence model was verified, and the numerical results were compared with experimental data obtained under the same conditions, as illustrated in Figure 4.
Through quantitative comparison of the numerical results from different turbulence models with experimental data, the S S T   k ω model demonstrated the highest predictive accuracy, fully confirming its suitability and reliability for the numerical simulation of convective heat transfer characteristics in generator stator windings.

2.3. Simulation Results

Using the technical parameters of a representative brushless AC synchronous generator, the numerical analysis of the stator coil’s convective heat transfer performance was performed. The stator coil is made of pure copper, features H-class insulation, and the three-phase windings are configured in a star connection. The generator is rated at 400 V, 108 A, 1500 rpm, and 60 kW, with a standby power of 64 kW and a power factor of 0.8. The detailed parameters are summarized in Table 2.
To systematically investigate the effect of varying fouling layer thickness on the convective heat transfer characteristics of generator stator coils, numerical analyses were conducted using the Ansys Fluent platform. During the simulations, the turbulence model, boundary conditions, and operating parameters were kept constant. Six different discretization schemes were employed to quantitatively analyze the influence of fouling thickness on the convective heat transfer coefficient.
For the numerical analysis of the stator coil’s convective heat transfer performance, the ambient temperature is selected to represent typical real-world operating conditions. Relevant standards specify that the generator must continuously supply rated power within an ambient temperature range of 25 °C to 45 °C. The load level is varied from 50% to 100%, corresponding to 30~60 kW.
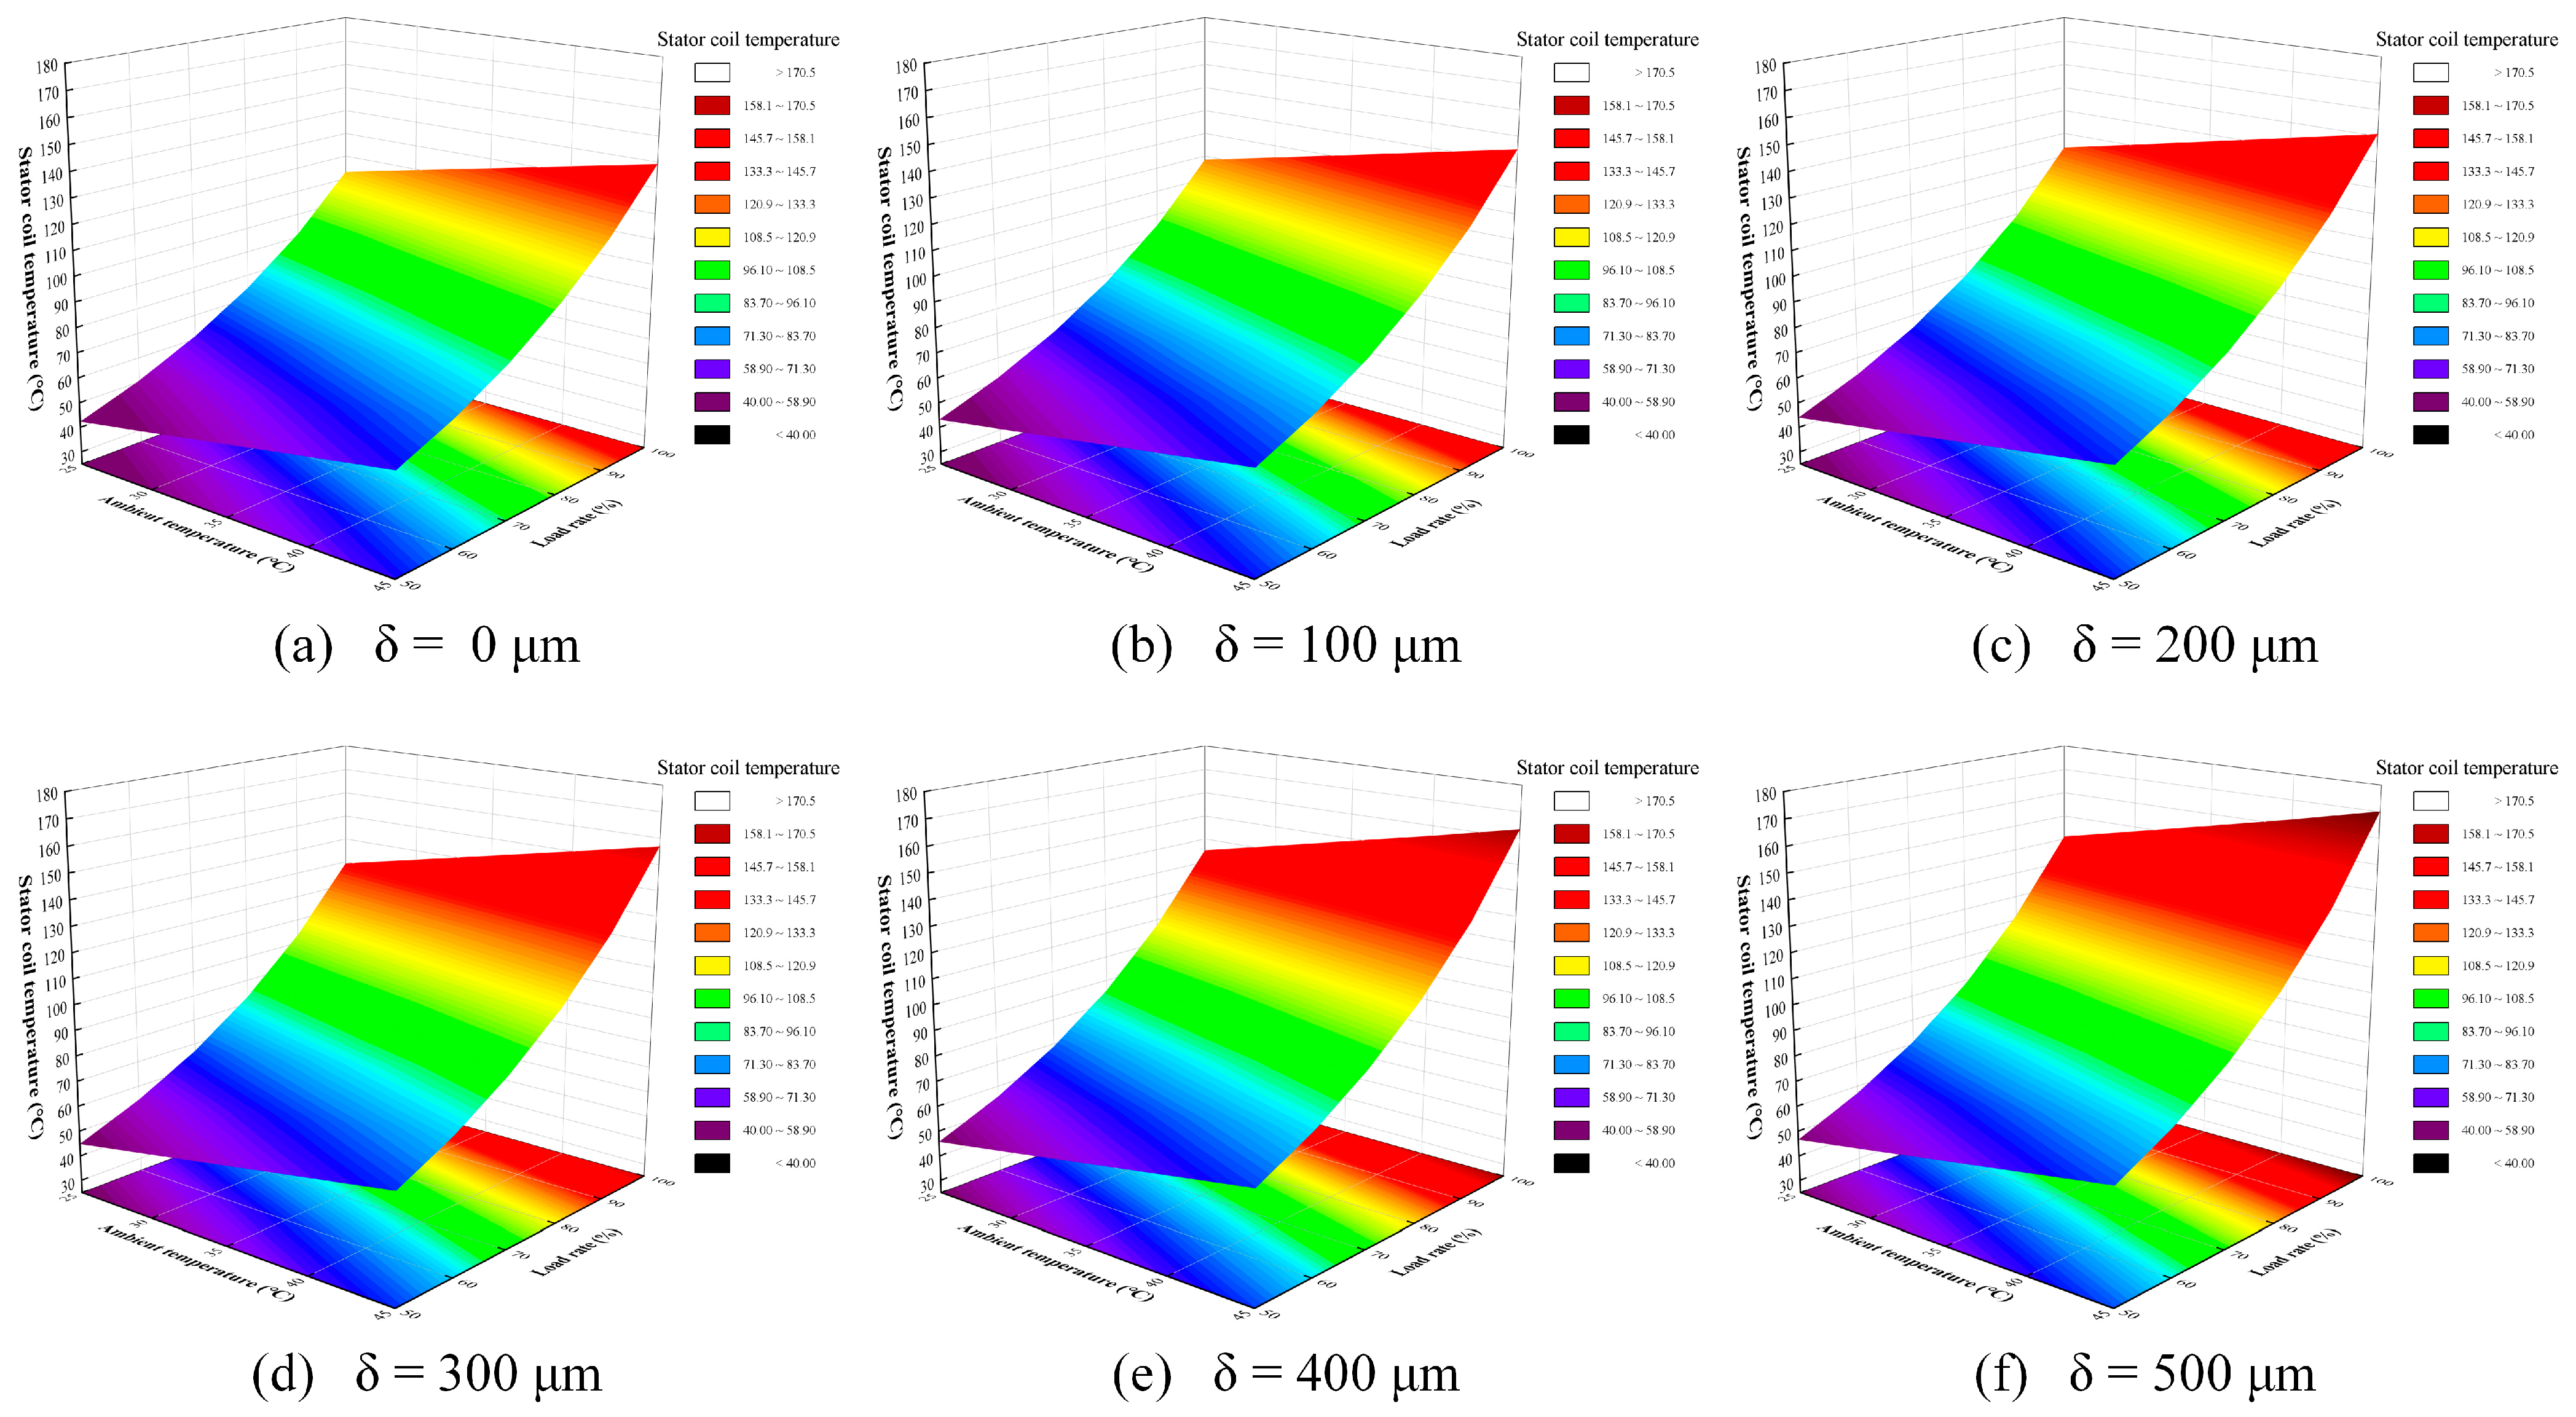
Figure 5 illustrates the temperature variation of the stator coil under different fouling layer thicknesses of 0 μm, 100 μm, 200 μm, 300 μm, 400 μm, 500 μm, corresponding to the respective environmental temperatures and load conditions.
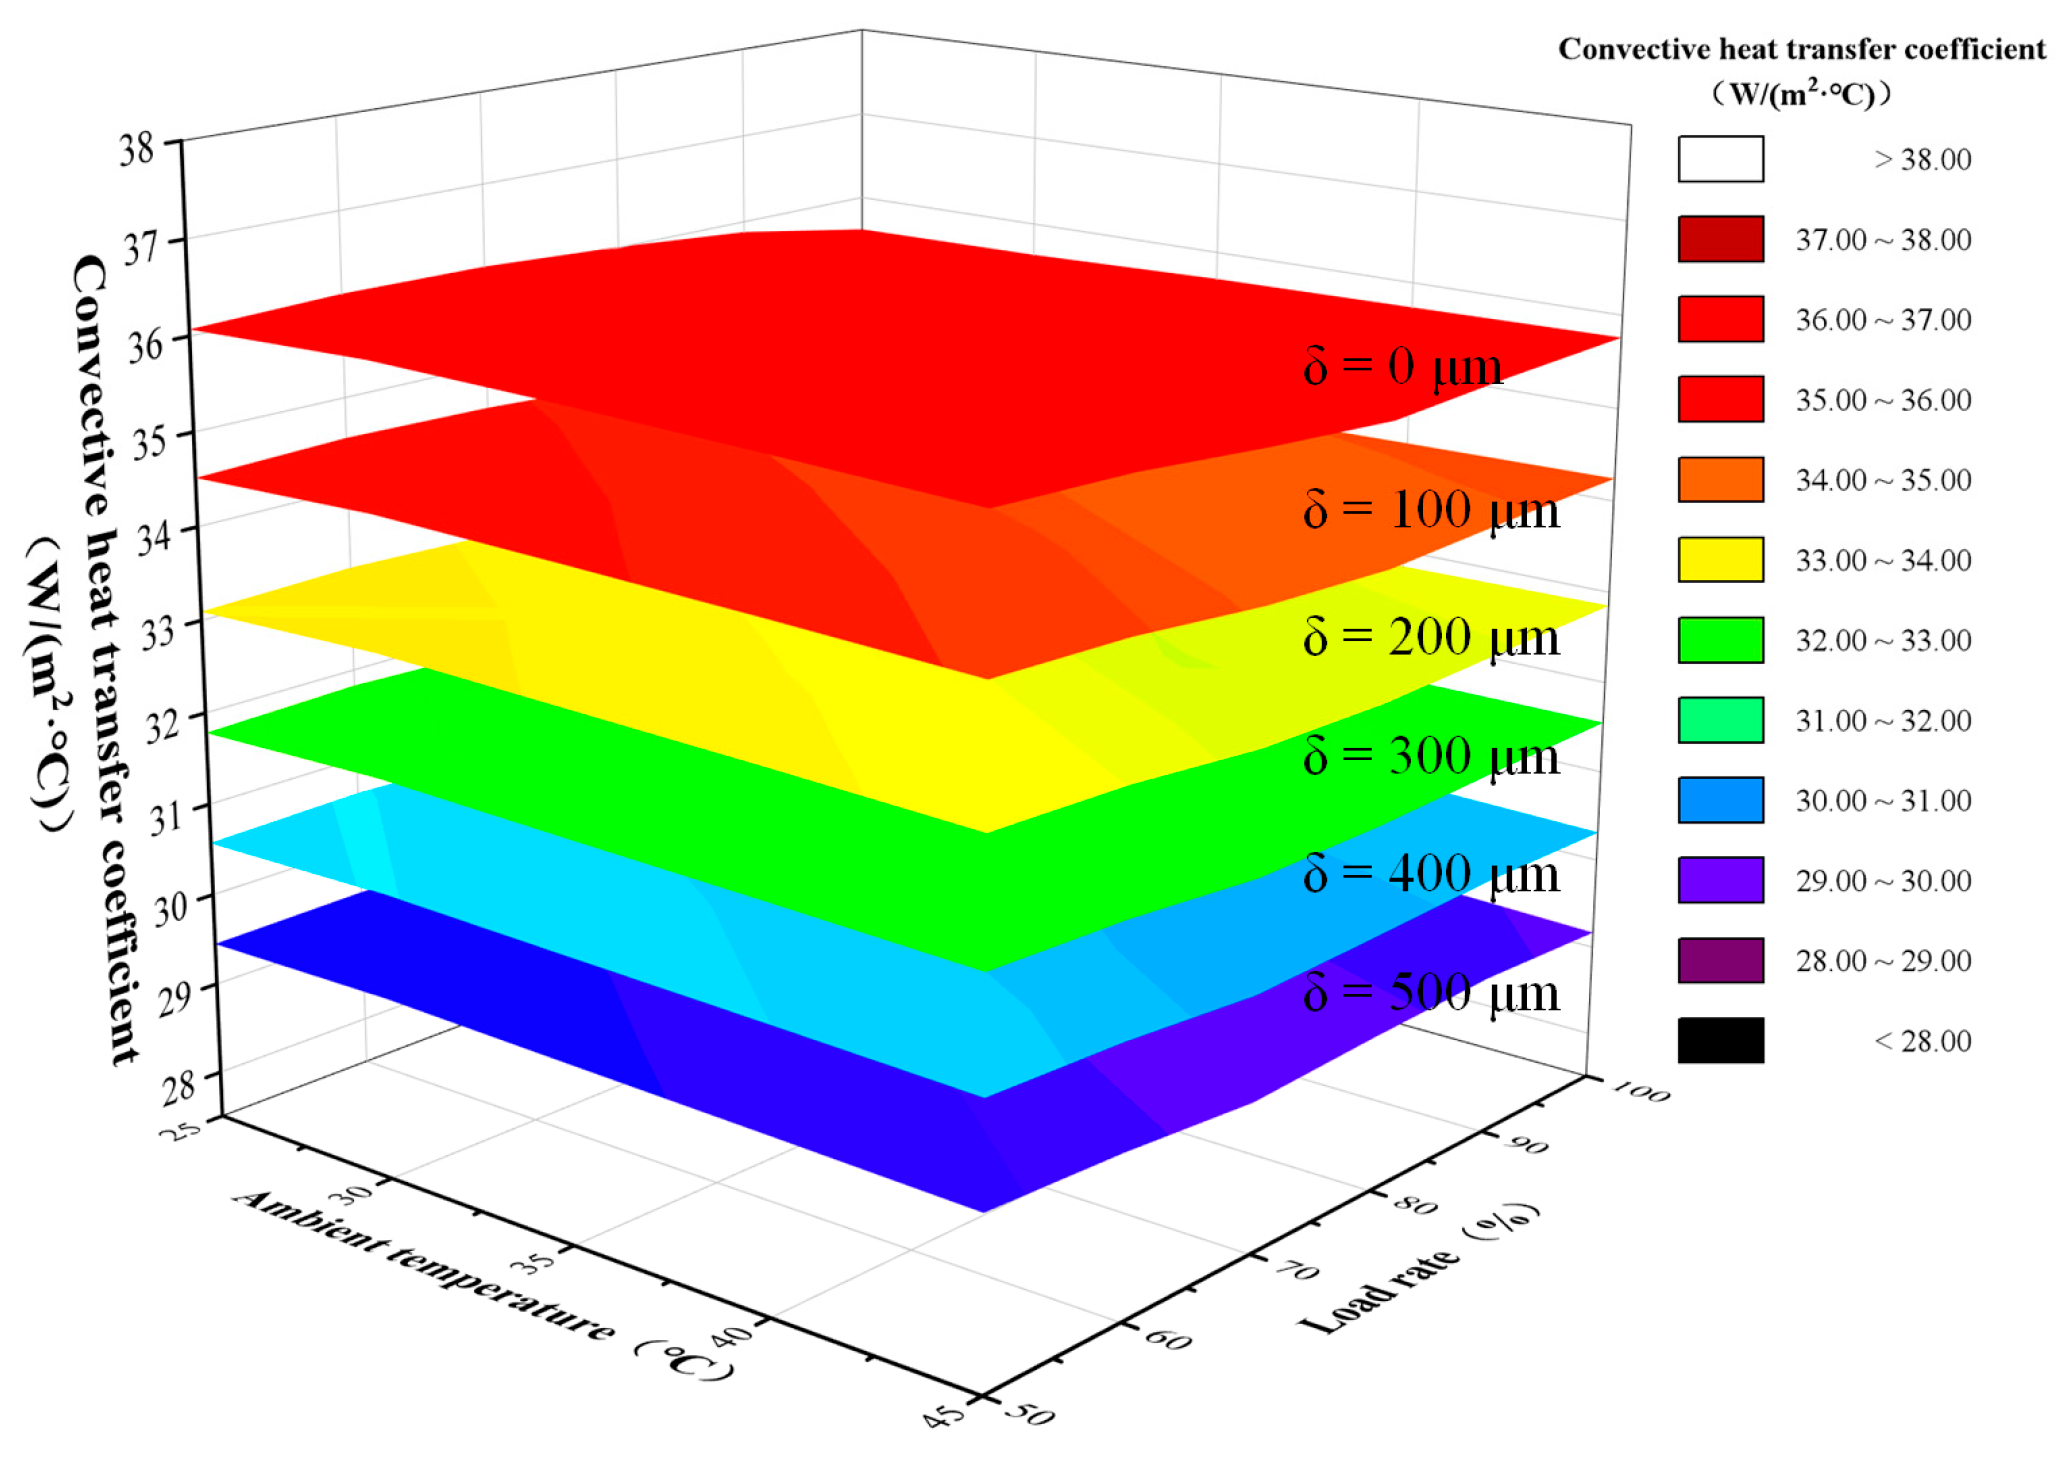
Based on Equation (3), the data were analyzed and processed to establish the quantitative relationship between fouling thickness and the convective heat transfer coefficient, as shown in Figure 6.
As the fouling-layer thickness increases, the stator winding temperature increases significantly while the convective heat transfer coefficient decreases.
Under the extreme operating condition (ambient temperature of 45 °C and load power of 60 kW), the maximum stator winding temperatures corresponding to fouling-layer thicknesses of 0 μm, 100 μm, 200 μm, 300 μm, 400 μm, 500 μm are 139.30 °C, 144.97 °C, 150.81 °C, 156.92 °C, 163.43 °C, and 170.17 °C, respectively, representing an overall increase of approximately 22.16%. The ranges of the average convective heat transfer coefficients decrease from 36.13   W / m 2 · to 29.11   W / m 2 · as the fouling layer grows from 0   μ m to 500   μ m , corresponding to a reduction of about 19.43%.
Based on the numerical simulation results under multiple models and operating conditions, the following observations can be summarized:
(1)
The stator coil temperature is primarily influenced by the environmental temperature and load power. The environmental temperature sets the baseline of the convective heat transfer, while an increase in load power strengthens the internal heat generation of the stator coil, thereby raising its maximum temperature.
(2)
Under the same environmental temperature and load conditions, an increase in fouling layer thickness significantly elevates the stator coil temperature, indicating that fouling amplifies the coupled effect of environmental temperature and load power on temperature rise.
(3)
When the fouling layer thickness is fixed, the convective heat transfer coefficient varies only slightly with environmental temperature and load power but exhibits a clear stratification pattern, demonstrating its high sensitivity to fouling thickness.

3. State Evaluation Model

3.1. Analysis of State Parameters

The diesel generator system, as a typical “mechanical—electrical—fluid” multi-physics coupled system, involves mechanical transmission, electromagnetic induction, and fluid heat transfer during operation, exhibiting strong coupling characteristics.
On one hand, the system contains numerous interdependent operating parameters, and their dynamic interactions are complex, making traditional univariate analysis insufficient to accurately characterize the overall health state of the system. On the other hand, raw data obtained from real-time monitoring cannot directly reflect performance degradation patterns or the evolutionary characteristics of different degradation stages.
Therefore, it is necessary to systematically analyze the dynamic behavior and mutual interactions of key operating parameters based on the underlying multi-physics coupling mechanisms and to establish a health assessment model that quantitatively describes the evolution of the generator’s operational state, enabling precise evaluation of equipment performance.
During generator operation, the input power P i n of the system is expressed by Equation (11):
P i n = T · n 9550
In the above equation, T and n denote the torque and rotational speed, respectively.
The electromagnetic power on the stator side, P e m , is expressed by Equation (12):
P e m = P o u t + P S _ C u
In the above equation, P o u t represents the output power. For a three-phase AC generator, the output power can be expressed as Equation (13):
P o u t = 3 · V L · I L · cos φ
In this equation, V L , I L , and cos φ denote the line voltage, line current, and power factor, respectively.
According to the law of energy conservation, the following relationship holds:
P i n = P e m + P F e + P R _ C u + P E x c i t a t i o n + P M e c h i n e
In the above equation, P F e , P R _ C u , P E x c i t a t i o n , and P M e c h i n e represent the iron loss, rotor coil copper loss, excitation power, and mechanical loss, respectively. When the generator operates at zero load, the sum of these four components equals the input power.
The monitored parameters of the generator system include torque, rotational speed, line voltage, line current, ambient temperature, and stator coil temperature. Therefore, the health state parameter set at any given time i can be expressed as:
H i = Τ i , n i , V L i , I L i , T a m b i e n t i , T c o i l i

3.2. Division of Health State Ranges

During long-term operation of a diesel generator, the continuous accumulation of fouling and dust layers on the stator coil surface significantly increases thermal resistance, reduces convective heat transfer efficiency, and leads to elevated coil temperatures. This, in turn, accelerates insulation degradation, decreases electromagnetic efficiency, and triggers other multi-physics coupled deterioration effects.
For the generator system, different levels of convective heat transfer efficiency can be considered as corresponding to distinct health states. In this study, the convective heat transfer coefficient is selected as the health evaluation metric to quantitatively describe the deviation of the generator system from its ideal healthy state. A lower convective heat transfer coefficient indicates a higher degree of system performance degradation.
Previously, under varying ambient temperatures and load conditions, numerical simulations were conducted for multiple fouling thicknesses to analyze the stator coil temperature distribution and corresponding convective heat transfer coefficients. These analyses systematically reveal the quantitative relationship between fouling thickness and the convective heat transfer coefficient, as expressed in Equation (16).
h = 35.60 ~ 36.13               δ = 0   μ m 34.09 ~ 34.57     δ = 100   μ m 32.69 ~ 33.14     δ = 200   μ m 31.40 ~ 31.83     δ = 300   μ m 30.23 ~ 30.61     δ = 400   μ m 29.11 ~ 29.47     δ = 500   μ m
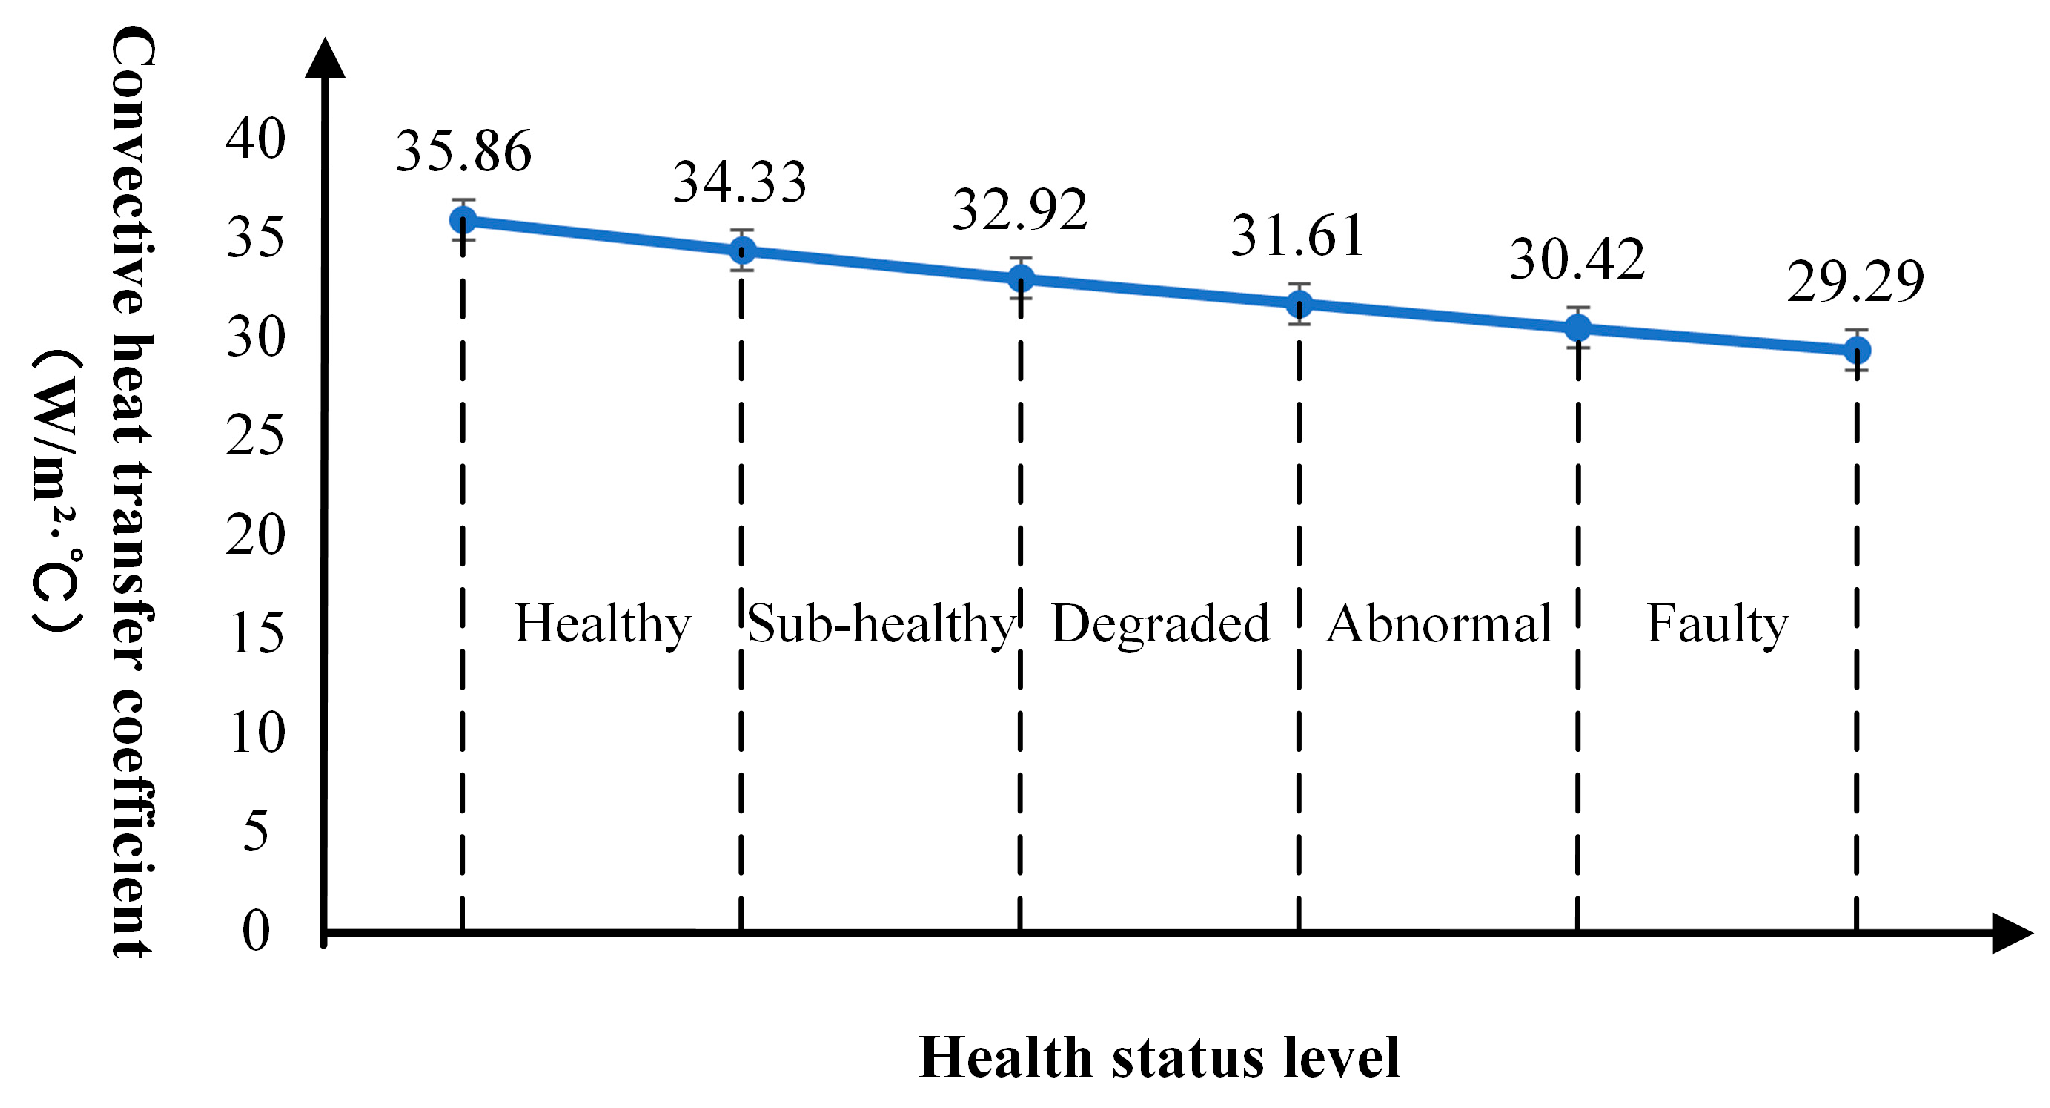
The health status of the generator system is divided into five levels: Healthy, Sub-healthy, Degraded, Abnormal, and Faulty, as shown in Figure 7. In the Healthy and Sub-healthy states, the generator can operate normally without approaching performance limits. In the Degraded and Abnormal states, maintenance plans should be proposed and executed in a timely manner. When the system is assessed as being in the Fault state, immediate shutdown and inspection are required.

3.3. State Assessment Workflow

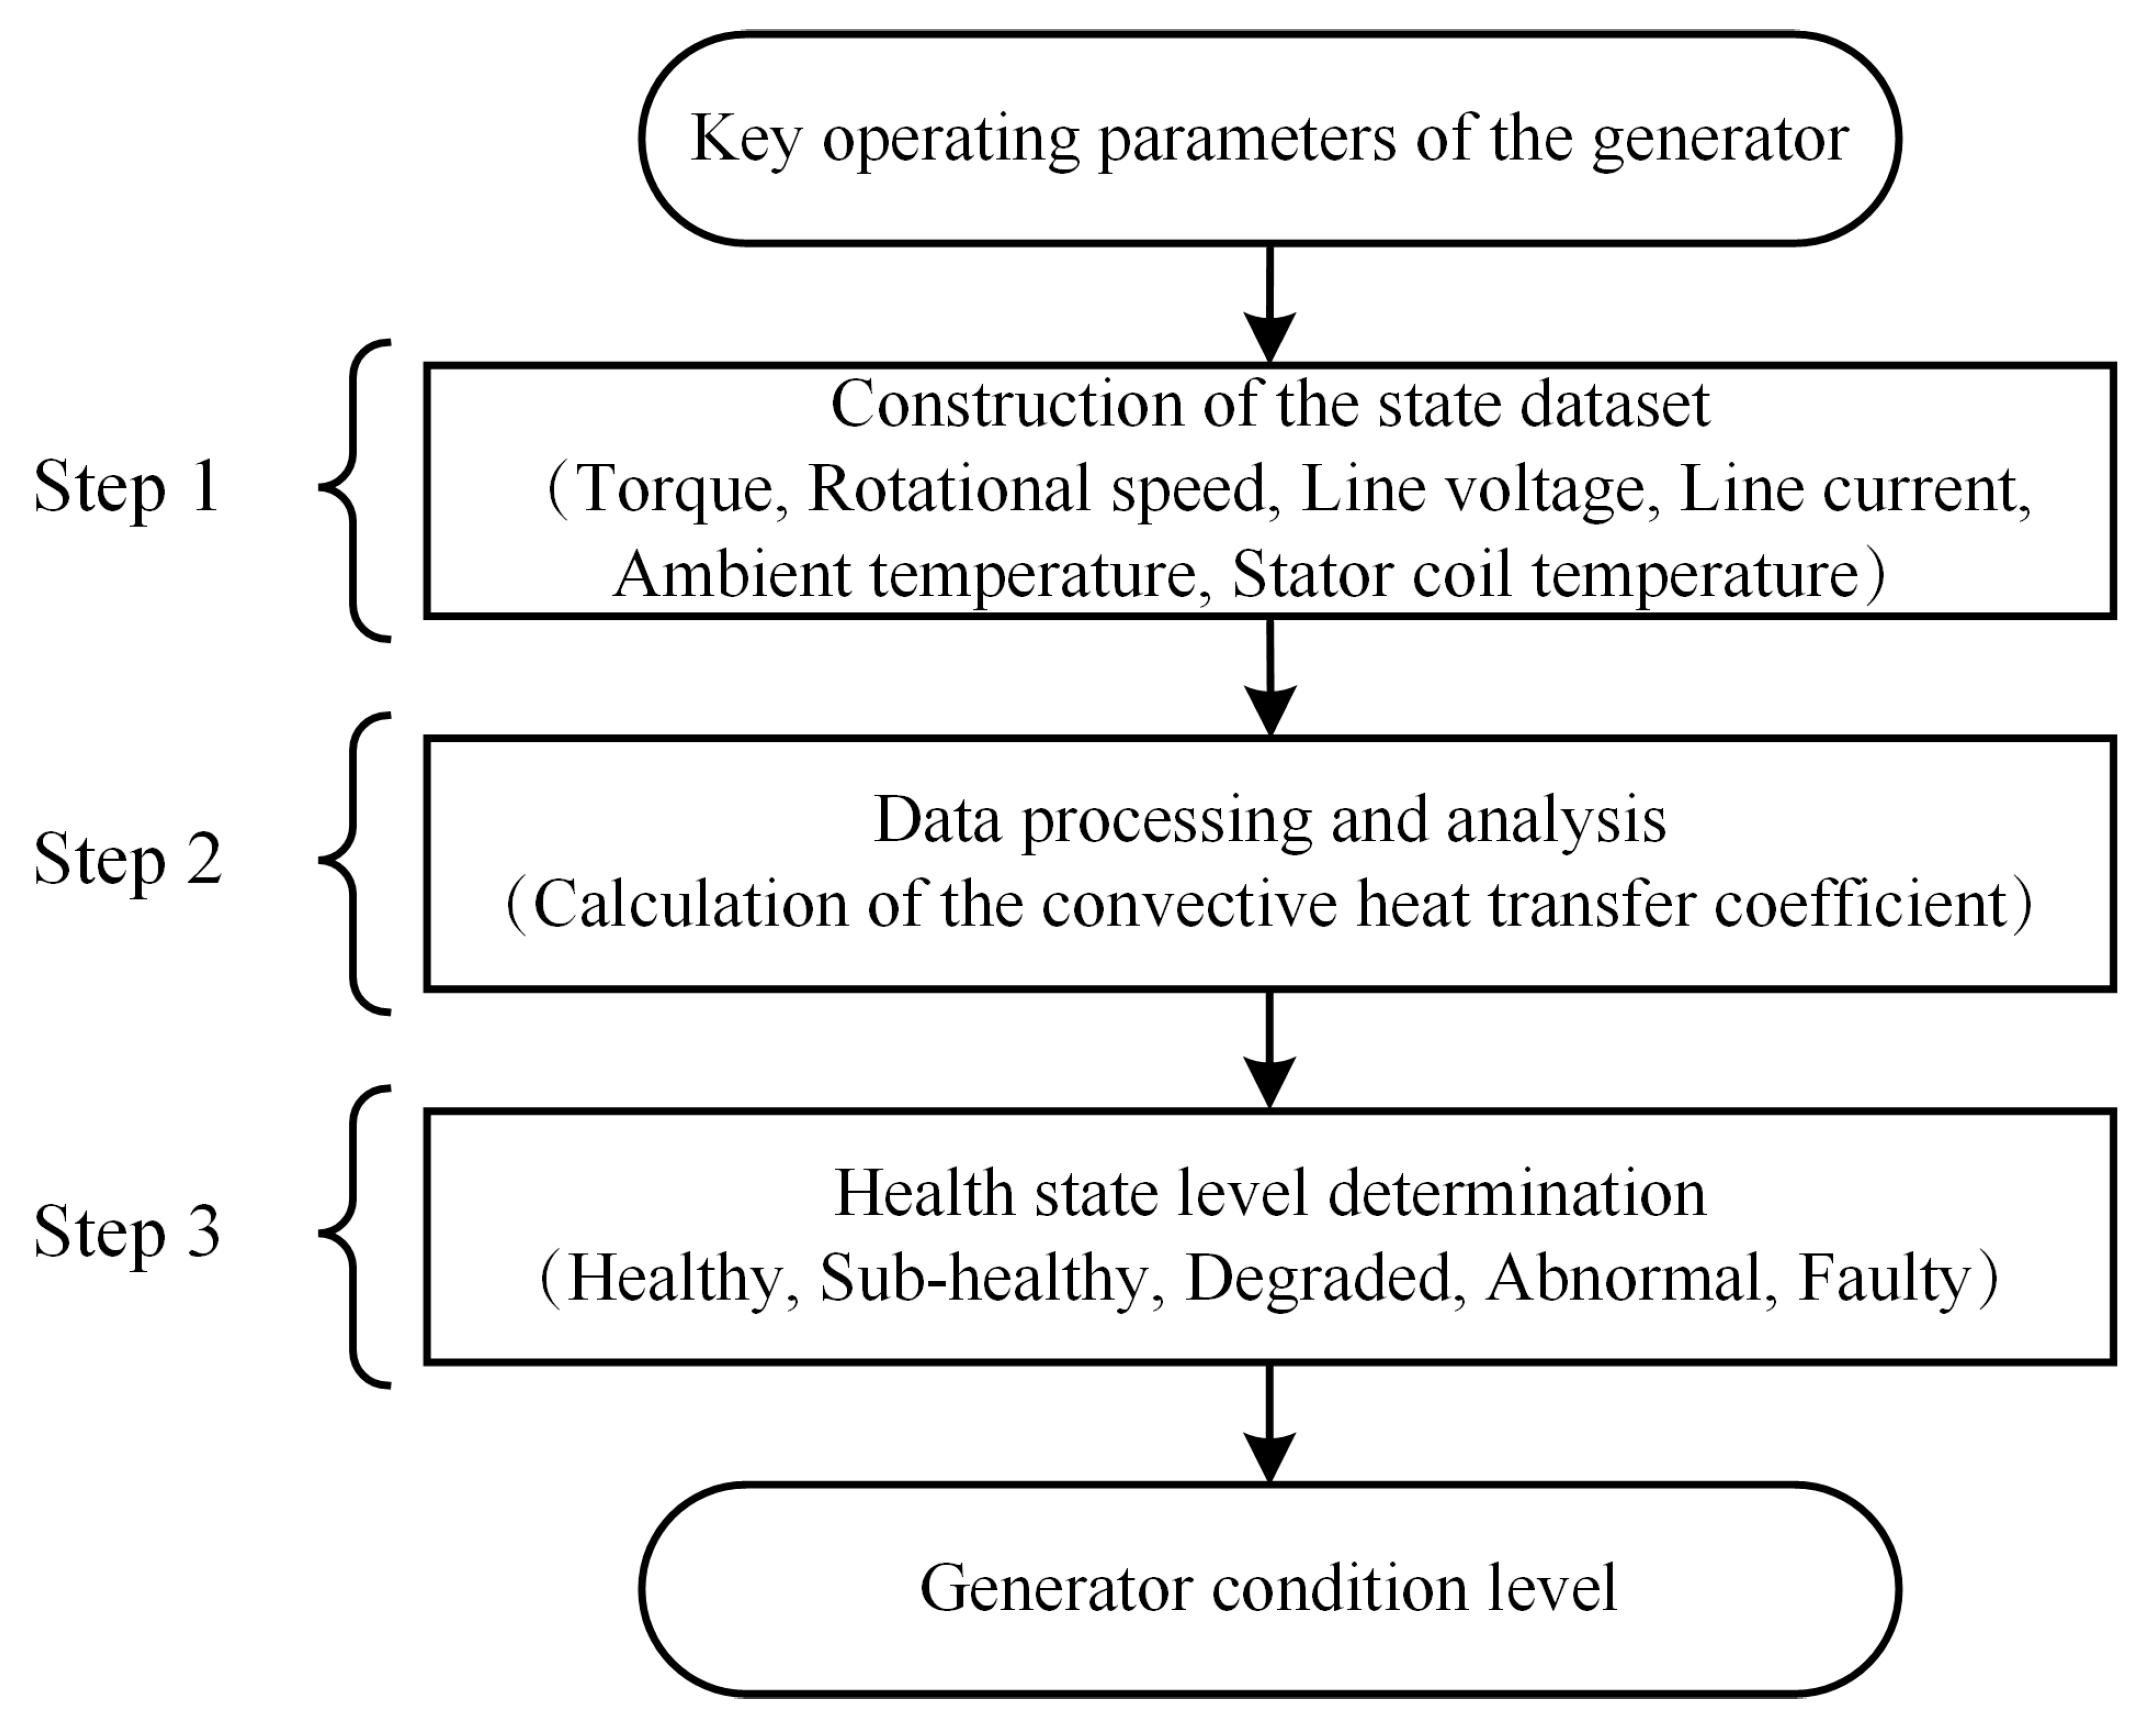
Real-time monitoring and accurate assessment of the generator system’s convective heat transfer status provide critical theoretical support and data reference for the scientific formulation of maintenance strategies. The state evaluation process is illustrated in Figure 8 and consists of the following steps:
Step 1: Construction of the state dataset
Using high-precision measurement instruments, key operational parameters of the generator—including torque, rotational speed, line voltage, line current, ambient temperature, and stator coil temperature—are collected. The acquired data are then organized into a systematic state dataset, providing the foundational information for health assessment.
Step 2: Data processing and analysis
Based on Equations (3) and (5)–(8), the state dataset is processed and analyzed to calculate the stator coil convective heat transfer coefficient under the given operating conditions. This enables the quantification of the generator’s convective heat transfer performance.
Step 3: Determination of health status level
The calculated convective heat transfer coefficient is mapped to the predefined health status levels to determine the real-time health condition of the generator system. Maintenance and operational strategies can then be formulated accordingly.

4. Results and Discussion

4.1. Experiments

To validate the scientific basis and effectiveness of the proposed generator health state evaluation method, several representative time points within the diesel generator’s cleaning and maintenance cycle were selected for monitoring and experimental assessment of operational parameters.
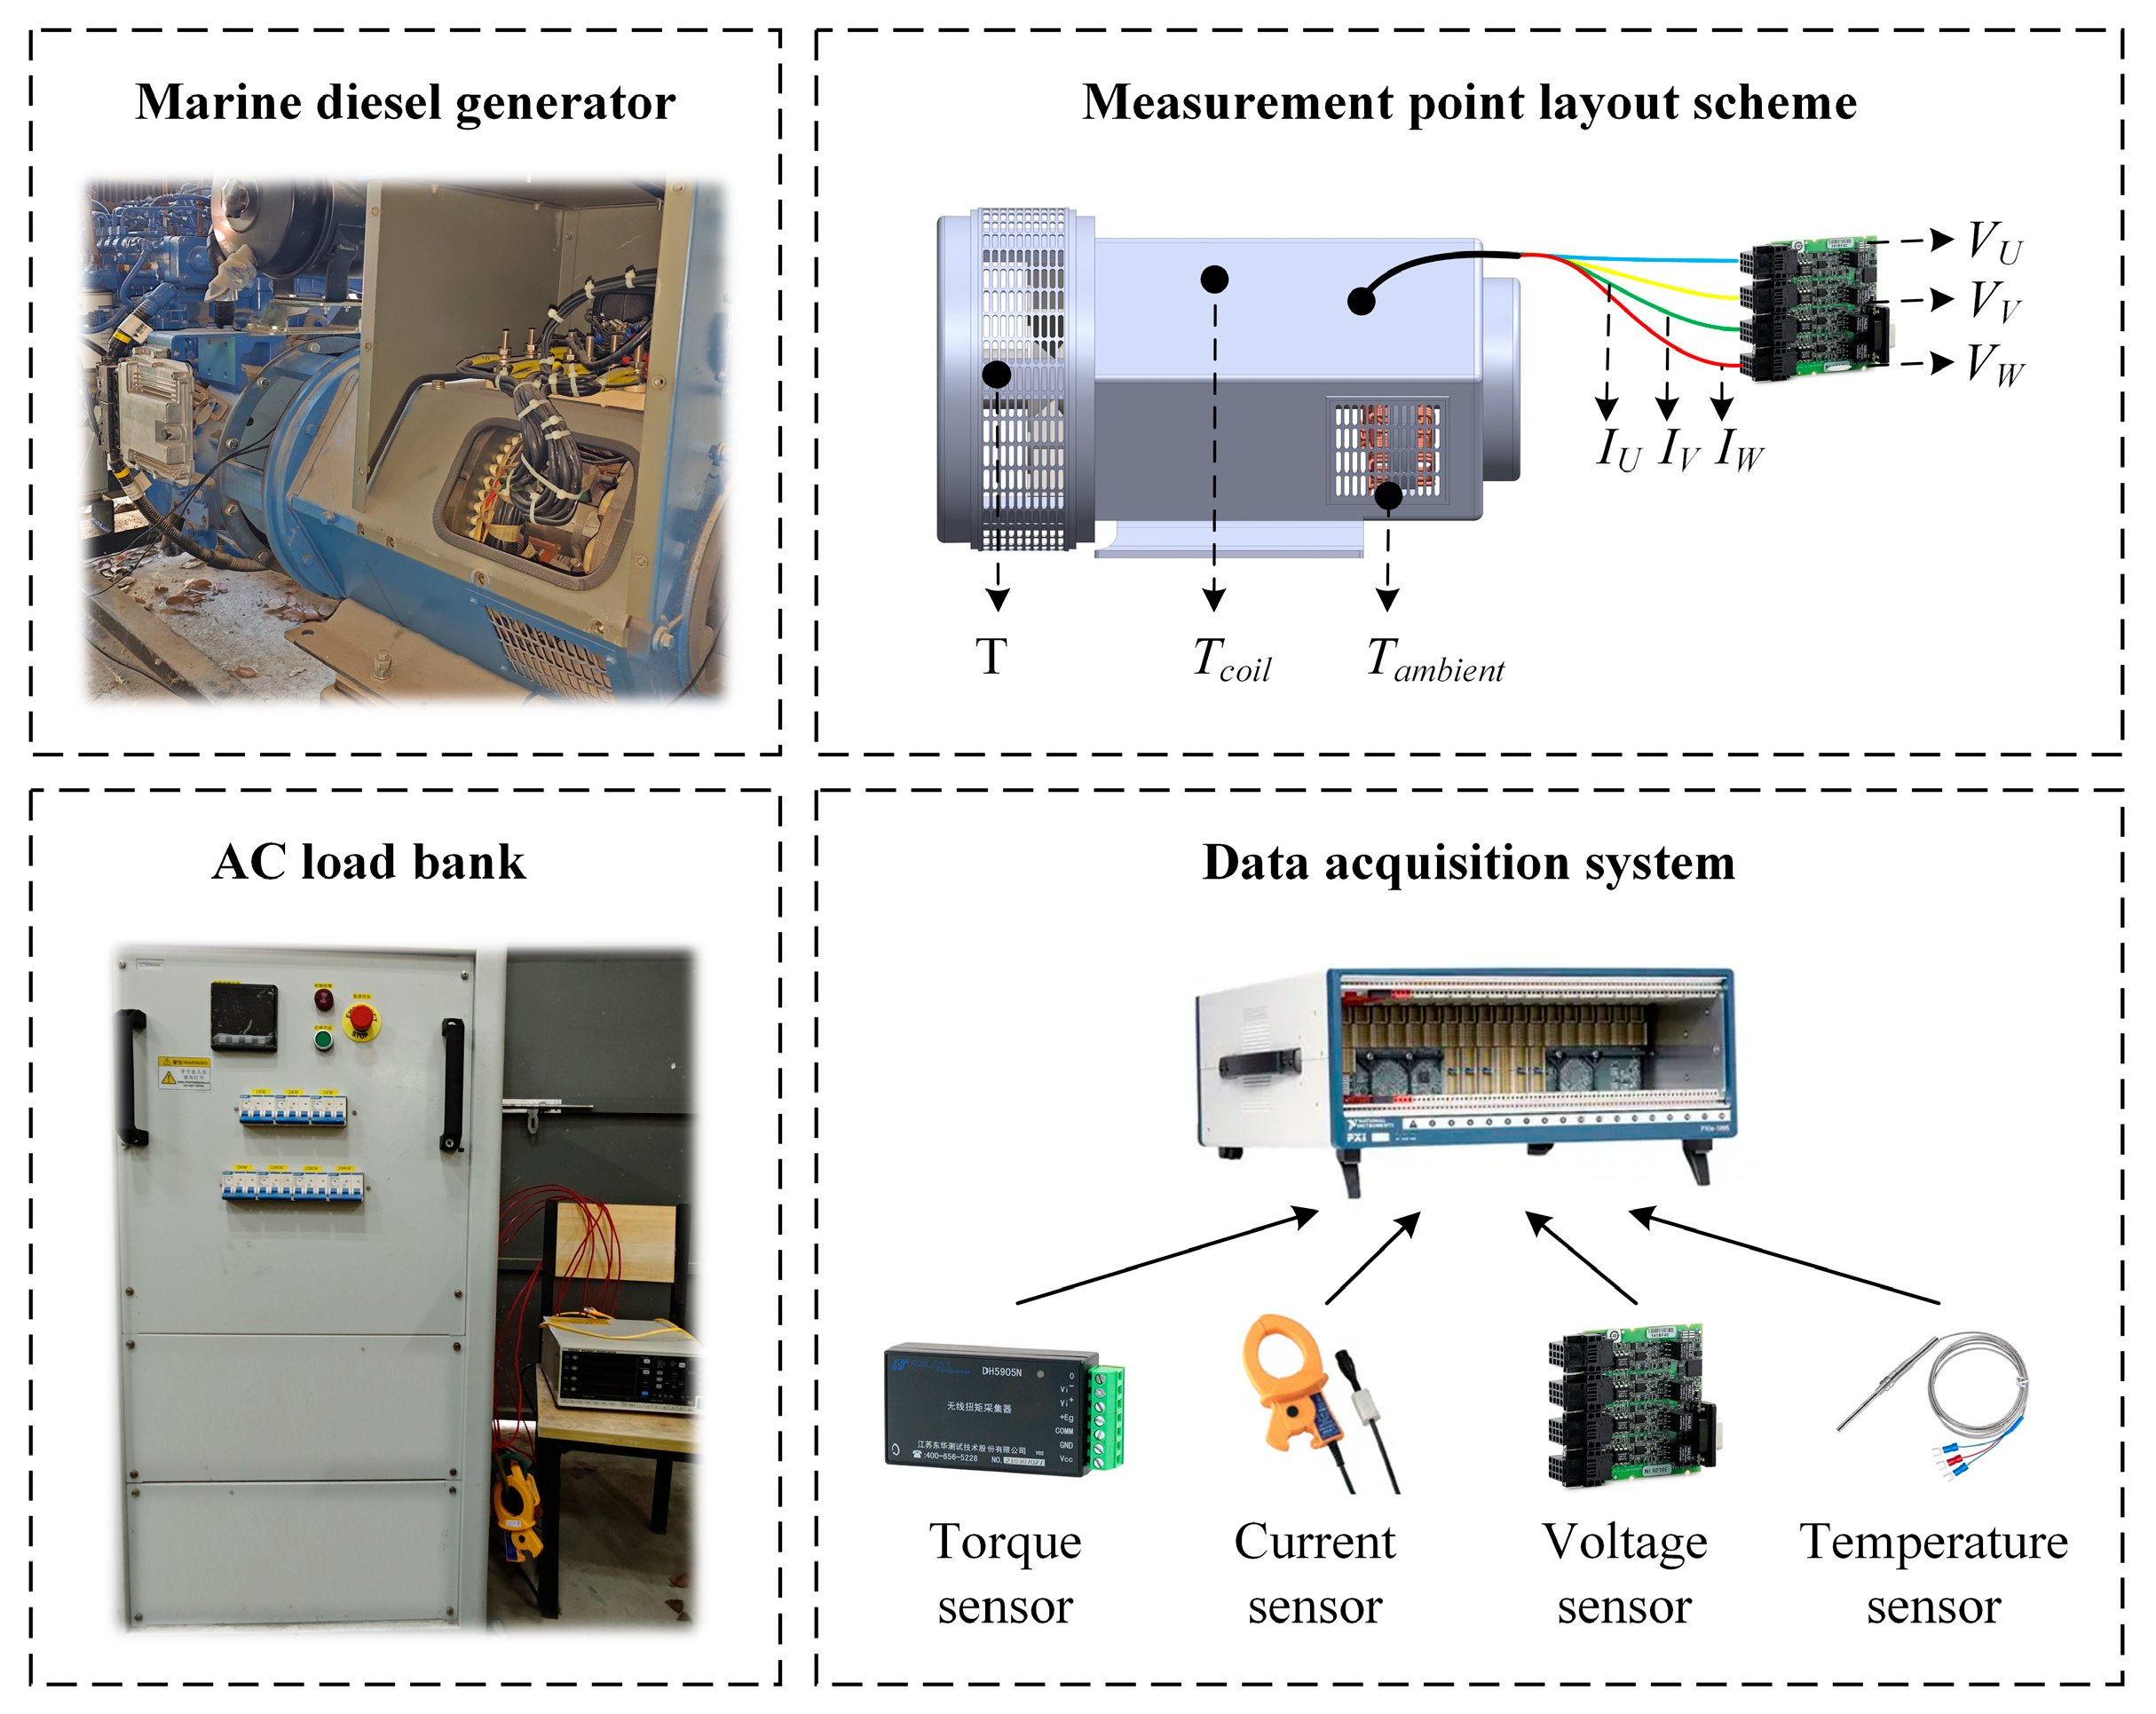
The experimental setup and data acquisition scheme are illustrated in Figure 9. The torque sensor is installed at the rotor input end of the generator and conforms to the curved surface of the shaft. Temperature sensors are positioned at the stator windings and at the fluid inlets on both sides of the generator. The U-, V-, and W-phase cables are individually clamped by current sensors and connected to the corresponding voltage measurement points in a three-phase four-wire configuration. Meanwhile, the generator’s built-in sensors enable real-time monitoring of the rotational speed.
To ensure the completeness and accuracy of the experimental data, the data acquisition system consists of five modules, responsible for the coordinated acquisition and synchronized processing of torque, rotational speed, current, voltage, and temperature signals.
The torque acquisition module comprises a DH5905N wireless strain acquisition module and a BE350-4FB resistive strain gauge. Within the operating temperature range of −20 °C to 60 °C, the typical measurement error is ±0.3% of the reading. The current/voltage acquisition module consists of a PW3337 power analyzer and 9661 clamp-type current sensors. For input currents not exceeding 50% of the rated full scale, the typical measurement error is ±0.15% of the reading. The temperature acquisition module includes an NI-9216 resistance temperature input module and PT100 platinum resistance temperature sensors. Within the measurement range of −200 °C to 150 °C, the typical measurement error is ±0.15 °C.
During data acquisition, the generator system is allowed to operate until all parameters reach steady-state conditions, after which the experimental data are recorded and organized. Table 3 presents the processed data for various test conditions. For instance, at a rotational speed of 1480   rpm and zero load power, the measured torque was 17.04   N · m , and the convective heat transfer area of the stator coil was 0.486   m 2 .

4.2. Discussion

Under relatively stable operating conditions of the diesel generator, the accumulation rate of dust layers can be considered approximately constant, with thickness increasing linearly over operating time. According to generator maintenance guidelines, the cleaning cycle for air-cooled models is about 1000 h. To verify the scientific validity and accuracy of the proposed health state assessment method, 10 sets of operational data were continuously collected at 72-h intervals over a full maintenance cycle. Systematic organization and quantitative analysis of these data led to the following conclusions:
(1)
The average convective heat transfer coefficient is only minimally affected by variations in ambient temperature and load power; however, it exhibits a clear stratification pattern as the fouling-layer thickness increases, revealing its high sensitivity to dust and fouling accumulation.
(2)
Based on the analysis of the convective heat transfer coefficient of the stator coil, the results for Groups 1~3 all fall within the range of 34.33, 35.86 . This indicates that during the first 150 h of the maintenance cycle, the generator remains in a “healthy” operating state. The results for Groups 4~5 fall within 32.92, 34.33 , showing that after approximately 300 h of continuous operation, the generator’s condition degrades to a “sub-healthy” state. The results for Groups 6~8 fall within 31.61, 32.92 , indicating that after 500 h of continuous operation, the generator further degrades to a “degraded” state. Finally, the results for Groups 9~10 fall within 30.42, 31.61 , suggesting that after 650 h of continuous operation, the generator enters an “abnormal” state.
(3)
The convective heat transfer coefficient of the generator stator coil decreases continuously with operating time, indicating that dust deposition increases thermal resistance and gradually degrades convective heat transfer performance. This demonstrates that the constructed health state assessment model can effectively visualize and quantify the degradation process under different operating conditions.

5. Conclusions and Future Work

This study addresses the degradation of convective heat transfer performance in stator coils of marine diesel generators caused by dust and fouling accumulation under high-humidity marine environments. A comprehensive investigation combining numerical simulation and experimental validation was conducted, and a health state assessment method based on the convective heat transfer coefficient was proposed.
The numerical analysis results indicate that, under stable operating conditions, as the fouling layer thickness increases from 0   μ m to 500   μ m , the maximum stator winding temperature under extreme operating conditions rises by approximately 22.16%, while the corresponding average convective heat transfer coefficient decreases by about 19.43%. By establishing a quantitative relationship model among fouling thickness, stator coil temperature, and convective heat transfer coefficient, the coupled mechanism of increased thermal resistance and enhanced Joule losses due to dust deposition was elucidated.
Furthermore, by using the convective heat transfer coefficient as a key indicator to define the health state space, a multi-condition adaptable state assessment model was constructed. Experimental results show that during the first 150 h of the maintenance cycle, the generator operates in a “healthy” state. As continuous operation extends to 300, 500, and 650 h, the operating state degrades to “sub-healthy,” “degraded,” and “abnormal,” respectively. This approach effectively visualizes the generator’s performance degradation process and validates the scientific reliability and effectiveness of the proposed assessment model.
Future research will focus on refining the underlying mechanisms and integrating intelligent data analysis. On one hand, multi-scale heat transfer and flow models will be introduced to reveal the effects of micro-scale particle deposition structures and porosity on local heat transfer efficiency, while also accounting for real-world environmental factors such as salt spray corrosion and vibration-induced detachment, thereby enhancing the physical accuracy and applicability of the fouling–heat transfer coupling model. On the other hand, by leveraging multi-source monitoring data, a hybrid health state assessment framework combining mechanistic models and data-driven approaches will be developed. Deep learning algorithms will enable adaptive identification and prediction of performance degradation trends, further improving the real-time responsiveness and intelligence of the state assessment system.

Author Contributions

Conceptualization, R.Z.; methodology, J.D. and R.Z.; software, Y.G.; validation, Y.G.; formal analysis, J.D.; investigation, Y.G.; resources, R.Z.; data curation, Y.G. and J.D.; writing—original draft preparation, Y.G.; writing—review and editing, R.Z. and J.D.; supervision, R.Z. All authors have read and agreed to the published version of the manuscript.

Funding

This research was funded by the High-Tech Research and Development Program: development of high ice-class propulsion and manipulation systems for polar regions (project number: K24532-1-2), the funder is Zhou Ruiping.

Data Availability Statement

The data presented in this study are available upon request from the corresponding author due to confidentiality restrictions, as part of the data originates from a confidential project and cannot be uploaded to a public repository.

Conflicts of Interest

The authors declare no conflict of interest.

Nomenclature

The following nomenclature is used in this manuscript:
R f The equivalent thermal resistance of the fouling layer
k f The thermal conductivity of the fouling material
δ The equivalent thickness of the fouling layer
N u The Nusselt number
h The convective heat transfer coefficient
l The characteristic length
λ The thermal conductivity of the fluid
P S _ C u The copper loss power of the stator winding
A The heat transfer area
T The temperature difference between stator winding and ambient
k t , ω t The time-dependent terms
U i k x i , U i ω x i The convective terms
P i n The input power
T The torque
n The rotational speed
P e m The electromagnetic power on the stator side
P o u t The output power
V L The line voltage
I L The line current
cos φ The power factor
P F e The iron loss
P R _ C u The rotor coil copper loss power
P E x c i t a t i o n The excitation power
P M e c h i n e The mechanical loss power
H i The health state parameter set at any given time i

References

  1. Luo, Y.; Kong, L.; Fang, S.; Shu, Y.; Niu, T.; Chen, G.; Liao, R. Reviews on the power management for shipboard energy storage systems. Sustain. Horiz. 2024, 9, 100094. [Google Scholar] [CrossRef]
  2. Tong, H.; Chen, S. A new pattern of green, intelligent and resilient international shipping: Conference report. Mar. Policy 2023, 152, 105587. [Google Scholar] [CrossRef]
  3. Hooshmand, H.; Nasiri, N.; Najafi Ravdanegh, S. Sustainable power management solutions for shipboard power systems: Incorporating CHP, hydrogen fuel cells, battery, and solar energy. J. Energy Storage 2025, 114, 115789. [Google Scholar] [CrossRef]
  4. Tao, J.; Li, W.; Guo, Y.; Zhang, H.; Dong, L.; Yang, Q. Investigation of electromechanical coupling torsional vibration in diesel generator sets. Mech. Syst. Signal Process. 2025, 230, 112622. [Google Scholar] [CrossRef]
  5. Li, B.; Ding, Y.; Ma, W.; Xiang, L.; Sui, C. A health condition assessment method for marine diesel engine turbochargers using zero-dimensional engine model and machine learning. Measurement 2025, 251, 117283. [Google Scholar] [CrossRef]
  6. Zhang, P.; Li, C.; Xu, H.; Zou, Y.; Wang, K.; Zhang, Y.; Sun, P. Bi-AAE: A binary adversarial autoencoder deep neural network model for anomaly detection in system-level marine diesel engines. Ocean Eng. 2024, 302, 117700. [Google Scholar] [CrossRef]
  7. Wang, Y.; Liu, J.; Liu, R.W.; Liu, Y.; Yuan, Z. Data-driven methods for detection of abnormal ship behavior: Progress and trends. Ocean Eng. 2023, 271, 113673. [Google Scholar] [CrossRef]
  8. Berce, J.; Zupančič, M.; Može, M.; Golobič, I. A review of crystallization fouling in heat exchangers. Processes 2021, 9, 1356. [Google Scholar] [CrossRef]
  9. Zou, Z.; Liu, S.; Kang, J. Degradation mechanism and online electrical monitoring techniques of stator winding insulation in inverter-fed machines: A review. World Electr. Veh. J. 2024, 15, 444. [Google Scholar] [CrossRef]
  10. Abdulkarim, D.A.; Lazakis, I. Systems reliability and data-driven analysis for marine machinery maintenance planning and decision making. Machines 2024, 12, 294. [Google Scholar]
  11. Lim, S.; Oh, J.; Park, J. Maintenance time prediction for predictive maintenance of ship engines. Appl. Sci. 2025, 15, 4764. [Google Scholar] [CrossRef]
  12. Park, J.; Oh, J. Anomalistic symptom judgment algorithm for predictive maintenance of ship propulsion engine using machine learning. Appl. Sci. 2023, 13, 11818. [Google Scholar] [CrossRef]
  13. Carvalho, T.P.; Soares, F.A.; Vita, R.; Francisco, R.D.; Basto, J.P.; Alcalá, S.G. A systematic literature review of machine learning methods applied to predictive maintenance. Comput. Ind. Eng. 2019, 137, 106024. [Google Scholar] [CrossRef]
  14. Le, X.H.K.; Pop, I.; Sheremet, M.A. Thermogravitational convective flow and energy transport in an electronic cabinet with a heat-generating element and solid/porous finned heat sink. Mathematics 2021, 10, 34. [Google Scholar] [CrossRef]
  15. Xuan, H.K.L.; Pop, I.; Sheremet, M.A. Numerical simulation of solid and porous fins’ impact on heat transfer performance in a differentially heated chamber. Mathematics 2022, 10, 263. [Google Scholar] [CrossRef]
  16. Essarroukh, I.; López, J.M. Convective heat transfer in uniformly accelerated and decelerated turbulent pipe flows. Mathematics 2024, 12, 3560. [Google Scholar] [CrossRef]
  17. Moradnia, P.; Chernoray, V.; Nilsson, H. Experimental assessment of a fully predictive CFD approach for flow of cooling air in an electric generator. Appl. Energy 2014, 124, 223–230. [Google Scholar] [CrossRef]
  18. Bang, H.; Park, G.; Lee, S. Performance improvement of intercooler in biogas generators by using computational fluid dynamics. Appl. Therm. Eng. 2024, 243, 122541. [Google Scholar] [CrossRef]
  19. Bersch, K.; Connor, P.H.; Eastwick, C.N.; Galea, M.; Rolston, R. CFD optimisation of the thermal design for a vented electrical machine. In Proceedings of the IEEE Workshop on Electrical Machines Design, Control and Diagnosis (WEMDCD), Nottingham, UK, 20–21 April 2017; pp. 1–6. [Google Scholar]
  20. Han, Z.; Xu, Z.; Yu, X. CFD modeling for prediction of particulate fouling of heat transfer surface in turbulent flow. International J. Heat Mass Transf. 2019, 144, 118428. [Google Scholar] [CrossRef]
  21. Inamdar, H.V.; Groll, E.A.; Weibel, J.A.; Garimella, S.V. Air-side fouling of finned heat exchangers: Part 1, review and proposed test protocol. Int. J. Refrig. 2023, 151, 77–86. [Google Scholar] [CrossRef]
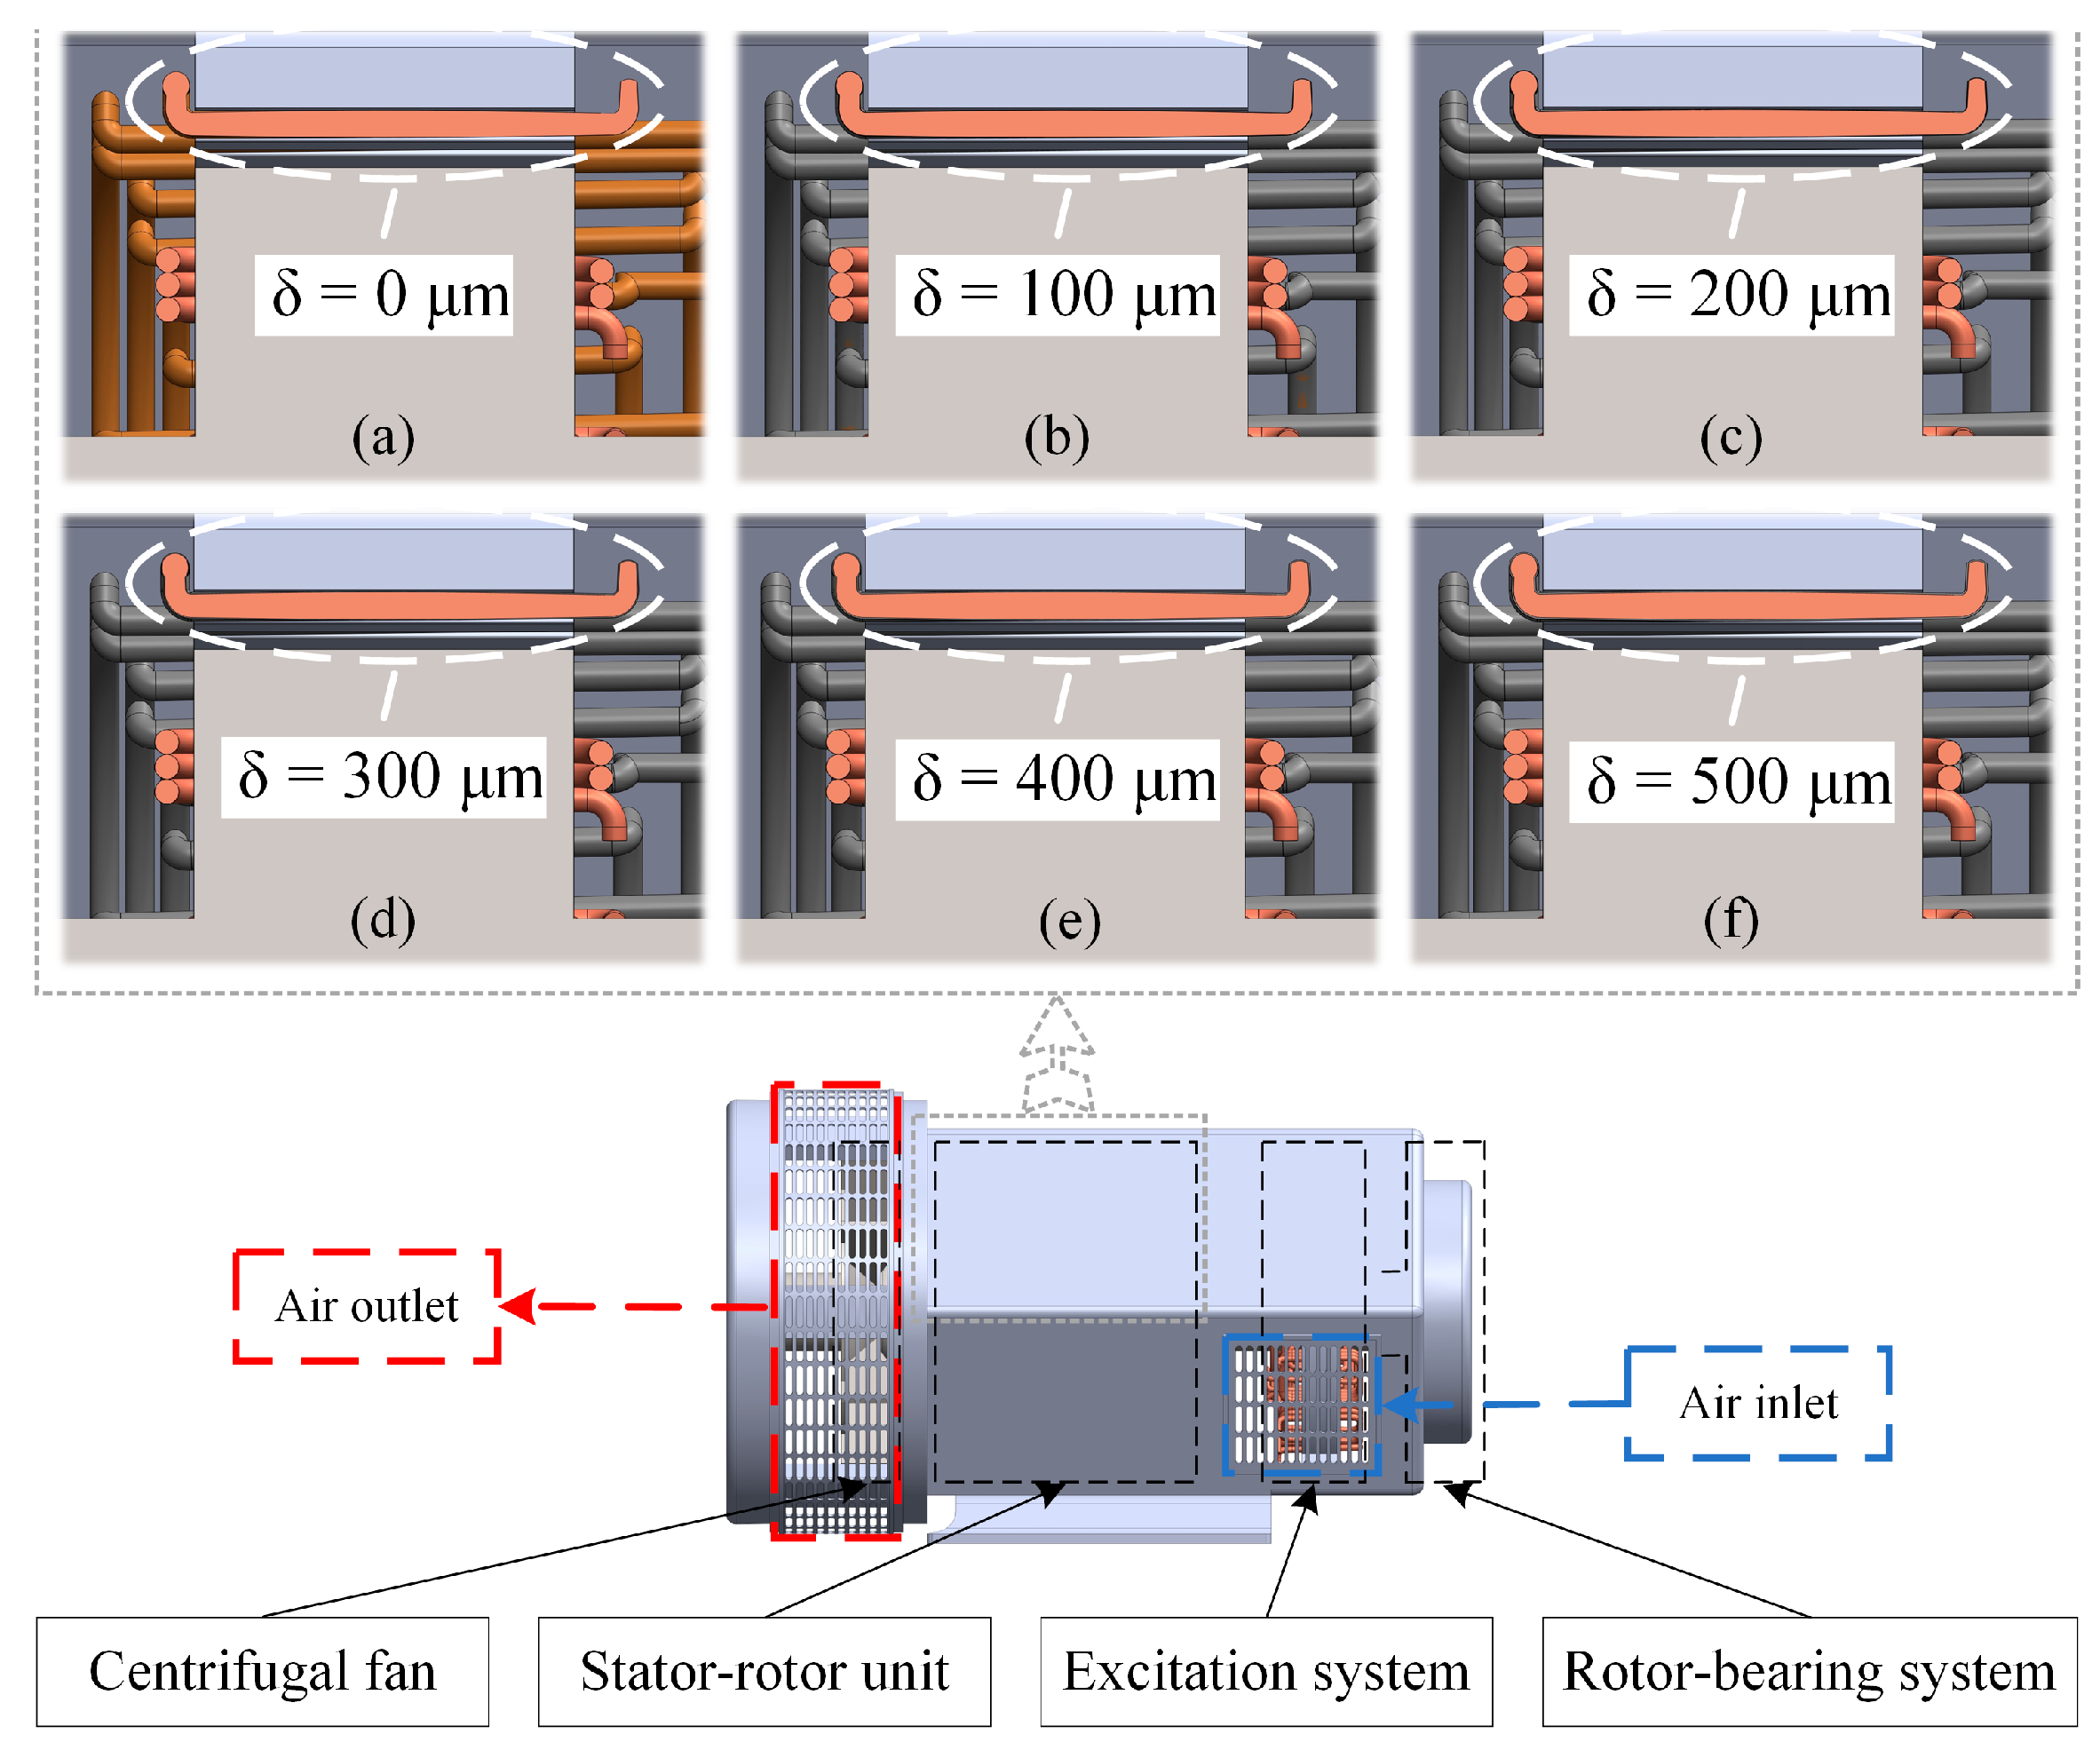
Figure 1. Three-dimensional digital model of the generator with schematic representation of fouling layer thickness variation.
Mathematics 13 03767 g001
Figure 2. Cross-sectional diagram of the mesh distribution.
Mathematics 13 03767 g002
Figure 3. Results of the mesh sensitivity analysis.
Mathematics 13 03767 g003
Figure 4. Results of the viscous model accuracy analysis.
Mathematics 13 03767 g004
Figure 5. Numerical simulation results of the stator coil temperature.
Mathematics 13 03767 g005
Figure 6. Effect of Fouling layer thickness on the convective heat transfer coefficient.
Mathematics 13 03767 g006
Figure 7. Health state classification.
Mathematics 13 03767 g007
Figure 8. Procedure for generator health state assessment.
Mathematics 13 03767 g008
Figure 9. Experimental equipment and data acquisition scheme.
Mathematics 13 03767 g009
Table 1. Mesh sensitivity analysis schemes.
3D Model NumberNumber of Cells (Thousand)
TinyCoarseMediumFineSuper Fine
(a) 0 μm57,00059,00061,00063,00065,000
(b) 100 μm62,50063,00063,50064,00064,500
(c) 200 μm63,50064,00064,50065,00065,500
(d) 300 μm64,50065,00065,50066,00066,500
(e) 400 μm65,50066,00066,50067,00067,500
(f) 500 μm66,50067,00067,50068,00068,500
Table 2. Key parameters of the brushless AC synchronous generator.
ParameterValue/UnitsParameterValue/Units
Rated voltage 400   V Rated current 108   A
Rated power 60   k W Rated revolution 1500   r p m
Standby power 64   k W Power factor0.8
Ingress ProtectionIP23Insulation classH
Table 3. Summary of Experimental Data.
Test Group T
( N · m )
V L
( V )
I L
( A )
T ambient
( ° C )
T c o i l
( ° C )
h
( W / m 2 · ° C )
1291.19220.15109.7128.8066.4635.71
2370.28220.31140.3529.6299.9134.79
3329.99220.26124.7929.5482.9534.37
4330.60220.24125.0428.4983.0433.79
5412.29220.57156.1430.16130.0133.04
6411.46220.45155.8929.33130.6932.51
7411.74220.47155.9331.40135.8832.00
8290.88220.14109.5530.9574.3831.69
9291.67220.16109.8529.6773.9631.20
10371.12220.29140.5828.54112.0530.45
Disclaimer/Publisher’s Note: The statements, opinions and data contained in all publications are solely those of the individual author(s) and contributor(s) and not of MDPI and/or the editor(s). MDPI and/or the editor(s) disclaim responsibility for any injury to people or property resulting from any ideas, methods, instructions or products referred to in the content.