Article

Copula Dependent Censoring Models for Survival Prognosis: Application to Lactylation-Related Genes

by
Clarissa Auryn Kahardinata
1,
Gen-Yih Liao
1 and
Takeshi Emura
2,3,4,*
1
Department of Information Management, Chang Gung University, Taoyuan 33302, Taiwan
2
Biostatistics Center, Kurume University, Kurume 8300011, Japan
3
School of Informatics and Data Science, Hiroshima University, Higashi Hiroshima 7390046, Japan
4
Research Center for Medical and Health Data Science, The Institute of Statistical Mathematics, Tokyo 1908562, Japan
*
Author to whom correspondence should be addressed.
Mathematics 2025, 13(23), 3735; https://doi.org/10.3390/math13233735
Submission received: 23 September 2025 / Revised: 11 November 2025 / Accepted: 18 November 2025 / Published: 21 November 2025

Abstract

Survival for cancer patients is predictable by gene expressions obtained from DNA microarrays for tumor samples. For analyzing survival data with gene expressions, traditional survival analysis methods have been employed. However, these methods rely on the independent censoring model. In real survival data, dependent censoring arises, which violates the fundamental assumption of independent censorship. In addition, how to handle dependent censoring has not been clearly demonstrated for scientists working on molecular genetics. In this article, we review copula-based methods to handle dependent censoring, including the copula-graphic estimator and significance test. We illustrate the copula-based method by the prognostic analysis of the lactylation-related genes from 327 breast cancer tumor tissues. To justify the correctness of the copula-based significance test, we examine the performance of the copula-based methods using a simulation study. The results of our analysis indicate that the copula-based analyses may reverse the conclusions derived from the traditional independent censoring model.

1. Introduction

Survival for cancer patients is predictable by gene expressions obtained from DNA microarrays for tumor samples [1,2,3,4,5,6]. In the gene expression data, one of the main goals is to assess the prognostic abilities of genes. For survival data with gene expressions, traditional survival analysis methods, such as the Kaplan–Meier (KM) survival curve and Cox regression, have been employed. Using these methods, one can assess genes via significance tests [5,6,7,8,9]. The resultant genes become useful biomarkers for predicting survival in breast cancer [10,11,12,13,14], lung cancer [6,7,8,15,16], gastric cancer [17,18,19], ovarian cancer [20,21,22,23,24,25], liver cancer [26,27], bladder cancer [28], head and neck cancer [29,30], myeloproliferative neoplasms [31], and cancers of mixed types [32,33].
These previous studies demonstrated the abilities of relevant genes to predict survival. However, a primary concern for these studies is the occurrence of dependent censoring (see Section 2), which may violate the fundamental assumptions needed for the traditional survival analysis methods. However, how to handle dependent censoring has not been clearly demonstrated for scientists working on molecular genetics. In this article, we review copula-based methods to handle dependent censoring with illustrations though the assessments of the prognostic values of the lactylation-related genes in cancer [34,35,36,37] using a breast cancer dataset of Kao et al. [10].
Traditional survival analysis methods critically rely on the “independent censoring model”, where survival time and censoring time are assumed to be statistically independent. This simplistic model may be invalid in poorly controlled clinical settings, where patients drop out from a follow-up study due to the worsening of his/her health condition or patients are removed due to organ transplantations [38,39]. Such a phenomenon is termed “dependent censoring” [39]. Moreover, dependent censoring naturally arises in clustering [40,41] and the significance analyses based on univariate gene selection [39,42,43,44]. In the presence of dependent censoring, traditional survival analysis methods may provide biased results [39,45], and, hence, fail to yield effective prognostic models based on gene expressions.
Copula-based survival models are novel approaches for gene selection [43,44], which can effectively adjust for the dependent censoring phenomenon. These models work if the underlying dependence structure is correctly specified by a copula function. In particular, the copula-graphic (CG) estimator unbiasedly estimates survival probabilities, serving as an alternative to the traditional KM estimates for survival [45]. Along with the mathematical integrity of copulas [46], these copula models have gained popularity in recent years, especially for dealing with survival data with dependent censoring [43,44,45,47,48,49,50,51,52,53,54,55]. However, these novel copula methods have not been widely utilized in genomic analyses. Therefore, there is an urgent need to explain how to use the copula models to scientists working on molecular genetics.
In this article, we demonstrate the usefulness of these copula-based approaches via an application to the prognostic evaluation of lactylation-related genes [37] using a publicly available breast cancer dataset [10]. We conclude that the copula-based analyses may reverse the conclusions derived from the independent censoring model. Specifically, genes declared to be significantly predictive of survival using the traditional methods are no longer significant under the copula-based models. This indicates that the traditional methods may overestimate the effect of genes when dependent censoring actually exists.
The article is constructed as follows: Section 2 describes the dataset and reviews the copula-based models for dependent censoring. Section 3 reports the results of analyzing the lactylation-related genes using the breast cancer dataset and the copula-based models. Section 4 provides a simulation study to validate the copula-based significance test. Section 5 concludes with the discussion. The Supplementary Materials section provides the code to reproduce all the numerical results of the article, as well as additional results of the data analysis.

2. Materials and Methods

In this section, we shall first describe the gene expression dataset to be analyzed. We then review copula-based methods [39,43,44,45] for analyzing the dataset.

2.1. Dataset

Lactylation-related genes are recently identified as key players in cancer biology [34,35,36,37]. Lactylation-related gene expressions (abundance of mRNA transcripts) measured in DNA microarray analyses are considered to be potential biomarkers for survival prognosis in various cancers. By regulating the mRNA transcription and the protein functions, the lactylation genes facilitate metabolic reprogramming. Large-scale sequencing has confirmed the widespread occurrence of lactylation sites across the tumor proteome.
In this context, we used the same breast cancer dataset as previously analyzed by Kao et al. [10]. This dataset was also recently reanalyzed in Jiao et al. [37] for understanding the role of lactylation-related genes. The dataset consists of n = 327 breast cancer tumor tissues [10] publicly available on the GEO (https://www.ncbi.nlm.nih.gov/geo/ (accessed on 20 September 2025)) under the accession number GSE20685. This data was chosen because it had a large number of tissues in the dataset and included survival information of patients.
We denote the ID of tumors as i   ( = 1 , 2 , , n ) . The dataset provides follow-up time t i (either death time or censoring time), survival status δ i (1 for death, or 0 for censor), and a l o g 2 -transformed gene expression value x i for each tumor i . For gene expressions, we used five lactylation-related genes for the analysis of gene expressions as considered in Jiao et al. [37], which are sufficiently independent: ARID3A, PKM2, HBB, CCNA2, and G6PD. Thus, the dataset consists of triplets ( t i , δ i , x i ) , i = 1 , 2 , , n , where n = 327 .
Figure 1 displays scatter plots for the five lactylation-related gene expressions based on the 327 tumor tissues. We observe that the five gene expressions are only weakly dependent (pairwise Kendall’s tau correlations < 0.20). This implies that the five genes are reasonably independent predictors with little concern for multicollinearity.

2.2. Copula Model for Dependent Censoring

We first define basic notations and terms. Let T be survival time and U be censoring time. Let x denote a l o g 2 -transformed expression value. The conditional survival functions given x are denoted by S t x = P T > t x , and G u x = P U > u x , respectively. In the traditional survival analysis models, the independent censoring assumption is imposed, namely,
P T > t , U > u x = S t x G u x ,             t 0 ,             u 0 .
Copulas can relax the assumption of independent censoring. Copula-based dependent censoring models have gained popularity in recent years [39,43,44,45,46,47,48,49,50,51,52,53,54,55] along with other copula models in different fields [56,57,58,59]. For the purpose of measuring the prognostic ability of the five lactylation-related genes, we take the following copula model:
P T > t , U > u x = C θ S t x , G u x ,             t 0 ,               u 0 ,
where C θ is a copula [46] with a parameter θ that specifies the strength of dependence.
The copula model (1) accommodates a variety of dependent censoring structures. For implementation, a copula with a simple form, such as the Clayton, Gumbel, or Frank copula, is suggested. As an instance, the Clayton copula takes the following expression:
C θ ( v , w ) = ( v θ + w θ 1 ) 1 θ , 0 < v , w < 1 , θ > 0 .
The parameter θ specifies the strength of dependence. The degenerate case gives the independent censoring model C θ v , w v w for θ 0 . To measure the degree of dependence, one can use Kendall’s tau, defined as τ = θ / ( θ + 2 ) under the Clayton copula. The range of τ varies from independence ( τ = 0 ) to perfect positive dependence ( τ = 1 ).

2.3. Copula-Graphic Estimator

Copula-graphic (CG) estimators provide unbiased estimates of survival curves when the copula in model (1) is correctly specified [45]. The virtue of the CG estimator is the ability to handle dependent censoring in a rigorous and efficient way. Therefore, the CG estimators are alternative methods to the traditional KM estimator.
To define the CG estimator, we introduce the structure of the observed dataset. Define T i as survival time, U i as censoring time, and x i as gene expression from tumors i = 1 , 2 , , n , where n is the sample size. The dataset consists of triplets ( t i , δ i , x i ) , i = 1 , 2 , , n , where t i = m i n ( T i , U i ) and δ i = 1 { T i U i } . We divide the dataset into the two groups via the gene expression ( x i > c or x i c ) for a cut-off value c . The value c may be chosen to be the 50th percentile (median) of the gene expressions to achieve robust groupings by eliminating the instability due to unevenly allocated sample sizes. Additionally, this rule has been commonly employed in the analysis of survival prognostic prediction with gene expressions [5,20,26,44].
The dataset yields two subsets: over-expressed group { i ; x i > c } and under-expressed group { i ; x i c } . Let n 1 = i = 1 n 1 { x i > c } and n 2 = i = 1 n 1 { x i c } be the sample sizes of the two groups. For each group, we assume Archimedean copula models:
P T i > t , U i > u x i > c = ϕ θ 1 ϕ θ S ( t | x i > c ) + ϕ θ G ( u | x i > c ) ,
P T i > t , U i > u x i c = ϕ θ 1 ϕ θ S ( t | x i c ) + ϕ θ G ( u | x i c ) ,
where ϕ θ is a generator function satisfying ϕ θ ( 0 ) = and ϕ θ ( 1 ) = 0 [46].
If the models (2) and (3) are assumed, one can estimate survival curves for the two groups. For instance, one can estimate the survival function for the over-expressed group S ( t | x i > c ) by the CG estimator:
S ^ C G ( t | x i > c ) = ϕ θ 1 j : t j t ,   δ j = 1 ,     x j > c ϕ θ n 1 j 1 n 1 ϕ θ n 1 j n 1 ,
where n 1 j = i = 1 n 1 t i t j , x i > c is the number of individuals at risk at time t j . The survival function S ( t | x i c ) for the under-expressed group is also estimated in a similar formula. Note that the CG estimator reduces to the KM estimator by ϕ 0 t = log ( t ) . For the Clayton copula, one has ϕ θ ( t ) = ( t θ 1 ) / θ log ( t ) with θ 0 . The copula generated by ϕ 0 t = log ( t ) is the independence copula: ϕ 0 1 ϕ 0 ( v ) + ϕ 0 ( w ) = v w . This means that the KM estimator is obtained as the limiting case of the Clayton CG estimator. Appendix A gives the formulas of the CG estimator under the Gumbel copula.
To compute the CG estimators, the parameter θ must be specified. However, it is difficult to be estimated by observed data due to their modest information for dependence [45,47,48,51,52]. Thus, a sensitivity analysis may be carried out for selected values of θ [39,44,45,48,49,50,51,52,53,54,55]. We suggest three values of θ yielding the low, medium, and high positive correlations (τ = 0.2, 0.5, and 0.8) and three values yielding the low, medium, and high negative correlations (τ = −0.2, −0.5, and −0.8). The computation can be carried out by the R functions, CG.Clayton(.), CG.Gumbel(.), and CG.Frank(.), available in the R package compound.Cox (version 3.33) [8].

2.4. Testing Significance of Survival Difference

The statistical significance of the gene can be visualized by plotting the CG estimators for a given copula parameter θ . If S ^ C G ( t | x i > c ) and S ^ C G ( t | x i c ) are clearly separated, we conclude that the prognostic ability for the gene x i is significant. An objective metric of “separation” is based on a large value of | D | , where the distance D is defined as
D = 1 τ 0 τ { S ^ C G ( t | x i c ) S ^ C G ( t | x i > c ) } d t ,
where τ = m i n { m a x   x i c t i , m a x   x i > c t i } as previously suggested [44]. A p-value is computed by a permutation method [44]. The computation can be carried out by the R function CG.test(.) available in the R package compound.Cox [8].
As this testing method has not been validated by means of a simulation study in the literature, we carried out an experiment under various conditions (see Section 4).

2.5. Hazard Ratio

Copula models can be used to estimate the hazard ratio (HR), a metric for the effect of gene expressions on survival. Although the metric D from the CG estimator can be used to measure the effect, a more interpretable metric in survival analysis is the HR, defined as e x p ( β ) , where β is a coefficient in the Cox model [60] for a gene x i . That is,
λ t x i = λ 0 t e x p ( β x i ) ,
where λ t x i = d log { P T i > t x i } / d t is the hazard function and λ 0 ( . ) is the baseline hazard function. Fitting survival data to the copula-based dependent censoring model, the estimator of the HR (and confidence interval) is obtained by the method of [44], which can also test H 0 : β = 0 vs. H 1 : β 0 . The computation is carried out by the R function, dependCox.reg(.), available in the R package compound.Cox [8].

2.6. Prognostic Index

Once genes are selected, one can combine them into a predictor, called Prognostic Index (PI). The PI is a weighted sum of gene expressions ( x 1 , , x q ) . For weights β s computed by fitting suitable models, the PI is defined as
P I = β 1 x 1 + + β q x q .
A convenient option for computing β s is fitting univariate Cox models for each gene. In this case, the PI is known as the compound covariate predictor [7,8,22,61]. The computation of β s can be implemented by the R function uni.score(.) available in the R package compound.Cox [8], or by a sequence of univariate Cox regression analyses.
By these weights, a high (low) value of the PI gives a low (high) survival probability. Thus, a patient is assigned to a low-risk ( P I < c ) or a high-risk ( P I > c ) group using c , the median of the PI values. The classification by the PI is supposed to be more accurate than the classifications by single genes since the PI combines the prognostic abilities of all genes.
An alternative method for computing β s is under the Clayton copula model as suggested by [44]. This may enhance the prediction ability under dependent censoring if the dependence parameter θ is estimated accurately. However, as the estimation of the parameter θ is time-consuming, we do not use this approach in this article.

3. Results

We report the results of the prognostic abilities of five lactylation-related genes, HBB, ARID3A, PKM2, CCNA2, and G6PD, using the breast cancer dataset and copula models described in Section 2. Our reports focus on the results under the Clayton copula model while those under the Gumbel and Frank copulas are given in Supplementary Materials. The copula-based models are compared to the traditional independent censoring model.

3.1. HBB Gene

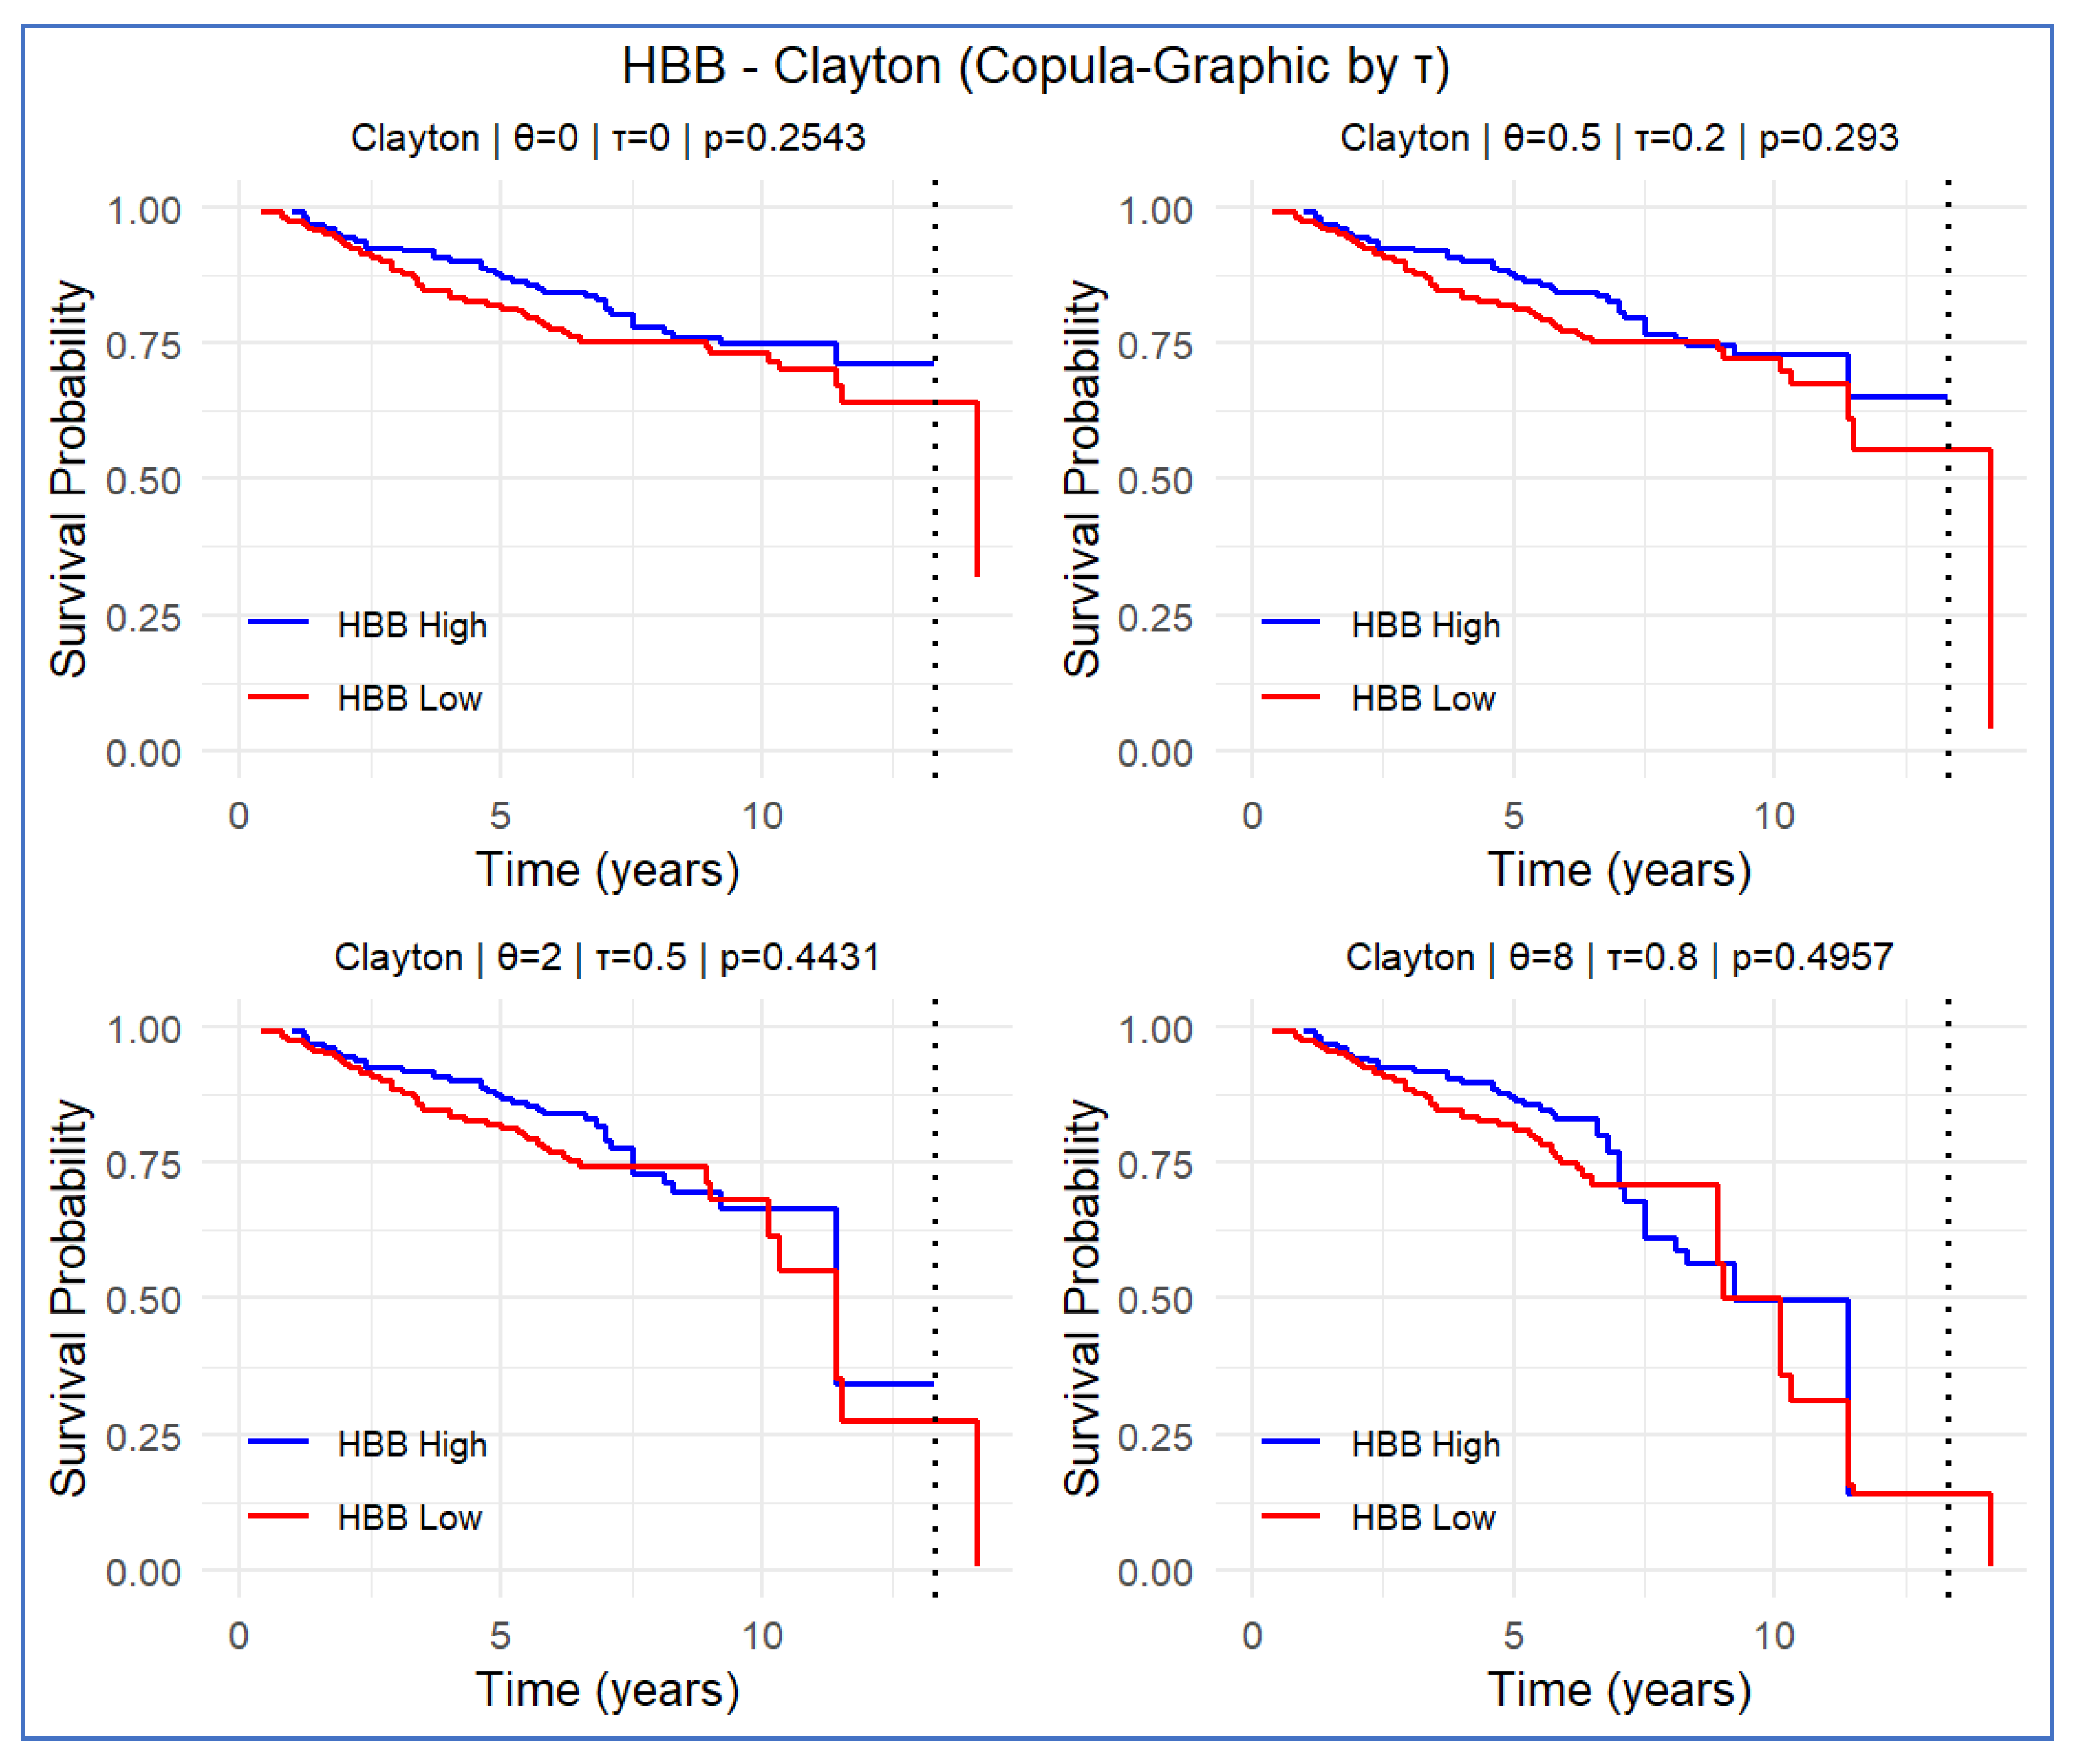
The KM estimates (under the independent censoring model) of survival curves did not show a clear difference between the high- and low-HBB-expression groups, as presented in the top-left panel of Figure 2 (the independence case of θ = 0 ) and Table 1 (τ = 0). Likewise, in the CG estimators for survival curves accounting for various degrees of dependent censoring, we did not observe any notable effect of HBB (Figure 2, Table 1). The conclusion remains consistent under the Frank and Gumbel copulas (figures in Supplement). The Cox regression analysis also failed to reach significance (HR: 0.964, 95% CI: 0.78–1.2). The HR adjusted for various degrees of dependent censoring under various copula were also non-significant (Table 2). In summary, the HBB gene does not yield a significant influence on survival outcomes under varying dependent censoring scenarios.

3.2. ARID3A Gene

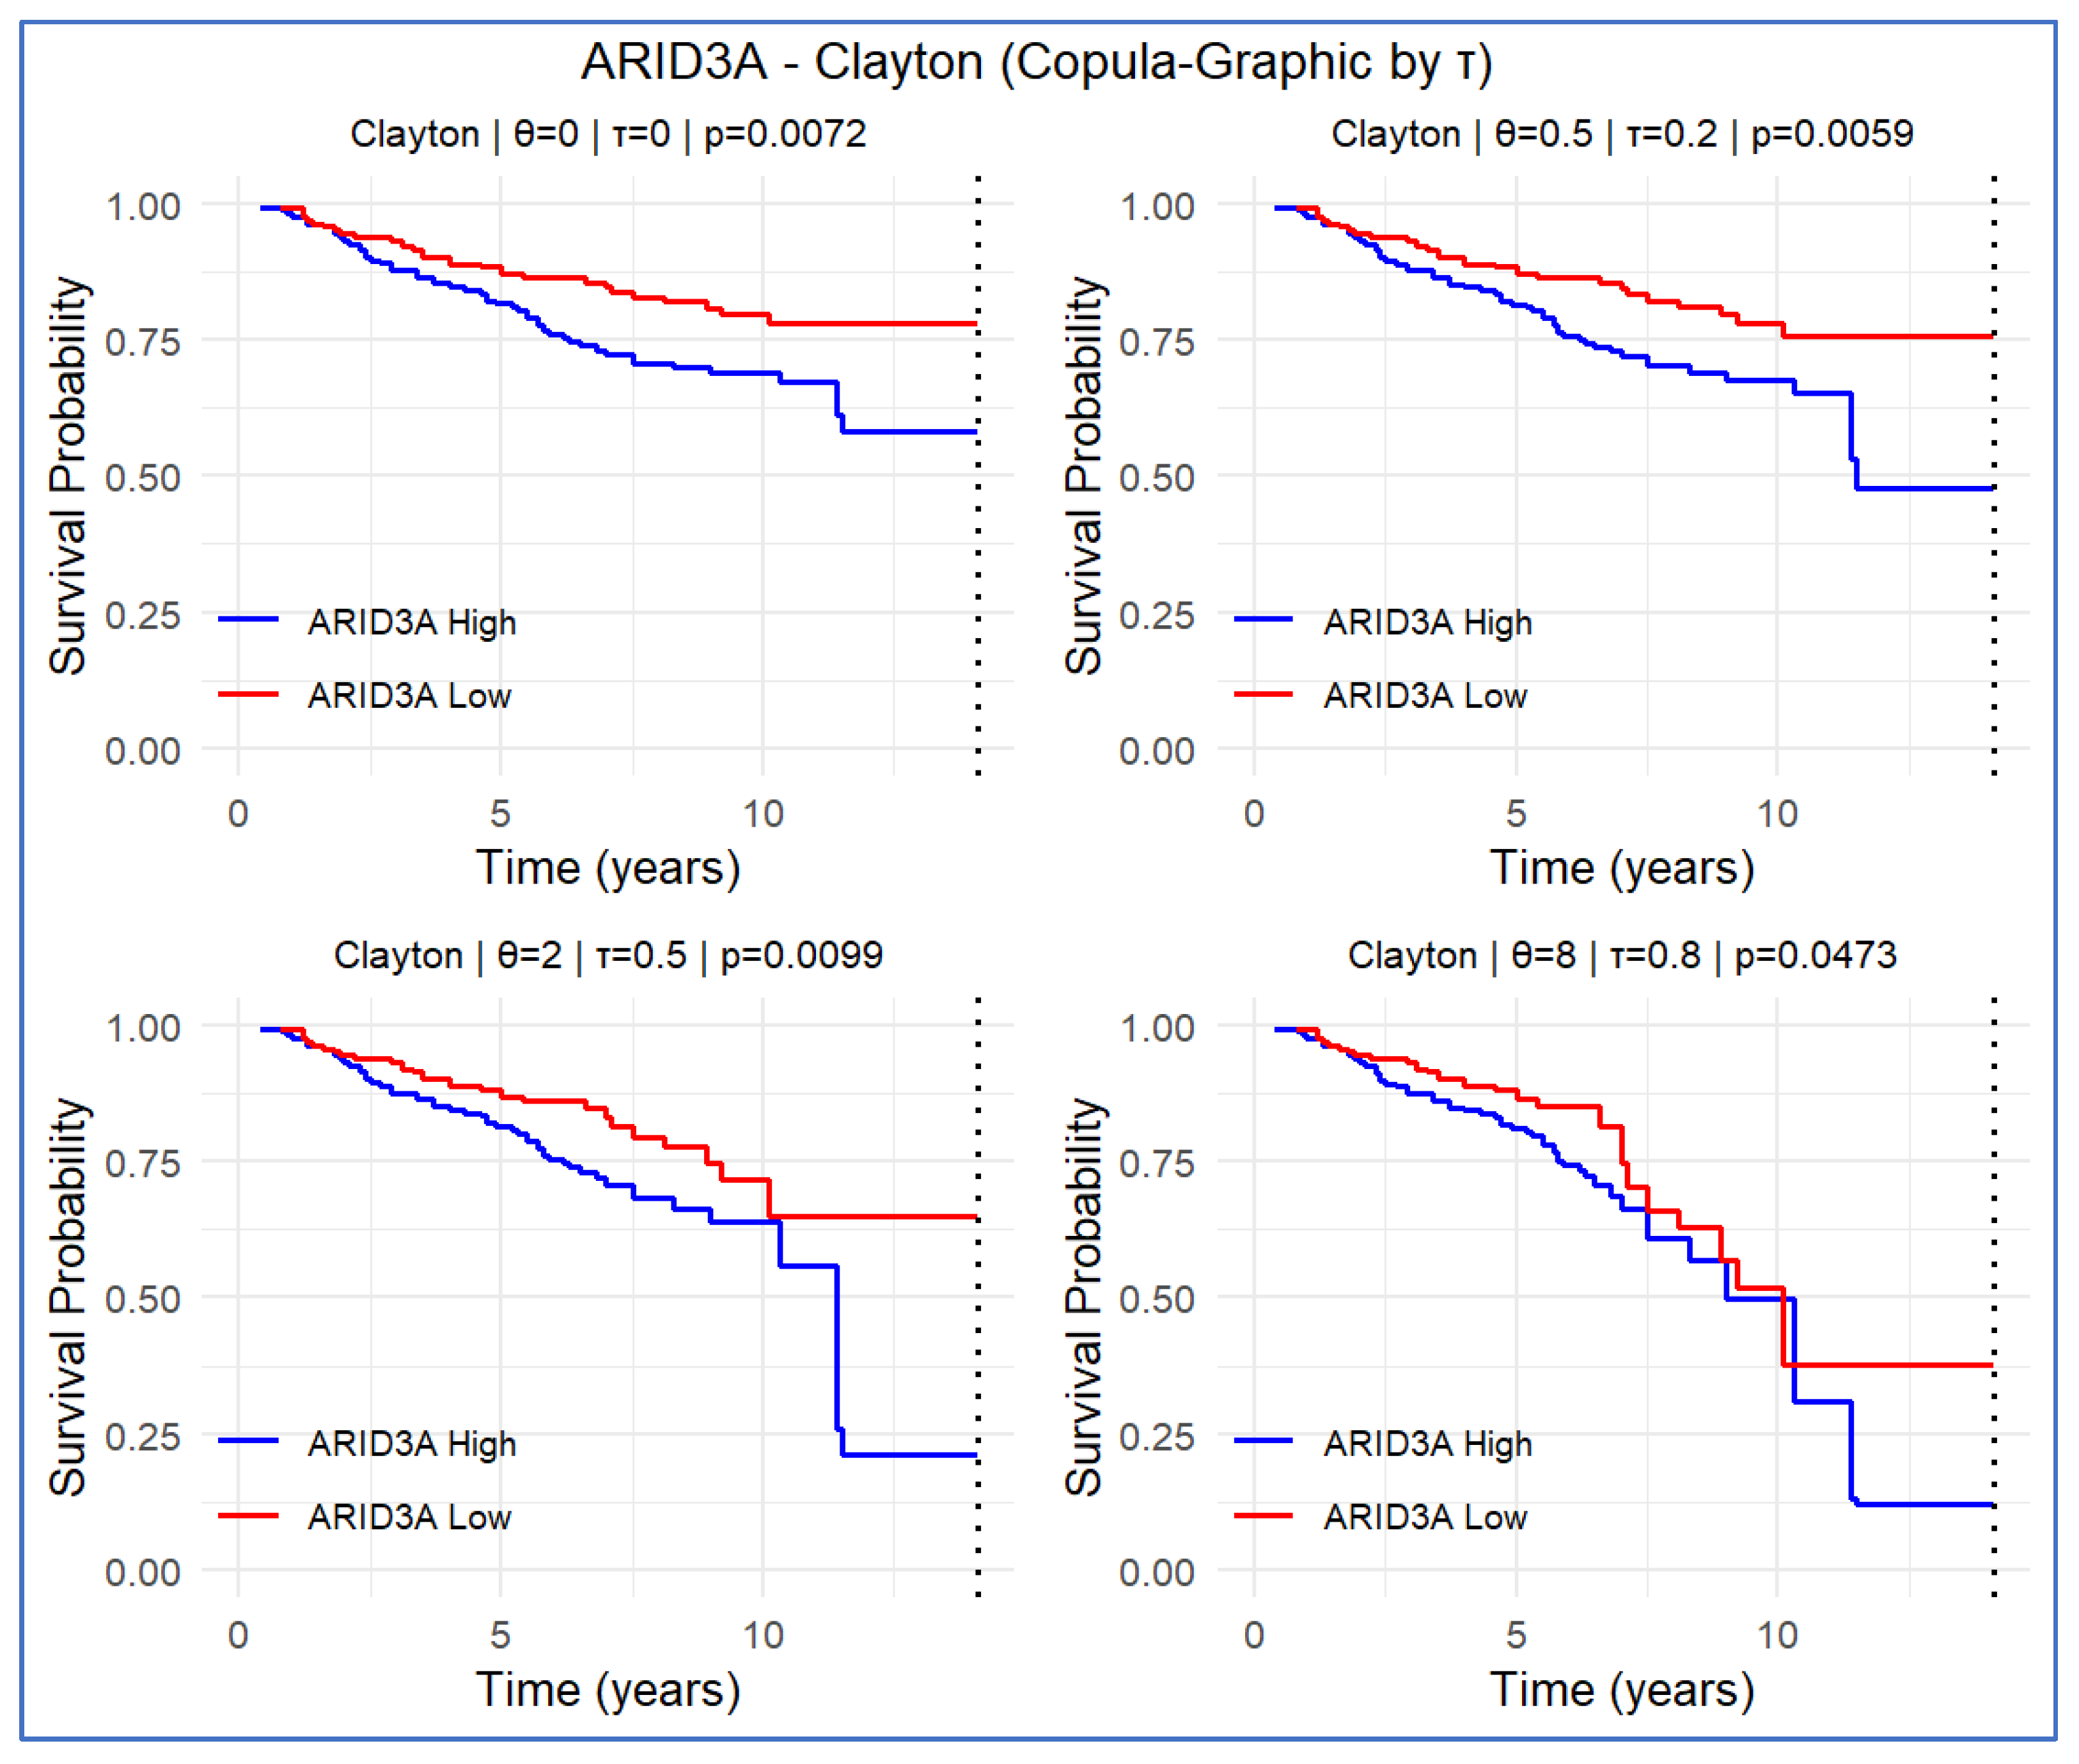
The ARID3A gene is significantly associated with survival under the independent censoring model. Specifically, KM estimators for survival curves demonstrate a clear separation between high- and low-expression groups as presented in Figure 3 (the case of θ = 0 ) and Table 1 (τ = 0). The Cox regression analysis yielded the HR of 2.1 (95% CI: 1.3–3.4), indicating that the unit increase in ARID3A expression increases the risk of death twice. However, for the CG estimators, the significance is reduced under the strongly dependent censoring scenario (τ  = 0.8 ). Indeed, the survival curves of the low- and high-expression groups cross at 10 years (τ  = 0.8 in Figure 3). Moreover, the HR approaches the null value when the dependence becomes stronger (Table 2). In summary, the significance declared using the traditional methods is reverted under the strongly dependent censoring scenario.

3.3. PKM2 Gene

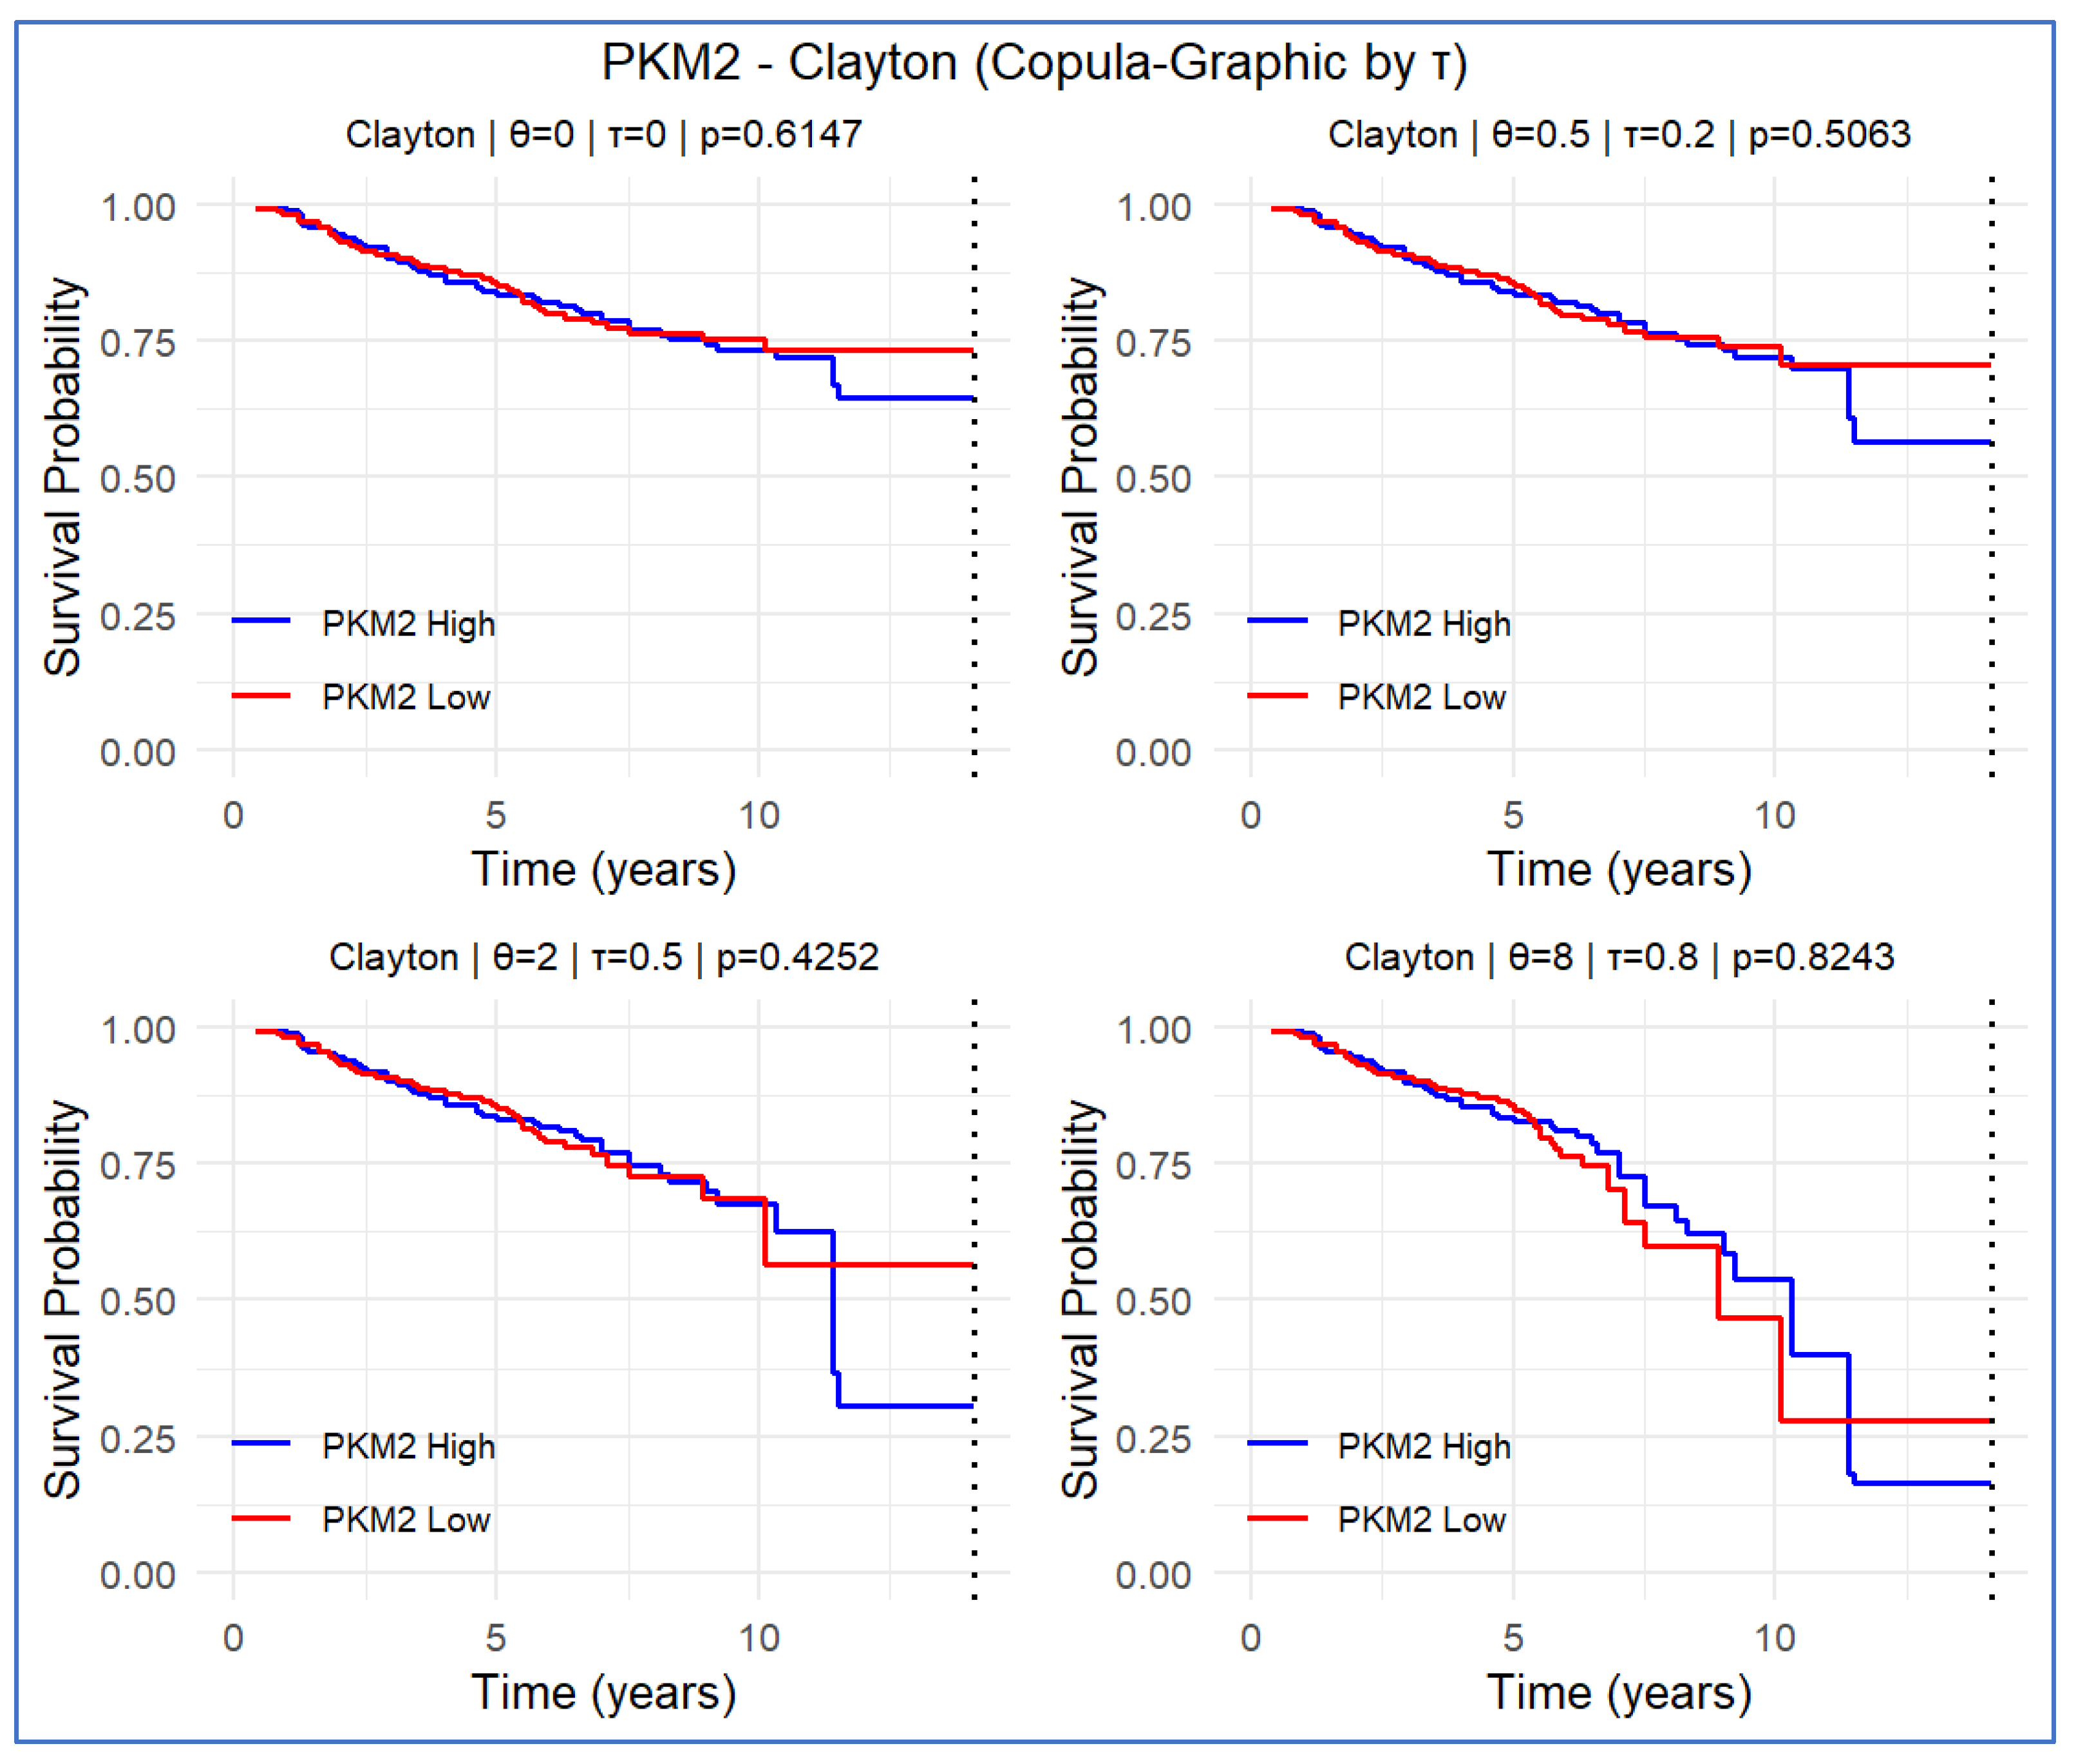
The KM estimators for survival probabilities indicate no significant difference between high- and low-expression groups (Figure 4 (the case of θ = 0 ) and Table 1 (τ = 0)). Even using the CG estimators accounting for dependent censoring, no difference is found (Figure 4 and Table 1). Furthermore, Cox regression produced non-significant HRs under both the independent and dependent censoring scenarios (Table 2), suggesting no effective impact on survival under varying levels of dependent censoring. This result indicates that the PKM2 gene has no influence on survival under various dependent censoring scenarios.

3.4. CCNA2 Gene

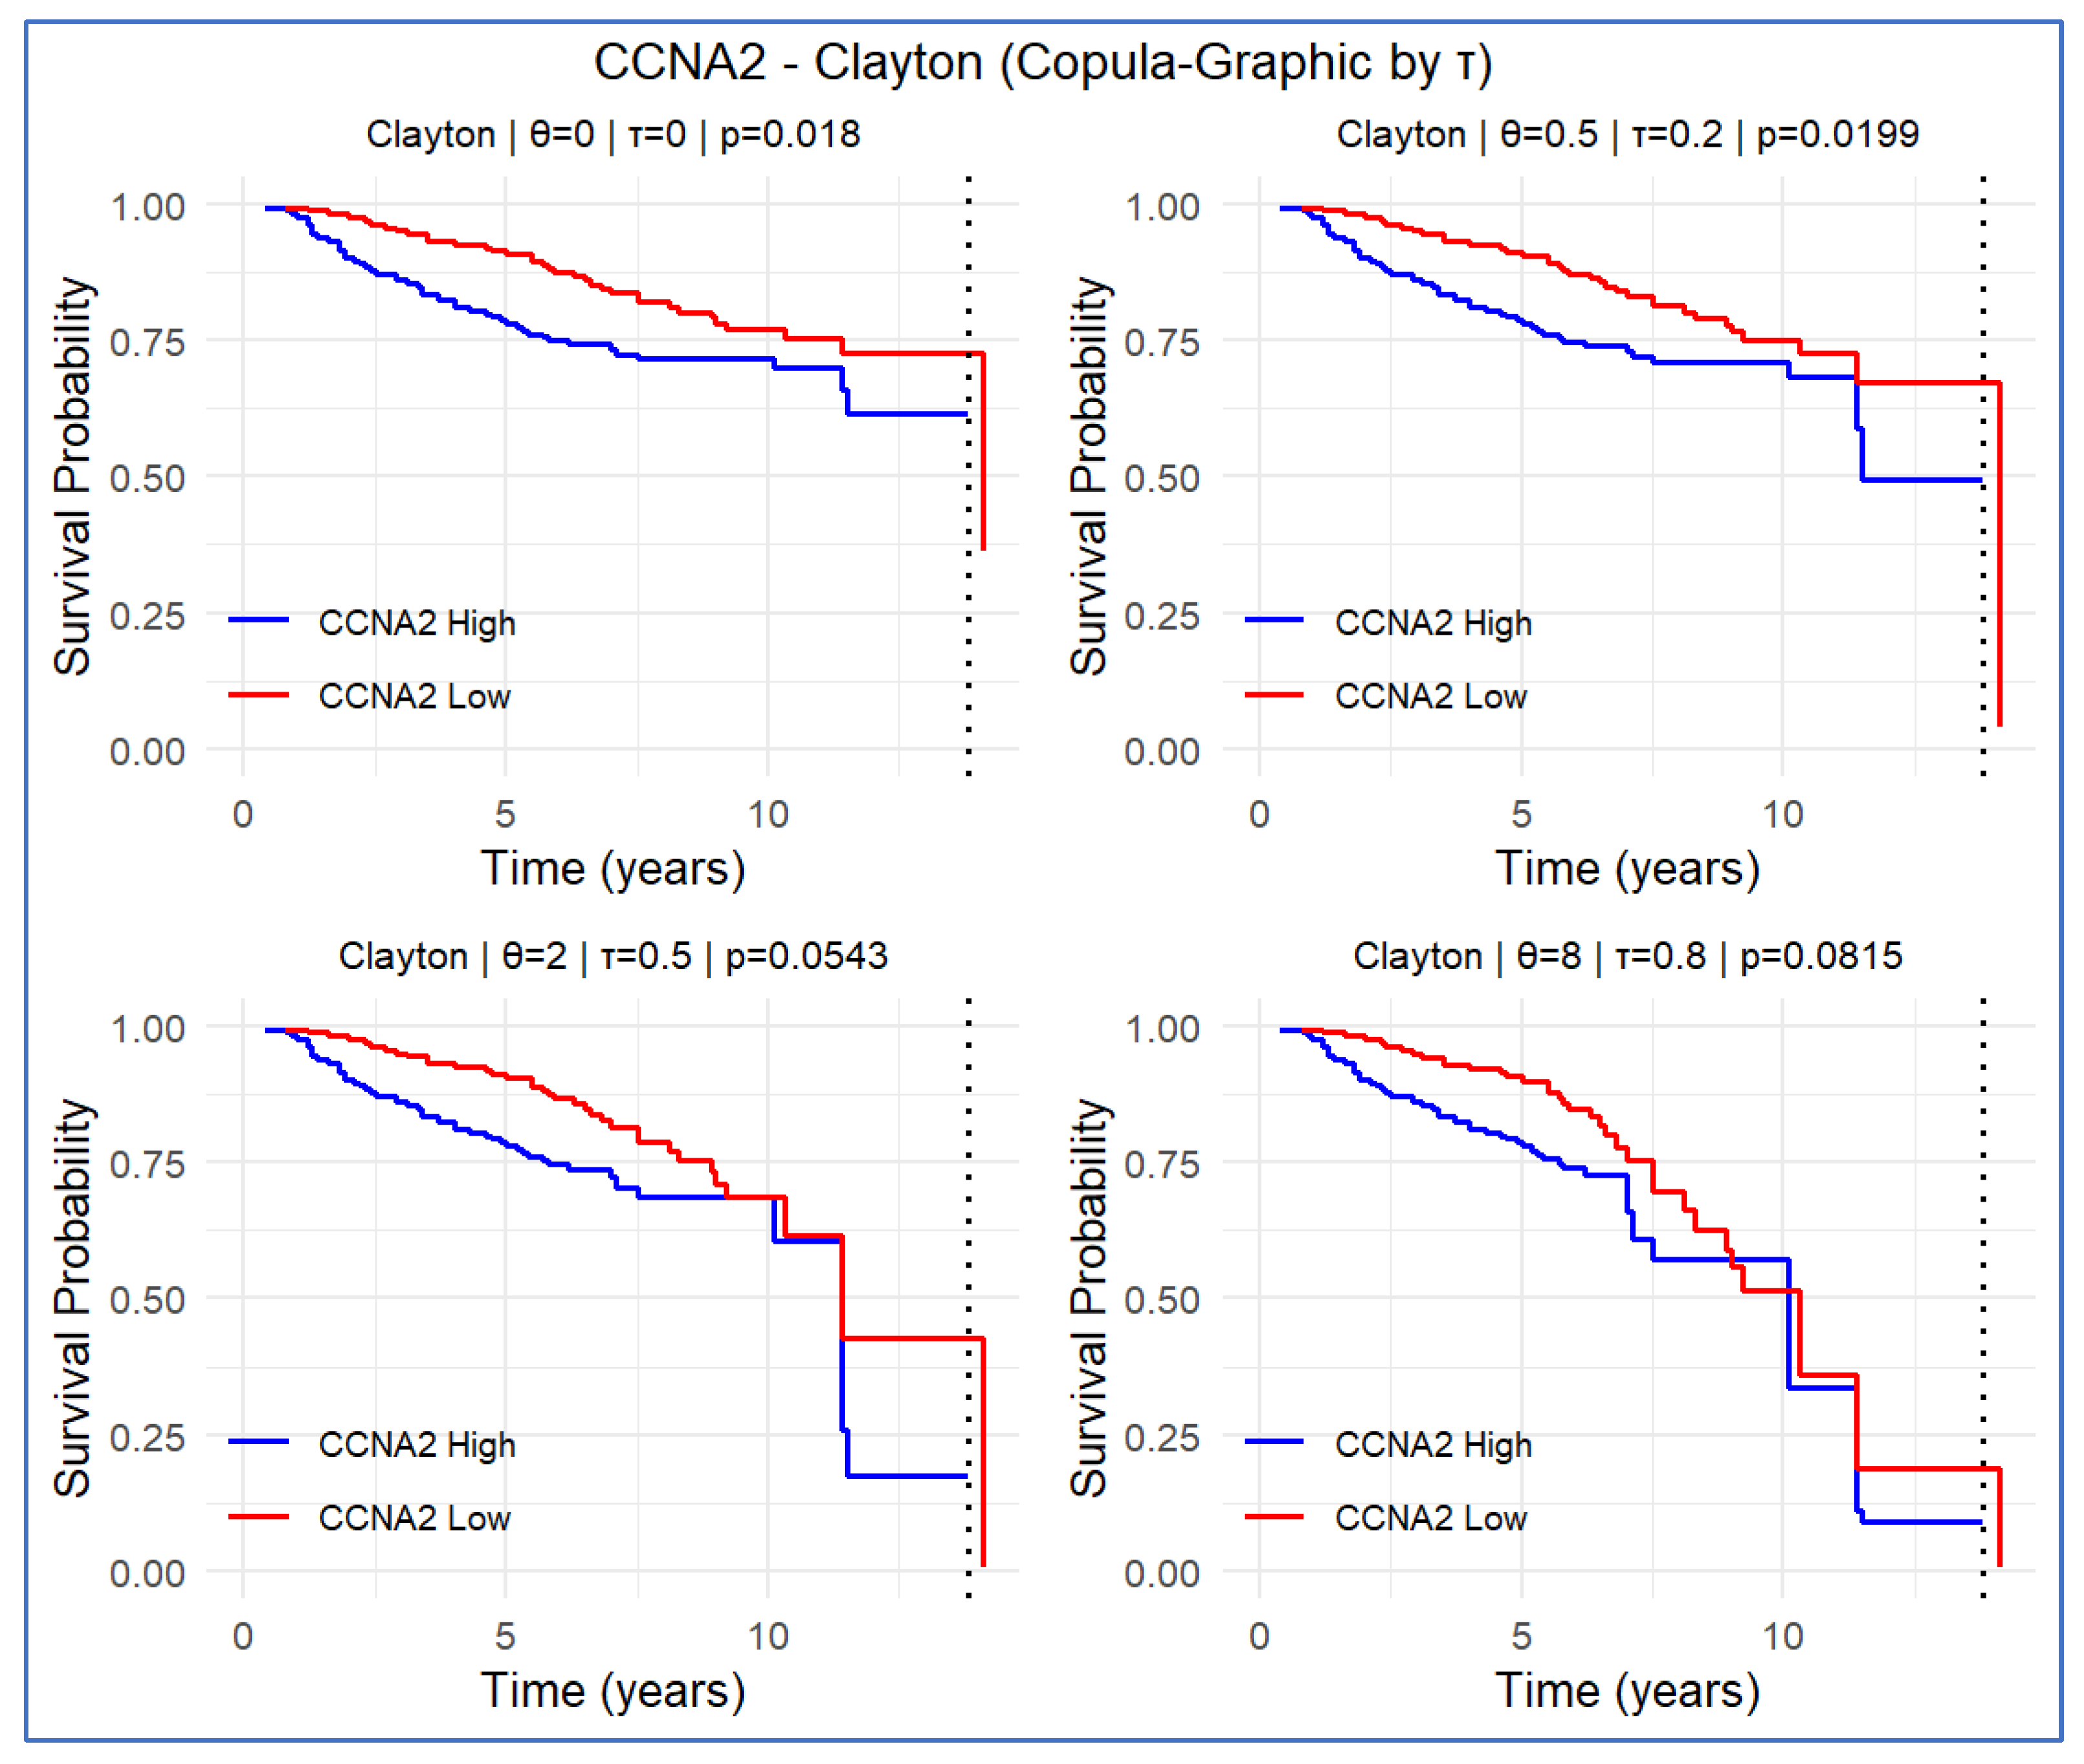
The survival probabilities estimated by the KM estimator indicated a significant difference between high- and low-expression groups (Figure 5 (the case of θ = 0 ) and Table 1 (τ = 0)). After accounting for dependent censoring using the CG estimators, the significance was somewhat reduced to non-significant levels due to the crossing of two survival curves. Especially, the p-values become higher than 0.05 under Kendall’s tau τ = 0.5 and 0.8. On the other hand, estimates for HR for the high- and low-expression groups are significant across various dependent censoring scenarios. This implies that the CCNA2 gene expression has a potential ability to predict survival; yet, it alone may be not be strong enough to justify the predictive ability. Thus, this gene will be considered as a component of the PI.

3.5. G6PD Gene

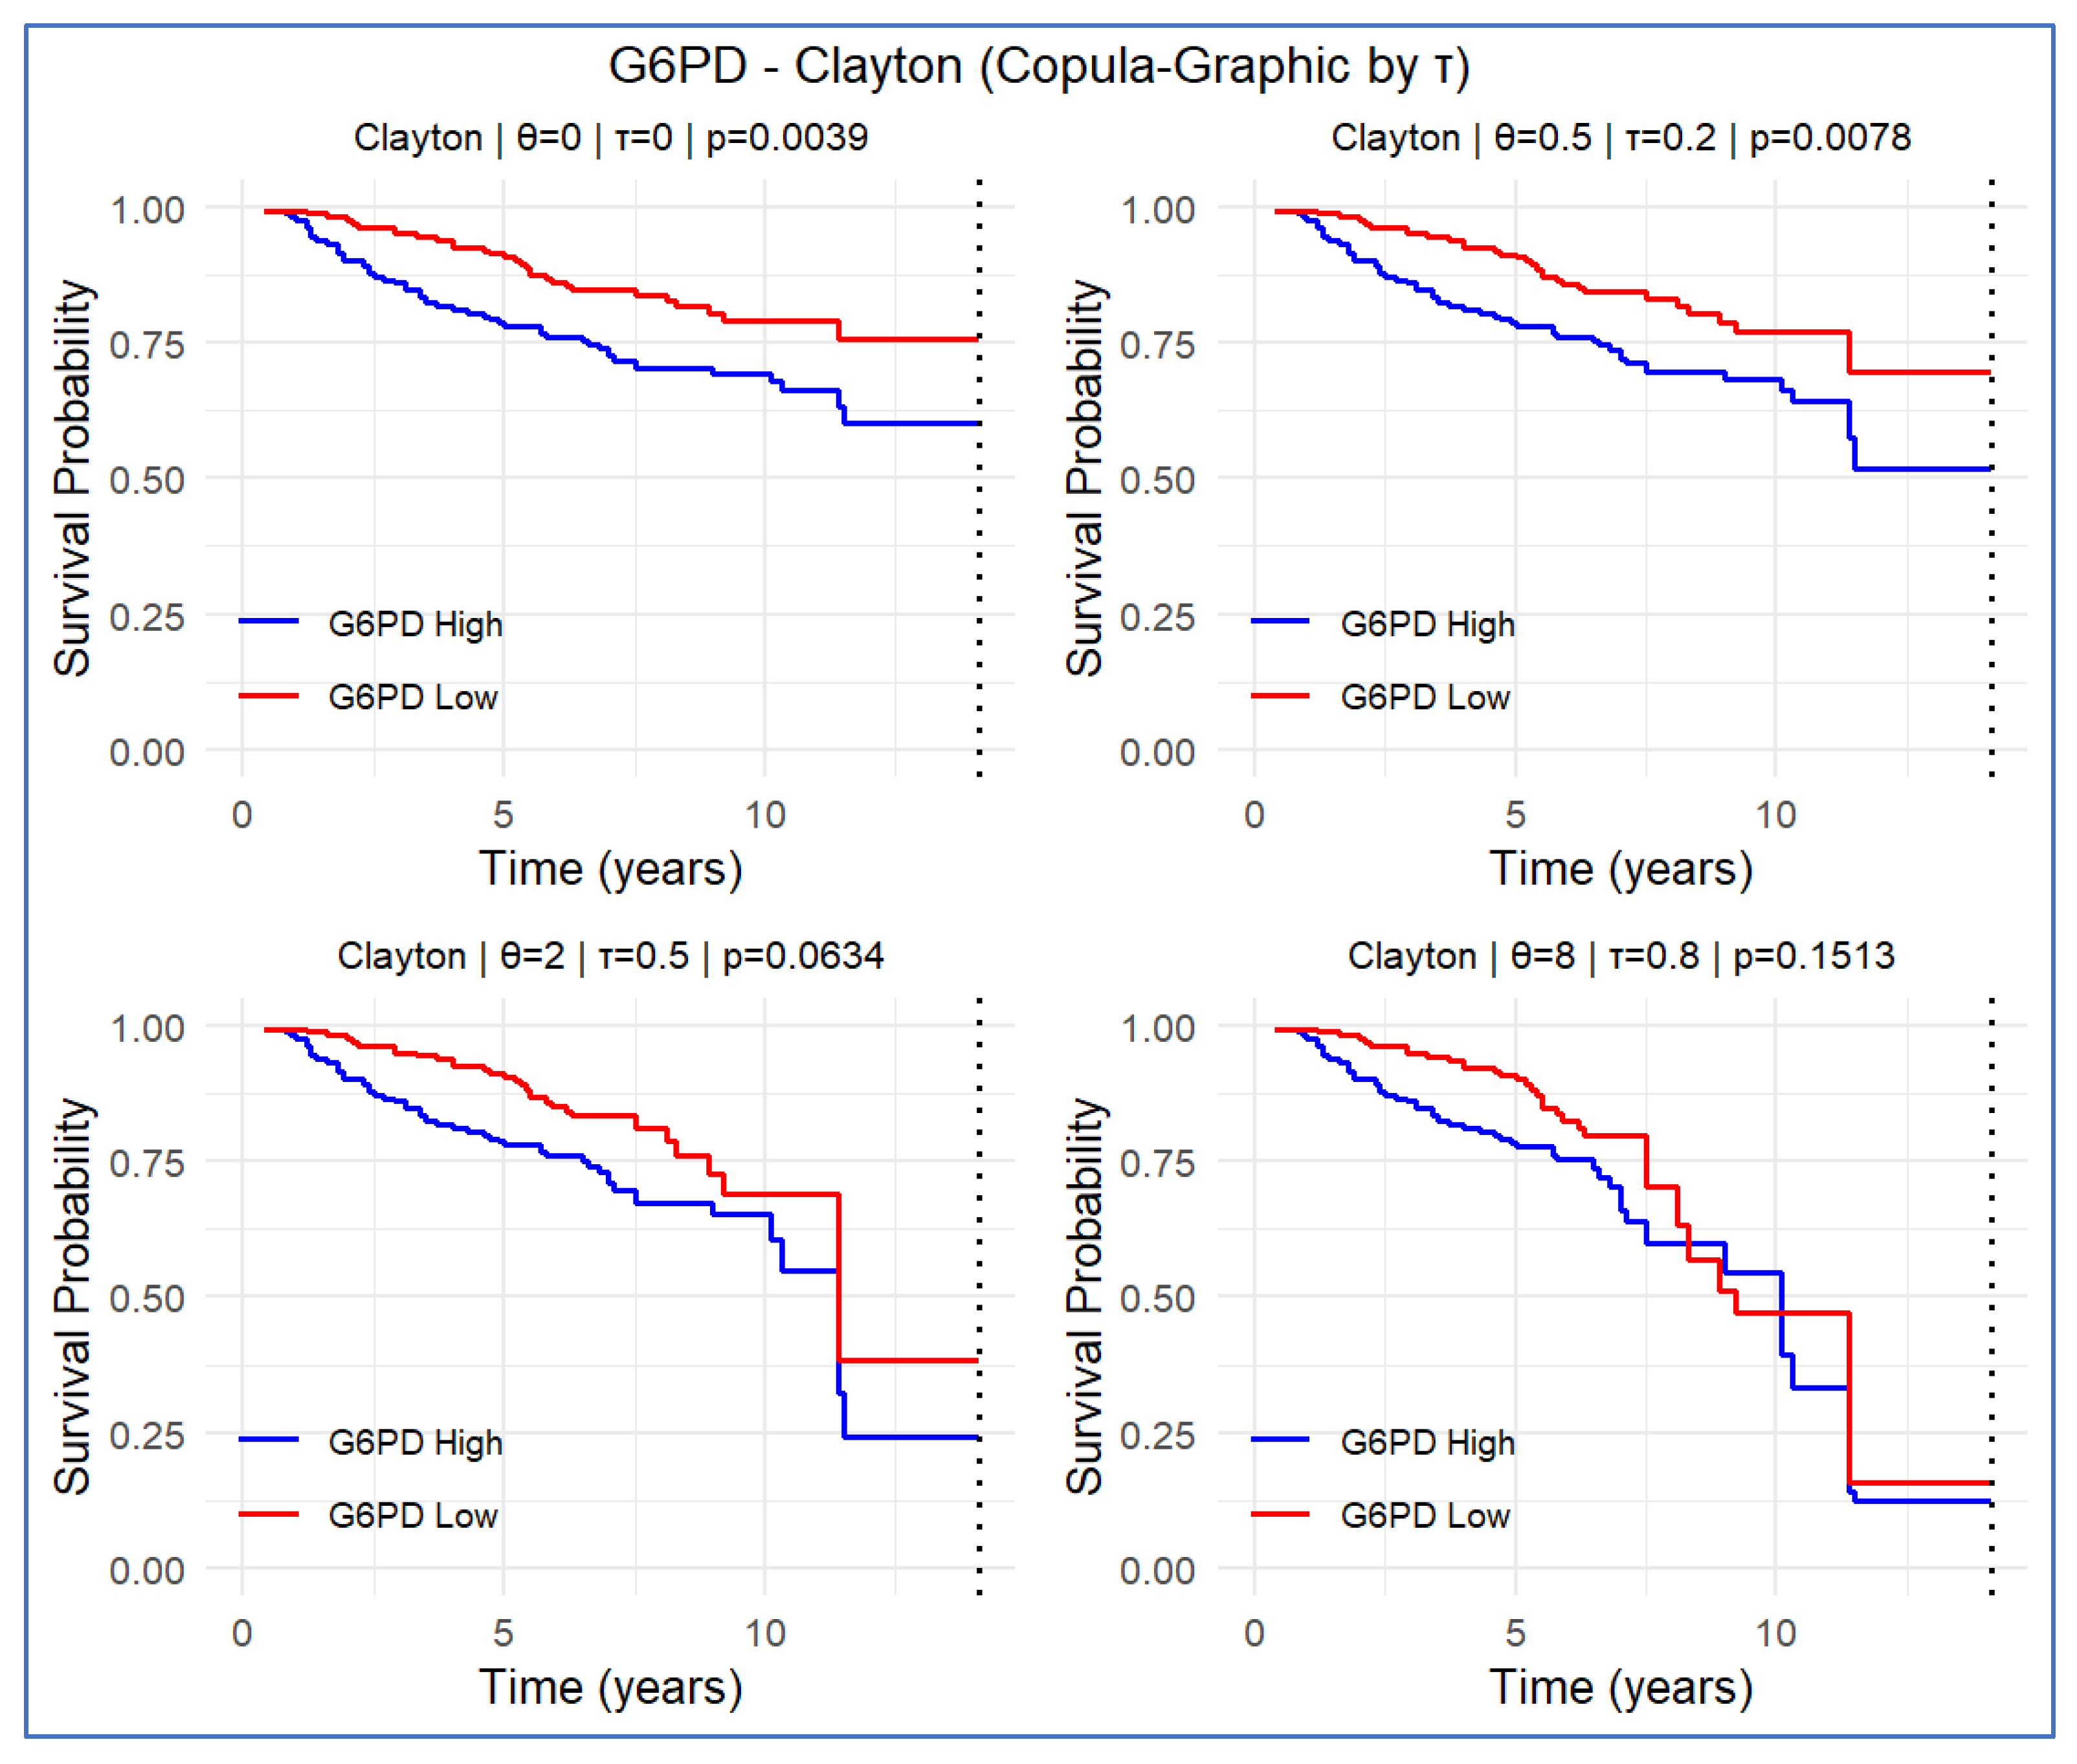
The high and low gene expression levels give significantly different KM estimators for survival (Figure 6 for the case of θ = 0 ). The difference remains clears under the weak dependent censoring scenario (Figure 6 for the case of θ = 0.2 ); yet, it reduces to non-significant levels under moderate and strong dependent censoring scenarios. We also find statistically significant HRs for survival under the independent censoring model ( θ = 0, τ = 0) (HR = 1.61, p < 0.001). The significance of HRs persists even after accounting for low-to-moderate dependent censoring. This observation demonstrates the predictive power of the G6PD gene expression under various dependent censoring scenarios.

3.6. Combining Five Genes

To combine the predictive abilities of individual genes, we created a PI by including significant genes and excluding non-significant genes under the independent censoring model (Table 2). The three genes yielded significance (ARID3A: HR = 2.10, p = 0.0023; CCNA2: HR = 1.22, p = 0.039; G6PD: HR = 1.55, p < 0.001). Using estimates β s from univariate Cox models using the uni.score(.) function, the resultant PI is the weighted sum:
P I = 0.744 × x A R I D 3 A + 0.194 × x C C N A 2 + 0.504 × x G 6 P D
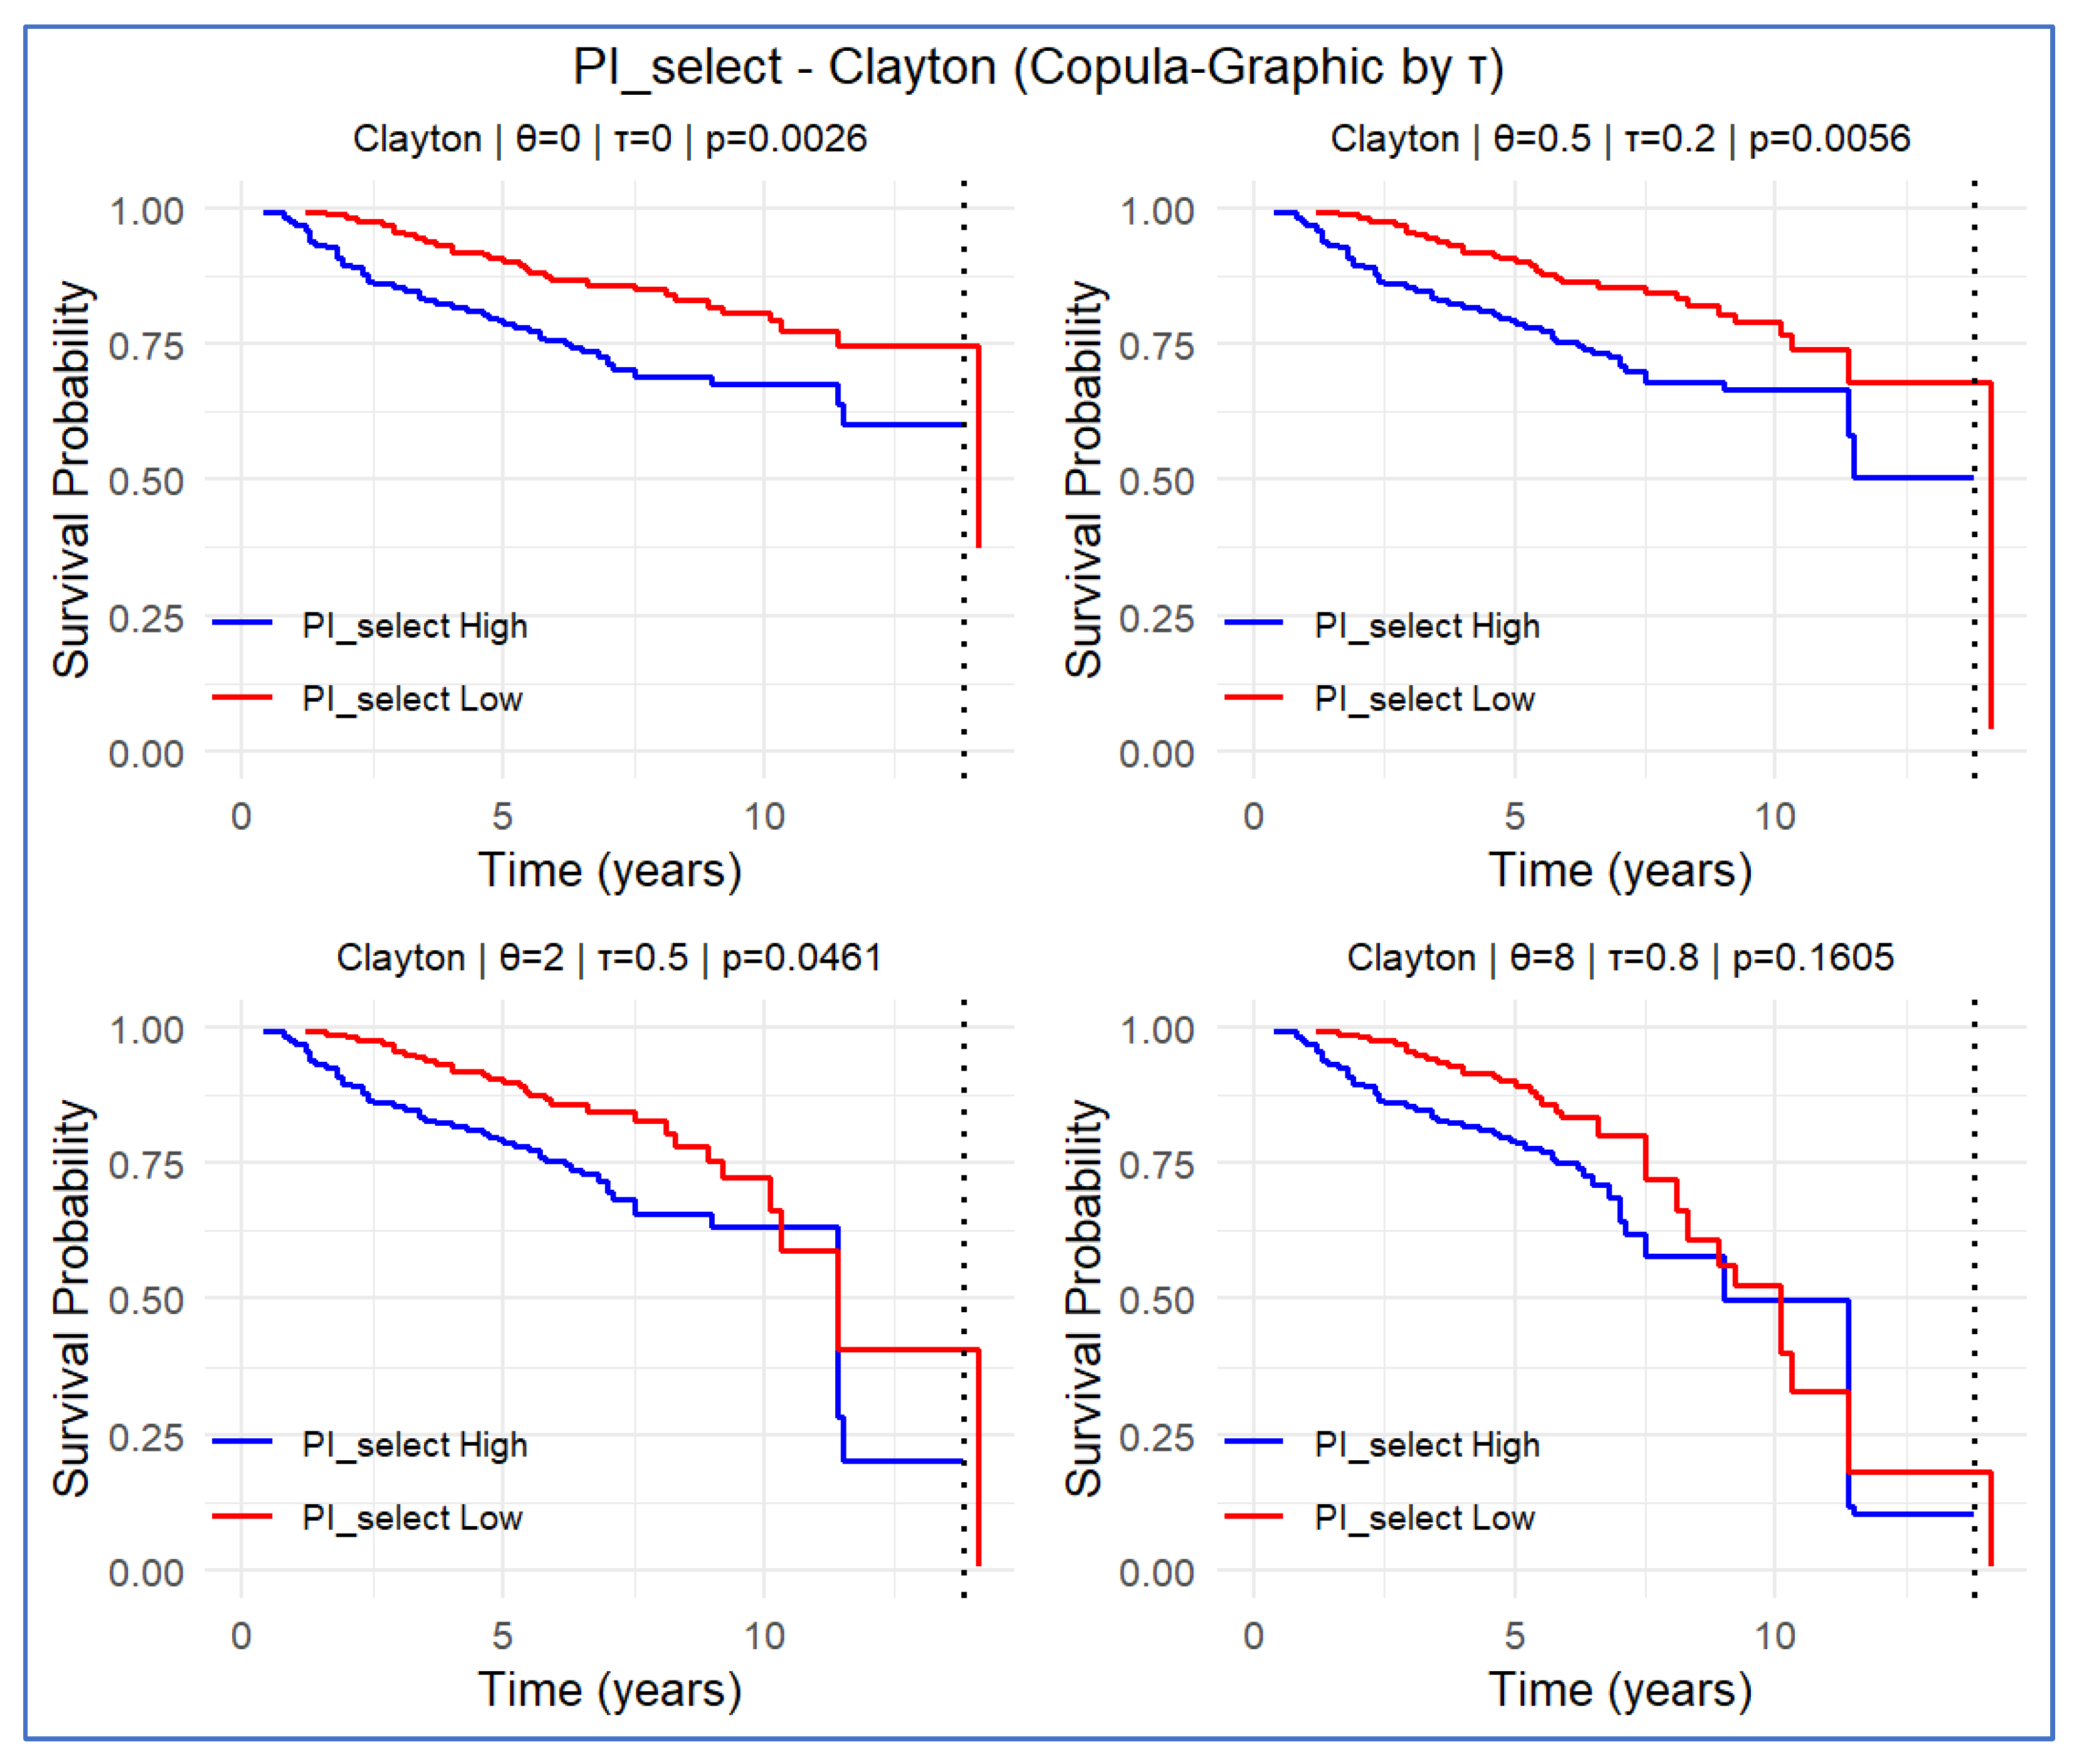
The PI exhibited quite a strong prognostic performance under independent censoring (τ = 0.00, HR = 1.995, p < 0.001). Moreover, the significance is stronger compared to the significance found for individual genes (Table 2). This means that the predictive power is enhanced by synthesizing the predictive power of the three genes. Moreover, the predictive power remains, even under weak or moderate degrees of dependent censoring (Table 2, Figure 7). However, the significance reduces under the strong dependent censoring at τ = 0.80: see Figure 7 (p = 0.1605) and Table 2 (HR = 1.122, p = 0.574).
In conclusion, although the PI yields a higher predictive ability than individual genes, its ability reduces to the non-significant level under the strong dependent censoring.

4. Simulation Study

We conducted a simulation study to validate the performance of the significance test based on a distance statistic D (defined in Section 2.4). We examined if the type I error rate is well-controlled, and if the power is reasonably high. Such a performance study has not been conducted in the literature since the method was proposed by [44] and implemented in the R function CG.test(.) in the R package compound.Cox [8].
We simulated survival time T i and censoring time U i from exponential survival models S t x i = exp exp β x i t and G u x i = exp u , where x i is a gene expression generated from the standard normal distribution. The value β was set in the range 1 β 1 . We adopted the Clayton copula with θ = 2 for the dependence, specified as
P ( T i > t , U i > u | x ) = S t x θ + G u x θ 1 1 θ ,             t , u 0 ,
Setting t i = m i n ( T i , U i ) and δ i = 1 { T i U i } , we formed an observed dataset of size n , denoted as ( t i , δ i , x i ) , i = 1 , 2 , , n , with n = 50   a n d   100 . A significance test was caried out by applying the dataset to the CG.test(.) function at the significance level of α , 0.01, 0.05, and 0.10. We analyzed the power (rejection rates defined as the proportion of p-values less than α ) for the test based on 1000 repetitions. We plotted the power as a function of β in the range 1 β 1 .
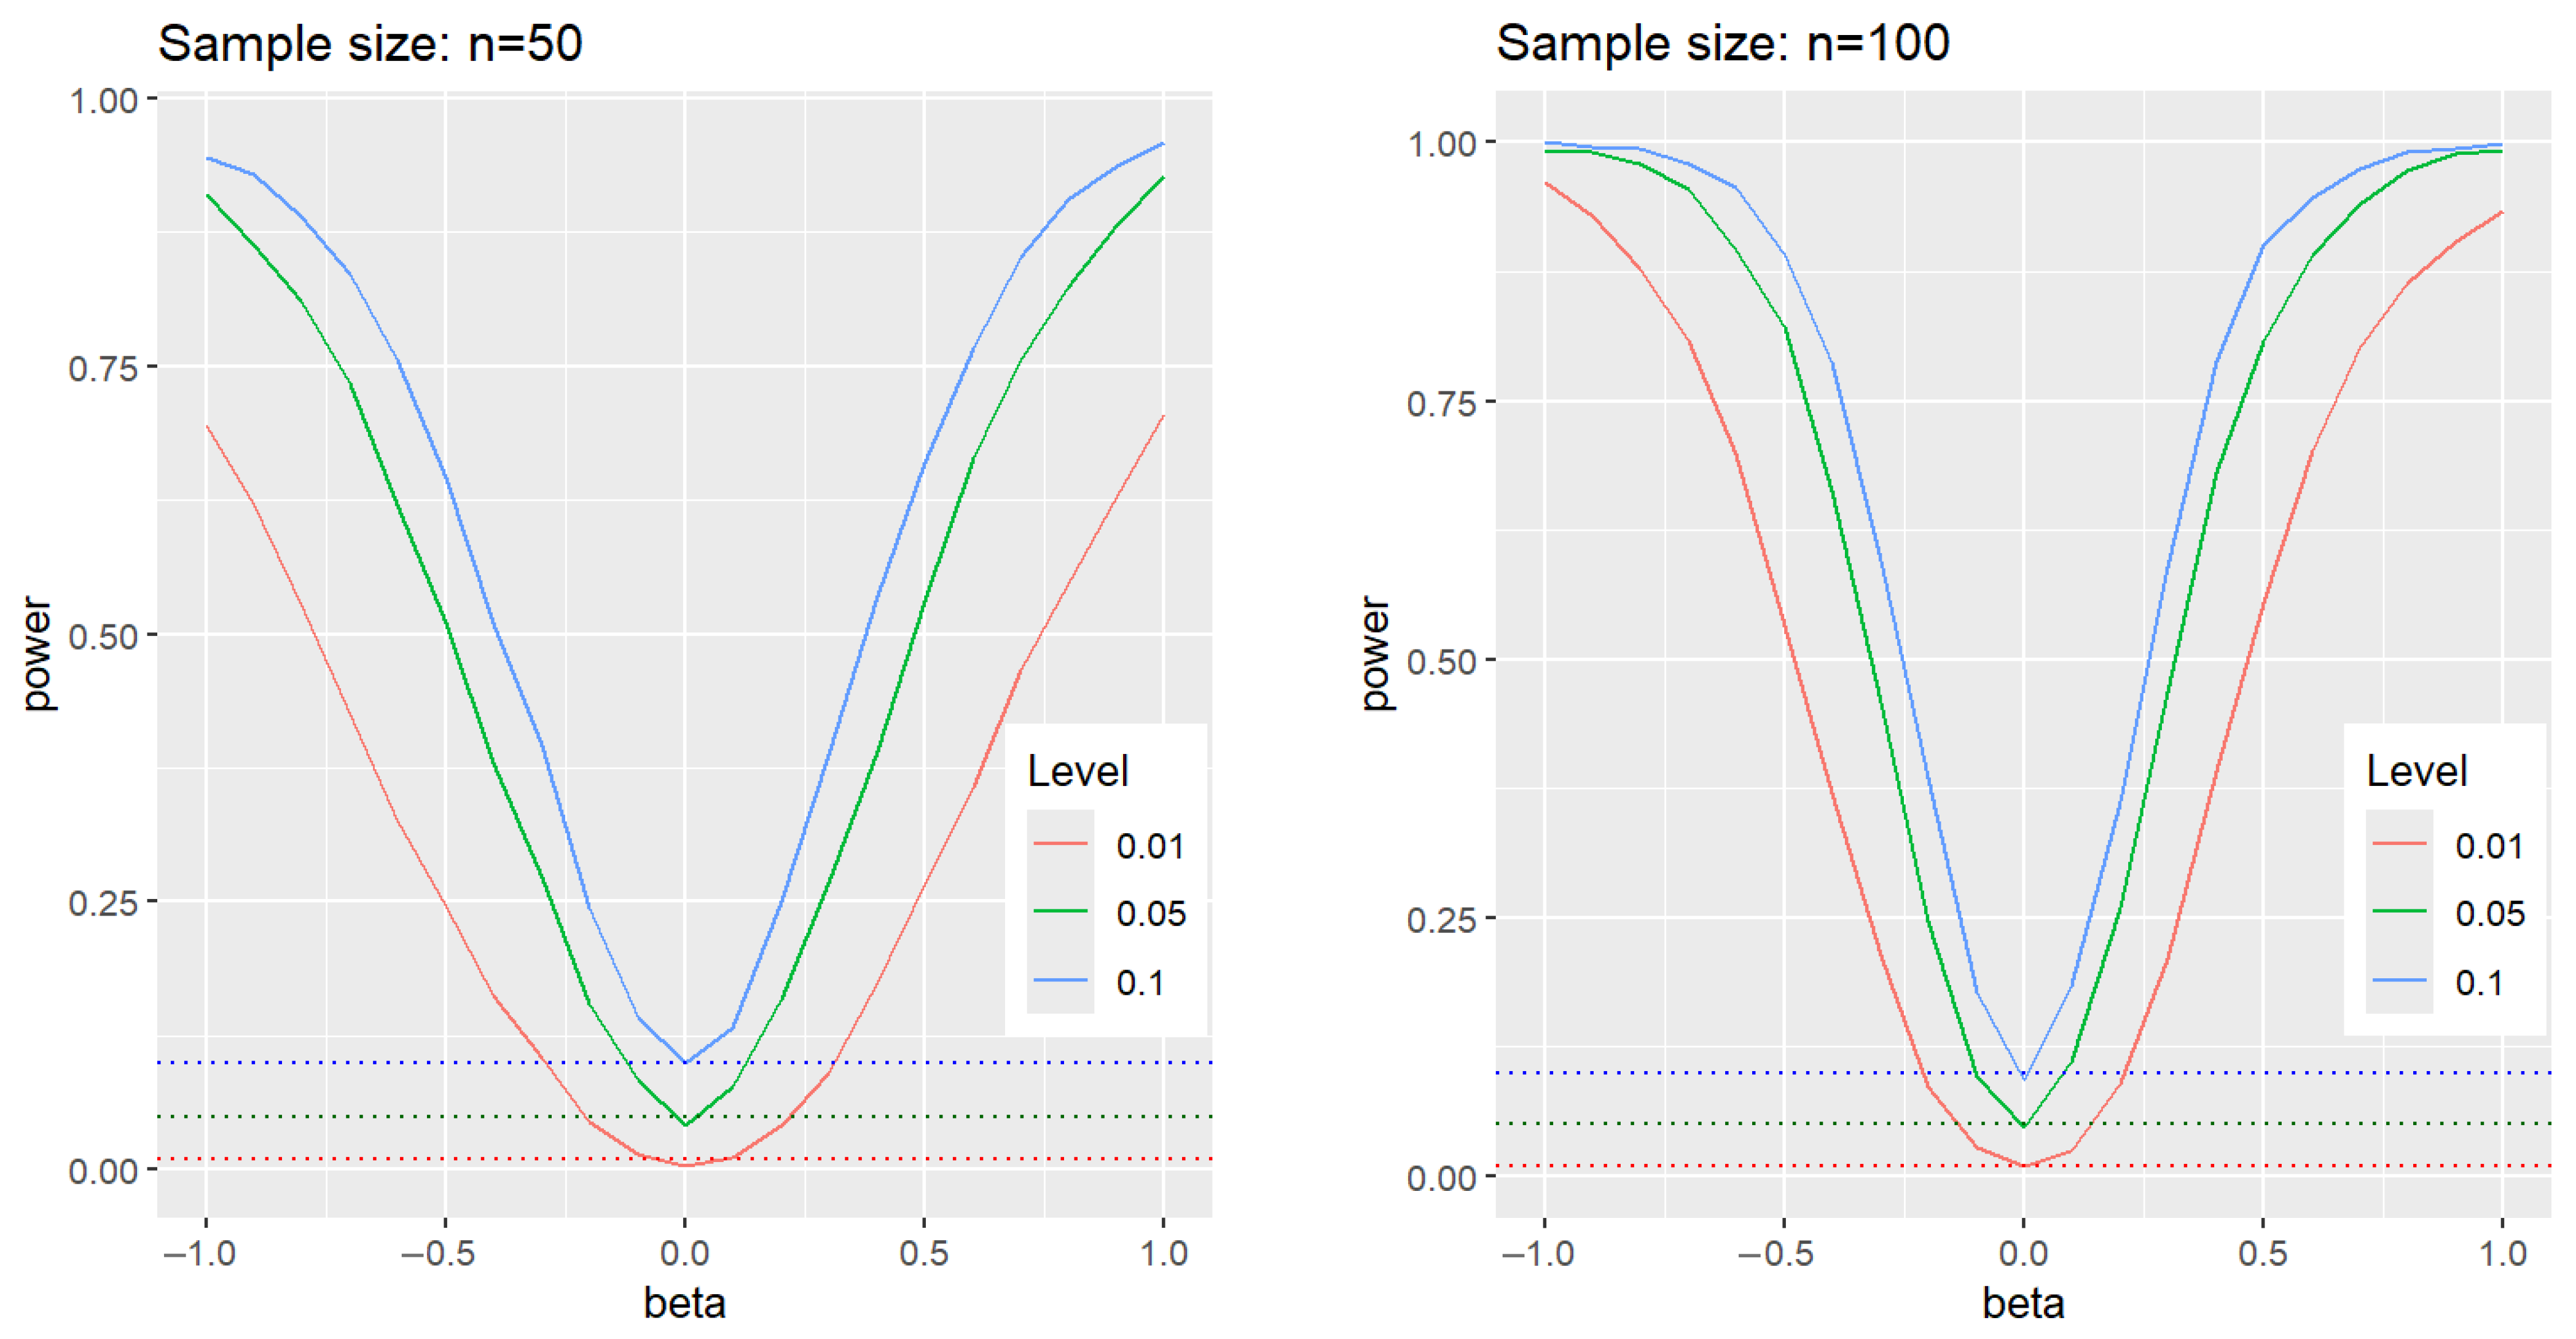
Figure 8 displays the power functions of β for the CG.test(.). We observe that the power functions at β = 0 are close to the significance level of 0.01, 0.05, and 0.10. Hence, the type I error rates are well-controlled. We also observe that the power functions become higher as β deviates from zero or n increases. This indicates the desired ability to detect the effect of gene expression on survival.

5. Conclusions and Discussion

In this article, we have introduced copula-based tools to cope with dependent censoring phenomena when developing survival prognostic models using gene expressions. These statistical tools consist of the CG estimator [45] for estimating survival probabilities and the Clayton–Cox model [43] for estimating HRs, both of which are valid under dependent censoring. These copula methods can effectively adjust for the impact of dependent censoring on survival data. We have also reviewed the R software (version 4.5.1) functions to implement these tools. While these copula methods are known in the statistical literature, they have not been widely used in the field of molecular genetics. Therefore, the major contribution of this article is to introduce these copula approaches to researchers of molecular genetics via its empirical application to the prognostic analyses of lactylation-related genes. Another methodological contribution is the simulation-based validation of the significance test based on a distance statistic D (Section 4).
The dependent censoring phenomenon is an important concern among medical statisticians in a variety of survival analysis methods [38,39,59]. While the problem of dependent censoring is not avoidable in real datasets, the copula-based methods can assess the influence of dependent censoring. This article illustrates how to analyze the influence of dependent censoring by copula-based models for dependent censoring. An important finding from our data analysis is that the significance of the three genes found in the independent censoring model is reversed in the presence of strongly dependent censoring (Section 3). This implies that some prognostic genes previously declared “significant” should be re-analyzed using the dependent censoring models. In addition, a strong impact of dependent censoring on the analysis results will be found in future genomic studies.
When developing a multi-gene predictor, a common practice is to re-fit a multivariate Cox regression model based on the selected genes. However, we have reservations about this strategy due to the poor predictive performance observed in many papers [62]. Alternatively, we have suggested using the PI based on a compound covariate predictor (Section 2.6) that combines the results from univariate Cox models without going through a multivariate analysis. This approach is commonly used to build a prognostic model based on DNA microarray data in medical studies [22,43,44,61,63,64,65,66,67]. This approach has the advantage of directly incorporating the significance analysis of gene selections into the construction of a predictor. In the data analysis, we constructed the PI based on three significant genes (ignoring two non-significant genes). We conducted an additional analysis to confirm that the inclusion of non-significant genes (which results in a five-gene PI) do not give additional predictive power over the three-gene PI (Supplement).
Finally, all the results of this article are easily reproduced by the dataset and computer code (R code) available in the Supplementary Materials. The computation time to produce all the numerical results of the article is a few hours. If users wish to apply the copula models for dependent censoring, they can first run the R code, and then modify the dataset and code according to their needs.

Supplementary Materials

The following supporting information can be downloaded at https://www.mdpi.com/article/10.3390/math13233735/s1, “Breast cancer data.csv”, “survival analysis of breast cancer.R”, and “simulation.R” files. These files contain the dataset and the R code to reproduce all the results of the article. Moreover, “Supplement” contains the estimated survival curves using the CG estimators under the Frank and Gumbel copulas, which are separated by the high and low gene expressions. We also provide the estimated survival curves under the Clayton, Frank, and Gumbel copulas, which separated by the PI based on the five genes.

Author Contributions

Conceptualization, T.E.; formal analysis, C.A.K. and T.E.; funding acquisition, G.-Y.L.; methodology, C.A.K. and T.E.; supervision, G.-Y.L. and T.E.; writing—original draft, C.A.K. and T.E. All authors have read and agreed to the published version of the manuscript.

Funding

This work was financially supported by JSPS KAKENHI (25K15036).

Data Availability Statement

All the results in this article are reproducible by the dataset and R code available in the Supplementary Materials.

Acknowledgments

We thank the four anonymous reviewers for their helpful comments that greatly improved the presentation of the manuscript.

Conflicts of Interest

The funders had no role in the design of the study; in the collection, analyses, or interpretation of the data; in the writing of the manuscript; or in the decision to publish the results.

Appendix A. Examples of CG Estimators

This subsection describes some examples of the CG estimators in order to compute survival curves. Under the Clayton copula, the CG estimator is
S ^ 1 C G ( t ) = 1 i : t i t , δ i = 1 ,     x i > c n 1 j 1 n 1 θ n 1 j n 1 θ 1 θ .
If the generator is ϕ θ t = ( log t ) θ + 1 for θ 0 , it yields the Gumbel copula:
ϕ θ 1 ϕ θ ( v ) + ϕ θ ( w ) = exp log v θ + 1 + log w θ + 1 1 θ + 1 , 0 < v , w < 1 , θ 0 .
For the Gumbel copula, Kendall’s tau for dependency is given by θ / ( θ + 1 ) . The resultant Gumbel CG estimator is
S ^ 1 C G ( t ) = exp i : t i t , δ i = 1 ,     x i > c log n 1 j 1 n 1 θ + 1 log n 1 j n 1 θ + 1 1 1 + θ .
Finally, one can obtain the Frank CG estimator by the generator ϕ θ ( t ) = log { ( e θ t 1 ) / ( e θ 1 ) } , θ 0 . The CC estimator under the Frank copula is also derived in a similar fashion.

References

  1. Witten, D.M.; Tibshirani, R. Survival analysis with high-dimensional covariates. Stat. Methods Med. Res. 2010, 19, 29–51. [Google Scholar] [CrossRef] [PubMed]
  2. Newcombe, P.J.; Ali, H.R.; Blows, F.M.; Provenzano, E.; Pharoah, P.; Caldas, C.; Richardson, S. Weibull regression with Bayesian variable selection to identify prognostic tumour markers of breast cancer survival. Stat. Methods Med. Res. 2017, 26, 414–436. [Google Scholar] [CrossRef] [PubMed]
  3. Zhang, Q.; Wang, J.; Liu, M.; Zhu, Q.; Li, Q.; Xie, C.; Han, C.; Wang, Y.; Gao, M.; Liu, J. Weighted correlation gene network analysis reveals a new stemness index-related survival model for prognostic prediction in hepatocellular carcinoma. Aging 2020, 12, 13502. [Google Scholar] [CrossRef] [PubMed]
  4. Bhattacharjee, A. Big Data Analytics in Oncology with R; CRC Press: New York, NY, USA, 2022. [Google Scholar]
  5. Chen, H.-Y.; Yu, S.-L.; Chen, C.-H.; Chang, G.-C.; Chen, C.-Y.; Yuan, A.; Cheng, C.-L.; Wang, C.-H.; Terng, H.-J.; Kao, S.-F.; et al. A five-gene signature and clinical outcome in non-small-cell lung cancer. N. Engl. J. Med. 2007, 356, 11–20. [Google Scholar]
  6. Beer, D.G.; Kardia, S.L.; Huang, C.-C.; Giordano, T.J.; Levin, A.M.; Misek, D.E.; Lin, L.; Chen, G.; Gharib, T.G.; Thomas, D.G.; et al. Gene-expression profiles predict survival of patients with lung adenocarcinoma. Nat. Med. 2002, 8, 816–824. [Google Scholar] [CrossRef]
  7. Emura, T.; Chen, Y.-H.; Chen, H.-Y. Survival prediction based on compound covariate under Cox proportional hazard models. PLoS ONE 2012, 7, e47627. [Google Scholar] [CrossRef]
  8. Emura, T.; Matsui, S.; Chen, H.-Y. compound.Cox: Univariate feature selection and compound covariate for predicting survival. Comput. Methods Programs Biomed. 2019, 168, 21–37. [Google Scholar] [CrossRef]
  9. Jenssen, T.K.; Kuo, W.P.; Stokke, T.; Hovig, E. Association between gene expressions in breast cancer and patient survival. Hum. Genet. 2002, 111, 411–420. [Google Scholar] [CrossRef]
  10. Kao, K.J.; Chang, K.M.; Hsu, H.C.; Huang, A.T. Correlation of microarray-based breast cancer molecular subtypes and clinical outcomes: Implications for treatment optimization. BMC Cancer 2011, 11, 143. [Google Scholar] [CrossRef]
  11. Li, D.; Hu, X.J.; Wang, R. Evaluating Association between Two Event Times with Observations Subject to Informative Censoring. J. Am. Stat. Assoc. 2023, 118, 1282–1294. [Google Scholar] [CrossRef]
  12. Sotiriou, C.; Wirapati, P.; Loi, S.; Harris, A.; Fox, S.; Smeds, J.; Nordgren, H.; Farmer, P.; Praz, V.; Haibe-Kains, B.; et al. Gene expression profiling in breast cancer: Understanding the molecular basis of histologic grade to improve prognosis. J. Natl. Cancer Inst. 2006, 98, 262–272. [Google Scholar] [CrossRef]
  13. Haibe-Kains, B.; Desmedt, C.; Loi, S.; Culhane, A.; Bontempi, G.; Quackenbush, J.; Sotiriou, C. A Five-Gene Model to Robustly Identify Breast Cancer Molecular Subtypes. J. Natl. Cancer Inst. 2012, 104, 311–325. [Google Scholar] [CrossRef]
  14. Peng, M.; Xiang, L. Correlation-based joint feature screening for semi-competing risks outcomes with application to breast cancer data. Stat. Methods Med. Res. 2021, 30, 2428–2446. [Google Scholar] [CrossRef]
  15. Li, F.; Niu, Y.; Zhao, W.; Yan, C.; Qi, Y. Construction and validation of a prognostic model for lung adenocarcinoma based on endoplasmic reticulum stress-related genes. Sci. Rep. 2022, 12, 19857. [Google Scholar] [CrossRef]
  16. Ding, H.; Shi, L.; Chen, Z.; Lu, Y.; Tian, Z.; Xiao, H.; Deng, X.; Chen, P.; Zhang, Y. Construction and evaluation of a prognostic risk model of tumor metastasis-related genes in patients with non-small cell lung cancer. BMC Med. Genom. 2022, 15, 187. [Google Scholar] [CrossRef] [PubMed]
  17. Neto, C.; Brito, M.; Lopes, V.; Peixoto, H.; Abelha, A.; Machado, J. Application of Data Mining for the Prediction of Mortality and Occurrence of Complications for Gastric Cancer Patients. Entropy 2019, 21, 1163. [Google Scholar] [CrossRef]
  18. Zhang, H.; Lin, Y.; Zhuang, M.; Zhu, L.; Dai, Y.; Lin, M. Screening and identification of CNIH4 gene associated with cell proliferation in gastric cancer based on a large-scale CRISPR-Cas9 screening database DepMap. Gene 2023, 850, 146961. [Google Scholar] [CrossRef] [PubMed]
  19. Wang, S.Y.; Wang, Y.X.; Shen, A.; Jian, R.; An, N.; Yuan, S.Q. Construction and validation of a prognostic prediction model for gastric cancer using a series of genes related to lactate metabolism. Heliyon 2023, 9, e16157. [Google Scholar] [CrossRef]
  20. Yoshihara, K.; Tajima, A.; Yahata, T.; Kodama, S.; Fujiwara, H.; Suzuki, M.; Onishi, Y.; Hatae, M.; Sueyoshi, K.; Fujiwara, H.; et al. Gene Expression Profile for Predicting Survival in Advanced-Stage Serous Ovarian Cancer across Two Independent Datasets. PLoS ONE 2010, 5, e9615. [Google Scholar] [CrossRef] [PubMed]
  21. Jin, M.; Ni, D.; Cai, J.; Yang, J. Identification and validation of immunity-and disulfidptosis-related genes signature for predicting prognosis in ovarian cancer. Heliyon 2024, 10, e32273. [Google Scholar] [CrossRef]
  22. Emura, T.; Nakatochi, M.; Matsui, S.; Michimae, H.; Rondeau, V. Personalized dynamic prediction of death according to tumour progression and high-dimensional genetic factors: Meta-analysis with a joint model. Stat. Methods Med. Res. 2018, 27, 2842–2858. [Google Scholar] [CrossRef]
  23. Waldron, L.; Haibe-Kains, B.; Culhane, A.C.; Riester, M.; Ding, J.; Wang, X.V.; Ahmadifar, M.; Tyekucheva, S.; Bernau, C.; Risch, T.; et al. Comparative Meta-analysis of Prognostic Gene Signatures for Late-Stage Ovarian Cancer. J. Natl. Cancer Inst. 2014, 106, dju049. [Google Scholar] [CrossRef]
  24. Emura, T.; Nakatochi, M.; Murotani, K.; Rondeau, V. A joint frailty-copula model between tumour progression and death for meta-analysis. Stat. Methods Med. Res. 2017, 26, 2649–2666. [Google Scholar] [CrossRef] [PubMed]
  25. Gao, L.; Jiang, W.; Yue, Q.; Ye, R.; Li, Y.; Hong, J.; Zhang, M. Radiomic model to predict the expression of PD-1 and overall survival of patients with ovarian cancer. Int. Immunopharmacol. 2022, 113, 109335. [Google Scholar] [CrossRef] [PubMed]
  26. Liu, P.; Dong, C.; Shi, H.; Yan, Z.; Zhang, J.; Liu, J. Constructing and validating of m7G-related genes prognostic signature for hepatocellular carcinoma and immune infiltration: Potential biomarkers for predicting the overall survival. J. Gastrointest. Oncol. 2022, 13, 3169–3182. [Google Scholar] [CrossRef]
  27. Liu, Z.; Wang, J.; Li, S.; Li, L.; Li, L.; Li, D.; Guo, H.; Gao, D.; Liu, S.; Ruan, C.; et al. Prognostic prediction and immune infiltration analysis based on ferroptosis and EMT state in hepatocellular carcinoma. Front. Immunol. 2022, 13, 1076045. [Google Scholar] [CrossRef]
  28. Xiang, X.; Guo, Y.; Chen, Z.; Zhang, F.; Huang, J.; Qin, Y. A prognostic risk prediction model based on ferroptosis-related long non-coding RNAs in bladder cancer: A bulk RNA-seq research and scRNA-seq validation. Medicine 2022, 101, e32558. [Google Scholar] [CrossRef]
  29. Zhou, L.; Cheng, Q.; Hu, Y.; Tan, H.; Li, X.; Wu, S.; Zhou, T.; Zhou, J. Cuproptosis-related LncRNAs are potential prognostic and immune response markers for patients with HNSCC via the integration of bioinformatics analysis and experimental validation. Front. Oncol. 2022, 12, 1030802. [Google Scholar] [CrossRef]
  30. Huang, J.; Xu, Z.; Yuan, Z.; Teh, B.M.; Zhou, C.; Shen, Y. Identification of a cuproptosis-related lncRNA signature to predict the prognosis and immune landscape of head and neck squamous cell carcinoma. Front. Oncol. 2022, 12, 983956. [Google Scholar] [CrossRef]
  31. Vannucchi, A.M.; Guglielmelli, P. Molecular prognostication in Ph-negative MPNs in 2022. Hematology 2022, 1, 225–234. [Google Scholar] [CrossRef] [PubMed]
  32. Choi, J.; Oh, I.; Seo, S.; Ahn, J. G2Vec: Distributed gene representations for identification of cancer prognostic genes. Sci. Rep. 2018, 8, 13729. [Google Scholar] [CrossRef]
  33. Kim, M.; Oh, I.; Ahn, J. An Improved Method for Prediction of Cancer Prognosis by Network Learning. Genes 2018, 9, 478. [Google Scholar] [CrossRef]
  34. He, Y.; Song, T.; Ning, J.; Wang, Z.; Yin, Z.; Jiang, P.; Yuan, Q.; Yu, W.; Cheng, F. Lactylation in cancer: Mechanisms in tumour biology and therapeutic potentials. Clin. Transl. Med. 2024, 14, e70070. [Google Scholar] [CrossRef]
  35. Sui, Y.; Shen, Z.; Wang, Z.; Feng, J.; Zhou, G. Lactylation in cancer: Metabolic mechanism and therapeutic strategies. Cell Death Discov. 2025, 11, 68. [Google Scholar] [CrossRef] [PubMed]
  36. Wang, W.; Wang, H.; Wang, Q.; Yu, X.; Ouyang, L. Lactate-induced protein lactylation in cancer: Functions, biomarkers and immunotherapy strategies. Front. Immunol. 2025, 15, 1513047. [Google Scholar] [CrossRef]
  37. Jiao, Y.; Ji, F.; Hou, L.; Lv, Y.; Zhang, J. Lactylation-related gene signature for prognostic prediction and immune infiltration analysis in breast cancer. Heliyon 2024, 10, e24777. [Google Scholar] [CrossRef]
  38. Staplin, N.D.; Kimber, A.C.; Collett, D.; Roderick, P.J. Dependent censoring in piecewise exponential survival models. Stat. Methods Med. Res. 2015, 24, 325–341. [Google Scholar] [CrossRef]
  39. Emura, T.; Chen, Y.H. Analysis of Survival Data with Dependent Censoring: Copula-Based Approaches; Springer: Singapore, 2018. [Google Scholar]
  40. Schneider, S.; Demarqui, F.; Colosimo, E.A.; Mayrink, V.D. An approach to model clustered survival data with dependent censoring. Biom. J. 2020, 62, 157–174. [Google Scholar] [CrossRef] [PubMed]
  41. Schneider, S.; Demarqui, F.; de Freitas Costa, E. Free-ranging dogs’ lifetime estimated by an approach for long-term survival data with dependent censoring. Environ. Ecol. Stat. 2022, 29, 869–911. [Google Scholar] [CrossRef]
  42. Bhattacharjee, A.; Vishwakarma, G.K.; Banerjee, S.; Ong, S.H. A modified risk detection approach of biomarkers by frailty effect on multiple time to event data. J. Comput. Appl. Math. 2023, 419, 114681. [Google Scholar] [CrossRef]
  43. Emura, T.; Chen, Y.-H. Gene selection for survival data under dependent censoring: A copula-based approach. Stat. Methods Med. Res. 2016, 25, 2840–2857. [Google Scholar] [CrossRef]
  44. Yeh, C.T.; Liao, G.Y.; Emura, T. Sensitivity analysis for survival prognostic prediction with gene selection: A copula method for dependent censoring. Biomedicines 2023, 11, 797. [Google Scholar] [CrossRef] [PubMed]
  45. Rivest, L.P.; Wells, M.T. A martingale approach to the copula-graphic estimator for the survival function under dependent censoring. J. Multivar. Anal. 2001, 79, 138–155. [Google Scholar] [CrossRef]
  46. Nelsen, R.B. An Introduction to Copulas; Springer: New York, NY, USA, 2007. [Google Scholar]
  47. Braekers, R.; Veraverbeke, N. A copula-graphic estimator for the conditional survival function under dependent censoring. Can. J. Stat. 2005, 33, 429–447. [Google Scholar] [CrossRef]
  48. Emura, T.; Michimae, H. A copula-based inference to piecewise exponential models under dependent censoring, with application to time to metamorphosis of salamander larvae. Environ. Ecol. Stat. 2017, 24, 151–173. [Google Scholar] [CrossRef]
  49. Moradian, H.; Larocque, D.; Bellavance, F. Survival forests for data with dependent censoring. Stat. Methods Med. Res. 2019, 28, 445–461. [Google Scholar] [CrossRef] [PubMed]
  50. Lo, S.M.; Wilke, R.A. A copula model for dependent competing risks. J. R. Stat. Soc. Ser. C (Appl. Stat.) 2010, 59, 359–376. [Google Scholar] [CrossRef]
  51. Zheng, M.; Klein, J.P. Estimates of marginal survival for dependent competing risks based on an assumed copula. Biometrika 1995, 82, 127–138. [Google Scholar] [CrossRef]
  52. de Uña-Álvarez, J.; Veraverbeke, N. Generalized copula-graphic estimator. Test 2013, 22, 343–360. [Google Scholar] [CrossRef]
  53. de Uña-Álvarez, J.; Veraverbeke, N. Copula-graphic estimation with left-truncated and right-censored data. Statistics 2013, 51, 387–403. [Google Scholar] [CrossRef]
  54. Emura, T.; Hsu, J.H. Estimation of the Mann–Whitney effect in the two-sample problem under dependent censoring. Comput. Stat. Data Anal. 2020, 150, 106990. [Google Scholar] [CrossRef]
  55. Emura, T.; Ditzhaus, M.; Dobler, D.; Murotani, K. Factorial survival analysis for treatment effects under dependent censoring. Stat. Methods Med. Res. 2023, 33, 61–79. [Google Scholar] [CrossRef]
  56. Lo, S.M.; Wilke, R.A. A regression model for the copula-graphic estimator. J. Econom. Methods 2014, 3, 21–46. [Google Scholar] [CrossRef]
  57. Kim, J.M.; Hwang, S.Y. The copula directional dependence by stochastic volatility models. Commun. Stat.-Simul. Comput. 2019, 48, 1153–1175. [Google Scholar] [CrossRef]
  58. Huang, X.W.; Wang, W.; Emura, T. A copula-based Markov chain model for serially dependent event times with a dependent terminal event. Jpn. J. Stat. Data Sci. 2021, 4, 917–951. [Google Scholar] [CrossRef]
  59. Das, S.; Bhattacharya, R.; Shome, M. A multi-treatment two stage allocation design for survival outcomes with nonrandom censoring: A copula-based approach. Seq. Anal. 2024, 43, 461–476. [Google Scholar] [CrossRef]
  60. Cox, D.R. Regression models and life-tables. J. R. Stat. Soc. Ser. B (Methodol.) 1972, 34, 187–202. [Google Scholar] [CrossRef]
  61. Simon, R.M.; Korn, E.L.; McShane, L.M.; Radmacher, M.D.; Wright, G.W.; Zhao, Y. Design and Analysis of DNA Microarray Investigations; Springer: New York, NY, USA, 2003. [Google Scholar]
  62. Van Wieringen, W.N.; Kun, D.; Hampel, R.; Boulesteix, A.L. Survival prediction using gene expression data: A review and comparison. Comput. Stat. Data Anal. 2009, 53, 1590–1603. [Google Scholar] [CrossRef]
  63. Matsui, S. Predicting survival outcomes using subsets of significant genes in prognostic marker studies with microarrays. BMC Bioinform. 2006, 7, 156. [Google Scholar] [CrossRef]
  64. Lee, J.S.; Chu, I.S.; Heo, J.; Calvisi, D.F.; Sun, Z.; Roskams, T.; Durnez, A.; Demetris, A.J.; Thorgeirsson, S.S. Classification and prediction of survival in hepatocellular carcinoma by gene expression profiling. Hepatology 2004, 40, 667–676. [Google Scholar] [CrossRef] [PubMed]
  65. Lee, J.S.; Thorgeirsson, S.S. Genome-scale profiling of gene expression in hepatocellular carcinoma: Classification, survival prediction, and identification of therapeutic targets. Gastroenterology 2004, 127, S51–S55. [Google Scholar] [CrossRef] [PubMed]
  66. Marcucci, G.; Radmacher, M.D.; Maharry, K.; Mrózek, K.; Ruppert, A.S.; Paschka, P.; Vukosavljevic, T.; Whitman, S.P.; Baldus, C.D.; Langer, C.; et al. MicroRNA expression in cytogenetically normal acute myeloid leukemia. N. Engl. J. Med. 2008, 358, 1919–1928. [Google Scholar] [CrossRef] [PubMed]
  67. Matsui, S. Statistical issues in clinical development and validation of genomic signatures. In Design and Analysis of Clinical Trials for Predictive Medicine; CRC Press: Boca Raton, FL, USA, 2015; pp. 207–226. [Google Scholar]
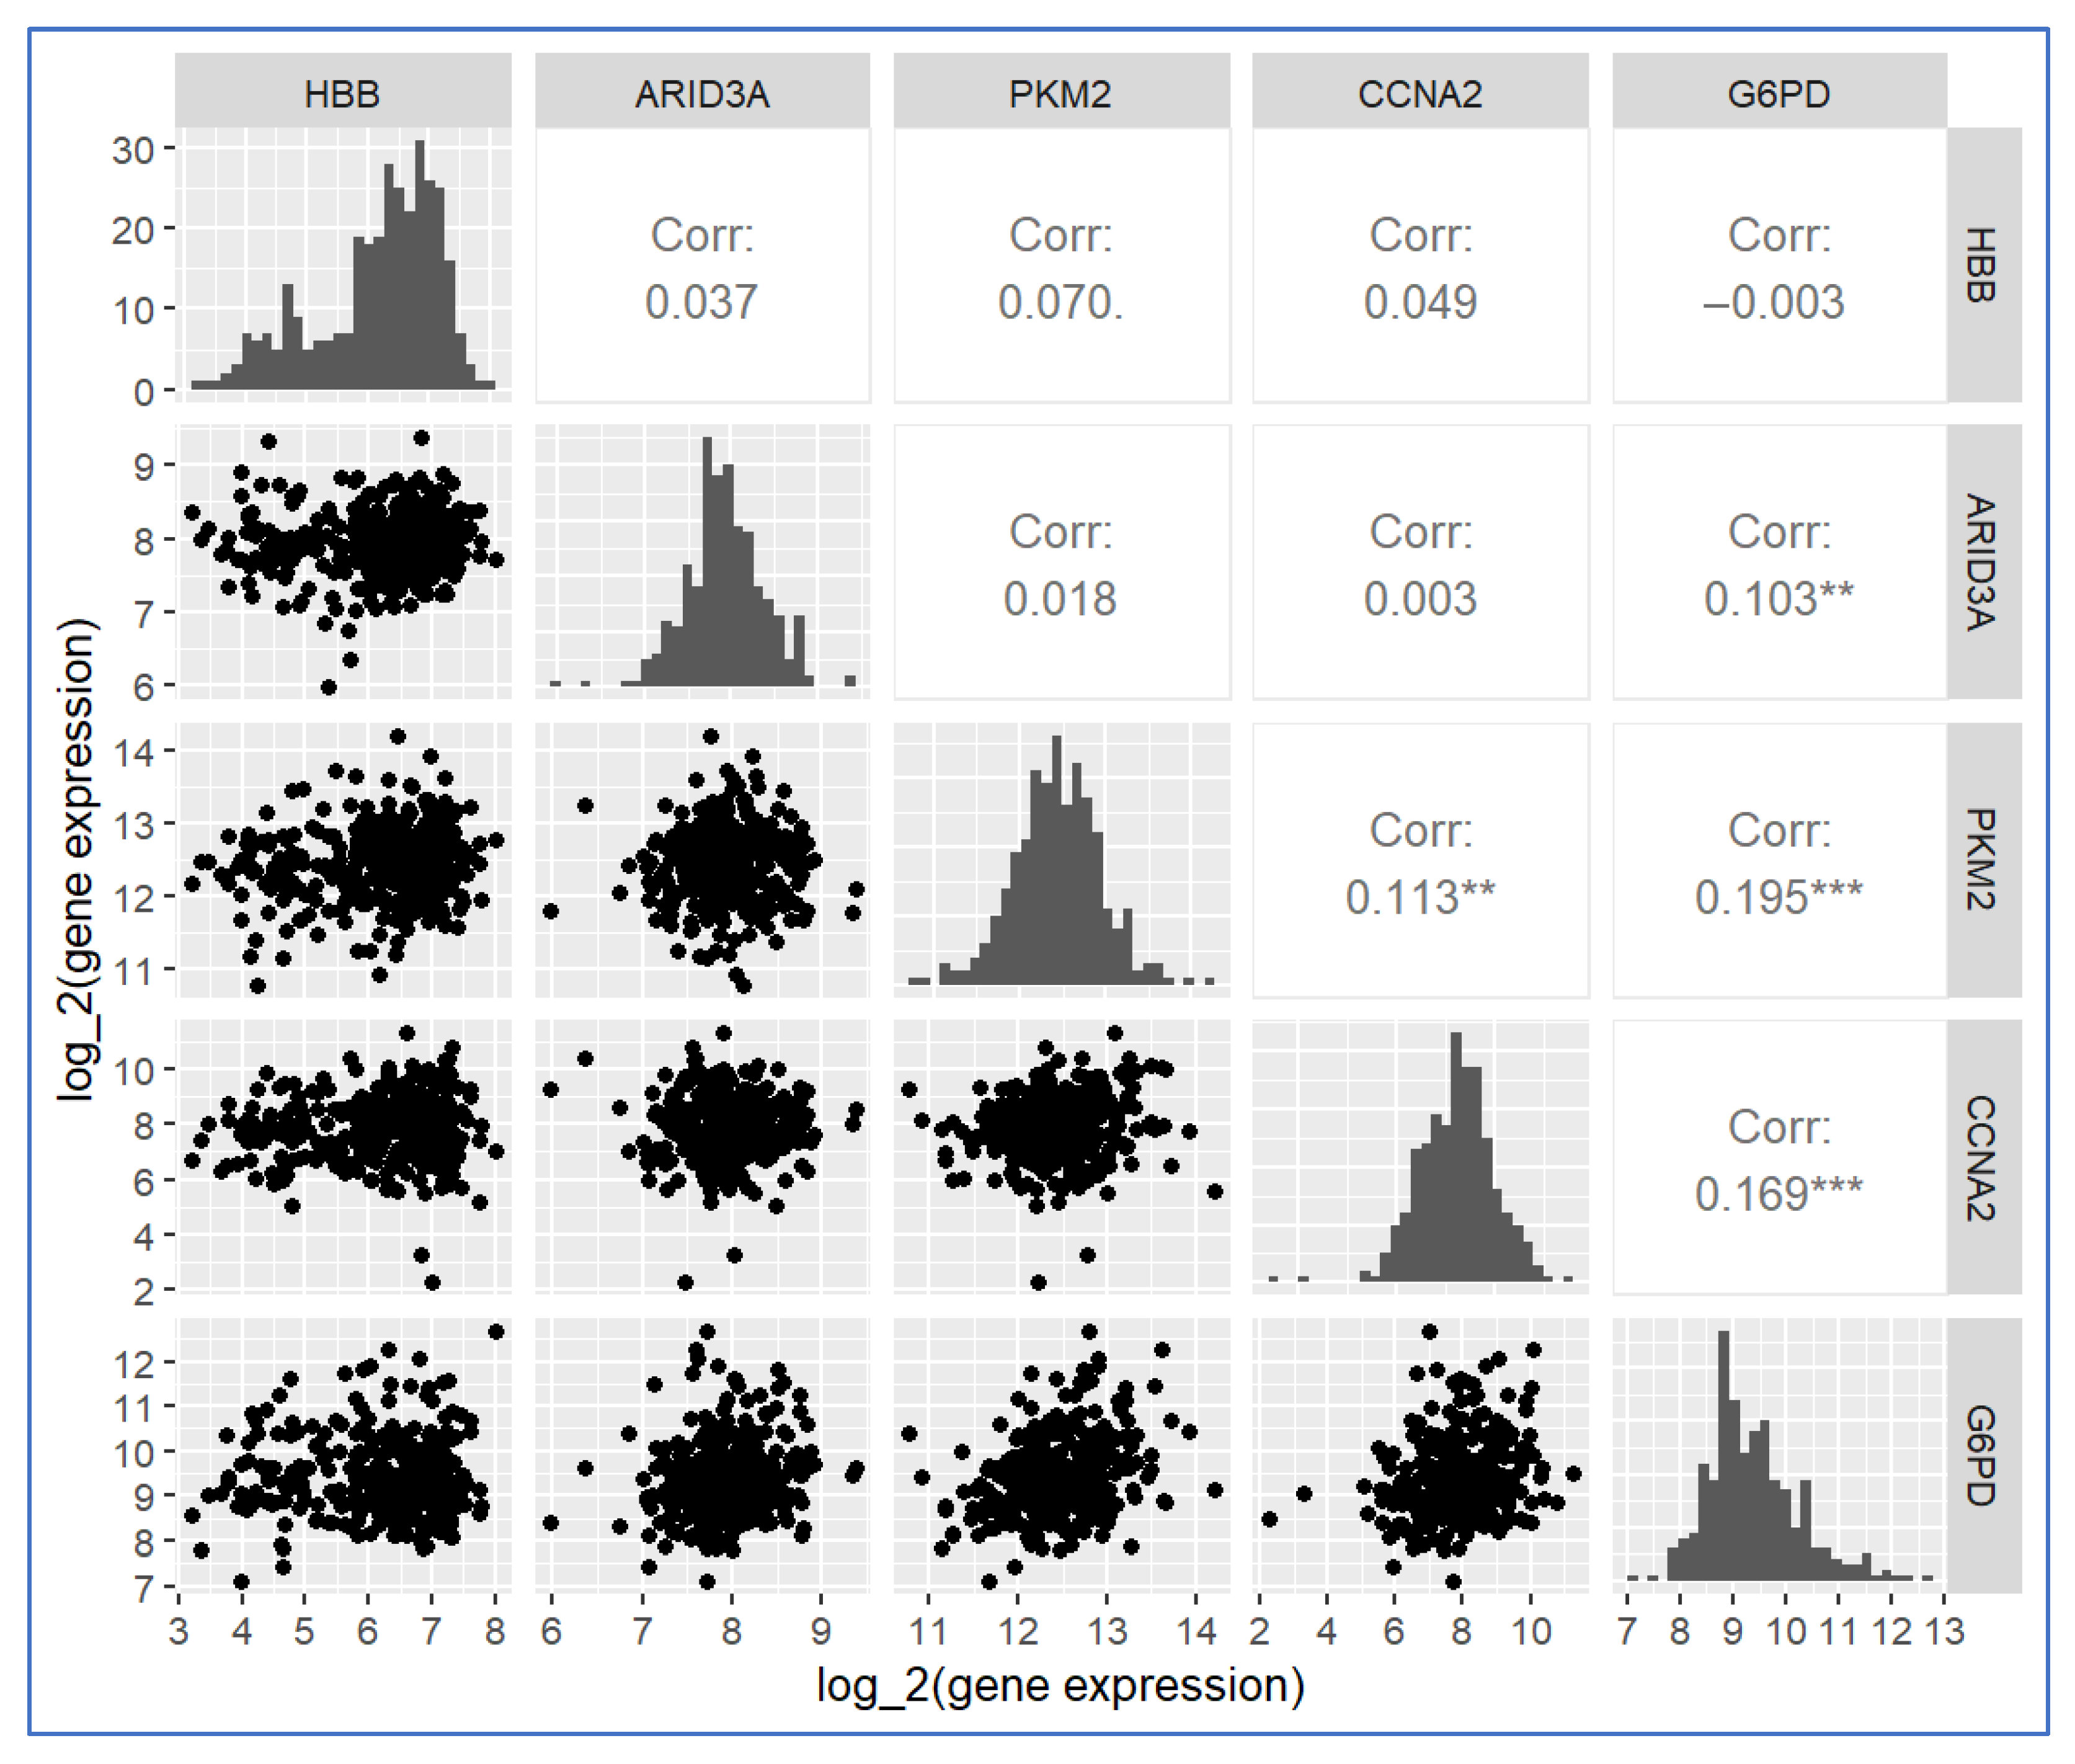
Figure 1. Scatter plots for the five lactylation-related gene expressions based on the 327 breast cancer tumor tissues publicly available on the GEO under the accession number GSE20685. The mark “**” is for a p-value less than 0.01 and “***” for a p-value less than 0.001.
Mathematics 13 03735 g001
Figure 2. Estimated survival curves separated by the low and high expression of the HBB gene. The survival curves are computed by the CG estimator under the Clayton copula. The p-value for testing the difference in survival curves is computed by the metric D and permutation test.
Mathematics 13 03735 g002
Figure 3. Estimated survival curves are separated by the low and high expression of the ARID3A gene. The survival curves are computed by the CG estimator under the Clayton copula. The p-value for testing the difference in survival curves is computed by the metric D and permutation test.
Mathematics 13 03735 g003
Figure 4. Estimated survival curves are separated by the low and high expression of the PKM2 gene. The survival curves are computed by the CG estimator under the Clayton copula. The p-value for testing the difference in survival curves is computed by the metric D and permutation test.
Mathematics 13 03735 g004
Figure 5. Estimated survival curves are separated by the low and high expression of the CCNA2 gene. The survival curves are computed by the CG estimator under the Clayton copula. The p-value for testing the difference in survival curves is computed by the metric D and permutation test.
Mathematics 13 03735 g005
Figure 6. Estimated survival curves are separated by the low and high expression of the G6PD gene. The survival curves are computed by the CG estimator under the Clayton copula. The p-value for testing the difference in survival curves is computed by the metric D and permutation test.
Mathematics 13 03735 g006
Figure 7. Estimated survival curves are separated by the low and high risk of the Prognostic Index (PI) using three selected genes. The survival curves are computed by the CG estimator under the Clayton copula. The p-value for testing the difference in survival curves is computed by the metric D and permutation test.
Mathematics 13 03735 g007
Figure 8. Power function of the significance test for the R function CG.test(.) at the significance level of α , 0.01, 0.05, and 0.10 (dotted lines). The power function is based on the rejection rate (the proportion of p-values less than α ) for the test based on 1000 repetitions.
Mathematics 13 03735 g008
Table 1. Test results for the difference in survival curves predicted by the five genes and PI (using ARID3A, CCNA2, and G6PD) under copula models for dependent censoring.
Model Parameter   θ Difference Metric D (p-Value)
HBBARID3APKM2CCNA2G6PDPI
Clayton copula 0.0 (τ = 0.0)0.043 (0.254)−0.097 (0.007)−0.018 (0.615)−0.087 (0.018)−0.107 (0.004)−0.111 (0.003)
0.5 (τ = 0.2)0.044 (0.293)−0.111 (0.006)−0.027 (0.506)−0.095 (0.020)−0.11 (0.008)−0.113 (0.006)
2.0 (τ = 0.5)0.040 (0.443)−0.136 (0.010)−0.041 (0.425)−0.101 (0.054)−0.097 (0.063)−0.105 (0.046)
8 .0 (τ = 0.8)0.028 (0.496)−0.086 (0.047)0.009 (0.824)−0.072 (0.082)−0.058 (0.151)−0.058 (0.160)
Gumbel copula 0 .00 (τ = 0.0)0.043 (0.254)−0.097 (0.007)−0.018 (0.615)−0.087 (0.018)−0.107 (0.004)−0.111 (0.003)
0.25 (τ = 0.2)0.039 (0.305)−0.099 (0.008)−0.022 (0.543)−0.081 (0.031)−0.101 (0.007)−0.102 (0.006)
1.00 (τ = 0.5)0.033 (0.422)−0.098 (0.013)−0.028 (0.475)−0.073 (0.068)−0.086 (0.029)−0.085 (0.034)
4 .00 (τ = 0.8)0.025 (0.514)−0.083 (0.038)−0.009 (0.821)−0.07 (0.074)−0.058 (0.128)−0.059 (0.128)
Frank copula 0 .00 (τ = 0.0)0.043 (0.254)−0.097 (0.007)−0.018 (0.615)−0.087 (0.018)−0.107 (0.004)−0.111 (0.003)
1.86 (τ = 0.2)0.041 (0.298)−0.101 (0.007)−0.024 (0.534)−0.084 (0.029)−0.104 (0.007)−0.105 (0.007)
5.74 (τ = 0.5)0.035 (0.399)−0.099 (0.016)−0.027 (0.508)−0.076 (0.065)−0.088 (0.033)−0.085 (0.041)
18.19 (τ = 0.8)0.027 (0.465)−0.077 (0.044)0.002 (0.968)−0.07 (0.063)−0.056 (0.123)−0.057 (0.124)
1.86 (τ = −0.2)0.043 (0.229)−0.093 (0.009)−0.015 (0.680)−0.089 (0.013)−0.107 (0.003)−0.114 (0.001)
5.74 (τ = −0.5)0.043 (0.217)−0.088 (0.011)−0.011 (0.747)−0.089 (0.010)−0.106 (0.003)−0.114 (0.001)
18.2   (τ = −0.8)0.043 (0.220)−0.085 (0.013)−0.010 (0.778)−0.088 (0.011)−0.105 (0.003)−0.114 (0.000)
Table 2. Hazard ratio (HR) and p-values (in parenthesis) for the five gene expressions under the Clayton copula model with various degrees of dependence.
Model Parameter   θ Hazard Ratio: exp(β) (p-Value)
HBBARID3APKM2CCNA2G6PDPI
Univariate CoxNone0.964 (0.743)2.103 (0.002)1.229 (0.645)1.222 (0.042)1.611 (0.000)1.995 (0.000)
Clayton copula 0.1 (τ = 0.05)0.964 (0.736)2.118 (0.001)1.256 (0.288)1.222 (0.033)1.619 (0.007)1.987 (0.000)
0.5 (τ = 0.2)0.969 (0.781)2.095 (0.002)1.135 (0.616)1.222 (0.035)1.599 (0.001)1.959 (0.000)
2.0 (τ = 0.5)0.991 (0.934)1.951 (0.002)1.049 (0.701)1.218 (0.030)1.327 (0.011)1.981 (n.a.)
8.0 (τ = 0.8)1.022 (0.843)1.344 (0.468)1.056 (n.a.)1.216 (0.041)1.303 (0.014)1.122 (0.574)
n.a.: not available due to convergence issues.
Disclaimer/Publisher’s Note: The statements, opinions and data contained in all publications are solely those of the individual author(s) and contributor(s) and not of MDPI and/or the editor(s). MDPI and/or the editor(s) disclaim responsibility for any injury to people or property resulting from any ideas, methods, instructions or products referred to in the content.