1. Introduction
In electric vehicle reducers, helical gears are key transmission components. Although it has advantages such as stable operation and strong load-bearing capacity, under high-speed working conditions, it is very easy to enter a complex nonlinear motion state due to the coupling effect of system parameters such as gear backlash, error excitation, and damping ratio. The rapid development of modern industrial technology, especially the demand for high-power-density electric drive systems in the field of electric vehicles, has led to a significant increase in motor speed [
1]. Moreover, compared with traditional internal combustion engine vehicles, electric vehicles, due to the lack of engine noise masking, have more prominent vibration and noise problems in gear transmission. Therefore, it is of great significance to study the influence mechanism of various system parameters on the dynamic characteristics of the helical gear system of electric vehicle reducers under high-speed operating conditions [
2,
3]. In addition to domestic studies, several international researchers have also contributed to the dynamic analysis of gear systems. For example, A. Kahraman investigated nonlinear vibration in spur gears [
4], and Siar Deniz Yavuz first proposed a dynamic model to study the nonlinear time-varying dynamic behavior of transmission systems including parallel shaft gears and intersecting shaft gears [
5]. Roee Cohen et al. proposed a new vibration dynamics model for helical gears and verified the accuracy of the model through experiments [
6].
In the context of studying the time-varying stiffness of a helical gear, Wan et al. [
7,
8] developed a model to quantify the time-varying stiffness. This model was based on the principle of cumulative integral functions. It evaluated the key geometric parameters, such as the number of teeth and the tooth width, in terms of their interaction. In the context of idealized conditions involving negligible surface friction, Liu et al. refined the traditional method of computing the forces exerted by a gear tooth on a gear tooth [
9]. Zhu et al. employed a computational approach to analyze the surface contact variations in a clamped-pitch gear, considering the effects of surface roughness on the contact stiffness [
10]. All the above-mentioned studies use the traditional energy method to calculate the time-varying meshing stiffness of helical gears. This method has relatively accurate precision. However, the prerequisite for this method is to consider the base circle and the root circle of the gear as coexisting. But in actual engineering, the base circle and the root circle of the gear are not coexisting. Therefore, the latest algorithm, namely the improved potential energy method, is introduced. That is, the time-varying meshing stiffness is calculated by considering the energy method where the base circle and the root circle of the tooth do not coincide. He et al. calculated the time-varying meshing stiffness of gears considering eccentric defects based on the improved potential energy method, and also studied the influence of gear eccentricity on the lateral and torsional responses and dynamic transmission errors [
11]. In this study, Hu et al. employed electric constant velocity transmission (ECVT) as a model to calculate the time-varying stiffness of the gear mesh under various torque conditions. They then proceeded to analyze the impact of torque and time-varying stiffness on the nonlinear characteristics of the gear mesh [
12]. In considering the condition that the core and the teeth are not coplanar, Yang et al. propose a method for calculating the instantaneous inter-engagement stiffness of a helical gear system. This method is more analogous to finite element methods [
13]. Zhang et al. [
14] have proposed an enhanced finite element method that considers the non-overlapping phenomenon of the root and base circles, as well as the root transition circle angle. This method has been shown to significantly improve the calculation accuracy. In conjunction with KISSsoft simulations, the influence of crack depth and angle on local strain degradation has been elucidated.
In the context of research on the dynamics of helical gears, Kong et al. [
15] proposed a model that considers the flexibility of the helical gears. This model was validated through ANSYS, which is a computer program used to analyze and optimize the performance of mechanical systems. The model established the foundation for the design of lightweight helical gears at high speeds. Chen et al. [
16] developed a nonlinear dynamic model of a compound crank gear under the influence of time-varying forces resulting from a mixed surface. They investigated the impact of various parameters on the system’s branching characteristics. Bozca, M. [
17] optimized the geometric design parameters of the gearbox based on the transmission error model, reducing the vibration and noise of the gears by optimizing the geometric parameters of the gearbox. Abdulhameed M. Y. and his colleagues [
18] established a 16-degree-of-freedom dynamic model for a pure electric vehicle’s deceleration mechanism. They investigated the impact of input speed, gear backlash, and torsional stiffness on the dynamic model’s response. Yan et al. [
19] employed a methodology involving the modification of the width of the teeth in a dynamic manner to address the issue of uneven load distribution on the inclined teeth. Through the analysis of the dynamic width of the teeth, the optimal parameters for modification were determined, resulting in an even distribution of the load on the surface of the teeth, with the load distribution center positioned in close proximity to the center of the teeth. This approach effectively mitigated the phenomenon of vibration. Yuan and his team established a model of a high-speed gear train’s helical gear teeth, including the internal 10-degree-of-freedom helical gear teeth, and the interaction between the gears and the load. They conducted a thorough investigation into the influence of the gear speed, the effectiveness of the engagement, the rigidity of the gears, and the supporting damper on the system’s power transmission [
20]. Mo et al. [
21] developed a model that considers EHL conditions, including disengagement from the interaction and reverse impact. This model features a combination of two- or three-toothed gears that alternate with each other. Through the use of a global branching diagram, the attraction domain, and the adjoint trajectory, the model elucidates the underlying mechanisms that enable the coexistence of multiple states. Zheng et al. [
22] established a model encompassing the nonlinear dynamic contact gap and friction coefficient of a high-speed gearbox with a slotted helical gear, incorporating the surface roughness of the gear teeth. This model was utilized to comprehensively examine the influence of the dynamic contact gap and friction coefficient on the dynamic behavior of the model. Huang et al. [
23] studied the dynamic characteristics of a spur tooth pair system with two types of tooth gaps and established a torsional dynamics model. The nonlinear characteristics of the system were studied by taking the rotational speed and the initial gear backlash as the bifurcation parameters, and it was concluded that the system would enter chaos at a high rotational speed and large backlash.
Based on extensive research reviews, it is not difficult to find that current research mostly focuses on the improvement of time-varying meshing stiffness algorithms for helical gears. Studies on gear system dynamics mostly only pay attention to the linear signal characteristics in the time domain and frequency domain. These methods can indirectly reflect the motion state of the system, but they cannot reflect the complexity of nonlinear motion. In this study, a six-degree-of-freedom, bending–torsion–axial coupling dynamic model of a high-speed helical gear pair in an electric vehicle reducer system was established using the lumped-parameter method. Based on the improved potential energy method, the time-varying meshing stiffness of helical gears is calculated, and the dynamic responses of the high-speed helical gear transmission system under different system parameters are analyzed. The nonlinear characteristic variation laws of helical gear transmission systems were explored.
This paper is structured into five cohesive sections. It commences with a comprehensive literature review in Section One, summarizing recent scholarly advancements in analyzing the time-varying meshing stiffness and dynamics of both healthy and faulty helical gears. Building on this foundation, Section Two establishes a dedicated dynamic model for helical gear pairs operating in the high-speed stage of electric vehicle reducers, accounting for their unique operational conditions. Subsequently, Section Three details the specific methodology and procedures for calculating the gears’ time-varying meshing stiffness. Section Four then leverages the established model and calculated stiffness to perform an in-depth nonlinear dynamic analysis, exploring complex behaviors induced by factors like backlash and parametric excitations. Finally, the concluding section synthesizes the key findings and contributions of the entire study.
2. Establishment of a Dynamic Model of a Helical Gear Transmission System
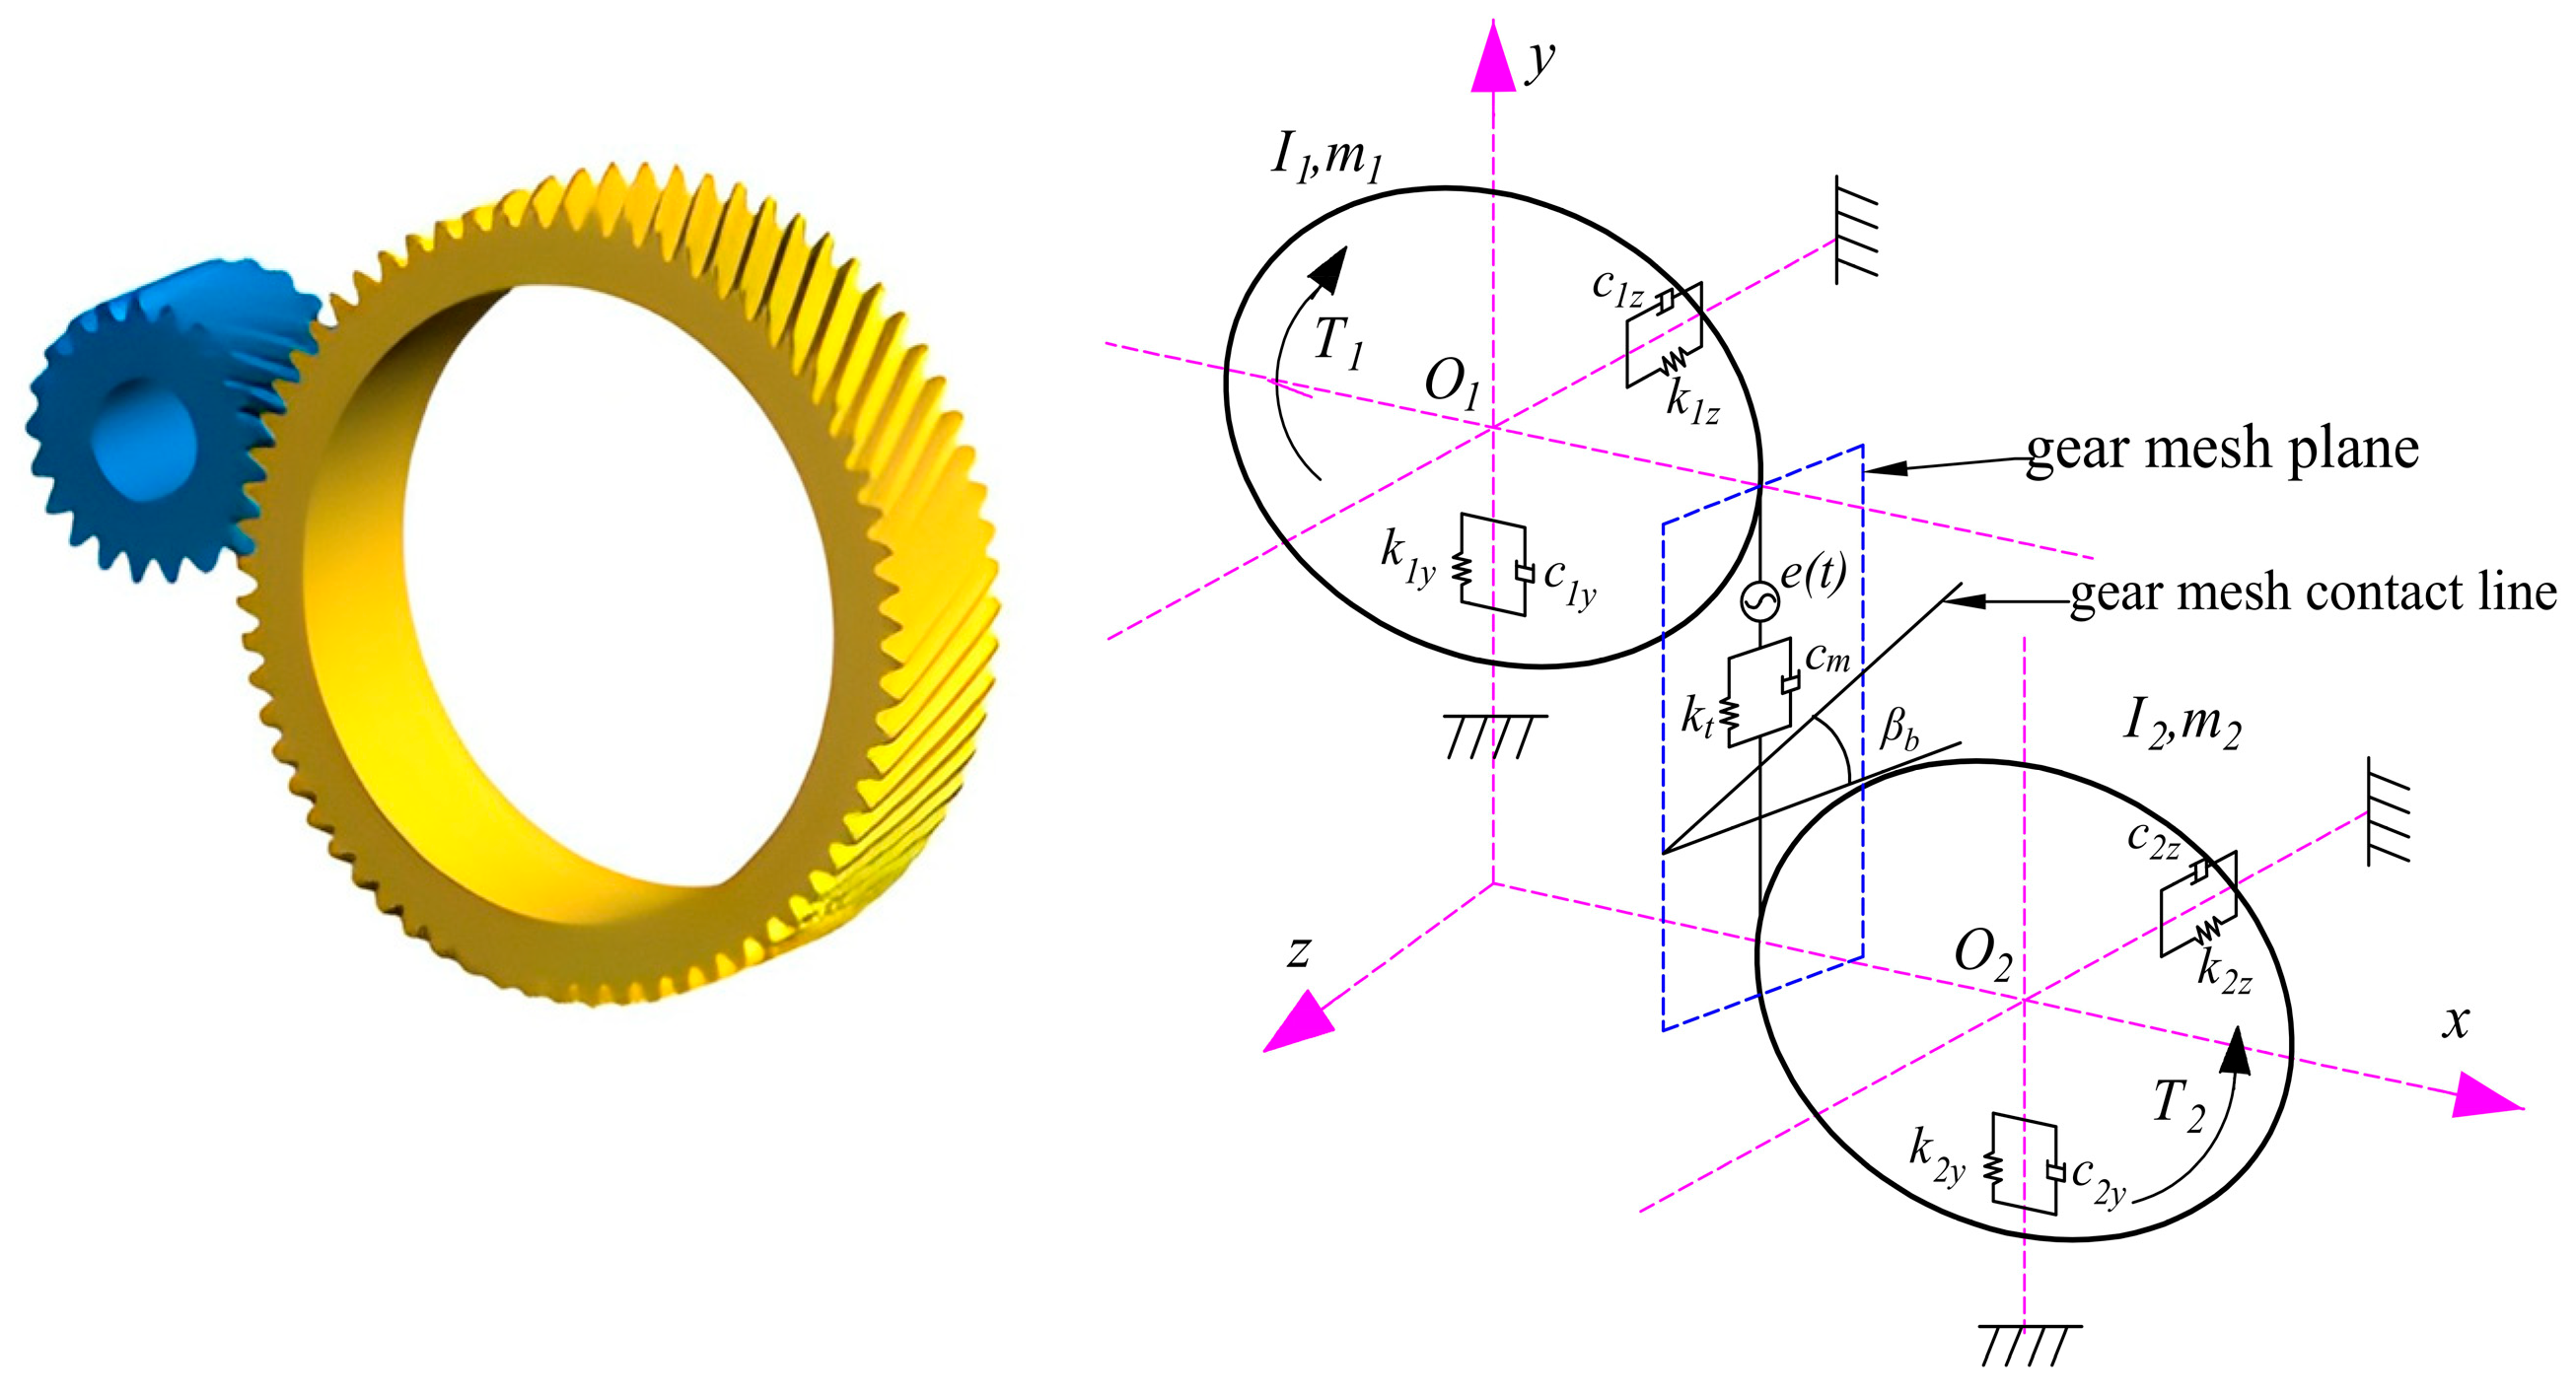
The present study focuses on the high-speed input gear of a certain electric vehicle’s secondary helical gear. The establishment of a six-degree-of-freedom model of a helical gear transmission system utilizing the concentration parameter method is illustrated in
Figure 1.
The following system of differential equations is derived from the model depicted in
Figure 1:
where
and
are the driving and driven gear mass, respectively.
and
are the Y-direction equivalent support stiffness of the driving and driven gears, respectively.
and
are the
Z-direction equivalent support stiffness of the driving and driven gears, respectively.
and
are the
Y-direction equivalent support damping of the driving and driven gears, respectively.
and
are the
Z-direction equivalent support damping of the driving and driven gears, respectively.
and
represent the dynamic contact forces acting on the driving gear along the Y and Z directions, respectively;
and
denote the input and output torques applied to the driving and driven gears, respectively; and
and
are the driving and driven gears, respectively, in the Y direction.
z1 and
z2 are the driving and driven gears, respectively, on the
Z-axis.
and
denote the base circle radii of the driving and driven gears, respectively. In this study, their values are
= 17.2 mm and
= 53.1 mm, which are derived from the geometric parameters listed in
Table 1.
I1 and
I2 are the inertia of the driving and driven gears, respectively.
and
are the points where the center of the gear center rotates.
Due to the presence of vibration and error, the dynamic meshing deformation amount
between the two helical gears at the equivalent meshing point along the meshing line is expressed as follows:
The dynamic contact force of the spiral helical gear in the
Y and
Z directions is expressed as follows:
where
refers to the resultant meshing force acting along the line of action.
is the helix angle.
is the variable stiffness of the meshing of the helical gear. The time derivative of the meshing displacement,
, is obtained by differentiating Equation (3) with respect to time, which includes the derivative of the meshing error term.
is the nonlinear function of the gear backlash, and the definition of the backlash can be expressed as 2
b.
cm is the gear meshing damping and can be expressed as
Among them, is the contact damping ratio, and is the mean of the time-varying meshing stiffness.
is the dynamic gear meshing error. Specifically, the meshing error
and its derivative
are computed using the harmonic expression, whose expression is
Among them,
is the mean value of the gear meshing error,
is the amplitude of the
i-th harmonic of the meshing error,
is the initial phase angle of the
i-th harmonic, and
is the meshing frequency, whose expression is
where
is the number of teeth of the driving gear, and
is the rotational speed (in rpm).
The fundamental parameters of this component are presented in
Table 1.
3. Calculation of Mesh Stiffness of Helical Gear Based on Improved Energy Method
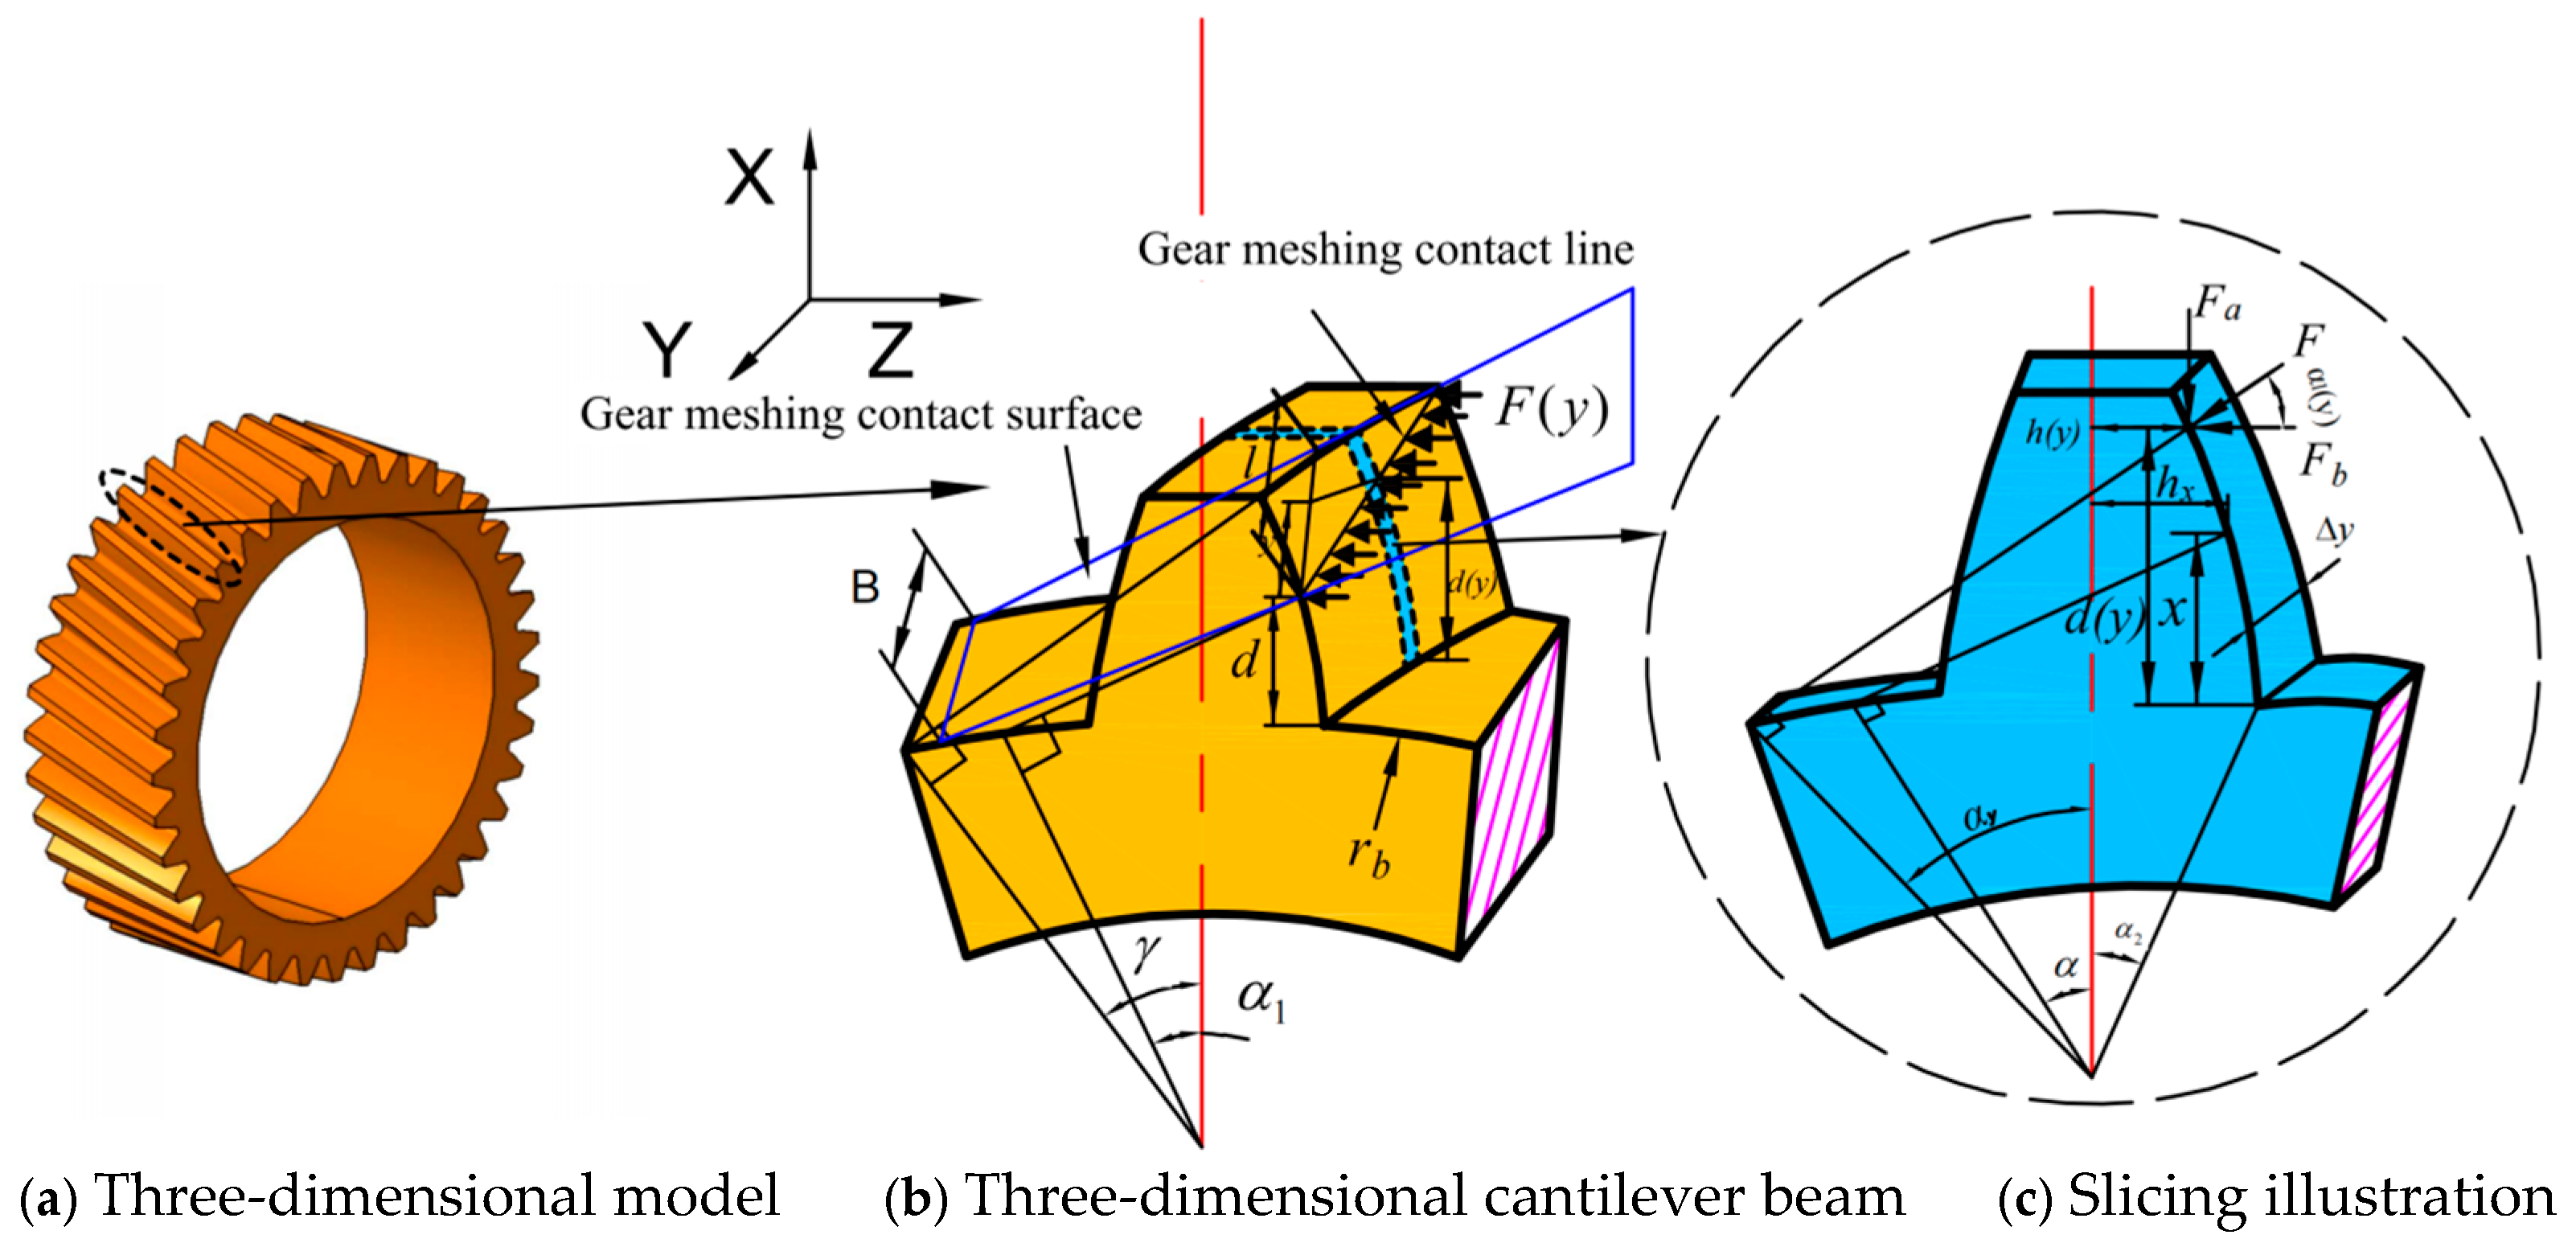
Due to the unique meshing characteristics of helical gears—originating from the helix angle and resulting in gradual, multi-tooth engagement—the accurate computation of their time-varying meshing stiffness (TVMS) requires a discrete integration methodology. As demonstrated by the cantilever beam model in
Figure 2, this approach effectively captures the three-dimensional nature of the problem by dividing the helical tooth along its face width into a finite number of two-dimensional micro-slices, each treated as an equivalent spur gear segment. The stiffness of each micro-slice is calculated using established analytical models for spur gears, incorporating contributions from bending, shear, and axial compressive deformations. The overall meshing stiffness of the helical gear tooth is then obtained through the systematic integration and superposition of the individual stiffness values across all slices. This resultant TVMS serves as a critical excitation input for subsequent nonlinear dynamic analyses of the gear system, directly affecting predictions of vibration behavior and noise performance.
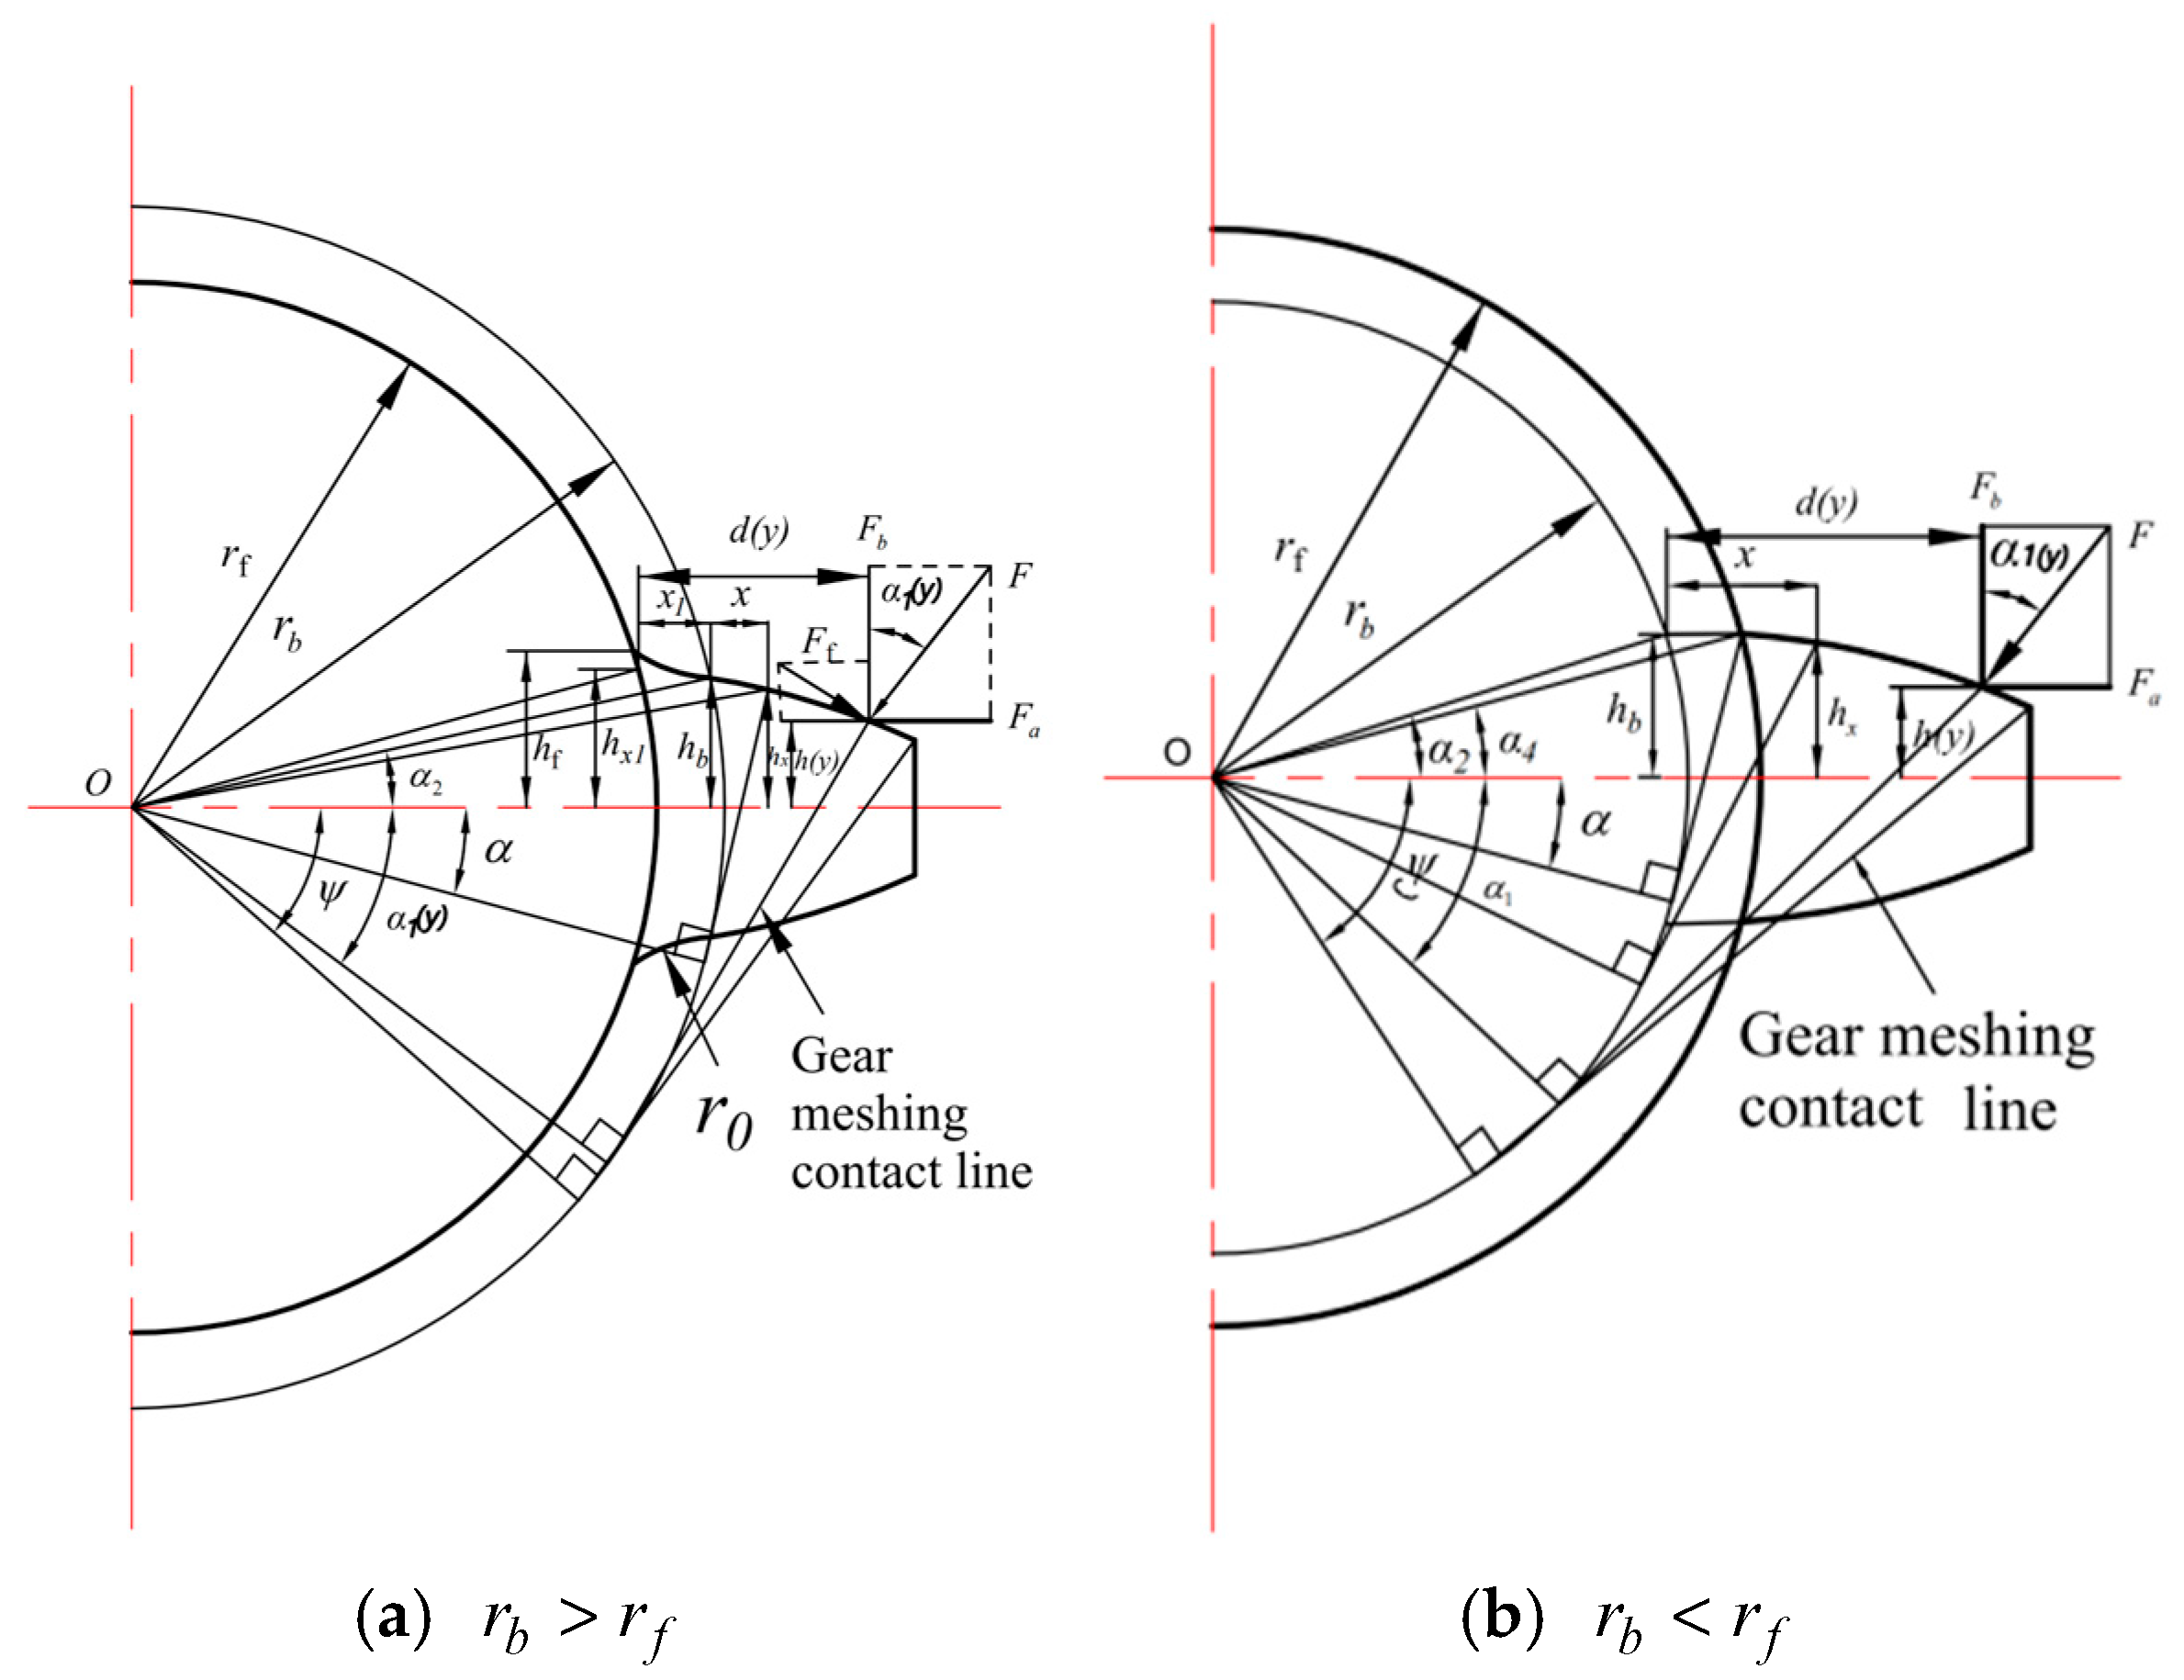
In the event that the base circle and the root circle are not congruent, as illustrated in
Figure 3, the following parameters can be calculated: bending stiffness
, shear stiffness
, axial compression stiffness
, hertz contact stiffness
, and elastic stiffness of the matrix
.
At this time, the bending stiffness
when the base circle is greater than the tooth root circle and when the base circle is less than the tooth root circle is, respectively
The shear stiffness
when the base circle is greater than the tooth root circle and when the base circle is less than the tooth root circle is, respectively
The axial compressive stiffness
when the base circle is greater than the tooth root circle and when the base circle is less than the tooth root circle is, respectively
Regardless of whether the base circle coincides with the root circle of the gear or not, the Hertz contact stiffness of the gear and the base stiffness are expressed as Formulas (10) and (11).
In the given context,
, the variable z denotes the number of teeth on the primary driving gear,
indicates the pressure angle, where
is the area of the cross-section at position
,
designates the distance from a point on the threaded passage to the threaded gear,
, and
signifies the radius of the threaded passage,
. The specific values of the polynomial coefficients of
,
,
, and
can be obtained through reference [
24];
and
can be expressed as
F represents the engaging force along the threaded passage,
denotes the angle between the threaded passage and the threaded gear center line, and
can be expressed as follows:
where
denotes the pressure angle of the gear tooth root.
In the present period, the magnitude of the shear–pinion–tooth engagement rigidity may be expressed as follows:
In the formula, i represents the driving and driven gears, and j represents the number of teeth involved in meshing at the same time.
The improved potential energy method in this paper is compared with the traditional potential energy method in the literature [
8]. The parameters for calculating the meshing stiffness are the same as those of the model in the literature.
Table 2 presents the maximum stiffness of single-tooth meshing stiffness and the average value of the comprehensive meshing stiffness. The results show the correctness of the program developed in this paper. The results show that the meshing stiffness calculated based on the improved potential energy method is closer to the ISO standard compared with the traditional energy method, and the error is controlled within 3%.
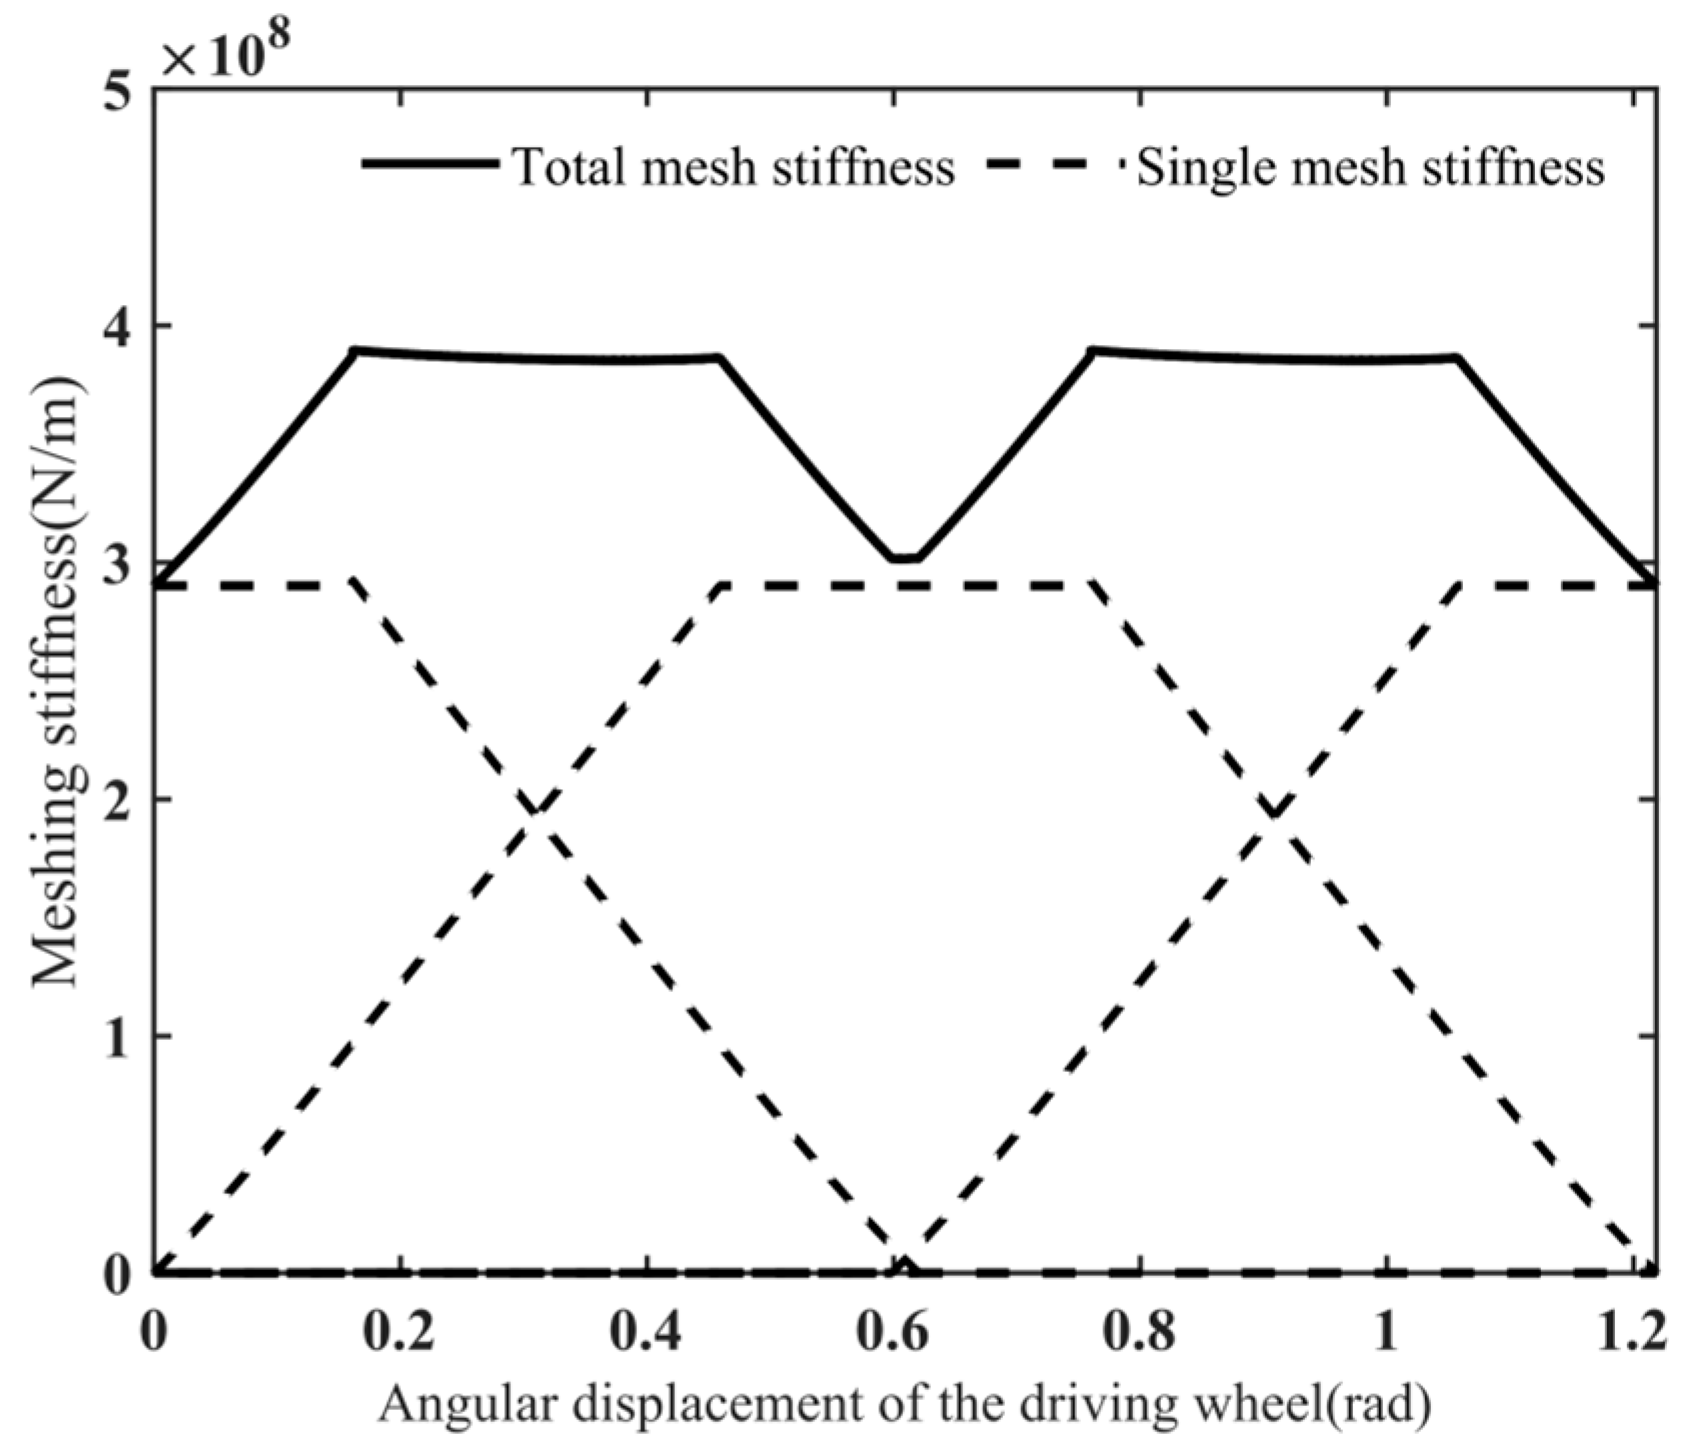
Take the data into
Table 1 for calculation, at this time,
,
, as shown in
Figure 4.
4. Analysis of the Dynamic Characteristics of Healthy Helical Gear Transmission System
All the figures presented in this section are obtained through numerical simulation based on the dynamic model established in
Section 2, where the time-varying mesh stiffness calculated by the improved potential energy method in
Section 3 is used as input data. The numerical integration of the system’s differential equations was performed using the variable-step Runge–Kutta method in MATLAB R2023a. The geometric and physical parameters employed in these simulations are listed in
Table 1, corresponding to the helical gear pair of the electric vehicle reducer.
4.1. The Effect of Input Speed on the System
Unlike traditional fuel vehicles, the input shaft of the reducer in pure electric vehicles is directly connected to the motor. The higher the motor speed, the higher the input speed of the reducer. For instance, the rotational speed of a Tesla motor can reach 16,000 revolutions per minute.
Taking the input speed
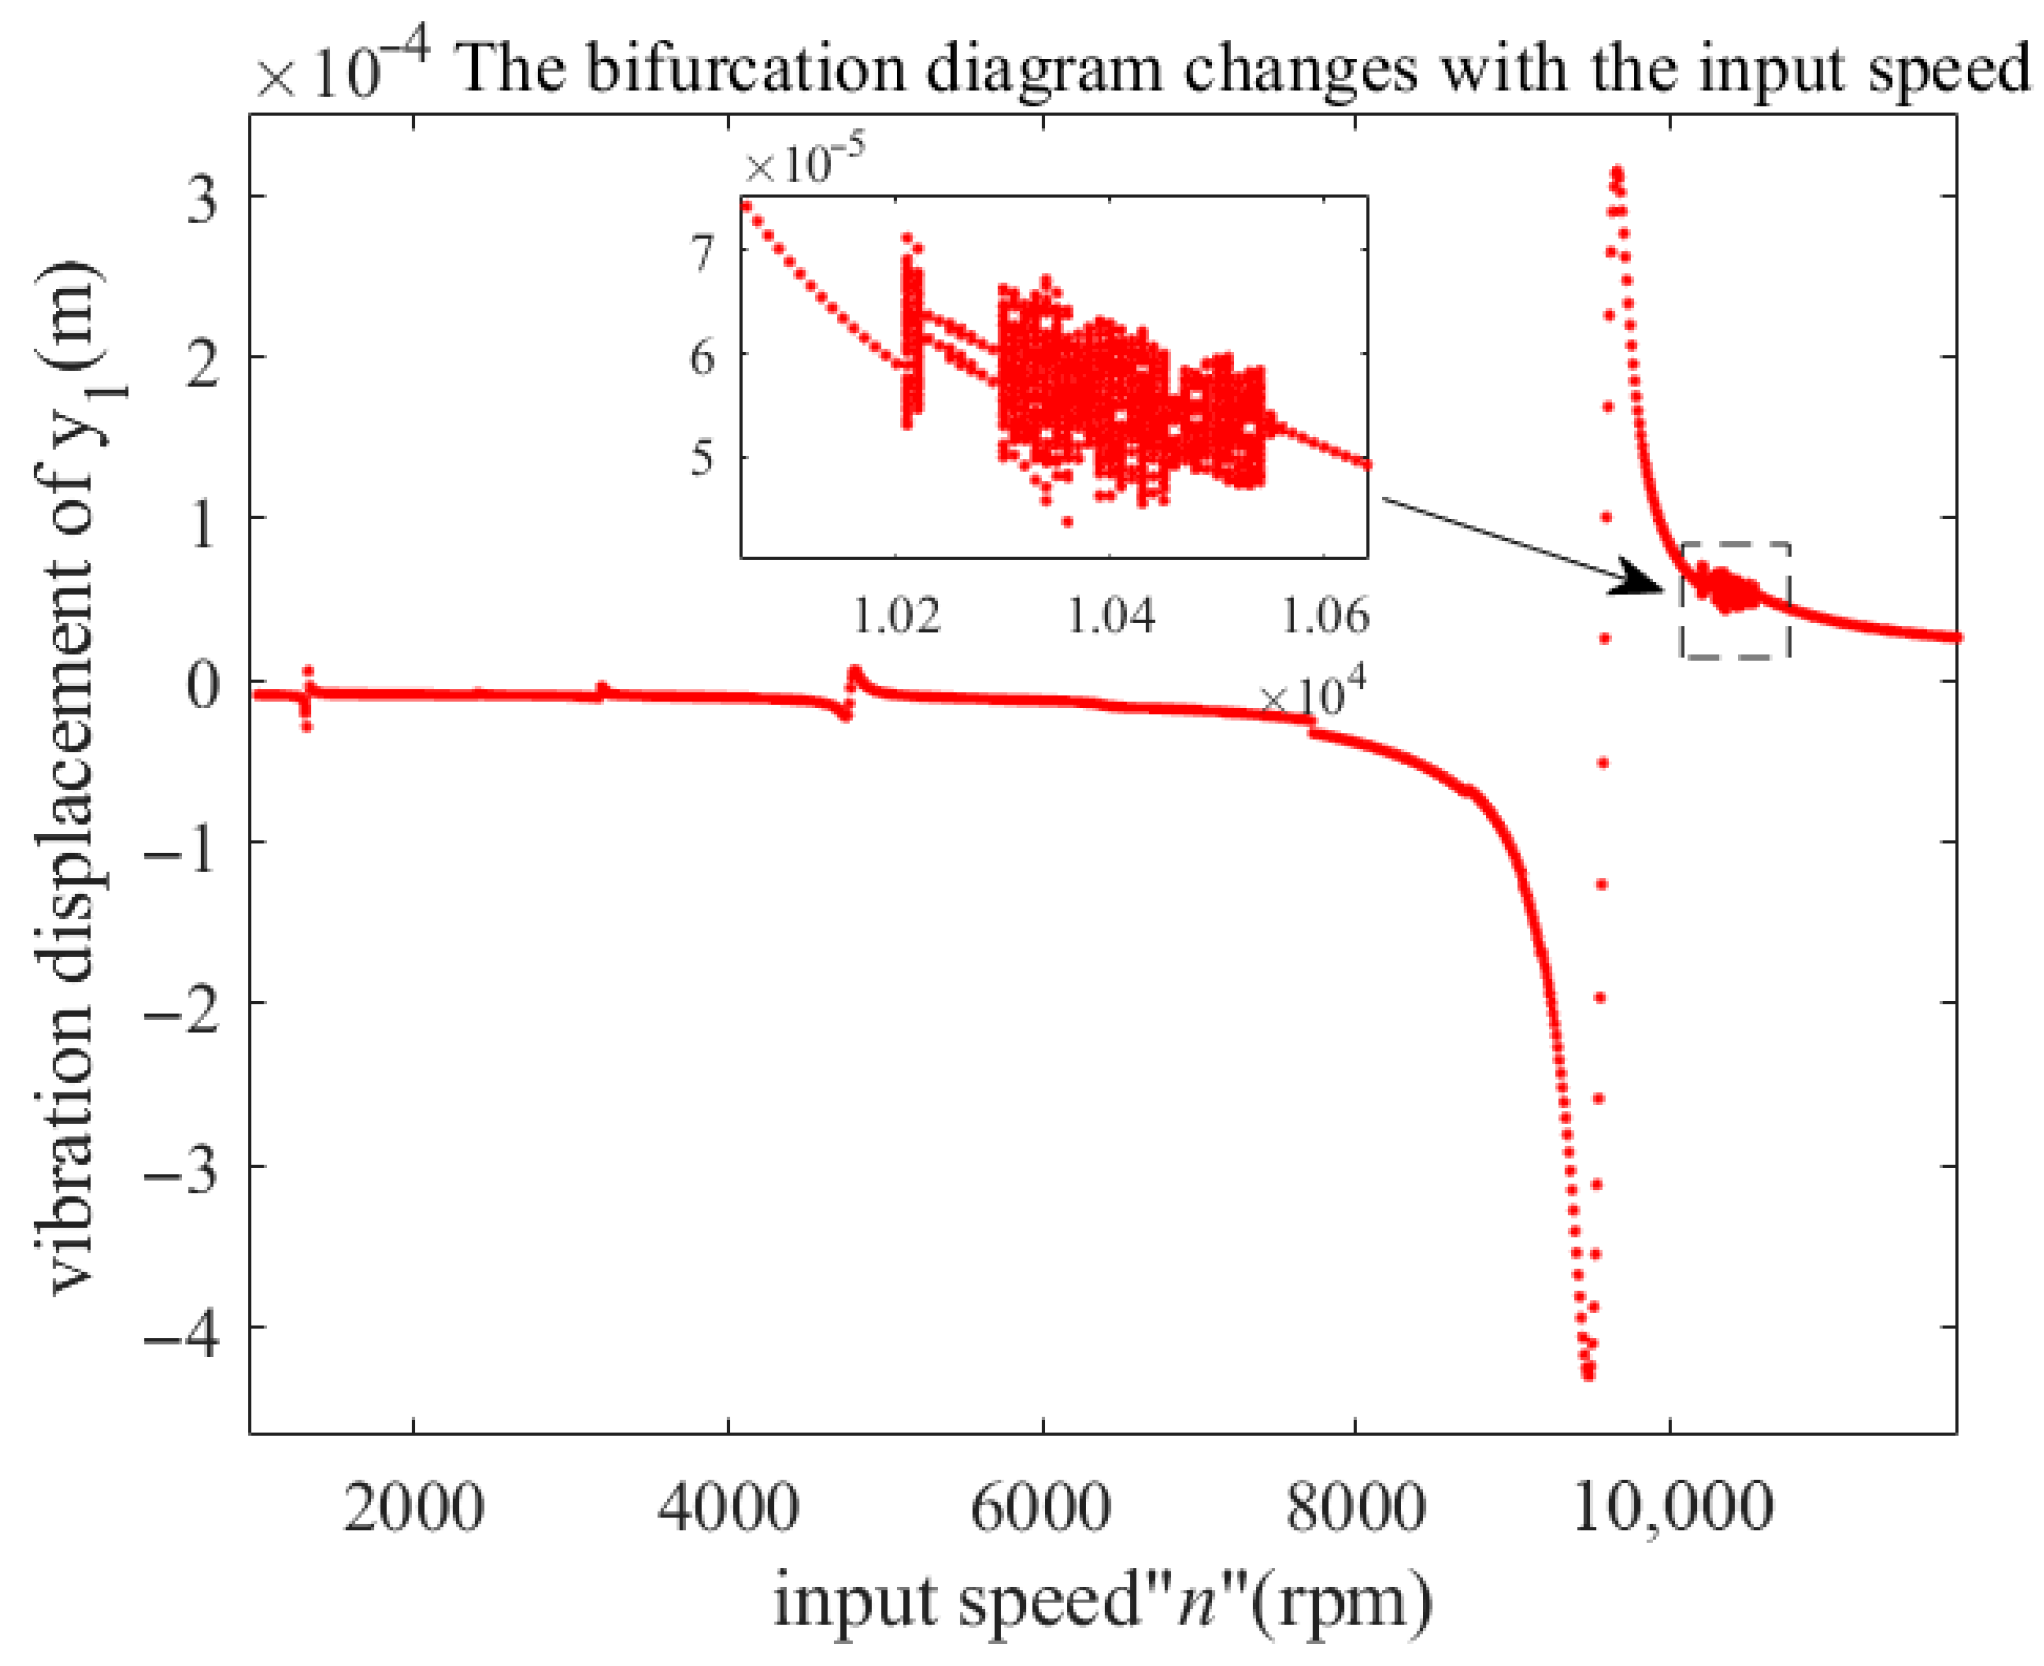
n as the bifurcation parameter, the gear backlash, the meshing damping ratio, and the error excitation amplitude take a certain value, and the bifurcation diagram of the y direction of the driving gear is drawn as shown in
Figure 5.
As illustrated in
Figure 5, the helical gear transmission system exhibits stable single-cycle operation at low speeds. However, when the input speed reaches 9470 r/min, a jump occurs, followed by a brief period of single-cycle operation at 10,200 r/min. Between 10,230 r/min and 10,290 r/min, the system transitions to double-cycle operation, and between 10,300 r/min and 10,550 r/min, it reverts to single-cycle operation. As the speed increases, the system maintains a stable single-cycle operation. This transformation process highlights the complexity of the nonlinear state conversion mechanism at high speeds, which is the focus of this study. This conclusion is similar to that of Reference [
23]. Therefore, the objective of this study is to investigate the characteristics of the high-speed transmission system.
4.2. The Influence of Backlash on the System
During the meshing process of gears for power transmission, it is essential to maintain a specific clearance between the engaging tooth profiles. This clearance, known as the tooth side clearance or simply backlash, serves two critical functions: it facilitates the formation of a lubricating oil film between the meshing surfaces and prevents the gears from jamming due to thermal expansion resulting from friction. However, the presence of this side clearance can lead to inter-tooth impact during operation, which in turn compromises the smoothness and stability of gear transmission. To mitigate these adverse effects, the backlash must be kept within a very small range. In practice, this is typically achieved and controlled through the application of the tooth difference method.
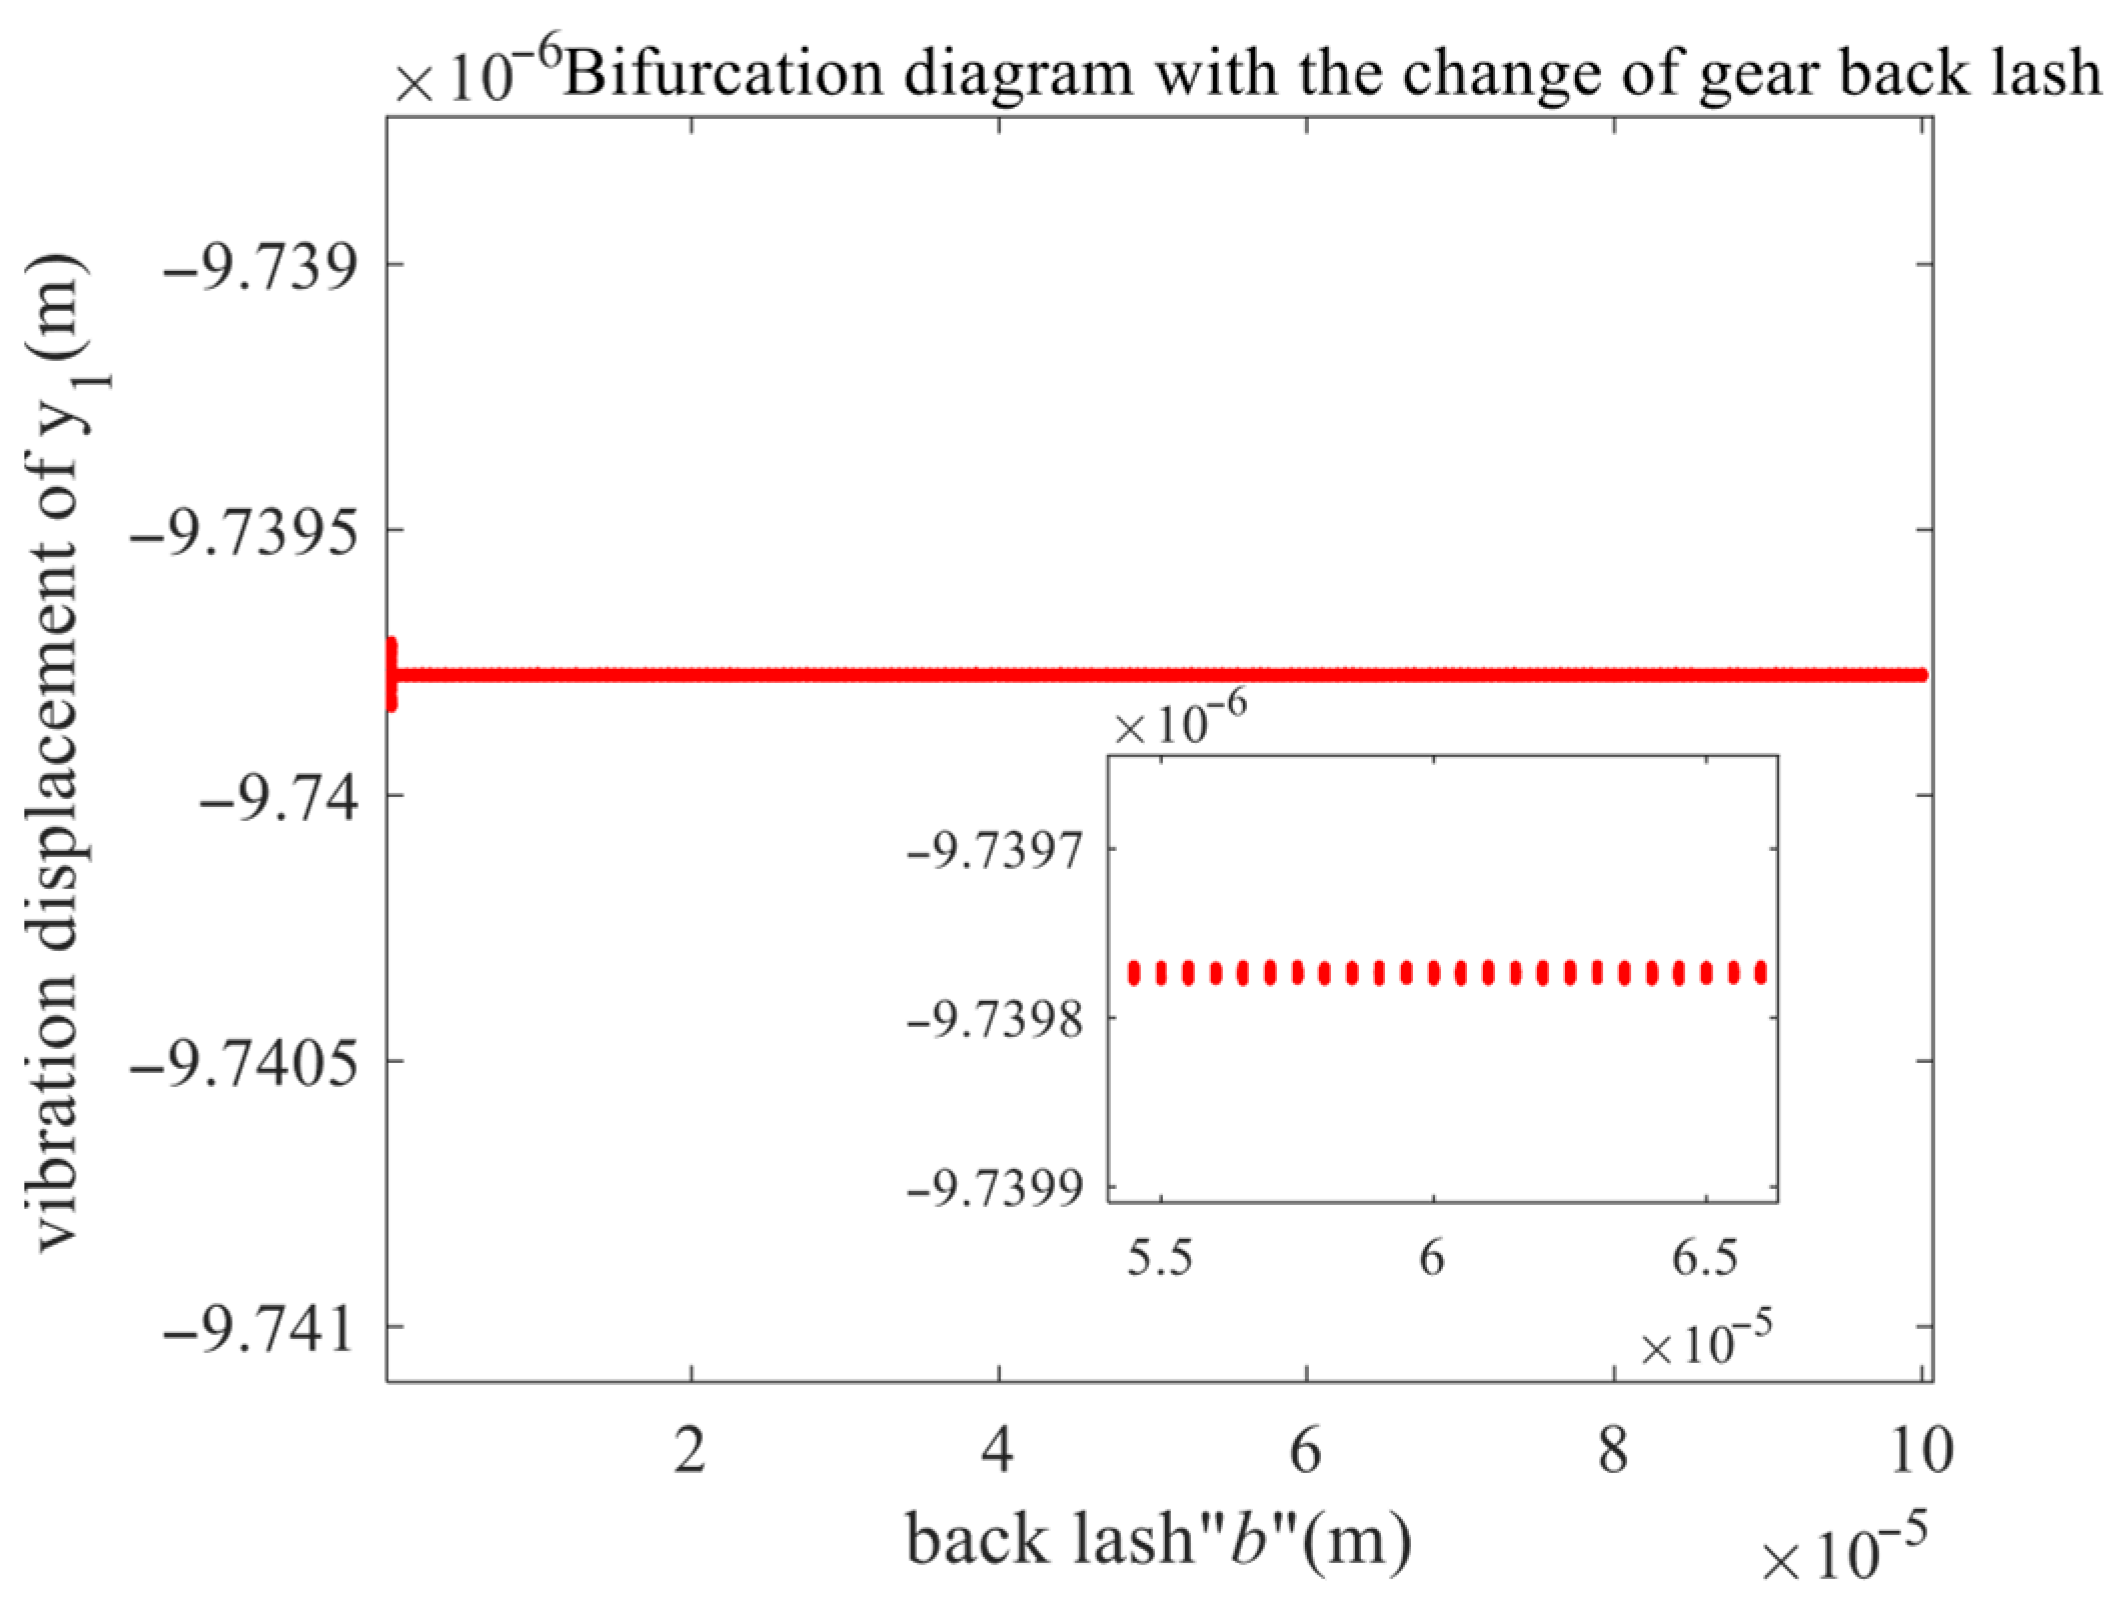
In order to verify that the nonlinearity of the helical gear transmission system is more obvious under high-speed conditions, the input speed is 3000 r/min, the backlash is taken as the bifurcation parameter, the meshing damping ratio and the error excitation amplitude are taken as a certain value, and the
y direction of the driving wheel is drawn. The bifurcation diagram is shown in
Figure 6.
As illustrated in
Figure 6, under a condition of 3000 rpm, the system consistently maintains a stable single-cycle operating state. This condition exhibits a uniform distribution of single-point values, indicating a lack of transition to higher cycles or chaotic behavior. At this operating speed, the system’s dynamic characteristics remain unaltered, limiting the system’s diagnostic value for nonlinear mechanisms and fault characteristics.
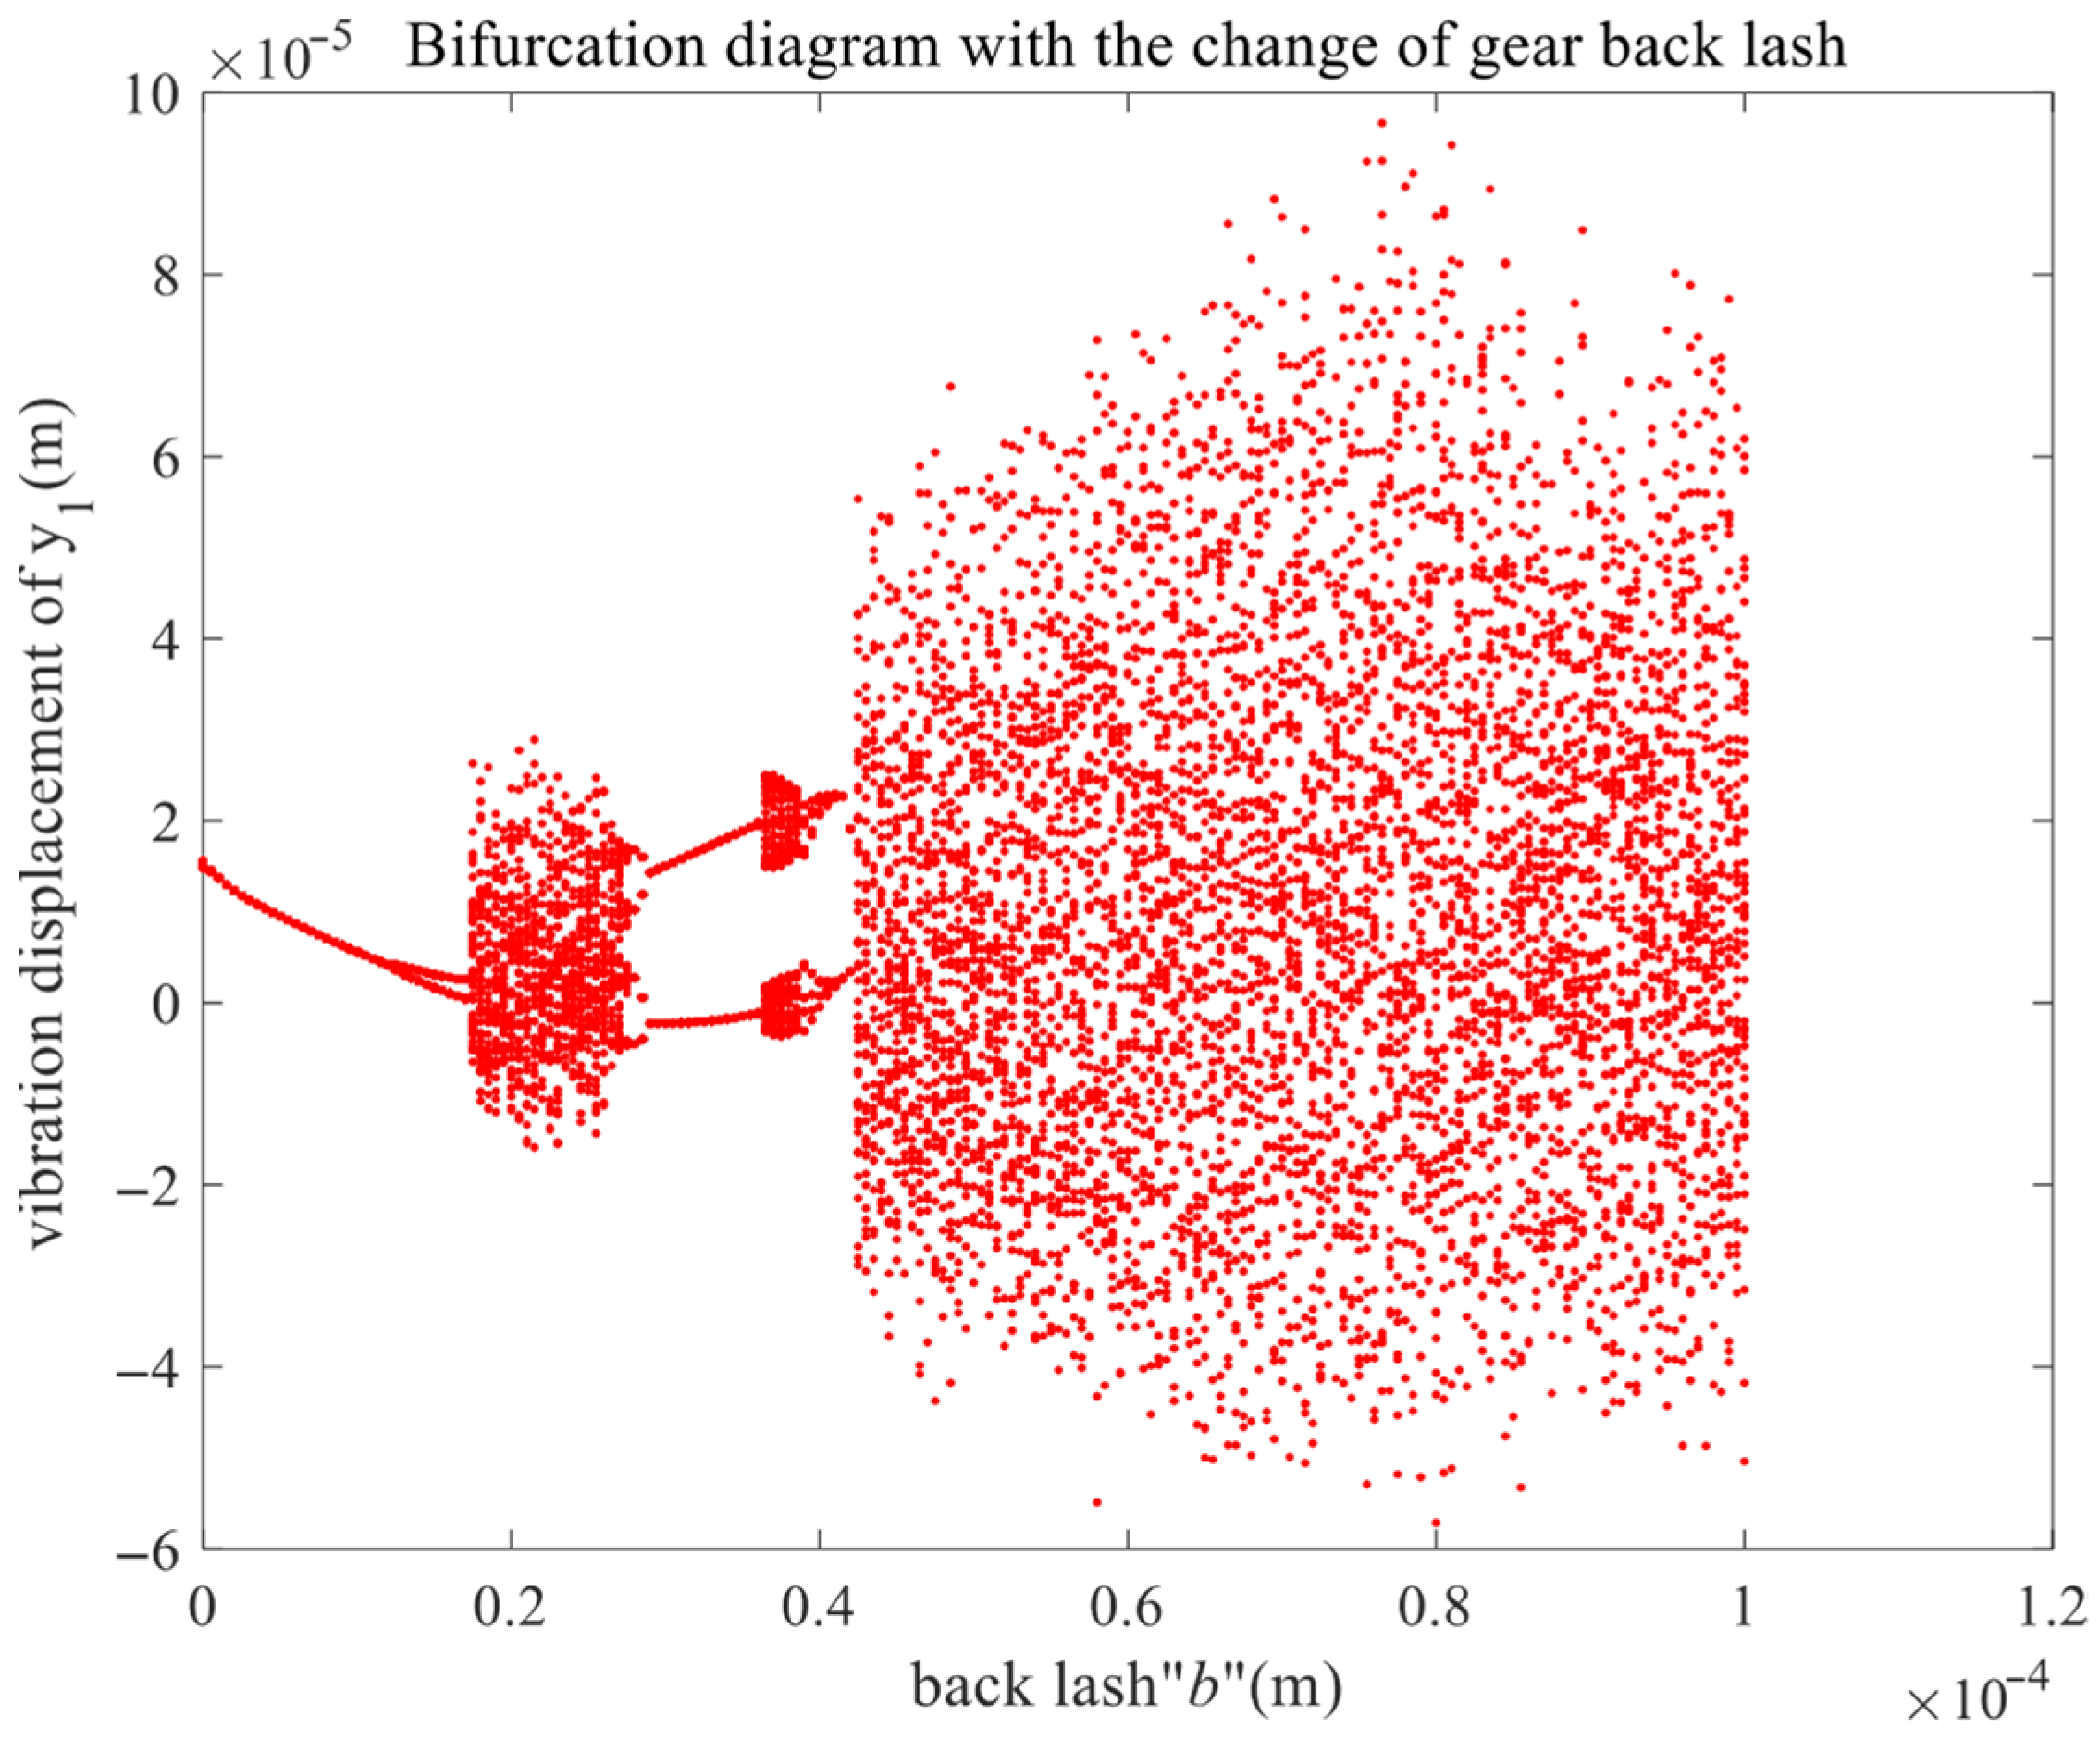
Taking the input speed as 10,000 r/min, with the backlash as the bifurcation parameter, and the meshing damping ratio and error excitation amplitude taking certain values, the bifurcation diagram of the driving wheel in the y direction is drawn as shown in
Figure 7.
As systematically illustrated in the bifurcation diagram presented in
Figure 7, the dynamic response of the system exhibits a complex, multi-stage evolution with increasing gear backlash
b. The system initially displays a unidirectional motion, characterized by a single trajectory for backlash values ranging from 0 to approximately 1.2 × 10
−5 m, which corresponds to stable periodic behavior. This regular regime undergoes a significant transformation as the first period-doubling bifurcation occurs, leading to a splitting of the trajectory into two distinct branches. Subsequently, the system rapidly transitions into a brief but well-defined interval of chaotic motion beginning at approximately 1.75 × 10
−5 m. This chaotic state is transient in nature; the four observed solution branches later merge back into two, eventually converging to a clearly identifiable stable periodic regime at the critical value of 3.65 × 10
−5 m. However, as the backlash parameter b further increases, the system once again loses stability and ultimately enters a sustained chaotic state. To quantitatively analyze this dynamical evolution, key nodal values of gear backlash—specifically 1 × 10
−5 m, 3 × 10
−5 m, 3.7 × 10
−5 m, and 4.5 × 10
−5 m—are identified as critical thresholds and will be subjected to detailed phase-space and time-domain analyses to elucidate the underlying nonlinear mechanisms governing the system’s behavior. It is worth noting that in this paper, the dynamic response plots are drawn starting from 5 s to eliminate the initial transient behavior and highlight the steady-state vibration characteristics of the system.
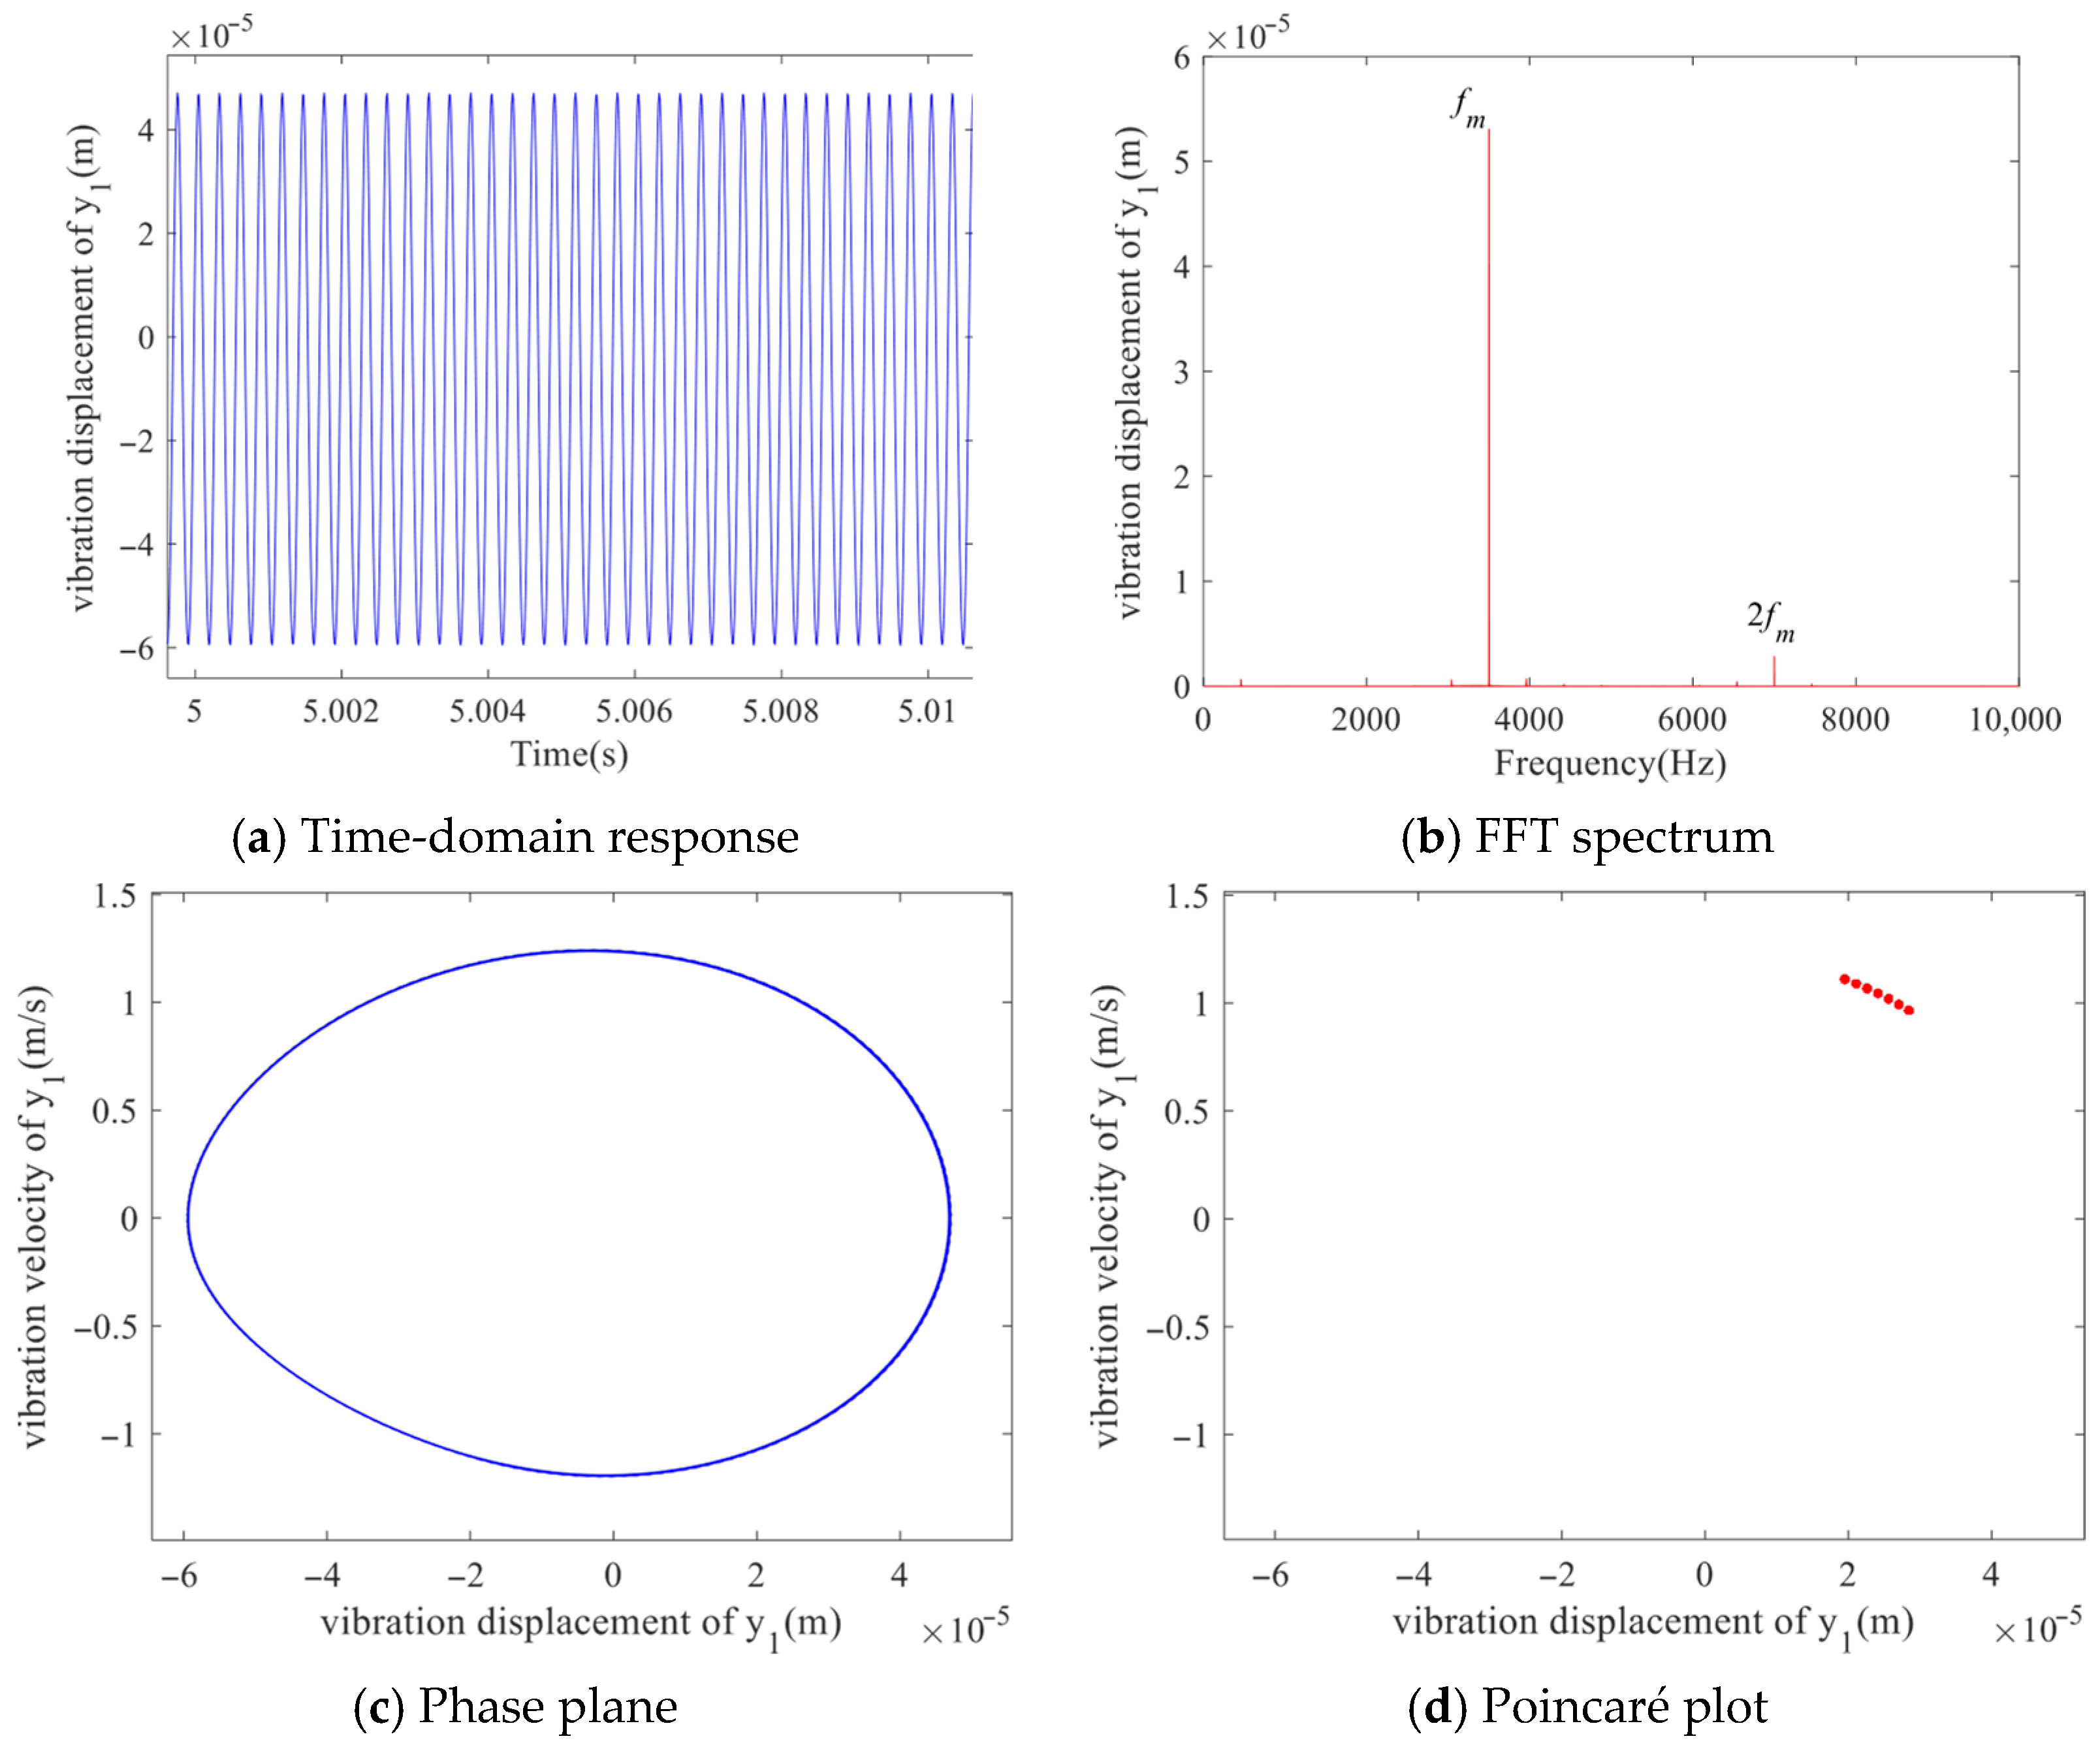
As shown in
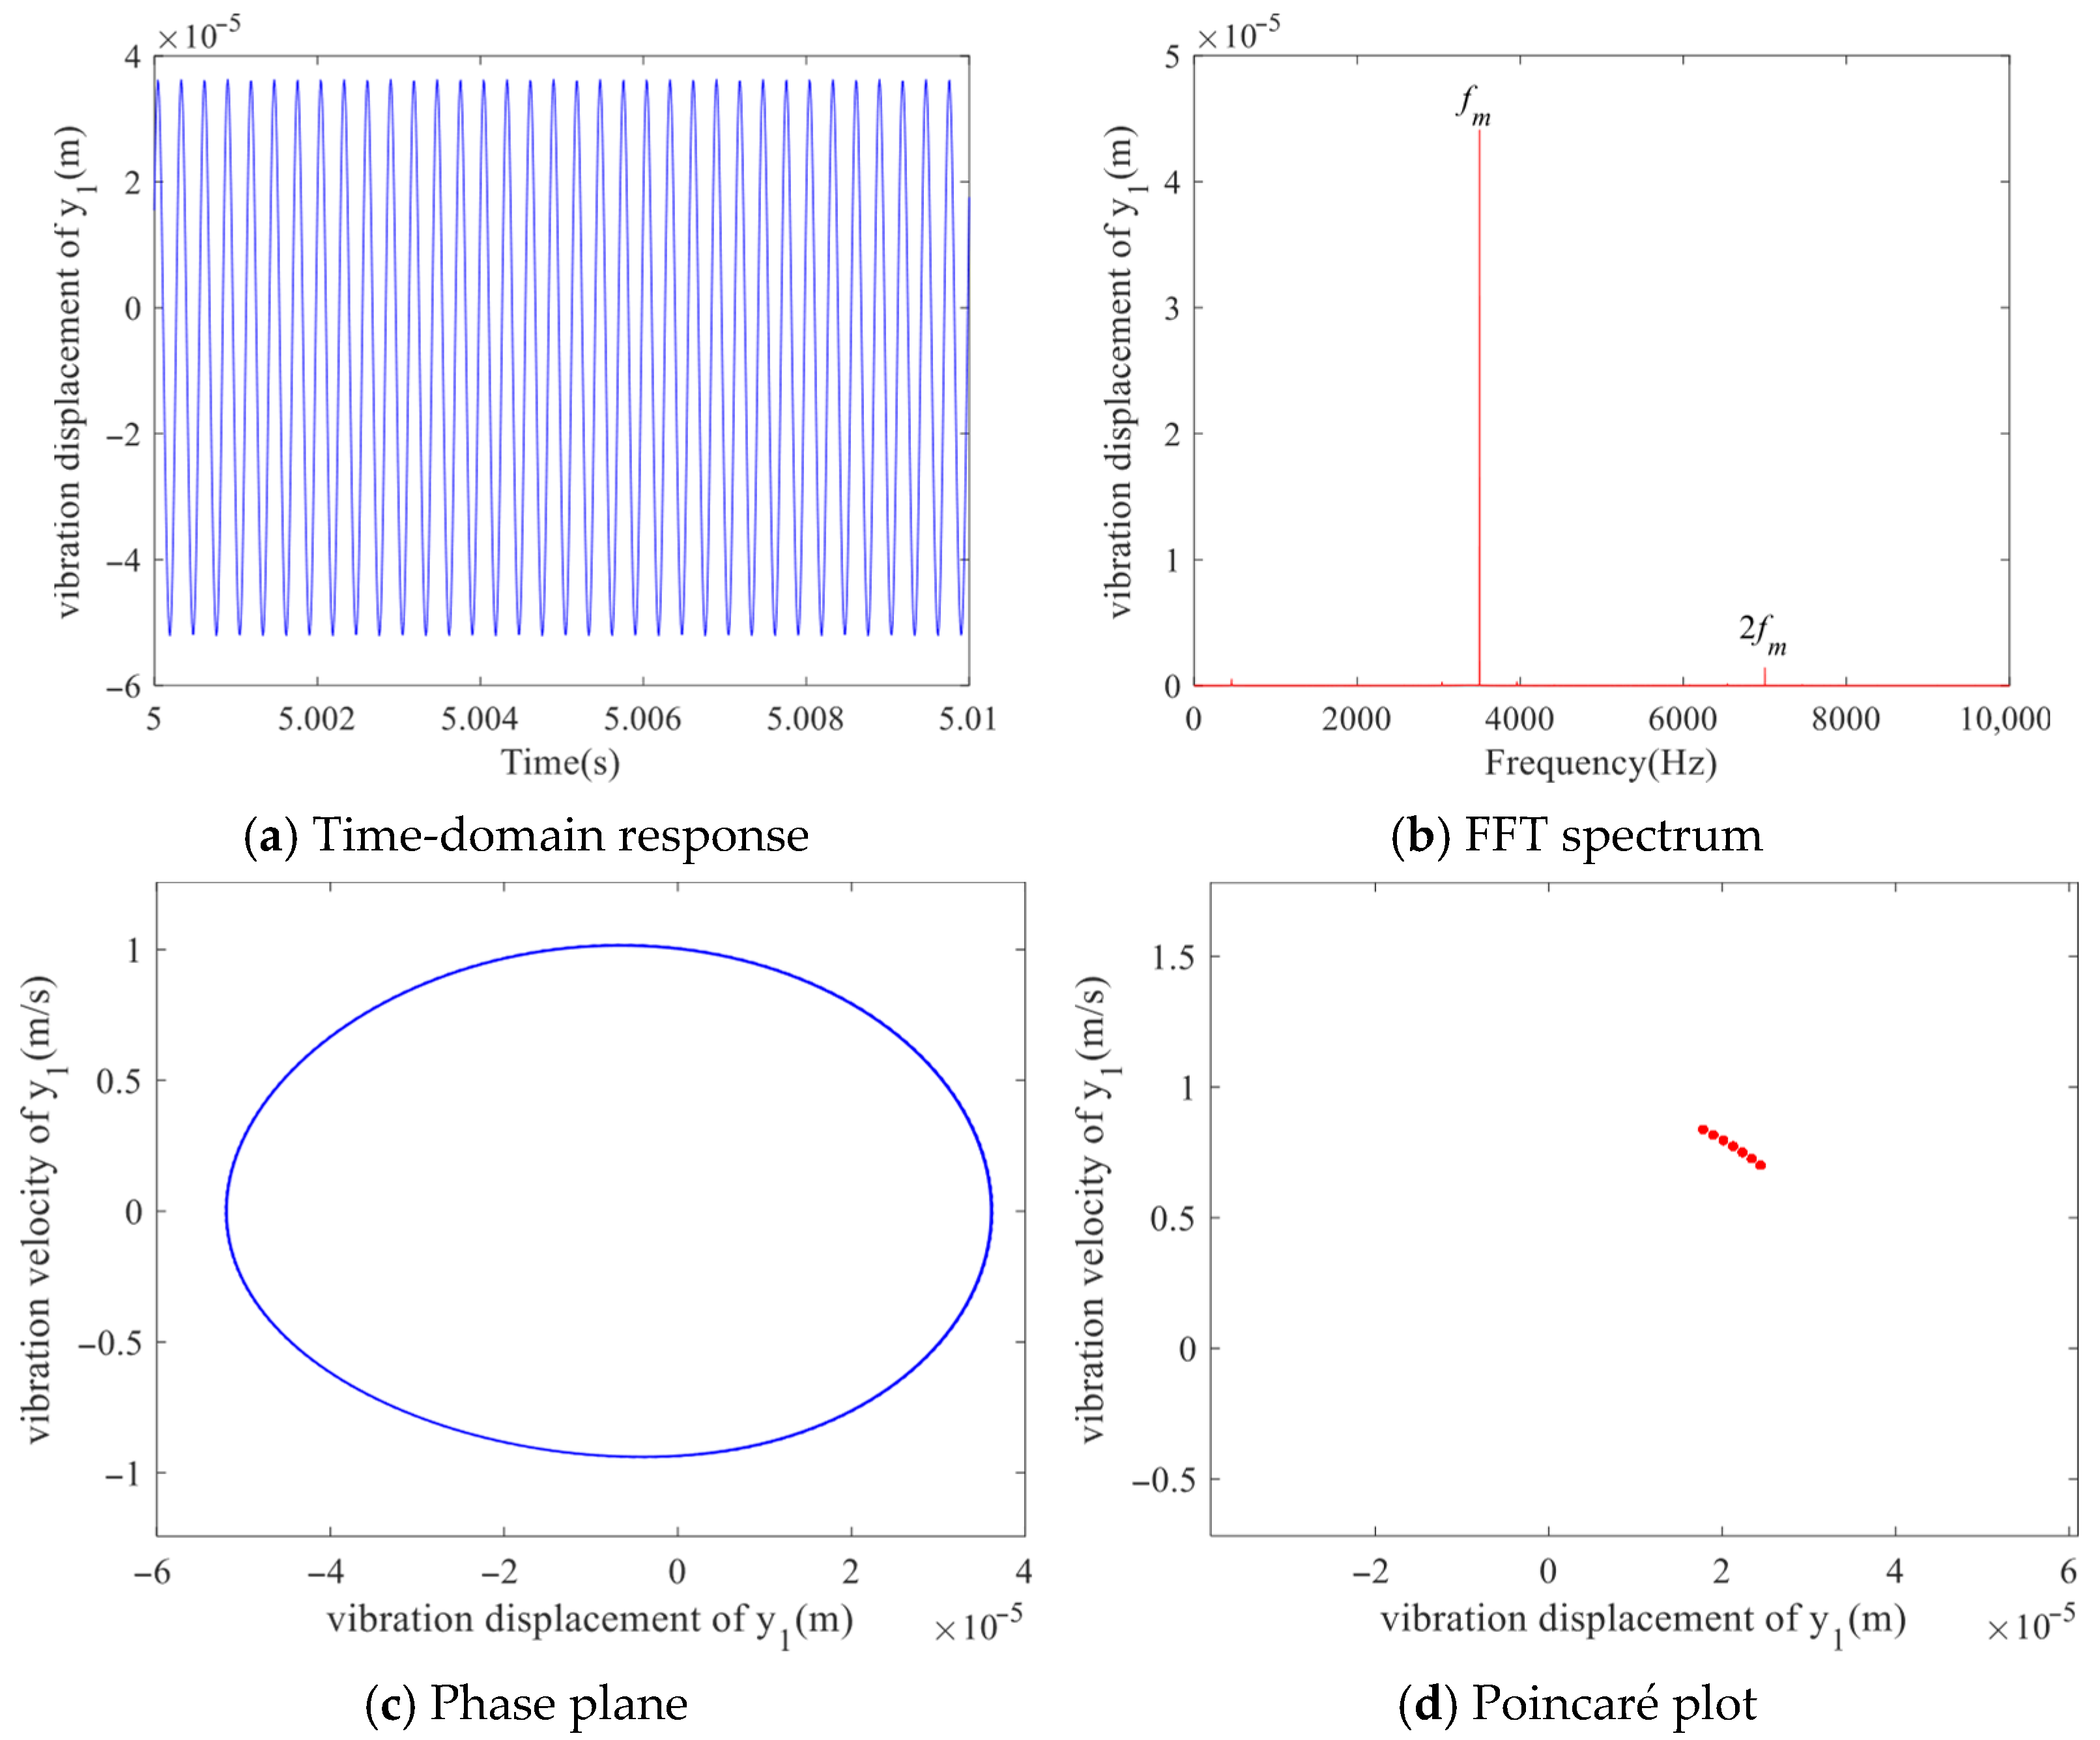
Figure 8, when the backlash is maintained at
b = 1 × 10
−5 m, the system exhibits distinct characteristics of single-period motion. The time-domain response presents a regular oscillatory waveform with consistent amplitude and period, while the frequency spectrum displays a single dominant peak with minimal harmonic components. The phase portrait reveals a well-defined, stable limit cycle, and the Poincaré map shows tightly clustered points, collectively confirming the periodic nature of the dynamic response. This coherent evidence from multiple analytical perspectives reliably demonstrates the system’s operation in a stable, predictable regime under this specific parameter configuration, indicating an absence of significant nonlinear disturbances at this minimal backlash setting.
As can be seen from
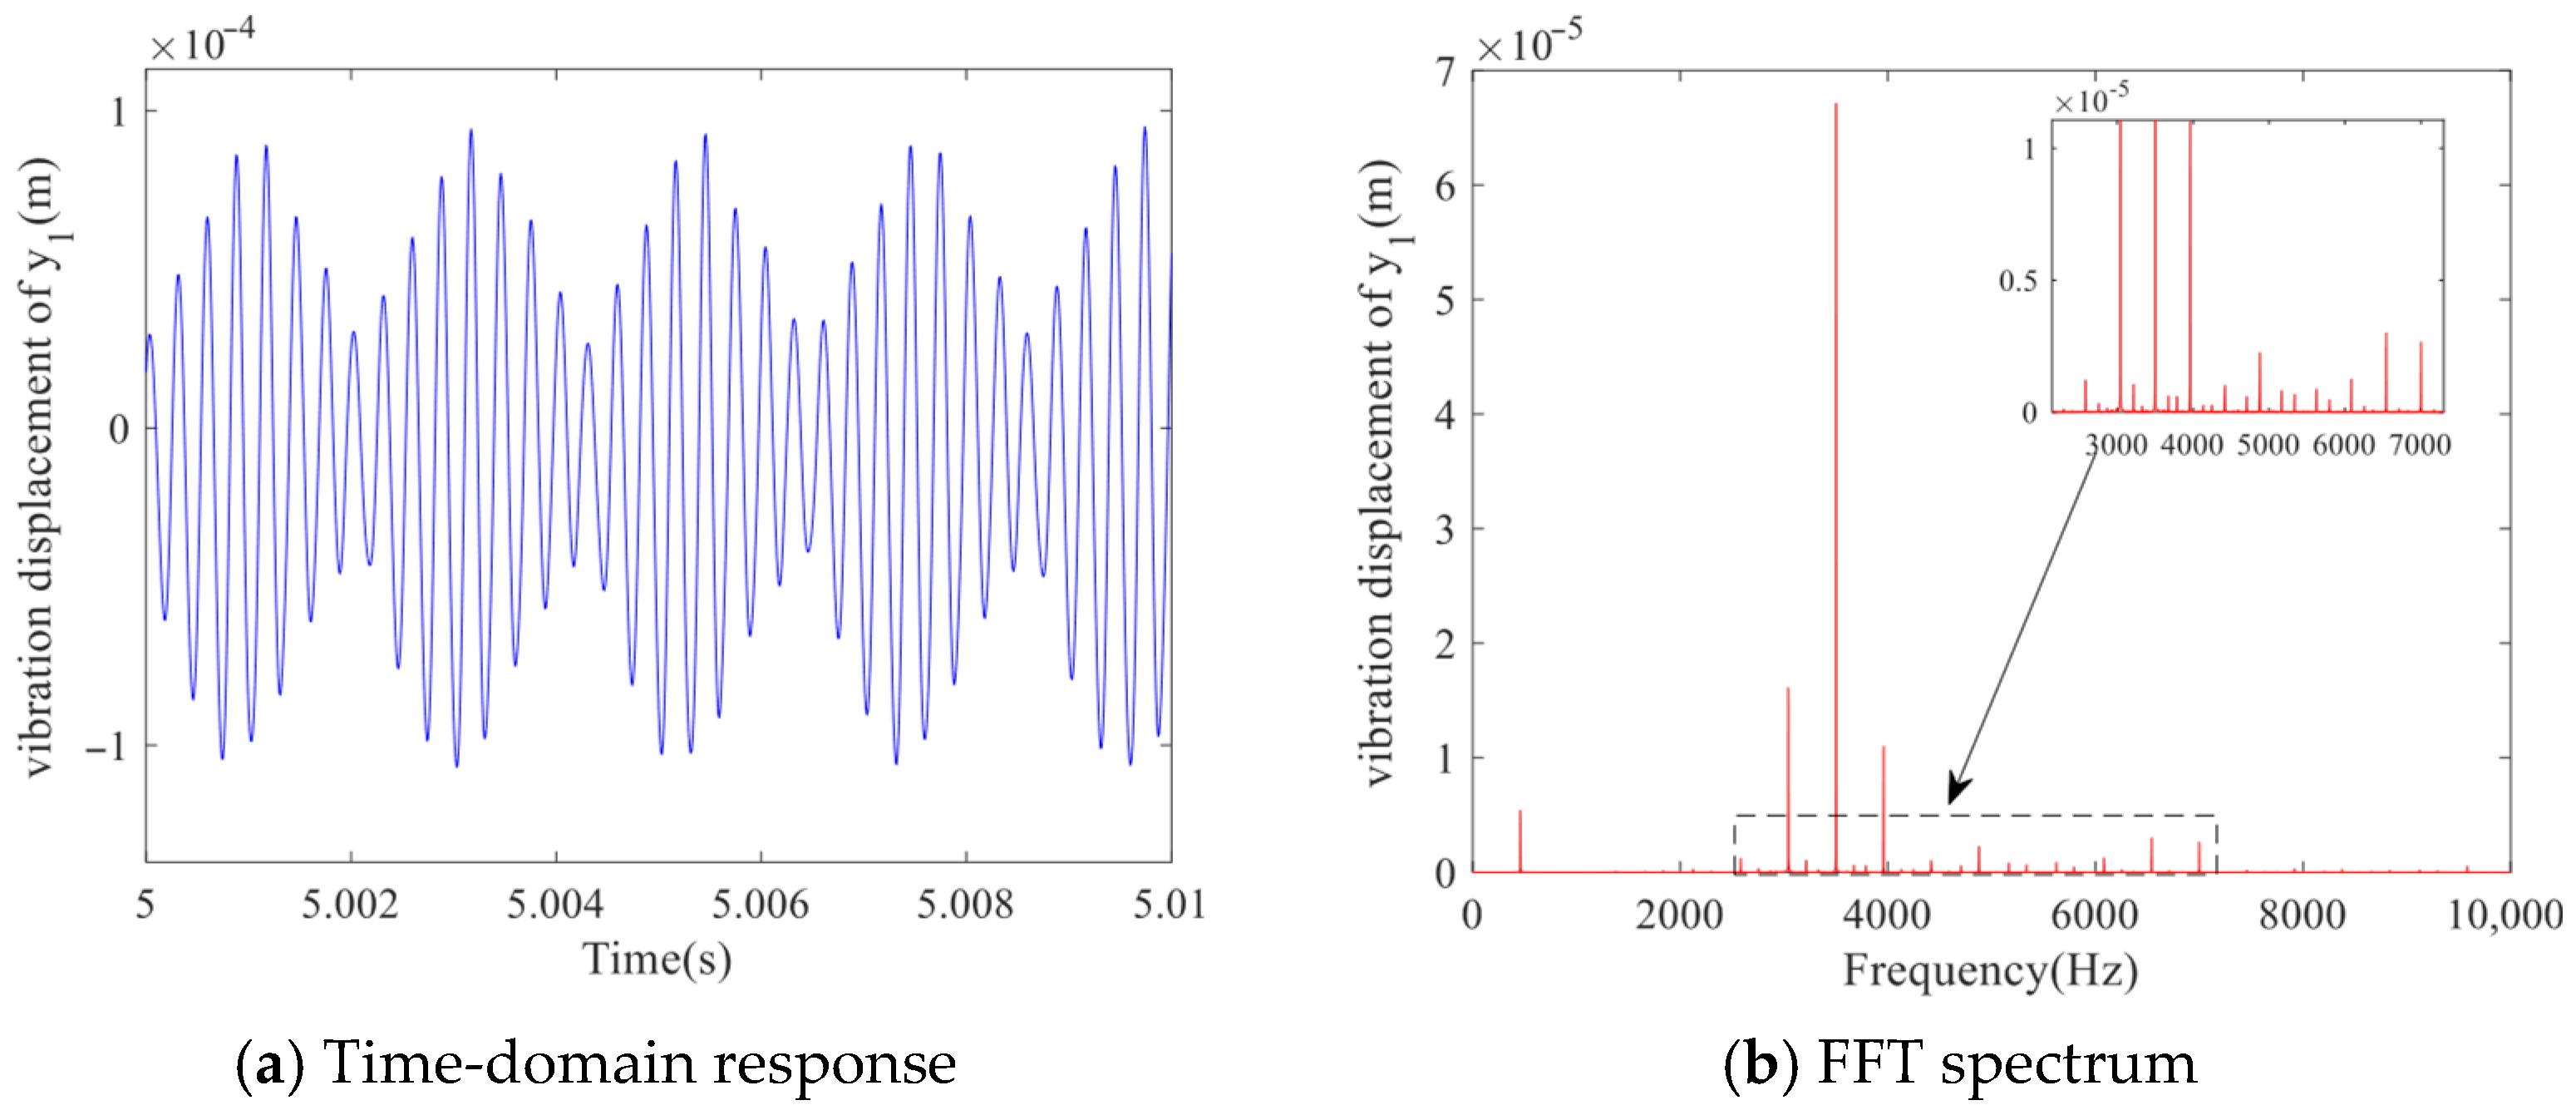
Figure 9, when the backlash increases to
b = 3 × 10
−5 m, its time-domain response shows a continuous waveform with alternating amplitudes of two peaks. Obvious sub-harmonic peaks (bimodal structure) appear in the spectrum diagram, and the phase diagram consists of two independent closed loops. The Poincare section forms two separate sets of aggregation points, which conforms to the typical characteristics of double periodic motion.
As can be seen from
Figure 10, when the backlash is further increased to
b = 3.7 × 10
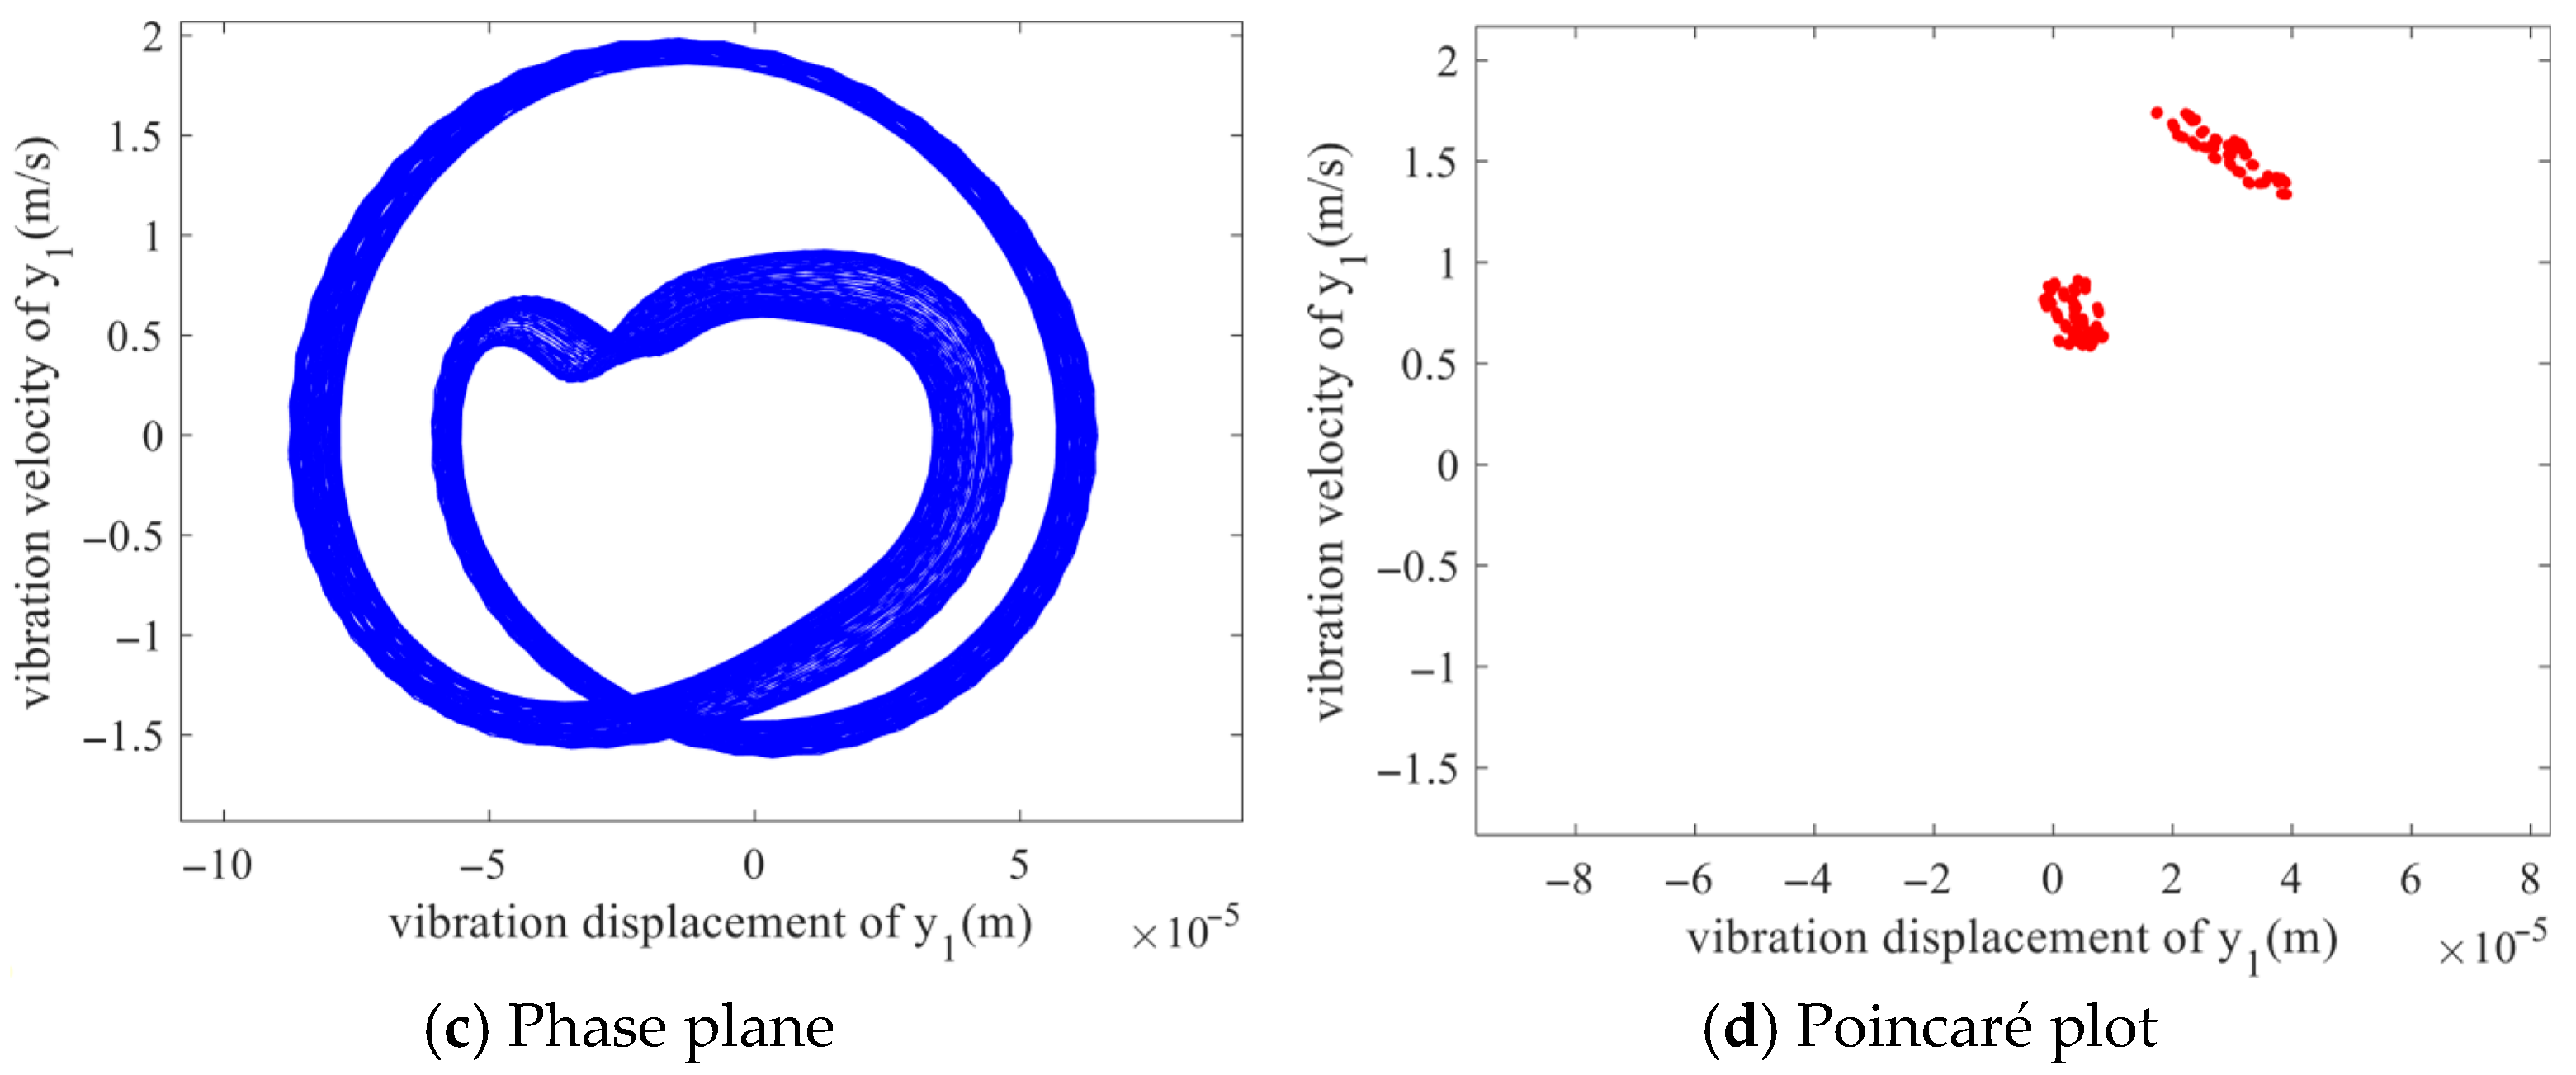
−5 m, the time-domain response still shows periodicity, but the waveform is more complex. The spectrum presents a multi-peak structure with multiple non-uniform frequency components. The phase diagram shows two closed loops formed by the winding of dense curves, and the Poincare section presents two relatively dispersed point sets. These features jointly reveal that the system has entered a quasi-periodic motion state.
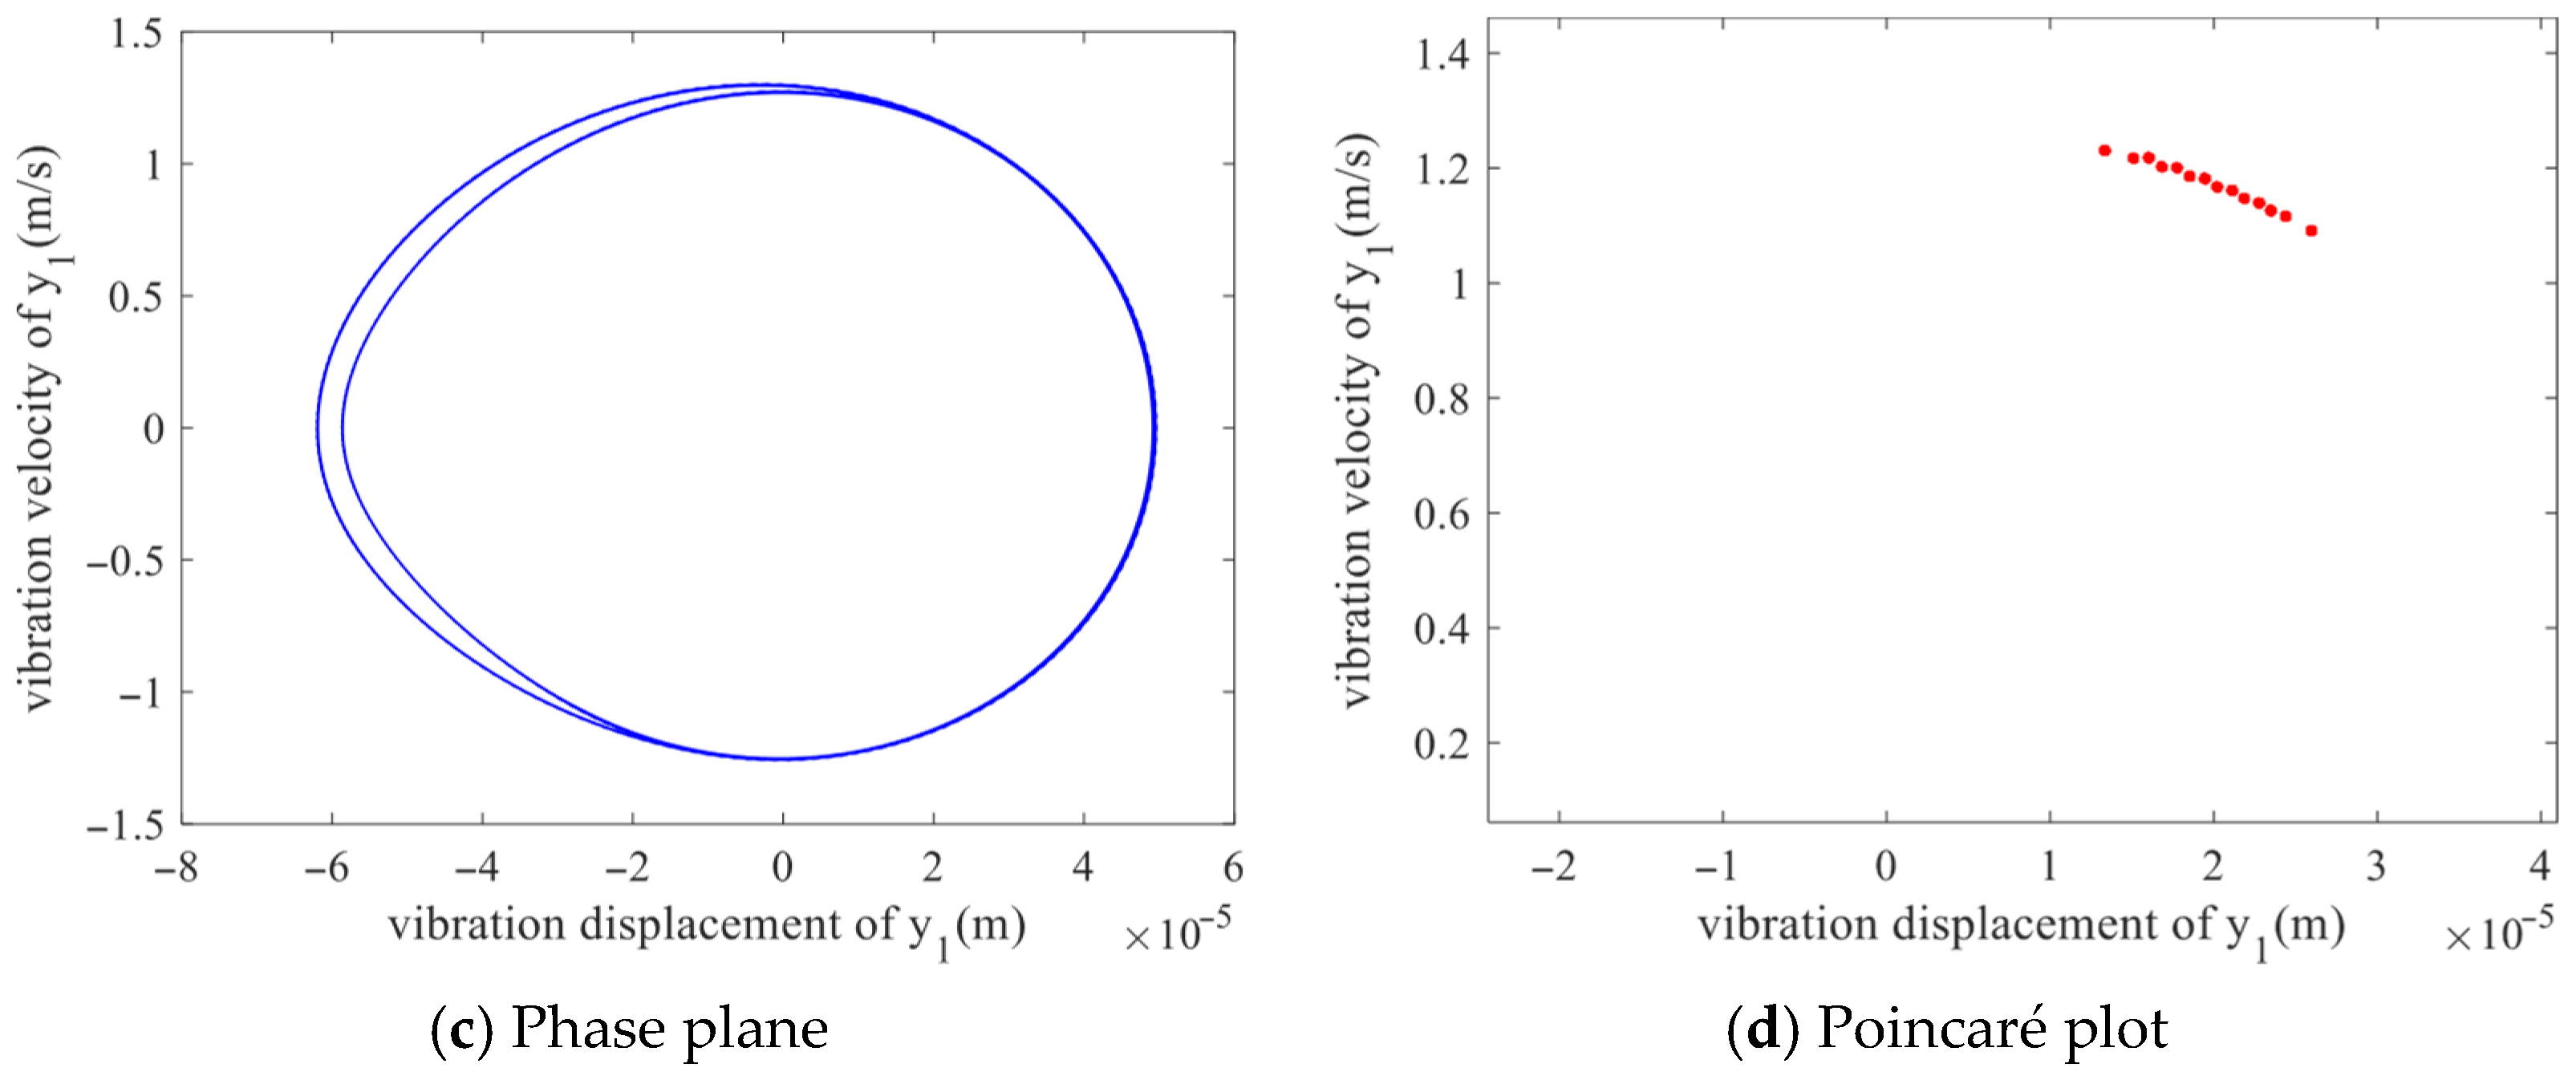
Subsequently, when the backlash reaches
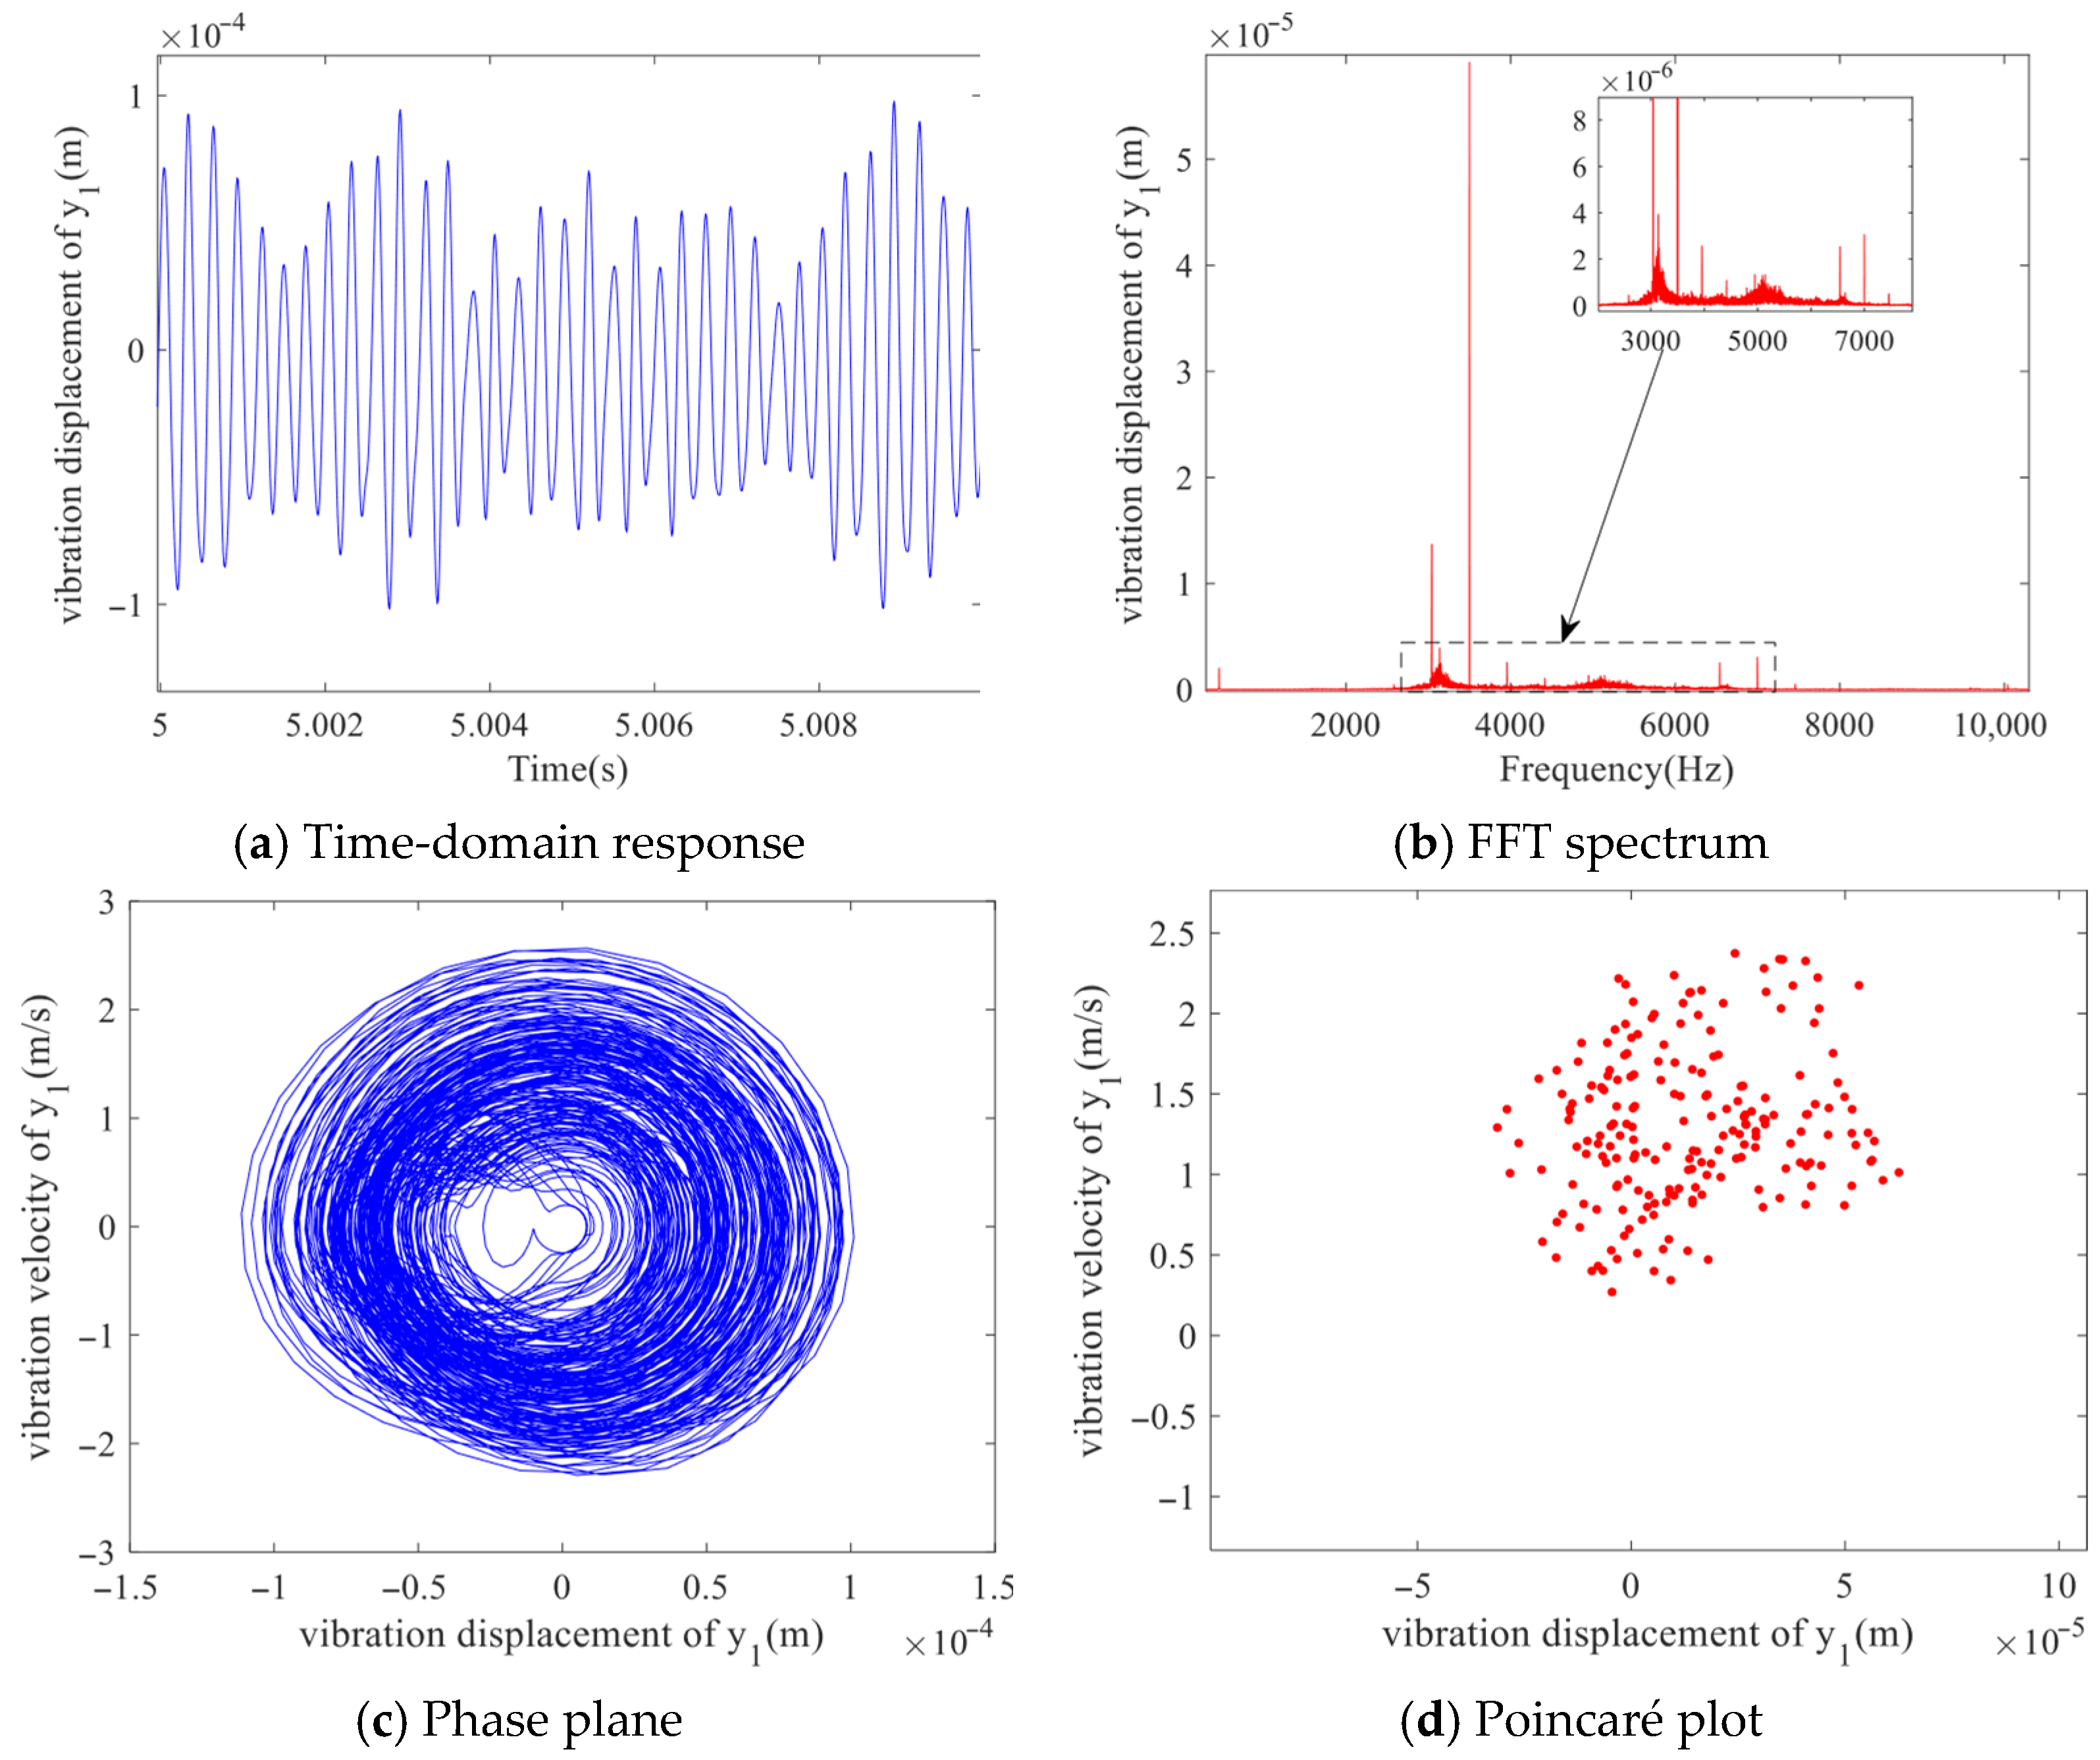
b = 4.5 × 10
−5 m, as shown in
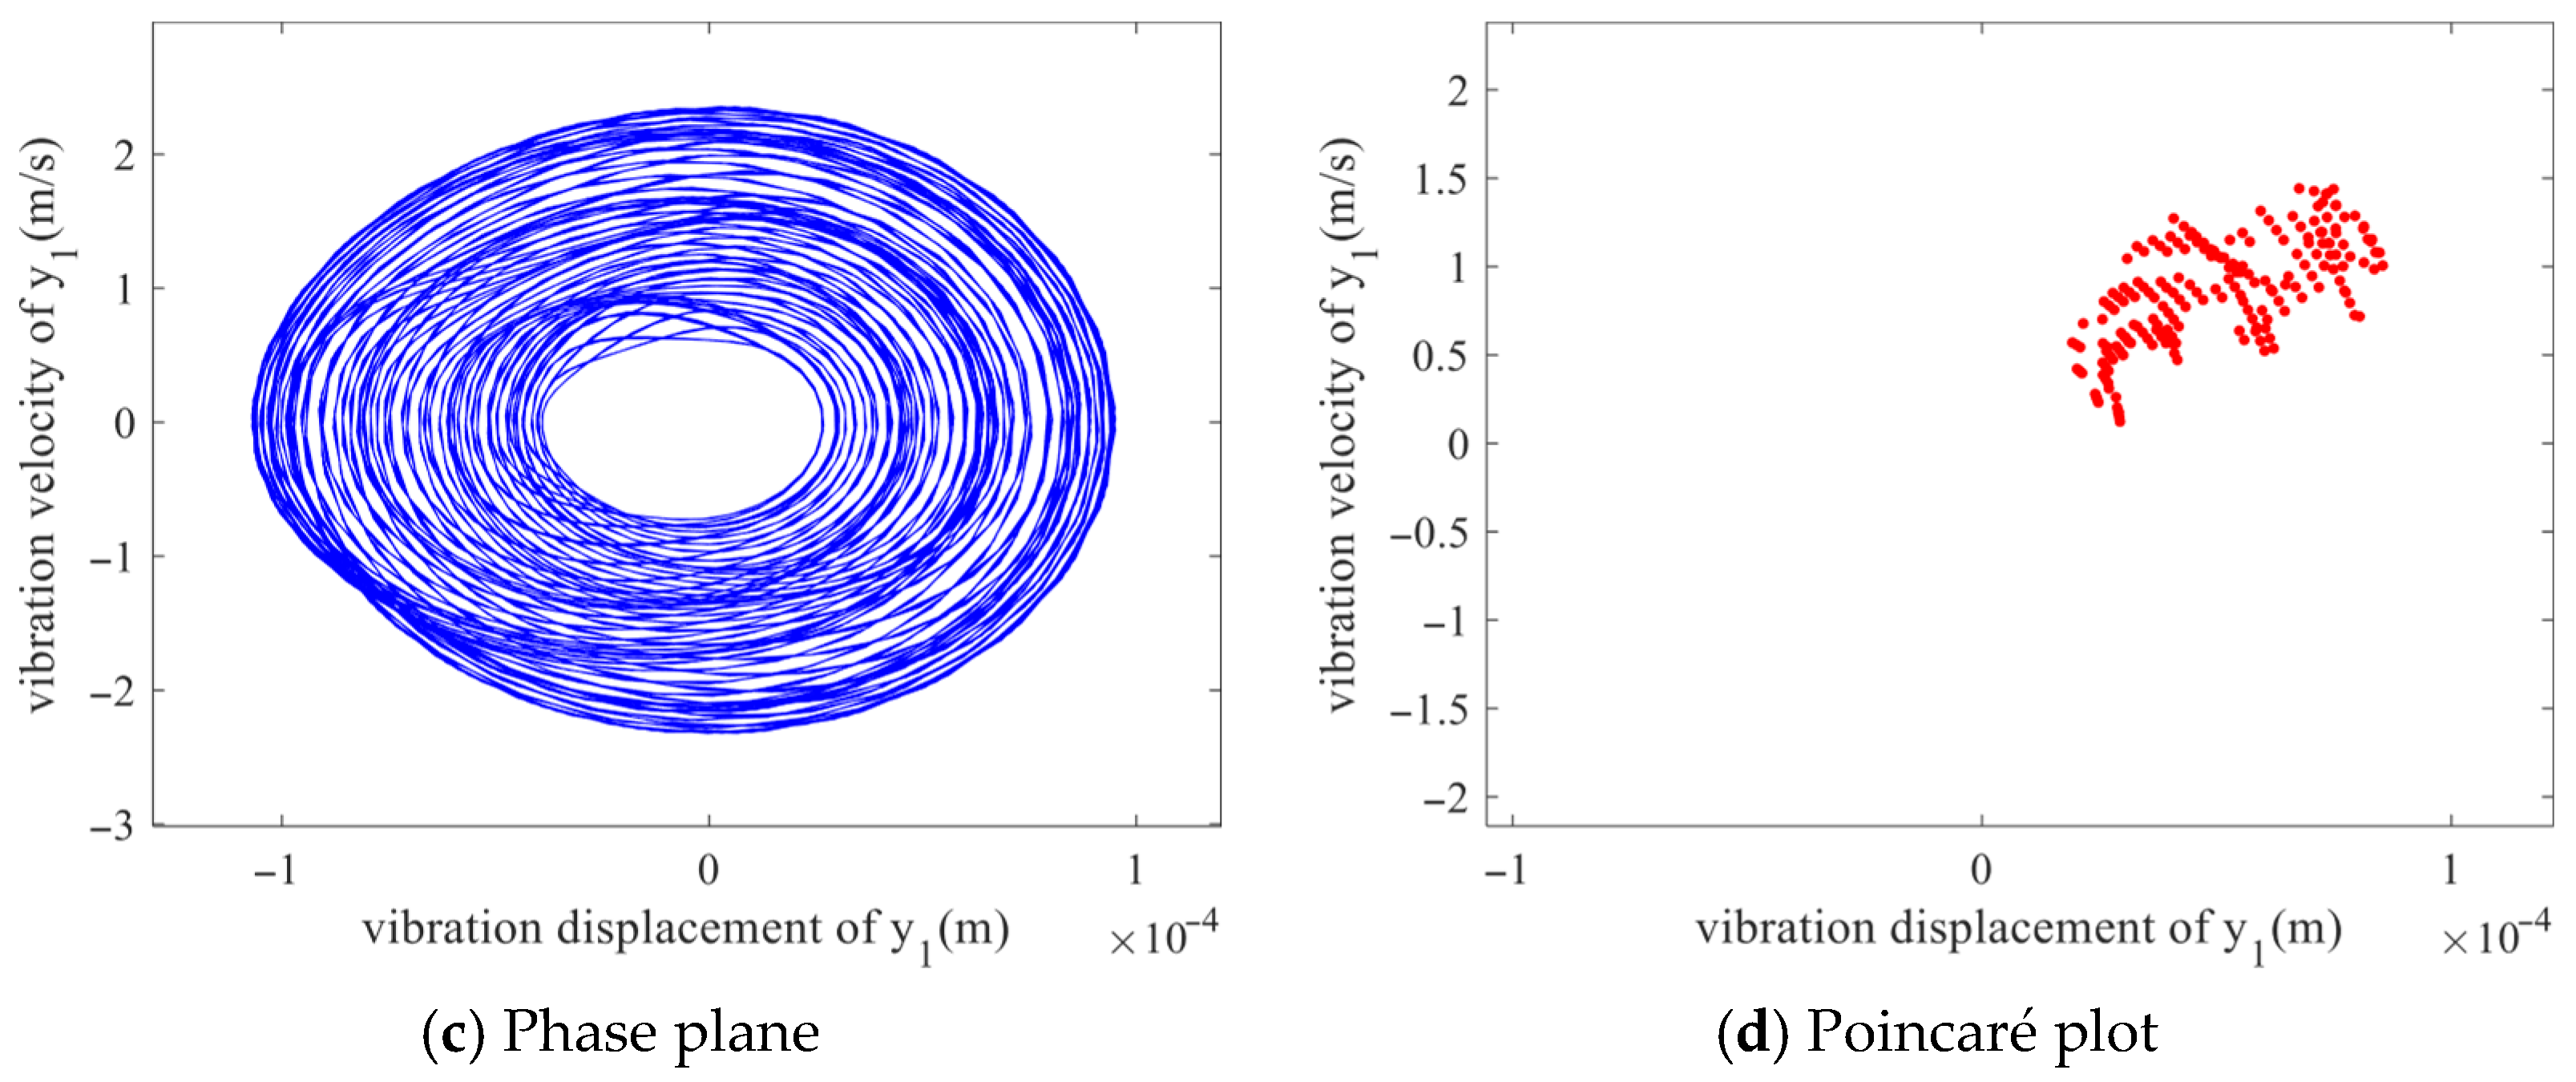
Figure 11. the response becomes non-periodic and exhibits a complex waveform. The spectrum is characterized by a wide band with a background of randomness. The surface response is non-uniform and distributed, with a lack of structure and dispersion. This indicates that the system has transitioned to a chaotic state.
The above analysis reveals the nonlinear characteristics of the system varying with the gear backlash under high-input-speed conditions. The system performs stable single-period motion with a small backlash. However, as the gear backlash increases, the system undergoes bifurcation behavior and enters double-period or quasi-periodic motion. When the backlash increases to a certain value, the system will enter chaotic motion. This result is similar to those in the literature [
16,
23]. This result has certain reference value for the design of helical gear transmission systems of pure electric vehicle reducers.
4.3. The Influence of Meshing Error on the System
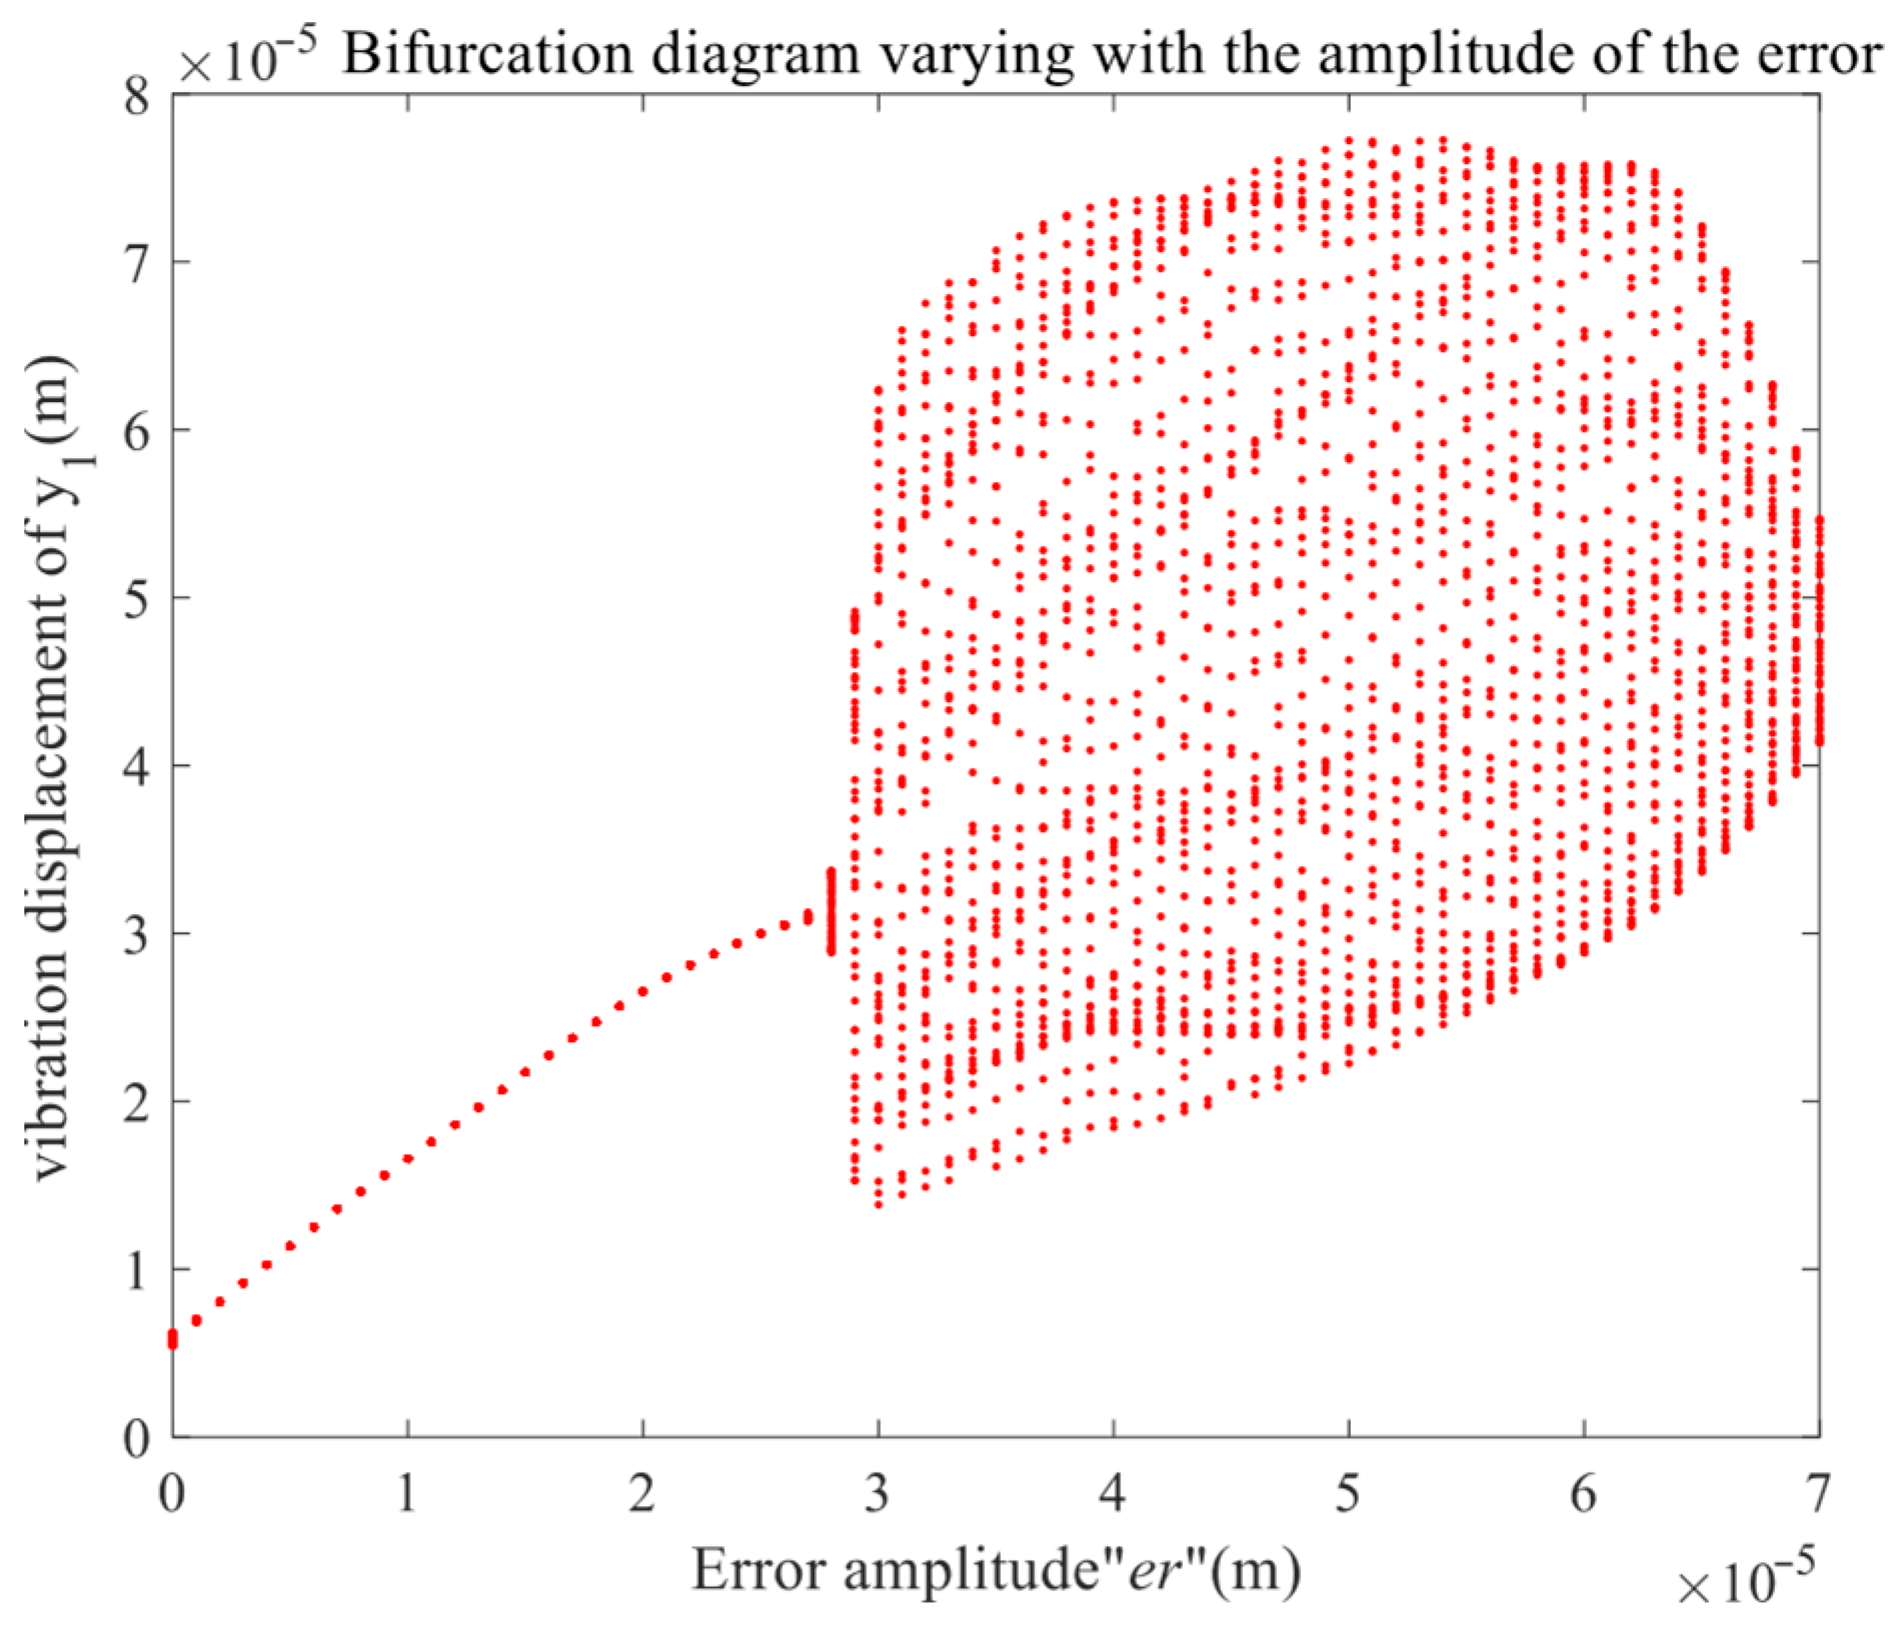
Gear transmission error refers to the difference between the actual output speed or position of the gear during the transmission process and the theoretical value. There are many sources of transmission errors, including gear manufacturing errors, installation errors, wear, etc. Taking the input speed as 10,000 r/min, the damping ratio and the gear backlash as certain values, and using the comprehensive error excitation amplitude
er as the bifurcation parameter, the bifurcation diagram of the driving gear in the y direction is drawn as shown in
Figure 12.
As revealed by the bifurcation diagram in
Figure 12, the system’s dynamic response is critically dependent on the error amplitude. At minimal error levels, the system exhibits a single-curve trajectory in the bifurcation diagram, a hallmark of stable periodic oscillation and predictable deterministic behavior. However, this orderly state undergoes a profound transformation once the error amplitude surpasses a specific critical threshold. The bifurcation structure subsequently dissolves into a dense, cloud-like distribution of points, which is a characteristic signature of chaotic dynamics. In this regime, the system’s behavior becomes inherently sensitive to initial conditions and exhibits long-term unpredictability. A comparative analysis of two distinct operational states—specifically, the stable periodicity observed at
er = 1 × 10
−5 m and the developed chaos at
er = 4 × 10
−5 m—serves to quantitatively illustrate this transition from an ordered to a chaotic state. The morphological evolution of the bifurcation diagram, from a well-defined curve to a complex, filled-band structure, thus provides a crucial visual mapping of the system’s degrading stability. Deciphering this mapping is essential for forecasting vibrational performance and establishing tolerance limits for transmission errors in practical gear system applications.
As illustrated by the diagnostic results in
Figure 13, under an error amplitude of
er = 1 × 10
−5 m, the system exhibits clear signatures of periodic motion. The corresponding time-domain waveform maintains a consistent amplitude modulation pattern, while its frequency spectrum is dominated by a distinct single peak at the fundamental meshing frequency, with higher-order harmonics remaining negligible. This behavior is further corroborated in the phase plane, where the trajectory resolves into a single, smooth, and closed limit cycle, indicating a deterministic periodic attractor. The Poincaré map, manifesting as a tight cluster of discrete points, provides conclusive evidence that the system operates in a stable, single-period steady state, characterized by minimal sensitivity to initial perturbations.
When the error amplitude increases to
er = 4 × 10
−5 m, as shown in
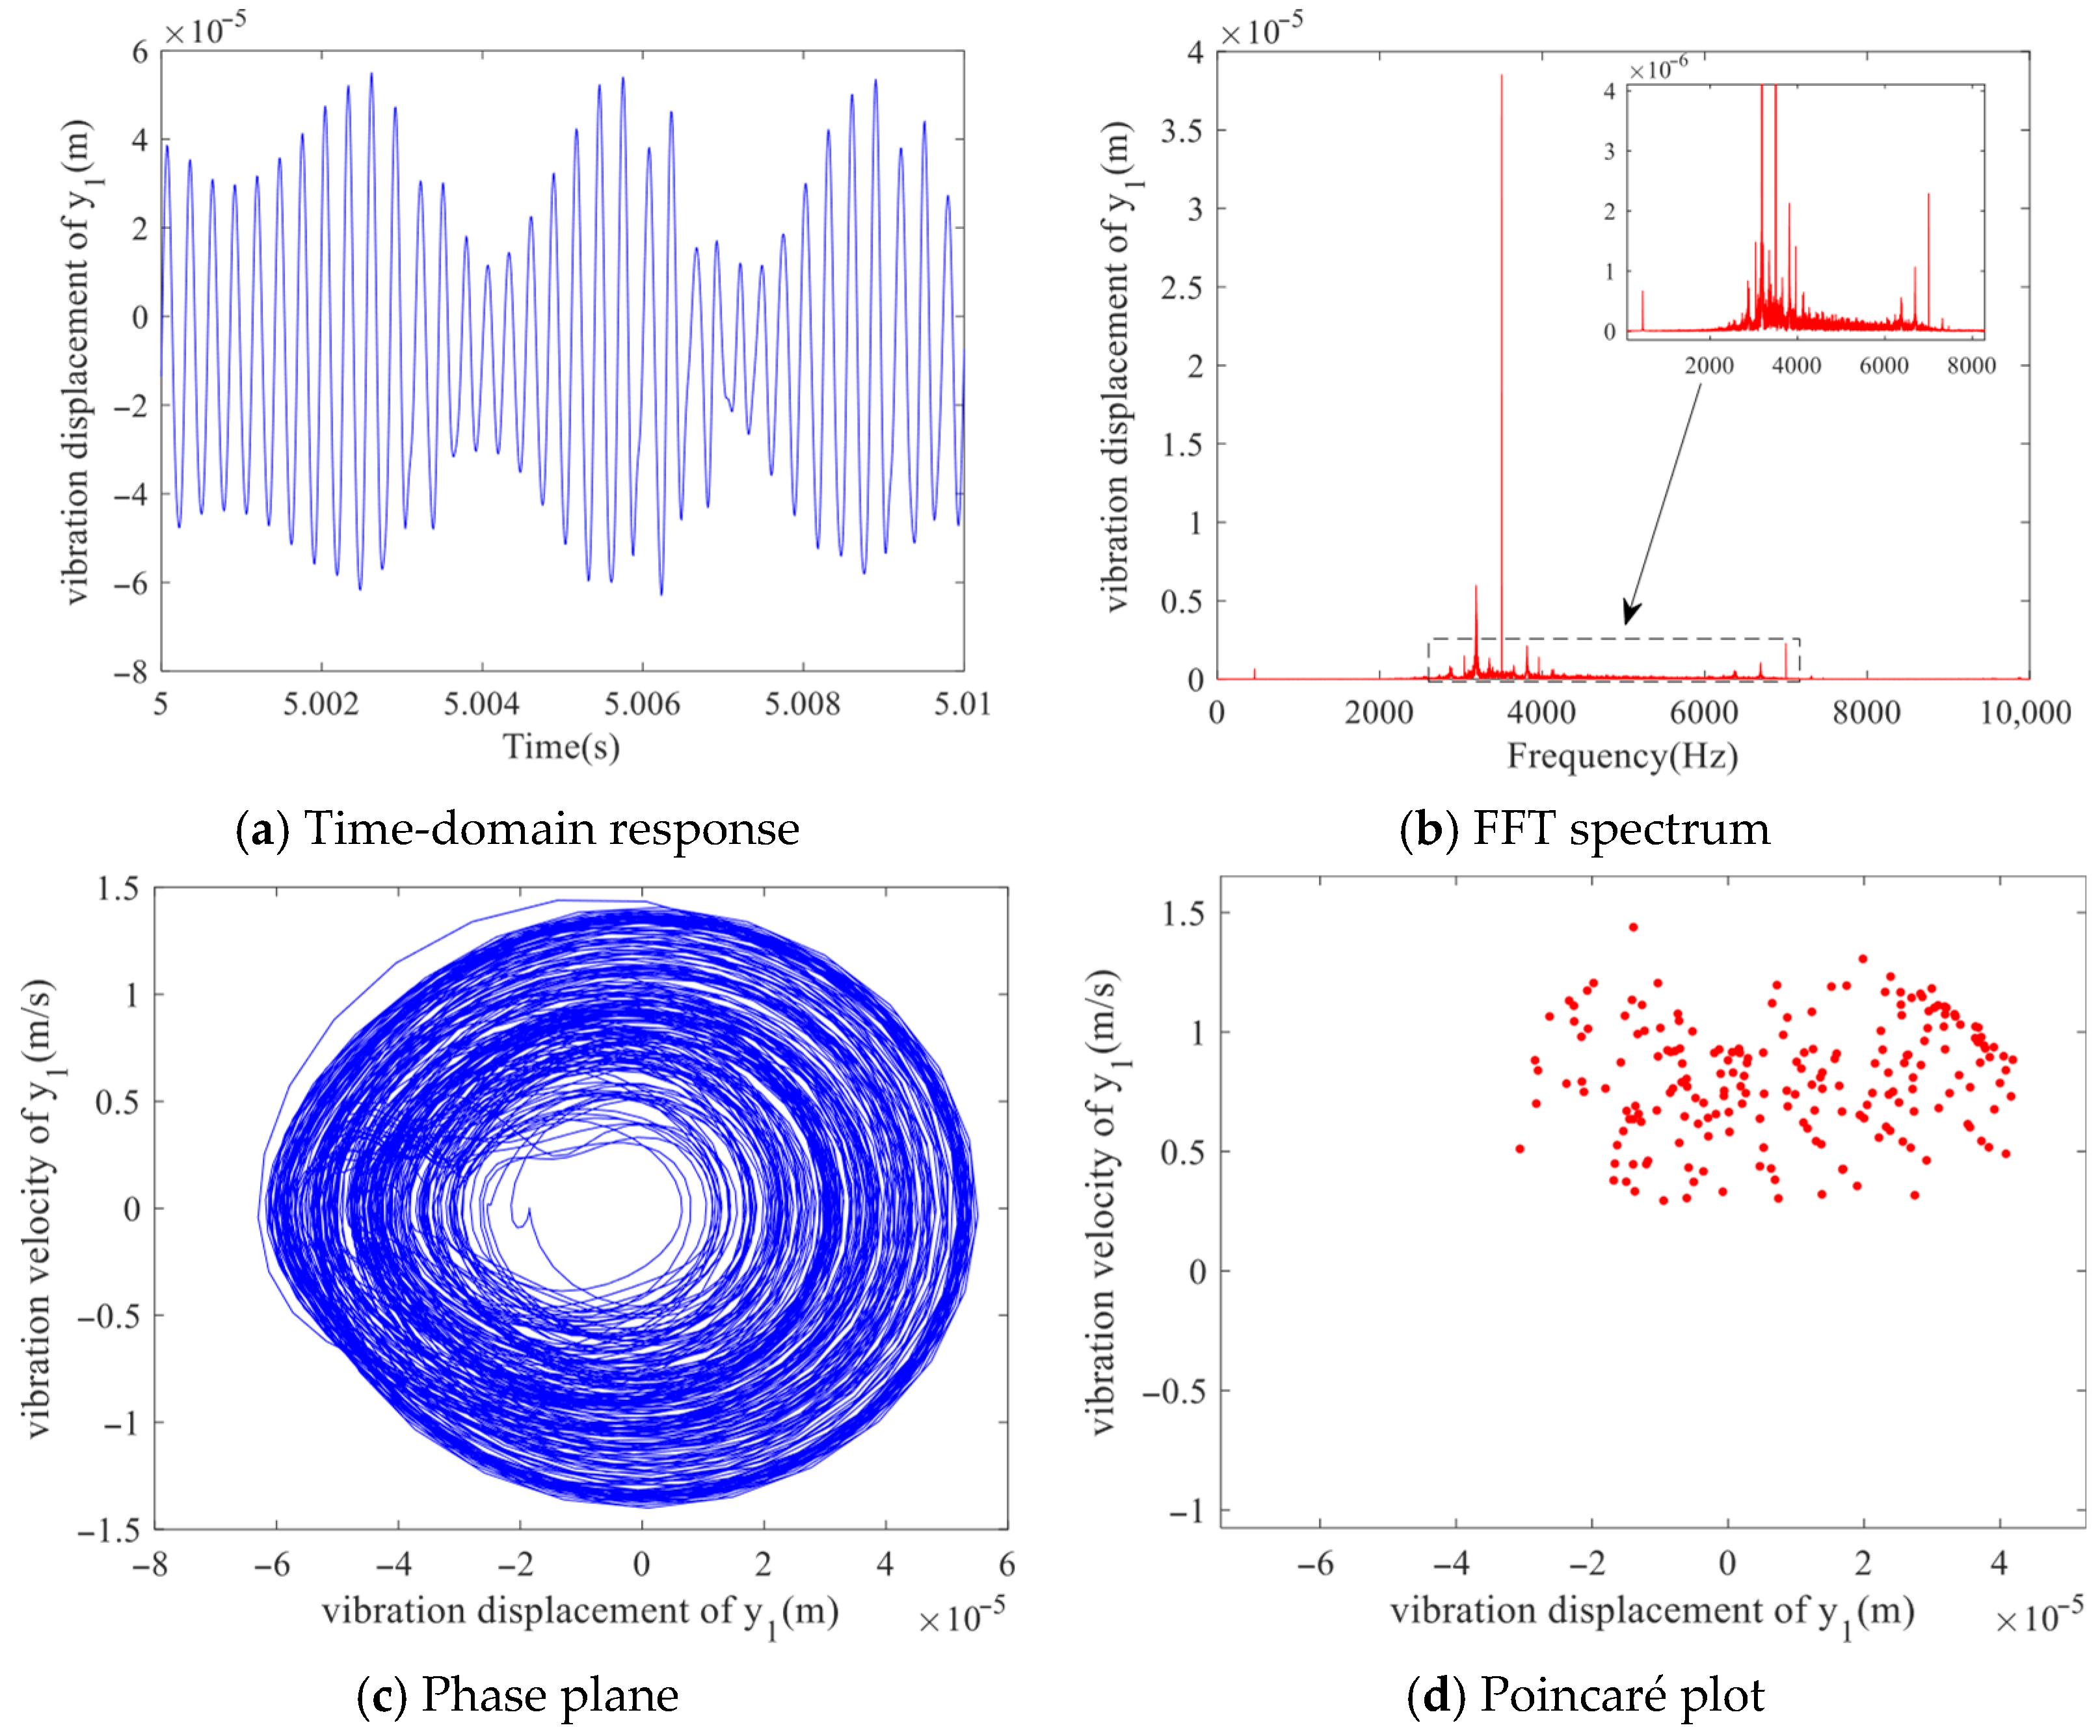
Figure 14, the time-domain response transitions into non-periodic and irregular oscillations. The spectrum displays a continuous multi-peak structure superimposed on a wideband background. The phase portrait shows a non-repetitive and irregular trajectory, and the corresponding Poincaré section appears as scattered and disordered points. These observations suggest that the system exhibits chaotic behavior under this condition.
The above analysis reveals the nonlinear characteristics of the system varying with the amplitude of the error excitation under high-input-speed conditions. The system performs stable single-period motion at relatively small values, but as the amplitude increases, the system enters chaotic motion.
4.4. The Influence of Meshing Damping Ratio on the System
The damping ratio suppresses excessive amplitude increase by consuming vibration energy. For instance, during the gear meshing process, factors such as tooth surface friction and lubricating oil viscosity can form damping forces, which slow down the attenuation rate of gear vibration. When the damping ratio increases, the system’s suppression effect on vibration is enhanced, which helps to reduce noise and wear.
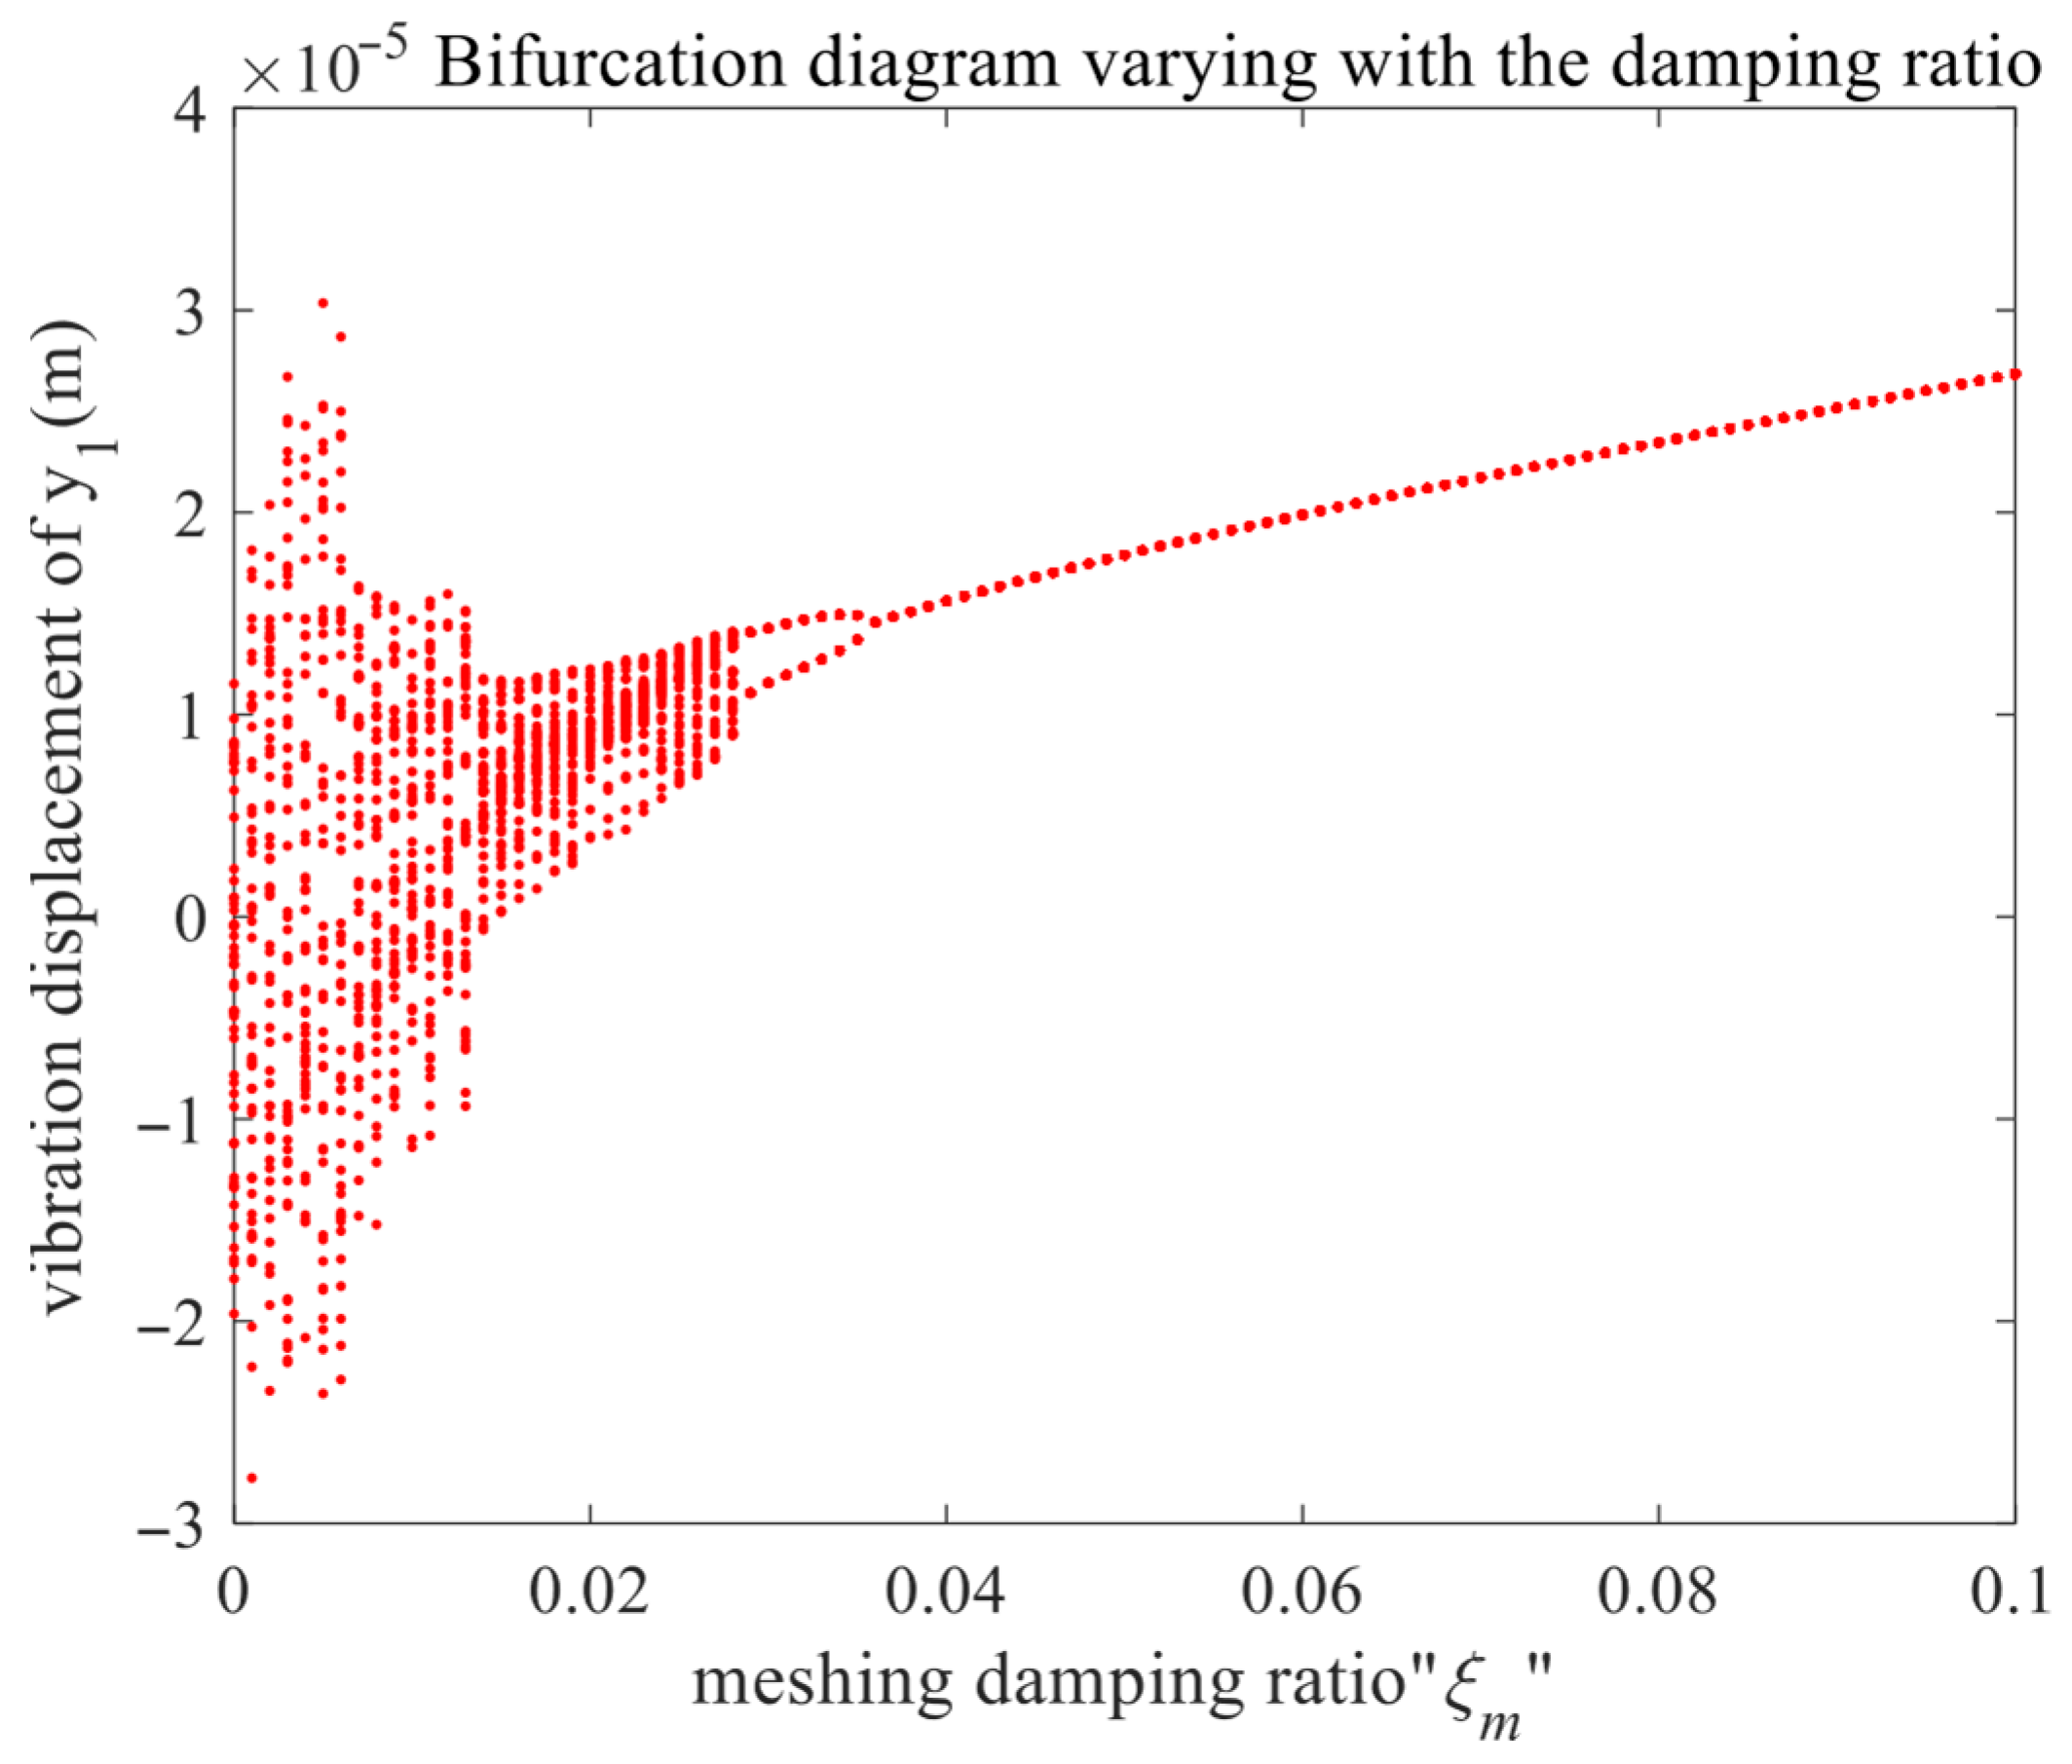
Taking the input speed as 10,000 r/min and the gear backlash and error excitation amplitude as certain values, with the meshing damping ratio
as the bifurcation parameter, the bifurcation diagram of the driving gear in the y direction is drawn as shown in
Figure 15.
As illustrated in
Figure 15, the system exhibits chaotic motion when the damping ratio
< 0.013. When the damping ratio falls within the range
∈ [0.013, 0.028], the bifurcation diagram of the system evolves from discrete points and gradually converges. For
∈ [0.029, 0.036], the bifurcation diagram consists of two distinct single curves. As the damping ratio continues to increase beyond this range, the bifurcation diagram transitions into a single curve. Overall, the variation in the system’s bifurcation diagram with respect to the damping ratio demonstrates an inverse bifurcation pattern.
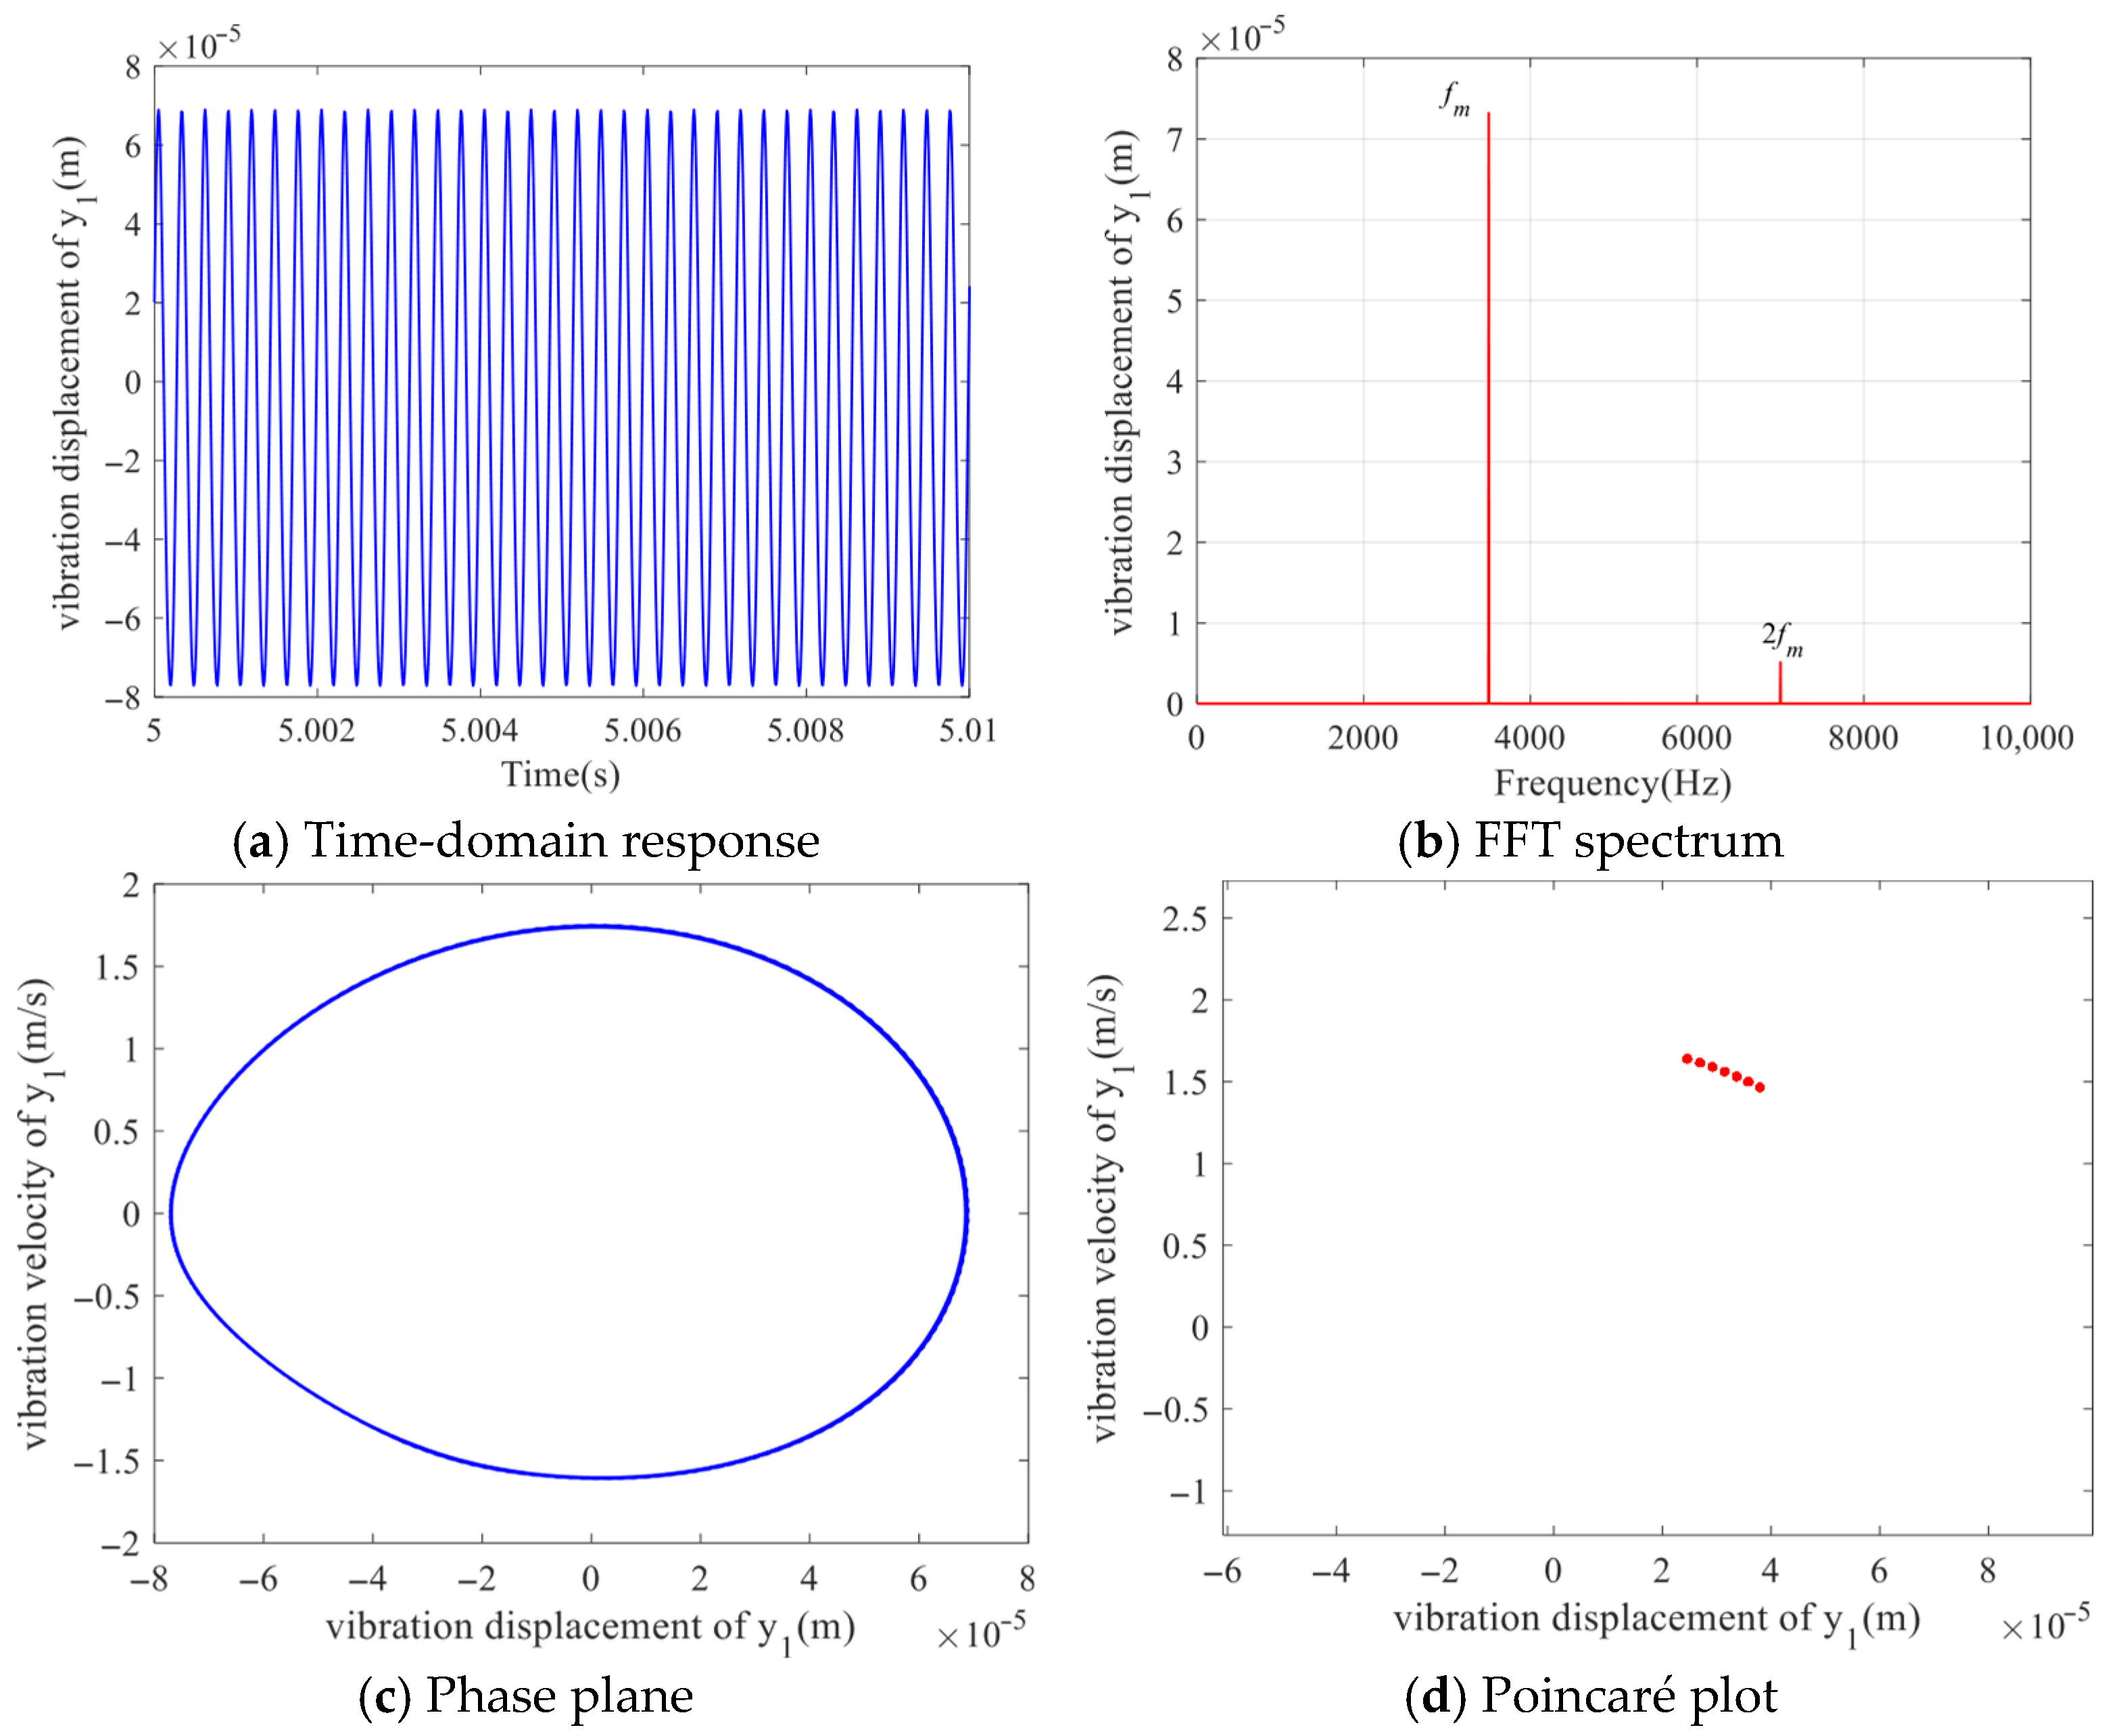
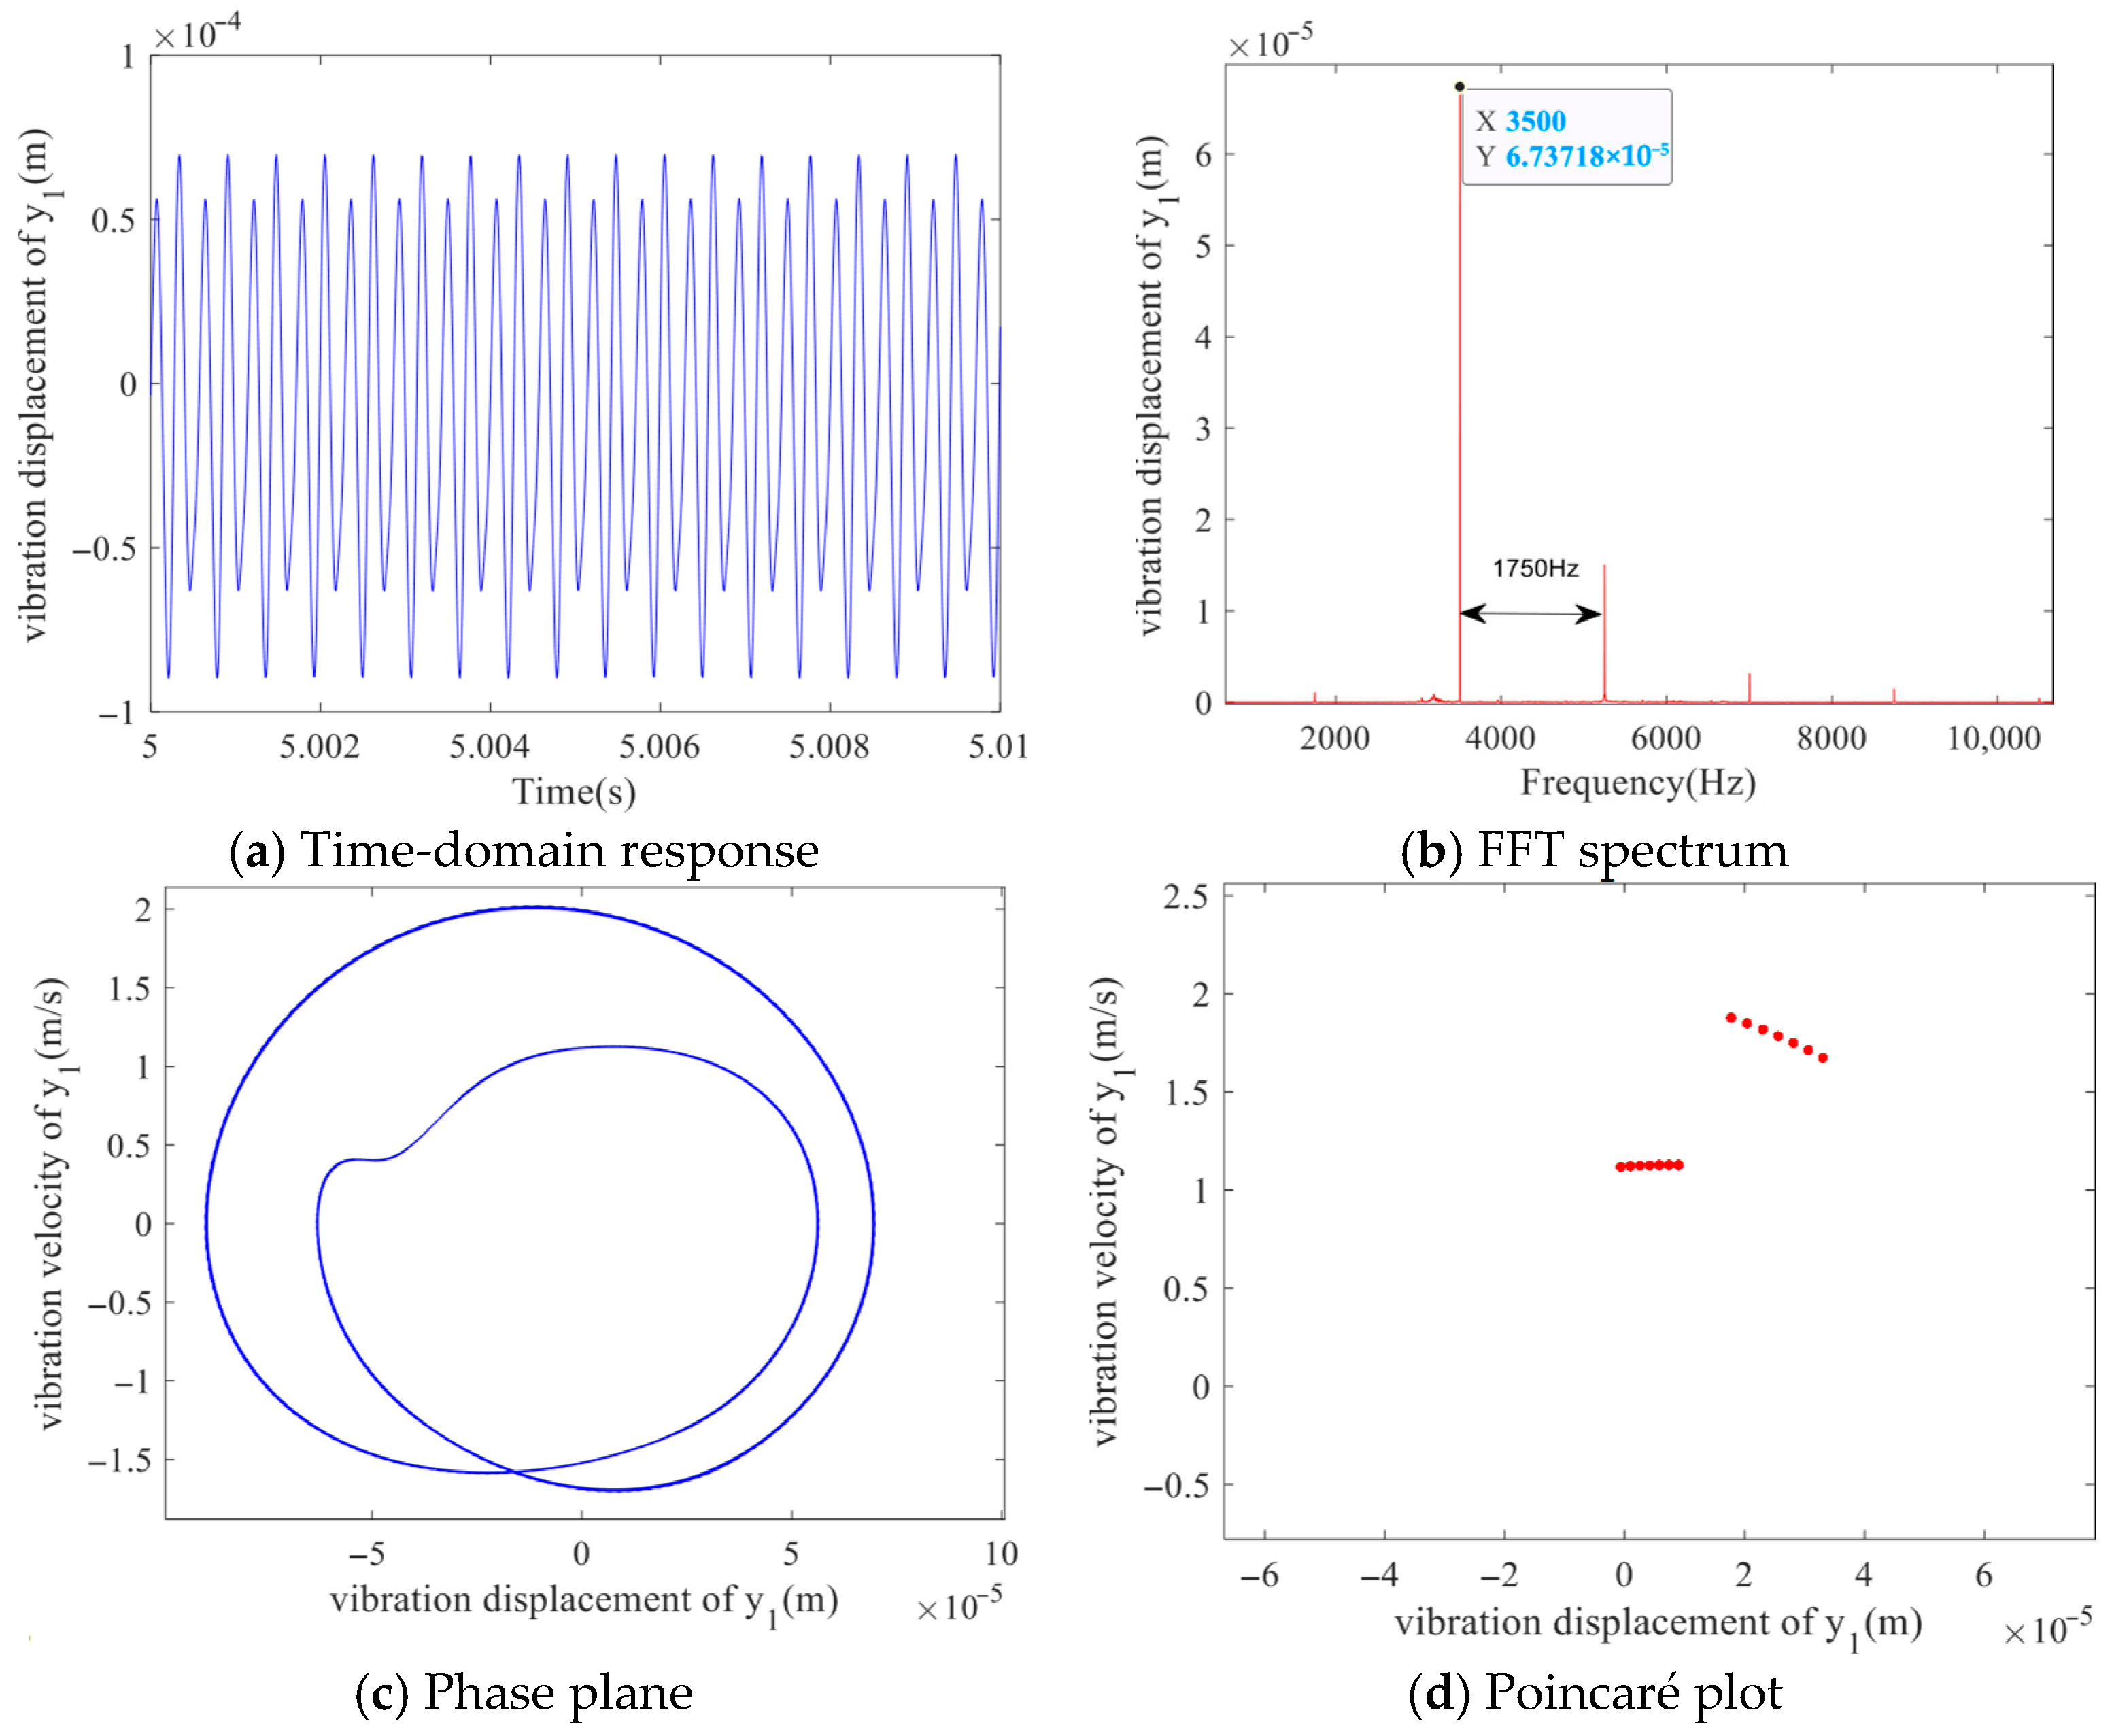
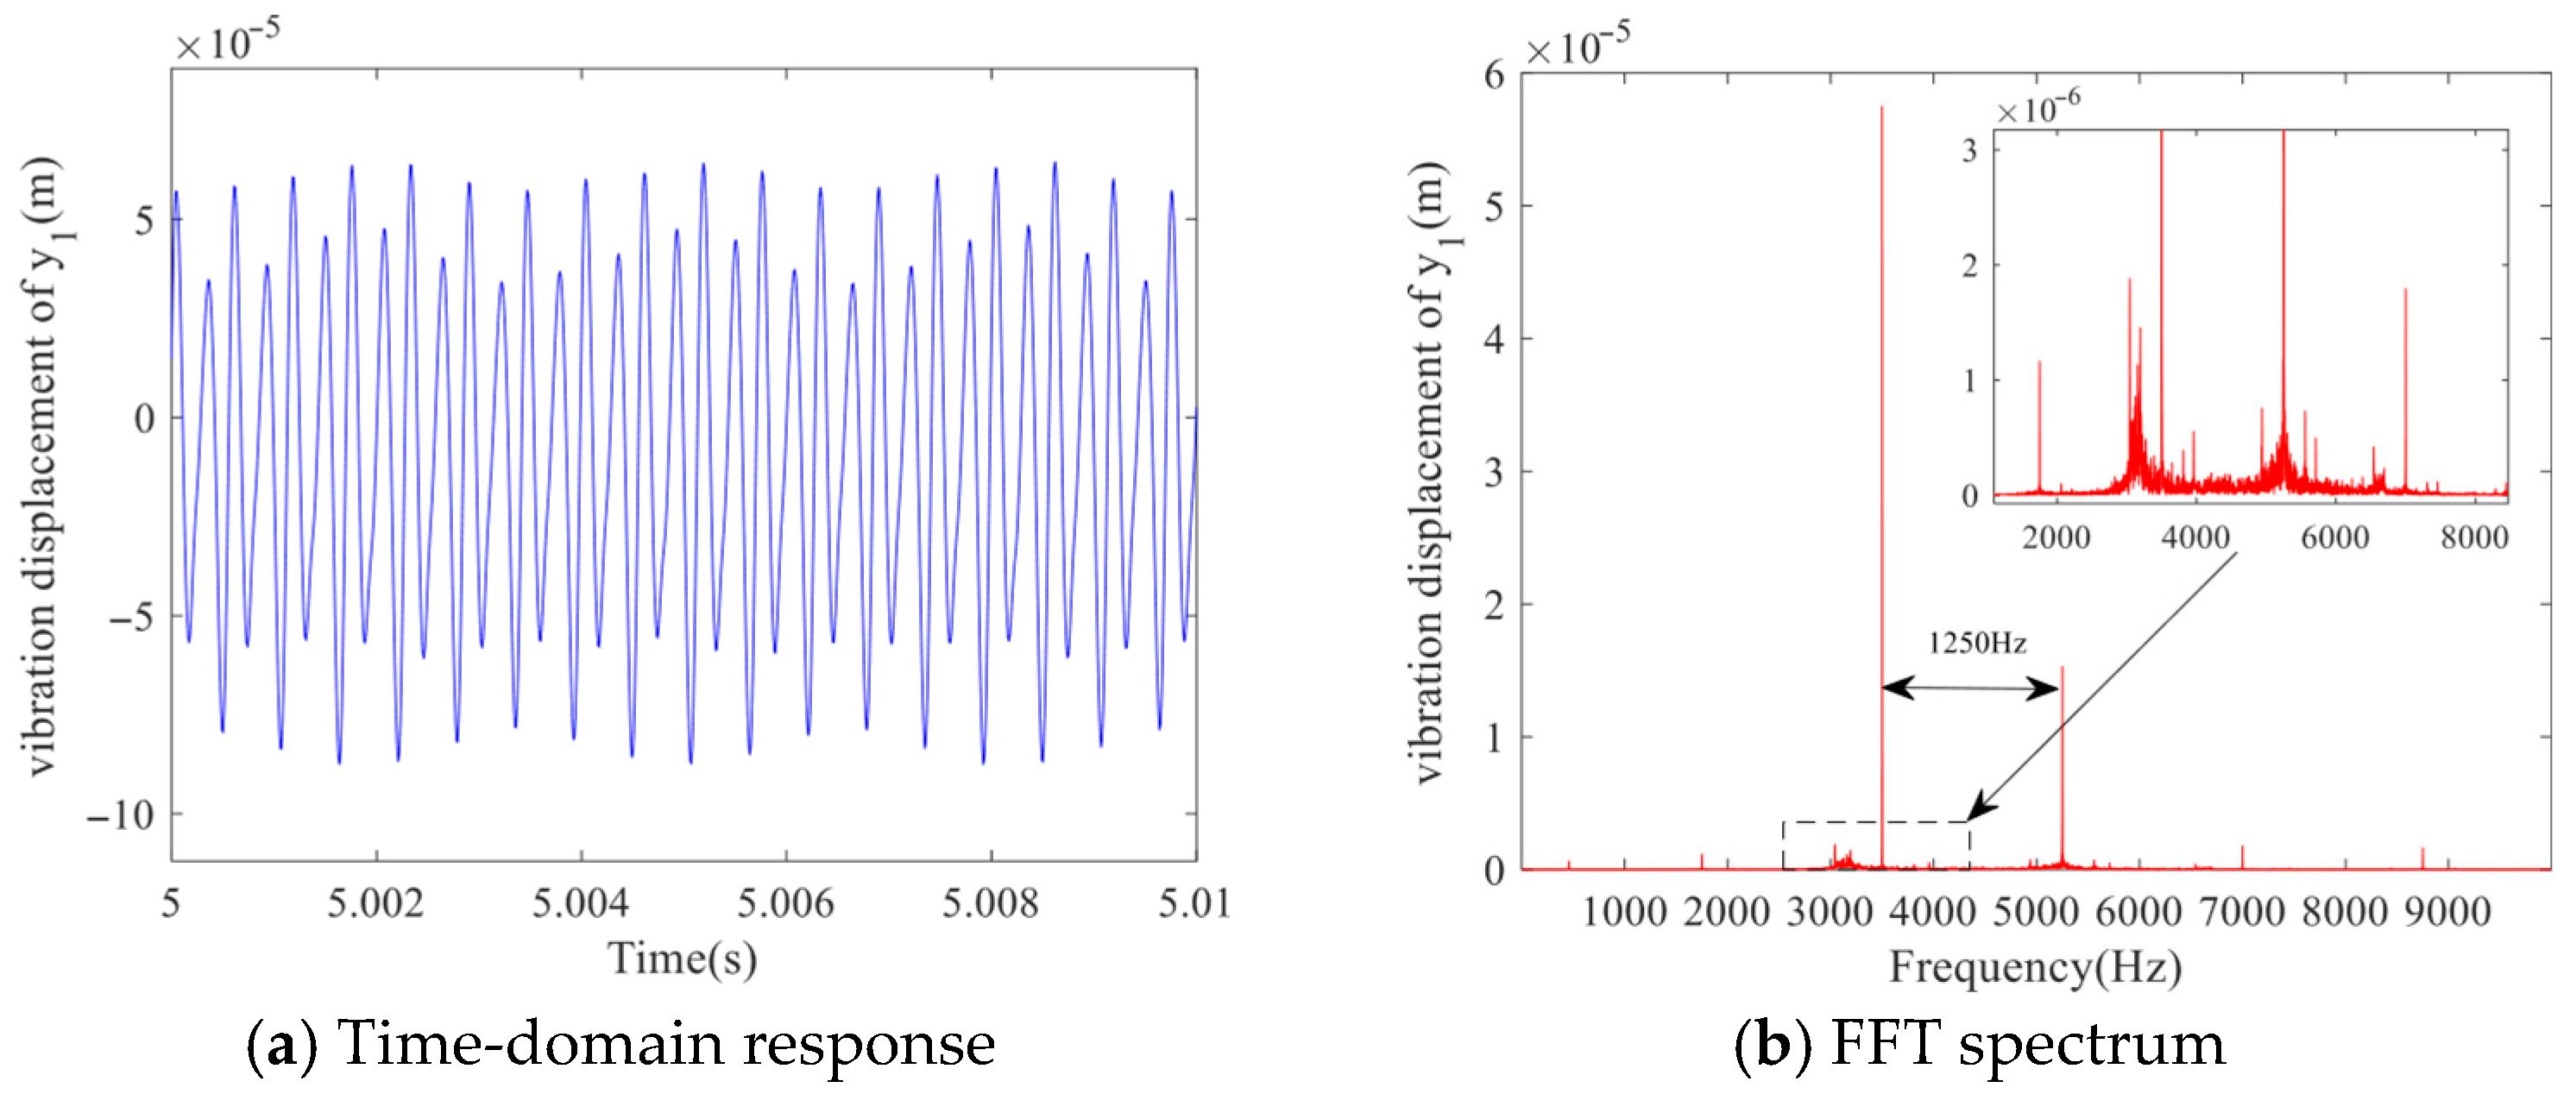
Take the meshing damping ratios of the key nodes as 0.005, 0.02, 0.03, and 0.05, respectively, for specific analysis.
According to the analysis results in
Figure 16, when the meshing damping ratio
= 0.005, it presents a non-periodic irregular waveform. The spectrum is a disordered continuous spectrum on a wideband background, and the phase diagram is an irregular and non-repetitive complex trajectory. The Poincare section shows an unstructured and diffusion-distributed discrete point set, indicating that the system is in a chaotic motion state.
When the meshing damping ratio increases to
= 0.02, as shown in
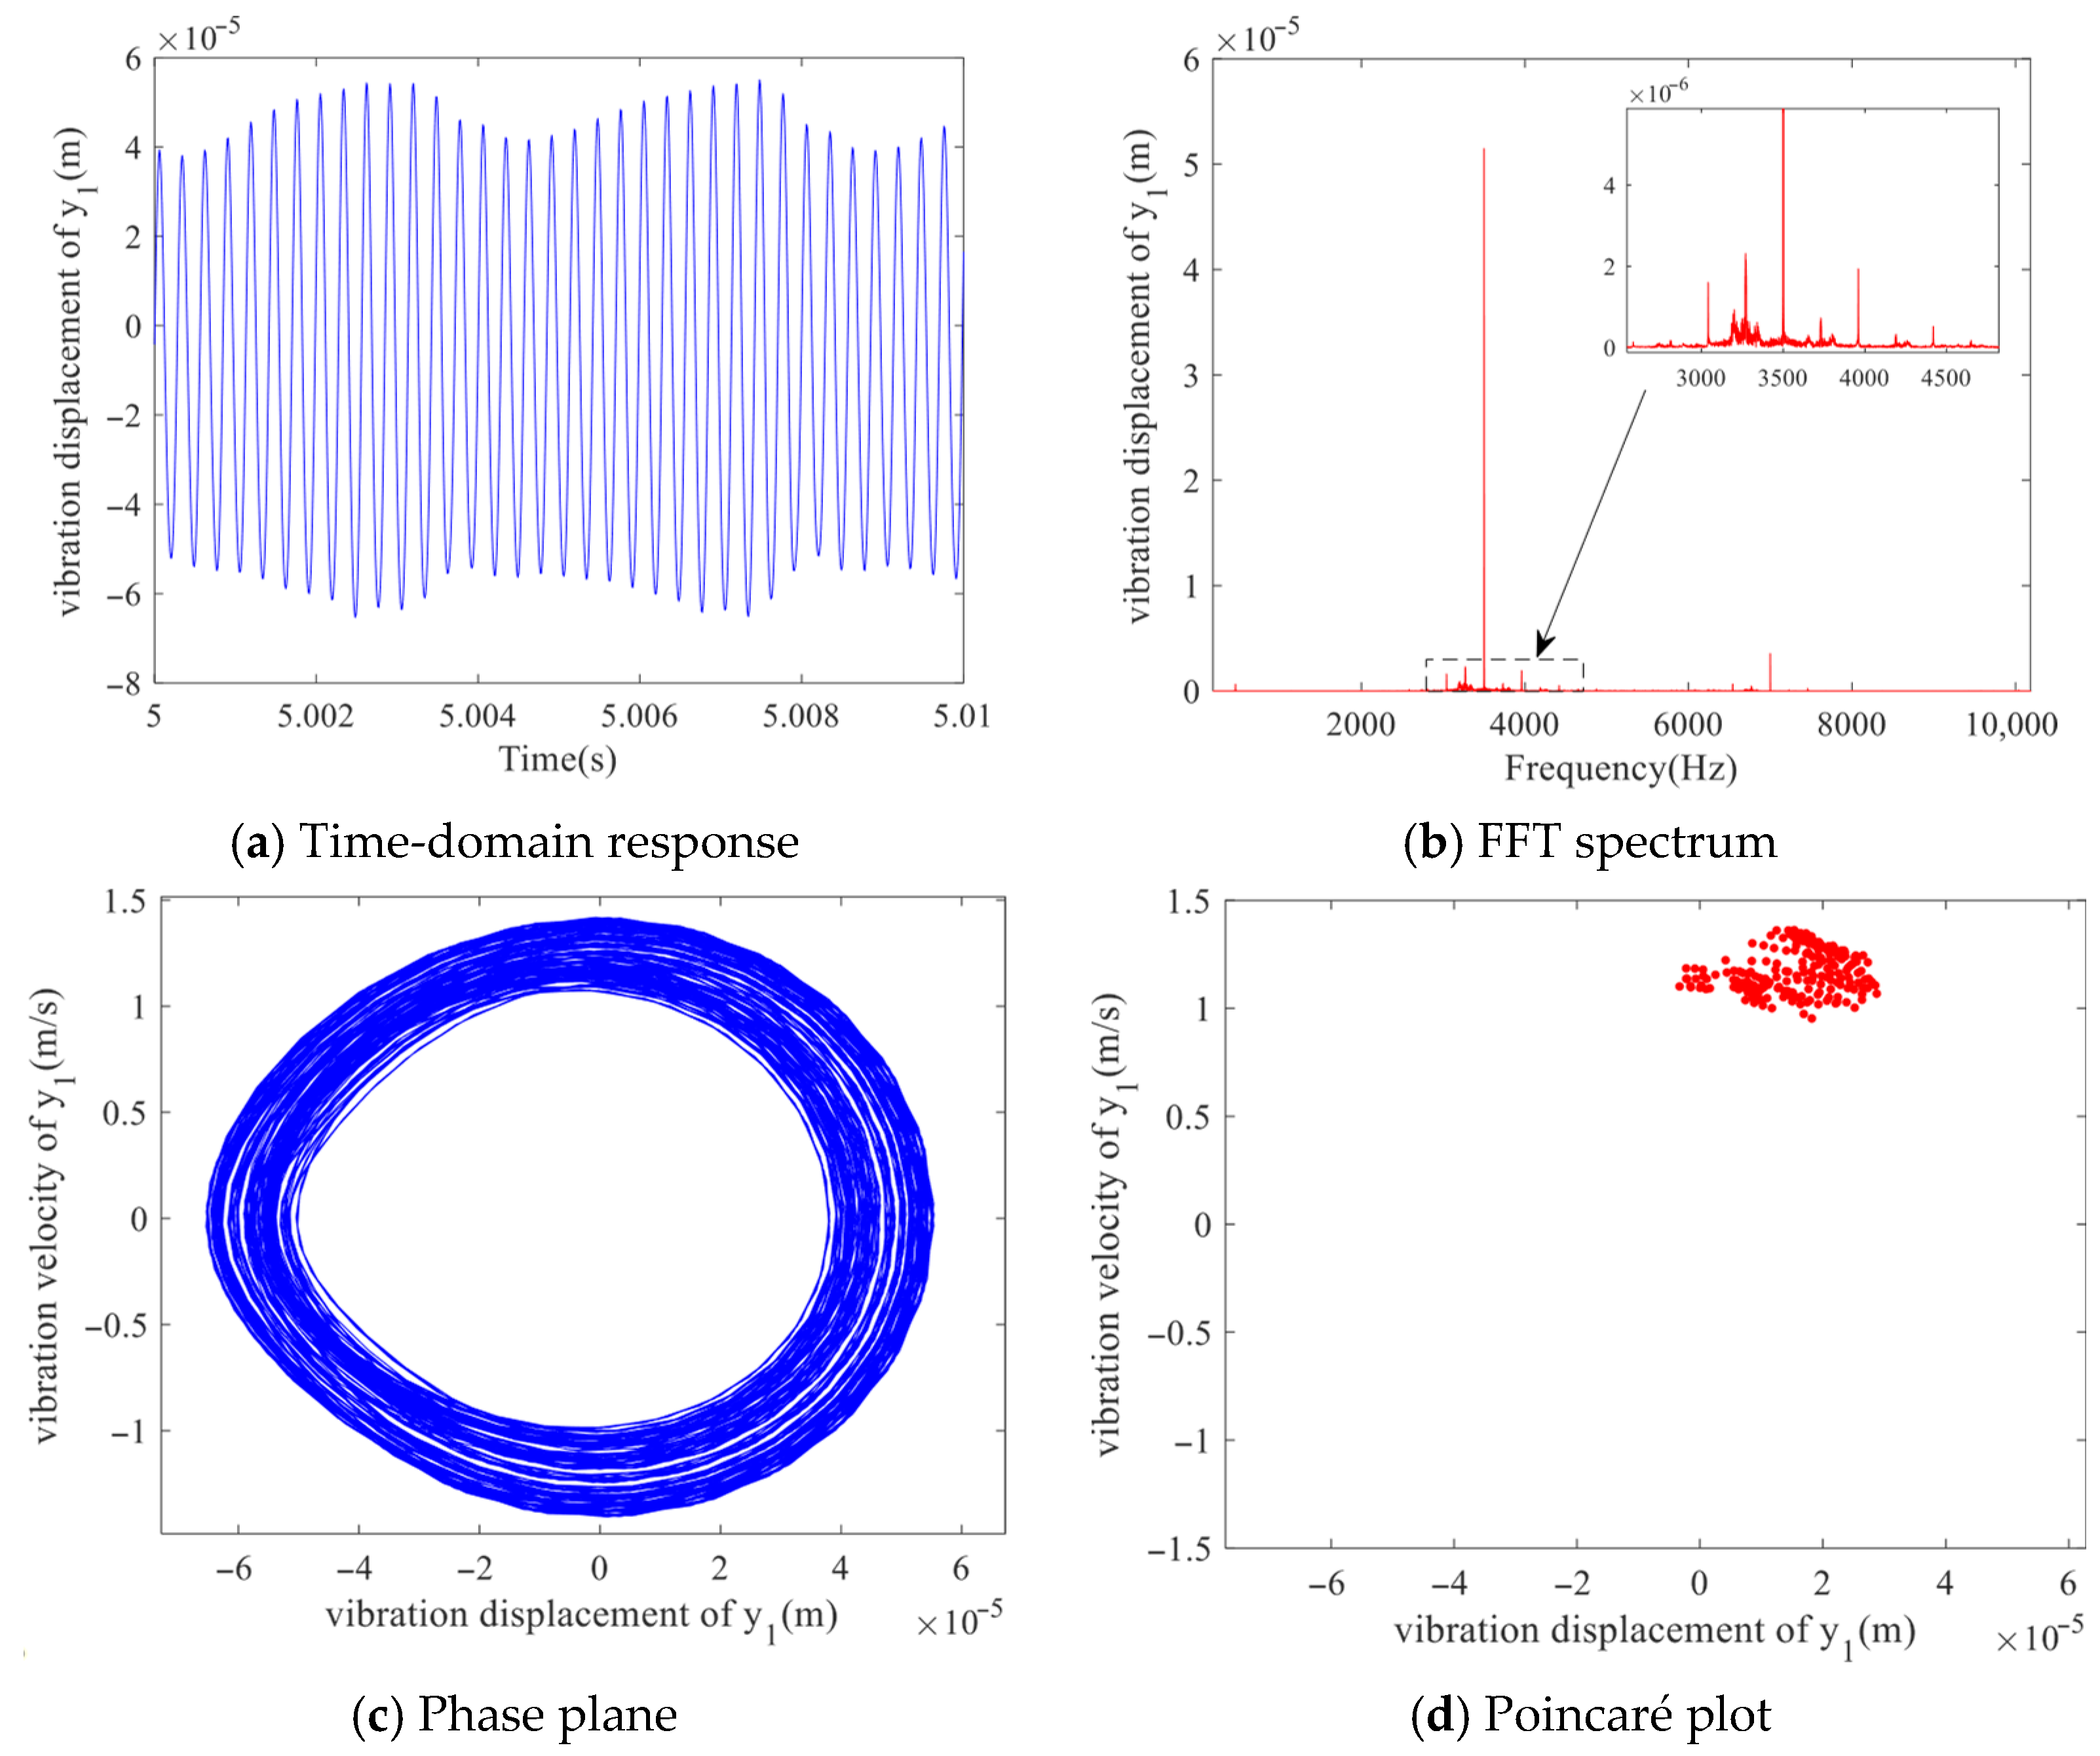
Figure 17, the time-domain response presents a continuous waveform with periodic amplitude variations. The spectrum exhibits a multi-peak structure, and the phase diagram shows a closed loop with densely wound curves. The Poincaré section forms a set of separated clustered points, suggesting that the system is undergoing quasi-periodic motion.
Further increasing the damping ratio to
= 0.03, as shown in
Figure 18, the time-domain response displays a continuous waveform with alternating bimodal amplitudes. The spectrum clearly exhibits a bimodal structure, and the phase diagram reveals two relatively close closed loops. The Poincaré section forms two distinct clustered point sets, indicating that the system has transitioned into a double-period motion.
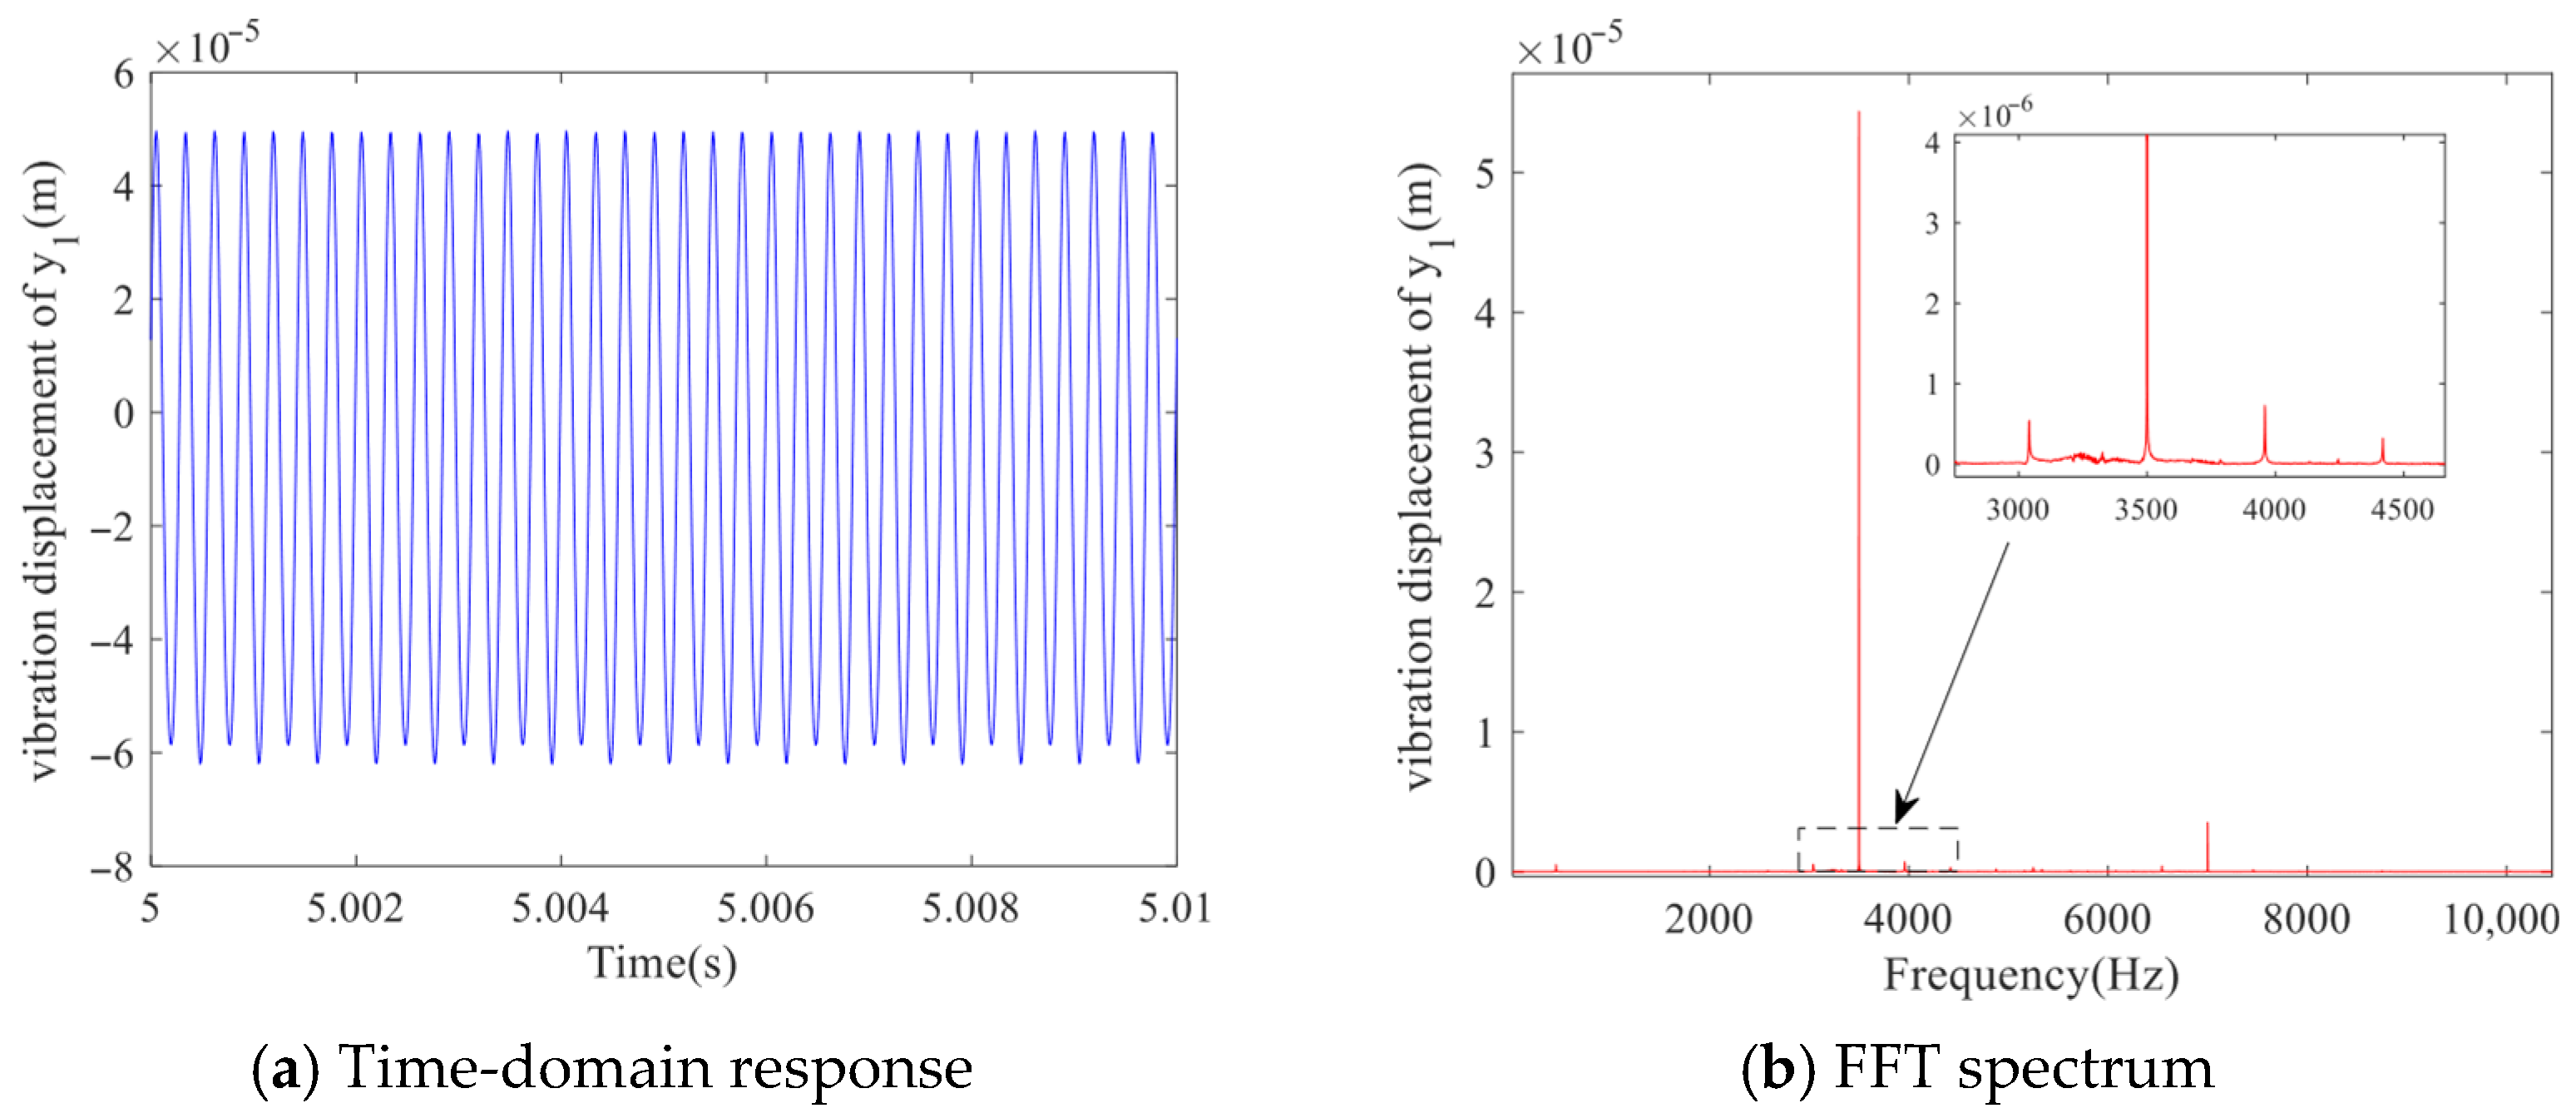
As the meshing damping ratio continues to increase, the system eventually enters a single-cycle motion state, as shown in
Figure 19. which indicates a relatively stable condition.
Based on the above analysis, it can be known that the influence of the damping ratio on the system is different from that of other system parameters. Overall, it shows an inverse bifurcation feature; that is, the system presents chaotic motion at a small damping ratio, while as the damping ratio increases, the system gradually becomes stable. This result is similar to those in the literature [
25]. It can be seen from this that appropriately increasing the damping ratio is conducive to the stability of the system.
5. Discussion
This study focuses on the helical gear pair located in the high-speed stage of a specific pure electric vehicle reducer. A torsional–bending coupled dynamic model of the helical gear pair is established using the lumped parameter method. Based on an improved potential energy approach, the time-varying meshing stiffness of the helical gear pair under conditions is calculated. The dynamic model is then solved using the Runge–Kutta method. Bifurcation diagrams of the system are generated with respect to various parameters, enabling a quantitative analysis of the system’s dynamic response under different operating conditions. The following conclusions are drawn:
- (1)
For the helical gear transmission system used in electric vehicle reducers, the system demonstrates a highly stable single-period motion state within the low-speed range. As the input speed increases, the system experiences abrupt transitions and exhibits pronounced nonlinear behavior along with complex motion state transformations. Therefore, investigating the dynamic characteristics of helical gear systems under high-speed input conditions holds considerable theoretical and practical significance. Such research is of great engineering value in ensuring the operational reliability and performance of high-speed electric drive systems.
- (2)
For healthy helical gear transmission systems, their dynamic behavior exhibits significant dependence on system parameters. When the gear backlash is small, the system remains in a stable single-cycle or double-cycle motion state. However, as the backlash increases, the system undergoes complex bifurcation phenomena, evolving into high-periodic and eventually chaotic motion. Under conditions of low-error excitation amplitude, the system demonstrates stable single-periodic motion. In contrast, an increase in excitation amplitude can significantly induce instability in the motion behavior. The meshing damping ratio plays a critical role in determining system stability. Specifically, when the damping ratio falls below a critical threshold, the system tends to exhibit chaotic motion. Conversely, increasing the damping ratio facilitates the transition from chaotic to quasi-periodic or periodic motion, effectively suppressing nonlinear vibrations and enhancing overall dynamic stability.
The present study concentrates on the nonlinear dynamic behavior of a single-stage helical gear transmission system used in electric vehicle reducers. The findings reveal that system stability is strongly influenced by backlash, meshing error, and damping ratio, and the observed bifurcation and chaos characteristics align well with previously reported results. From a practical engineering viewpoint, the results indicate that minimizing backlash and manufacturing errors, while appropriately increasing the mesh damping ratio, can effectively suppress nonlinear vibration and chaotic motion in high-speed gear systems. These findings provide valuable guidance for gearbox designers in electric vehicles, particularly for improving the stability, noise reduction, and durability of high-speed reducers.
Future work will focus on extending the current model to multi-stage gear trains and incorporating additional factors such as frictional coupling, manufacturing deviations, and load fluctuations. Moreover, optimization studies on key parameters—such as backlash, helix angle, and damping ratio—will be conducted to further enhance the vibration suppression, dynamic stability, and overall transmission performance of high-speed electric drive systems.
