You are currently viewing a new version of our website. To view the old version click .
Mathematics
  • Article
  • Open Access

13 November 2025

Asymptotic Distribution of the Functional Modal Regression Estimator

and
Department of Mathematics, College of Science, King Khalid University, Abha 62223, Saudi Arabia
*
Author to whom correspondence should be addressed.
This article belongs to the Special Issue Advances in Robust and Nonparametric Statistical Techniques for Data Science

Abstract

We propose a novel predictor for functional time series (FTS) based on the robust estimation of the modal regression within a functional statistics framework. The robustness of the estimator is incorporated through the L 1 -estimation of the quantile density. Such consideration improves the precision of conditional mode estimation. A principal theoretical contribution of this work is the establishment of the asymptotic normality of the proposed estimator. This result is of considerable importance, as it provides the foundation for statistical inference, including hypothesis testing and the construction of confidence intervals. Therefore, the obtained asymptotic result enhances the practical usability of the modal regression prediction. On the empirical side, we evaluate the performance of the estimator under various smoothing structures using both simulated and real data. The real data application highlights the ability of the L 1 -conditional mode predictor to perform robust and reliable short-term forecasts, with very high effectiveness in the analysis of economic data.

1. Introduction

Functional time series (FTS) analysis is a subfield of functional data analysis (FDA), motivated by its wide-ranging applicability in various domains such as economics, finance, environmental science, climatology, and the biomedical sciences. The subfield was first popularized by the monograph of [], which developed a linear functional model highlighting the potential utility of the linear modeling of dependent functional data analysis. Alternatively, the general framework of the present contribution is the nonparametric analysis of the functional time series data. We cite, for instance, ref. [] for ergodic-FTS, ref. [] for quasi-associated FTS and [] long-memory-FTS. The main contribution of this work is to create a new method for predicting values from functional data, using a reliable regression technique that fits data dependencies. This approach is less sensitive to outliers and model errors, offering a better understanding of the data’s distribution, especially the volatility of the functional time series.
Functional nonparametric regression was first introduced by []. Extending this pioneer contribution, many significant studies have focused on exploring the connection between functional predictors and scalar outcomes. Prominent works include the formulation of M-regression [], the application of local linear regression methods [], and the creation of functional relative error models []. At this stage, the functional time series analysis based on modal regression has become one of the most relevant topics in nonparametric functional data analysis (NFDA). Often, the kernel estimator of the conditional mode is defined as the maximizer of the conditional density. Ref. [] established the almost complete consistency of the kernel estimator over dependence structure. While [] proved the asymptotic normality of the same estimator under a mixing functional time series framework. Ref. [] investigated the asymptotic properties of the kernel estimator in the context of spatio-functional modal regression. Considering the same model, ref. [] studied ergodic functional time series and established the almost sure consistency of the kernel estimator of the conditional mode, when the response variable is subject to missing-at-random (MAR) mechanisms. As a recent study, ref. [] derived the asymptotic normality of a functional local linear estimator of the conditional mode, obtained via maximization of the conditional density, under functional mixing conditions. We point out that all the previously cited works use the standard conditional density to estimate the modal regression. In this work, we instead employed the conditional quantile density. The main strength of the proposed approach is that it allows us to use the robustness of the quantile function through its L 1 -approximation, which offers more accuracy and stability against outliers. Motivated by this feature, quantile regression has attracted growing attention in nonparametric data analysis. In the functional data analysis, quantile regression has become a central topic of investigation in three different fields of statistics such as parametric, semiparametric and nonparametric frameworks. Specifically, functional linear modeling of conditional quantiles was addressed in [,], which also provides comprehensive reviews of recent methodological advances. Semiparametric approaches were developed in [], whereas nonparametric estimation has been pursued using a functional version of the Nadaraya–Watson (NW) estimator, as proposed by [], who established the Borel–Cantelli property of the resulting estimator. Moreover, ref. [] proved moment integrability for the functional NW estimator. More recent developments in this area can be found in [,], which continue to advance the theoretical foundations and practical applications of functional quantile regression. The integration of conditional mode and quantile regression was first explored in functional data analysis (FDA) by []. In their study, the authors established the pointwise consistency of the robust estimator under the assumption of independent observations. The generalization of this framework to functional time series data (FTSDA) and to ergodic FTSDA, respectively, can be found in [,]. We refer to [] for the robust local linear estimator of the modal regression and its asymptotic results.
In all the previously cited works, the authors have focused on the almost perfect consistency. In this work, we estimate the modal regression by minimizing the derivative of the quantile function and stating its asymptotic distribution. This estimation strategy allows us to enhance the robustness of the modal regression, making it less sensitive to outliers and deviations from model assumptions. It is well known that the proof of the asymptotic normality is considerably more challenging. Specifically, it requires a precise characterization of the bias and variance terms of the estimator. This task becomes more difficult when the estimator is implicitly defined through an L 1 -quantile scoring function and the data arise from a functional time series structure. Moreover, asymptotic normality has significant practical importance. It allows us to derive standard errors, to construct confidence intervals and implement statistical tests using the standard normal distribution. Unlike almost complete convergence, which only ensures that the estimator approaches to the true parameter, asymptotic normality provides essential information about the mean square error and distribution of convergence. This makes it an indispensable tool for statistical inference, model comparison and data-driven analysis based on finite samples. Recall that in functional time series analysis, the strong mixing assumption is important because it describes how the dependence between observations decreases over time. It provides a flexible framework for modeling real-world problems in various fields, such as economic, environmental or biomedical time series, where observations are correlated but gradually lose memory of the past. Such considerations are crucial for both theoretical analysis and practical applications of functional time series methods. Such advantages of our contribution have been illustrated using simulated and real data examples. Specifically, we assess the accuracy and robustness of our predictor in comparison with competitive predictors, considering both single-point predictions and region-based predictive tasks. These evaluations highlight the superior performance and practical applicability of our approach compared to the existing methods.
The paper is structured as follows. In the next section, we introduce the proposed model. Section 2 presents the main theoretical results. The algorithm used to construct confidence intervals using the derived asymptotic normality is discussed in Section 3. Section 4 illustrates the practical applicability of the estimator through analyses of both simulated and real datasets. Concluding remarks are provided in Section 5, while the technical proofs are presented in Section 6.

2. Functional Frame Work and Mathematical Support

Let { ( X 1 , Y 1 ) , , ( X n , Y n ) } be a stationary sequence of random vectors with the same distribution as given random couple ( X , Y ) , which takes values in F × R . Here, F is a separable metric space with a metric d. The relationship between the functional structure of X and its probability distribution is characterized by the concentration property:
P ( X B ( x , r ) ) = ζ x ( r ) > 0 , and ζ x ( r ) 0 as r 0 ,
where B ( x , r ) = { u F : d ( u , x ) < r } . This is a standard condition in nonparametric functional data analysis, and ζ x ( · ) can be defined explicitly for many continuous processes (see []). Additionally, for the asymptotic normality result, we require a second assumption on the regular variation of the function ζ x :
s [ 0 , 1 ] , lim r 0 ζ x ( s r ) / ζ x ( r ) = β x ( s ) .
The function β x ( · ) plays an important role in establishing the asymptotic normality result, as it allows the variance term to be expressed explicitly. This function can be specified in various situations (see [] for some examples).
Regarding the nonparametric feature of the model, we assume the conditional cumulative distribution function (CCDF) F ( · | x ) is strictly increasing and has a continuous density f ( · | x ) with respect to the Lebesgue measure on R . Furthermore, we assume a Lipschitz condition on the conditional distribution:
For all ( x 1 , x 2 ) N x , | F ( t | x 1 ) F ( t | x 2 ) | C d b ( x 1 , x 2 ) for some b > 0 ,
where N x is a neighborhood of a fixed curve x F .
Recall that the conditional mode of Y given X = x , denoted C M o d ( x ) , is defined as the value that maximizes the conditional density f ( y | x ) over a given compact set S R . The conditional mode offers a robust and informative summary of the conditional distribution, which is particularly useful for prediction when the data are asymmetric or heavy-tailed. To enhance this robustness, we express the conditional mode in terms of the conditional quantile function C Q u ( p | x ) :
C M o d ( x ) = C Q u ( p C M o d | x ) , where p C M o d = arg min p [ a x , b x ] p C Q u ( p | x ) .
Here, [ a x , b x ] = f 1 ( S | x ) and the second derivative with respect to p such that
inf p ( 0 , 1 ) 2 p 2 C Q u ( p | x ) > 0 .
This relationship can be derived from a simple analytical argument (see []). Consequently, a robust estimator of C M o d ( x ) can be constructed from an L 1 -estimator of the conditional quantile:
C Q u ^ ( p | x ) = arg min A R i = 1 n L p ( Y i A ) K d ( x , X i ) f n ,
where L p ( y ) = y ( p 1 { y < 0 } ) is the quantile loss function, f n is a bandwidth sequence and K is a continuously differentiable, decreasing kernel function supported on [ 0 , 1 ] .
Under this framework, the robust conditional mode estimator is as follows:
C M o d ^ ( x ) = C Q u ^ ( p ^ C M o d | x ) , where p ^ C M o d = arg min p [ a x , b x ] C Q u ^ ( p | x ) .
The estimator C Q u ^ ( p | x ) of the quantile derivative is defined by the following:
C Q u ^ ( p | x ) = C Q u ^ ( p + b n | x ) C Q u ^ ( p b n | x ) 2 b n ,
where b n is a positive bandwidth sequence.
The theoretical foundation of our approach is established by deriving the asymptotic normality of C M o d ^ ( x ) and its rate of convergence under dependence conditions. To our knowledge, this is the first work to establish the asymptotic distribution for a robust modal regression estimator within a functional time series framework.
This framework models dependence through a strong mixing condition. The sequence is assumed to be stationary and strong mixing with coefficient as follows:
F T S ( n ) = sup A , B P ( A B ) P ( A ) P ( B ) 0 ,
where the supremum is taken over all A F 1 k (the σ -algebra generated by { ( X 1 , Y 1 ) , , ( X k , Y k ) } ) and B F k + n . (the σ -algebra generated by { ( X k + n , Y k + n ) , ( X k + n + 1 , Y k + n + 1 ) , } ).
Recall that this mixing property includes many standard models, such as ARCH and GARCH processes, under general ergodicity conditions (see, e.g., [,,]). For the required asymptotic property, we assume that the sequence { ( X i , Y i ) } i N satisfies the following:
a > 3 , c > 0 : n N , F T S ( n ) c n a ,
and
i j , 0 < sup i j P ( X i , X j ) B ( x , r ) × B ( x , r ) C 1 ζ x ( r ) ( a + 1 ) / a .
The main asymptotic result of this work is given by the following theorem.
Theorem 1.
Under assumptions (1)–(7), and if n b n 2 f n 2 b ζ x ( f n ) 0 as n . Moreover, suppose that
η > 0 s u c h t h a t n 3 a a + 1 + η ζ x ( f n ) w i t h a > 3 .
Then, the following asymptotic normality holds:
n b n 2 ζ x ( f n ) σ 2 ( x ) 1 / 2 C M o d ^ ( x ) C M o d ( x ) D N ( 0 , 1 ) a s n ,
where
σ 2 ( x ) = C Q u p x ( 3 ) ( x ) a 2 ( x ) C Q u p x ( 1 ) ( x ) a 1 2 ( x ) ,
with
a j ( x ) = K j ( 1 ) 0 1 ( K j ) ( s ) β x ( s ) d s , f o r j = 1 , 2 ,
and D denotes the convergence in distribution.
Remark 1.
It is clear that the new estimator improves the asymptotic variance of the normality asymptotic of the standard estimator obtained by maximizing the conditional density. The latter has an asymptotic variance σ 2 ( x ) n b n 3 ζ x ( f n ) 1 / 2 (see []) against σ 2 ( x ) n b n 2 ζ x ( f n ) 1 / 2 for the new estimator. We point out that condition (8) is a technical assumption used to ensure the applicability of Liebscher asymptotic normality [].

3. Application to Confidence Interval Prediction

The construction of confidence intervals represents an important application of asymptotic normality results. This is obtained through a plug-in estimator for the asymptotic standard deviation σ ( x ) . Specifically, the required estimator is constructed using C Q u ^ ( 3 ) ( p ^ C M o d | x ) and C Q u ^ ( p ^ C M o d | x ) as estimators for C Q u p C M o d ( 3 ) ( x ) and C Q u p C M o d ( 1 ) ( x ) , respectively, implying that the computational estimator of σ ( x ) is
σ ^ ( x ) : = C Q u ^ ( 3 ) ( p ^ C M o d | x ) a ^ 2 ( x ) C Q u ^ ( p ^ C M o d | x ) a ^ 1 2 ( x ) 1 / 2 .
where
a ^ 1 ( x ) = 1 n ζ x ( f n ) i = 1 n K i and a ^ 2 ( x ) = 1 n ζ x ( f n ) i = 1 n K i 2 ,
with K i = K d ( x , X i ) f n as the kernel weight. This estimated standard deviation is then used to build an approximate ( 1 ζ ) confidence interval for θ x :
C M o d ^ ( x ) ± t 1 ζ / 2 × σ ^ 2 ( x ) n b n 2 ζ x ( f n ) 1 / 2 ,
where t 1 ζ / 2 is the ( 1 ζ / 2 ) -quantile of the standard normal distribution.

4. Empirical Analysis

4.1. A Simulation Study

As is common in theoretical work, a principal objective of this empirical study is to evaluate the performance of the proposed estimator under different components of the theoretical part. Clearly, the structural elements of the present contribution are as follows: The functional data dependence, the robustness of the estimation method and the nonparametric specification of the functional model. This empirical analysis is performed using the R-programming software (version 4.4.1). Specifically, we simulate a dependent functional time series using a Functional Autoregressive process of order one (FAR(1)). The data-generating process is defined by the following:
X i = Ψ ( X i 1 ) + ε i ,
where Ψ is a linear operator defined by a kernel function ψ ( · , · ) , and ε i is a functional white noise process. Formally, the value of the functional observation at a point t is given by the following:
X i ( t ) = 0 1 ψ ( t , s ) X i 1 ( s ) d s + ε i ( t ) .
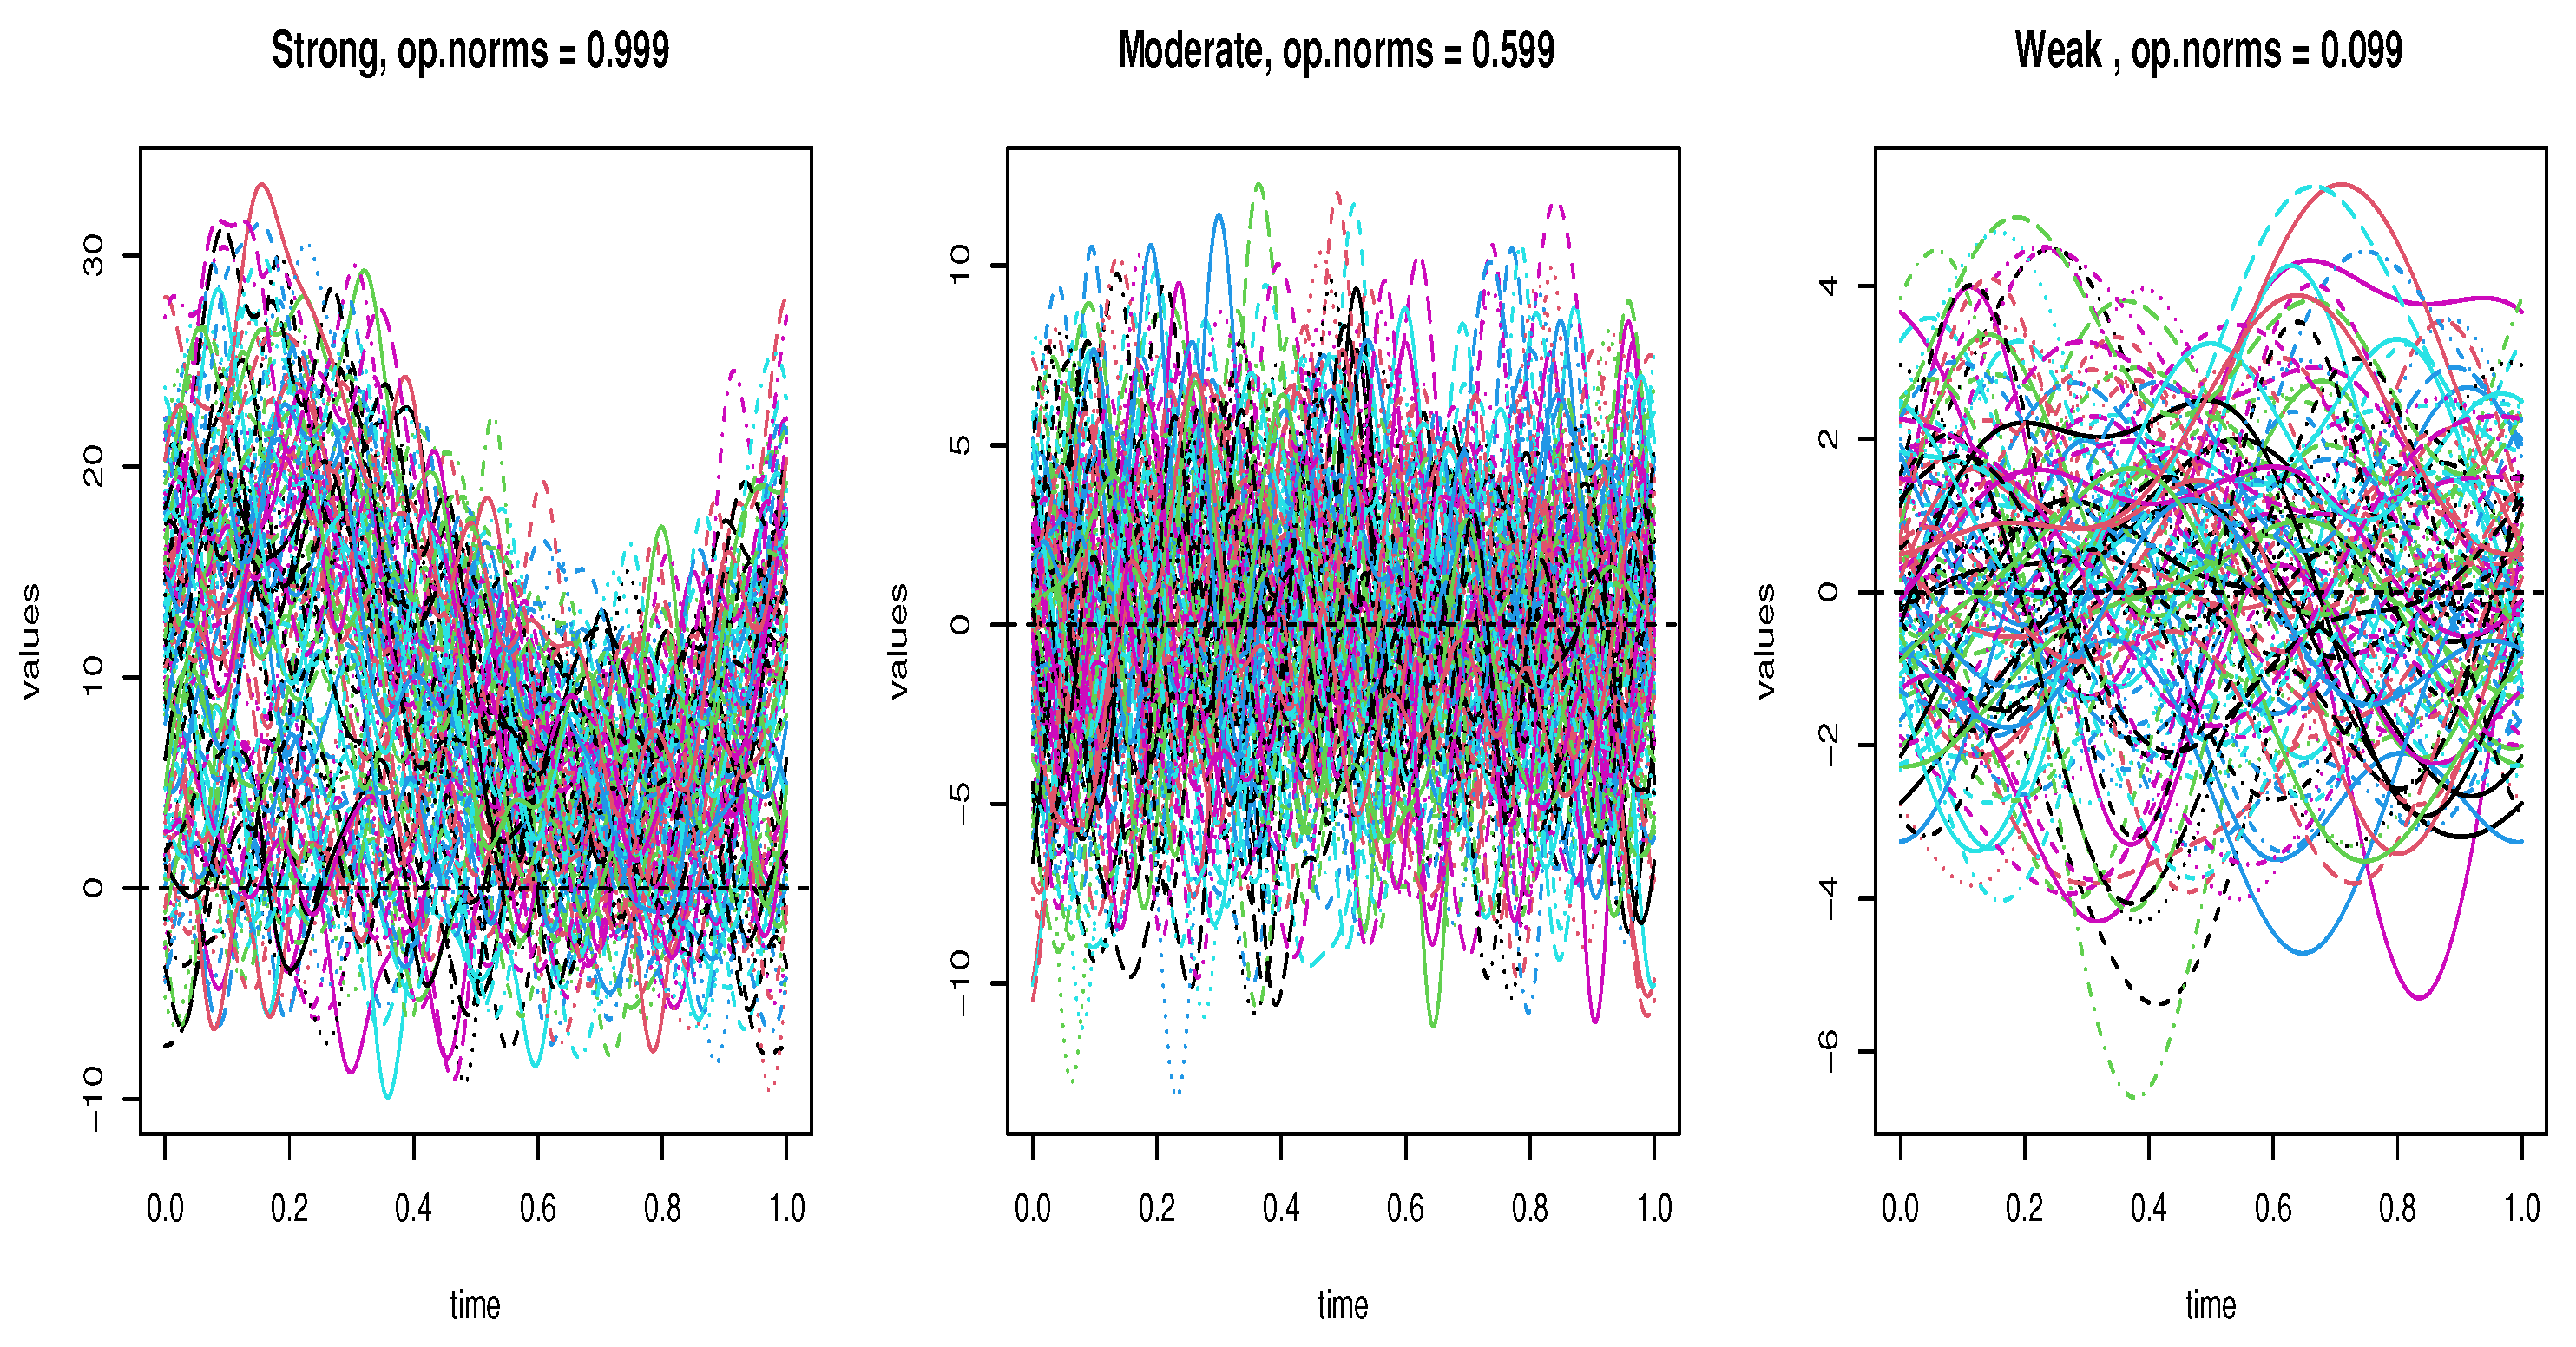
The operator Ψ is defined theoretically using a set of Fourier basis functions { F j } j = 1 d . Its value is characterized by the matrix ( ψ i j ) i j , where each coefficient is given by ψ i j = Ψ ( F i ) , F j , which controls the dependence structure of the system. In practice, we implement this operator using the routine fts.rar. The latter generates an autoregressive functional time series data with an argument called op.norms. This argument plays an important role in determining the level of dependence between functional observations. Specifically, the strength of the dependence is controlled by the function op.norms, which is a normalizing parameter for the Hilbert–Schmidt norm of the kernel operator Ψ . Consequently, a larger value of op.norms induces a stronger dependency, whereas a smaller value results in a weaker dependency. For illustration, we present a sample of functional variables generated under various values of op.norms (see Figure 1).
Figure 1. A sample f 100 curves from different cases, displayed in different colors.
To evaluate the impact of the functional dependence structure within our analysis, we consider three distinct levels of correlation: strong, moderate and weak. Specifically, we assign the value op.norms = 0.99 to represent strong dependence, while medium and weak dependence are modeled using op.norms values of 0.59 and 0.09, respectively. Now, to assess the performance of the robust modal regression estimator, we consider several simulation scenarios designed to examine its behavior under different conditions. These include homoscedastic versus heteroscedastic distributions, symmetric versus asymmetric distributions and heavy-tailed versus light-tailed error distributions. The data of six different situations are generated by the following regression relationship.
  • Homoscedastic Model:
    Y i = r ( X i ) + ϵ i , r ( z ) = exp 2 z 1 + z 2 d t , ϵ i N ( 0 , 0.5 ) i = 1 , , 150 .
  • Heteroscedastic Model:
    Y i = r ( X i ) + σ ( X i ) ϵ i , σ 2 ( z ) = sin 1 + z 2 π , i = 1 , , 150 .
  • Symmetric Model:
    Y i = r ( X i ) + ϵ 1 i , ϵ 1 i N ( 0 , 1 ) , i = 1 , , 150 .
  • Asymmetric Model:
    Y i = r ( X i ) + ϵ 2 i , ϵ 2 i L o g N o r m a l ( 0 , 1 ) , i = 1 , , 150 .
  • Heavy-tailed Model:
    Y i = r ( X i ) + ε 1 i , ε 2 i F r e c h e t ( 2 , 1 , 0 ) , i = 1 , , 150 .
  • Light-tailed Model:
    Y i = r ( X i ) + ε 2 i , ε 2 i G u m b e l ( 1 , 1 ) , i = 1 , , 150 .
Next, we generate 100 independent samples for each case and for each sample, we compute the empirical values of the asymptotic variance following the normalized statistic: σ ^ 2 ( x 0 ) for an arbitrary conditioning curve x 0 = X i 0 . Then we deduce m-independent values of
N T ( x 0 ) = n b n 2 ζ x 0 ( f n ) σ ^ 2 ( x 0 ) 1 / 2 C M o d ^ ( x 0 ) C M o d ( x 0 ) ,
We have employed the B-spline metric and simulate using a quadratic kernel supported on ( 1 , 1 ) . Furthermore, the performance of the estimator depends heavily on the appropriate selection of the smoothing parameter ( f n , b n ) . In this work we have used the cross-validation based on the mean squared error (MSE), defined as follows:
MSE ( C M o d ) = 1 n i = 1 n Y i C M o d ^ ( X i ) 2 ,
The optimal parameters are then chosen as follows:
( f opt , b opt ) = arg min f n , b n H n MSE ( C M o d ) .
Here, H n is the set of positive real numbers f n such that the ball centered at F with radius f n contains exactly k neighbors of x 0 . The value of k is typically selected from the set { 5 , 10 , 20 , , 0.5 n } . Although applying this cross-validation approach to high-dimensional functional data requires intensive numerical smoothing and optimization, its effectiveness is well established, as demonstrated by its large use in nonparametric functional data analysis (see [] for a detailed discussion of its flexibility).
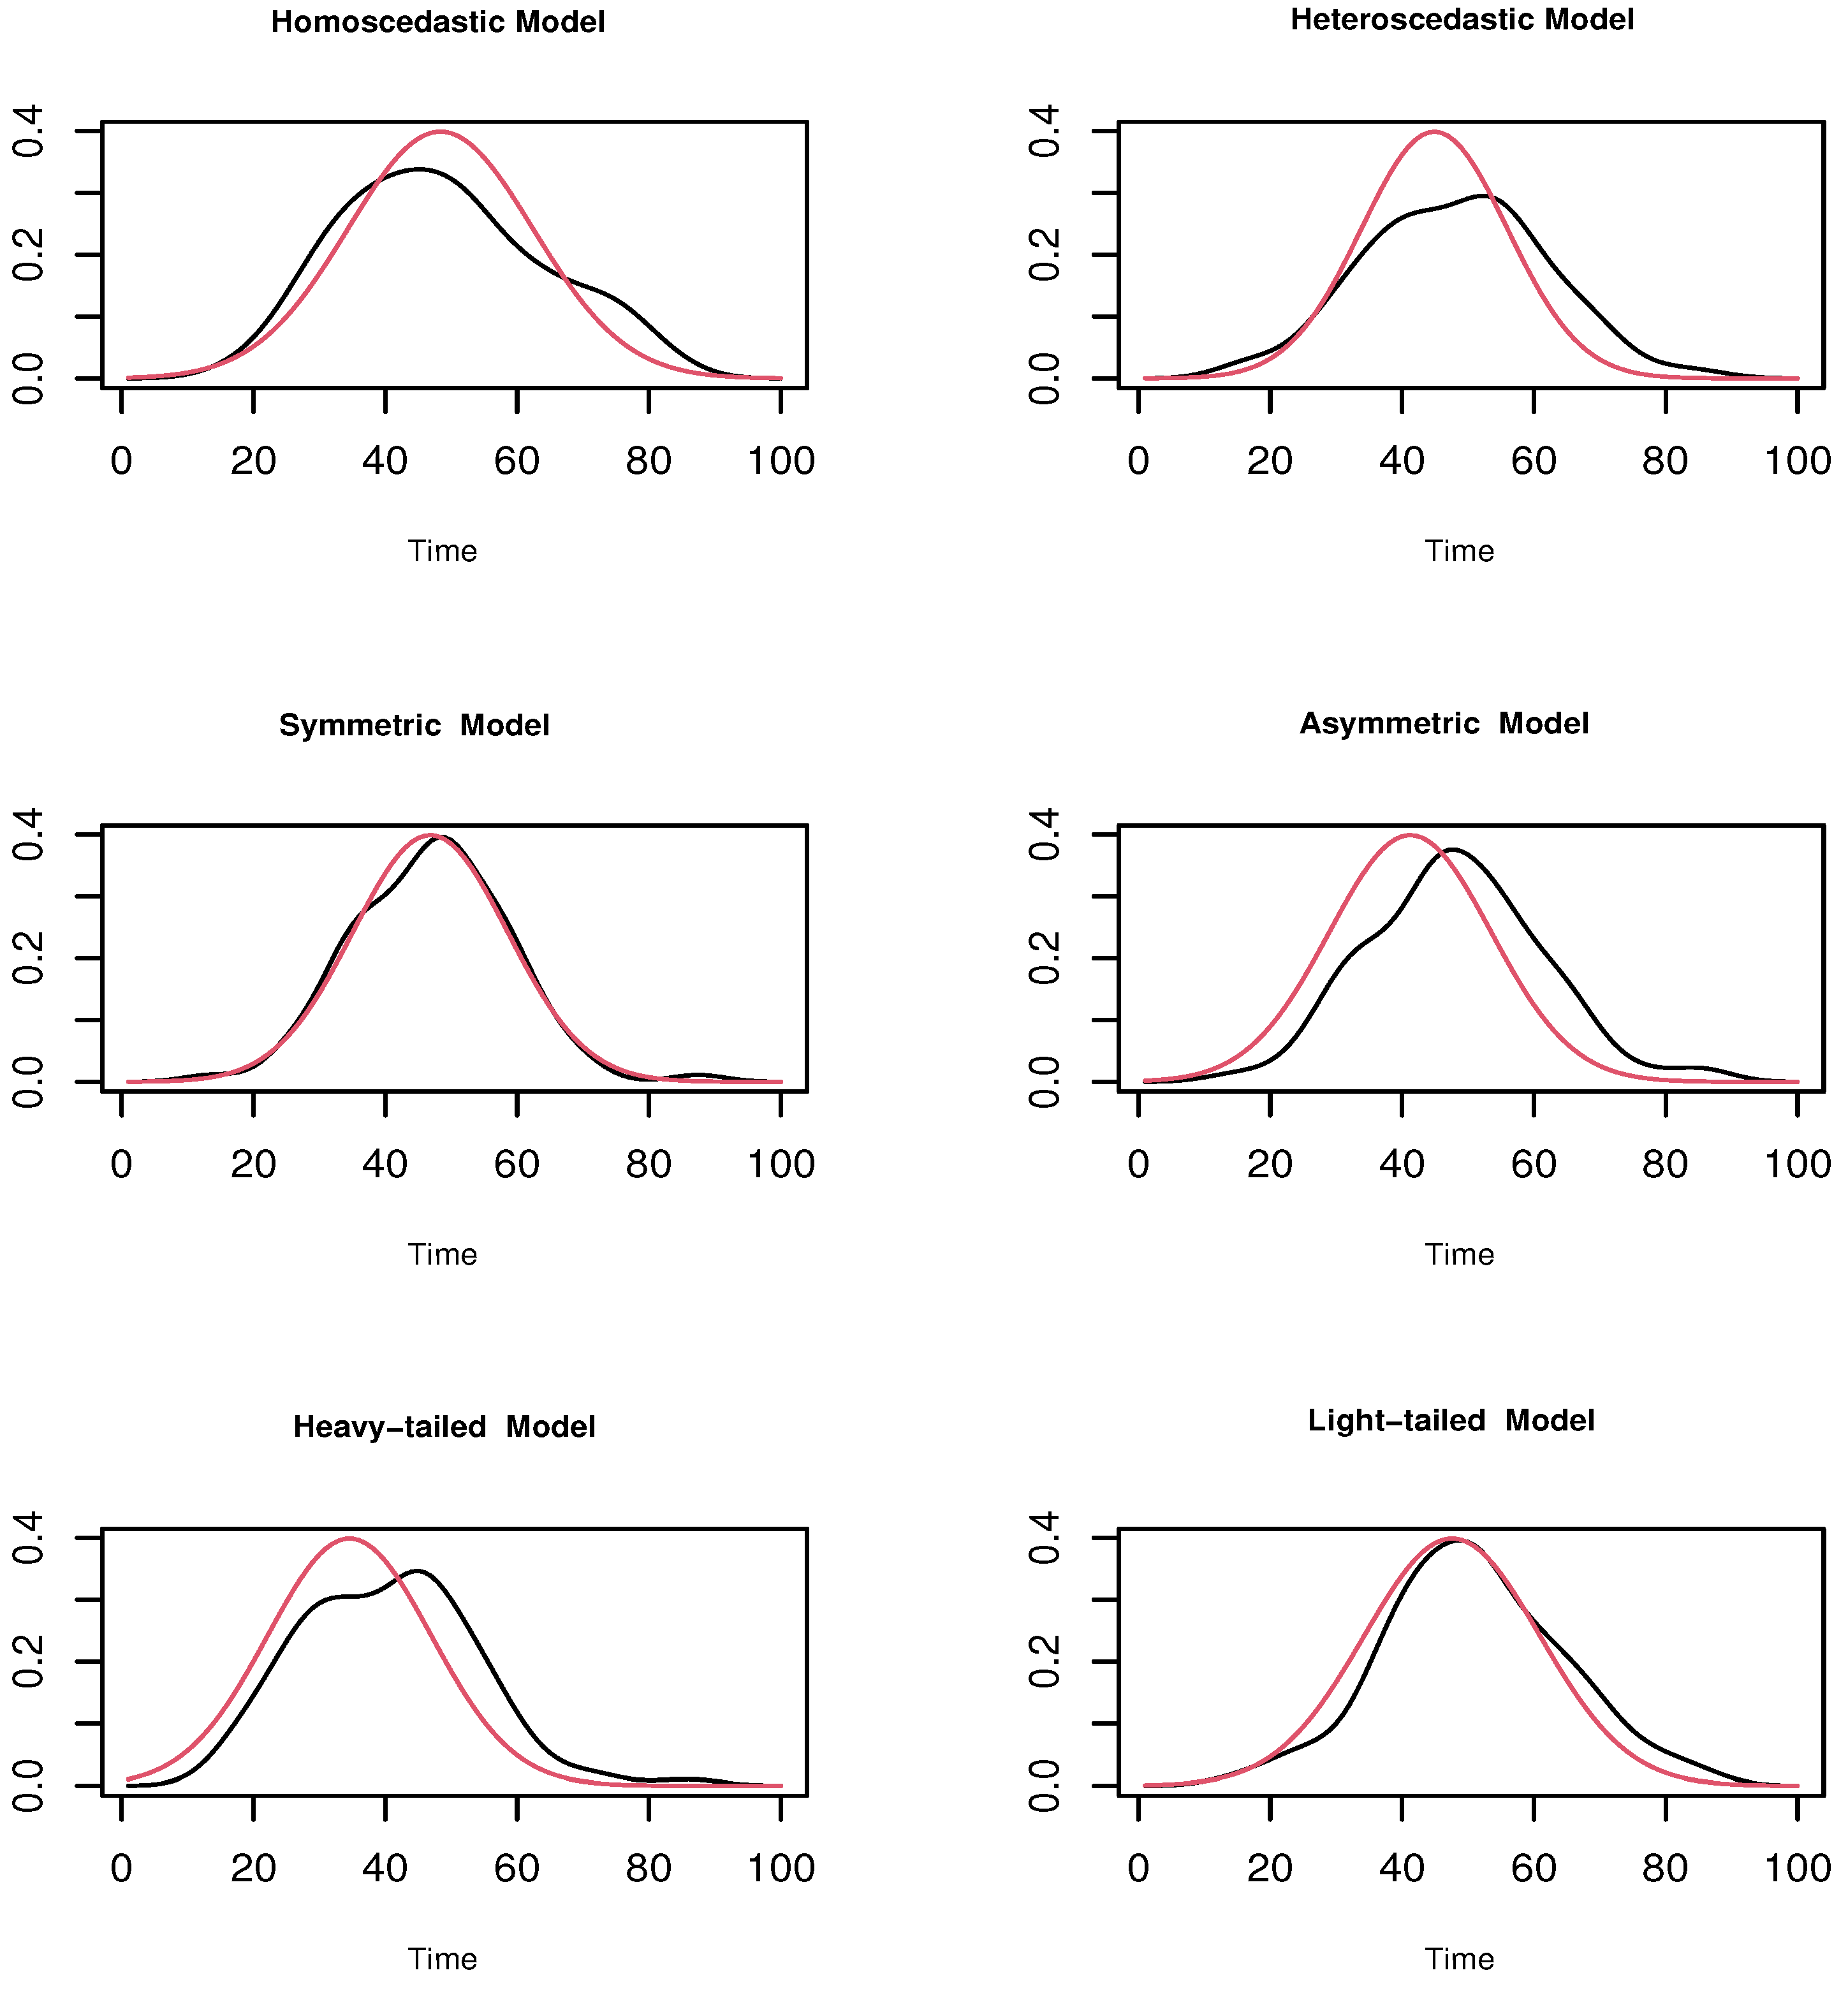
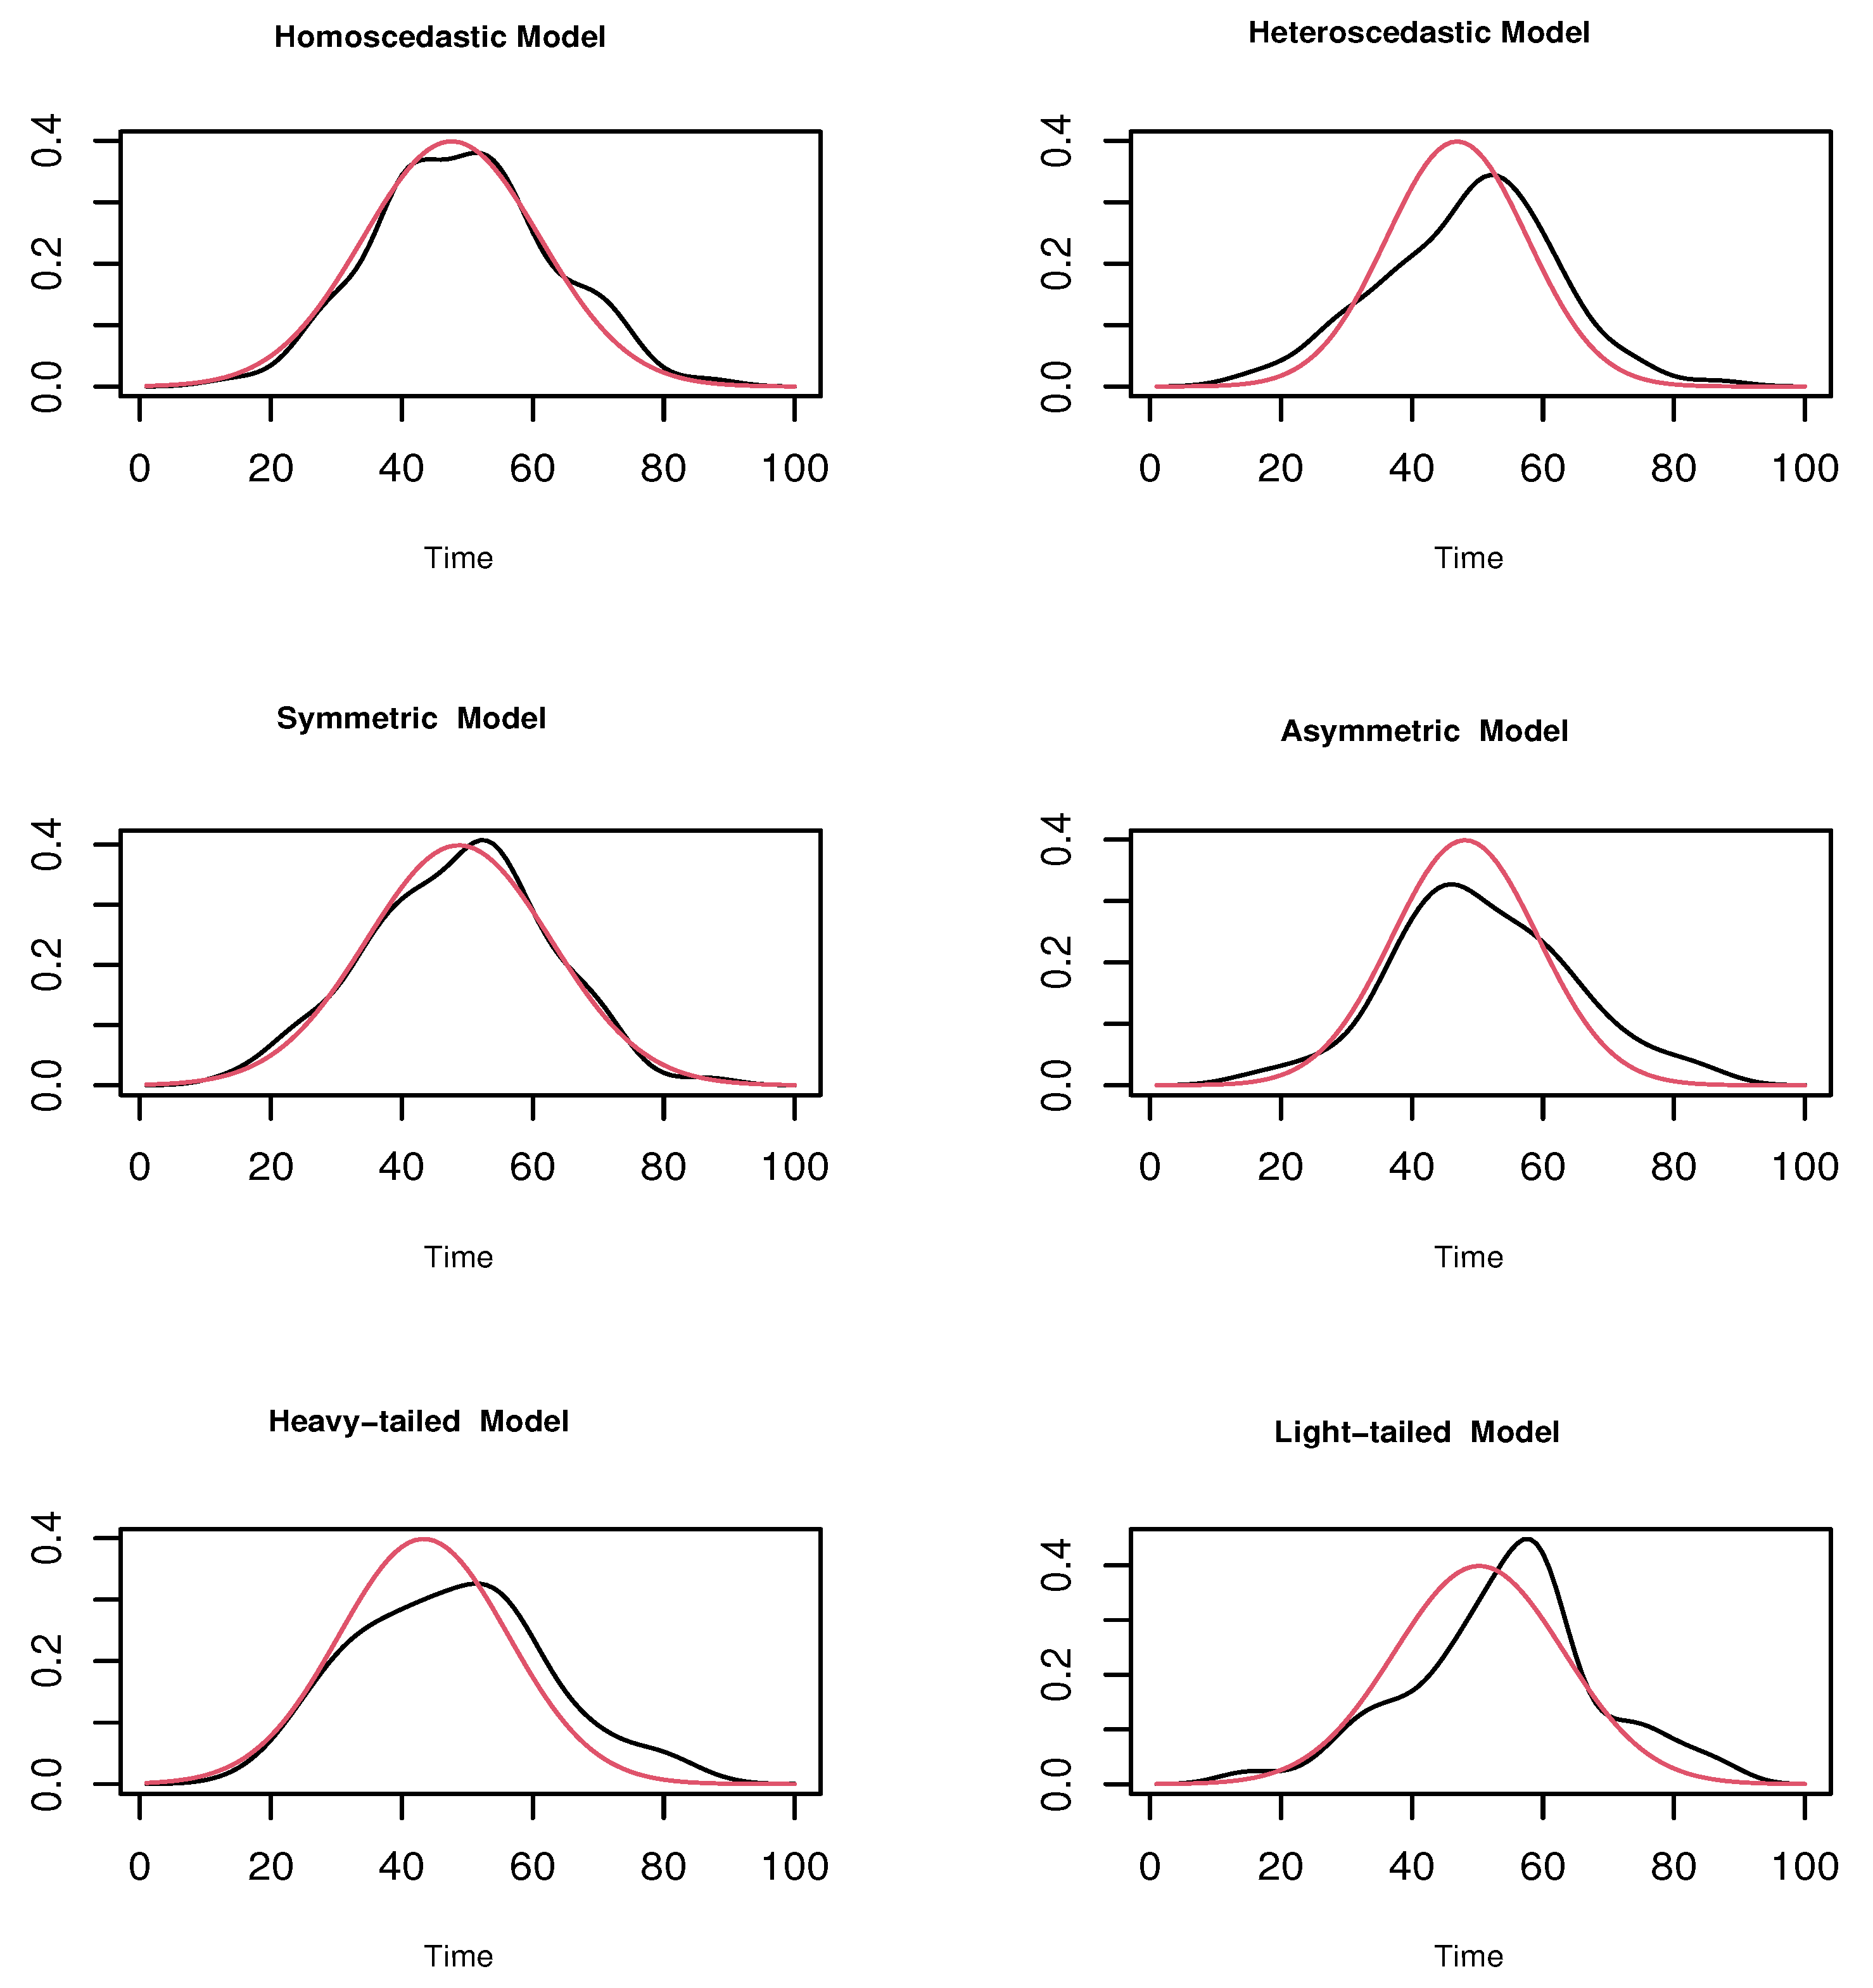
The true values of the conditional modes in the N T function is obtained by shifting the distribution of the white noise ϵ , ϵ 1 , ϵ 2 , ε 1 and ε 2 . After computing the m-independent realizations of ( Z i = N T i ( x 0 ) ) for an arbitrary x 0 we plot the density estimates for different cases (see Figure 2, Figure 3 and Figure 4). The true density is shown in red line and the estimated in the black line.
Figure 2. Limit distribution for the weak dependency case: The true in red line and the estimated in the black line.
Figure 3. Limit distribution for the moderate dependency case: The true in red line and the estimated in the black line.
Figure 4. Limit distribution for the strong dependency case: The true in red line and the estimated in the black line.
These graphical results demonstrate that the limit distribution is impacted by the degree of correlation as well as the model structure. It appears clearly that the quality of the asymptotic normality decreases slightly as the correlation increases. The weak correlation case in Figure 2 exhibits good normality compared to the strongly correlated scenario in Figure 4. Although, generally, the empirical analysis shows a stratified asymptotic normality of the estimator in different situations, the performance remains mildly affected by the type of the model. To quantify this goodness we compute the empirical variance using the 100 generated samples { Z i } i = 1 100 . The results are shown in Table 1.
Table 1. Empirical Variance.
The results presented in Table 1 demonstrate the feasibility of the proposed algorithm, as shown by the low variability in the empirical variance under different experimental conditions. These findings also confirm the good estimation quality of the asymptotic variance, reflecting the theoretical expectation of an empirical variance close to 1, which corresponds to the standard variance of the normal distribution. The influence of the model structure and the level of correlation on the estimation quality can also be observed in this table. In particular, models that are homoscedastic, symmetric and light-tailed show empirical variances closer to 1 compared to other cases.
In the second part of this illustration, we focus on the robustness feature of the constructed estimator. To this end, we find that there are several metrics to assess robustness, including the influence function, breakdown point, gross-error sensitivity, local shift sensitivity, sensitivity curve, bias/variance under contamination, among others (see [,,] for other metrics). Of course some of these metrics are difficult to apply in functional statistics. But all metrics share the main purpose of evaluating the stability of the statistical approach and quantifying its sensitivity to deviations from ideal conditions. In this work, we evaluate robustness using the bias and variance under contamination. For this purpose we drew a contamination model between heavy and light-tailed distribution. Formally we generate new response variables
Y i = r ( X i ) + ε w i t h ε = t ε 1 i + ( 1 t ) ε 2 i t ( 0 , 1 ) i = 1 , , 150 ,
and we compute the variance of the m = 100 -sample of C M o d ^ computed by the same algorithm of the first illustration. The empirical variance of each contamination of order t is defined by
V ( t ) = V a r ( C M o d ^ ( X i ) ) i = 1 m .
In Figure 5 we plot the function V ( t ) for the three levels of dependency.
Figure 5. The viability of the function V ( t ) over 50 points in ( 0 , 1 ) .
Unsurprisingly, V ( t ) shows only small variations in the three scenarios. This statement is confirmed by computing the range of V ( t ) , defined as
R G = max V ( t ) min V ( t )
which serves as a measure of the function’s variability. This benchmark is computed over 50 discretized points in the interval (0, 1). Specifically, we obtained 0.045 for the weak case, compared to 0.061 and 0.113 for the moderate and strong cases, respectively.

4.2. Real Data Example

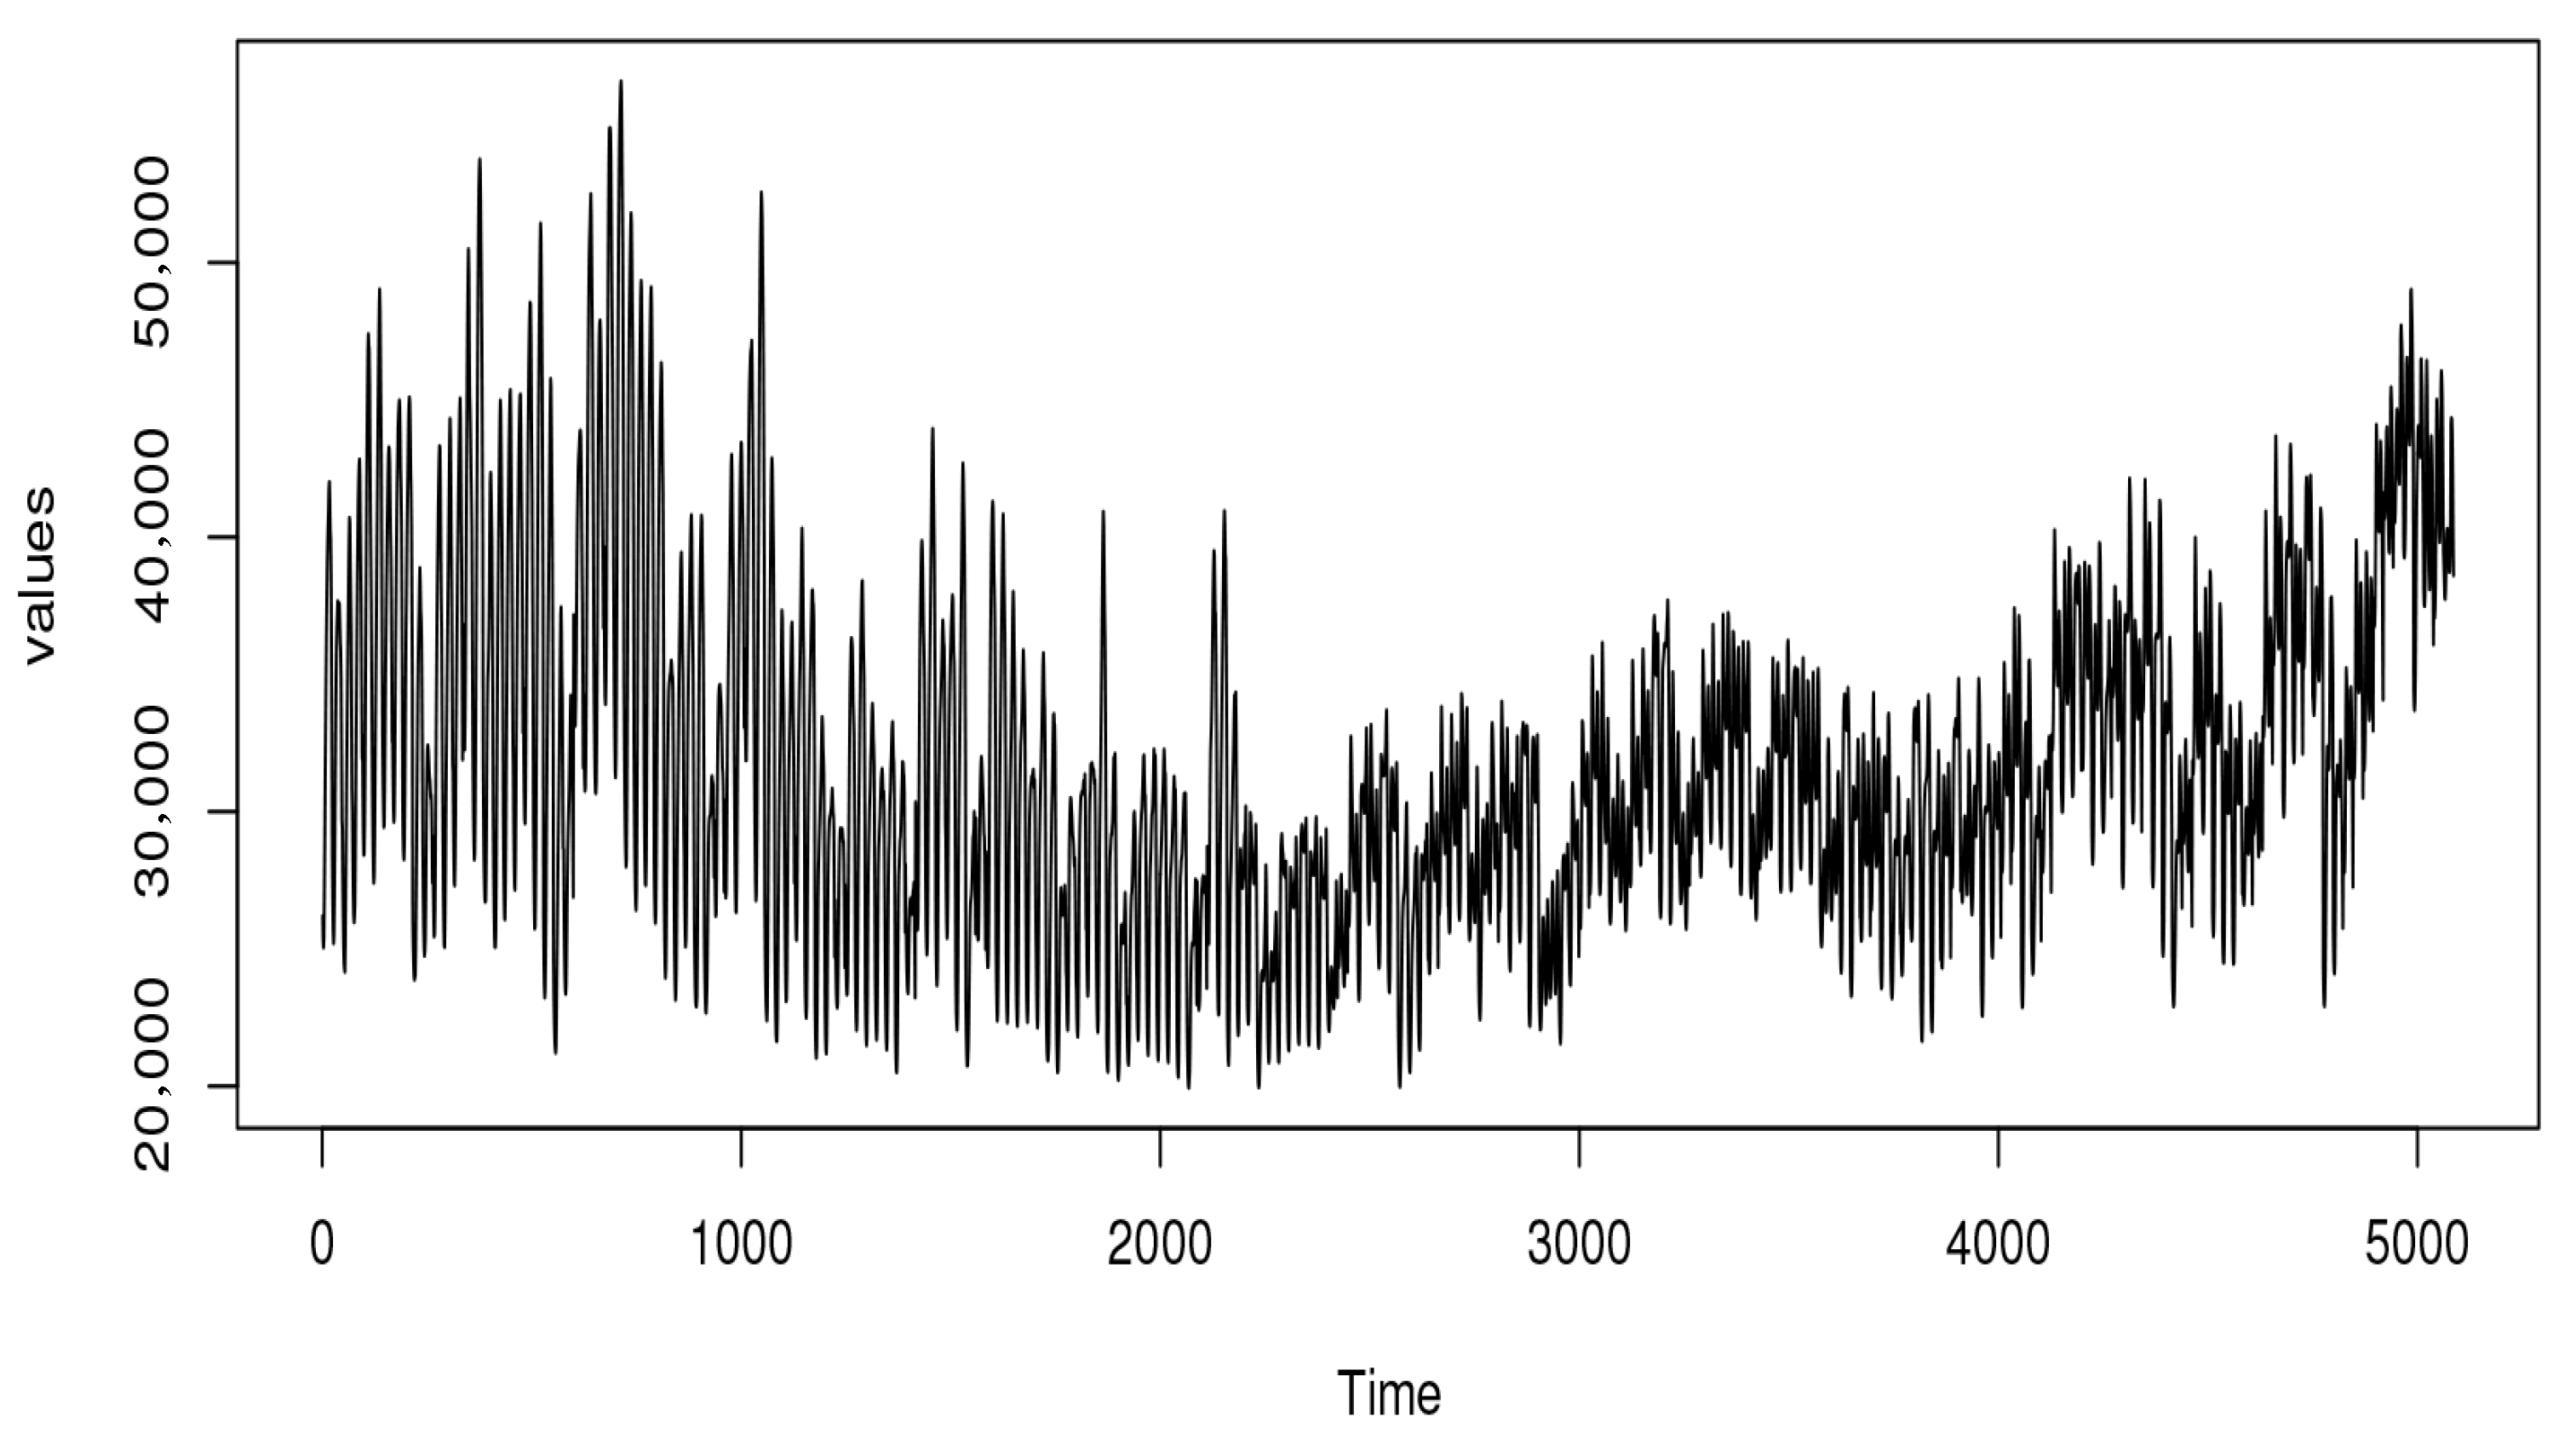
In addition to the empirical analysis presented in the previous section, this part examines the applicability of the proposed model to a real-world example. Our goal is to illustrate how robust modal regression estimation can enhance predictive performance. Specifically, we compare the predictions C M o d ^ with those from median regression, using hourly energy consumption data from the USA. The dataset for this study is available at https://www.kaggle.com/datasets/robikscube/hourly-energy-consumption (accessed on 30 October 2025) and contains hourly power consumption data from PJM, a Regional Transmission Organization (RTO) in the United States. PJM operates within the Eastern Interconnection grid, serving all or parts of Delaware, Illinois, Indiana, Kentucky, Maryland, Michigan, New Jersey, North Carolina, Ohio, Pennsylvania, Tennessee, Virginia, West Virginia and the District of Columbia. The analyzed dataset covers the period from 1 January 2018 to 31 July 2018. We note that [] used similar data in a prediction context with the classical regression function, applying a logarithmic transformation to reduce heteroscedasticity. The data exhibits the principal characteristics of functional time series, including seasonality, high volatility, random fluctuations and asymmetry in the distribution. To highlight the advantages of our robust approach, we compare the sensitivity of both models to these features using the original data and its logarithmic transformation.
Now, in order to predict the average consumption one day ahead, knowing the last daily curve of consumption using the robust modal regression or conditional median, we employ the following sampling design ( X i , Y i ) i = 1 , , n as follows:
For each fixed day d i , we put X i ( · ) = l o g Z d i ( · ) and for all fixed t 0 , Y i = X i + 1 ( t 0 ) .
where Z d i ( . ) is the hourly curve of the energy consumption at day d i . The initial data Z i is presented in Figure 6.
Figure 6. The initial process.
The functional curves are shown in Figure 7.
Figure 7. The functional regressors.
Two comparative studies were conducted. The first focuses on pointwise prediction, while the second addresses confidence interval prediction. For details on constructing confidence intervals for quantile regression, we refer to []. Clearly, the effectiveness of these predictors depends on the choice of estimation parameters. In this study, the optimal bandwidths were selected using the cross-validation method over a discrete set of bandwidth values determined by the nearest neighbors, as described in the previous section.
To predict values or construct a predictive interval for the last day ( i = 365 ) of the sample, given the functional covariates X 364 , we use the first 363 curves as a training set. For each fixed hour j = 1 , , 24 , we estimate the target quantities based on X 364 using the training data ( Y i j , X i ) i = 1 , , 363 , where Y i j = X i + 1 ( j ) . The estimation is performed using the quadratic kernel and we define the semi-metric using the first m eigenfunctions of the empirical covariance operator corresponding to the m largest eigenvalues (see [] (pp. 28 and 223) for more details). This choice is motivated by the non-differentiable nature of the curves X i . The parameter m is selected from the training data using cross-validation.
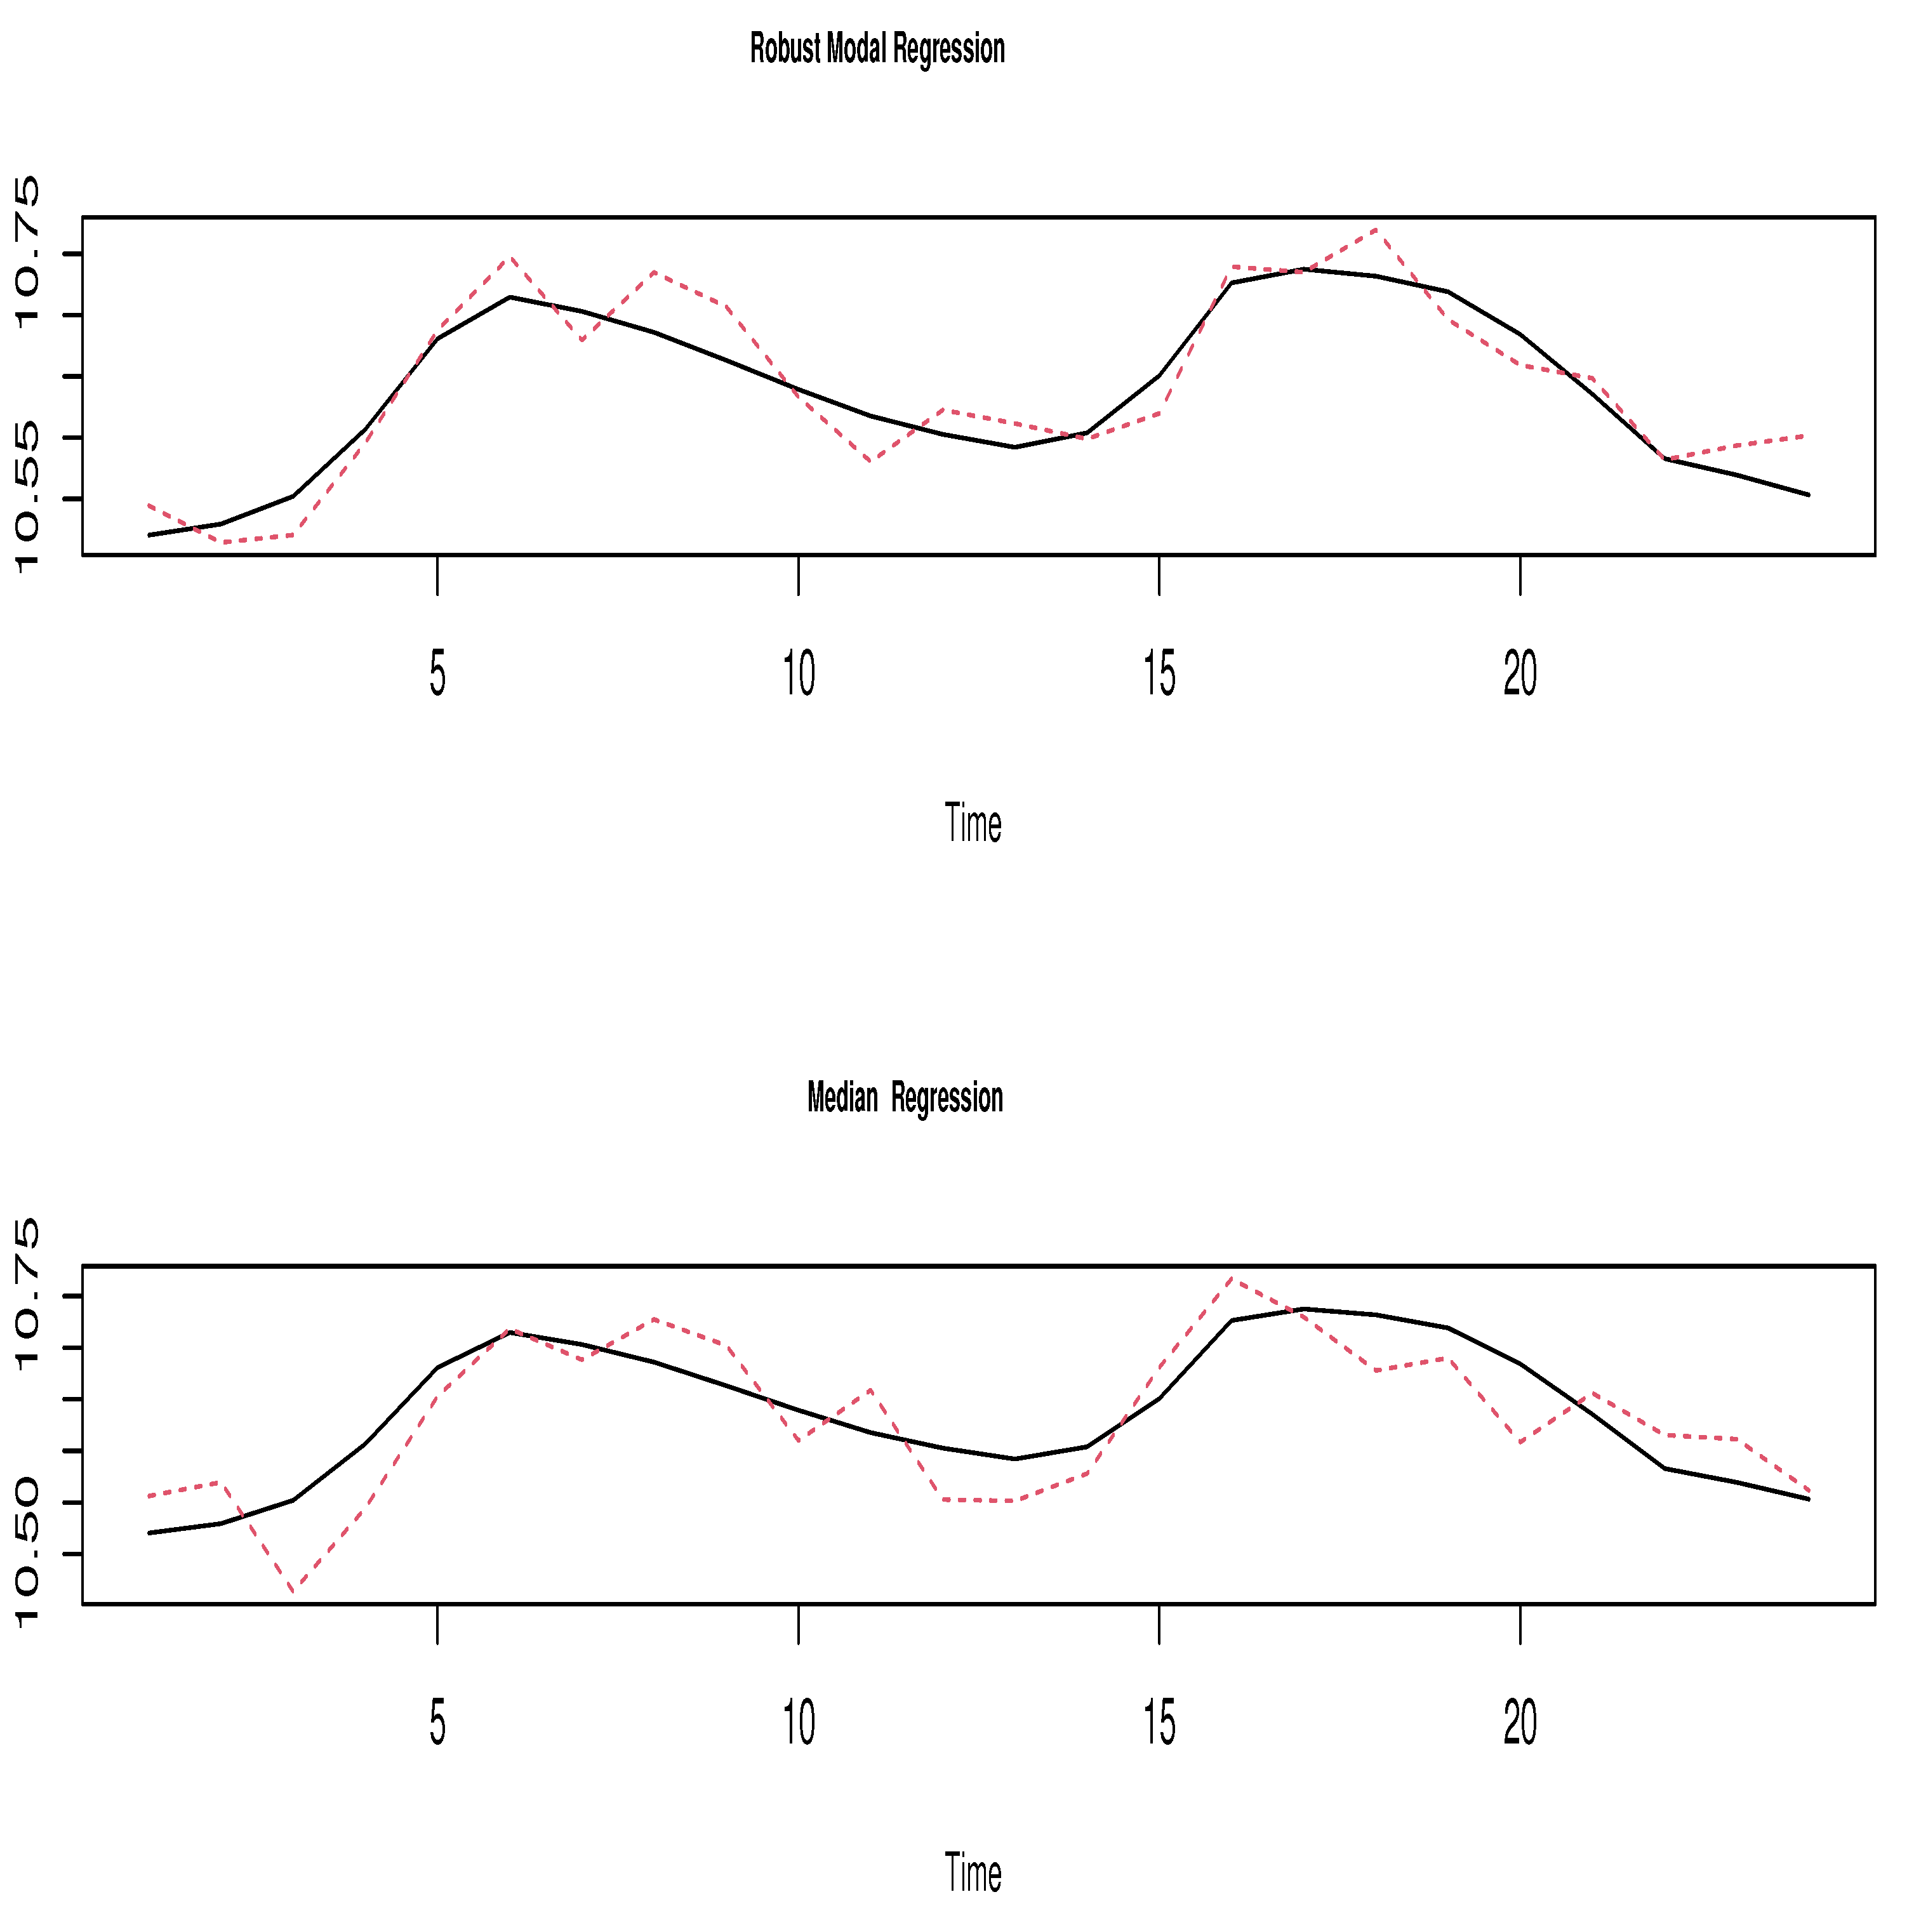
The results are given in the following figures. Figure 8 presents the observed values (black solid lines) alongside the estimated values (red dashed lines) for both the robust mode and median predictors. Figure 9 illustrates the bounds of their corresponding confidence intervals.
Figure 8. Poin twise prediction results: The estimator in red line and the true in the black line.
Figure 9. Confidence interval prediction results: The estimator in red line and the true in the black line.
We observe that the robust mode provides the best performance in terms of MSE values. This is visually supported in Figure 8, where the predicted curves (red dashed lines) closely follow the true curve (black solid line). In particular, the mode predicted curve is closer to the true curve than the one obtained from median regression. A quantitative comparison using the mean squared error (MSE), as defined in (9), confirms this statement. Specifically MSE = 1.97 for the robust mode versus MSE = 2.87 for the median regression. Furthermore, the confidence interval prediction for the mode appears to be more accurate than that for the median (as is visible in Figure 9). This is evidenced by the average mean length (M.L.) of the confidence intervals, which is 2.36 for the robust mode compared to 5.71 for the median. It is worth noting that the M.L. metric is commonly used to assess the quality of confidence interval predictions by quantifying the closeness of the interval’s extremities to the true values.

5. Conclusions and Prospects

In this paper, we studied the robust estimation of the conditional mode for functional time series. The proposed estimator, derived from robust quantile regression, provides a viable alternative to classical approaches based on conditional density estimation, offering improved accuracy and stability. Its asymptotic properties were established under general assumptions. We have stated the asymptotic normality of the predictor, which allows us to construct the confidence intervals and its use in prediction. The predictive framework was developed under a strong mixing assumption, highlighting that convergence rates and consistency are highly dependent on both the degree of temporal dependence and the structural features of the underlying functional space. The empirical investigation supports these theoretical findings. Simulation results show the easy computability of the estimator. However, the analysis also reveals that performance is sensitive to the selection of tuning parameters, particularly bandwidth and functional components, highlighting the necessity for data-driven procedures to automate parameter choice. The absence of such methods currently limits practical applicability and remains an important question for future research. Additionally, extending the proposed approach by combining robust estimation with k-nearest neighbors (kNNs) smoothing appears promising, as kNN methods are known to enhance convergence rates in modal regression. Next, it is well known that the moment of integrability of the robust estimator is important for some inferential statistics issues. Thus the statement of this asymptotic result is also important for practical purposes.

6. The Mathematical Development

Proof. 
The proof of Theorem 1 is established through standard analytical techniques. Indeed, by definition we have
C M o d ^ ( x ) C M o d ( x ) = C Q u ^ ( p ^ C M o d | x ) C Q u ( p C M o d | x ) = C Q u ^ ( p ^ C M o d | x ) C Q u ( p ^ C M o d | x ) + C Q u ( p ^ C M o d | x ) C Q u ( p C M o d | x )
Next, rewrite the last term via a Taylor expansion
C Q u ( p ^ C M o d | x ) C Q u ( p C M o d | x ) = C Q u ( p * C M o d | x )
for q u a d p * C M o d between   p ^ C M o d for q u a d p C M o d
Observe that
n b n 2 ζ x ( f n ) σ 2 ( x ) 1 / 2 C Q u ^ ( p ^ C M o d | x ) C Q u ( p ^ C M o d | x ) n b n 2 ζ x ( f n ) σ 2 ( x ) 1 / 2 sup p ( 0 , 1 ) | C Q u ^ ( p | x ) C Q u ( p | x ) | .
Thus as n b n 2 f n b ζ x ( f n ) 0 it suffices to show convergence in probability
sup p ( 0 , 1 ) | C Q u ^ ( p | x ) C Q u ( p | x ) | = O ( f n b ) + 1 n ζ x ( f n ) in probability
to write
n b n 2 ζ x ( f n ) σ 2 ( x ) 1 / 2 C M o d ^ ( x ) C M o d ( x ) = n b n 2 ζ x ( f n ) σ 2 ( x ) 1 / 2 ( p C M o d ^ p C M o d ) C Q u p ( x ) + o p ( 1 ) .
Finally, Theorem 1 is a consequence of the following lemmas. □
Lemma 1.
Under assumptions (1)–(7),
sup p ( 0 , 1 ) | C Q u ^ ( p | x ) C Q u ( p | x ) | = O ( f n b ) + 1 n ζ x ( f n ) i n   p r o b a b i l i t y .
Proof. 
We note that the convergence rate of sup p ( 0 , 1 ) | C Q u ^ ( p x ) C Q u ( p x ) | in the almost complete sense was established in Proposition 4.1 of []. However, in our setting, we need the convergence in probability with a small rate. This claimed result follows from a straightforward modification of the proof of the cited proposition. Indeed, the Bahadur representation of C Q u ^ ( p | x ) C Q u ( p | x ) can be expressed as
C Q u ^ ( p | x ) C Q u ( p | x ) = 1 f C Q u ( p | x ) A n + O sup | δ | M | W n ( δ ) + f ( t p ( x ) | x ) δ A n | ,
where M is an arbitrary positive constant and
W n ( δ ) = 1 n I E [ K 1 ] i = 1 n ( p 1 I Y i ( δ + C Q u ( p | x ) ) ) K i , and A n = W n ( 0 ) .
The bias term is not influenced by the dependence structure, it remains the same as in the independent case described in [], and is of order O ( f n b ) . We now focus on the stochastic component, and for this purpose, we divide the proof into the following parts.
sup p [ 0 , 1 ] | A n I E A n | = O 1 n ζ x ( f n ) in probability
and
sup p [ 0 , 1 ] sup | δ | M | W n ( δ ) + f ( C Q u ( p | x ) | x ) δ A n | = O 1 n ζ x ( f n ) in probability .
The proofs of both terms are very similar. Thus, we focus only on the second term. In particular, we use the compactness of the interval [ 0 , 1 ] in the sense that
[ 0 , 1 ] k = 1 d n [ p k l n , p k + l n ] , f o r p k [ 0 , 1 ] .
Next, for all p [ 0 , 1 ] we put k ( p ) = arg min k | p p k | and we evaluate this term as a function of δ and p. To simplify the notation, we put
S n ( δ , p ) = W n ( δ ) A n .
Thus,
sup | δ | M sup p [ 0 , 1 ] | S n ( δ , p ) I E S n ( δ , p ) | sup | δ | M sup p [ 0 , 1 ] | S n ( δ , p ) S n ( δ j ( δ ) , p ) | + sup | δ | M sup p [ 0 , 1 ] | S n ( δ j ( δ ) , p ) S n ( δ j ( δ ) , p k ( p ) ) | + sup | δ | M sup p [ 0 , 1 ] | S n ( δ j ( δ ) , p k ( p ) ) I E [ S n ( δ j ( δ ) , p k ( p ) ) ] | + sup | δ | M sup p [ 0 , 1 ] | I E [ S n ( δ j ( δ ) , p k ( p ) ) ] I E [ S n ( δ , p k ( p ) ) ] | + sup | δ | M sup p [ 0 , 1 ] | I E [ S n ( δ , p k ( p ) ) ] I E [ S n ( δ , p ) ] | .
Observe that
sup | δ | M sup p [ 0 , 1 ] | S n ( δ , p ) S n ( δ j ( δ ) , p ) | 1 n I E [ K 1 ] i Z i 0
with
Z i 0 = sup | δ | M sup p [ 0 , 1 ] 1 I | Y i δ j ( δ ) C Q u ( p | x ) | C l n K i .
In the strong mixing case, the variance term is evaluated using the method of Massry together with the Davydov–Rio inequality. It is
V a r i = 1 n Z i 0 = O n l n ζ x ( f n )
As a consequence, we obtain
sup | δ | M sup p [ 0 , 1 ] | S n ( δ , p ) S n ( δ j ( δ ) , p ) = O 1 n ζ x ( f n ) in probability
and
sup | δ | M sup p [ 0 , 1 ] | I E S n ( δ , p ) S n ( δ j ( δ ) , p ) = o 1 n ζ x ( f n ) .
Similarly, we use the fact that C Q u ( p x ) belongs to the class C 1 to conclude that
sup | δ | M sup p [ 0 , 1 ] | S n ( δ j ( δ ) , p ) S n ( δ j ( δ ) , p k ( p ) ) | 1 n I E [ K 1 ] i Z i 1
with
Z i 1 = sup | δ | M sup p [ 0 , 1 ] 1 I | Y i δ j ( δ ) C Q u ( p k ( p ) | x ) | C l n K i .
Since
V a r i = 1 n Z i 1 = O n l n ζ x ( f n )
implying
sup | δ | M sup p [ 0 , 1 ] | S n ( δ , p ) S n ( δ j ( δ ) , p ) = O 1 n ζ x ( f n ) in probability
and
sup | δ | M sup p [ 0 , 1 ] | I E S n ( δ , p ) S n ( δ j ( δ ) , p ) = o 1 n ζ x ( f n ) .
For the last term, we proceed in the same way.
S n ( δ j , p k ) I E [ S n ( δ j , p k ) ] = 1 n I E [ K 1 ] i = 1 n Γ i
where
Γ i = 1 I Y i C Q u ( p k | x ) 1 I Y i δ j + C Q u ( p k | x ) K i
I E 1 I Y i C Q u ( p k | x ) 1 I Y i δ j + C Q u ( p k | x ) K i .
It has
V a r i = 1 n Γ i = O n l n ζ x ( f n )
We deduce
sup | δ | M sup p [ 0 , 1 ] | S n ( δ j ( δ ) , p k ( p ) ) I E [ S n ( δ j ( δ ) , p k ( p ) ) ] | = o 1 n ζ x ( f n ) in probability
It follows that
sup p [ 0 , 1 ] sup | δ | M | W n ( δ ) A n I E W n ( δ ) A n | = O 1 n ζ x ( f n ) in probability .
and
sup p [ 0 , 1 ] | A n I E A n | = O 1 n ζ x ( f n ) in probability
We conclude
sup p [ 0 , 1 ] | C Q u ^ ( p | x ) C Q u ( p | x ) | = O ( f n b ) + O 1 n ζ x ( f n ) in probability .
Lemma 2.
Under assumptions (1)–(8), then
n b n 2 ζ x ( f n ) σ 2 ( x ) 1 / 2 ( p C M o d ^ p C M o d ) D N ( 0 , 1 )
w i t h σ 2 ( x ) = a 2 ( x ) Q p C M o d ( 1 ) ( x ) Q p C M o d ( 3 ) ( x ) a 1 2 ( x )
Proof. 
For the asymptotic normality, we put Z n = n b n 2 ζ x ( f n ) σ 2 ( x ) 1 / 2 ( p C M o d ^ p C M o d ) and we define
L n ( z ) = C Q u ^ C Q u p C M o d + z n b n 2 ζ x ( f n ) σ 2 ( x ) C Q u ^ C Q u p C M o d .
Clearly
Z n = arg min z F 1 ( S | x ) L n ( z ) .
Thus, it is sufficient to establish the asymptotic normality of L n ( z ) in order to derive the limiting distribution of Z n . For this, we write for all z R
L n ( z ) = L n ( z ) L ( z ) + L ( z )
where
L ( z ) = C Q u C Q u p C M o d + z n b n 2 ζ x ( f n ) σ 2 ( x ) C Q u C Q u p C M o d = C Q u ( 3 ) C Q u p C M o d z 2 + o σ 2 ( x ) n b n 2 ζ x ( f n ) .
So the asymptotic normality of L n ( z ) is derived from asymptotic normality of L n ( z ) L ( z ) . To do that we take the Bahadur representation of C Q u p ˜ in (11) provided in Proposition 4.2 of [], to give the Bahadur representation of L n ( z ) L ( z ) as
L n ( z ) L ( z ) = 1 f C Q u p ( x ) x 1 n b n E K 1 i = 1 n K i 1 { Q p C M o d b n < Y i < Q p C M o d + z n b n 2 ζ x ( f n ) b n } o r { C Q u p C M o d + b n < Y i < C Q u p C M o d + z n b n 2 ζ x ( f n ) + b n } + o 1 n ζ x ( f n ) .
Thus, the proof reduces to showing that, for all z F 1 ( S | x ) such that
n b n 2 ζ x ( f n ) L n ( z ) L ( z ) D z a 2 ( x ) a 1 2 ( x ) N ( 0 , 1 ) a s n .
For this purpose, we write
n b n 2 ζ x ( f n ) σ 2 ( x ) L n ( z ) L ( z ) = i = 1 n Δ i ( x ) + o i n p r o b a b i l i t y ( 1 )
where
Δ i : = ζ x ( f n ) n I E [ K 1 ] 1 { Q p C M o d b n < Y i < Q p C M o d + z n b n 2 ζ x ( f n ) σ n 2 ( x ) b n } o r { Q p C M o d + b n < Y i < Q p C M o d + z n b n 2 ζ x ( f n ) σ 2 ( x ) + b n } K i I E 1 { Q p C M o d b n < Y i < Q p C M o d + z n b n 2 ζ x ( f n ) σ 2 ( x ) b n } o r { Q p C M o d + b n < Y i < Q p C M o d + z n b n 2 ζ x ( f n ) σ 2 ( x ) + b n } K 1 .
The remainder of the proof follows from the Central Limit Theorem of [] (Corollary 2.2, p. 196), based on the asymptotic behavior of the following quantity
lim n i = 1 n I E [ Δ i 2 ]
and the additional assumptions
There exists a sequence τ n = o ( n ) such that τ n max i = 1 , , n C i 1 where C i = e s s sup ω Ω | Δ i | and n τ n F T S ( ϵ τ n ) 0 for all ϵ > 0 .
There exists a sequence ( m n ) of positive integers tending to such that n m n γ n = o ( 1 ) where γ n : = max 1 i j n I E [ | Δ i Δ j | ] j = m n + 1 F T S ( j ) i = 1 n C i = o ( 1 ) .
We begin by evaluating the limit of (15). To this end, we set
Ψ i = 1 { Q p C M o d b n < Y i < Q p C M o d + z n b n 2 ζ x ( f n ) σ n 2 ( x ) b n } o r { Q p C M o d + b n < Y i < Q p C M o d + z n b n 2 ζ x ( f n ) σ 2 ( x ) + b n } .
Let us remark that
i = 1 n I E [ Δ i 2 ] = ζ x ( f n ) n I E 2 [ K 1 ] i = 1 n V a r K i Ψ i = ζ x ( f n ) I E 2 [ K 1 ] V a r K 1 Ψ 1 = ζ x ( f n ) I E 2 [ K 1 ] I E K 1 2 Ψ 1 2 ζ x ( f n ) I E 2 [ K 1 ] I E K 1 Ψ 1 2 = ζ x ( f n ) I E K 1 2 I E 2 [ K 1 ] I E K 1 2 Ψ 1 2 I E K 1 2 ζ x ( f n ) I E K 1 Ψ 1 I E K 1 2 .
It follows that
lim n i = 1 n I E [ Δ i 2 ] = a 2 z 2 a 1 2 .
Concerning (16), using the boundness of K and Ψ to show that C i = O 1 n ζ x ( f n ) . Therefore, we can take τ n = n ζ x ( f n ) log n . Furthermore, by (8) this sequence gives, for all ϵ > 0
n τ n F T S ( ϵ τ n ) C n 1 ( a + 1 ) / 2 ( ζ x ( f n ) ) ( a + 1 ) / 2 ( log n ) ( a + 1 ) / 2 r i g h t a r r o w 0
We proceed to derive (17). On the one hand, the boundedness of Ψ implies that
i j , I E [ | Δ i Δ j | ] ζ x ( f n ) n I E [ K 1 ] 2 I E K i K j + I E [ K i ] I E [ K j ]
Next,
I E [ | Δ i Δ j | ] C 1 n ζ x ( f n ) n 1 / a + ζ x ( f n ) .
Since a > 1 , we have
γ n = max 1 i j n I E [ | Δ i Δ j | ] = O ζ x ( f n ) n .
Meanwhile, taking into account that
j x + 1 j a u x u a = ( a 1 ) x a 1 1
to write
j = m n + 1 F T S ( j ) j = m n F T S ( j ) t m n t a d t = m n 1 a a 1 ,
thus,
j = m n + 1 F T S ( j ) i = 1 n C i = O m n 1 a a 1 n ζ x ( f n ) .
Choosing m n = log n ζ x ( f n ) n 1 / ( 2 ( 1 a ) ) where [ . ] denote the function integer part. It is evident that m n . Moreover, substituting the expression for m n yields
j = m n + 1 F T S ( j ) i = 1 n C i = O ( log n ) 1 / 2 ,
implying
m n γ n         C n 1 1 / ( 2 ( 1 a ) ( ζ x ( f n ) ) 1 + 1 / ( 2 ( 1 a ) ( log n ) 1 / ( 2 ( 1 a ) )     n ( 3 + 2 a ) / ( 2 ( 1 a ) ( ζ x ( f n ) ) ( 3 2 a ) / ( 2 ( 1 a ) ( log n ) 1 / ( 2 ( 1 a ) ) n 1 ( log n ) 1 / ( 2 ( 1 a ) ) = o n 1 .
Consequently, the lemma follows directly from (15)–(17) and Corollary 2.2 of []. □

Author Contributions

The authors contributed approximately equally to this work. Formal analysis, M.B.A.; Writing—review and editing, Z.K. All authors have read and agreed to the published version of the manuscript.

Funding

This research was funded by the Deanship of Scientific Research and Graduate Studies at King Khalid University for funding this work through Small Research Project under grant number RGP1/41/46.

Data Availability Statement

The dataset used in this study is openly available on Kaggle at https://www.kaggle.com/datasets/robikscube/hourly-energy-consumption (accessed on 30 October 2025).

Acknowledgments

The authors would like to thank the Editor, the Associate Editor and the three anonymous reviewers for their valuable comments and suggestions which improved substantially the quality of an earlier version of this paper. The authors thank and extend their appreciation to the funder of this work: Deanship of Scientific Research and Graduate Studies at King Khalid University for funding this work through Small Research Project under grant number RGP1/41/46.

Conflicts of Interest

The authors declare no conflicts of interest.

References

  1. Bosq, D. Linear Processes in Function Spaces; Lecture Notes in Statistics; Springer: New York, NY, USA, 2000; Volume 149. [Google Scholar]
  2. Ling, N.; Liu, Y.; Vieu, P. Conditional mode estimation for functional stationary ergodic data with responses missing at random. Statistics 2016, 50, 991–1013. [Google Scholar] [CrossRef]
  3. Bouzebda, S.; Laksaci, A.; Mohammedi, M. Single index regression model for functional quasi-associated time series data. REVSTAT 2022, 20, 605–631. [Google Scholar]
  4. Wang, L. Nearest neighbors estimation for long memory functional data. Stat. Methods Appl. 2020, 29, 709–725. [Google Scholar] [CrossRef]
  5. Ferraty, F.; Vieu, P. Nonparametric Functional Data Analysis. Theory and Practice; Springer Series in Statistics; Springer: New York, NY, USA, 2006. [Google Scholar]
  6. Azzeddine, N.; Laksaci, A.; Ould-Saïd, E. On robust nonparametric regression estimation for a functional regressor. Stat. Probab. Lett. 2008, 78, 3216–3221. [Google Scholar] [CrossRef]
  7. Barrientos-Marin, J.; Ferraty, F.; Vieu, P. Locally modelled regression and functional data. J. Nonparametr. Stat. 2010, 22, 617–632. [Google Scholar] [CrossRef]
  8. Demongeot, J.; Hamie, A.; Laksaci, A.; Rachdi, M. Relative-error prediction in nonparametric functional statistics: Theory and practice. J. Multivar. Anal. 2016, 146, 261–268. [Google Scholar] [CrossRef]
  9. Ferraty, F.; Laksaci, A.; Vieu, P. Functional time series prediction via conditional mode estimation. C. R. Math. Acad. Sci. Paris 2005, 340, 389–392. [Google Scholar] [CrossRef]
  10. Ezzahrioui, M.H.; Ould-Saïd, E. Asymptotic normality of a nonparametric estimator of the conditional mode function for functional data. J. Nonparametr. Stat. 2008, 20, 3–18. [Google Scholar] [CrossRef]
  11. Dabo-Niang, S.; Kaid, Z.; Laksaci, A. Asymptotic properties of the kernel estimate of spatial conditional mode when the regressor is functional. AStA Adv. Stat. Anal. 2015, 99, 131–160. [Google Scholar] [CrossRef]
  12. Ling, N.; Vieu, P. Nonparametric modelling for functional data: Selected survey and tracks for future. Statistics 2018, 52, 934–949. [Google Scholar] [CrossRef]
  13. Bouanani, O.; Laksaci, A.; Rachdi, M.; Rahmani, S. Asymptotic normality of some conditional nonparametric functional parameters in high-dimensional statistics. Behaviormetrika 2019, 46, 199–233. [Google Scholar] [CrossRef]
  14. Cardot, H.; Crambes, C.; Sarda, P. Quantile regression when the covariates are functions. J. Nonparametr. Stat. 2005, 17, 841–856. [Google Scholar] [CrossRef]
  15. Wang, H.; Ma, Y. Optimal subsampling for quantile regression in big data. Biometrika 2021, 108, 99–112. [Google Scholar] [CrossRef]
  16. Jiang, Z.; Huang, Z. Single-index partially functional linear quantile regression. Commun. Stat. Theory Methods 2024, 53, 1838–1850. [Google Scholar] [CrossRef]
  17. Ferraty, F.; Laksaci, A.; Vieu, P. Estimating some characteristics of the conditional distribution in nonparametric functional models. Stat. Inference Stoch. Process. 2006, 9, 47–76. [Google Scholar] [CrossRef]
  18. Dabo-Niang, S.; Kaid, Z.; Laksaci, A. Spatial conditional quantile regression: Weak consistency of a kernel estimate. Rev. Roum. Math. Pures Appl. 2012, 57, 311–339. [Google Scholar]
  19. Chowdhury, J.; Chaudhuri, P. Nonparametric depth and quantile regression for functional data. Bernoulli 2019, 25, 395–423. [Google Scholar] [CrossRef]
  20. Mutis, M.; Beyaztas, U.; Karaman, F.; Shang, H.L. On function-on-function linear quantile regression. J. Appl. Stat. 2025, 52, 814–840. [Google Scholar] [CrossRef]
  21. Azzi, A.; Laksaci, A.; Ould-Saïd, E. On the robustification of the kernel estimator of the functional modal regression. Stat. Probab. Lett. 2021, 181, 109256. [Google Scholar] [CrossRef]
  22. Azzi, A.; Belguerna, A.; Laksaci, A.; Rachdi, M. The scalar-on-function modal regression for functional time series data. J. Nonparametr. Stat. 2024, 36, 503–526. [Google Scholar] [CrossRef]
  23. Alamari, M.B.; Almulhim, F.A.; Almanjahie, I.M.; Bouzebda, S.; Laksaci, A. Scalar-on-Function Mode Estimation Using Entropy and Ergodic Properties of Functional Time Series Data. Entropy 2025, 27, 552. [Google Scholar] [CrossRef]
  24. Almulhim, F.A.; Alamari, N.B.; Laksaci, A.; Kaid, Z. Modal Regression Estimation by Local Linear Approach in High-Dimensional Data Case. Axioms 2025, 14, 537. [Google Scholar] [CrossRef]
  25. Ferraty, F.; Mas, A.; Vieu, P. Nonparametric regression on functional data: Inference and practical aspects. Stat. Sin. 2007, 17, 113–136. [Google Scholar] [CrossRef]
  26. Jones, D.A. Nonlinear autoregressive processes. Proc. R. Soc. Lond. A 1978, 360, 71–95. [Google Scholar]
  27. Bradley, R.C. Introduction to Strong Mixing Conditions; Kendrick Press: Heber City, UT, USA, 2007; Volume I–III. [Google Scholar]
  28. Dedecker, J.; Doukhan, P.; Lang, G.; Leon, J.R.; Louhichi, S.; Prieur, C. Weak Dependence: With Examples and Applications; Lecture Notes in Statistics 190; Springer: New York, NY, USA, 2007. [Google Scholar]
  29. Ezzahrioui, M.; Ould-Saïd, E. Some asymptotic results of a non-parametric conditional mode estimator for functional time-series data. Stat. Neerl. 2010, 64, 171–201. [Google Scholar] [CrossRef]
  30. Liebscher, E. Central limit theorems for α-mixing triangular arrays with applications to nonparametric statistics. Math. Meth. Statist. 2001, 10, 194–214. [Google Scholar]
  31. Huber, P.J. Robust Statistics; Wiley: New York, NY, USA, 1981. [Google Scholar]
  32. Hampel, F.R. A general qualitative definition of robustness. Ann. Math. Stat. 1971, 42, 1887–1896. [Google Scholar] [CrossRef]
  33. Maronna, R.A.; Martin, R.D.; Yohai, V.J. Robust Statistics: Theory and Methods; Wiley: Chichester, UK, 2006. [Google Scholar]
  34. Laksaci, A.; Lemdani, M.; Ould Saïd, E. Asymptotic results for an L1-norm kernel estimator of the conditional quantile for functional dependent data with application to climatology. Sankhya A 2011, 73, 125–141. [Google Scholar] [CrossRef]
Disclaimer/Publisher’s Note: The statements, opinions and data contained in all publications are solely those of the individual author(s) and contributor(s) and not of MDPI and/or the editor(s). MDPI and/or the editor(s) disclaim responsibility for any injury to people or property resulting from any ideas, methods, instructions or products referred to in the content.

Article Metrics

Citations

Article Access Statistics

Multiple requests from the same IP address are counted as one view.