1. Introduction
Real-time communication is becoming increasingly critical in fields such as industrial automation, intelligent transportation, and healthcare. These fields impose stringent requirements on end-to-end delay and jitter in network transmission. Devices must not only achieve high-speed data transmission and immediate control responses but also ensure precise clock synchronization and high inter-device coordination. Typically, industrial control systems require transmission delays below 10 ms, while autonomous driving demands latencies under 1 ms.
However, the maximum network latency of traditional Ethernet [
1,
2,
3] can typically reach the level of hundreds of milliseconds, which is far from meeting the stringent requirements of these fields. The introduction of time-sensitive networking (TSN) [
4,
5,
6,
7,
8,
9,
10] significantly enhances network transmission real-time performance and addresses the urgent need for low-latency communication in industrial automation. Building on traditional Ethernet, TSN delivers microsecond-level deterministic services via clock synchronization, data scheduling, and network configuration mechanisms, ensuring real-time communication and collaboration among automation devices to optimize production processes and enhance product quality. Simultaneously, advancements in autonomous driving technology have expanded TSN’s potential in intelligent transportation, enabling precise communication support for autonomous vehicles and ensuring collaborative operations and safe driving among vehicles. In healthcare, TSN enables monitoring and regulation of medical devices, facilitates efficient coordination and information flow among them, and ultimately enhances patient safety.
TSN supports three types of mixed-critical traffic: time-triggered (TT) [
11,
12,
13], audio video bridging (AVB) [
14,
15], and best-effort (BE) [
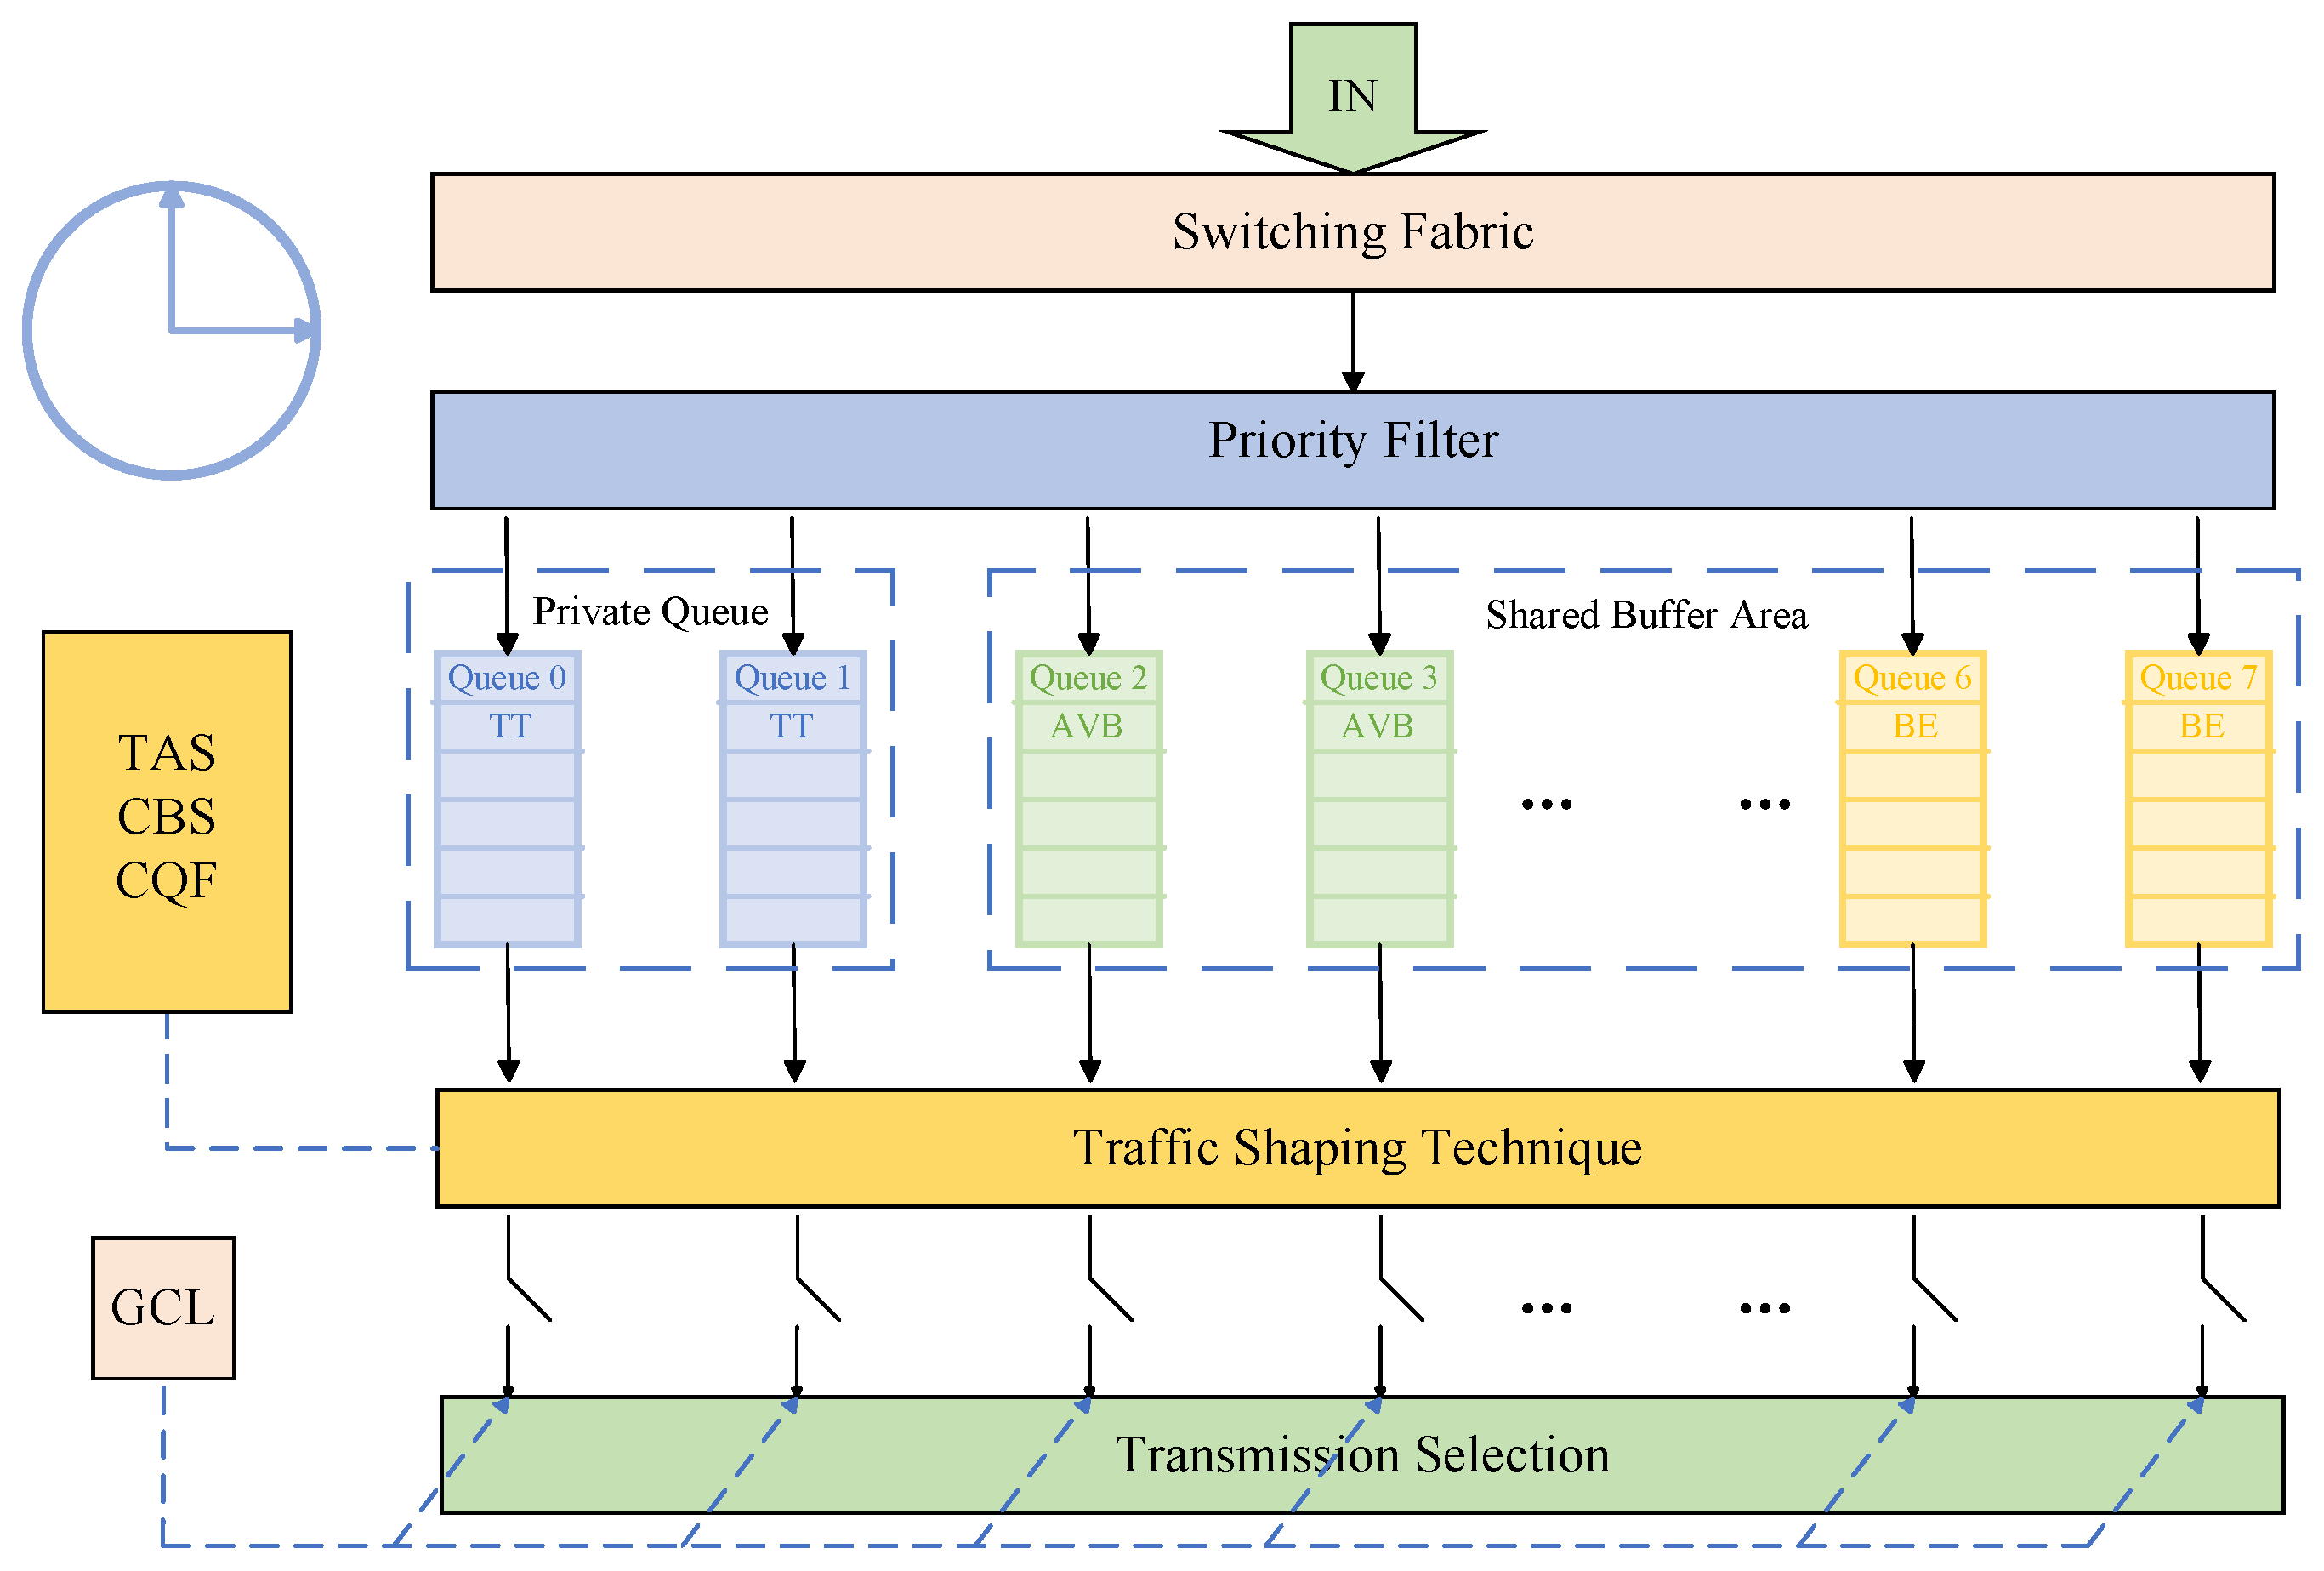
16]. As shown in
Figure 1, the traffic transmission and processing architecture of the TSN switch is explicitly designed in line with TSN core standards, ensuring seamless integration with existing scheduling and shaping mechanisms. The transmission and scheduling logics of the three types of traffic form a clear and collaborative system within this architecture. Among them, the highest-priority TT traffic for scenarios such as industrial control and periodic task transmission is allocated to an independent transmission partition, with its scheduling strictly interfaced with the time-aware shaper (TAS) technology [
17,
18,
19,
20,
21] proposed in the IEEE 802.1Qbv [
22,
23] standard: through a pre-configured gate control list (GCL) [
24,
25,
26], it periodically adjusts the on/off state of the output queue to achieve deterministic gating operations, ensuring TT traffic is transmitted within preset time windows and complying with the precise clock synchronization and scheduling requirements of this standard. Relying on this highest priority and sophisticated time synchronization and scheduling mechanism, TT traffic can effectively support periodic data transmission, perfectly matching the characteristics of periodic fixed operations in automated equipment. For example, in industrial scenarios, whether it is the regular movement of a robotic arm or the periodic processing of a production line, TT traffic provides accurate and reliable guarantees to ensure that these periodic tasks are performed accurately. Therefore, the transmission and scheduling strategy for TT traffic has been widely studied. However, in the GCL gating control method at the core of TAS technology, the offset difference between similar windows of adjacent nodes will affect network performance. Thus, Reference [
27] proposed an optimized flexible window overlapping scheduling algorithm, which optimizes TT window offset based on delay evaluation while considering the overlap between windows of different priorities on the same node. In addition, under the condition of a simple network architecture, Reference [
28] proposed an adaptive cycle compensation scheduling algorithm based on traffic classification. This study combines path selection and scheduling algorithms to improve scheduling success rate and reduce execution time, further optimizing the transmission of TT traffic. In addition, for AVB traffic that requires stable quality of service (QoS) guarantees, traffic shaping is accomplished in this architecture by integrating the IEEE 802.1Qav credit-based shaper (CBS) mechanism. This can effectively smooth traffic bursts, regulate transmission rates, and ensure compliance with preset bandwidth constraints. Meanwhile, AVB traffic shares the same transmission partition with BE traffic, which has the lowest priority and no strict latency requirements, and both are scheduled to transmit during the transmission gaps of TT traffic. This design can fundamentally avoid resource competition between AVB, BE traffic, and TT traffic, and achieve maximum utilization of link bandwidth without compromising the deterministic transmission guarantees of TT traffic. Existing research demonstrates that TT traffic scheduling has been thoroughly investigated, ensuring high reliability and low latency during transmission. In contrast, the transmission optimization techniques for the event-triggered (ET) [
29] traffic types, AVB and BE, are relatively less studied.
Recent representative studies on mixed traffic scheduling in the TSN domain have further provided important references for the advancement of this field. The OHDSR+ model proposed in [
30] focuses on the joint scheduling and routing optimization of TT traffic and BE traffic. It enhances the reliability of TT traffic through redundant routing and time offset mechanisms, with its core innovation residing in the collaborative optimization of paths and scheduling under the constraint programming (CP) framework, and particularly emphasizes scalability in large-scale networks. As the precursor work of OHDSR+, Reference [
31] first proposed the queue-gating time (QGT) mechanism, which precisely controls the transmission windows of TT and BE traffic via the GCL. Its core contribution lies in the establishment of a CP-based joint optimization framework for mixed traffic, verifying the feasibility of scheduling low-priority traffic. Both studies revolve around the top-level collaboration of “scheduling-routing” and provide effective solutions for the transmission optimization of TT traffic and low-priority traffic. However, they fail to delve into the resource competition issue at the shared buffer level. Even if temporal isolation of traffic is achieved through window scheduling, AVB and BE traffic in the shared buffer may still exhibit resource monopoly due to priority differences, thereby impairing transmission performance.
To address shared buffer unfairness, priority queue technology has been extensively studied as a core solution, with abundant research outcomes forming a mature theoretical and practical system. In the context of TSN switch buffer management, numerous studies have proposed targeted optimization schemes based on priority queue mechanisms. For example, Ref. [
32] proposed a time-triggered switch-memory-switch architecture, which supports efficient transmission of time-triggered traffic through dedicated queue design and provides architectural references for the coordinated management of priority queues and buffer resources. Literature [
33] introduced a dynamic per-flow queues (DFQ) method in shared buffer TSN switches, improving the efficiency and determinism of time-triggered traffic transmission through refined queue partitioning and priority adaptation. Ref. [
34] designed a flexible switching architecture with virtual queues, realizing logical isolation of different priority traffics via virtual queues and optimizing the allocation and scheduling of buffer resources. Ref. [
35] proposed a size-based queuing (SBQ) approach, which ensures the transmission performance of high-priority traffic while improving bandwidth utilization through differentiated length management of priority queues. Ref. [
36] combined virtual queues and time offset parameters to design a scheduling strategy, which reduces traffic interference and ensures low latency and high reliability of high-priority traffic through precise control of priority queues without increasing excessive hardware overhead.
Building on the aforementioned priority queue-related research, the dynamic threshold (DT) strategy [
37] stands out for its high adaptability. However, the DT strategy struggles to achieve efficient buffer utilization, as it necessitates reserving space in the shared buffer. Building on the dynamic threshold management strategy, Ref. [
38] proposed an efficient thresholding-based filter buffer management scheme, which compares the queue length of the output port with a specific buffer allocation factor, classifies the output port as active or inactive, and filters out the incoming packets of the inactive output port when the queue length exceeds a threshold. It can reduce the overall packet loss rate of the shared buffer packet switch and improve the fairness of buffer usage. Ref. [
39] proposes a new strategy combining evolutionary computing and fuzzy logic. The core idea of this strategy is to adaptively adjust the threshold of each logic output queue through a fuzzy reasoning system to match the actual network traffic conditions. Ref. [
40] proposes a double threshold method considering traffic scenarios, simplifies the calculation formula of traffic intensity, and dynamically adjusts the threshold value of each port to maintain common traffic intensity, maintain system equilibrium, and achieve global optimization. Refs. [
41,
42] present an enhanced dynamic threshold (EDT) strategy, mitigating micro-burst-induced packet loss via buffer optimization and temporary fairness relaxation.
Recently, due to the popularity of artificial intelligence algorithms, a series of AI-based buffer management strategies have been proposed. Refs. [
43,
44] propose a traffic-aware dynamic threshold (TDT) strategy, dynamically adjusting buffer allocation based on real-time port traffic detection. The wide application of machine learning [
45] technology promotes its combination with network traffic control, and realizes the intelligence and refinement of traffic management through accurate analysis and prediction of traffic patterns. Ref. [
46] proposed a buffer management strategy method based on deep reinforcement learning, developed corresponding domain-specific technologies to successfully apply deep reinforcement learning to the buffer management problem of network switches, and verified its effectiveness and superiority through experiments. However, these methods demand complex training processes and significant computational resources, posing challenges for deployment in high-speed switching environments.
This paper proposes a switch buffer management strategy for mixed-critical traffic in TSN. The core idea is to configure the output port of the TSN switch with multiple priority queues. A dedicated highest-priority queue is allocated for TT traffic, while the remaining queues are organized into a two-tier priority system. The high-priority queue is used to transmit AVB traffic, and the low-priority queue is used to transmit BE traffic. TT traffic occupies an independent buffer space inaccessible to other traffic types. Two types of the ET traffic share the remaining buffer space. To guarantee quality of service (QoS) for AVB traffic, a priority threshold is defined for lower-priority queues. When the shared buffer’s total queue length exceeds the preset threshold, only high-priority AVB frames are admitted, while low-priority BE frames are blocked. Existing low-priority frames in the buffer are transmitted following default egress rules. This ensures the real-time transmission of AVB traffic, reduces the delay of BE traffic, and reduces the overall blocking probability of the system.
Using a two-dimensional Markov chain [
47,
48] as the state space, this paper analyzes the performance of the priority queue threshold control strategy for mixed-critical traffic in TSN switches with shared buffers. Firstly, the two-dimensional Markov chain model is used to analyze and deduce the system performance, through metrics such as queue blocking probability, average queue length, and average queue delay. Compared to conventional one-dimensional methods, this method can greatly enhance the richness and detail of information in the queueing system, and show significant advantages in analytical precision. Secondly, the system model is analyzed through closed-form solutions of key performance indicators under multi-parameter conditions, exploring how parameters govern overall system behavior. Finally, mathematical tools establish a performance analysis model to uncover critical challenges in optimizing mixed-critical traffic performance. Based on this analysis, the optimal priority threshold for enhancing mixed-critical traffic transmission efficiency in time-sensitive networks is determined.
The remaining parts of the paper are organized as follows.
Section 2 gives the system model and provides the detailed process of the analysis.
Section 3 provides the numerical analysis results. Finally,
Section 4 concludes the paper.
2. System Model and Analysis
This section systematically models the transmission process of mixed-critical traffic at the output port of the TSN switch. First, the necessity of introducing the priority threshold mechanism into the system is analyzed. Then, a two-dimensional Markov chain is used as a mathematical tool to thoroughly discuss the system performance. Finally, through detailed calculations, the steady-state distribution of the system is derived, laying a theoretical foundation for system performance analysis and optimization in subsequent sections.
2.1. System Model
In the TSN switch, once a data frame arrives, it is directly buffered in the preset priority queue and waits for egress scheduling. The switch follows an established scheduling policy for dequeuing to ensure prioritized transmission of data frames in high-priority queues. The TSN network handles three traffic types: TT traffic occupies a private queue with a dedicated scheduling algorithm to guarantee transmission determinism, while the remaining queues transmit AVB and BE traffic. To optimize resource allocation, we consolidate these remaining queues into a two-priority system: a high-priority queue for AVB traffic and a low-priority queue for BE traffic, which share the memory space. Thus, the AVB and BE queues can be modeled as a shared-buffer switch supporting QoS differentiation [
49,
50].
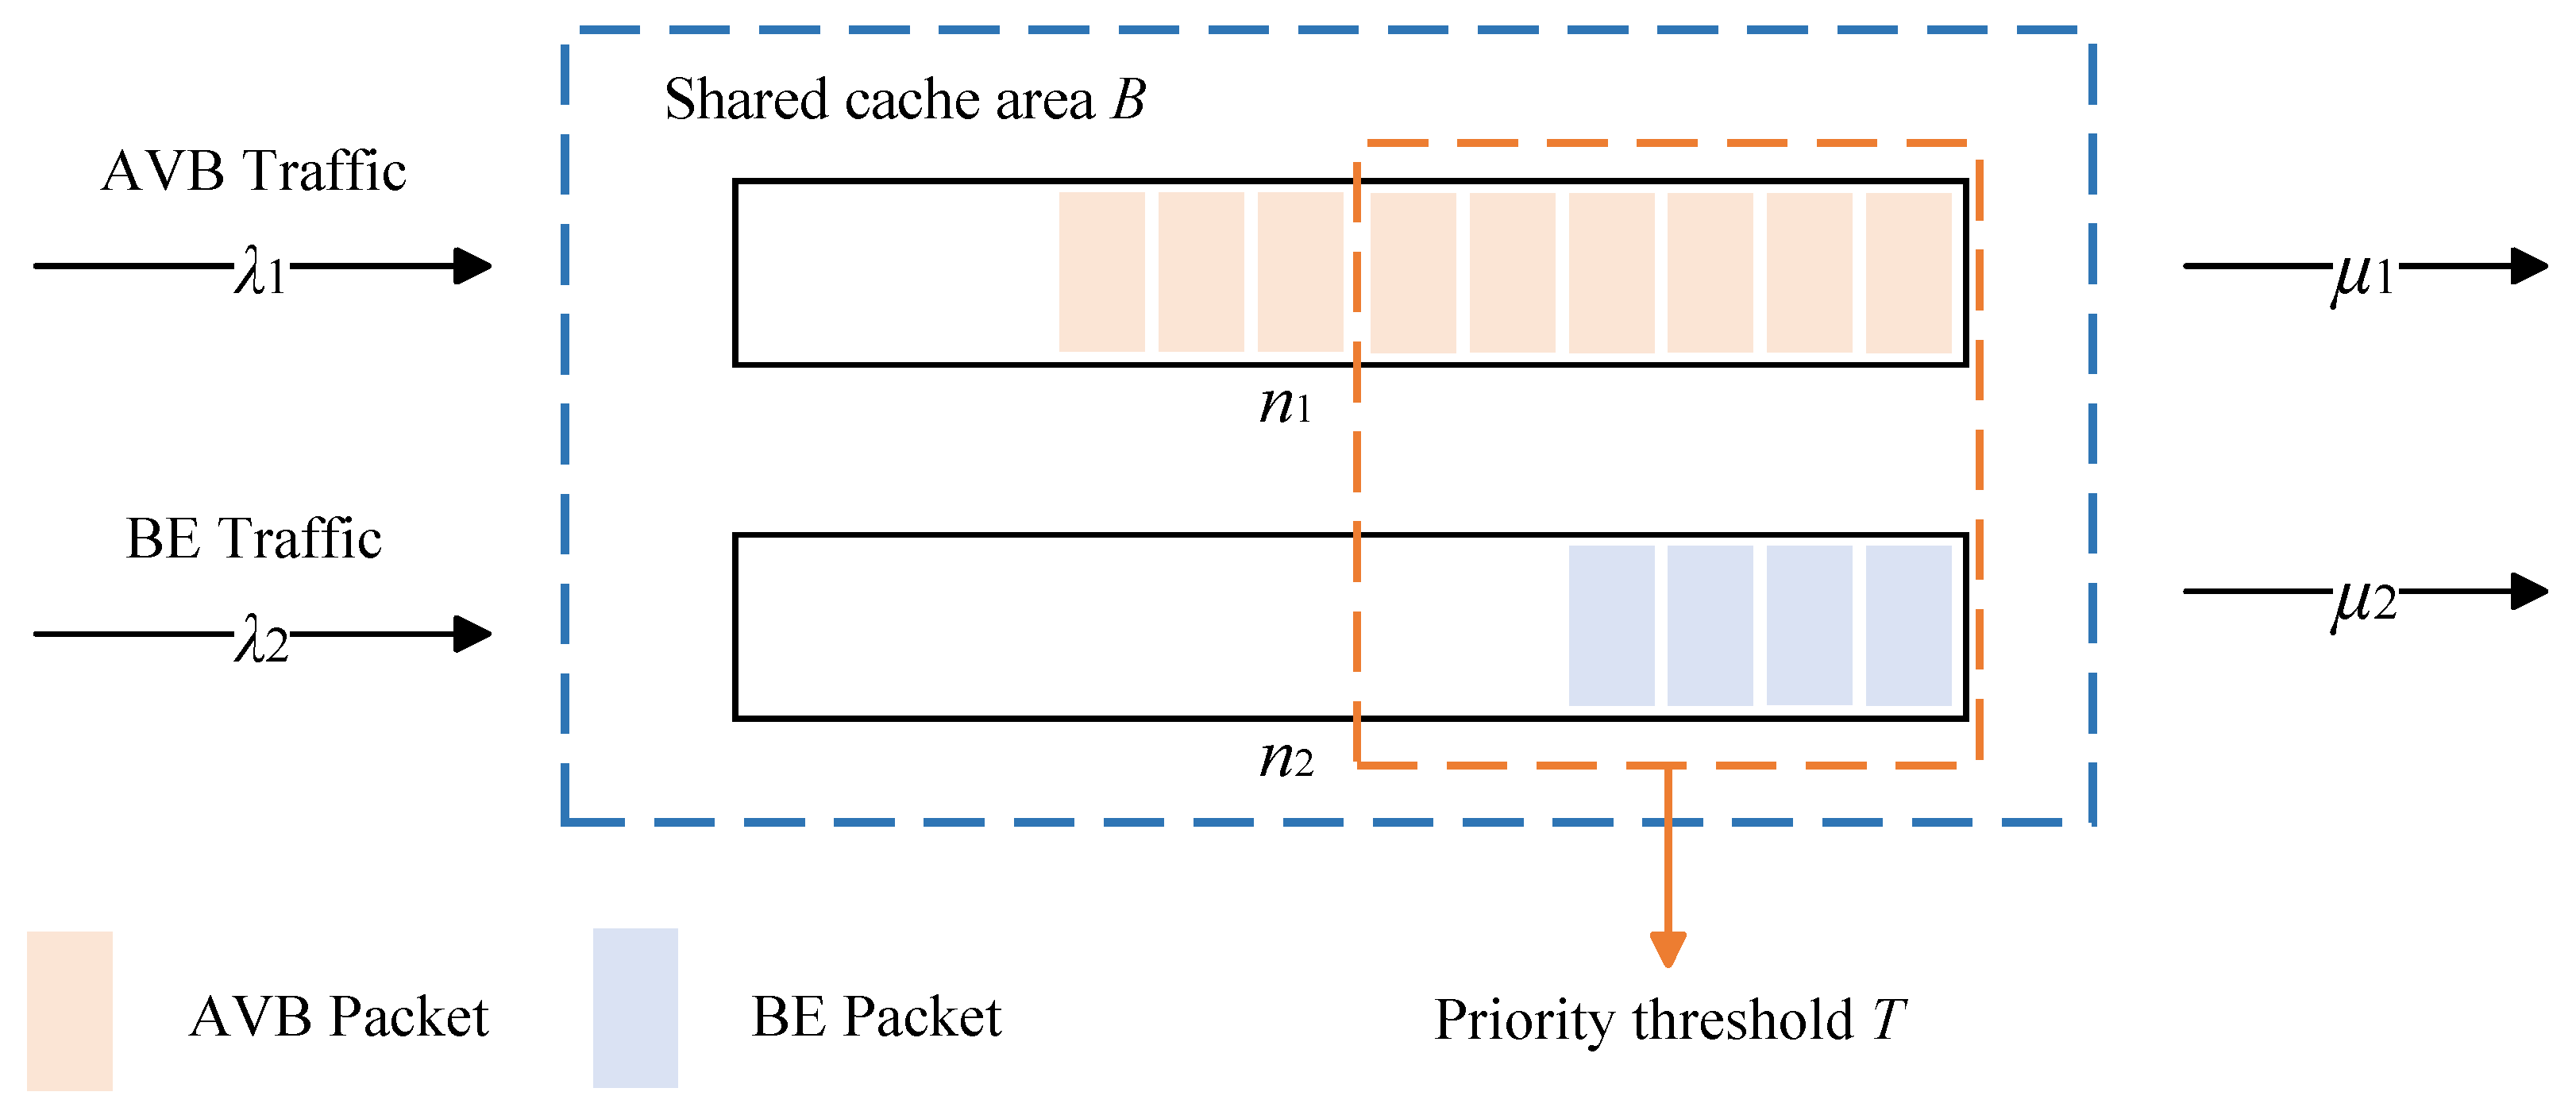
The queuing model of the TSN switch with multiple priority output queues is shown in
Figure 2. The size of the shared buffer space of the entire output queue is
B. The packet arrival rate of the high-priority queue is a Poisson process with rate
, and the service time follows an exponential distribution with parameter
. Similarly, the packet arrival rate of the low-priority queue is a Poisson process with rate
, and the service time follows an exponential distribution with parameter
. In addition,
indicates the length of the high-priority queue,
indicates the length of the low-priority queue,
indicates the load of the high-priority queue, and
indicates the load of the low-priority queue. A priority threshold with value
T is set in the system. If the total queue length
exceeds
T, low-priority traffic is blocked from entering the system.
The system can be modeled as a two-dimensional Markov chain, whose state space can be expressed as
. The steady-state distribution of the system is
where
G is a normalization constant that ensures
is a probability distribution
2.2. Buffer Occupancy Without Priority Threshold
In this model, the high-priority queue is assigned a higher service rate than the low-priority queue, thus high-priority queues are dequeued faster than low-priority queues. When the shared buffer lacks a priority threshold, after the system reaches steady state, it can be expected that low-priority data frames will accumulate in the shared buffer, reducing the available buffer space for high-priority packets. Consequently, the transmission of high-priority packets is severely degraded. Additionally, the queuing delay of the low-priority queue will significantly increase. While high-priority data frames are designed to achieve low latency and high service quality, a shared buffer without a priority threshold directly contradicts this objective.
Here, we will illustrate the necessity of setting a priority threshold for low-priority queues through two parts of numerical analysis.
In the first part of numerical analysis, we analyze the occupancy ratio of low-priority data frames in the shared buffer (without a priority threshold) when the total queue length reaches the maximum threshold
B. When the shared buffer is full (i.e.,
), combined with the analysis method for the steady-state distribution of Markov chains in [
51], the steady-state distribution of the system is:
Then, the average queue length of low priority in the shared buffer is
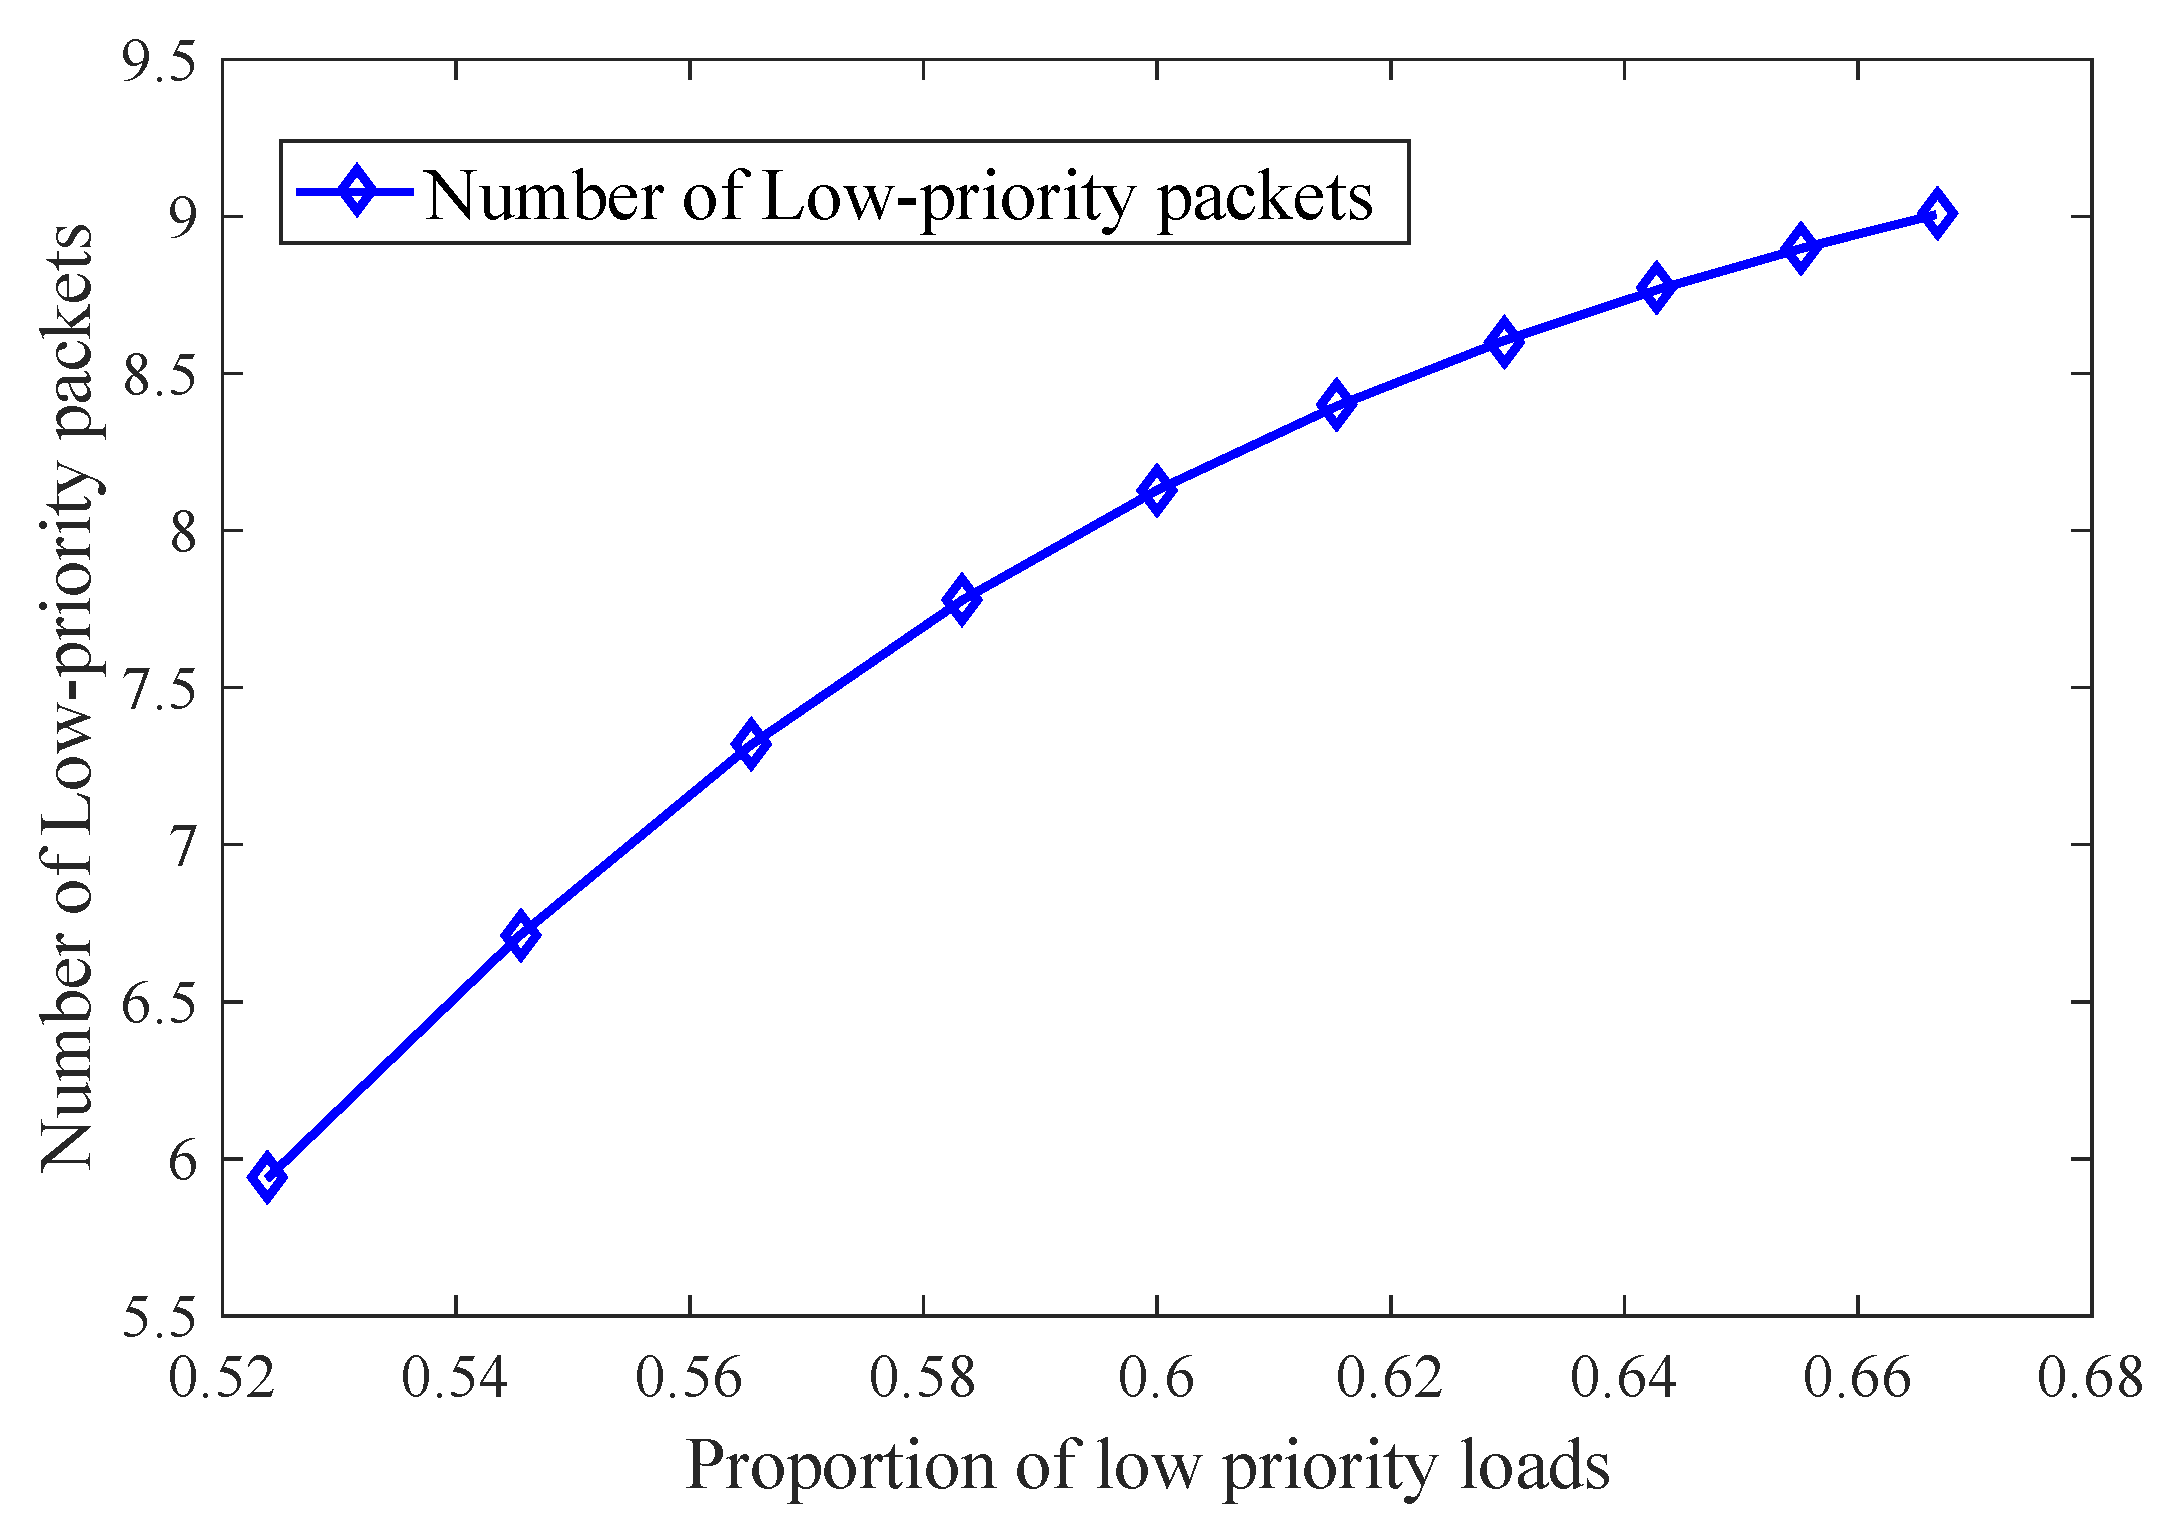
When no priority threshold is applied, the relationship between the low-priority average queue length and the proportion of low-priority queue load is shown in
Figure 3, where the proportion of low-priority queue load is
and the shared buffer space is
. As can be seen from the figure, the low-priority average queue length increases with the proportion of low-priority loads. The results indicate that without controlling the enqueuing of low-priority traffic, a large amount of ET traffic flooding into the system causes low-priority BE traffic to occupy significant shared buffer space due to slow dequeueing speed, thereby drastically reducing the buffer space available for high-priority AVB traffic and degrading the transmission of AVB traffic with higher real-time requirements.
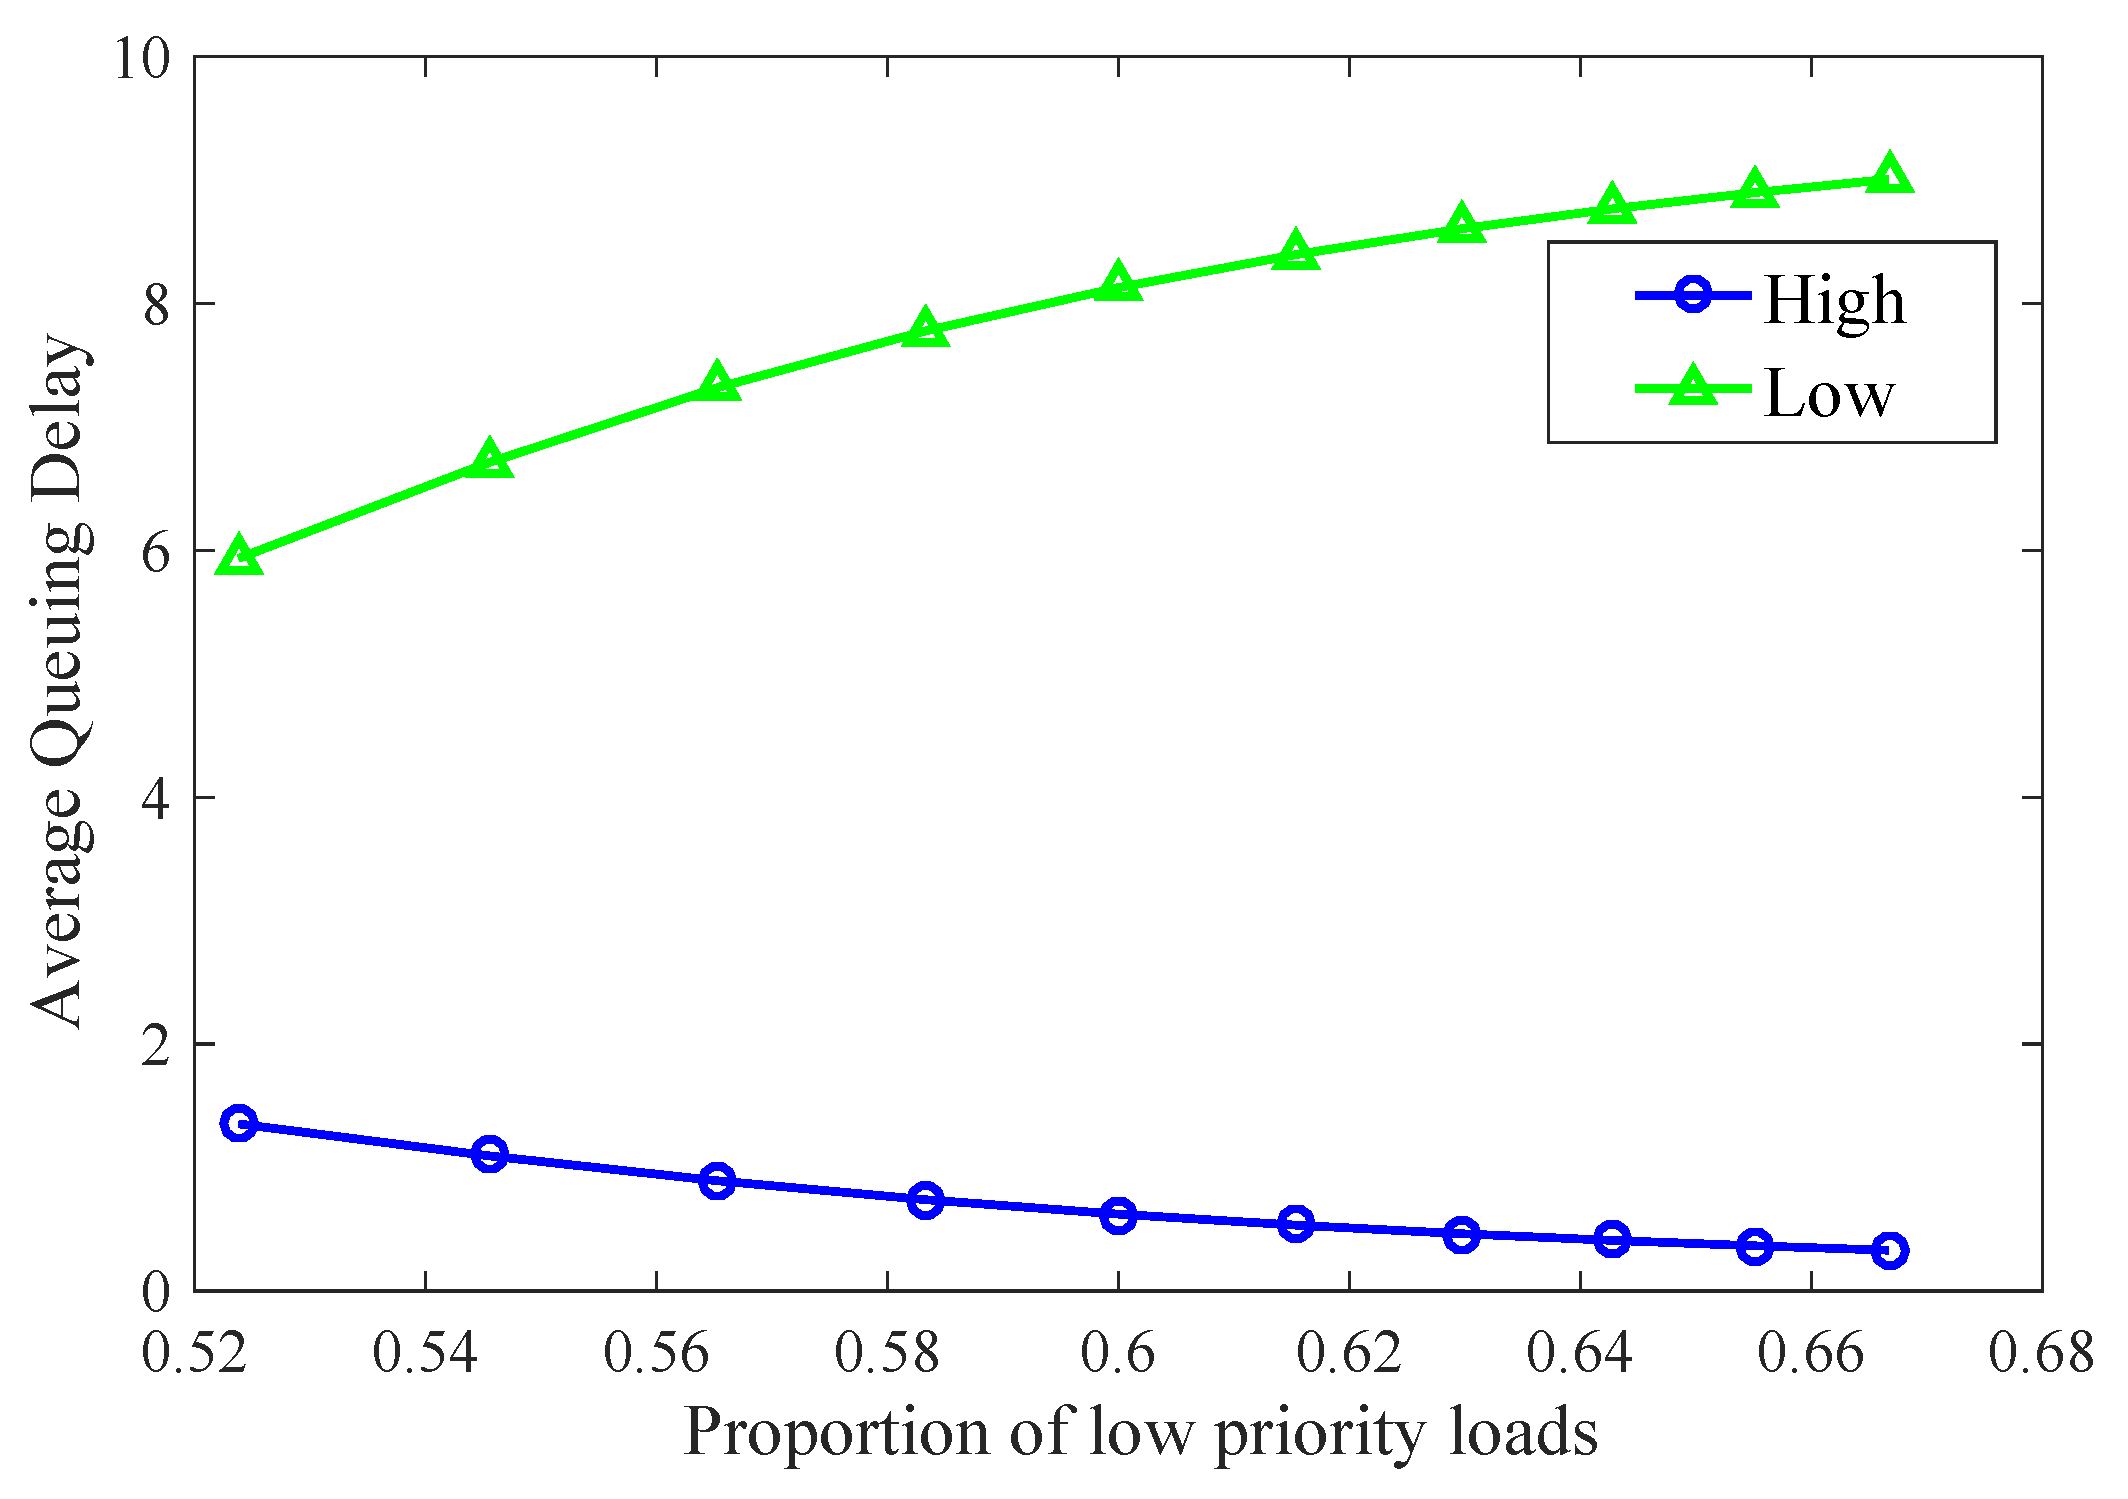
In the second part of the numerical analysis, we analyzed the average queuing delay of high-priority and low-priority queues without a priority threshold, and obtained the numerical analysis results shown in
Figure 4. When no priority threshold is applied and the whole shared buffer is completely shared by high- and low-priority data frames, the average queue length of the high-priority queue is
and the average queue length of the low-priority queue is
, which is expressed as follows:
According to Little’s Law [
52], the average queuing delay of the high-priority queue
and the average queuing delay of the low-priority queue
can be expressed as follows:
Figure 4 illustrates the relationship between the average queuing delay of the two-priority queues and the proportion of low-priority load. As shown in the figure, the average queuing delay of low-priority queues increases as the proportion of low-priority load rises. The results demonstrate that without restricting low-priority data frames’ access to the shared buffer, their queuing delay increases dramatically, reaching values tens of times higher than those of high-priority queues.
In summary, setting a priority threshold for low-priority queues to regulate their access to the shared buffer is both critically important and theoretically justified.
2.3. Analysis of Priority Threshold Mechanism
In this section, we analyze the behavior of a low-priority queue with a priority threshold T. A two-dimensional Markov chain is employed to model the queuing system, where the state space represents the lengths of the high-priority queue and the low-priority queue within the shared buffer.
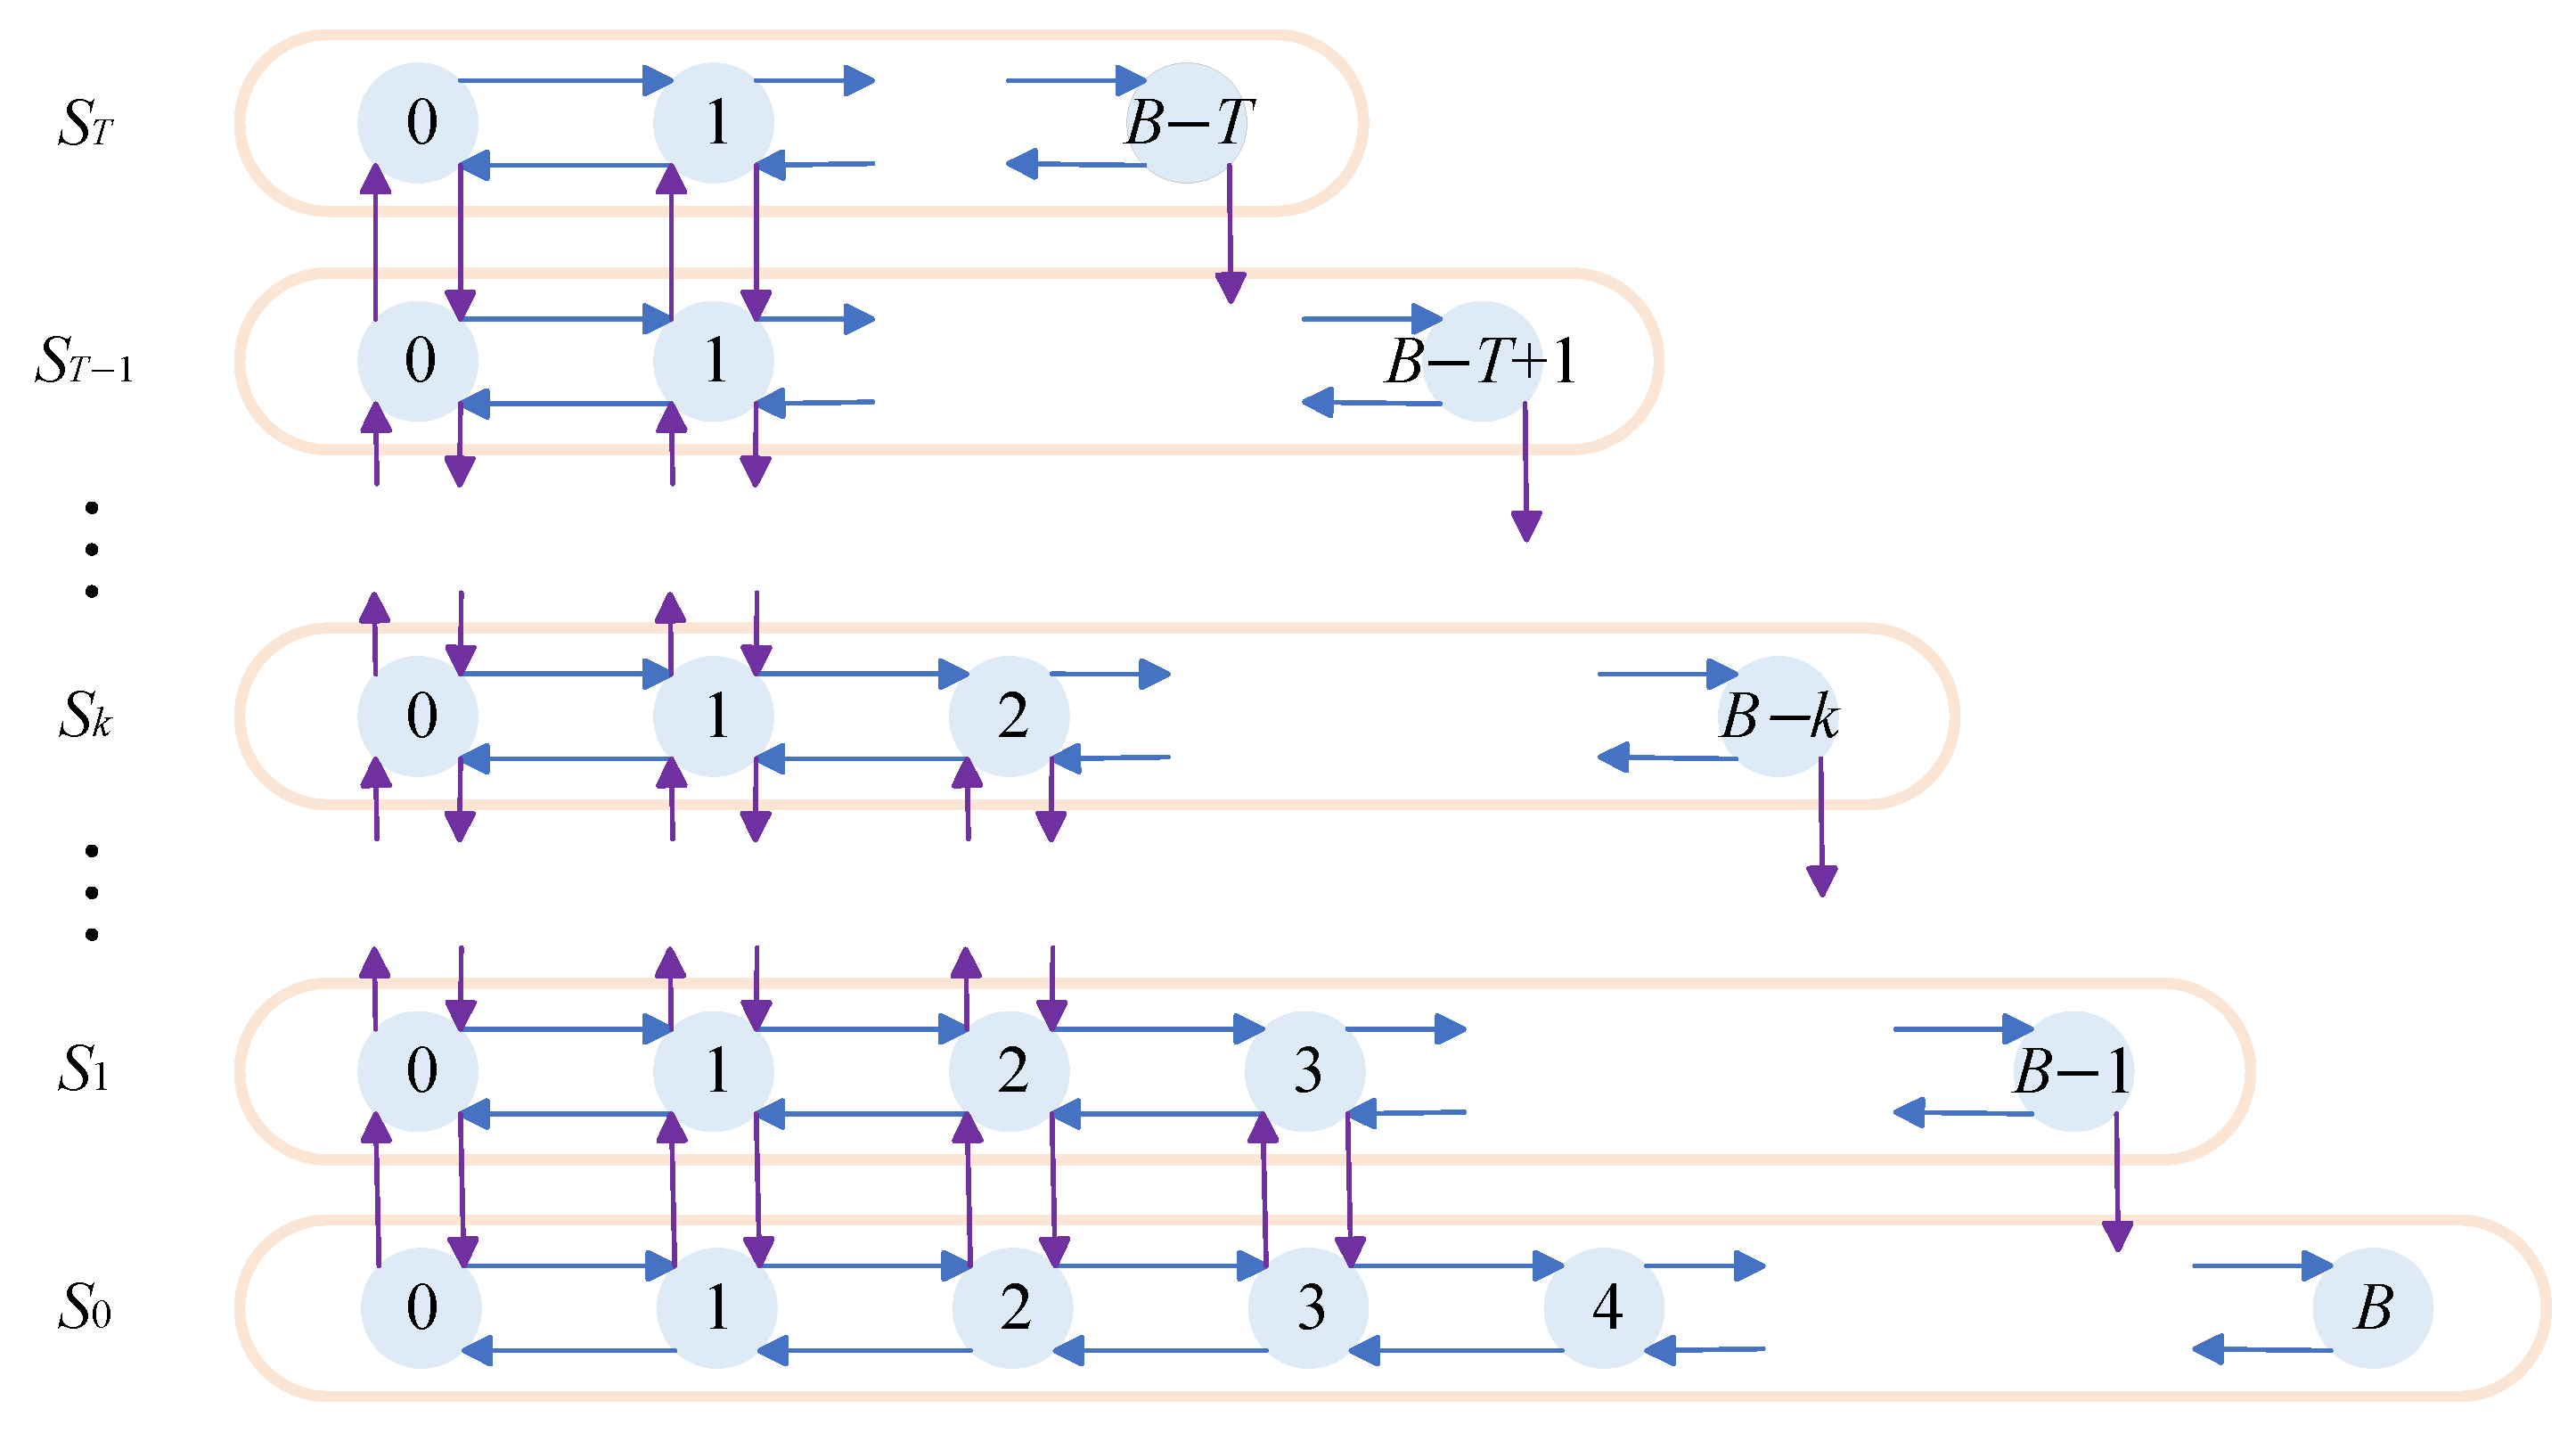
As shown in
Figure 5, the horizontal axis represents state transitions of high-priority data frames, and the vertical axis represents state transitions of low-priority data frames. When the total queue size is
, both low- and high-priority data frames can be queued in the buffer. When the total queue size is
, the low-priority data frame cannot enter the buffer queue, and the low-priority data frame already in the buffer is dequeued normally according to the original dequeuing rule. When the total queue length is
, all data frames cannot enter the buffer.
Based on the queuing rules described above, key system performance metrics—including queue blocking probability, average queue length, and average queue delay—are analyzed and derived through a two-dimensional Markov chain model. By calculating the system’s steady-state distribution and incorporating all state space behaviors, the blocking probability of each priority queue is derived. An average weighted packet loss rate is then introduced to quantify the system’s overall blocking probability. The average queue length for each priority queue is calculated using the marginal distribution probability of the queue length in the steady state. Similarly, the average delay for each priority queue is derived via Little’s theorem based on the corresponding average queue length. These results demonstrate that determining the system’s steady-state distribution is the critical step for computing its core performance metrics.
2.3.1. Steady-State Distribution of the System
Theoretically, the exact steady-state distribution of a two-dimensional Markov chain under a finite buffer size can be obtained by constructing a global balance equation system and solving the corresponding linear system. Taking a specific buffer size
as an example,
denotes the steady-state probability of the state
. The system contains nearly 100 independent states in total. The corresponding linear system to be constructed must satisfy the global balance conditions, namely “the sum of steady-state probabilities of all states equals 1” and “the inflow probability of each state equals its outflow probability”, and eventually forms a linear system with approximately 100 equations, as shown below:
However, although such a solution method based on the global balance equation system can yield a theoretical solution through numerical methods like Gaussian elimination, as the buffer size B increases, the number of system states grows quadratically. This directly leads to a sharp expansion in the scale of the linear system, which in turn causes severe computational complexity issues in the solution process. It not only requires a large amount of storage space to store the coefficient matrix and variable vectors of the equation system, but also demands extremely high computational resources to complete matrix operations and iterative solving. Ultimately, this results in extremely low engineering feasibility for exact solutions.
Therefore, to solve the problem of finding the system’s steady-state distribution of the two-dimensional Markov chain, this paper adopts the truncated chain method to achieve an efficient approximate solution. By doing so, it decomposes the two-dimensional state space (which originally contains two variables) into two one-dimensional state spaces, each containing only a single variable. The two-dimensional Markov chain is horizontally truncated into T one-dimensional truncated chains, each with a single variable as its state space. Subsequently, each of these truncated chains is regarded as a state point, and all truncated chains are synthesized into a single aggregated one-dimensional chain with a single variable as its state space. With the help of the properties of one-dimensional Markov chains, we can calculate the stationary probability of a truncated chain in the aggregate chain and the stationary probability of a state of the truncated chain. By multiplication of the two, we can get the stationary probability of the state point in the two-dimensional Markov chain. When the system reaches a stable state after a long period of operation, the stationary probability of the point is converted to the expected proportion of the point in the two-dimensional state chain and can be further approximated as the steady-state distribution of the system. Therefore, the problem of the system steady-state distribution of two-dimensional Markov chains is transformed into the problem of solving the stationary probability of a certain truncated chain and the stationary probability of a certain state of the truncated chain in the aggregate chain.
Firstly, we solve for the stationary probability
of a certain state of the truncation chain. The two-dimensional Markov chain is truncated horizontally, as shown in
Figure 6, and
T truncated chains with state space
are obtained.
Defining
as the set of states
, the horizontally truncated chain with state space
is shown in
Figure 7.
is a one-dimensional Markov chain, with its state space determined by the length
of a high-priority queue.
We denote by
the stationary probability of state j of the truncated chain
. From the detailed balance equation and the equation indicating that the sum of stationary probabilities of all states is 1, we obtain
Thus, we can obtain the stationary probability of any state within the truncated chain
as
Secondly, we solve for the stationary probability
of a certain truncated chain in the aggregated chain. As shown in
Figure 8, the state transition diagram of the aggregated chain for this system model is a one-dimensional Markov chain with only one state variable, which is generated by state transitions between T truncated chains. The state space variable of this aggregated chain is the length
of the low-priority queue.
We denote by
the transition probability from the truncated chain
to the truncated chain
, and by
the transition probability from the truncated chain
to the truncated chain
, which is also the transition probability of the aggregated chain. Then,
where
represents the one-step transition probability from the truncated chain in which state j is located to the truncated chain in which state i is located.
We denote by
the stationary probability of the truncated chain
within the aggregated chain. When the aggregated chain reaches its stationary state, we can establish equations based on the detailed balance equation and the constraint that the sum of the stationary probabilities of all truncated chains equals 1. Therefore, we have
Thus, we can obtain the stationary probability of any truncated chain within the aggregated chain as follows:
Finally, we solve for the steady-state distribution of the system. By multiplying the stationary probability
of a particular truncated chain within the aggregated chain by the stationary probability
of a specific state within that truncated chain, we can obtain the steady-state distribution of the entire system as follows:
2.3.2. Blocking Probability for Two Priority Queues
When the total queue length reaches the maximum threshold B, blocking occurs in the high-priority queue, and
is used to denote the blocking probability of the high-priority queue. When the total queue length reaches the priority threshold T, blocking occurs in the low-priority queue, and
is used to denote the blocking probability of the low-priority queue.
2.3.3. Average Queue Length and Delay
We need to obtain the average queue length and queue delay of the high-priority queue and the low-priority queue, respectively. The marginal distribution of the high-priority queue length is
The marginal distribution of the low-priority queue length is
After obtaining the marginal distributions of the queue lengths for each priority, we can then calculate the average queue lengths for the high-priority queue and the low-priority queue, respectively, using the following formulas:
By applying Little’s theorem, we can obtain the average delays for both the high-priority queue and the low-priority queue as follows:
2.3.4. Overall Blocking Probability
We introduce the system’s average weighted packet loss rate as a measure of the overall blocking probability of the system, denoted as
, as follows:
where
is the weight of the high-priority queue and
is the weight of the low-priority queue. From the above equation, it can be seen that the value of the system’s overall blocking probability
is related to the weights of the high- and low-priority queues. Additionally, the system’s overall blocking probability
may also be related to the input traffic. We aim to optimize the overall performance of the system, which requires minimizing the system’s overall blocking probability
. In this situation, the value of threshold
T is the best priority threshold value.
3. Numerical Results
Based on the analysis and derivations in
Section 2, this chapter will conduct numerical analysis on the main system performance indicators. Subsequently, by adjusting the relevant parameters that influence these performance indicators, the aim is to optimize system performance. On this foundation, the optimal priority threshold value is determined in order to attain optimal system performance. Finally, a comparative analysis is carried out between the proposed priority threshold management mechanism and other shared buffer management mechanisms to provide valuable references for network performance optimization in practical applications.
3.1. Accuracy Evaluation of the Truncated Chain Method
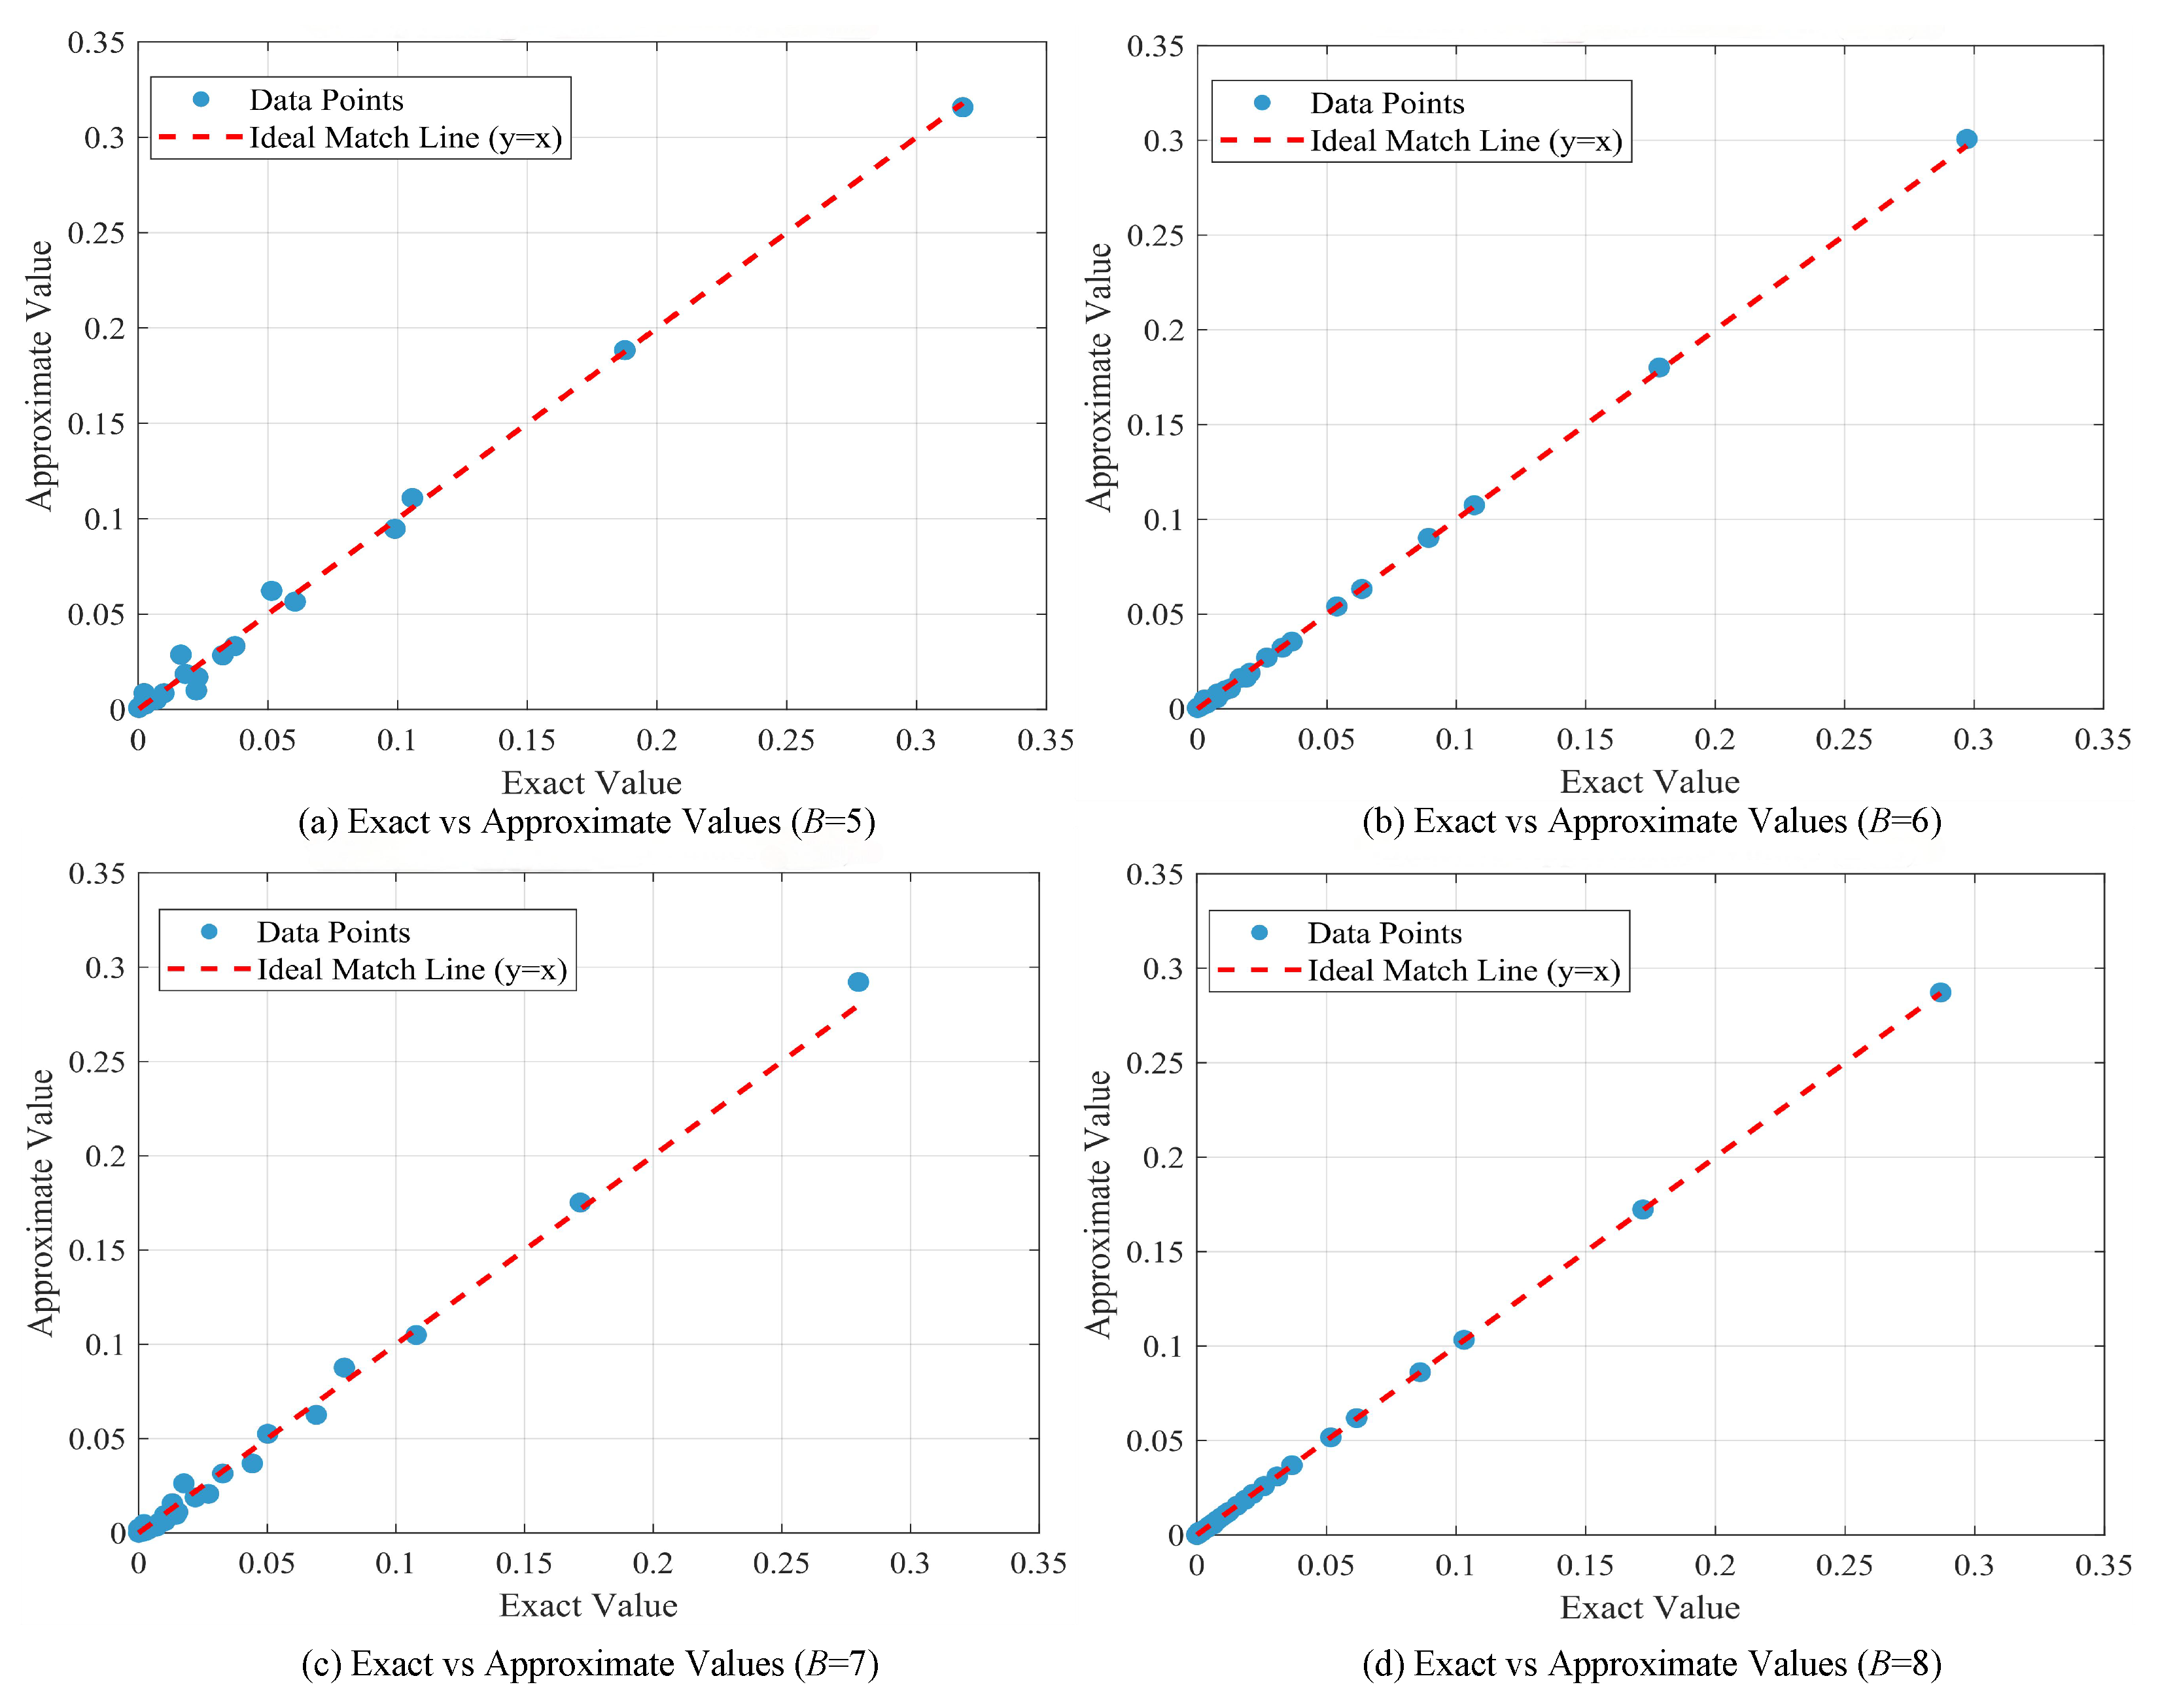
To systematically validate the accuracy and reliability of the truncated chain method adopted in this paper for approximating the steady-state distribution of the two-dimensional Markov chain, we specifically designed and conducted a series of baseline tests for scenarios with small buffer sizes. Buffer sizes of
,
,
, and
were selected. Under the traffic scenario with a high-priority traffic load of
and a low-priority traffic load of
, the system’s steady-state probability distribution was solved via two distinct approaches. On one hand, we employed the classical Gaussian elimination method to solve the system’s global balance equations exactly, thereby obtaining the precise steady-state distribution
as the benchmark reference. On the other hand, the truncated chain method proposed in this paper was applied for computation, yielding the corresponding approximate steady-state distribution
.
Figure 9 visually presents and compares the complete steady-state distribution results obtained from both methods across all state points, showing a high degree of consistency in both overall shape and local details.
To further quantitatively evaluate the error level of the truncated chain approximation,
Table 1 in this paper details three key performance metrics: root mean square error (RMSE), mean absolute error (MAE), and Pearson correlation coefficient (PCC). Analysis of these metrics reveals that for all tested buffer sizes, the RMSE and MAE values between the approximate and exact solutions remain stably controlled below 1%, while the PCC value consistently maintains an extremely high level above 99%. Therefore, the truncated chain method employed in this paper demonstrates high reliability, and the steady-state distribution of the two-dimensional Markov system obtained by this method can effectively substitute for the exact solution method, which involves extremely high computational complexity.
3.2. Analysis of Blocking Probability of Each Priority Queue
In
Figure 10, the relationship between the blocking probabilities of different priority queues and the priority threshold factor
is illustrated under various proportions of low-priority load, where
. As can be seen from the figure, for any low-priority load ratio, as
rises, the blocking probability of the high-priority increases, while the blocking probability of the low-priority decreases. This is because when threshold
T is small, low-priority packets will occupy less shared buffer space and leaving more space for high-priority packets. Consequently, the blocking probability for low-priority packets is higher, while the blocking probability for high-priority packets is lower at this point. As
continues to increase, so does
T, causing low-priority packets to occupy more shared buffer space, leaving less space for high-priority packets. Therefore, at this stage, the blocking probability for low-priority packets decreases, while the blocking probability for high-priority packets increases.
We expect the blocking probability of the high-priority queue and the low-priority queue to be at a low level, but when T is small, it is beneficial to the transmission of the data frame of the high-priority queue. When T is large, it is beneficial for the transmission of low-priority queue data frames. Therefore, it is necessary to find an appropriate value of T, such that in this state, the high-priority and low-priority queue blocking probability are at a low level. It should be noticed that the blocking probability of the high-priority queue is always close to 0 until is above 0.9. Therefore, it is intuitive to infer that the priority threshold should not be set too small.
3.3. Analysis of Average Queue Length and Delay
Figure 11 shows the relationship between the normalized low-priority queue length and the priority threshold factor
. The normalization of the low-priority queue length is defined as
. For any low-priority load fraction, the fraction of low-priority packets rises as
rises. When
is increased to 1, that is,
, the low-priority group will occupy a large amount of shared cache space, especially for large traffic loads.
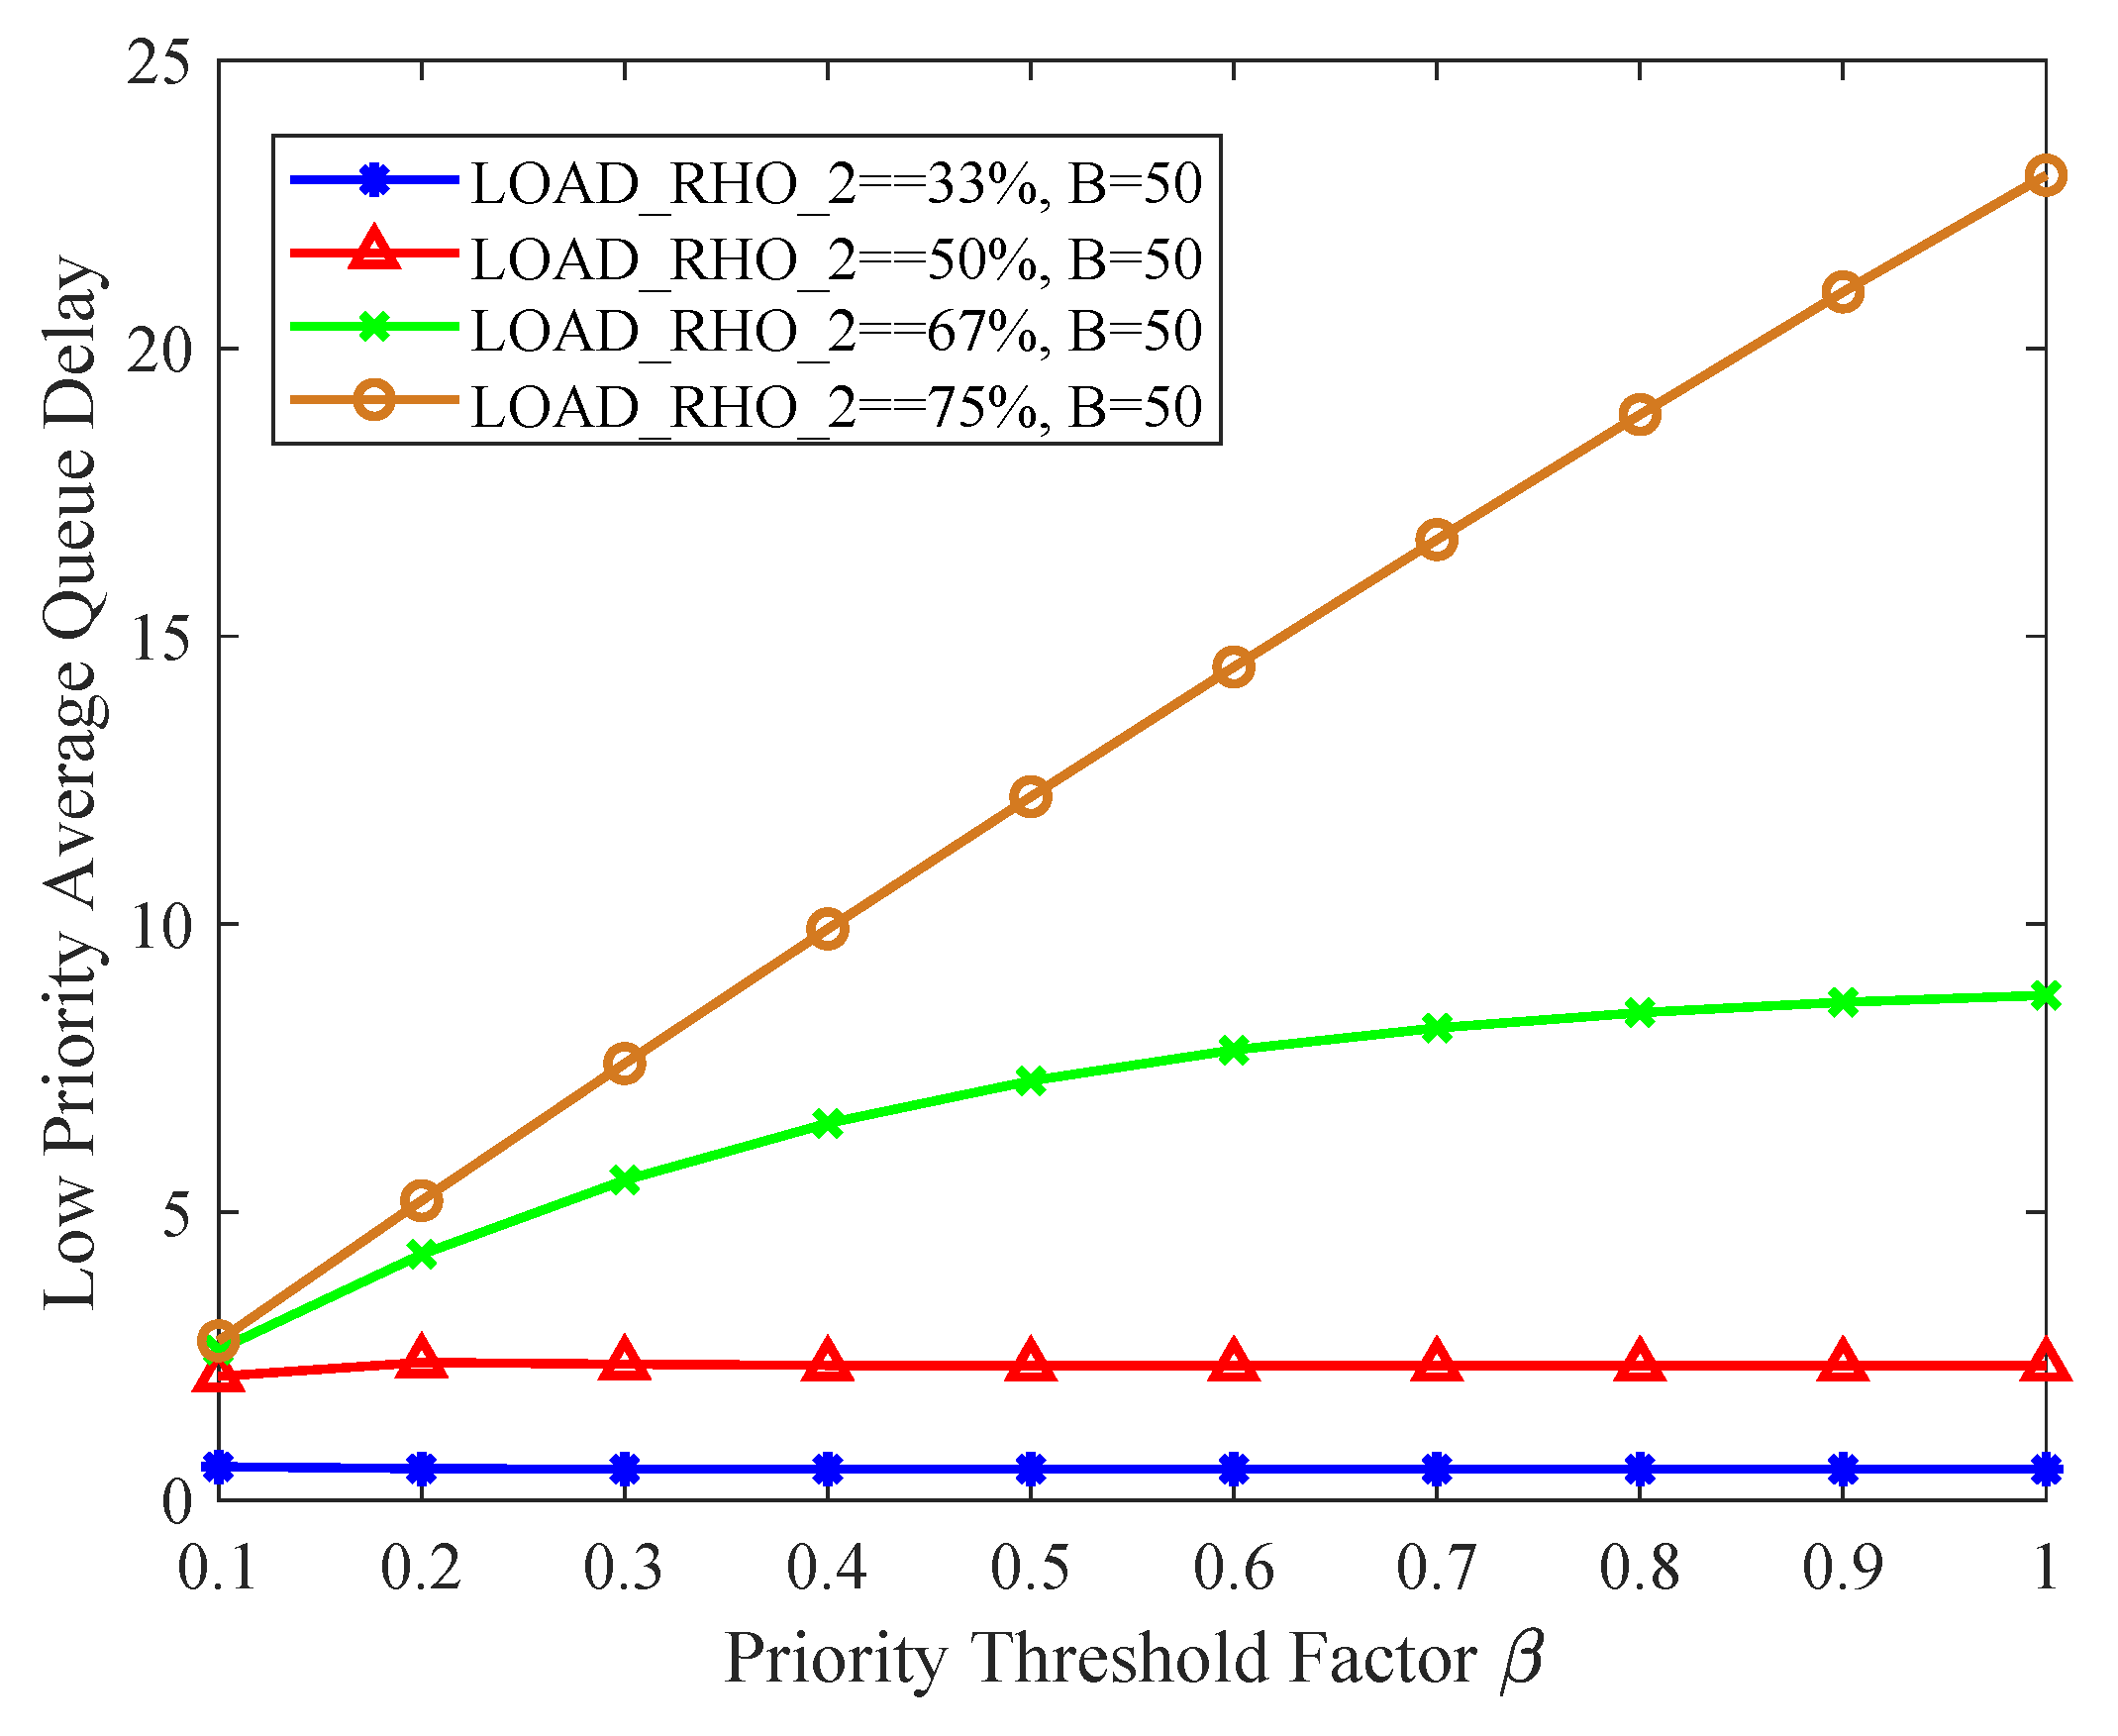
Figure 12 and
Figure 13 collectively illustrate the variation characteristics of the average delay of the low-priority queue with the priority threshold factor
. Specifically,
Figure 12 adopts the parameter
, while
Figure 13 further expands the parameter range to
to improve parameter exploration. Consistent variation patterns can be observed from the statistical results of the two figures: first, as the priority threshold factor
increases, the average delay of the low-priority queue shows a significant and stable upward trend; second, regardless of whether the parameter
B is set to 10 or 50, the overall average delay of the low-priority queue increases accordingly when the proportion of low-priority traffic in the total network traffic rises.
By analyzing the above numerical analysis results, we have concluded the necessity of setting an appropriate threshold value for the low-priority queue. This setting not only ensures that high-priority data frames receive priority processing and efficient transmission, thereby guaranteeing the timely delivery of critical information, but also creates a relatively stable transmission environment for low-priority packets. Even when resource allocation is tight, through a reasonable cache allocation mechanism, low-priority packets can still obtain the necessary transmission opportunities. As a result, it effectively reduces the phenomena of long waiting times or packet losses caused by resource competition, thereby enhancing the transmission efficiency and user experience of the entire network system.
3.4. Optimal Priority Threshold Value
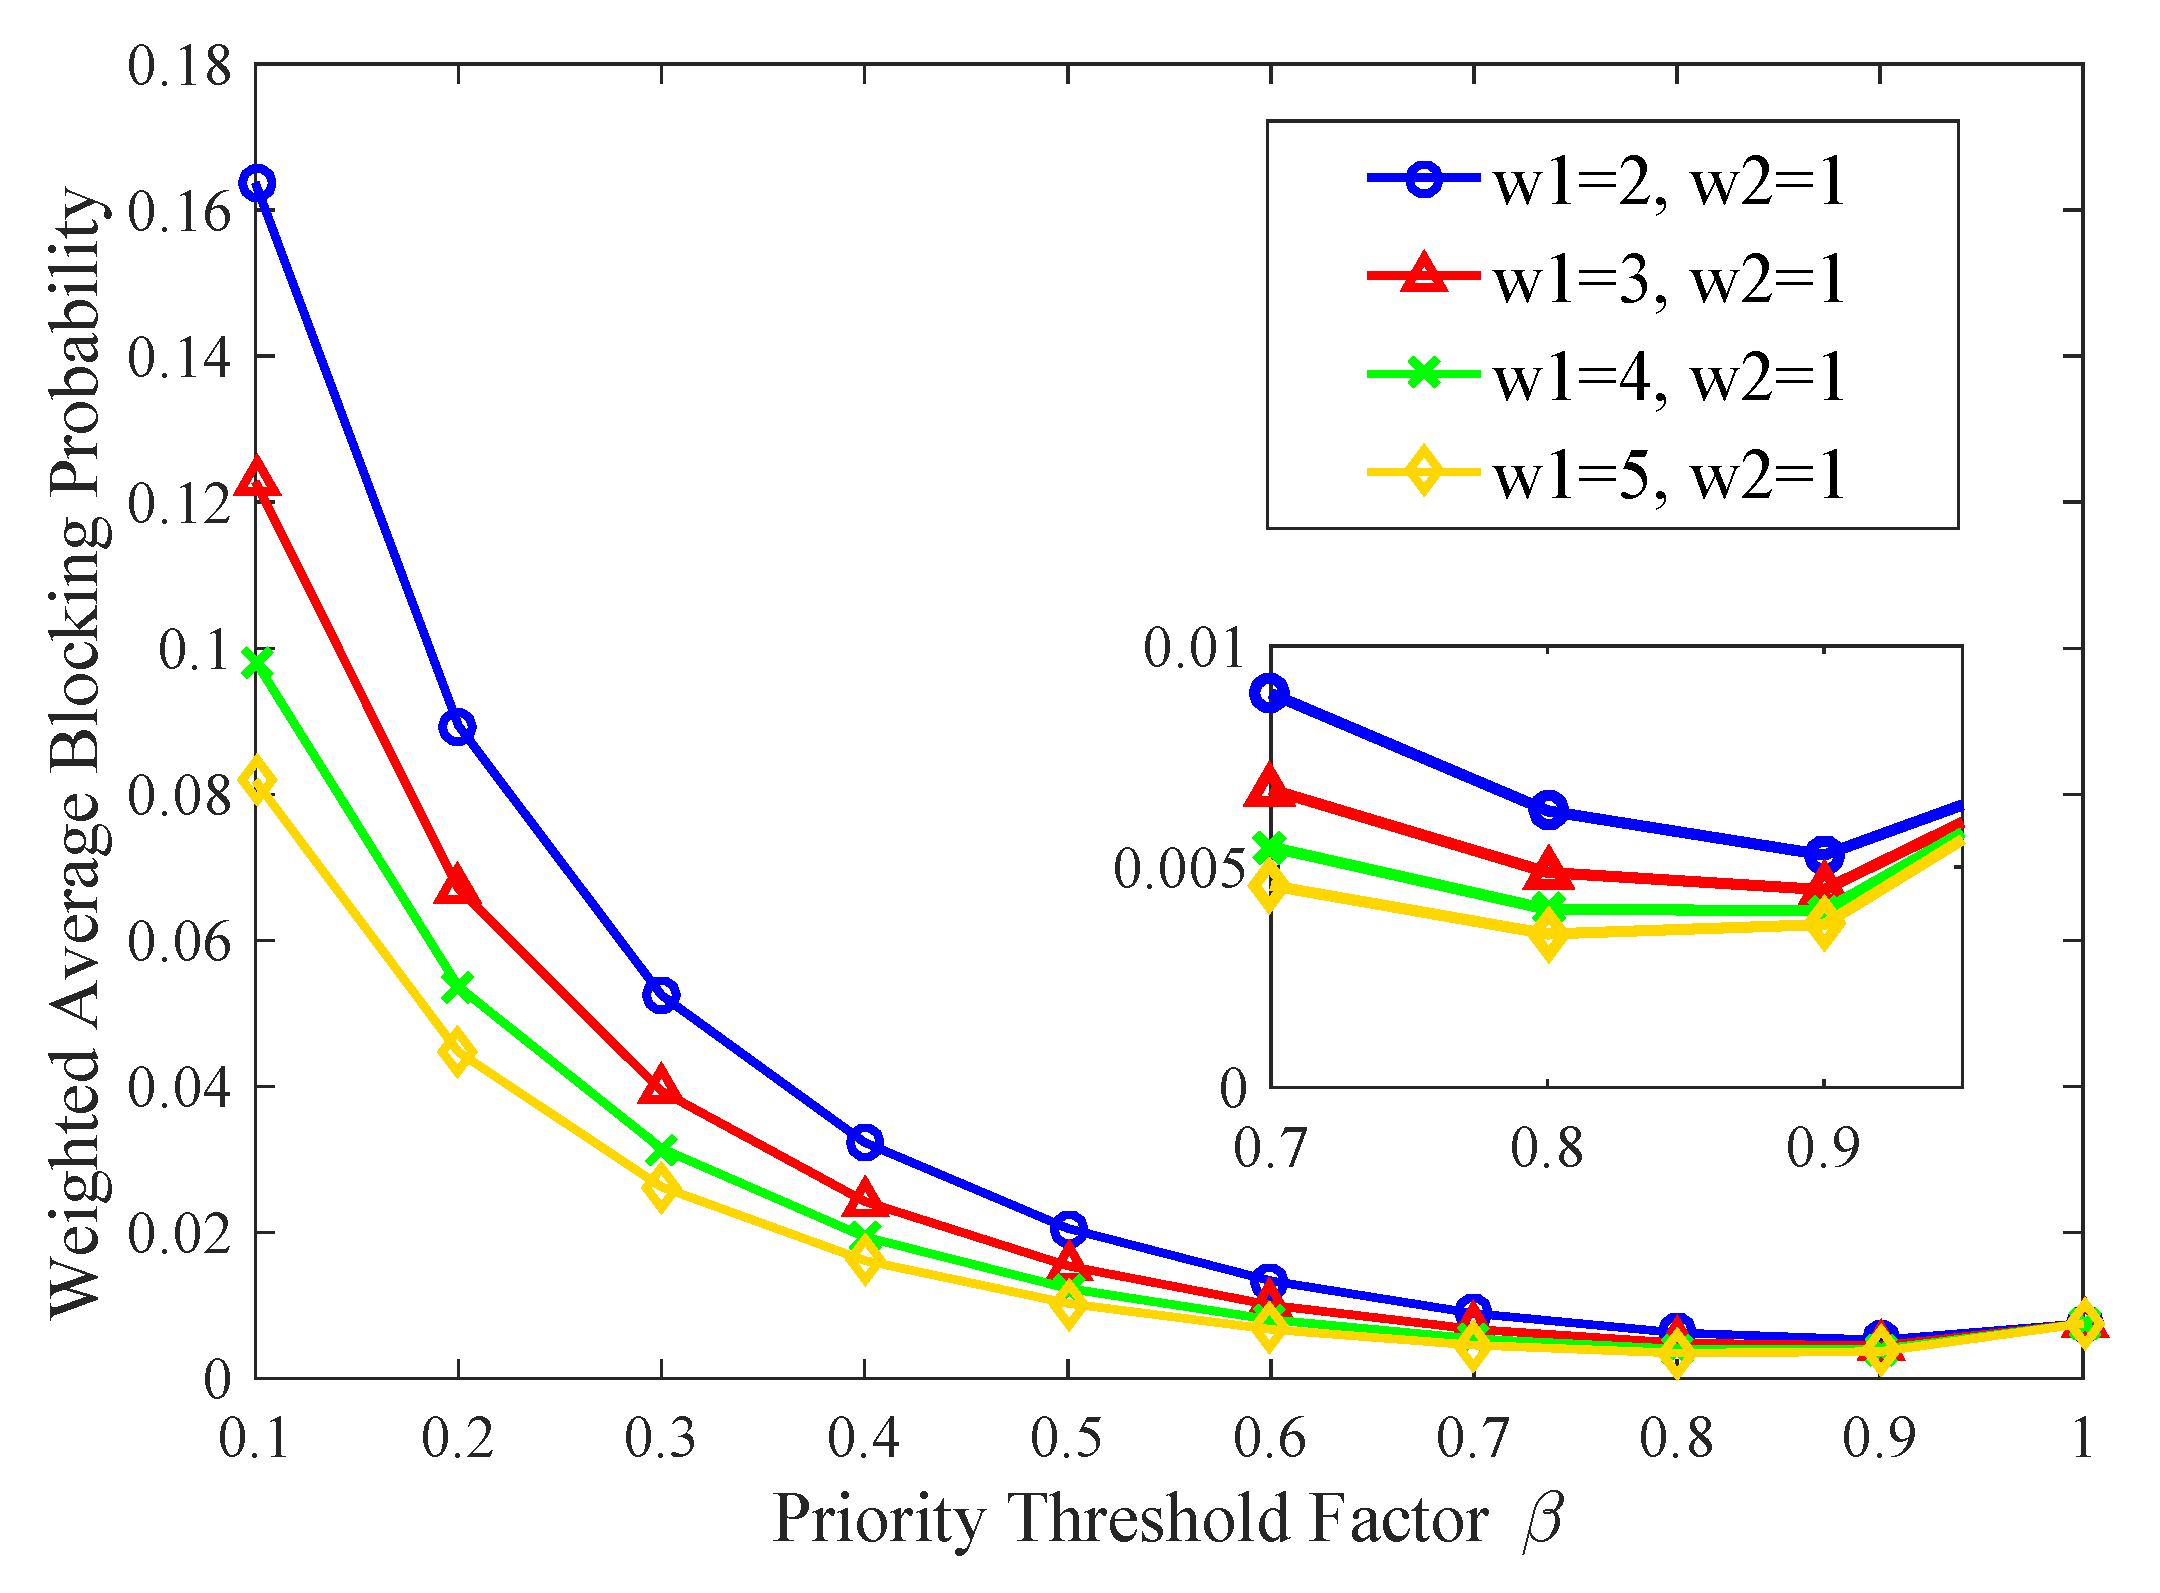
To evaluate the system’s overall blocking probability and determine the optimal threshold value, we perform two numerical analyses. In the first numerical analysis, we will explore the impact of adjusting the weight allocation between high- and low-priority queues on the overall blocking probability of the system under the condition of constant input traffic. According to the actual system behavior, we know that the weight of the high-priority queue should always be greater than the weight of the low-priority queue, that is, .
Figure 14 shows the different priority weights, the system weighted average blocking probability varying with threshold factor
. Under the condition that the proportion of low-priority load is 75%, the experiment sets the low-priority queue weight
and adjusts the high-priority weight
to 2, 3, 4, and 5, respectively, and the overall blocking probability
of the system varies with the threshold factor
. It can be seen from the figure that the average weighted packet loss rate of the system is smaller when the weight of the higher priority is larger under the same input traffic. As a whole, in the range of
, the average weighted blocking rate reaches the minimum, so the threshold
is obtained in this interval. Since the importance of high-priority services is to be higher,
T should be as small as possible.
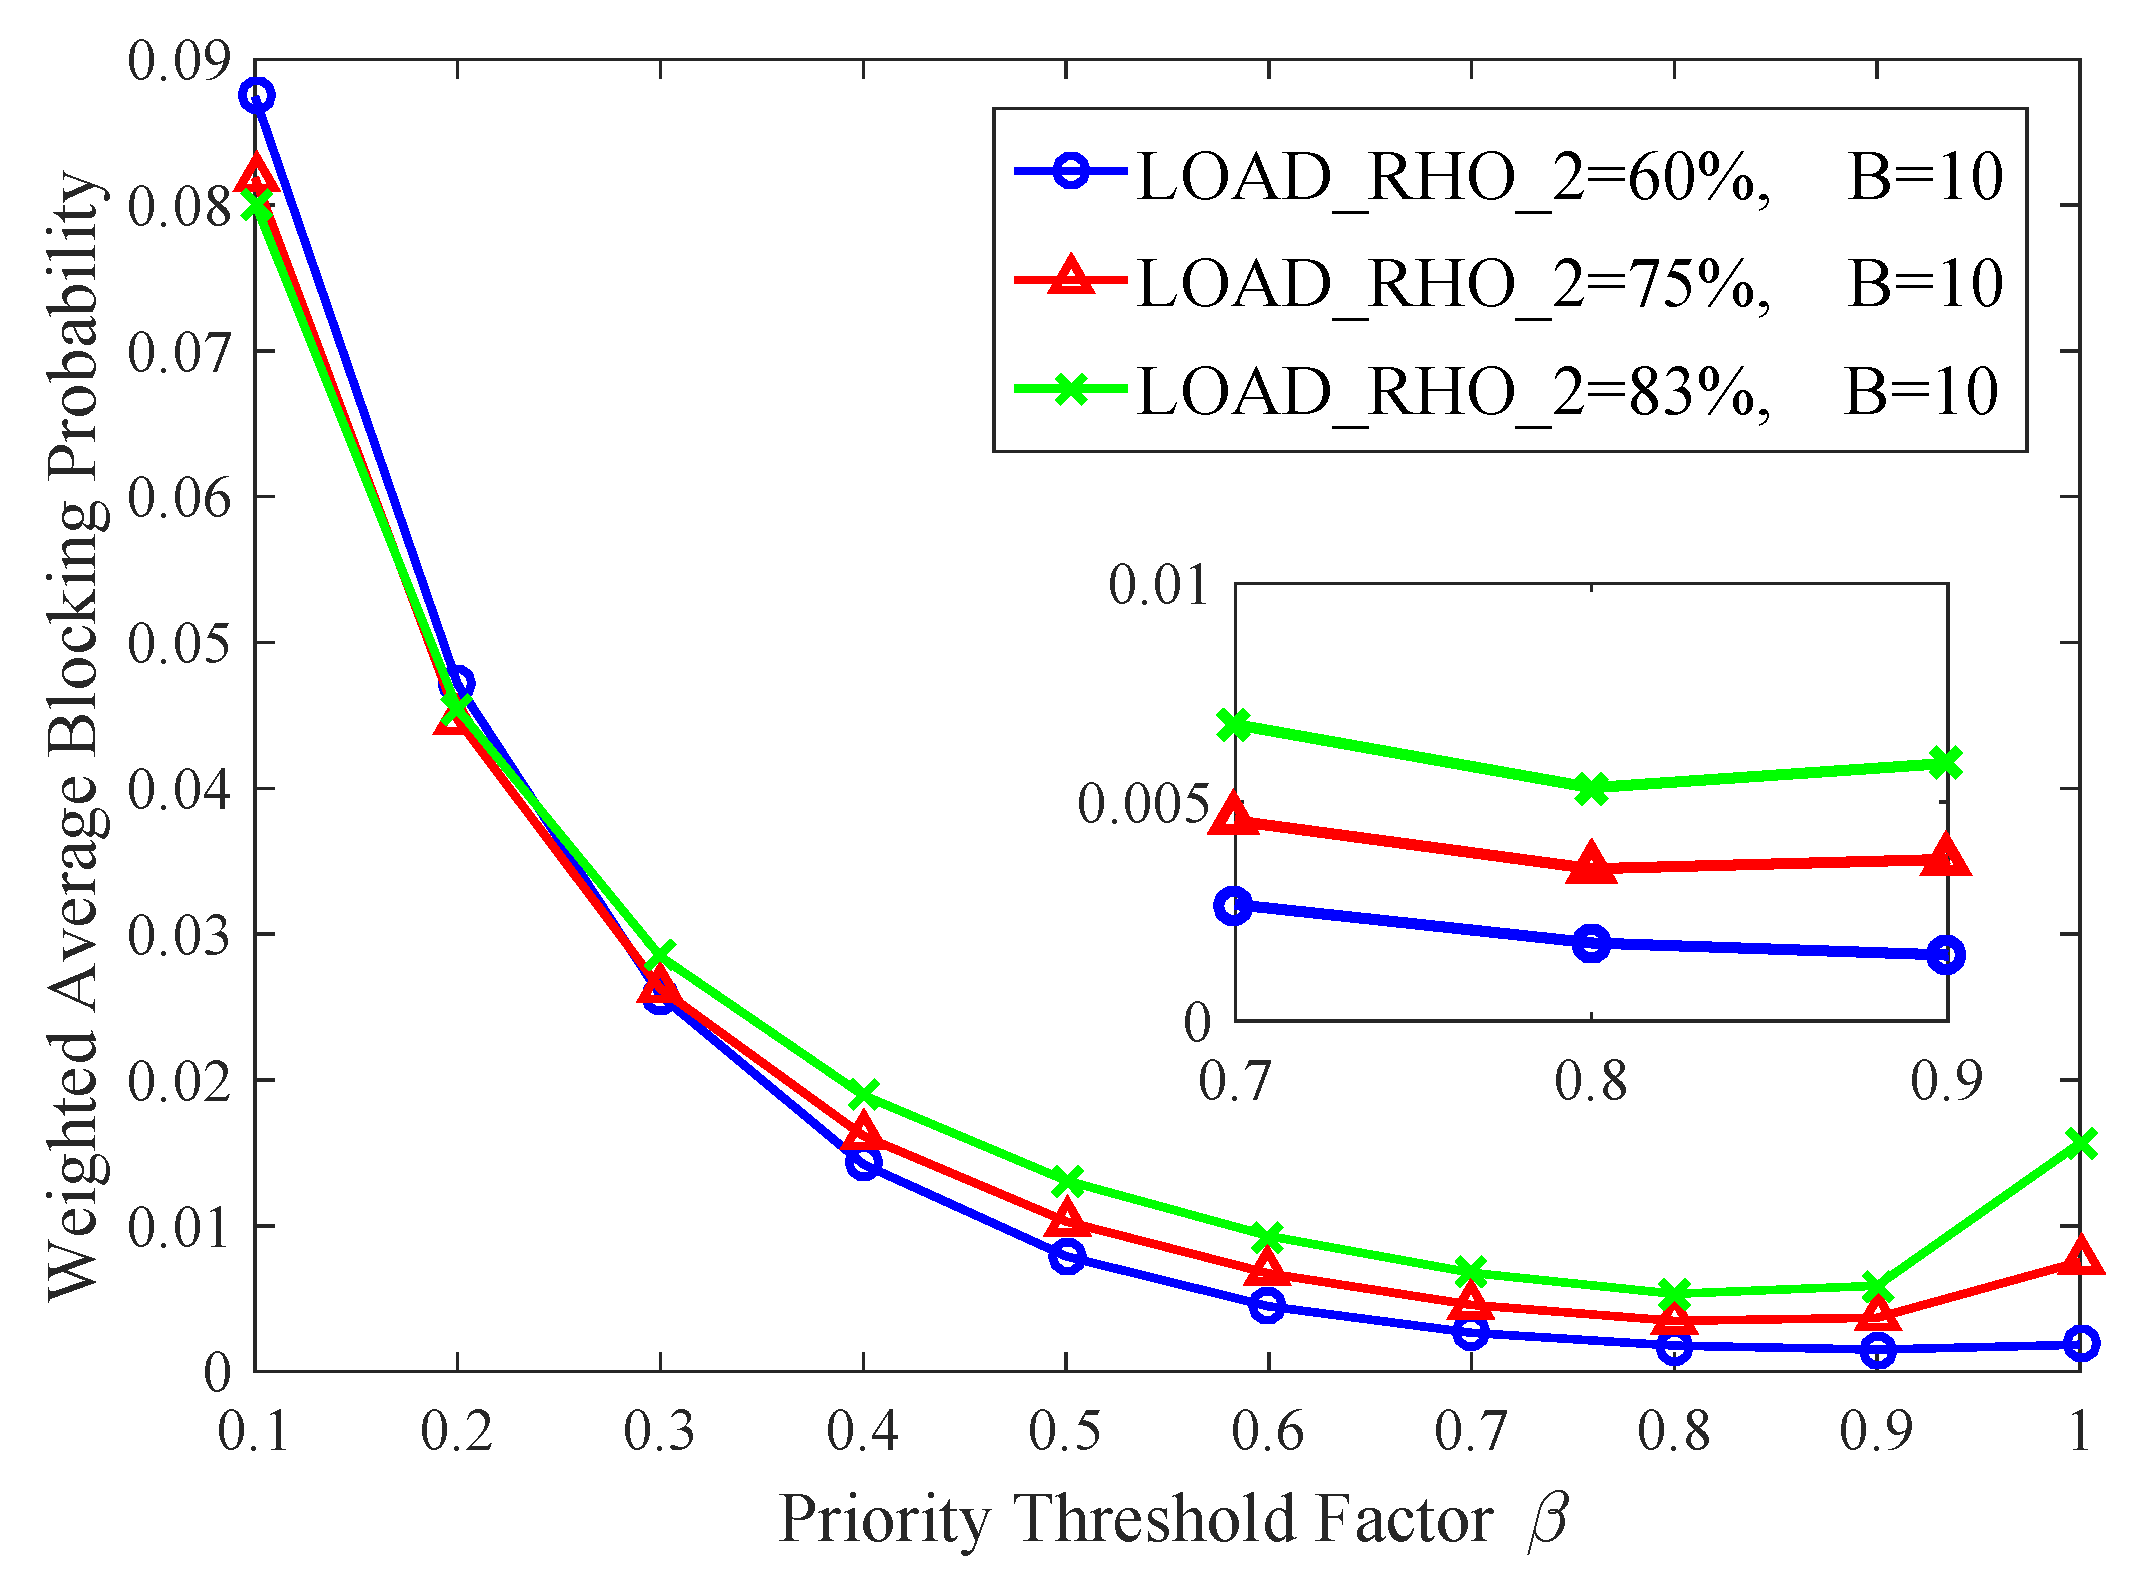
In the second numerical analysis, under the condition of constant high- and low-priority weights, the input traffic of the system is changed by adjusting the proportion of low-priority load to explore how the input traffic would affect the blocking probability of the system.
As shown in
Figure 15, two queues are set with weights
and
, respectively. This figure illustrates the relationship between the overall system blocking probability
and the threshold factor
under different traffic loads. From the figure, it can be observed that for any proportion of low-priority load, the overall system blocking probability decreases as the threshold factor
increases, reaching a minimum value before subsequently increasing with further increases in
. Moreover, within the range of approximately
, the average weighted packet loss rate reaches its minimum, and thus the threshold
is obtained within this interval.
From the above two numerical analyses, it can be seen that the optimal value of the priority queue threshold T is approximately obtained at for various network parameters. Changing the weight settings or the proportion of network traffic does not affect the range of the optimal threshold. It shows that the priority threshold mechanism has good stability for all kinds of network traffic conditions.
3.5. Comparisons for Different Buffer Management Mechanisms
To verify the performance of the priority queue threshold control (PQTC) mechanism in time-sensitive networking (TSN) scenarios, this section includes five types of queue management mechanisms for comparative analysis, namely complete sharing weighted fair queuing (CS-WFQ), complete sharing with strict priority (CS-SP), static threshold (ST), shared-private queue management (SPQM), and the proposed PQTC mechanism.
The experimental parameter configuration matches the characteristics of TSN mixed-critical traffic: the high-priority load is set to
, and the low-priority load is set to
; considering TSN’s QoS guarantee requirements for high-priority services, the high-priority weight
, and the low-priority weight
, the shared buffer space is uniformly set to
to ensure the comparison of various mechanisms under the same resource constraints. Among them, the blocking probability and delay data of CS-WFQ, CS-SP, ST, and PQTC mechanisms are obtained through simulation; the SPQM mechanism adopts the blocking probability of each priority and the overall blocking probability under the optimal priority threshold value from Ref. [
53].
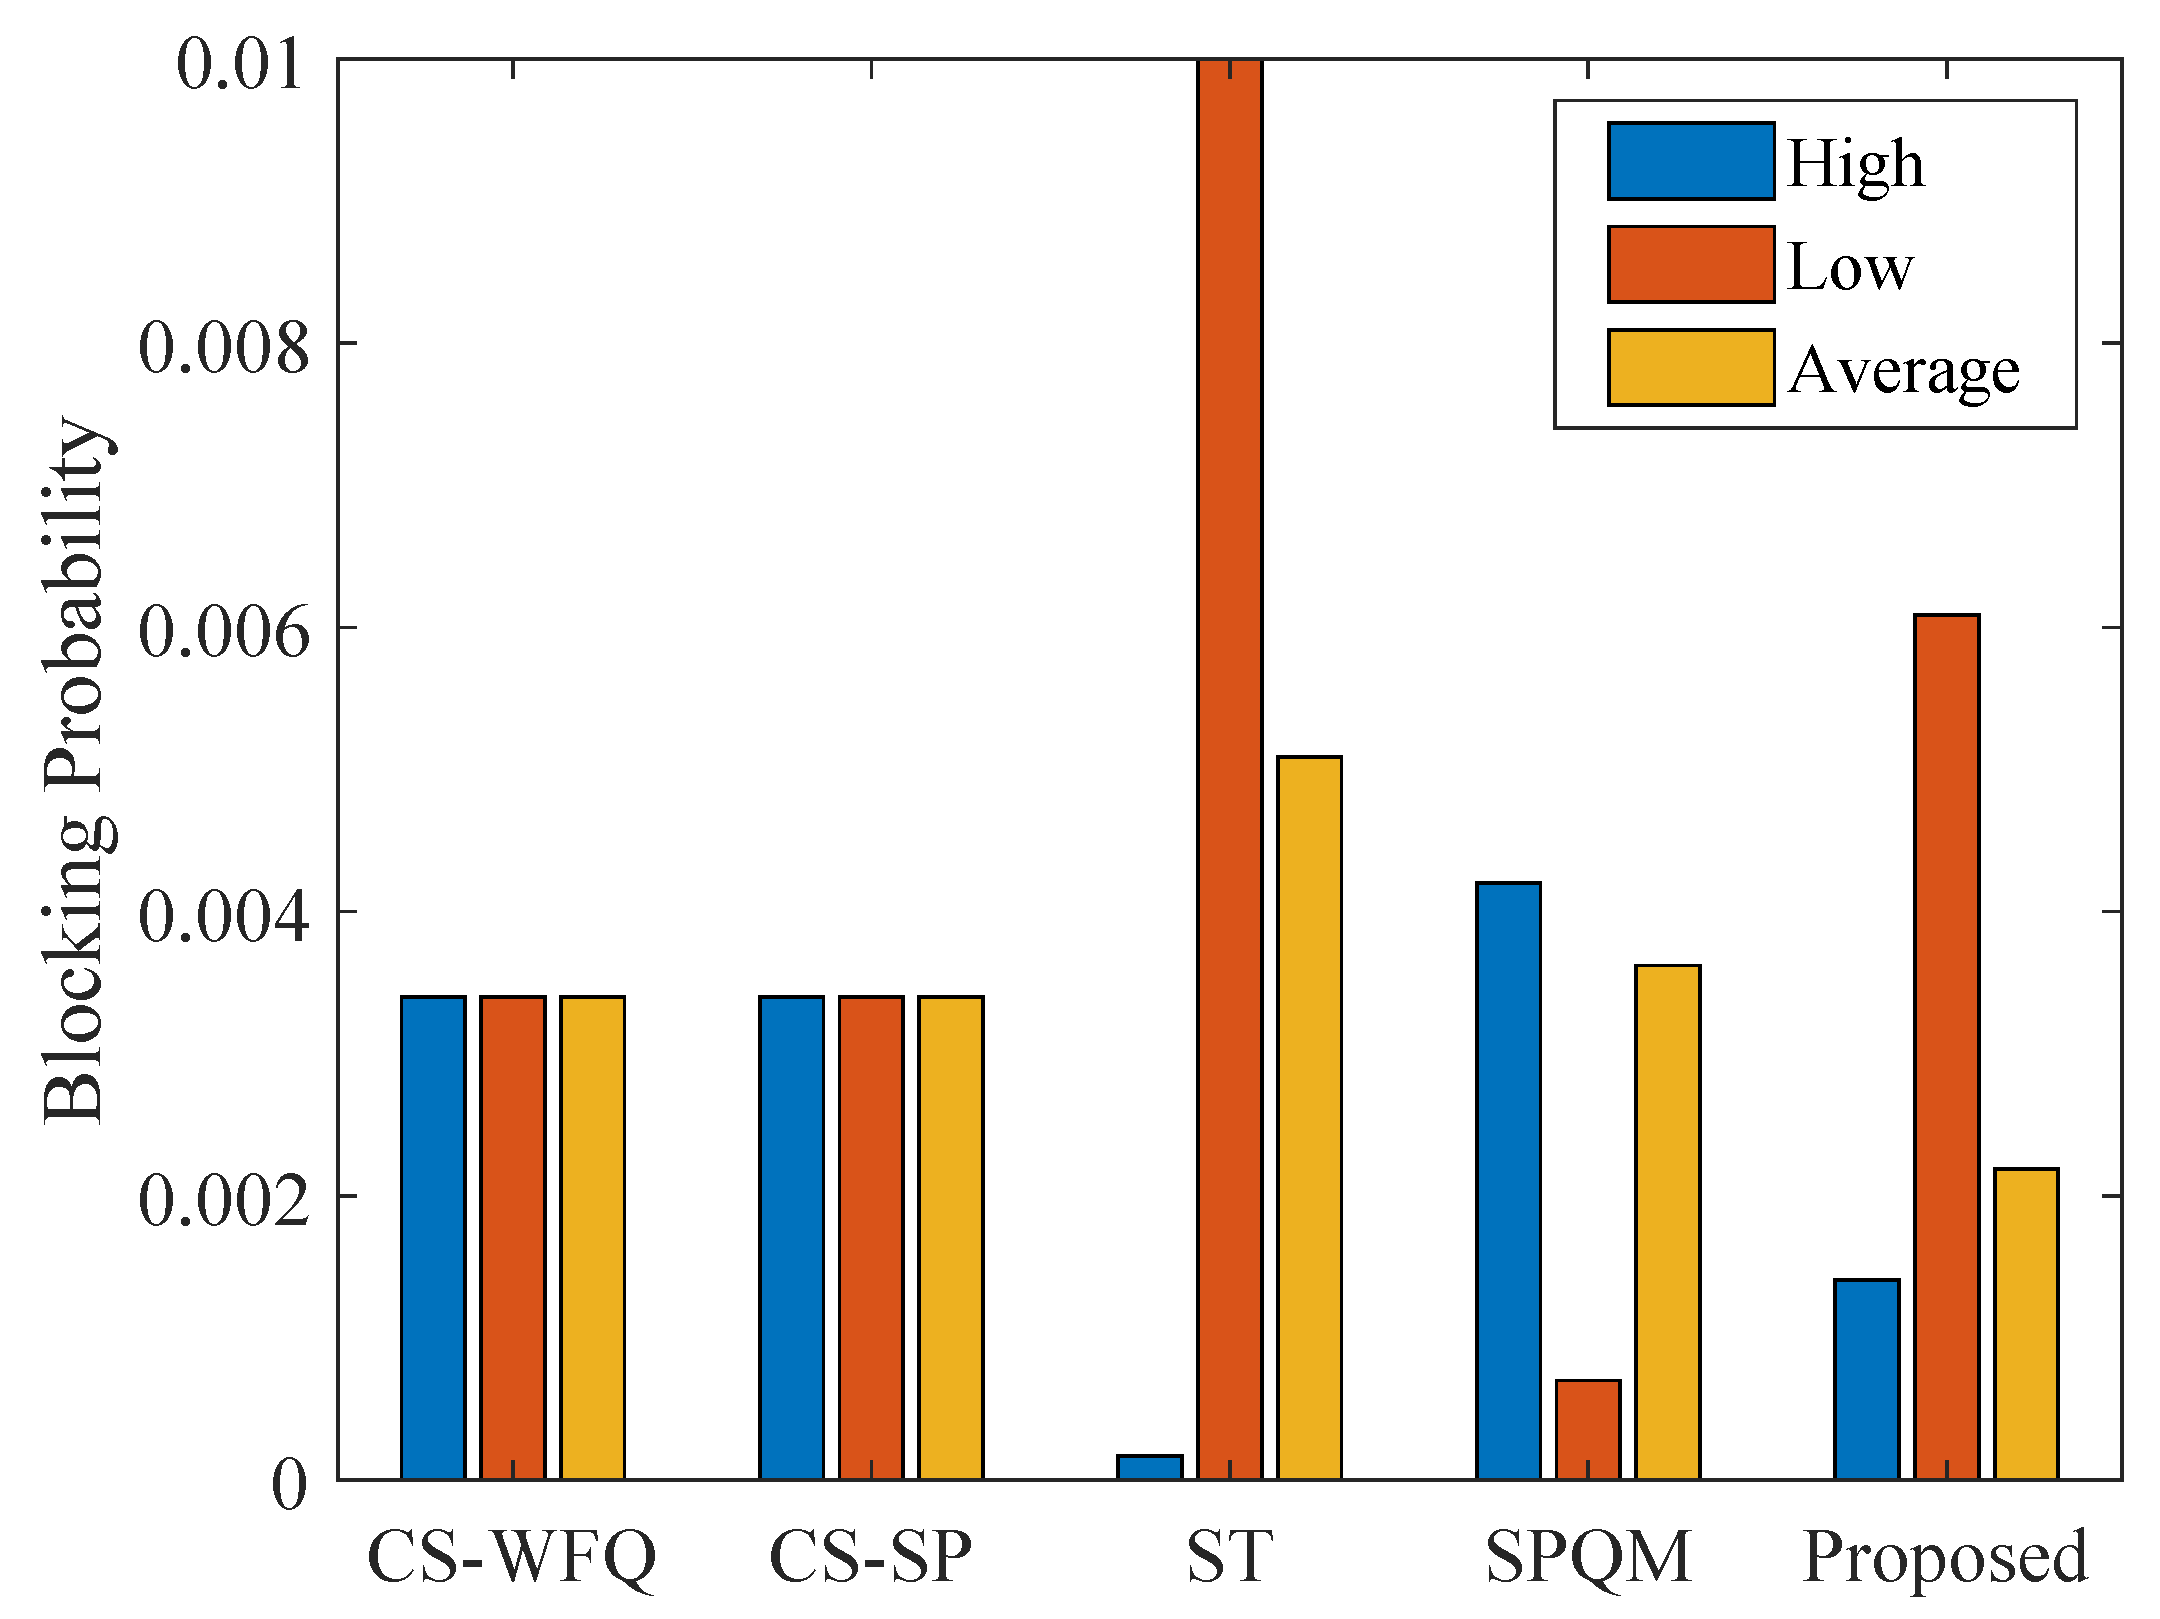
The comparison results of the blocking probability of the five mechanisms are shown in
Figure 16. It can be seen from the figure that the two CS mechanisms (CS-WFQ and CS-SP) have no differentiated buffer control, so the blocking probabilities of high-priority, low-priority, and overall traffic are equal and relatively high, making it difficult to meet TSN’s demand for differentiated guarantee of high-priority services. Although the ST mechanism reduces the high-priority blocking probability to an extremely low level through static allocation, the low-priority blocking probability is the highest, resulting in the highest overall system blocking probability. This is because the ST mechanism is unable to fully utilize the shared memory space. In the optimal state of the SPQM mechanism, the high-priority blocking probability is higher than that of the low-priority, and the overall system blocking probability is still higher than that of the PQTC mechanism. Within the optimal threshold range, the PQTC mechanism effectively balances the buffer resource allocation between high-priority and low-priority, and its overall blocking probability is significantly lower than that of the other four mechanisms. Specifically, compared with the SPQM mechanism, it decreases by 40%; compared with the two CS mechanisms, it decreases by 50%; and compared with the ST mechanism, it decreases by 60%.
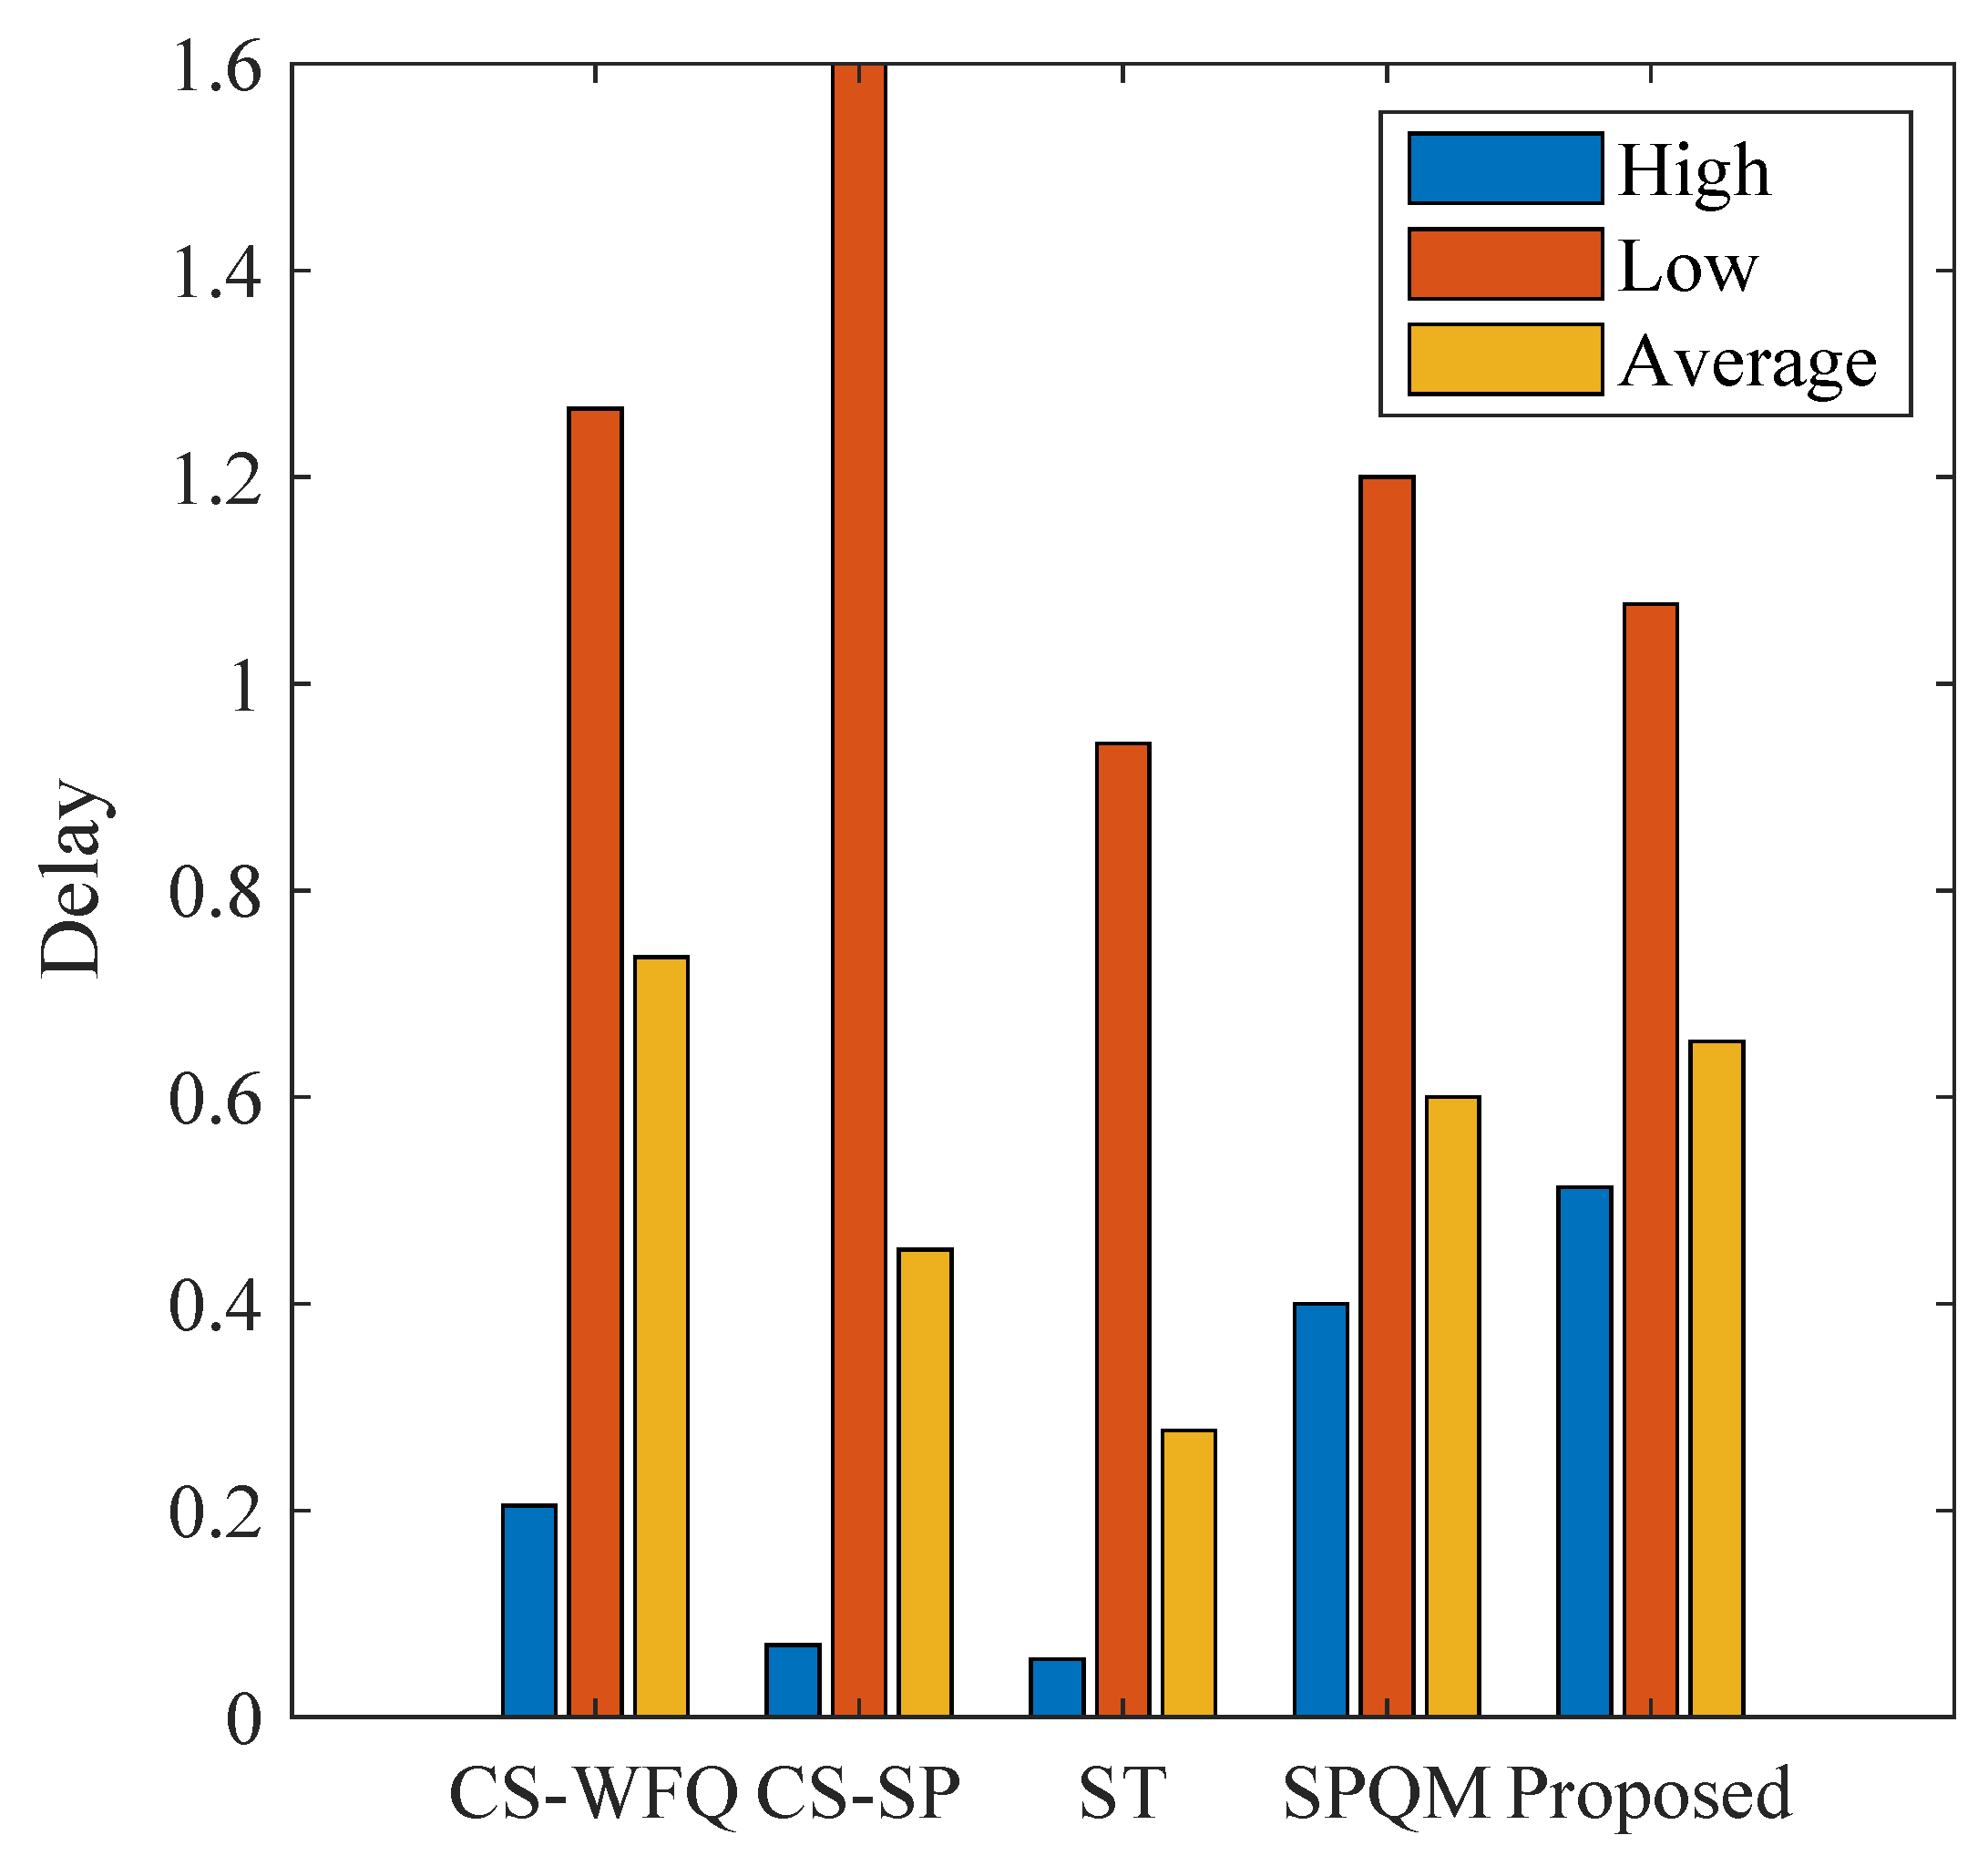
The comparison results of the queueing delays of different mechanisms are shown in
Figure 17. The results show that CS-WFQ, CS-SP, and SPQM mechanisms exhibit relatively high levels of low-priority delay. This is the data backlog effect caused by the imbalanced traffic. Although the ST mechanism maintains a low level of average delay, it is limited by the static resource allocation logic, resulting in insufficient memory utilization and higher packet loss rate. Under optimal threshold configuration, PQTC balances high- and low-priority delays while maintaining acceptable overall latency. Although its high-priority delay is marginally higher than resource-aggressive schemes like CS-SP, this results from admitting more high-priority packets into the shared buffer. This design improves buffer utilization while ensuring lower loss rates for critical traffic. With controllable latency, low packet loss, and optimal blocking probability, PQTC collectively satisfies TSN’s comprehensive QoS requirements for mixed-criticality traffic.
In summary, through dynamic threshold adjustment, the PQTC mechanism realizes the precise allocation of shared buffer resources. It demonstrates superior performance in blocking probability that far surpasses the other four mechanisms, while effectively balancing the delay performance of high-priority and low-priority queues. Consequently, it provides a buffer management solution that balances reliability and fairness for mixed-critical traffic scenarios in TSN.
