Article

Mathematical Modeling and Intensive Simulations Assess Chances for Recovery of the Collapsed Azov Pikeperch Population

by
Yuri V. Tyutyunov
1 and
Inna Senina
2,*
1
Southern Scientific Centre of the Russian Academy of Sciences (SSC RAS), Chekhov Street, 41, Rostov-on-Don 344006, Russia
2
The Pacific Community (SPC), BP D5, Noumea 98848, New Caledonia
*
Author to whom correspondence should be addressed.
Mathematics 2025, 13(19), 3232; https://doi.org/10.3390/math13193232
Submission received: 16 August 2025 / Revised: 24 September 2025 / Accepted: 27 September 2025 / Published: 9 October 2025
(This article belongs to the Special Issue Models in Population Dynamics, Ecology and Evolution)

Abstract

The main objective of the study is to evaluate the recovery potential of the collapsed semi-anadromous pikeperch population (Sander lucioperca L.) in the Azov Sea during 2021–2030. We use a Ricker-based age-structured model that accounts for the effects of salinity and temperature on reproduction. In earlier work, the model predicted and explained the pikeperch stock collapse as the consequence of salinity and temperature exceeding the species’ tolerance limits. To assess the probability of stock recovery, we conducted a long-term retrospective validation and ran Monte Carlo projections under alternative climate scenarios with supplemental management actions. The results confirm that the dynamics of the pikeperch population in the Azov Sea are essentially environment-driven and negatively impacted by the large positive anomalies in both water temperature and salinity. Simulations suggest that either a substantial and persistent artificial restocking of juvenile recruits, or mostly unlikely scenarios of simultaneous reduction in salinity and temperature combined with additional restocking can provide conditions for the stock restoration within the decade considered. Based on these projections, we recommend a suite of urgent restoration measures to create the conditions required for future stock recovery.

1. Introduction

The long-term risk of quasi-extinction for the exploited semi-anadromous Azov Sea pikeperch (Sander lucioperca L.) population was assessed with a discrete-time age-structured model using a Ricker stock–recruitment function [1]. A Gaussian-shaped dependence of the pikeperch reproduction coefficient on average seawater temperature and salinity was assumed; results were obtained via Monte Carlo simulations across different harvesting strategies using random time series of these two environmental factors (see details in the above cited paper). In these simulations, the model predicted more than a 70% probability of stock collapse between 1982 and 2016, even in the absence of fishing. This collapse was explained by an increase in seawater salinity that exceeded the species’ tolerance limit.
In the early 2000s, the fishing ban was considered only a hypothetical measure for fishery control in simulation scenarios. However, since 2017, any catch of pikeperch in the Azov Sea—except for scientific and fish-breeding purposes—has been completely forbidden [2,3]. This decision followed the realization that the commercial stock of the pikeperch population had dropped by 82% from 2005 to 2008, leaving only 1.8 million of adult fish [4]. Unfortunately, the ban did not improve the situation. In 2018, the abundance of adult pikeperch was 0.3–0.4 million individuals [3]. By 2022, the stock had not recovered; it remained below 0.4 million and had lost commercial significance [5,6].
Besides qualitative verification of the stochastic forecast, the model was later validated using observed seawater temperature and salinity for the period 1982–2016, demonstrating good agreement between the simulated trajectory and observations [7]. Also, the modeling revealed that sea warming plays an essential role in the pikeperch population’s decline. More specifically, temperature has become a crucial driver since the mid-2000s. Berdnikov et al. [8] reported that during this period the Azov Sea began transitioning to a new state characterized by significant positive anomalies in both water temperature and salinity, not seen in nearly a century of instrumental records. Authors of [9] suggested that the mean annual values of these variables could serve as a useful indicator of climate change in the Azov Sea ecosystem. Notably, although ichthyologists have long emphasized temperature’s role in pikeperch spawning success (see, e.g., [2]), Azov Sea temperature was not previously regarded as a key driver of the population collapse; most studies focused instead on rising salinity and overfishing [2,3,4,5,6,10]. In contrast, studies in other European waters, in particular in the Baltic Sea, generally consider warming as beneficial for pikeperch, because higher temperatures and precipitation lower salinity and shorten ice cover duration [11,12,13,14,15].
Thus, including effects of these two external factors into the population dynamics model allows for accounting of the impact of environmental variability. Biological and modeling studies confirm that salinity and temperature jointly impact growth, spawning and survival of pikeperch [11,12,13,14,15,16,17]. Elevated temperatures desiccate spawning grounds in the Lower Don River and lead to reduced dissolved oxygen in the shallow Azov Sea, often triggering mass mortality events [9,18]. Conversely, low temperatures increase metabolic costs and may reduce pikeperch fecundity. Salinity extremes are also harmful to pikeperch. Very low salinity may predispose fish to epizootic diseases by enhancing pathogen activity, whereas salinization reduces available feeding habitat, pushing the population from highly productive marine waters to the Lower Don River. As the reproduction is the most vulnerable process of population dynamics, the bell-shaped Gaussian functions are incorporated as multipliers on the recruitment term. The bell-shaped dependence provides the simplest and natural way for representing a basic formalization of Shelford’s [19,20] law of tolerance [21,22] to environmental factors. This approach has been successfully used to model the population dynamics of other fish species [23,24], and is a standard method of incorporating influence of spatial and/or temporal variance of the environment on the species’ fitness [25]. Environmental effects can also be described by asymmetric bell-shaped functions (see, e.g., [26]); however, this added complexity introduces additional parameters that typically increase overall model uncertainty.
The main objective of this study is to assess the probability of pikeperch stock recovery during 2021–2030 under alternative abiotic-condition scenarios, including cases with supplemental restocking of recruits. To achieve this objective, we perform intensive Monte Carlo simulations with the earlier proposed, identified, and verified simulation model, which already demonstrated its robustness in long-term prediction of population dynamics and risk assessment of the stock collapse for the Azov pikeperch, which is a typical semi-anadromous fish species in this brackish water body.
The paper is organized as follows. We first present the model and describe the simulation algorithm [27], which was revised by adding (i) an automatic bootstrapping procedure to accurately handle the uncertainties of the identified model parameters, (ii) new observations of stock, catches, and abiotic factors, (iii) harvesting and restocking scenarios, and (iv) Monte Carlo simulations with climate change scenarios. Next, we describe the data, the scenarios for stochastic simulations, and report the results. Finally, the outcomes of the study are interpreted in relation to pikeperch ecology and management, emphasizing benefits of using relatively simple models in forecasting dynamics of endangered populations vulnerable to environmental stochasticity.

2. Data and Methods

2.1. The Model

The model runs with an annual time step t = 0 , 1 , . . . , iteratively computing the dynamics of three age groups: recruits N 0 t , yearlings N 1 t , and adult individuals aged two years and older N 2 t :
N 0 t + 1 = ( a 1 N 1 t + a 2 N 2 t ) e b N 1 t + N 2 t e S t + 1 S 0 σ S 2 e T t + 1 T 0 σ T 2 ,
N 1 t + 1 = p 0 N 0 t 1 h 1 t + 1 ,
N 2 t + 1 = p 1 N 1 t + p 2 N 2 t 1 h 2 t + 1 .
The age group abundances at t = 0 determine the initial conditions.
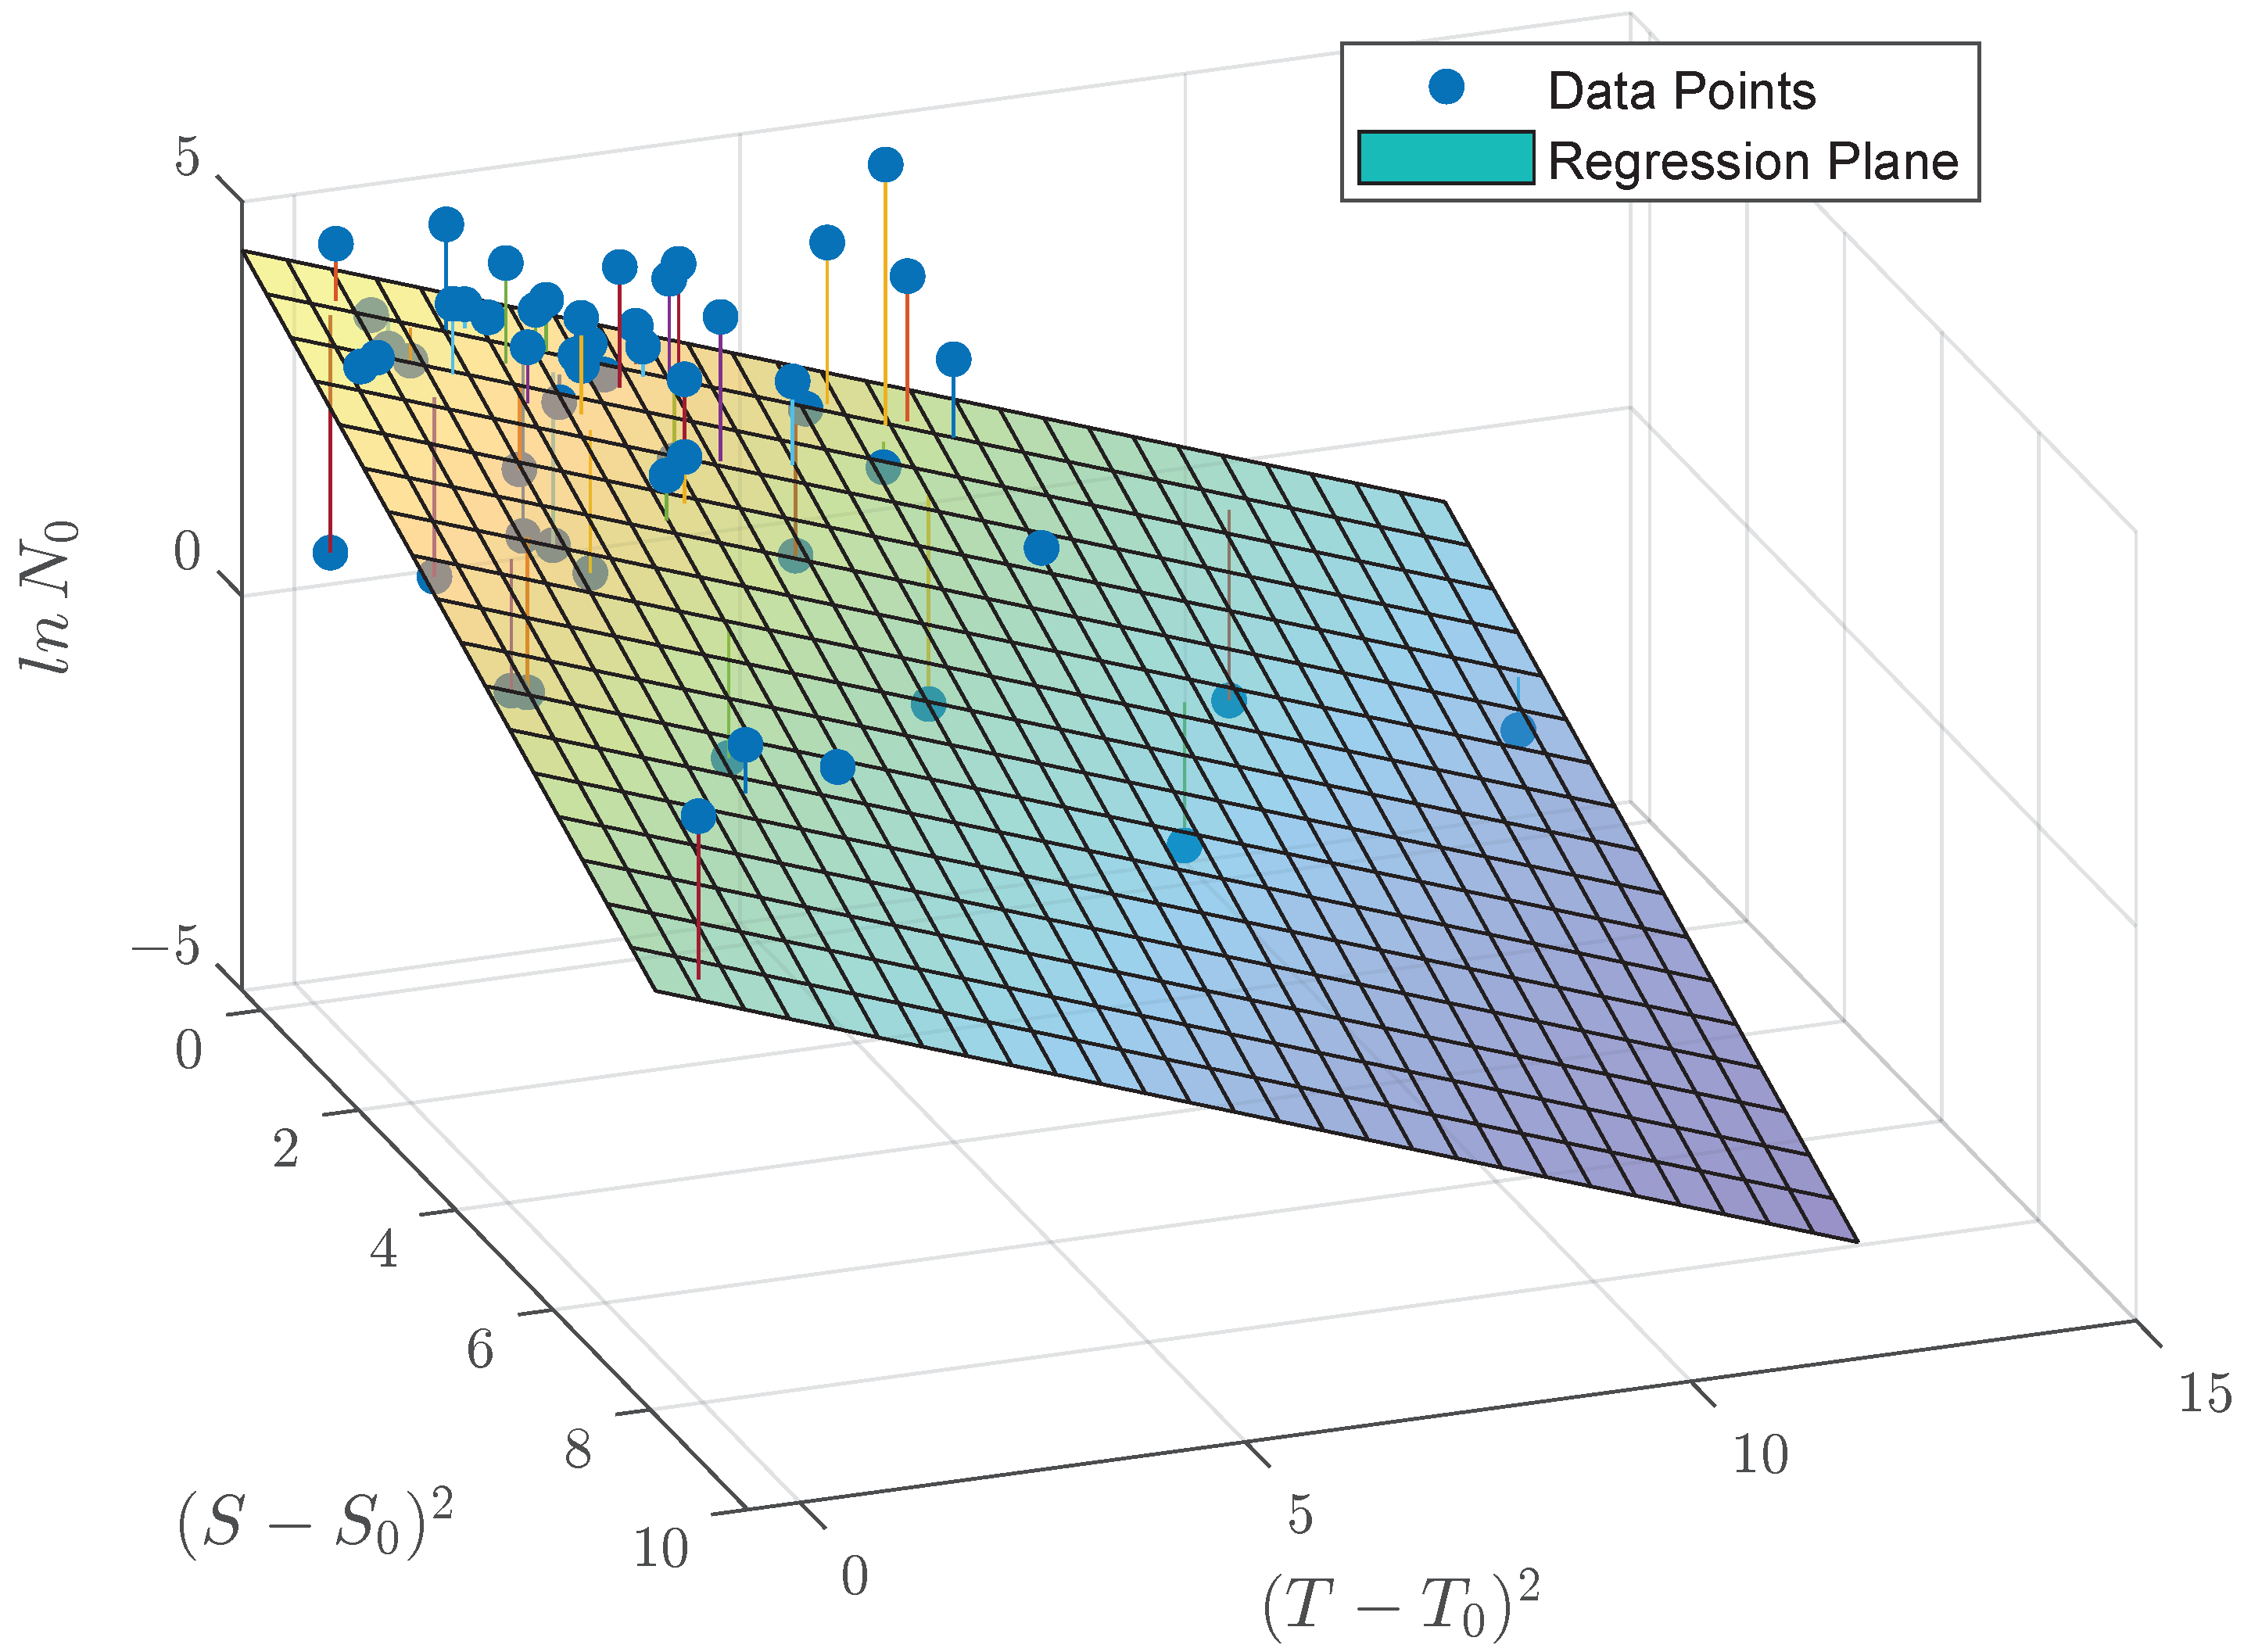
Equation (1) is based on the Ricker model [28], additionally assuming a Gaussian-shaped dependence of the survival of pikeperch larvae on water temperature T t and salinity S t , in each year t. To justify including simplest symmetric bell-shaped terms in the recruitment equation, we performed a regression analysis of a simplified model describing recruits’ abundance depending solely on the environmental variables. The results are presented in Appendix A. Equations (2) and (3) describe age-specific survival, where p 0 , p 1 and p 2 are the survival rates of recruits, yearlings and adults, respectively. Fishing mortality is parameterized by annual harvest coefficients h 1 t , h 2 t .
Table 1 summarizes the model parameters estimated by fitting to observations, and parameter values and errors estimated by bootstrapping. The procedure of parameter identification is described below in Section 2.3.

2.2. Sensitivity Analysis to the Model’s Structural Assumptions

In order to address structural stability of the model, we consider the autonomous case of system (1)–(3) with some constant values of water temperature and salinity, T and S, in the absence of harvest. The system has two equilibria (fixed points): trivial equilibrium, corresponding to the population extinction,
N 0 = ( 0 , 0 , 0 ) ,
and nontrivial equilibrium
N * = ( N 0 * , N 1 * , N 2 * ) ,
with
N 0 * = 1 p 2 b ( 1 + p 1 p 2 ) p 0 ln a 1 ( 1 p 2 ) + a 2 p 1 p 0 G S G T 1 p 2 ; N 1 * = p 0 N 0 * ; N 2 * = p 0 p 1 N 0 * .
where G S and G T denote the bell-shaped Gaussian terms of Equation (1).
Applying standard methods to assess the stability of fixed points (see, e.g., [29]), we analysed the eigenvalues λ i ( i = 1 , 2 , 3 ) of the Jacobian matrix of the autonomous system at (4) and (5). With the parameter estimates in Table 1, and under optimal temperature and salinity, the nontrivial equilibrium (5) is positive and stable, whereas the trivial equilibrium (4) is unstable. Moderate deviations of the environmental factors from their optima do not alter these results. Figure 1 shows the spectral radius ρ ( J ) = max λ i for each equilibrium as a function of water temperature and salinity.
Depending on the environmental factors, either the trivial or nontrivial equilibrium can be stable. Thus, despite the use of the Ricker reproduction function in (1), the model with the estimated parameters is essentially environment-driven. The reproduction coefficients a i appear to be too small to generate periodic or chaotic dynamics. Consequently, for the parameter set identified for the pikeperch population, the dynamics can be viewed as a series of transitions between equilibria (4) and (5), constantly perturbed by environmental factors and anthropogenic forcing. Small variations of the model equations and parameter values may distort the shape and/or position of the stability-domain boundary in Figure 1 but do not alter the system’s qualitative behavior.
As an additional robustness check, we replaced the Ricker stock-recruitment function in Equation (1) with the Beverton-Holt relationship [30], i.e., using 1 1 + b N 1 t + N 2 t instead of e b N 1 t + N 2 t . The modified system retained the same qualitative behavior, producing trajectories similar to those of the original model despite such a substantial change.
Note that our earlier results [7] also support the structural adequacy of system (1)–(3) by comparing its forecasts with those from a minimal model describing the dynamics of two age groups: juveniles, N 0 , and adult fish aged one year and older, N 1 . Both the full and the minimal models produce nearly identical estimates of juvenile and adult abundance.

2.3. Identification and Validation of the Model

2.3.1. Sources of Input Data

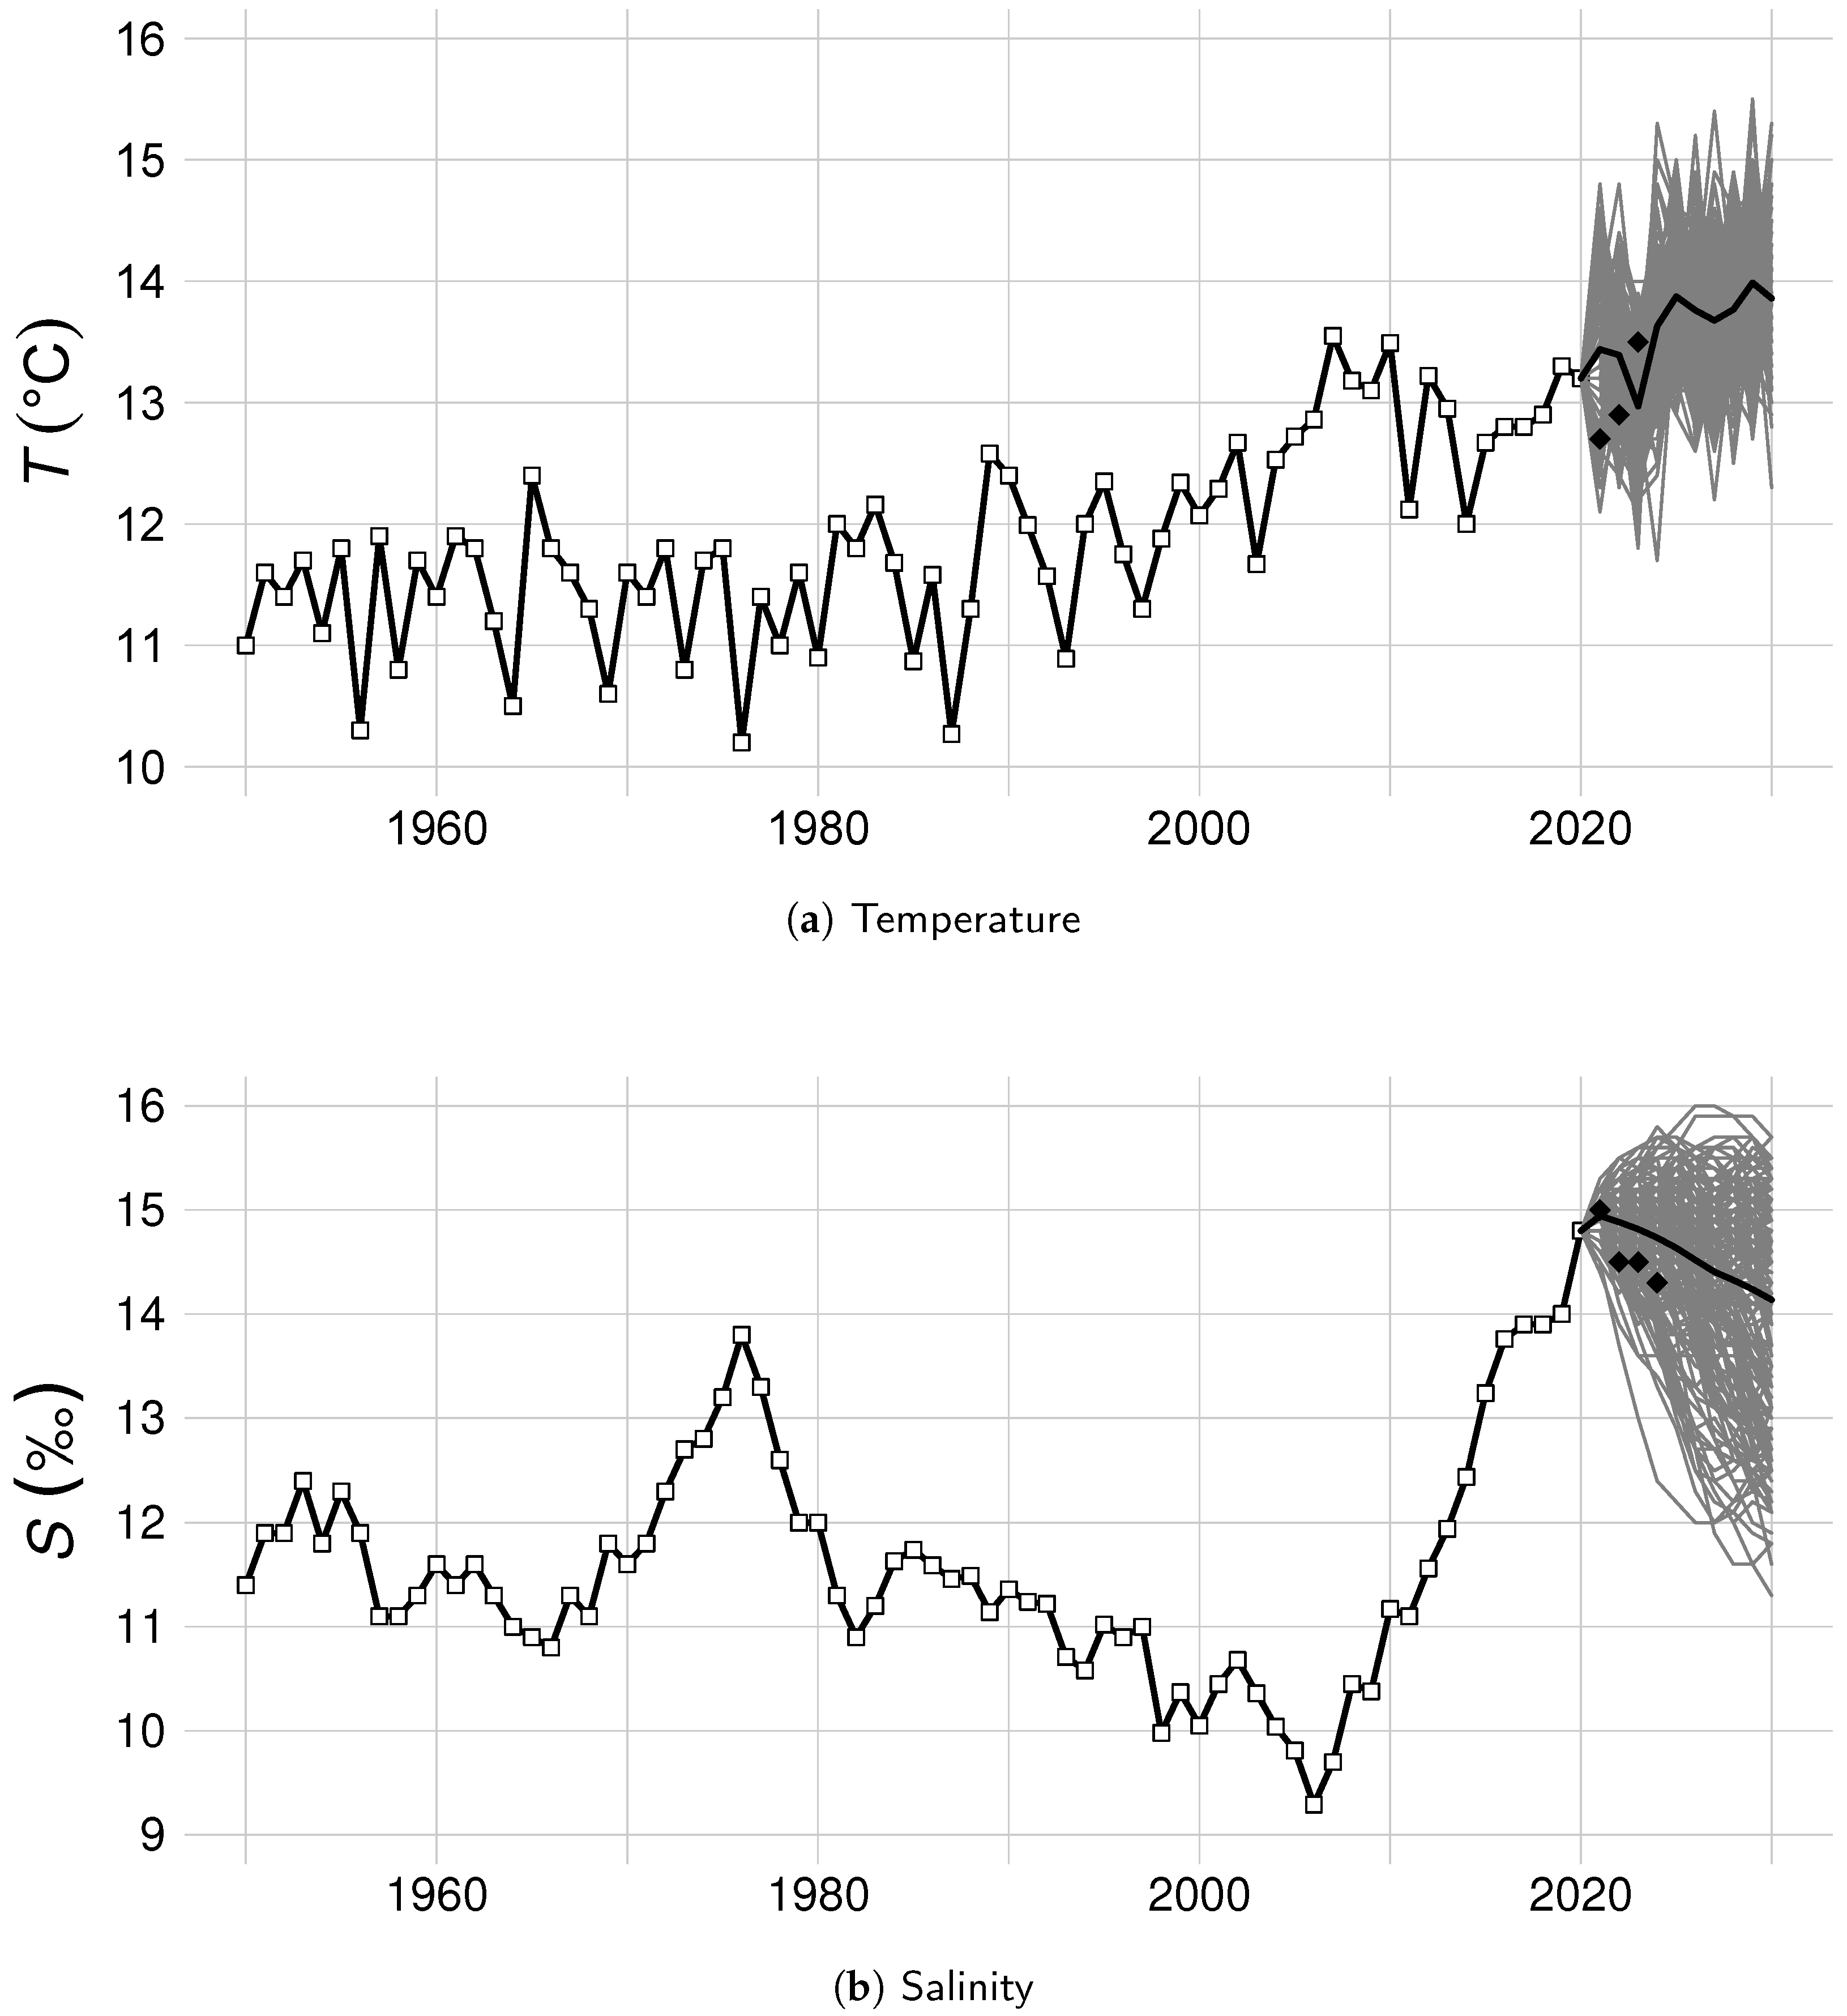
The identification and bootstrapping procedures have been greatly enhanced compared with those applied in [1]. In addition to the previous study, which was focused on risk assessment of the population collapse and had been performed in circumstances of data scarcity, nowadays opportunity of retrospective analysis of the simulation results allows us to distinguish clearly between the identification (1950–1981), validation (1982–2020), and projection (2021–2030) periods of modeling. Parts of time series plots in Figure 2, corresponding to years 1950–2020, present measurements of average annual temperature and salinity, T t , S t [8]. The observations of environmental factors, in addition to the estimates for annual abundances of considered age groups, and time series of annual catches, available for the identification period, which were borrowed from the earlier study [1], constitute input data of the model. Population abundance and age structure were estimated by ichthyologists of the Azov Fisheries Research Institute using the method of virtual populations, based on time series of commercial catches and data from regular scientific surveys. The initial abundances of the three age group correspond to the estimated values of 1949. Besides, within the validation period, we compare the modeled trajectory with the abundance estimation data, collected from a number of published sources [2,3,4,5,31,32,33,34].

2.3.2. Identification Procedure

The identification procedure has been significantly improved in course of revising the modeling algorithm, which did not qualitatively change the results. The annual harvesting rates h 1 t and h 2 t are calculated for the identification period 1950–1981, from the catch and stock data time series known for these years. Part of the model parameters, namely, the survival of adults p 2 , and optimal (providing the best conditions for reproduction of pikeperch in the Azov Sea) values of average temperature and salinity T 0 and S 0 , were taken from ichthyological studies [16,35,36]. Other parameters listed in Table 1 are estimated by fitting the model trajectories to the data for the three age groups, minimizing the sum of the squares of the differences (residuals) between modeled values N 0 t , N 1 t , N 2 t and observed abundances of the age groups.
First, a multiple starting point optimization was conducted to identify the global minimum of the objective function. During this process, we observed the presence of multiple local minima in the minimized function. These were attributed to the correlation between values in two parameter pairs, specifically a 1 , b and a 2 , b . This is not much surprising because, exactly as in the classical Ricker model, the coefficient b is a scaling parameter, which does not change the qualitative dynamics of the system. Thus, we set the intraspecific competition parameter to the value b = 0.039 providing the global minimum. This allowed reducing the number of fitted parameters, avoiding the over-parametrization of the model. Consequently, the model fitting can now be performed in a single-step optimization without the need to apply the multiple starting point technique.
Errors of the fitted parameters were evaluated by a residual bootstrap [37]. For this, the fitting procedure was applied to 10,000 bootsrapped time series, generated by random adding residuals (sampled with replacement) with randomly chosen signs to each point of the modeled trajectories. This number of replications ensures convergence of estimated means to the values with two significant digits. Table 1 summarizes the results of the identification and bootstrapping procedures.
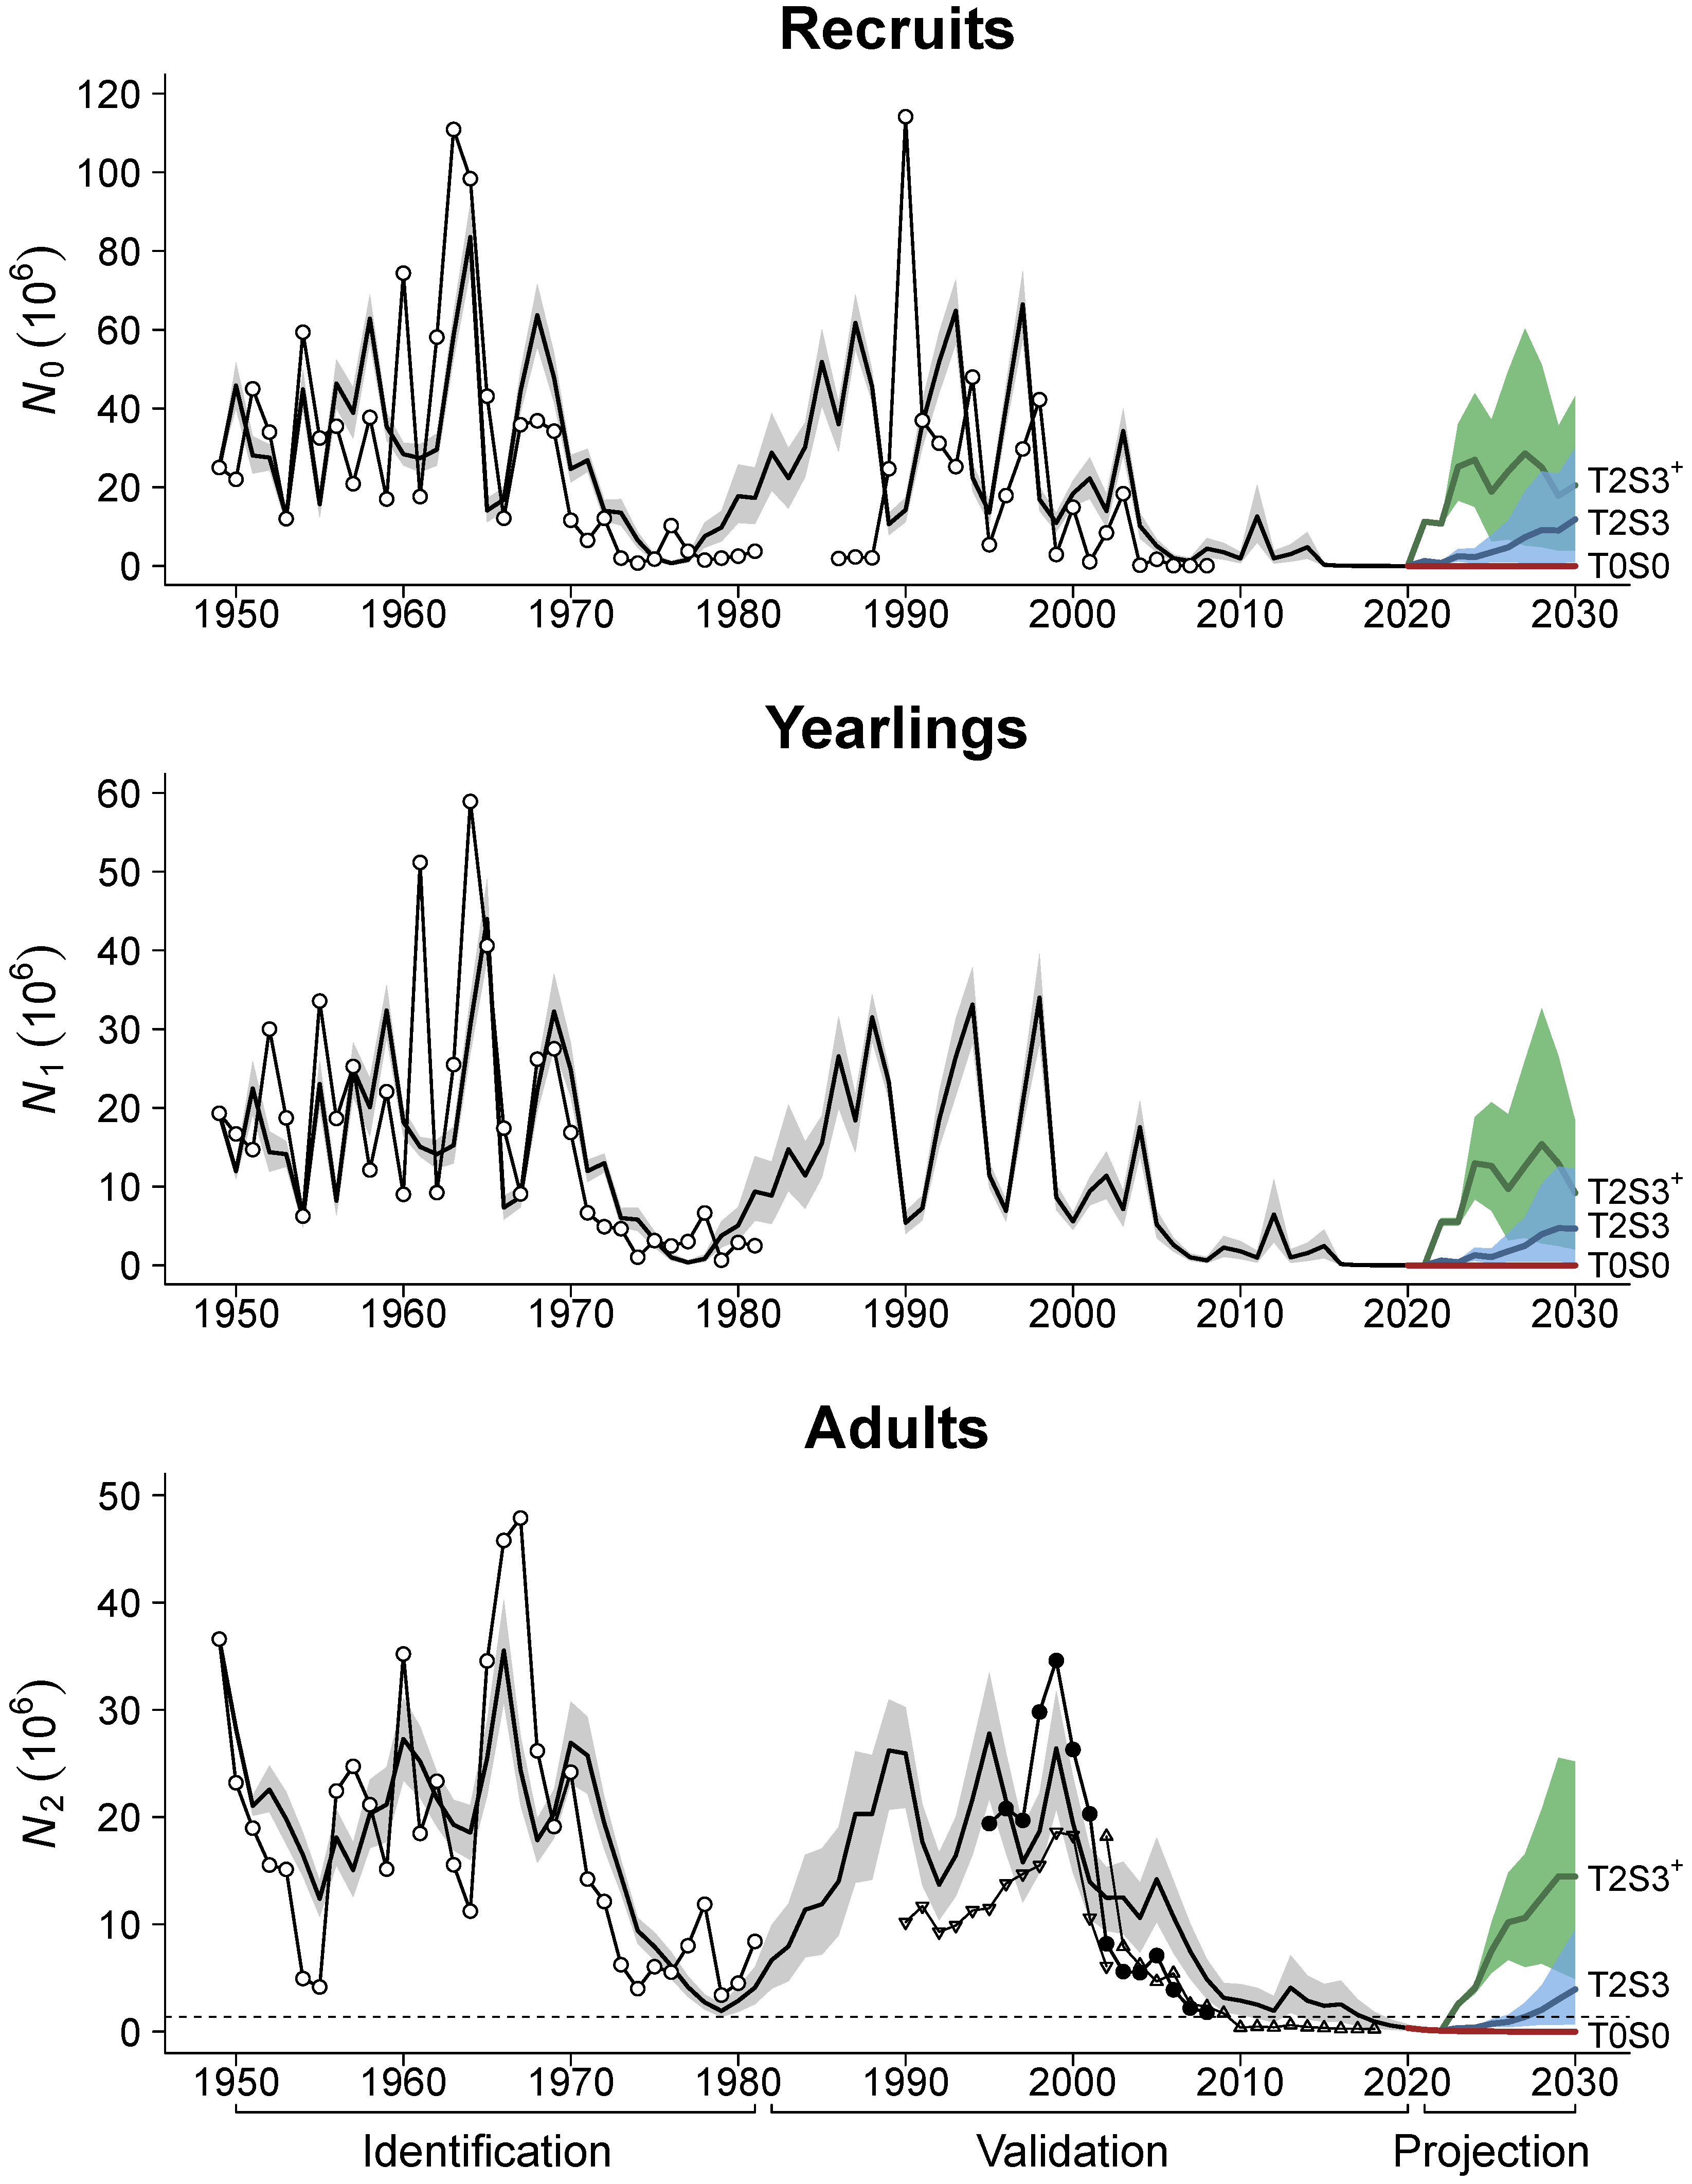
The ‘Identification’ part of plots in Figure 3 presents the model trajectories obtained with identified parameters, in comparison with ichthyological estimates of the age group abundances, which were used for identification. The grey bands show the spread of 10,000 trajectories of Monte Carlo simulations computed with parameter values randomly sampled within their error intervals.

2.3.3. Validation

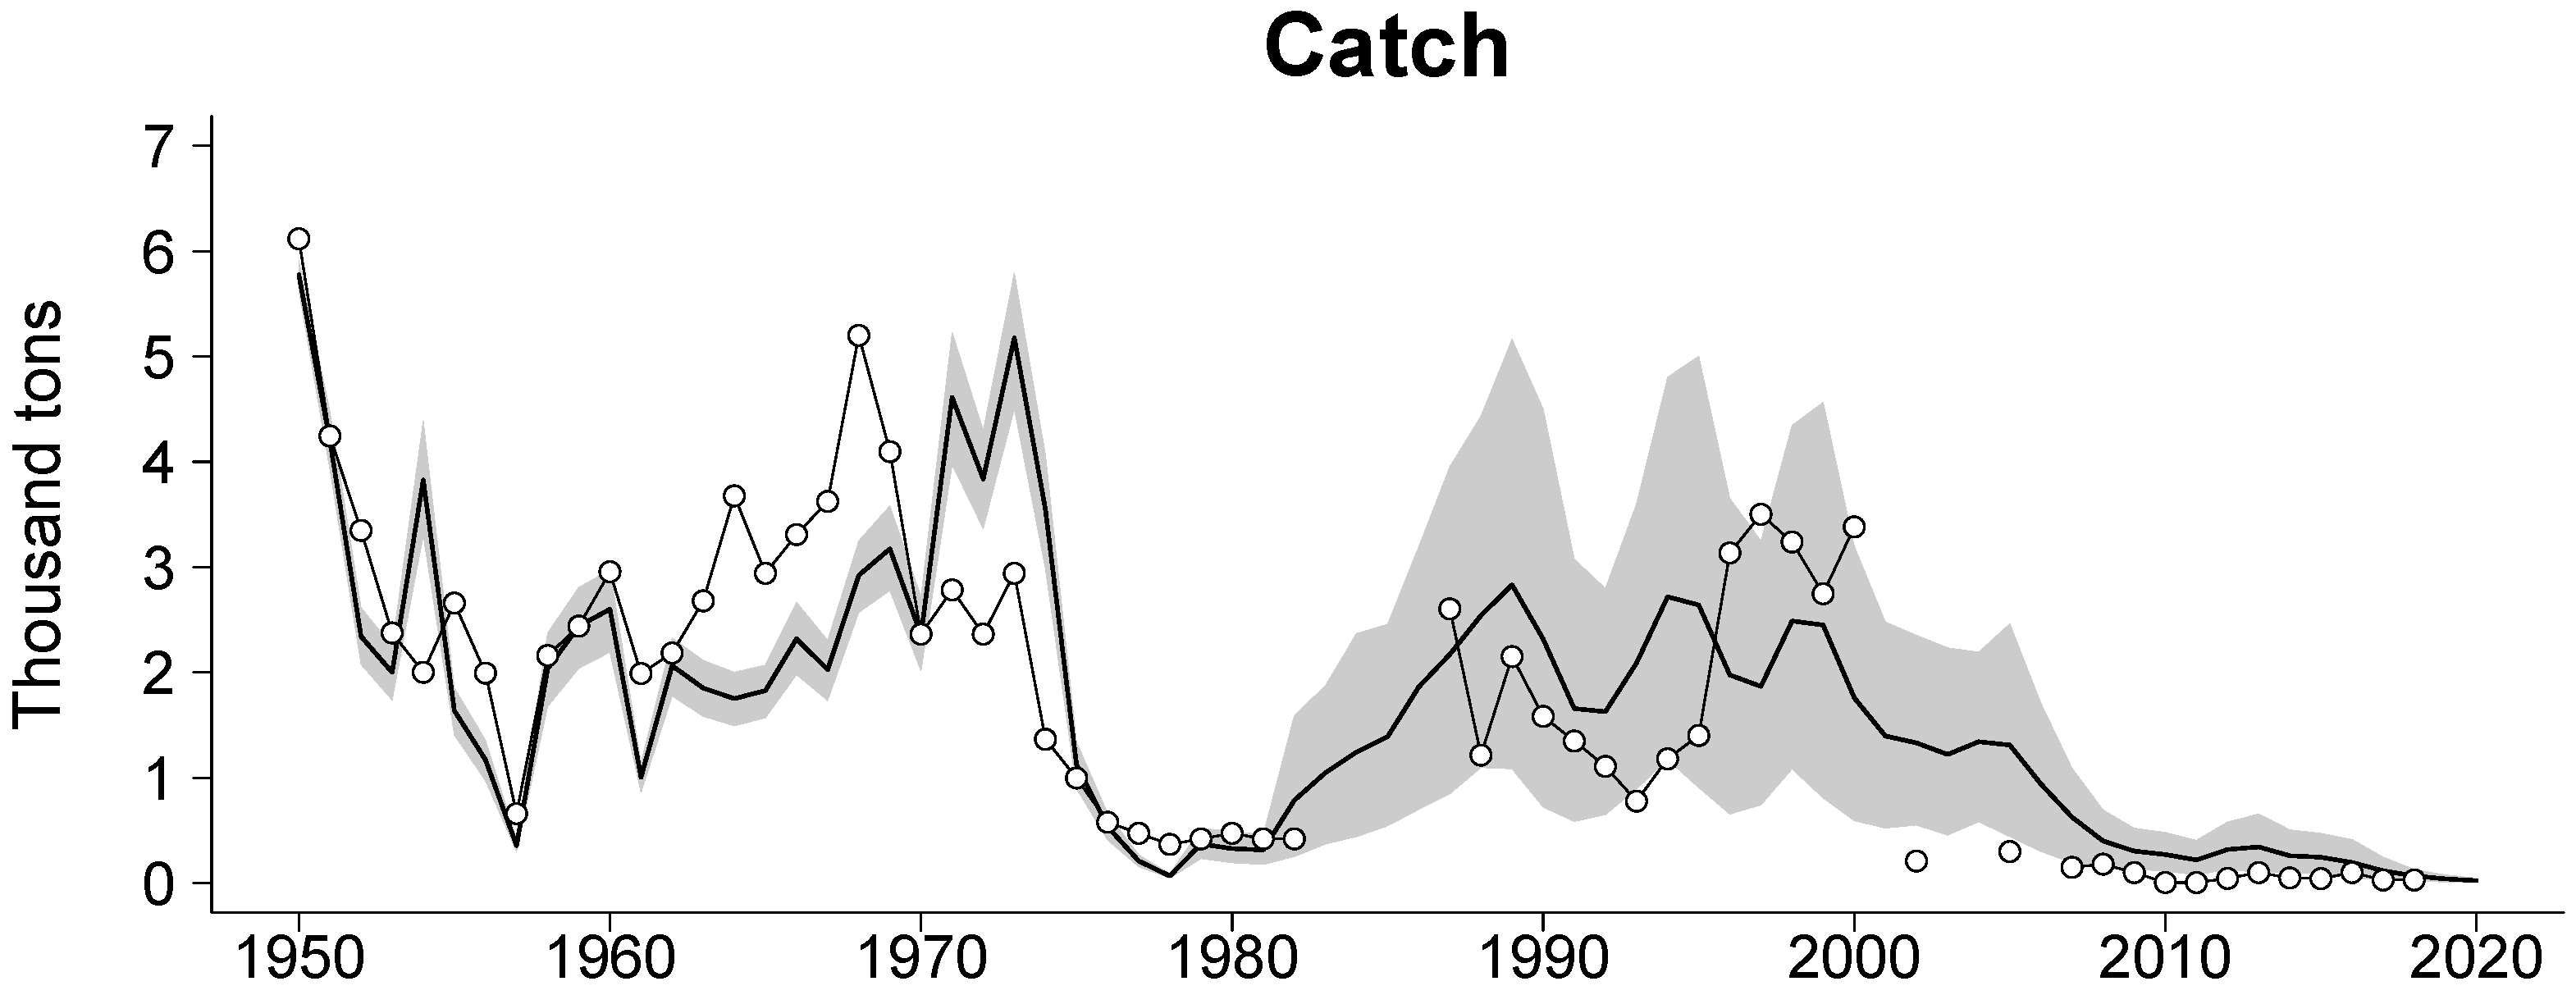
Validation of the identified model (see ‘Validation’ part of plots in Figure 3) was performed on time interval 1982–2020 with deterministic time series of observed temperature and salinity of the sea, shown in Figure 2. Lines with upside-down triangles and filled circles in panel ‘Adults’ of Figure 3 correspond to data from [31,32] and [4], respectively; lines with upright triangles show data collected from [2]. Additionally, comparison of predicted and observed (reported) catches [2,3,5,6,38,39] is shown in Figure 4. With average individual weights w 1 = 0.5 and w 2 = 1.5 kg, the total catch in year t is computed according to Equations (2) and (3) as
C t = w 1 h 1 t p 0 N 0 t 1 + w 2 h 2 t p 1 N 1 t 1 + p 2 N 2 t 1 .
Ichthyologists have suggested that a substantial percentage of pikeperch catches in the Azov Sea may be illegal and undocumented [3,31,32]. This may explain the persistent overestimation of the model-predicted catch compared to the reported catch after 2000 (Figure 4). To account for this additional source of uncertainty in the Monte Carlo simulations, the annual harvest coefficients h 1 and h 2 have been randomly varied within [0, 0.3] during the validation period. This significantly widens the spread of the computed trajectories (see Figure 4), making the modeling more cautious and highlighting the population’s response to variations in fishing effort. Since 2017, a fishing ban on pikeperch has been maintained; accordingly, the harvest coefficients were set to zero from that year onward.

2.4. Scenarios of Monte Carlo Simulations

Simulations of population dynamics for the projection period 2021–2030 were performed with model (1)–(3) for several scenarios of temperature and salinity changes. For each of the two environmental factors, a baseline, i.e., the most likely scenario, and three of its modifications were included into the plan of simulation experiments. For each scenario, a set of 200 stochastic time series have been computed by external models. Thus, with 10,000 Monte Carlo replications, projection simulation for each scenario requires computation of 10,000 × 200 stochastic trajectories.
The baseline scenario T0 for temperature dynamics in the sea corresponds to the ‘low-emission scenario’ SSP126 of the global climate model [40]. The set of 200 stochastic time series of the baseline temperature scenario is shown in Figure 2a. Though this scenario involves slowing down of the temperature increase in the global climate model, the 2 °C target reduction is reached only by the year 2100. For that reason, we also consider other three, more optimistic but unlikely scenarios Tk with k = 1 , 2 , 3 obtained from the T0 scenario simply by subtracting k°C from each value of the time series.
The dynamics of the baseline salinity scenario S0 were simulated using an external regression model proposed by Bronfman and Surkov [41]. This model was calibrated to a longer time series that includes modern observation periods. Figure 2b shows the time series projected under the S0 scenario. Besides S0, we considered three additional scenarios for the salinity dynamics, Sm with m = 1 , 2 , 3 obtained from the S0 scenario by subtracting m‰ from each value of the time series.
In addition, we considered inclusion of artificial stocking option into the simulation scenarios. Thus, each combination of temperature and salinity scenarios was combined with potential annual release of 10, 20, or 25 million artificially grown pikeperch recruits. This corresponds to adding the amount of released recruits to the right side of Equation (1).

3. Simulation Results for the Projection Period

The ‘Projection’ section of the plots in Figure 3 presents the model projections for the period 2021–2030, under various scenarios of temperature and salinity changes, with and without the optional inclusion of artificial restocking of 10 million juvenile recruits. The dashed line in the adult pikeperch plot represents a critical threshold, set at 1.38 million individuals, based on recommendations from ichthyologists [3].
In addition to the probabilistic forecasts presented in Figure 3, Table 2 contains further estimates of recovery probability, calculated using a broader range of scenario combinations.
The results suggest that the most likely baseline environmental scenarios, T0 and S0, do not create conditions conducive to the restoration of the pikeperch population within the current decade. Furthermore, simulations indicate that neither the existing fishing ban nor the additional release of 10 or even 20 million juvenile recruits between 2021 and 2025 alleviates the ongoing decline of the pikeperch population. Note that the baseline temperature scenario, T0, assumes further sea warming in the near future (see Figure 2a). Meanwhile, the S0 scenario follows a non-extreme trajectory: the average salinity decreases by almost one per mille over the projection period (Figure 2b). However, this change is still insufficient; therefore, the combination of T0 and S0 appears quite pessimistic. Under such conditions, only the scenario with additional release (and recruitment into the Azov sea population) of 25 million juveniles between 2021 and 2025 results in high probabilities of pikeperch stock recovery. In contrast, the ‘optimistic’ environmental scenarios, which involve reduced temperature and salinity values—such as the combination of T2, S3 presented in Figure 3, or other combinations of Tk and Sk, depicted in bold numbers in Table 2—provide conditions for stock recovery. And in scenarios with a significant reduction in both temperature and salinity, such as T3 and S3, recovery of the population is probable without artificial stocking.

4. Discussion

The model’s simplicity is a central feature of this study. In formulating general principles for environmental model development and evaluation, Jakeman et al. [42] emphasize the importance of using parsimonious model structures paired with robust identification algorithms, noting that simple models with well-identified parameters typically outperform complex, over-parameterized models when data are limited. Compared with more detailed and complex models that depend heavily on system-specific data, simple models are more suitable for forecasting and universal for applications to other populations with similar properties. Accounting for stochastic fluctuations in environmental conditions and handling various sources of uncertainty are also essential features of fisheries stock assessments models. The effectiveness of parsimonious, classical models for applied problems in exploited populations was earlier demonstrated by various authors [23,43,44,45,46,47,48,49]. We believe that the present study provides another example of the successful development and application of a simple mathematical model to estimate and forecast the dynamics of an exploited and endangered species.
Model (1)–(3) is based on a well-established classical description of a discrete age-structured population, using the non-linear Ricker stock-recruitment equation. Additionally, the model incorporates the influence of external factors, such as water temperature and salinity, on recruitment success. Such formulation of the model assumes integrative impact of the environmental factors on the pikeperch reproduction, which is the most vulnerable process of population dynamics. Working with annual time-step and total abundances of the age groups, the model implicitly takes into account many different factors affected by variations of temperature and salinity, including spatiotemporal effects related to dramatic shrinking of the pikeperch feeding area, caused by increase of the water salinity, which is stressed in ichthyological studies [10,50,51]. Note that in the Azov Sea, where pikeperch and other semi-anadromous fishes are negatively affected by the combined effects of salinization and warming, only the right-hand part of the Gaussian curve (values above the optimum) is practically meaningful, because salinity and temperature substantially below their ‘optimal’ values have never been observed. However, applying the model to the Baltic pikeperch population [11,12,13,14,15] may invert this pattern, making the left-hand part more pertinent.
By avoiding over-parameterization, the model’s simplicity enables accurate parameter identification. Importantly, the identification procedure can be implemented as an automated algorithm, which can be run as many times as needed. This allows for the assessment of parameter errors using bootstrapping, which requires multiple realizations of the identification procedure (in our case, for 10,000 replications). Despite its simplicity, the model effectively handles various sources of uncertainty in Monte Carlo simulations, including environmental stochasticity, observational errors, and the lack of reliable catch statistics. In particular, the Monte Carlo approach mitigates the uncertainties inherent in external models that generate the temperature and salinity time series [40,41]. Validation of the model, using both qualitative (critical threshold exceedance) and quantitative (root mean squared error) criteria [52], demonstrated its ability to make accurate predictions in both stochastic and deterministic simulations.
Regarding the projection results, we note that the baseline scenarios of the Monte Carlo simulations for both temperature and salinity can be considered ‘soft’ in an ecological sense. Specifically, the spread of the modeled sea salinity trajectories, and the average trajectory of scenario S0 shown in Figure 2b, exhibit a tendency for salinity values to decrease. The same is true for the temperature factor. Although scenario T0 suggests a continued increase in temperature from 2021 to 2030 (see Figure 2a), this scenario represents the ‘optimistic’ predictions of global climate models [40], assuming climate protection measures are implemented and warming slows. Nevertheless, model (1)–(3) suggests further decline in the pikeperch population under the baseline scenario, which combines T0 and S0. According to the projection modeling, recovery of the population requires a more substantial reduction in both temperature and salinity, which seems unlikely (see Figure 3 and Table 2). While the inclusion of artificial stocking significantly increases the probability of recovery, stocking less than 25 mln recruits has no effect under the baseline scenarios.
Importantly, as a typical and highly vulnerable semi-anadromous species in the Azov Sea, pikeperch can be considered an indicator of the changes expected for other Azov Sea populations, such as Azov roach, bream, vimba, and sabrefish, which also suffer from climate change [9]. In this context, our modeling results align with the conclusions of Mirzoyan et al. [50], who provided an expert assessment of the recovery prospects for semi-anadromous pikeperch, roach, and bream populations in the Azov Sea. They emphasize that even the ‘optimistic’ hypothetical hydrological scenario for the period up to 2030—featuring sea salinity fluctuations within a range of 13.0 to 14.5‰ with an average of 14.3‰—cannot be considered favorable for pikeperch and bream populations. Only roach appears to have the capacity for significant stock recovery. In more realistic scenarios, bream, pikeperch, and roach will not experience considerable population growth. Recent events confirm this pessimistic outlook: since autumn 2024, harvesting of Azov roach has also been prohibited.
In addition to the fishing ban, ichthyologists recommend the restoration of artificial reproduction for semi-anadromous species, as their preservation depends on the continuous operation of hatcheries with spawning and rearing facilities [50,51]. In conjunction with these recommendations, the results of our simulations confirm that artificial reproduction and rearing of the pikeperch can be an effective means of stock rehabilitation, especially during the current period of abnormal increase in salinity and temperature of the sea. Table 2 suggests that the annual release of 25 million juveniles, reared under suitable artificial conditions and introduced into the Azov Sea to replenish the Azov pikeperch population, provides a reasonably high probability—exceeding 80%—of stock recovery, even under the baseline scenarios of temperature T0 and salinity S0 dynamics. Unfortunately, the floodplain fish hatcheries on the Don and Kuban rivers have become obsolete and are bankrupt [50]. Currently, only fish hatcheries in the Azov and Kuban limans retain reproductive potential; however, due to the poor hydrological conditions, only little quantity of juveniles effectively migrate to the sea, the Azov-Kuban limans serve today as refuges for pikeperch and cannot provide the necessary additional recruitment for the semi-anadromous population [50]. Our study suggests that such a situation is very bad for the Azov pikeperch due to the synergistic negative impacts of unfavorable temperature and salinity conditions. Thus, we have to conclude that warming, increased salinity, and the current deadlock state of the Azov hatcheries leave no chance for the recovery of the semi-anadromous pikeperch in the Azov Sea under realistic scenarios for the medium-term period of 2021–2030.
At the same time, despite the pessimistic inference made for the current decade, the modeling results also suggest that even though presently restoration measures do not allow achieving conditions of simulation scenarios resulting in stock recovery, artificial reproduction in combination with the rational use of water resources, cleaning riverbeds of small rivers, spawning grounds restoration, and regulation of river inflow aimed at decreasing salinity should be considered as quite effective recuperation methods for the future perspective. This is confirmed by practical experience of rehabilitation of pikeperch populations in other brackish waterbodies subject to increase of salinity due to climate change and mismanagement of water resources. The most well-known and dramatic example is the catastrophic transformation of the Aral Sea ecosystem that occurred between the 1960s and 1980s. This was caused by large-scale diversions of the Syr Darya and Amu Darya rivers into extensive canal systems to support cotton production. As a result, the water level dropped significantly, and salinization intensified—with salinity reaching 34–37‰ by 1992, compared to just 9–10‰ in the 1960s. The sea dried up and split into two separate bodies: the Small and Large Aral Seas, both of which lost their fishery value [53]. However, the construction of the Kokaral Dike in 2005 allowed the Syr Darya’s flow to be retained in the Small Aral Sea, leading to a rise in water level and a gradual decrease of water salinity. Creation of a freshened water zone for indigenous ichthyofauna helped to restore commercial fishery of the Aral roach, carp, bream, pikeperch, asp, sabrefish, rudd, and pike during the relatively short period of 1989–2010 [54]. Due to the continuing intense desalination of the Small Sea (<10‰), the population of semi-anadromous pikeperch inhabits almost all water area, performing seasonal pre-spawning migrations to the Syr Darya River [55].
A further reason the long-term forecast may be slightly more optimistic than the presented decadal projection is that the tolerance interval parameters estimated for Azov Sea pikeperch should not be considered as fixed, species-specific limits. These parameters reflect this particular population and the ecosystem’s current state. Over longer timescales, environmental changes may impact the population’s gene pool, given that every species possesses a certain adaptive potential, and such genetic adaptations could shift the peaks of the temperature and salinity-dependent bell-shaped survival functions [25]. Although the study of these selection mechanisms lies beyond the scope of the present medium-term forecasting work, the hypothesis of gradual acclimation merits attention and could be examined in the future with more detailed modeling approach that couples population dynamics with adaptation to external pressures (see, e.g., [24,56,57,58]).

5. Conclusions

The study demonstrates that simple population dynamics models can assess the viability of harvested fish populations under various environmental conditions and management strategies. Model (1)–(3) is based on a classical approach to describe the discrete-time dynamics of an age-structured population with a Ricker-type stock-recruitment relationship. The model parameters have clear ecological interpretations, and the parameter identification algorithm has demonstrated both efficacy and robustness in bootstrap and Monte Carlo simulations. The model analysis revealed that the dynamics of the semi-anadromous pikeperch population in the Azov Sea is essentially environment-driven. According to multi-scenario probabilistic projections for 2021–2030, pikeperch stock restoration during this period is achievable under unlikely conditions, assuming reduction of both temperature and salinity of the Azov Sea combined with additional five years of artificial restocking of juvenile pikeperch. To create conditions conducive to future stock recovery, a suite of urgent restoration measures is recommended, including: (i) strict enforcement of the fishing ban; (ii) renewal of hatcheries with spawning and rearing facilities and resumption of hatchery activities; (iii) restoration of spawning grounds; (iv) cleaning riverbeds of small rivers; (v) rational use of water resources of the Don and Kuban rivers; (vi) regular monitoring of population status and environmental drivers of population dynamics.
In future studies, the model can be applied to probabilistic assessment of the quasi-extinction risk of other semi-anadromous fish species affected by current climatic anomalies. At the same time, questions beyond the scope of the present approach, e.g., analysis of spatial dynamics and migration cycle, competition between native and invasive/introduced marine species, potential adaptation of fish to environmental changes, will require more detailed models that provide a more in-depth view of the system.

Author Contributions

Conceptualization and methodology, Y.V.T. and I.S.; software, I.S.; validation and research, Y.V.T. and I.S.; writing—original draft preparation, review and editing, Y.V.T. and I.S. All authors have read and agreed to the published version of the manuscript.

Funding

The work of Yu.V.T. was financially supported by the Ministry of Science and Higher Education of the Russian Federation (Agreement No. 075-15-2024-528 of 24.04.2024 on the implementation of a large-scale research project within the priority areas of scientific and technological development).

Institutional Review Board Statement

Not applicable.

Informed Consent Statement

Not applicable.

Data Availability Statement

All environmental, catch and abundance data, and the computer code for model simulations and parameter identification are available for download in GitHub (accessed on 29 December 2024) under the reference DOI:10.5281/zenodo.15625329.

Acknowledgments

We thank warmly Valery Kulygin for providing us with observed and projected time series of average annual temperature and salinity, used as input data of the model. We also thank Elena Ponomareva and Daniil Bukhmin for their help in collecting the most recent catch and stock estimation data.

Conflicts of Interest

The authors declare no conflicts of interest.

Appendix A

To demonstrate the effectiveness of including Gaussian terms in system (1)–(3), we consider a simplified nonlinear statistical model in which recruit abundance N 0 (dependent variable) is assumed to be directly proportional to the product of two Gaussian functions of salinity S and temperature T (independent variables):
N 0 = a e S S 0 σ S 2 e T T 0 σ T 2 .
Applying logarithmic transformation to Equation (A1), we get a regression model expressing ln N 0 as a linear function of ( S S 0 ) 2 and ( T T 0 ) 2 :
ln N 0 = C + A ( S S 0 ) 2 + B ( T T 0 ) 2 .
Next, we fit the linear regression model (A2) to available data consisting of 55 annual records of recruit abundance and corresponding mean annual salinity and temperature of the Azov Sea over 1950–1981 and 1986–2008. Results of the regression analysis are summarized in Table A1. They suggest that even the highly simplified model (A1), omitting age structure and density dependence in reproduction, fits the data satisfactorily, explaining 40% of the variation in ln N 0 and reflecting the negative effect of environmental variables deviating from their optimal values (Figure A1).
Table A1. Results of the regression analysis with linear model (A2).
CoefficientValueSEt-Statp-Value
C3.96890.3473911.4258.5758 × 10 16
A−0.471120.1293−3.64350.00062093
B−0.389660.075378−5.16943.7966 × 10 6
Number of observations: 55, Error degrees of freedom: 52
Root Mean Squared Error: 1.42
R-squared: 0.414, Adjusted R-Squared: 0.391
F-statistic vs. constant model: 18.4, p-value = 9.25 × 10 7
Figure A1. A regression plane obtained with linear model (A2), demonstrating the negative relationship between log-transformed number of pikeperch recruits and squared deviations of water salinity and temperature from their optimal values.
Mathematics 13 03232 g0a1

References

  1. Tyutyunov, Y.; Senina, I.; Jost, C.; Arditi, R. Risk assessment of the harvested pike-perch population of the Azov Sea. Ecol. Modell. 2002, 149, 297–311. [Google Scholar] [CrossRef]
  2. Dudkin, S.I.; Leontiev, S.Y.; Mirzoyan, A.V. The state of stocks and catches of commercial fish species of the Azov and Black Seas for the period 2000–2020: Dynamics and trends. Trudy VNIRO 2024, 195, 35–44. (In Russian) [Google Scholar] [CrossRef]
  3. Zhivoglyadov, A.A.; Luk’yanov, S.V. Stock assessment of the current state of the zander Sander lucioperca population in the Azov Sea basin. Probl. Fish. 2018, 19, 405–415. (In Russian) [Google Scholar]
  4. Podoinitsyn, D.A. Modern ecological state of pike perch population in the Azov Sea. Izv. Vuzov Sev.-Kavkaz. Region, Ser. Estestv. Nauki 2010, 4, 111–112. (In Russian) [Google Scholar]
  5. Balykin, P.A.; Ponomareva, E.N.; Sorokina, M.N.; Startsev, A.V. Changes in the size and composition of catches in the Taganrog Bay in the 21st century. Nauka Yuga Rossii 2022, 18, 55–61. [Google Scholar] [CrossRef]
  6. Ponomareva, E.; Balykin, P.; Startsev, A.; Savitskaya, S.; Sorokina, M.; Korchunov, A. Current state of the Sea of Azov main commercial fishery resources and ways to restore them. E3S Web Conf. 2023, 431, 01055. [Google Scholar] [CrossRef]
  7. Tyutyunov, Y.V.; Senina, I.N.; Titova, L.I.; Dashkevich, L.V. Long-range prediction of the risk of extinction faced by the pikeperch in the Azov Sea: Was the prediction correct? Biophysics 2020, 65, 338–348. [Google Scholar] [CrossRef]
  8. Berdnikov, S.V.; Dashkevich, L.V.; Kulygin, V.V. A new state in the hydrological regime of the Sea of Azov in the 21th century. Dokl. Earth Sci. 2022, 503, 123–128. [Google Scholar] [CrossRef]
  9. Berdnikov, S.V.; Sorokina, V.V.; Kleshchenkov, A.V.; Tyutyunov, Y.V.; Kulygin, V.V.; Kovaleva, G.V.; Bulysheva, N.I. Marine indicators of climate change in the Azov Sea ecosystem. J. Sea Res. 2023, 193, 102373. [Google Scholar] [CrossRef]
  10. Balykin, P.A.; Kutsyn, D.N.; Orlov, A.M. Changes in salinity and species composition of ichthyofauna in the Sea of Azov. Oceanology 2019, 59, 358–366. [Google Scholar] [CrossRef]
  11. Kjellman, J.; Lappalainen, J.; Urho, L. Influence of temperature on size and abundance dynamics of age-0 perch and pikeperch. Fish. Res. 2001, 53, 47–56. [Google Scholar] [CrossRef]
  12. Ložys, L. The growth of pikeperch (Sander lucioperca L.) and perch (Perca fluviatilis L.) under different water temperature and salinity conditions in the Curonian Lagoon and Lithuanian coastal waters of the Baltic Sea. Hydrobiologia 2004, 514, 105–113. [Google Scholar] [CrossRef]
  13. Gröger, J.P.; Winkler, H.; Rountree, R.A. Population dynamics of pikeperch (Sander lucioperca) and its linkage to fishery driven and climatic influences in a southern Baltic lagoon of the Darss-Zingst Bodden Chain. Fish. Res. 2007, 84, 189–201. [Google Scholar] [CrossRef]
  14. Heikinheimo, O.; Pekcan-Hekim, Z.; Raitaniemi, J. Spawning stock–recruitment relationship in pikeperch Sander lucioperca (L.) in the Baltic Sea, with temperature as an environmental effect. Fish. Res. 2014, 155, 1–9. [Google Scholar] [CrossRef]
  15. Olin, M.; Heikinheimo, O.; Lehtonen, T.K.; Raitaniemi, J. Long-term monitoring of pikeperch (Sander lucioperca) populations under increasing temperatures and predator abundances in the Finnish coastal waters of the Baltic Sea. Ecol. Freshw. Fish. 2023, 32, 750–764. [Google Scholar] [CrossRef]
  16. Goptarev, N.P.; Simonov, A.I.; Zatuchnaya, B.M.; Gershanovich, D.E. Hydrometeorology and Hydrochemistry of Seas of the USSR. Vol. 5. The Sea of Azov; Gidrometeoizdat: St. Petersburg, Russia, 1991; 236p. (In Russian) [Google Scholar]
  17. Lund, I.; Rodríguez, C.; Izquierdo, M.S.; El Kertaoui, N.; Kestemont, P.; Reis, D.B.; Dominguez, D.; Pérez, J.A. Influence of salinity and linoleic or α-linolenic acid based diets on ontogenetic development and metabolism of unsaturated fatty acids in pike perch larvae (Sander lucioperca). Aquaculture 2019, 500, 550–561. [Google Scholar] [CrossRef]
  18. Chernichko, J.I.; Demchenko, V.A.; Podorozhny, S.N.; Zhmud, M.Y.; Suchkov, S.I. Possible impact of different scenarios of climate change on the formation of some ecosystem services in the Azov-Black Sea region. IOP Conf. Ser. Earth Environ. Sci. 2022, 1049, 012065. [Google Scholar] [CrossRef]
  19. Shelford, V.E. Animal Communities in Temperate America as Illustrated in the Chicago Region: A Study in Animal Ecology; Univ. of Chicago Press: Chicago, IL, USA, 1913; 362p. [Google Scholar]
  20. Shelford, V.E. Some concepts of bioecology. Ecology 1931, 12, 455–467. [Google Scholar] [CrossRef]
  21. Lynch, M.; Gabriel, W. Environmental tolerance. Am. Nat. 1987, 129, 283–303. [Google Scholar] [CrossRef]
  22. Erofeeva, E.A. Plant hormesis and Shelford’s tolerance law curve. J. For. Res. 2021, 32, 1789–1802. [Google Scholar] [CrossRef]
  23. Senina, I.; Tyutyunov, Y.; Arditi, R. Extinction risk assessment and optimal harvesting of anchovy and sprat in the Azov Sea. J. Appl. Ecol. 1999, 36, 297–306. [Google Scholar] [CrossRef]
  24. Senina, I.N.; Lehodey, P.; Hampton, J.; Sibert, J. Quantitative modelling of the spatial dynamics of South Pacific and Atlantic albacore tuna populations. Deep-Sea Res. II Top. Stud. Oceanogr. 2020, 175, 104667. [Google Scholar] [CrossRef]
  25. Gabriel, W.; Lynch, M. The selective advantage of reaction norms for environmental tolerance. J. Evol. Biol. 1992, 5, 41–59. [Google Scholar] [CrossRef]
  26. Skagen, D.W.; Skern-Mauritzen, M.; Dankel, D.; Enberg, K.; Kjesbu, O.S.; Nash, R.D.M. A simulation framework for evaluating fisheries management decisions using environmental information. ICES J. Mar. Sci. 2013, 70, 743–754. [Google Scholar] [CrossRef]
  27. Senina, I. innasenina/pikeperch-model: v3.0-pikeperch-model-with-cc (v3.0). Zenodo 2025, 15625329. [Google Scholar] [CrossRef]
  28. Ricker, W.E. Stock and recruitment. J. Fish. Res. Board Can. 1954, 11, 559–623. [Google Scholar] [CrossRef]
  29. Elaydi, S.N. An Introduction to Difference Equations, 3rd ed.; Springer: New York, NY, USA, 2005; 546p. [Google Scholar] [CrossRef]
  30. Beverton, R.J.H.; Holt, S.J. On the Dynamics of Exploited Fish Populations; Springer: Cham, The Netherlands, 1957; 538p. [Google Scholar] [CrossRef]
  31. Belousov, V.N. History of harvesting pikeperch Stizostedion lucioperca (Linnaeus, 1758) in the Azov Sea. Izv. Vuzov Sev.-Kavkaz. Reg. Ser. Estestv. Nauki 2004, 5, 47–65. (In Russian) [Google Scholar]
  32. Belousov, V.N. The Formation and Use of the Stock of Semi-Anadromous Pikeperch Stizostedion lucioperca (Linnaeus, 1758) in Conditions of Varying Regime of the Azov Sea; Extended Abstract of Candidate’s Dissertation in Biology; Kuban State Agrarian University: Krasnodar, Russia, 2004; 34p. (In Russian) [Google Scholar]
  33. Luk’yanov, S.V.; Zhivoglyadov, A.A. Environmental problems of formation of the stock of pike-perch Stizostedion lucioperca (Linnaeus, 1758) in the Azov Sea. In Ecological, Industrial and Energy Safety; Lukina, L.I., Bezhina, N.A., Lyamina, N.V., Eds.; Sevastopol State University: Sevastopol, Crimea, 2018; pp. 739–743. (In Russian) [Google Scholar]
  34. Luk’yanov, S.V.; Zhivoglyadov, A.A. Catadromous pike perch of the Azov Sea Stizostedion lucioperca (Linnaeus, 1758) in the conditions of salinity increase. In The Wildlife Management Conflict: A Role in Noosphere Evolution; Shuvaev, N.S., Kolchin, E.A., Eds.; Astrakhan State University: Astrakhan, Russia, 2019; pp. 78–83. (In Russian) [Google Scholar]
  35. Boiko, E.G. Evaluating natural mortality in the Azov zander (Stizostedion lucioperca). In Translation Series No. 541; Ricker, W.E., Ed.; Fisheries Research Board of Canada, Biological Station: Nanaimo, BC, Canada, 1964; Available online: https://waves-vagues.dfo-mpo.gc.ca/Library/29894.pdf (accessed on 10 August 2025).
  36. Bronfman, A.M.; Dubinina, V.G.; Makarova, G.D. Hydrological and Hydrochemical Bases of Productivity of the Sea of Azov; Pishchevaya Promyshlennost: Moscow, Russia, 1979; 288p. (In Russian) [Google Scholar]
  37. Efron, B.; Tibshirani, R.J. An Introduction to the Bootstrap; Chapman and Hall: London, UK, 1994; 456p. [Google Scholar]
  38. Gribanova, S.E.; Zaydiner, Y.I.; Landar, E.A.; Popova, L.V.; Filchagina, I.N. (Eds.) Catches of Fish and Non-Fish Objects by Fishery Organizations of the Azov-Black Sea Basin (1995–2000). Statistical Collection; Everest: Rostov-on-Don, Russia, 2003; 90p. (In Russian) [Google Scholar]
  39. Zaydiner, Y.I.; Popova, L.V. (Eds.) Catches of Fish and Non-Fish Objects by Fishery Organizations of the Azov-Black Sea Basin (1990–1995). Statistical Collection; Molot: Rostov-on-Don, Russia, 1997; 100p. (In Russian) [Google Scholar]
  40. Eyring, V.; Bony, S.; Meehl, G.A.; Senior, C.A.; Stevens, B.; Stouffer, R.J.; Taylor, K.E. Overview of the coupled model Intercomparison project phase 6 (CMIP6) experimental design and organization. Geosci. Model Dev. 2016, 9, 1937–1958. [Google Scholar] [CrossRef]
  41. Bronfman, A.M.; Surkov, F.A. A statistical model of salinity in the Azov Sea. Trudy VNIRO 1976, 118, 62–69. (In Russian) [Google Scholar]
  42. Jakeman, A.J.; Letcher, R.A.; Norton, J.P. Ten iterative steps in development and evaluation of environmental models. Environ. Model. Softw. 2006, 21, 602–614. [Google Scholar] [CrossRef]
  43. Abakumov, A.; Izrailsky, Y. Optimal harvest problem for fish population—Structural stabilization. Mathematics 2022, 10, 986. [Google Scholar] [CrossRef]
  44. Danilov, M.B.; Kriksunov, E.A.; Bobyrev, A.E.; Sheremet’ev, A.D.; Mel’nik, M.M.; Severin, S.O. Dynamics of the Sander lucioperca population in lake Peipsi-Pihkva. J. Ichthyol. 2018, 58, 531–544. [Google Scholar] [CrossRef]
  45. Il’ichev, V.G.; Rokhlin, D.B. Internal prices and optimal exploitation of natural resources. Mathematics 2022, 10, 1860. [Google Scholar] [CrossRef]
  46. Medvinsky, A.B.; Bobyrev, A.E.; Burmensky, V.A.; Kriksunov, E.A.; Nurieva, N.I.; Rusakov, A.V. Modelling aquatic communities: Trophic interactions and the body mass-and-age structure of fish populations give rise to long-period variations in fish population size. Russ. J. Numer. Anal. Math. Model. 2015, 30, 55–70. [Google Scholar] [CrossRef]
  47. Neverova, G.P.; Abakumov, A.I.; Yarovenko, I.P.; Frisman, E.Y. Mode change in the dynamics of exploited limited population with age structure. Nonlinear Dyn. 2018, 94, 827–844. [Google Scholar] [CrossRef]
  48. Revutskaya, O.; Neverova, G.; Frisman, E. Fluctuations in real population sizes: Mathematical modeling and estimation of demographic parameters. Ecol. Model. 2025, 507, 111175. [Google Scholar] [CrossRef]
  49. Tyutyunov, Y.; Arditi, R.; Büttiker, B.; Dombrovsky, Y.; Staub, E. Modelling fluctuations and optimal harvesting in perch populations. Ecol. Model. 1993, 69, 19–42. [Google Scholar] [CrossRef]
  50. Mirzoyan, A.V.; Belousov, V.N.; Shevchenko, V.N.; Polin, A.A.; Rybalchenko, A.D.; Poroshina, E.A. Artificial reproduction of semi-anadromous fish species under different development scenarios of hydrological situation in the Azov Sea. Aquat. Bioresour. Environ. 2023, 6, 91–108. (In Russian) [Google Scholar] [CrossRef]
  51. Zherdev, N.A.; Luk’yanov, S.V. Status of the Azov Sea populations of roach and zander at the present time. Proc. AzNIIRKH 2021, 3, 31–41. (In Russian) [Google Scholar]
  52. Jacobs, B.; Tobi, H.; Hengeveld, G.M. Linking error measures to model questions. Ecol. Modell. 2024, 487, 110562. [Google Scholar] [CrossRef]
  53. Kamilov, B. The use of irrigation systems for sustainable fish production: Uzbekistan. In Fisheries in Irrigation Systems of Arid Asia. FAO Fisheries Technical Paper 430; Petr, T., Ed.; FAO: Rome, Italy, 2003; pp. 115–126. Available online: https://www.fao.org/4/y5082e/y5082e0e.htm (accessed on 9 April 2025).
  54. Ermakhanov, Z.K.; Plotnikov, I.S.; Aladin, N.V.; Micklin, P. Changes in the Aral Sea ichthyofauna and fishery during the period of ecological crisis. Lakes Reserv. Res. Manag. 2012, 17, 3–9. [Google Scholar] [CrossRef]
  55. Berdiakhmetkyzy, S.; Assylbekova, S.Z.; Abdybekova, A.; Barakbaev, T. Current state of populations of the main commercial fish species of the Small Aral Sea. Exp. Biol. 2021, 88, 120–129. [Google Scholar] [CrossRef]
  56. Lehodey, P.; Senina, I.; Nicol, S.; Hampton, J. Modelling the impact of climate change on South Pacific albacore tuna. Deep-Sea Res. II Top. Stud. Oceanogr. 2015, 113, 246–259. [Google Scholar] [CrossRef]
  57. Neverova, G.P.; Frisman, E.Y. Dynamic modes of population size and its genetic structure for species with nonoverlapping generations and stage development. Commun. Nonlinear Sci. 2021, 94, 105554. [Google Scholar] [CrossRef]
  58. Lamarins, A.; Carlson, S.M.; Prévost, E.; Satterthwaite, W.H.; Buoro, M. Eco-evolutionary consequences of selective exploitation on metapopulations illustrated with Atlantic Salmon. Fish Fish. 2025, 26, 291–305. [Google Scholar] [CrossRef]
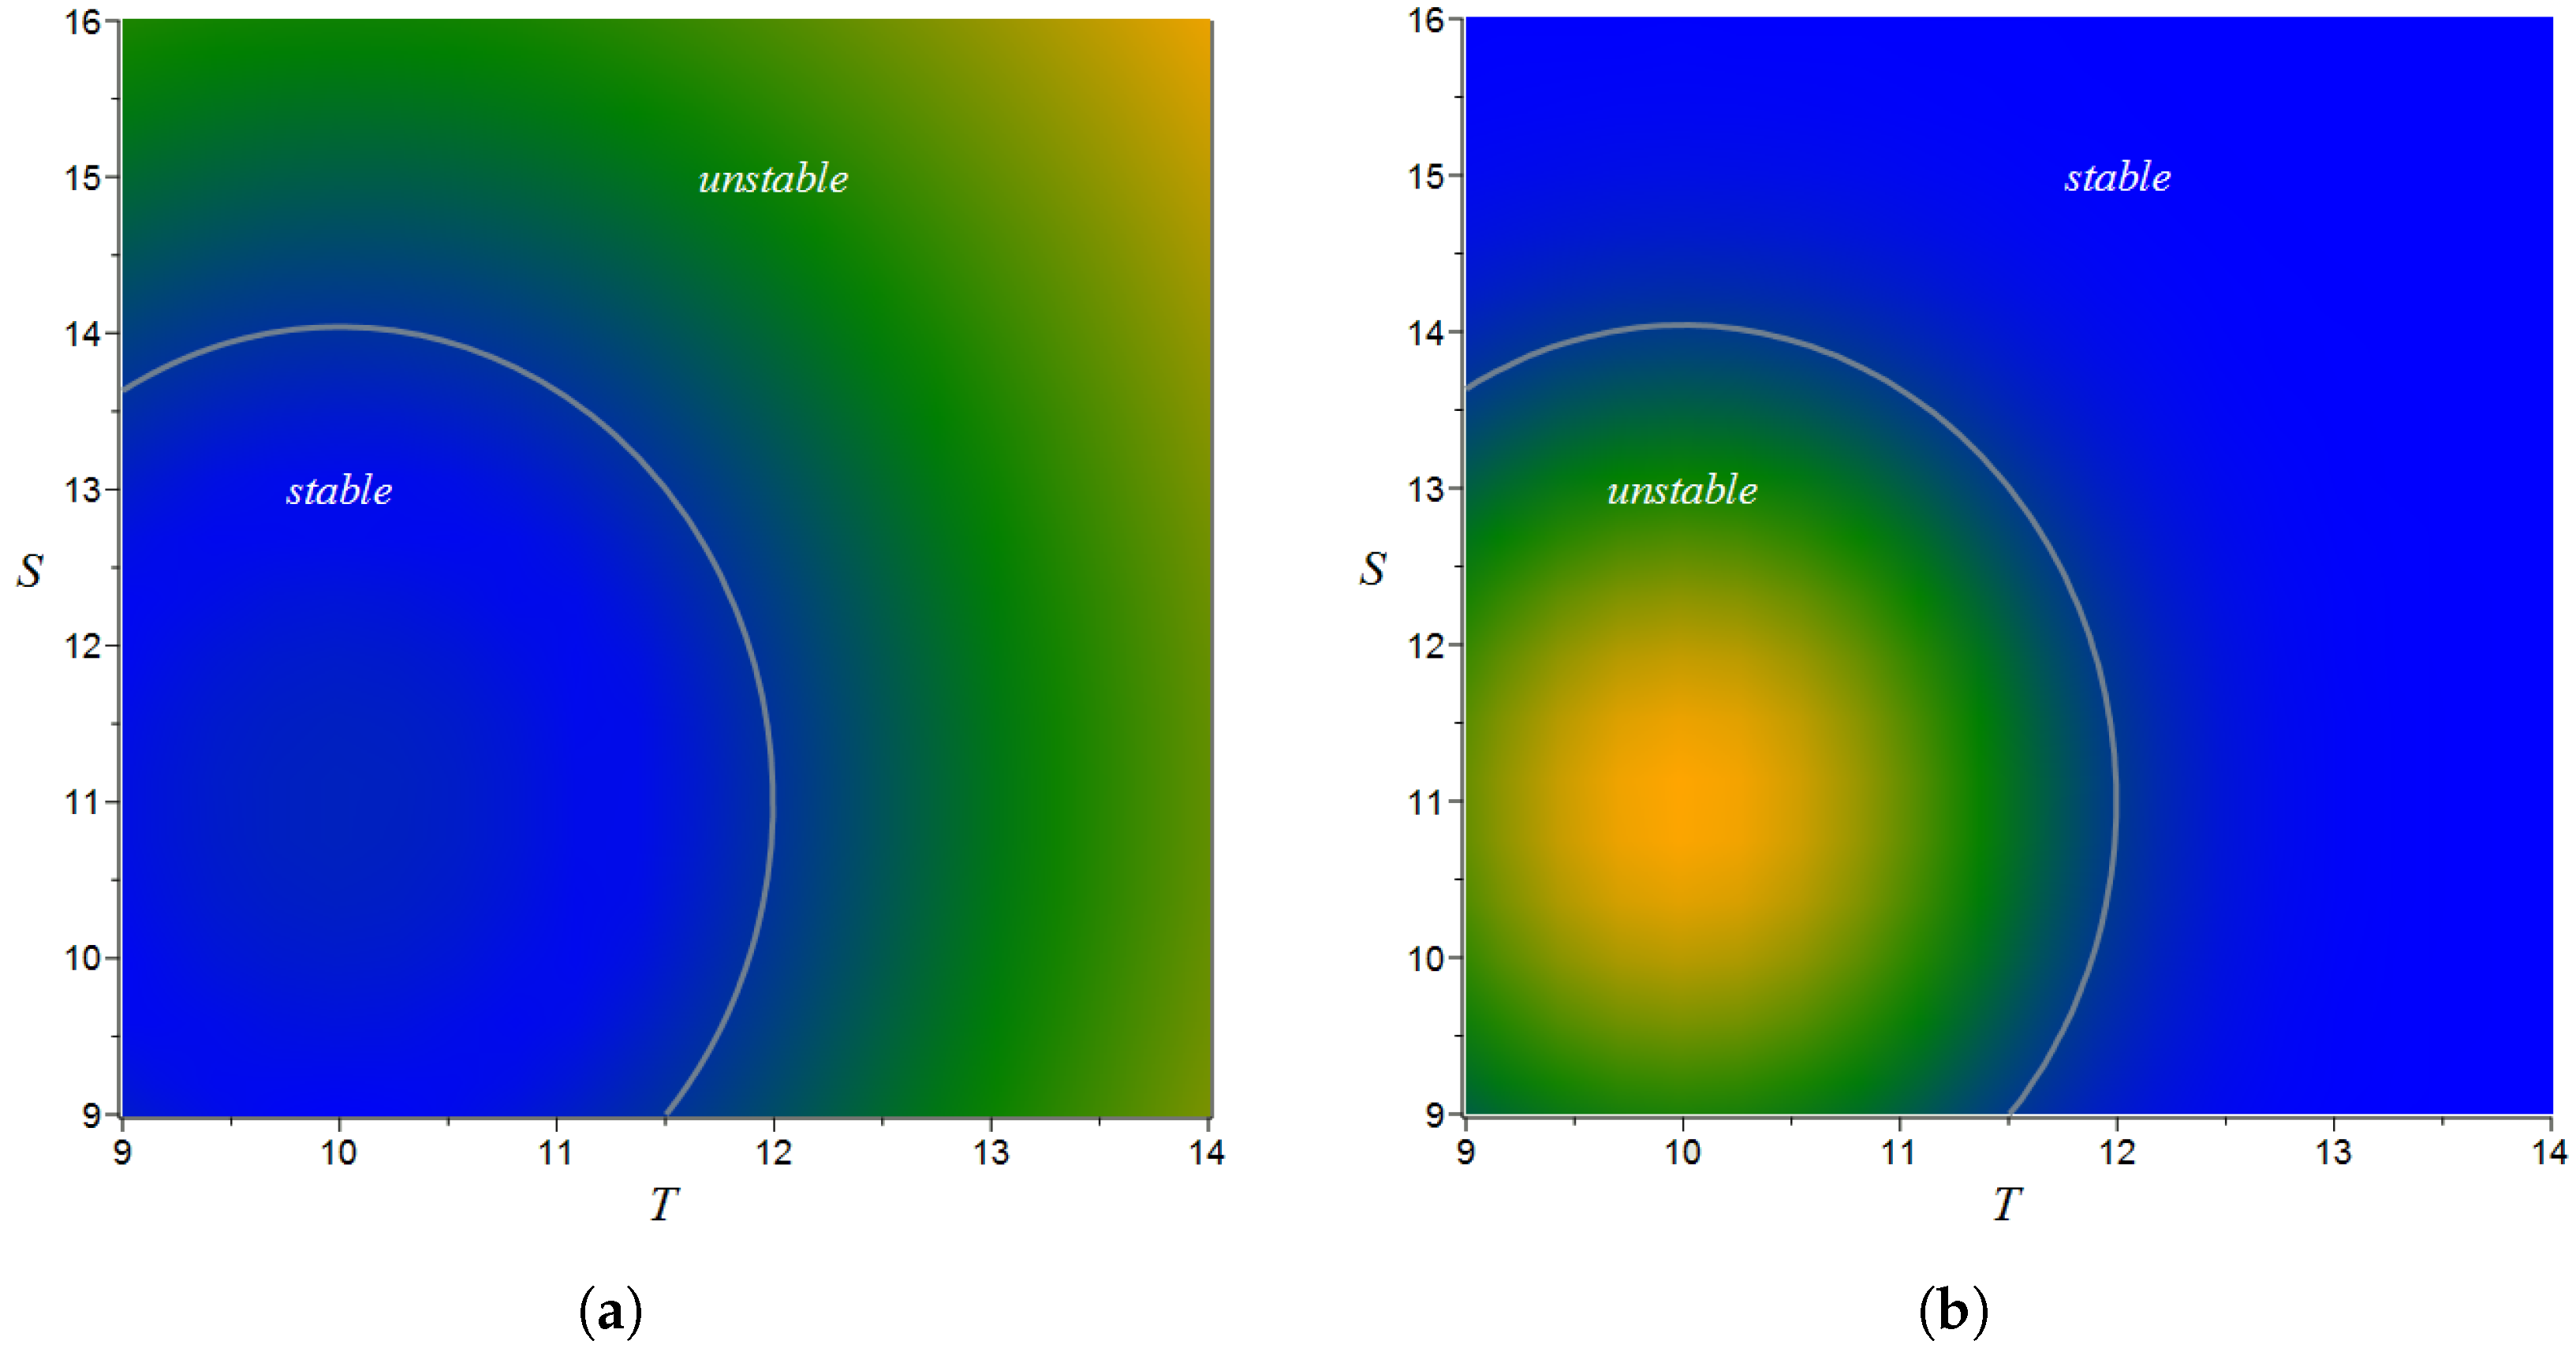
Figure 1. Dependence of the spectral radius ρ ( J ) = max λ i of the Jacobian of system (1)–(3) on temperature T and salinity S, evaluated for nontrivial (a) and trivial (b) equilibrium. The dark (cold) and light (warm) colors represent domains with ρ ( J ) < 1 and ρ ( J ) > 1 , respectively. The grey curve indicates the stability-domain boundary corresponding to ρ ( J ) = 1 .
Mathematics 13 03232 g001
Figure 2. Time series of external factors—annual mean water temperature and salinity of the Azov Sea. From 1950 to 2020—observed data; 2021–2030—set of 200 stochastic trajectories generated by external models. Black diamonds show the most recent observed values.
Mathematics 13 03232 g002
Figure 3. Modeled and observed (marked lines) abundances of the age groups. Solid lines show mean trajectories; shaded bands—the range between 0.05 and 0.95 quantiles of the spread of Monte Carlo trajectories. The ‘Projection’ part includes model projections under baseline scenario T0S0 and two ‘optimistic’ scenarios: T2S3—with more favorable temperature and salinity conditions, and T2S3+—the same with additional artificial restocking of 10 mln juveniles. Description of scenarios is given in Section 2.4.
Mathematics 13 03232 g003
Figure 4. Modeled (solid lines) and observed (marked lines) catch. Shaded area shows the range between 0.05 and 0.95 quantiles of the spread of Monte Carlo trajectories, obtained with added variability of fishing effort, while modeled trajectory is the mean of Monte Carlo trajectories.
Mathematics 13 03232 g004
Table 1. Parameter estimates and bootstrap standard errors.
NotationParameterEstimateBootstrap Mean ± SE
a 1 Yearling reproduction6.77 6.93 ± 3.68
a 2 Adult reproduction12.59 12.67 ± 3.44
bIntraspecific competition0.039
p 0 Survival of recruits0.55 0.54 ± 0.09
p 1 Survival of yearlings0.47 0.48 ± 0.08
p 2 Survival of adults0.62
σ T Temperature tolerance1.26 1.28 ± 0.17
σ S Salinity tolerance1.92 1.95 ± 0.29
T 0 Optimal temperature, °C10
S 0 Optimal salinity, ‰11
Table 2. Probabilities of population recovery (exceeding threshold of 1.38 million adult pikeperch) in 2021–2030, computed for different combinations of temperature and salinity scenarios (baseline scenarios of temperature Tk and salinity Sk dynamics, reduced by k = 0 , 1 , 2 , and 3 degrees and per mille respectively) with and without additional option of artificial restocking of 10, 20, and 25 million recruits per year during the first 5 years of the projection period.
SalinityTemperature ScenarioTemperature ScenarioTemperature ScenarioTemperature Scenario
ScenarioT0T1T2T3T0T1T2T3T0T1T2T3T0T1T2T3
S00.000.000.000.000.000.030.090.120.050.130.210.250.800.830.840.86
S10.000.000.000.020.010.150.280.370.190.400.600.710.860.930.960.98
S20.000.000.060.240.070.520.870.940.580.940.991.000.971.001.001.00
S30.000.000.870.970.310.981.001.000.961.001.001.001.001.001.001.00
StockingWithout restocking10 mln released recruits20 mln released recruits25 mln released recruits
The bold values represent strategies ensuring high (exceeding 70%) probabilities of population recovery.
Disclaimer/Publisher’s Note: The statements, opinions and data contained in all publications are solely those of the individual author(s) and contributor(s) and not of MDPI and/or the editor(s). MDPI and/or the editor(s) disclaim responsibility for any injury to people or property resulting from any ideas, methods, instructions or products referred to in the content.