Article

Theoretical Modeling of Light-Fueled Self-Harvesting in Piezoelectric Beams Actuated by Liquid Crystal Elastomer Fibers

1
School of Mechanical and Electrical Engineering, Anhui Jianzhu University, Hefei 230601, China
2
School of Civil Engineering, Anhui Jianzhu University, Hefei 230601, China
*
Author to whom correspondence should be addressed.
Mathematics 2025, 13(19), 3226; https://doi.org/10.3390/math13193226
Submission received: 3 September 2025 / Revised: 30 September 2025 / Accepted: 6 October 2025 / Published: 8 October 2025
(This article belongs to the Special Issue Mathematical Models in Mechanics and Engineering)

Abstract

Traditional energy harvesting systems, such as photovoltaics and wind power, often rely on external environmental conditions and are typically associated with contact-based vibration wear and bulky structures. This study introduces light-fueled self-vibration to propose a self-harvesting system, consisting of liquid crystal elastomer fibers, two resistors, and two piezoelectric cantilever beams arranged symmetrically. Based on the photothermal temperature evolution, we derive the governing equations of the liquid crystal elastomer fiber–piezoelectric beam system. Two distinct states, namely a self-harvesting state and a static state, are revealed through numerical simulations. The self-oscillation results from light-induced cyclic contraction of the liquid crystal elastomer fibers, driving beam bending, stress generation in the piezoelectric layer, and voltage output. Additionally, the effects of various system parameters on amplitude, frequency, voltage, and power are analyzed in detail. Unlike traditional vibration energy harvesters, this light-fueled self-harvesting system features a compact structure, flexible installation, and ensures continuous and stable energy output. Furthermore, by coupling the light-responsive LCE fibers with piezoelectric transduction, the system provides a non-contact actuation mechanism that enhances durability and broadens potential application scenarios.
MSC:
65L60; 70H25; 34C15; 78M34; 74E30

1. Introduction

Environmental energy harvesting technologies capture widely available energy sources, such as mechanical vibrations [1], thermal gradients [2], and light radiation [3], that are available in the environment and transform them into electrical energy suitable for practical use, providing a sustainable power solution for distributed, low-power electronic devices [4,5]. With advantages such as environmental adaptability, sustainability, and ease of system integration, these technologies exhibit significant application potential in fields such as smart sensor networks and soft robotics. Among the various energy sources, vibration energy harvesting has attracted particular attention due to the ubiquity of environmental vibration, making vibration-based systems particularly suitable for powering unmanned devices [6].
To further explore the vibration energy harvesting, these technologies are mainly categorized into three types based on their energy conversion mechanisms: piezoelectric [7], electromagnetic [8], and electrostatic [9]. Among these, piezoelectric-based energy harvesting is particularly suitable for miniaturized systems. It directly converts mechanical energy into electrical energy through asymmetric strain within the material’s internal lattice structure [10]. These systems typically rely on external forced vibration sources [11], such as the operation of mechanical equipment [12], vehicle motion [13], or human activity [14], to generate periodic deformation in the piezoelectric material, enabling energy conversion. However, when the excitation frequency in the environment differs from the system’s resonant frequency, the energy conversion efficiency decreases significantly, limiting the performance of traditional systems in dynamic environments [15]. Despite these advantages, traditional vibration energy harvesting systems face severe limitations in dynamic or unstable environments, prompting the need for more adaptable energy harvesting systems.
Recently, self-oscillating systems have attracted significant attention, as they are capable of autonomously generating and sustaining oscillations under continuous external stimuli [16,17], such as electric fields [18], thermal energy [19], and light [20]. Self-oscillating systems based on responsive materials are characterized by simple structures, high sensitivity, strong robustness, and the absence of specialized controllers [21], and have found extensive applications in frontier fields such as autonomous robots [22], soft robots [23,24], actuators [25], biomimetic systems [26,27], and 3D printing technologies [28,29,30,31]. Among various external stimuli, light has become a particularly attractive driving mechanism for constructing self-oscillating systems, due to its non-contact operation, high spatial resolution, ease of integration, and precise controllability [32,33,34,35]. Liquid crystal elastomer (LCE) [36,37,38,39,40], as a representative class of light-responsive active materials, has received considerable attention due to combining the orientational order of liquid crystal molecules with the elastic properties of polymer networks [41,42]. The deformation of LCE can be precisely controlled by adjusting the intensity, wavelength, and angle of the light source, thereby enabling the design of diverse types of self-oscillating systems. The self-sustained motion modes include bending [43], toppling [44], wobbling [45], swinging [46,47], rolling [48,49], wrinkling [50], ejecting [51], tapping [52], vibration [53,54], chaotic dynamics [55,56], and even synchronized motions of coupled self-oscillators [57].
Although various light-driven self-oscillating systems have been widely studied in previous works, traditional piezoelectric energy harvesters still face significant challenges, as they typically rely on external mechanical vibrations that cause wear of mechanical components and limit long-term reliability [58]. In addition, such systems often require complex controllers and involve bulky structures [59]. To address these issues, this study introduces an LCE fiber–piezoelectric beam system based on light-fueled self-oscillation. In this system, the LCE fibers contract under light illumination, pulling the piezoelectric beam to generate self-oscillation, which in turn drives the piezoelectric layer on the beam to harvest energy. The use of light as a non-contact driving source avoids mechanical wear and allows for flexible operation under varying light conditions, while the intrinsic self-oscillation eliminates the need for external mechanical vibrations or complex controllers. By integrating the responsive characteristics of LCE materials with piezoelectric energy harvesting, this work provides a new strategy for light-fueled energy harvesting and demonstrates potential applications in adaptive robotics and self-powered devices.
The structure of this paper is as follows. In Section 2, we establish a light-fueled self-harvesting system and solve the dimensionless govern equations by using a developed LCE dynamics model. In Section 3, through numerical calculations, we reveal the static and self-harvesting states of the LCE fiber–piezoelectric beam in the linear optical environment. In Section 4, we investigate the effects of various system parameters on the amplitude, frequency, voltage and power of the system. Finally, we provide the conclusions in Section 5.

2. Theoretical Model and Formulation

In this section, a theoretical model for the LCE fiber–piezoelectric beam system is established. The dynamic model of the system is developed by considering kinetic energy, strain energy, electric field potential energy, and non-conservative forces, including damping forces and the tension in the LCE fibers. Since the main objective of this study is to capture the fundamental dynamic mechanism, factors such as thermal noise or illumination instabilities that may occur in real environments are not included here. To facilitate analysis, the governing equations are then derived, non-dimensionalized, and solved using the Galerkin method with variable separation.

2.1. The Temperature Field of the LCE Fiber

The physical model of the LCE fiber–piezoelectric beam system is illustrated in Figure 1. The system consists of two piezoelectric bimorph cantilevered beams, densely arranged vertically distributed optical response LCE fibers, and gradient light. Figure 1a shows the initial length of LCE fibers as L i s , in the LCE fiber, the molecular rods inside the fiber are preferentially arranged along its axis, referred to as nematic. With the effect of gravity on the piezoelectric beam neglected, and the beam remains unbent. Where the piezoelectric bimorph cantilevered beam consists of a substrate and two upper and lower piezoelectric layers. The piezoelectric layers are assumed to be tightly bonded to the substrate, with both the top and bottom surfaces covered by electrodes. The electrodes thickness between the substrate and piezoelectric layers, as well as the electrode thickness on the top and bottom surfaces of the piezoelectric layers, can be neglected. Both layers exhibit the same linear elastic behavior. In the present study, the material properties are assumed to be uniform, and perfect bonding is assumed at all interfaces. These simplify the model and highlight the main mechanism under investigation. The beam has a length of L b , a width of b , and a thickness of h b . The unit mass of the piezoelectric layer is m . Figure 1b represents the initial state. The system is connected in series to an external resistor R L . The LCE fibers is closely distributed along the piezoelectric beam, varying linearly with position, with the fiber’s mass neglected. In Figure 1b, a coordinate system is established, with the u -axis along the beam’s direction and the v -axis perpendicular to the beam’s end, where the beam’s end is the origin. The angle between the lower piezoelectric beam and the horizontal axis is θ , and the two beams are symmetrically arranged. The angle between the lower piezoelectric beam and the horizontal axis is θ , and the two beams are symmetrically arranged. In this configuration, a non-linear light field with 808 nm wavelength source [60] is applied as the driving illumination, which is commonly employed in LCE actuation studies due to its efficient absorption and photothermal conversion. Figure 1c depicts the possible self-harvesting behavior of the system throughout its motion. The LCE fiber can capture light energy along its axis, and the rod-like molecules inside the fiber shift from the nematic state to the isotropic state, resulting in contraction of the fiber under the light field. When the beam bends, the LCE fiber moves into the low-light region. At low light intensity, a transition between the isotropic and nematic phases takes place, allowing the fiber to fully recover its initial length and relocate to the high-light region. Figure 1d shows the LCE fibers driving force q LCE s and the damping force q d s acting on the piezoelectric beam. Figure 1e shows the LCE fibers tension q LCE s , which provides the driving force for the system. During each self-oscillating cycle, the LCE fibers contracts and recovers, pulling the piezoelectric beam to deform and output electrical energy.
The force generated by the fiber q LCE is directly related to its deformation from light exposure, causing strain within the material, defined as
q LCE = K ε e ,
where K denotes the elastic coefficient of LCE fiber, and the elastic strain ε e caused by the fiber force is expressed as
ε e = ε tot ε light ,
where ε tot is the total strain and ε light is the optical strain. The total strain ε tot is expressed as
ε tot = 2 v cos θ 0 2 u sin θ 0 L i 2 s sin θ 0 .
The constraint condition considering the beam’s inability to elongate is [61]
v 2 + 1 + u 2 = 1 .
Substituting Equation (4) into Equation (3), we obtain
ε tot = 2 v cos θ 0 2 sin θ 0 0 ξ 1 2 v 2 d ξ L i 2 s sin θ 0 .
Assuming a linear relation between the optical strain ε light and the temperature difference T t [62], the optical strain is defined as
ε light = α 1 T t ,
where α 1 is the contraction coefficient, α 1 > 0 denotes the negative light-driven strain and fiber contraction, and α 1 < 0 represents the light-driven expansion. LCEs undergo a nematic–isotropic phase transition within a characteristic temperature range, depending on their chemical composition. To ensure that the actuation behavior is fully captured, we consider a photothermal intensity corresponding to a temperature range of 0–200 ° C [63]. Under these conditions, we discuss the temperature field evolution in the LCE fiber. Due to its small radius d = 10 5 m , the Biot number B i = 10 3 is low, indicating that heat conduction dominates over surface convection. Moreover, since the dimensionless ratio γ d / I 1 , representing the relative temperature variation along the fiber cross-section induced by the light gradient, is small. Therefore, even under high light gradients γ , the temperature variation along x-axis in the LCE fiber is small and can be considered negligible, so that local overheating effects are minimal. Thus, the temperature along the fiber can be considered approximately uniform. The photothermally responsive LCE converts light energy into heat due to the thermal effects from light absorption. The photothermal intensity I quantify the rate of energy transfer driven by the temperature difference T between the fiber and its environment. T is given by [64] under light exposure.
d T d t = I k c T ρ c ,
where ρ c represents the specific heat capacity, and k c denotes the coefficient of heat transfer. It should be noted that the temperature difference T t evolves according to Equation (7), showing exponential relaxation rather than linear time dependence. Using the thermal relaxation time τ = ρ c / k c , Equation (7) can be rewritten as
τ d T d t = I k c T .
The thermal relaxation time of the LCE fiber characterizes the transition between its two states, reflecting the heat exchange with the surrounding environment. A shorter thermal relaxation time indicates that the photothermally responsive LCE fiber reaches its limiting temperature difference more quickly.
As shown from Figure 1, by assuming a linear optical environment and establishing an Eulerian coordinate system x , we obtain
I = γ x = γ s cos θ v sin θ u cos θ .
where γ is the light gradient and the terms v sin θ and u cos θ represent the instantaneous height of the LCE fiber.
By substituting Equations (5) and (6) into Equation (2), the result is
q LCE = K ε e = K 2 v cos θ 0 2 sin θ 0 0 ξ 1 2 v 2 d ξ L i 2 s sin θ 0 + α 1 T t .
From Equation (10), it is evident that the LCE fiber tension depends on parameters such as the contraction coefficient and inclined angle. The LCE fiber contracts under light illumination, pulling the piezoelectric beam and causing it to deform.

2.2. The Energy and Work Analysis of the LCE Fiber–Piezoelectric Beam System

To analyze the dynamic behavior of the system, it is essential to evaluate both the energy contributions and the external work. These include the strain and electric field energies stored in the elastic and piezoelectric layers, as well as the work performed by non-conservative forces such as damping and LCE fibers tension. The constitutive equations and parameter transformation for the piezoelectric and elastic layers of the beam are formulated as follows [65]:
T 1 s T 1 p D 3 = Y s 0 0 0 Y p e 31 0 e 31 ε 33 S S 1 s S 1 p E 3 .
In Equation (11), Y P represents the Young’s modulus of the piezoelectric layer, Y S represents the Young’s modulus of the substrate, T 1 represents stress, S 1 represents strain, D 3 represents electric displacement, E 3 represents electric field intensity, e 31 = d 31 Y P is the permittivity at constant strain, ε 33 S = ε 33 T d 31 2 Y P is the dielectric constant under constant strain, d 31 denotes the piezoelectric strain constant, ε 33 T is the dielectric constant of the piezoelectric material under constant stress. The superscripts P and S denote the corresponding parameters for the piezoelectric and substrate layers, respectively.
E 3 = V t 2 t p , V = R L d Q d t ,
where V is the voltage across the piezoelectric layers, R L is the resistance, and Q is the charge.
The kinetic energy T k of the general continuum LCE fiber–piezoelectric beam system is given by
T k = 1 2 0 L m v ˙ 2 + u ˙ 2 d s .
Here, denotes the time t derivative, and m represents the mass per unit length of the piezoelectric composite beam, given by m = 2 ρ P t P b + ρ S t S b , where ρ P and ρ S are the densities of the piezoelectric layer and substrate, respectively.
The strain energy U of the LCE fiber–piezoelectric beam system is given by
U = 1 2 V S T 1 s S 1 s d V s + 1 2 V p T 1 p S 1 p d V p ,
where V S and V P represent the volumes of the substrate and piezoelectric layer, respectively.
Considering geometric non-linearity, the strain of the beam is given by [66].
S 1 p = S 1 s = y v + 1 2 v v 2 .
Substituting Equations (11) and (15) into Equation (14), we obtain
U = 1 2 0 L Y I v 1 + 1 2 v 2 2 Y p b d 31 R L h + t p 2 v × 1 + 1 2 v 2 d Q d t d s ,
where (′) denotes the derivative with respect to displacement s , and Y I = 1 3 2 Y S b h 3 + 2 Y P b 3 h 2 t P + 3 h t P 2 + t P 3 represents the effective bending stiffness of the piezoelectric composite beam with h = t S / 2 , which is valid under the assumption of perfect bonding between layers and can be derived based on classical composite beam theory.
The electrical energy W e of the LCE fiber–piezoelectric beam system is given by
W e = 1 2 V p E 3 D 3 d V p .
Substituting Equation (11) into Equation (17), we obtain
W e = 1 2 Y p b d 31 R L h + t p 2 0 L v 1 + 1 2 v 2 d Q d t d s + b L ε 33 S R L 2 4 t p d Q d t .
The work performed by the non-conservative forces acting on the LCE fiber–piezoelectric beam system is given by [67]
δ W = 0 L c a v ˙ + c q v ˙ v ˙ δ v d s R L d Q d t δ Q + 0 L q LCE cos θ 0 δ v d s ,
where c a is the first-order damping coefficient and c q is the second-order damping coefficient.
To construct the dynamic model, it is necessary to derive the governing equations that describe the system’s motion. The piezoelectric beam is treated as a continuous system with a fixed spatial domain, and the effects of light are incorporated through the forces generated by the LCE fibers acting on the beam. Based on the energy expressions and the principle of virtual work, the equations of motion for the LCE fiber–piezoelectric beam system are formulated using Hamilton’s principle, where Lagrange multipliers are introduced to incorporate the constraint. The generalized variational principle for the bimorph piezoelectric composite beam is expressed as follows:
δ t 0 t 1 T k U + W e + W + 0 L λ 1 v 2 1 + u 2 d s d t = 0 ,
where λ is the Lagrange multiplier.
Through a series of variational calculations, we obtain
δ t 0 t 1 T k d t = m 0 L v ˙ δ v + u ˙ δ u d s | t 0 t 1 m t 0 t 1 0 L v ¨ δ v + u ¨ δ u d s d t .
δ t 0 t 1 U d t = t 0 t 1 T I v 1 + 1 2 v 2 2 δ v | 0 L d t t 0 t 1 T I 1 + 1 2 v 2 v + 1 2 v 2 v + v v 2 δ v | 0 L d t + t 0 t 1 0 L T I v + 1 2 v 2 v + 3 v v v + v 2 1 + 1 2 v 2 + v + 1 2 v 2 v + v v v v δ v d s d t 1 2 Y L p b d 31 R L h + t p 2 0 L v 1 + 1 2 v 2 δ Q d t | t 0 t 1 t 0 t 1 0 L d d t v 1 + 1 2 v 2 δ Q d s d t + t 0 t 1 d Q d t 1 + 1 2 v 2 H s H s L δ v d t | 0 L t 0 t 1 d Q d t 1 + 1 2 v 2 δ s δ s L δ v d t | 0 L + t 0 t 1 0 L d Q d t 1 + 1 2 v 2 d δ s d s d δ s L d s + v v δ s δ s L δ v d s d t .
In Equation (22), H s denotes the Heaviside step function. Since the charge Q in Equations (16) and (18), which depends solely on time t , is linked to electromechanical coupling, the Heaviside step function is applied in the variational procedure. The factor H s H s L guarantees the persistence of charge-related terms under arbitrary-order differentiation in s .
Using Equation (18), we can obtain
δ t 0 t 1 W e d t = 1 2 Y p b d 31 R L h + t p 2 0 L v 1 + 1 2 v 2 δ Q d s | t 0 t 1 t 0 t 1 0 L d d t v 1 + 1 2 v 2 δ Q d s d t t 0 t 1 d Q d t 1 + 1 2 v 2 H s H s L δ v d t | 0 L t 0 t 1 d Q d t 1 + 1 2 v 2 δ s δ s L δ v d t | 0 L + t 0 t 1 0 L d Q d t 1 + 1 2 v 2 d δ s d s d δ s L d s δ v d s d t + t 0 t 1 0 L d Q d t v v δ s δ s L δ v d s d t . + 2 b L ε 33 s R L 2 4 t p d Q d t δ Q | t 0 t 1 2 b L ε 33 s R L 2 4 t p t 0 t 1 d 2 Q d t 2 δ Q d t
The variation in the work associated with the non-conservative force in Equation (19) is derived as
δ t 0 t 1 W d t = t 0 t 1 0 L c a v ˙ + c q v ˙ v ˙ δ v d s d t t 0 t 1 R L d Q d t δ Q d t + t 0 t 1 0 L cos θ 0 q LCE δ v d s d t .
For the Lagrange multipliers λ term in Equation (20), it can be expressed that
δ t 0 t 1 0 L λ 1 v 2 1 + u 2 d s d t = t 0 t 1 0 L 1 v 2 1 + u 2 δ λ d s d t t 0 t 1 2 λ v d δ v | 0 L d t + t 0 t 1 0 L 2 λ v δ v d s d t , t 0 t 1 2 λ 1 + u δ u | 0 L d t + t 0 t 1 0 L 2 λ 1 + u δ u d s d t
where δ x is the Dirac delta function. The Dirac delta function and the Heaviside step function satisfy the following relationship:
d H s d s = δ s , + d n δ s s 0 d s n f s d s = 1 n d f n s 0 d x n .
By applying Hamilton’s principle and substituting Equations (21)–(25) into Equation (20), we obtain the following governing equation:
m 0 L v ˙ δ v + u ˙ δ u d s | t 0 t 1 t 0 t 1 2 λ v δ v | 0 L d t t 0 t 1 2 λ 1 + u δ u | 0 L d t t 0 t 1 Y I v 1 + 1 2 v 2 2 δ v | 0 L d t + t 0 t 1 Y I 1 + 1 2 v 2 v + 1 2 v v 2 + v 2 v δ v | 0 L + Y p b d 31 R L h + t p 2 0 L v 1 + 1 2 v 2 δ Q d s | t 0 t 1 + t 0 t 1 d Q d t 1 + 1 2 v 2 H s H s L δ v d t | 0 L t 0 t 1 d Q d t 1 + 1 2 v 2 δ s δ s L δ v d t | 0 L + 2 b L ε 33 s R L 2 4 t p d Q d t δ Q | t 0 t 1 t 0 t 1 0 L m v ¨ + Y I 1 + 1 2 v 2 v + 1 2 v 2 v + 3 v v v + v 3 + v v v + 1 2 v 2 v + v v 2 2 λ v Y b d 31 R L h + t p 2 d Q d t 1 + 1 2 v 2 d δ s d s d δ s L d s + v v δ s δ s L + c a v ˙ + c q v ˙ v ˙ cos θ 0 q L C E δ v δ v d s d t t 0 t 1 0 L m u ¨ 2 λ 1 + u δ u d s d t + t 0 t 1 0 L 1 v 2 1 + u 2 δ λ d s d t + t 0 t 1 0 L Y p b d 31 R L h + t p 2 v ˙ + 1 2 v 2 v ˙ + v v v ˙ d s 2 b L ε 33 s R L 2 4 t p d 2 Q d t 2 R L d Q d t δ Q d t = 0 .
Since the virtual displacements, i.e., δ v , δ u , δ λ , and δ Q are arbitrary, the coefficients of these variations must vanish to satisfy the equation. Accordingly, we derive the governing equations involving v , u , λ , and Q . The coefficients corresponding to δ v , δ u , δ λ , and δ Q are as follows, respectively:
m v ¨ + Y I 1 + 1 2 v 2 v + 1 2 v 2 v + 3 v v v + v 3 + v v v + 1 2 v 2 v + v v 2 2 λ v Y p b d 31 R L h + t p 2 d Q d t 1 + 1 2 v 2 d δ s d s d δ s L d s + v v δ s δ s L . + c a v ˙ + c q v ˙ v ˙ cos θ 0 q LCE = 0
0 L Y p b d 31 R L h + t p 2 v ˙ + 1 2 v 2 v ˙ + v v v ˙ d s + 2 b L ε 33 s R L 2 4 t p d 2 Q d t 2 + R L d Q d t = 0 .
m u ¨ 2 λ 1 + u = 0 .
By using Equations (4) and (30), and applying the Taylor expansion, we can obtain
2 λ v = v L s 1 2 m 0 ξ 2 v ˙ v ˙ + v v ¨ d s d ξ ,
Substituting Equation (31) into Equation (28), we note that the quantitative effects of truncating non-linear terms of fourth-order and higher are small and do not introduce qualitative errors. To focus on the electromechanical coupling motion differential equation of the LCE fiber–piezoelectric beam system, the fourth-order terms and higher of v are omitted in the derivation. Then, Equations (28) and (29) are rearranged to obtain the following electromechanical coupling motion differential equation for the LCE fiber–piezoelectric beam system:
Y I v + v 2 v + 4 v v v + v 3 + m v ¨ + c a v ˙ + c q v ˙ v ˙ cos θ 0 K 2 v cos θ 0 + 2 sin θ 0 0 ξ 1 2 v 2 d ξ L i 2 s sin θ 0 + α 1 T t           , + m v 0 s v ˙ v ˙ + v v ¨ d η m v s L 0 ξ v ˙ v ˙ + v v ¨ d η d ξ α 2 V 1 + 1 2 v 2 d δ s d s d δ s L d s + v v δ s δ s L = 0
α 2 0 L v ˙ + 1 2 v 2 v ˙ + v v v ˙ d s + C p V ˙ + V R L = 0 ,
where α 2 = Y p b d 31 h + t p 2 , C p = C ¯ p L , C ¯ p = b ε 33 s 2 t p , ξ and η are the coordinate symbols introduced by integration, and α 2 is electromechanical coupling coefficient and C p is capacitance.

2.3. Dimensionless Formulation

The following dimensionless parameters are introduced, and their typical values for real materials, based on commonly used LCE fibers and piezoelectric beams, are listed in Table 1.
s ¯ = s / L ,   ξ ¯ = ξ / L ,   v ¯ = v / L ,   ω 0 = Y I / m L 4 ,   t ¯ = ω 0 t ,   τ ¯ = ω 0 τ ,   c ¯ a = c a / m ω 0 ,   c ¯ q = c q L / m , V ¯ = V / ω 0 L m / C ¯ p ,   α ¯ 2 = α 2 / ω 0 L 2 m C ¯ p ,   γ ¯ = γ L / k c T ext ,   α ¯ 1 = α 1 T ext ,   K ¯ = K / m ω 0 2 L ,   I ¯ = I / k c T ext , v ¯ ¨ = v ¨ / ω 0 2 L ,   v ¯ = v ,   v ¯ = L v ,   v ¯ = L 2 v ,   v ¯ = L 3 v ,   v ¯ ˙ = v ˙ / ω 0 ,   v ¯ ¨ = v ¨ / ω 0 2 ,   v ¯ ˙ = L v ˙ / ω 0 ,
where v ¯ is the dimensionless displacement amplitude, and V ¯ is the dimensionless voltage amplitude.
Substituting Equation (34) into Equations (31) and (33), we obtain the following non-linear electromechanical coupling dimensionless motion differential equation for the LCE fiber–piezoelectric beam system:
v ¯ ¨ + c ¯ a v ¯ ˙ + c ¯ q v ¯ ˙ v ¯ ˙ + v ¯ + v ¯ 2 v ¯ + 4 v ¯ v ¯ v ¯ + v ¯ 3 + v ¯ 0 s ¯ v ¯ ˙ v ¯ ˙ + v ¯ v ¯ ¨ d η ¯ v ¯ s ¯ 1 0 ξ ¯ v ¯ ˙ v ¯ ˙ + v ¯ v ¯ ¨ d η ¯ d ξ ¯ α ¯ 2 V ¯ 1 + 1 2 v ¯ 2 d δ s ¯ d s ¯ d δ s ¯ 1 d s ¯ + v ¯ v ¯ δ s ¯ δ s ¯ 1 , cos θ 0 K ¯ 2 v ¯ cos θ 0 2 sin θ 0 0 s ¯ 1 2 v ¯ 2 d η ¯ L ¯ i 2 s ¯ sin θ 0 + α ¯ 1 T ¯ t ¯ = 0 ,
V ¯ ˙ + μ V ¯ + α ¯ 2 0 1 v ¯ ˙ + 1 2 v ¯ 2 v ¯ ˙ + v ¯ v ¯ v ¯ ˙ d s ¯ = 0 ,
where μ = 1 R L ω 0 C p is the resistivity. Equations (35) and (36) describe the coupled electromechanical motion of a continuous cantilever beam with piezoelectric actuation. These equations are non-linear and generally require numerical methods to obtain the displacement and voltage responses of the system. The beam is treated as a continuous structure with distributed parameters, and the boundary conditions of a cantilever beam are applied.

2.4. Galerkin Method

To obtain the analytical solutions of the non-linear Equations (35) and (36), we first apply the Galerkin method [68] to convert them into a set of non-linear ordinary differential equations. By employing the Galerkin method with separation of variables and using the mode superposition approach [69,70], the dimensionless displacement summation function of the piezoelectric beam can be expressed as
v ¯ s ¯ , τ = W ¯ n τ X n s ¯ ,
where W ¯ n τ is the generalized modal coordinate, and X n s ¯ is the n-th-order mode shape function of the piezoelectric cantilever beam. Equation (37) represents a modal series expansion including multiple modes. In principle, this formulation allows higher-order modes to be included. In the present study, due to the small deformations induced by the LCE fibers, the vibration amplitudes remain sufficiently low and within the linear regime. The orthogonal basis functions used in the analysis are the linear mode shape functions of an Euler–Bernoulli beam with fixed-free boundary conditions. The normalized mode shape functions are given as follows:
X n s ¯ = cosh β ¯ n s ¯ cos β ¯ n s ¯ + α ¯ n sin β ¯ n s ¯ sinh β ¯ n s ¯ ,
α ¯ n = cos β ¯ n + cosh β ¯ n sin β ¯ n + sinh β ¯ n ,
where β ¯ 2 = ω ¯ n = ω n / ω 0 , ω n is the n-th-order natural frequency of the piezoelectric cantilever beam. The parameter β ¯ n satisfies the following equation:
cosh β ¯ n cos β ¯ n + 1 = 0 ,
with solutions β 1 = 1.875 , β 2 = 4.694 , β 3 = 7.855 , and β 4 = 10.996 , etc. Equation (37) is expressed as a modal summation, which in principle allows the inclusion of any number of modes. For the derivation, we considered a generic n-th term of the displacement function and the Galerkin procedure applied to obtain the corresponding reduced-order equations. By substituting Equation (37) into Equations (33) and (36), and then multiplying both sides of Equation (35) by X n s ¯ and integrating along the length of the beam, we can apply the orthogonality condition of the mode shape functions. This results in the reduced-order equations of the non-linear distributed parameter model of the LCE fiber–piezoelectric beam system under bi-directional base excitation where W ¯ n is the unknown. The equations are as follows:
W ¯ ¨ n + 2 c ˜ W ¯ ˙ n + c ˜ q W ¯ ˙ W ¯ ˙ + ω ¯ n 2 W ¯ n + β n W ¯ n 3 + κ n W ¯ ˙ n 2 + W ¯ n W ¯ ¨ n W ¯ n α ¯ 2 V ¯ ζ n + γ n W ¯ n 2       , l W ¯ n φ W ¯ n 2 ϑ = 0
V ¯ ˙ + μ V ¯ + α ¯ 2 η ¯ + χ n W ¯ n 2 W ¯ ˙ n = 0 .
Equations (41) and (42) govern the dynamic behavior of the LCE-based cantilever under linear light illumination. Similarly to the Mathieu–Dufing equation [71], the cantilever can be interpreted as a self-regulating oscillator, where β n W ¯ n 3 is the cubic geometric non-linear term and κ n W ¯ ˙ n 2 + W ¯ n W ¯ ¨ n W ¯ n is the inertial non-linear term. In Equation (41), we extract that F ¯ represents the tension in the LCE fibers, and F ¯ d denotes the damping force of the system as follows:
F ¯ = l W ¯ n + φ W ¯ n 2 + ϑ ,
F ¯ d = 2 c ˜ W ¯ ˙ n + c ˜ q W ¯ ˙ W ¯ ˙ .
The expression for the power response P is
P = μ V ¯ 2 ,
where a 1 n s ¯ = s ¯ 1 0 ξ ¯ X n 2 η ¯ d η ¯ d ξ ¯ , a 2 n s ¯ = 0 s ¯ X n 2 η ¯ d η ¯ , b 1 n n = 0 1 X n X n d s ¯ = 1 , b 2 n n = 0 1 β ¯ n 4 X n 2 X n + 4 X n X n X n + X n 3 X n d s ¯ , b 3 n n = 0 1 X n X n X n d s ¯ , b 4 n n = 0 1 a 1 n s ¯ X n X n d s ¯ , b 5 n n = 0 1 a 2 n s ¯ X n X n d s ¯ , b 6 n n 0 1 X n d s ¯ , b 7 n n = d X n s ¯ d s ¯ | s ¯ = 1 , b 8 n n = d X n s ¯ X n 2 s ¯ d s ¯ | s ¯ = 1 = 2 X n 1 X n 1 X n 1 + X n 3 1 , b 9 n n = X n 1 X n 1 X n 1 , b 10 n n = 0 1 X n d s ¯ = d X n s ¯ d s ¯ | s ¯ = 1 = b 9 n n , b 11 n n = 0 1 X n 2 X n d s ¯ = 1 3 X n 3 1 , b 12 n n = 0 1 a 2 n s ¯ X n d s ¯ , b 13 n n = cos θ 0 K ¯ 0 1 2 cos θ 0 L ¯ i 2 s ¯ sin θ 0 X n X n d s , b 14 n n = cos θ 0 K ¯ 0 1 a 2 n s ¯ sin θ 0 L ¯ i 2 s ¯ sin θ 0 X n d s , b 15 n n = cos θ 0 K ¯ 0 1 α ¯ T ¯ t ¯ X n d s , κ n = b 5 n n b 4 n n b 1 n n , ζ n = b 7 n n b 1 n n , γ n = b 8 n n 2 b 9 n n 2 b 1 n n , η n = b 10 n n , χ n = 3 2 b 11 n n , η n = ζ n , χ n = γ n , c ˜ a = c ¯ a 2 b 1 n n , c ˜ q = c ¯ q b 3 n n b 1 n n , β n = b 2 n n b 1 n n , l = b 13 n n , φ = b 14 n n , ϑ = b 15 n n .
Equations (41) and (42) describe the dynamic behavior of the LCE fiber–piezoelectric beam under linear light illumination. The tension F ¯ i in the LCE fibers at time t ¯ i can be determined by solving Equation (43), based on the displacement W ¯ t ¯ i at t ¯ i . This tension is then used for subsequent updates of displacement and velocity. The heat flow density I ¯ i at time t ¯ i is calculated from Equation (8), using the current displacement W ¯ t ¯ i . With the resulting heat flow density, the current temperature T ¯ i is updated to obtain the temperature T ¯ i + 1 at time t ¯ i + 1 . Through continuous updates, the program progressively simulates the dynamic response of the LCE fiber–piezoelectric beam system under the influence of light-driven forces and thermal effects.

3. Motion States and Their Mechanisms

By numerically solving the governing Equations (41) and (42), two distinct motion states of the LCE fiber–piezoelectric beam system are identified, namely, the static state and the self-harvesting state. The underlying mechanism of the self-harvesting state is then analyzed in detail.

3.1. Two Motion States

To investigate the characteristics of the LCE fiber–piezoelectric beam system, Table 1 [63,72,73] lists representative material properties and geometric parameters, while Table 2 provides the corresponding dimensionless parameters, which are subsequently used to analyze the system’s self-harvesting behavior.
Figure 2 describes the time history of displacement, phase trajectories, voltage, and displacement–voltage response diagram of the LCE fiber–piezoelectric beam system with different first-order damping coefficient to demonstrate system’s two motion states. The time–history curve for the displacement in Figure 2a shows the self-harvesting state at c ¯ a ¯ = 0.025 , where the system’s amplitude stabilizes after converging to a stable value, indicating that the piezoelectric layers oscillate periodically with time. Figure 2b depicts a stable cycle associated with the self-harvesting state shown in Figure 2a. Figure 2c shows that the voltage reaches a stable state, and Figure 2d illustrates the relationship between the voltage and the deformation of the piezoelectric beam at a stable state. In contrast, Figure 2e displays the displacement time–history curve for c ¯ a ¯ = 0.035 . As shown in Figure 2f, the phase trajectory gradually converges to a point, indicating that the system has reached a static state. As shown in Figure 2g, the voltage decreases to zero over time, and in Figure 2h, the voltage at the equilibrium position is zero.
The emergence of the two motion states is explained by the following mechanism. The LCE fibers absorb light energy from illumination, part of which compensates for damping losses, while the remainder is converted into electrical energy. When the damping coefficient is high (e.g., c ¯ a ¯ = 0.035 ), the LCE fibers absorb insufficient light energy to compensate for the energy loss, preventing the system from gaining enough kinetic energy and causing it to eventually reach a static state.

3.2. Mechanism of the Self-Harvesting State

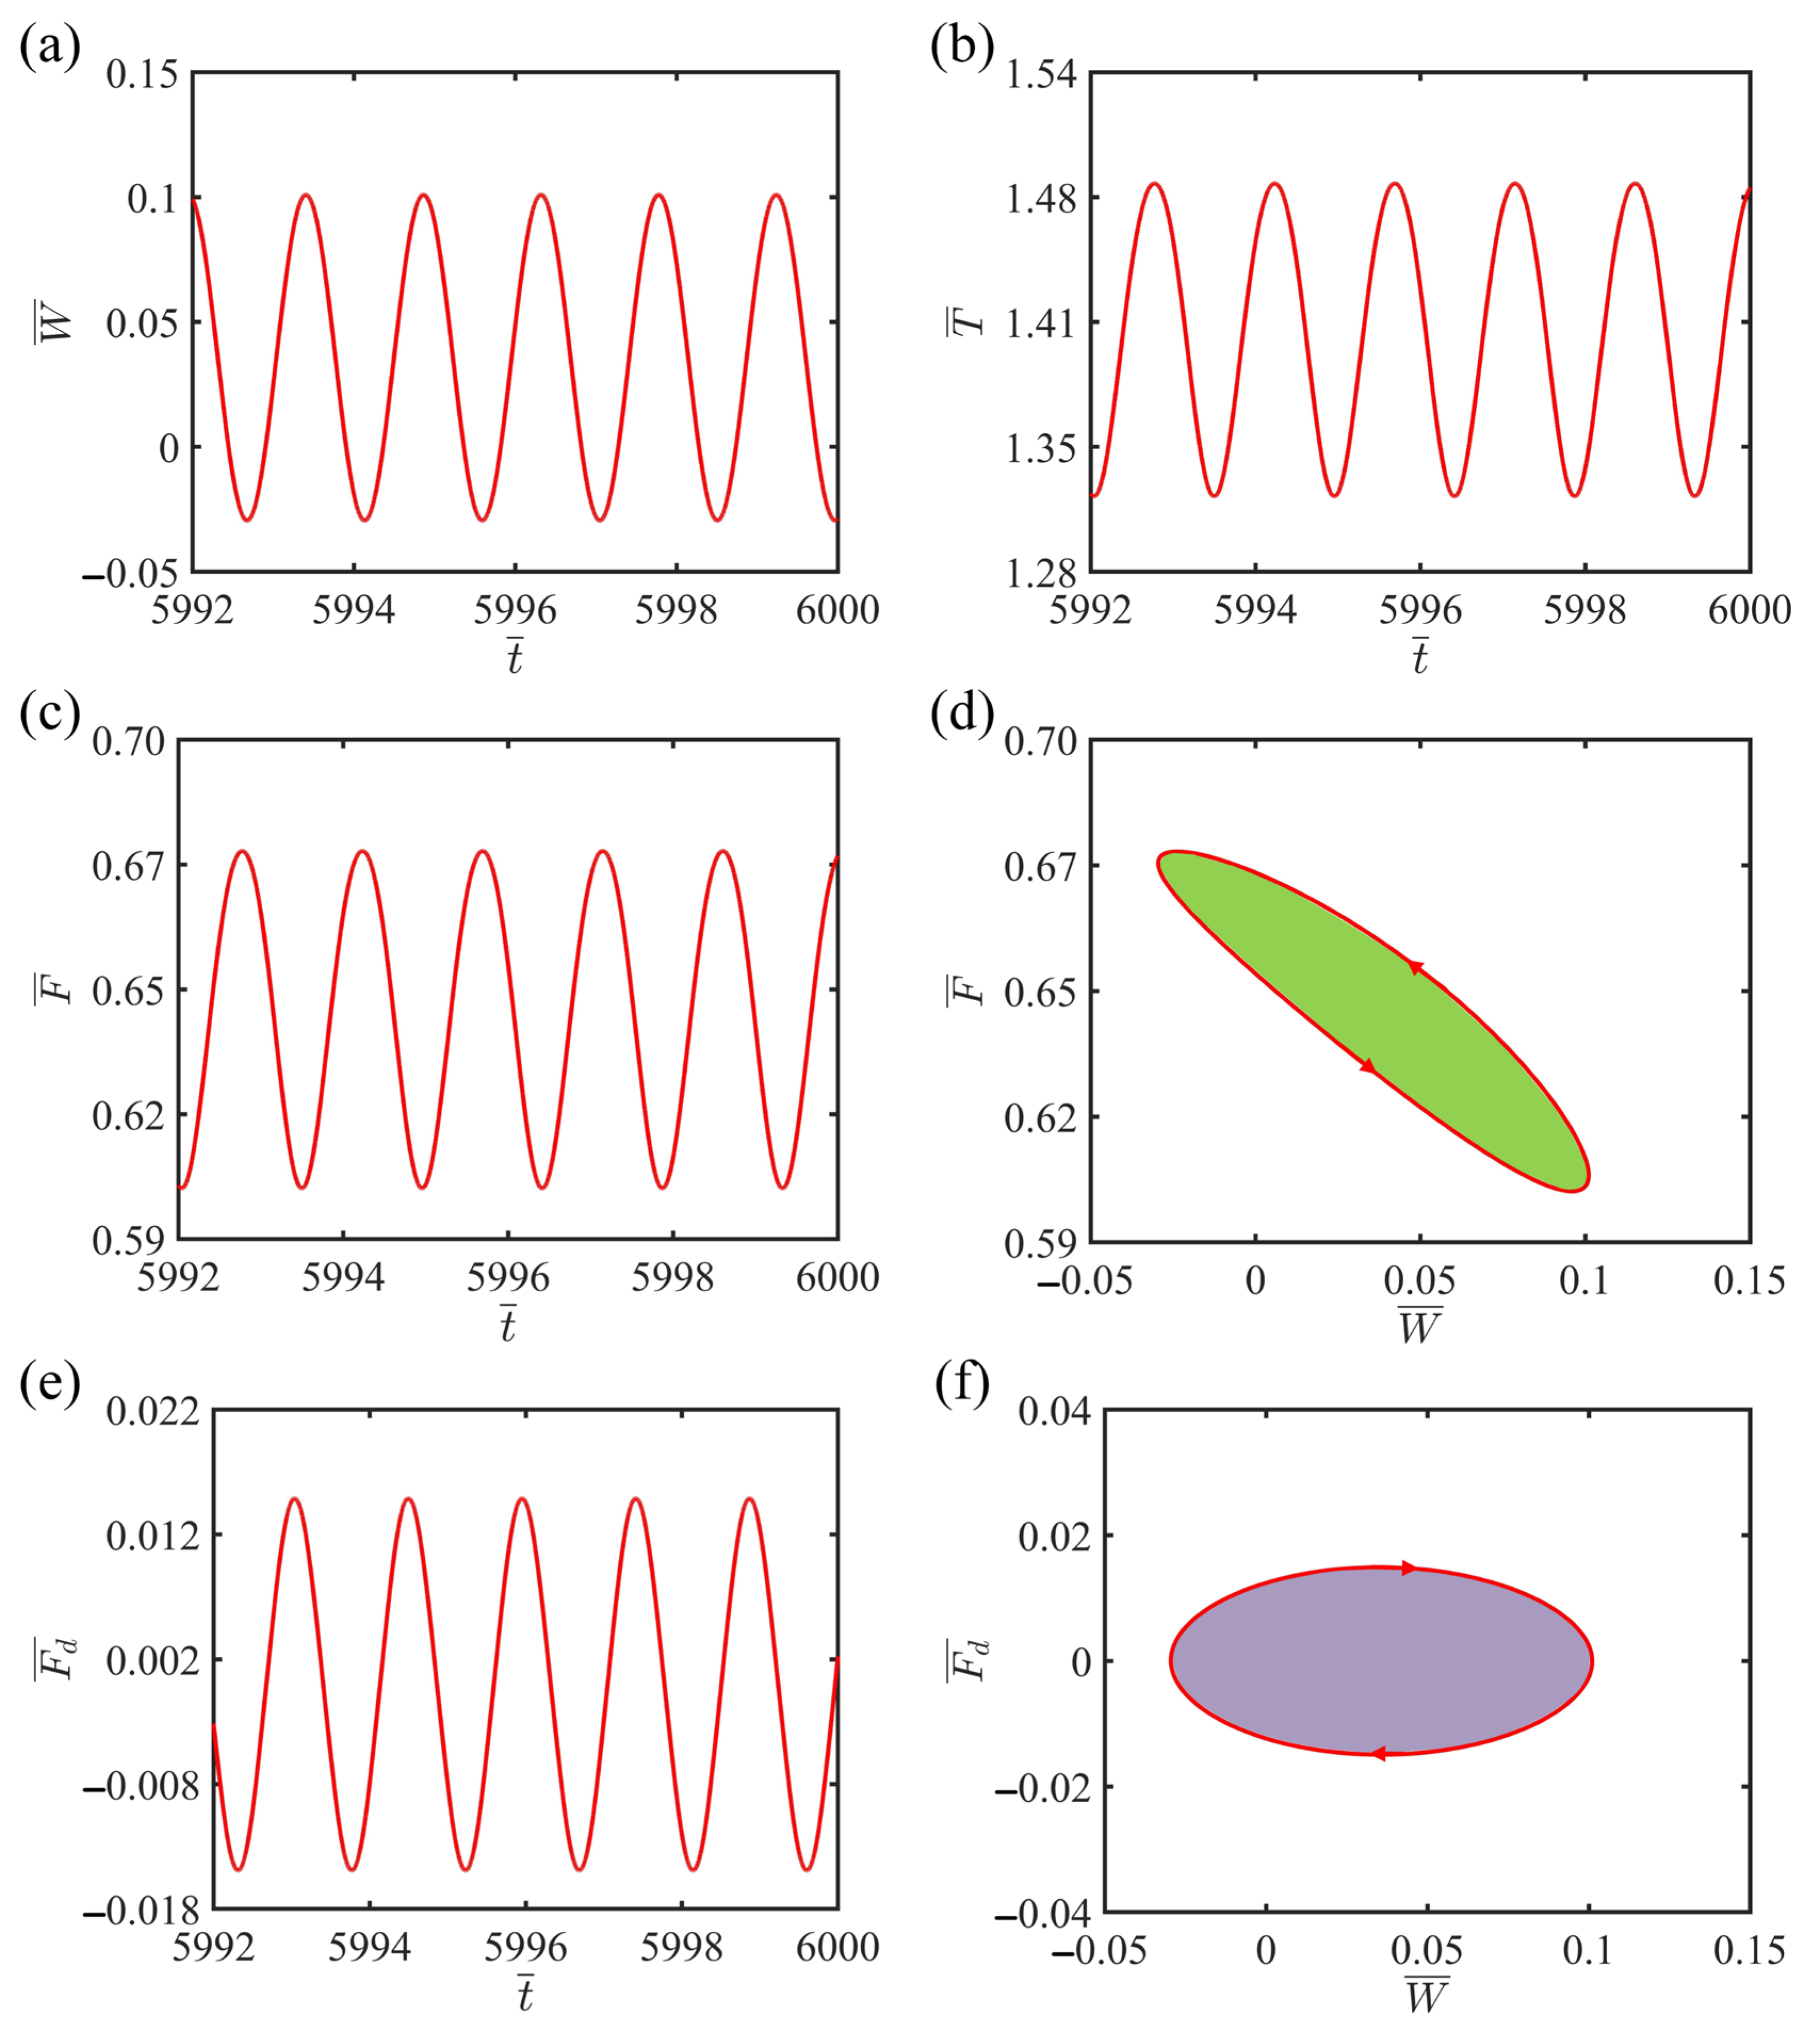
Figure 3 illustrates the self-oscillation and voltage generation operating principle of the LCE fiber–piezoelectric beam system exposed to light, with the system parameters set as c ¯ a ¯ = 0.025 , c ¯ q ¯ = 0.01 , K ¯ = 1.8 , γ ¯ = 3 , α ¯ 1 = 0.35 , τ ¯ = 0.1 , θ = 0.393 , α ¯ 2 = 0.1 , μ ¯ = 0.01 , L ¯ i = 1.2 . Figure 3a shows the time variation in the position at the LCE fiber’s end, corresponding to the self-harvesting case shown in Figure 2a. The displacement of the LCE fiber’s end reflects the deformation of the piezoelectric beam, which varies periodically over time. Figure 3b presents the cyclic changes in temperature difference within the LCE fibers, reflecting its thermal response to illumination. These temperature variations are closely related to the contraction and expansion behavior of the LCE fibers. Figure 3c shows the LCE fibers’ tension undergoing periodic oscillations over time, reflecting the fiber’s length variation and capturing its dynamics mechanical response to light-induced excitation. Additionally, Figure 3e illustrates the time-varying damping force, which also exhibits a periodic trend due to the system’s self-oscillating behavior. Figure 3d and Figure 3f depict the cyclic relationships between displacement and the LCE fibers tension, and between the displacement and damping force, respectively. In Figure 3d, the shaded area enclosed by the loop represents the net work performed by the LCE fibers tension during one cycle, calculated as 0.003. Similarly, in Figure 3f, the enclosed areas represent the energy dissipated by damping over one cycle, also amounting to 0.003. To demonstrate the generality of this result, we further varied the first-order damping coefficient to c ¯ a ¯ = 0.02 . In this case, the net work performed by the LCE fiber tension over one cycle was 0.0532, which equals the energy dissipated by damping over the same cycle (0.0532), illustrating that the energy balance persists under parameter variations. The equivalence of these two energy quantities indicates that the system achieves a precise balance between energy input and dissipation, with the net work of the LCE fibers tension exactly offsetting the damping losses, thereby enabling the LCE fiber–piezoelectric beam system to sustain stable periodic self-oscillation.
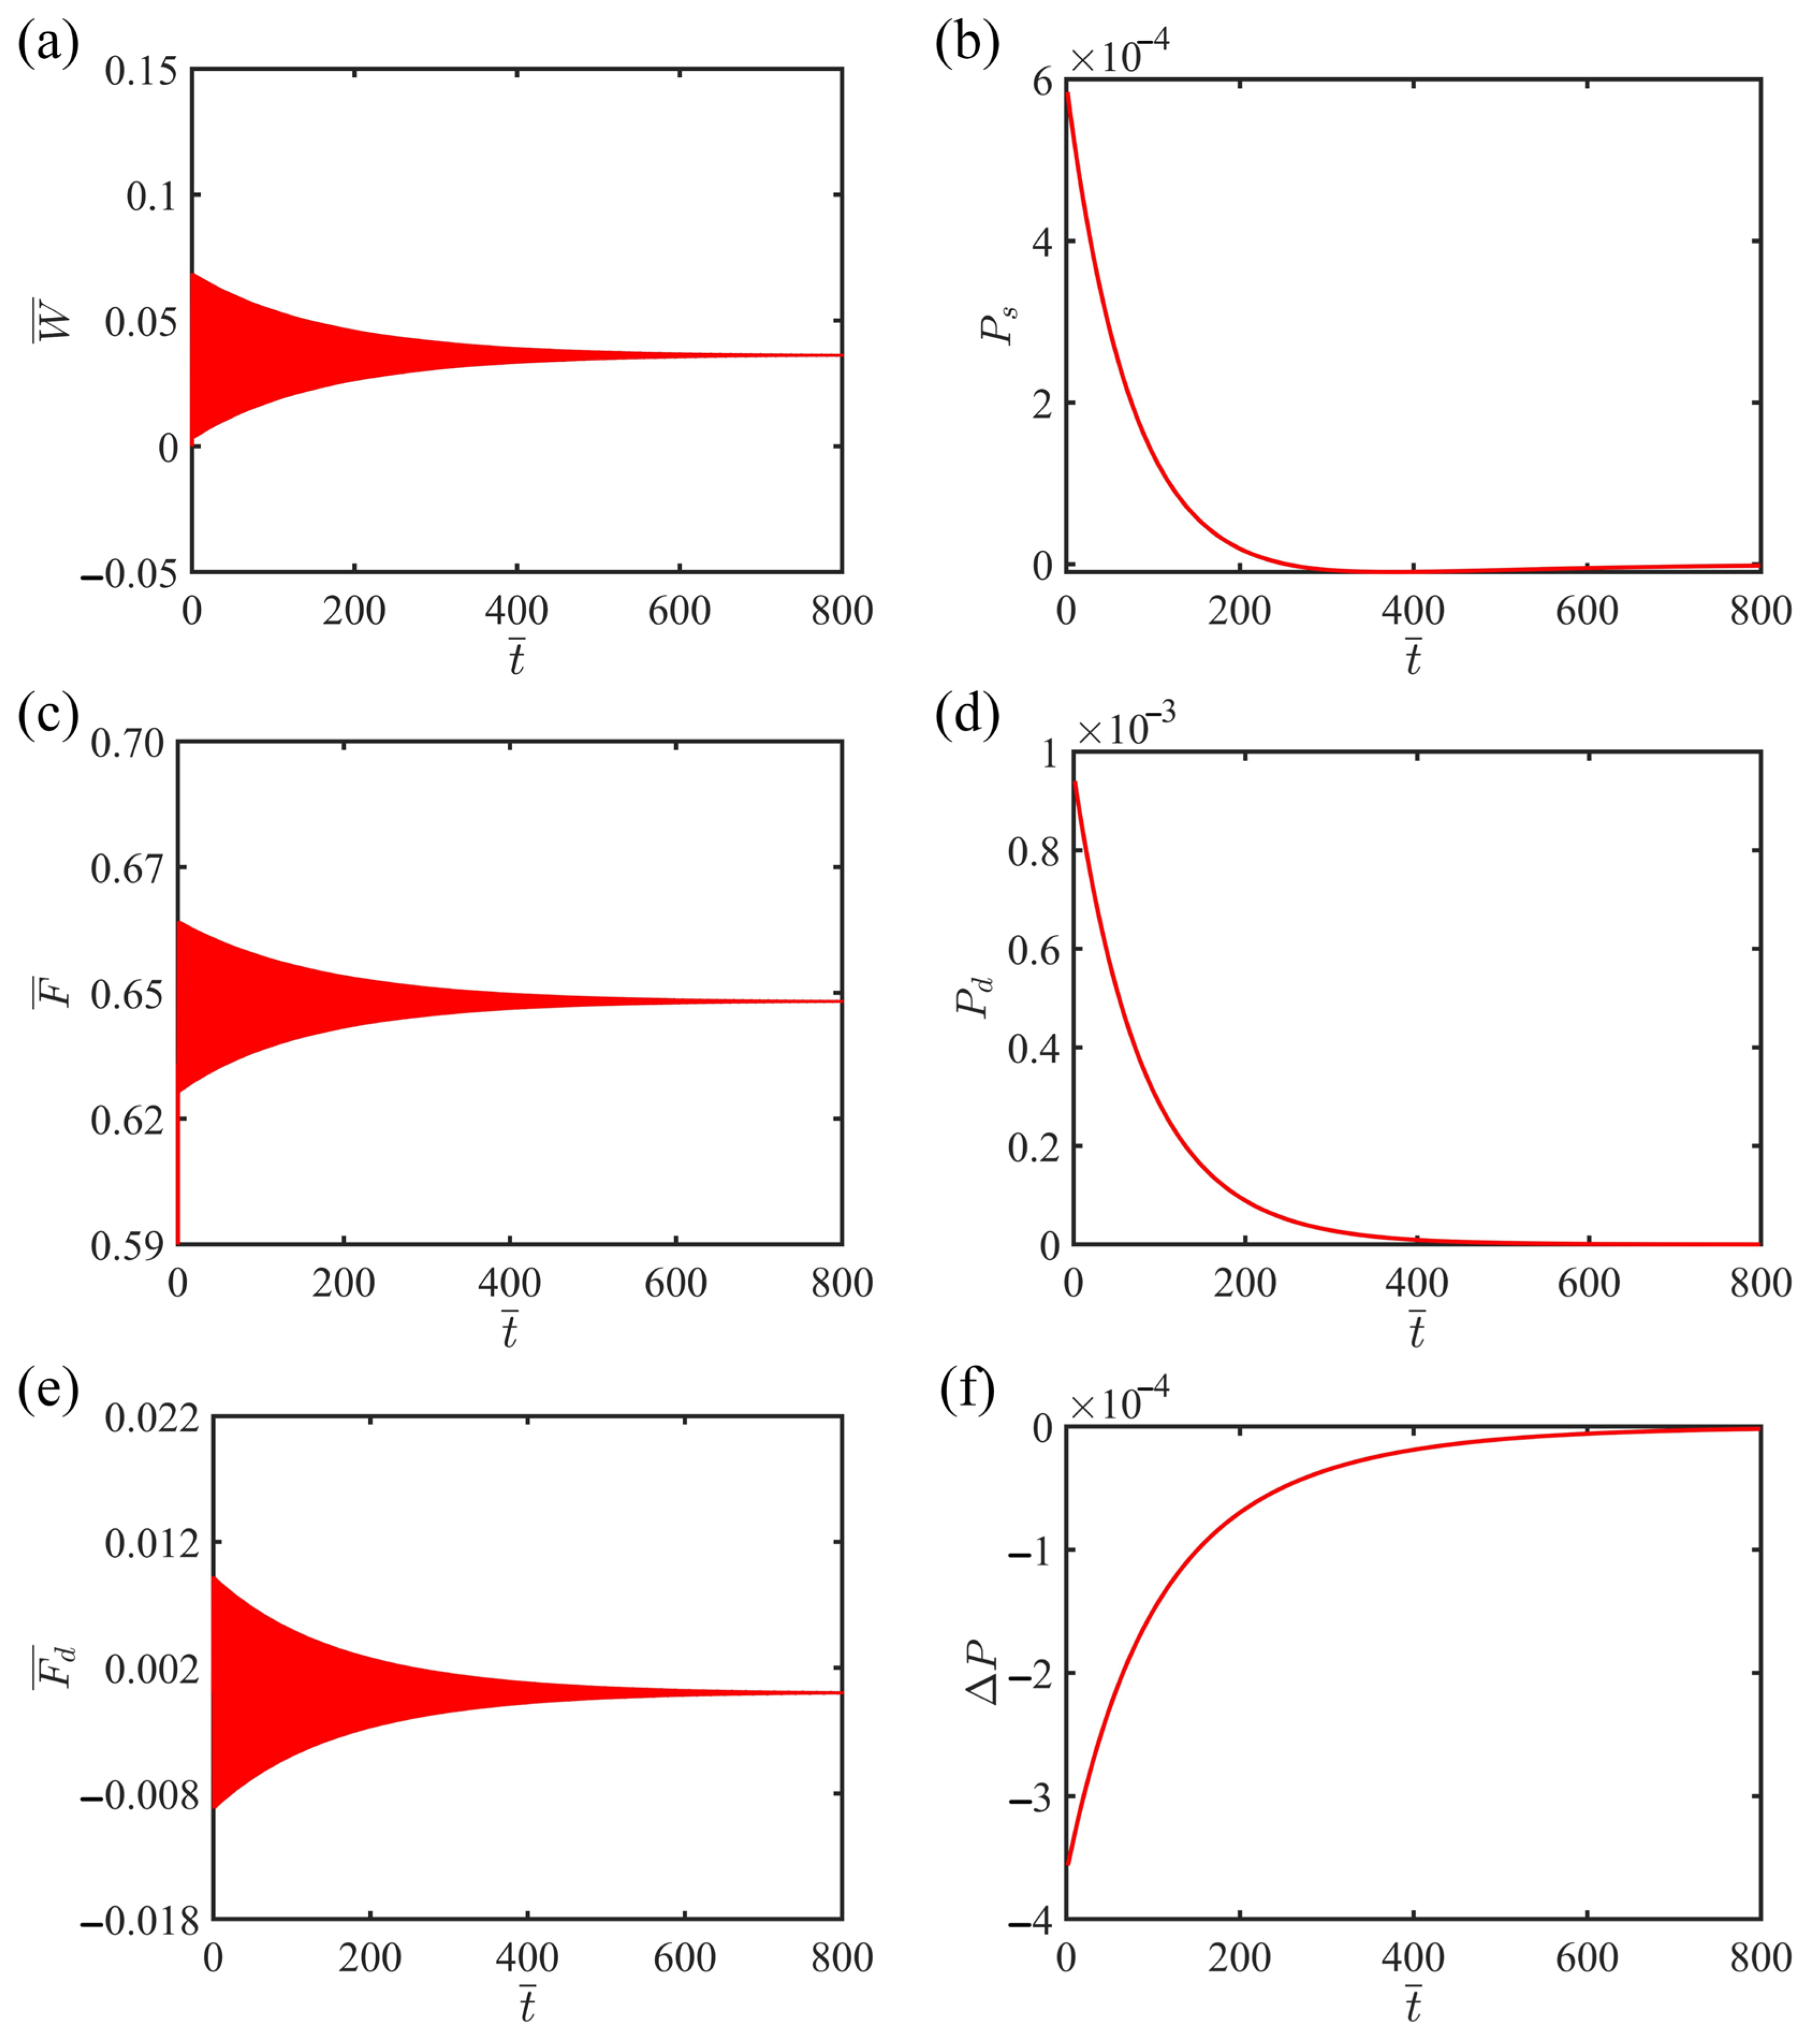
Figure 4 illustrates that when the first-order damping coefficient c ¯ a ¯ = 0.032 , the LCE fiber–piezoelectric beam system fails to acquire sufficient kinetic energy and eventually reaches a static state. The system parameters are set as c ¯ q ¯ = 0.01 , K ¯ = 1.8 , γ ¯ = 3 , α ¯ 1 = 0.35 , τ ¯ = 0.1 , θ = 0.393 , α ¯ 2 = 0.1 , μ ¯ = 0.01 , L ¯ i = 1.2 . Figure 4a shows the time–history curve of the displacement at the end of the LCE fiber, which corresponds to the static state depicted in Figure 2e. Figure 4c and Figure 4e present the time–history curves of the LCE fiber tension and the damping force, respectively. Consistent with the displacement, both quantities decrease to zero as the system reaches the static state. In Figure 4b, the power of the LCE fiber tension P s and in Figure 4d, the power of the damping force P d exhibit the same downward trend. Prior to reaching the static state, P d consistently remains greater than P s . Figure 4f shows the time–history curve of the difference between P s and P d , denoted as P , confirming that the difference remains negative until the system reaches the static state, where it becomes zero. Therefore, the damping coefficient must be chosen within a reasonable range to ensure that the energy absorbed from illumination can effectively counteract energy dissipation, thereby sustaining stable self-oscillation of the system.

4. Performance of Self-Harvesting

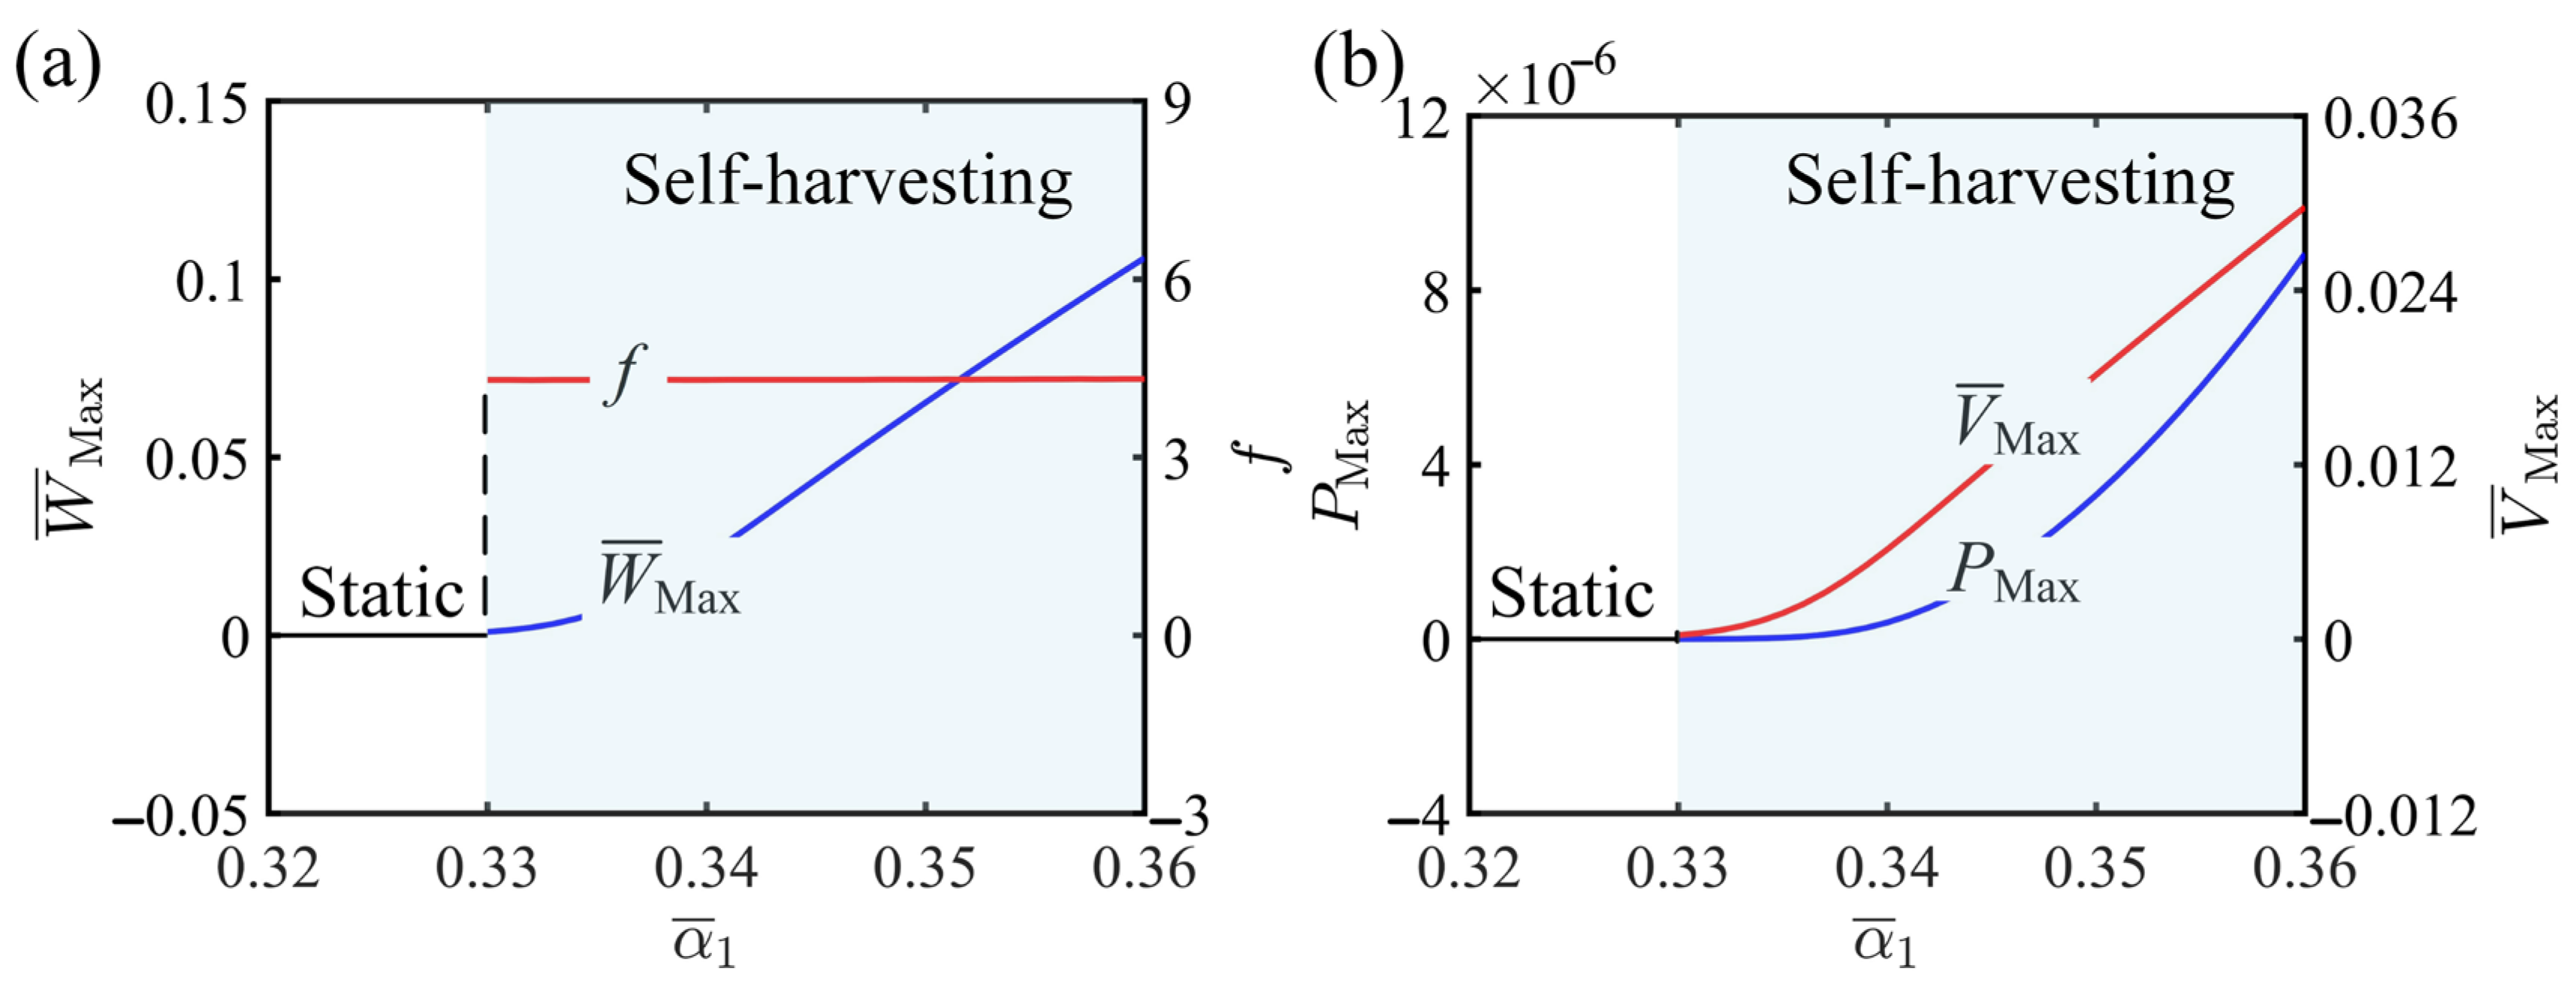
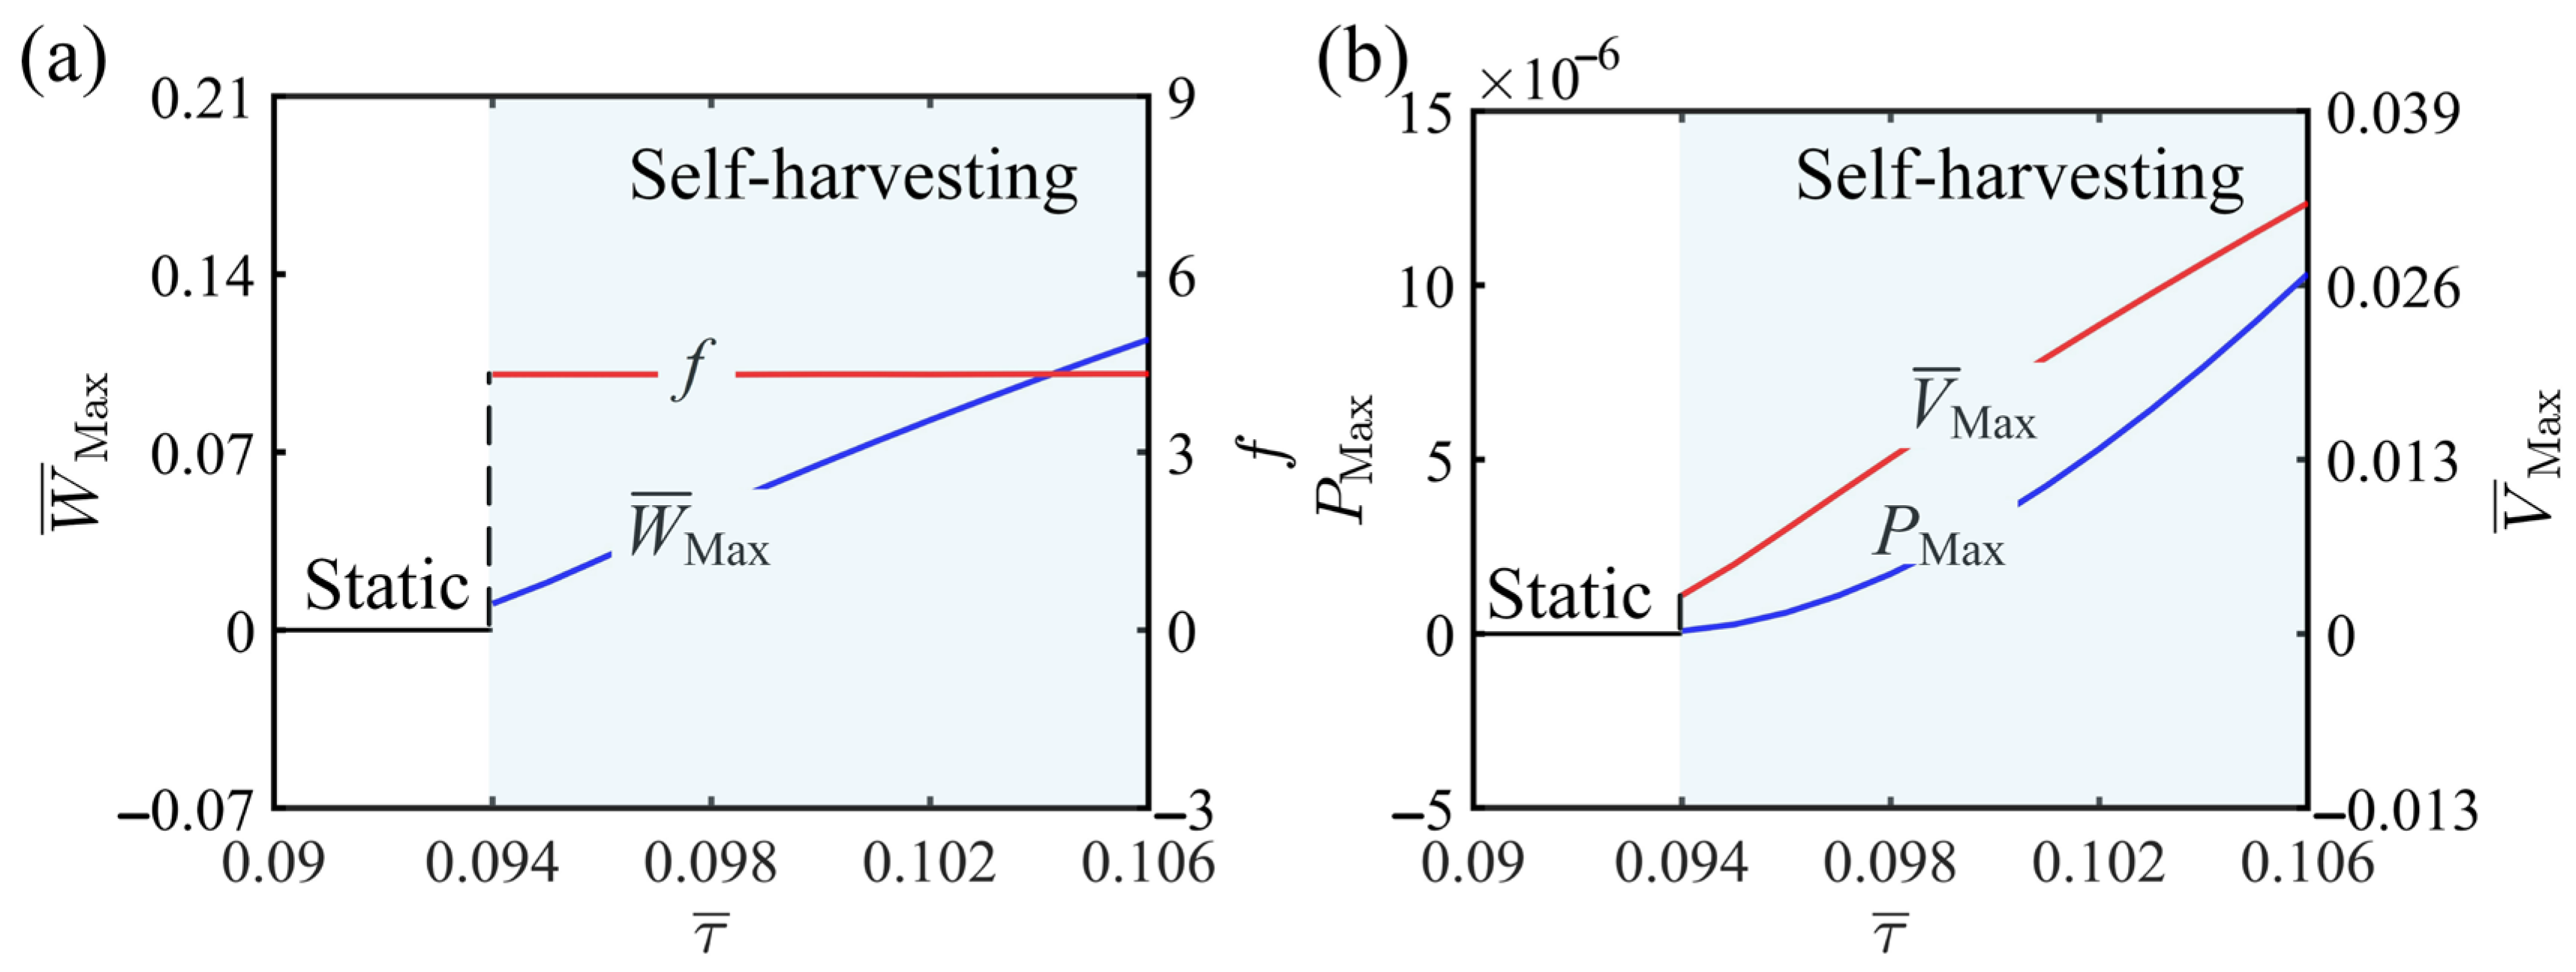
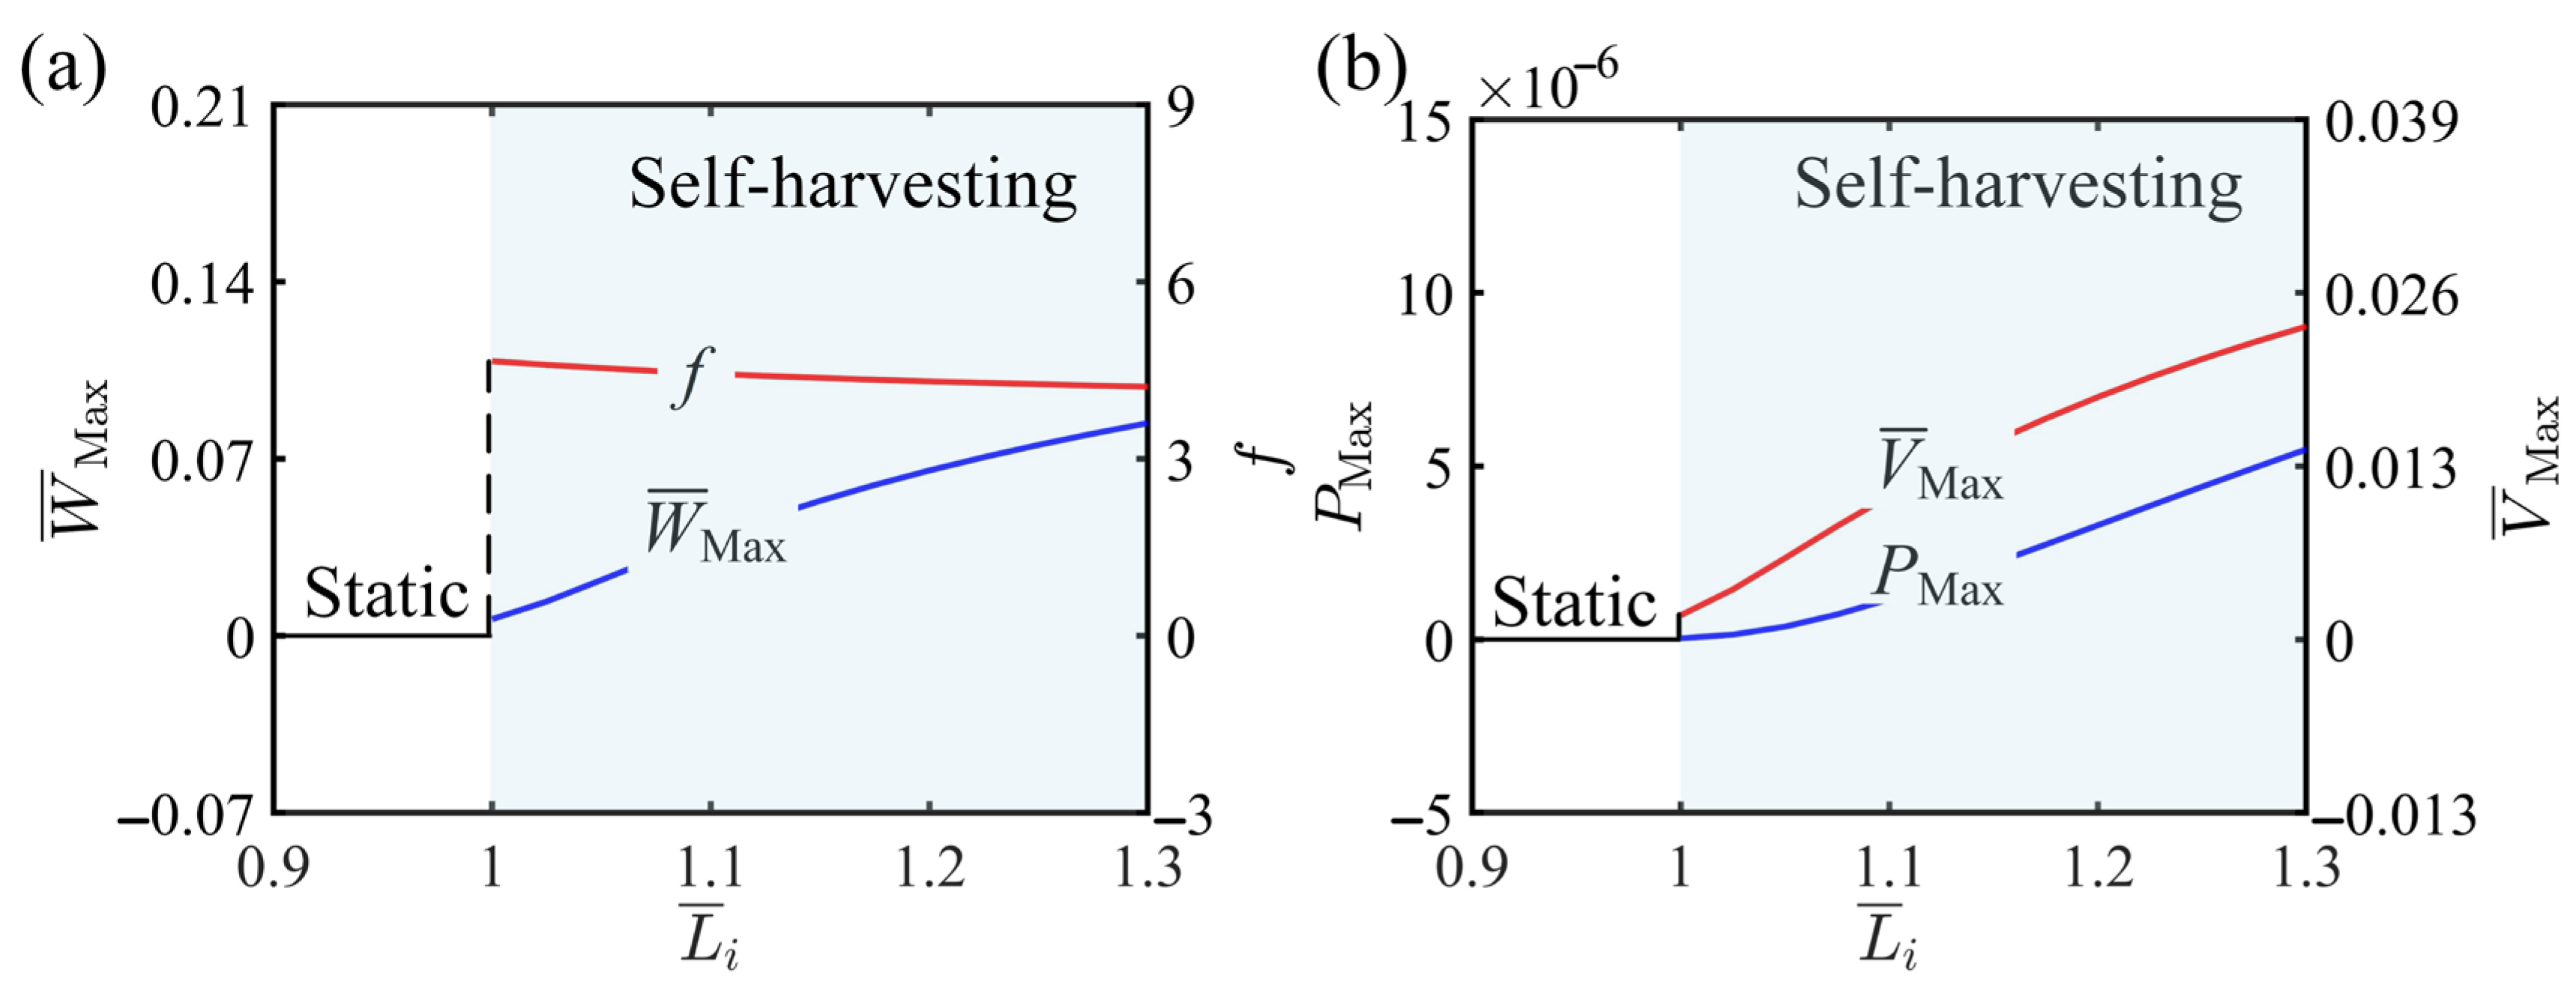
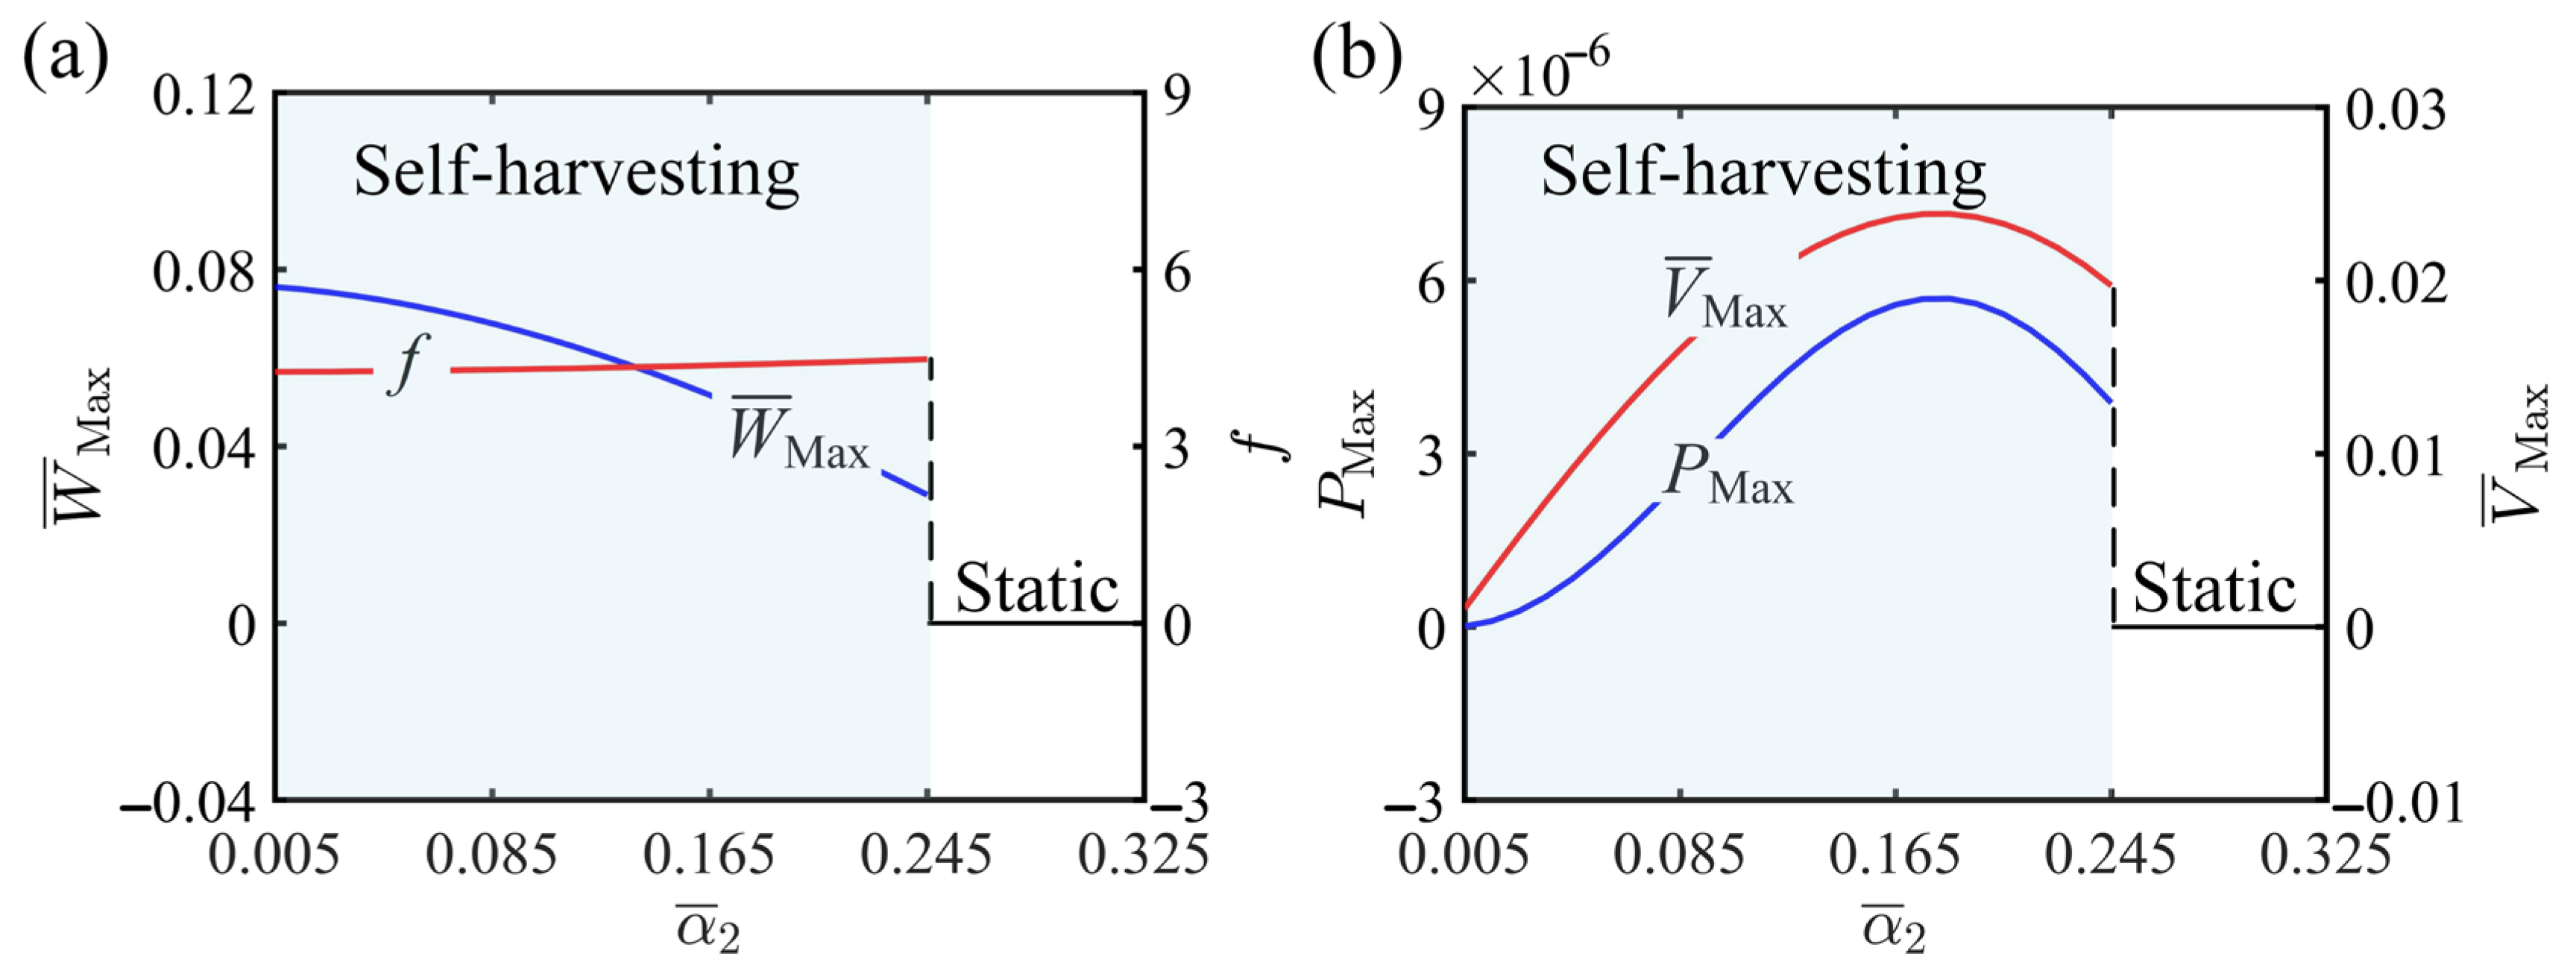
In the above mechanical model, the motion state is governed by a series of dimensionless system parameters. This section investigates nine key parameters, including the first-order damping coefficient c ¯ a ¯ , second-order damping coefficient c ¯ q ¯ , elastic coefficient of LCE fiber K ¯ , thermal relaxation time τ ¯ , light gradient γ ¯ , contraction coefficient α ¯ 1 , electromechanical coupling coefficient α ¯ 2 , inclined angle θ , LCE initial length L ¯ i , and resistivity μ . Based on Equations (41) and (42), these parameters were systematically varied to obtain a series of computational results. The analysis primarily explores how variations in these dimensionless parameters affect the performance of the piezoelectric layer, with a particular focus on their relationships with the piezoelectric layer’s amplitude W ¯ Max , voltage V ¯ Max , frequency f , and power P Max . Based on their influence on the self-harvesting performance, these parameters can be classified into three categories: the first category includes two system parameters that decrease self-harvesting, the second category includes six system parameters that enhance self-harvesting, and the third category includes two system parameters that have a non-monotonic effect on self-harvesting. To visually illustrate the impact of each parameter on self-harvesting performance, the following numerical results, calculated using MATLAB R2014b, are presented.

4.1. Parameters Inhibiting Self-Harvesting

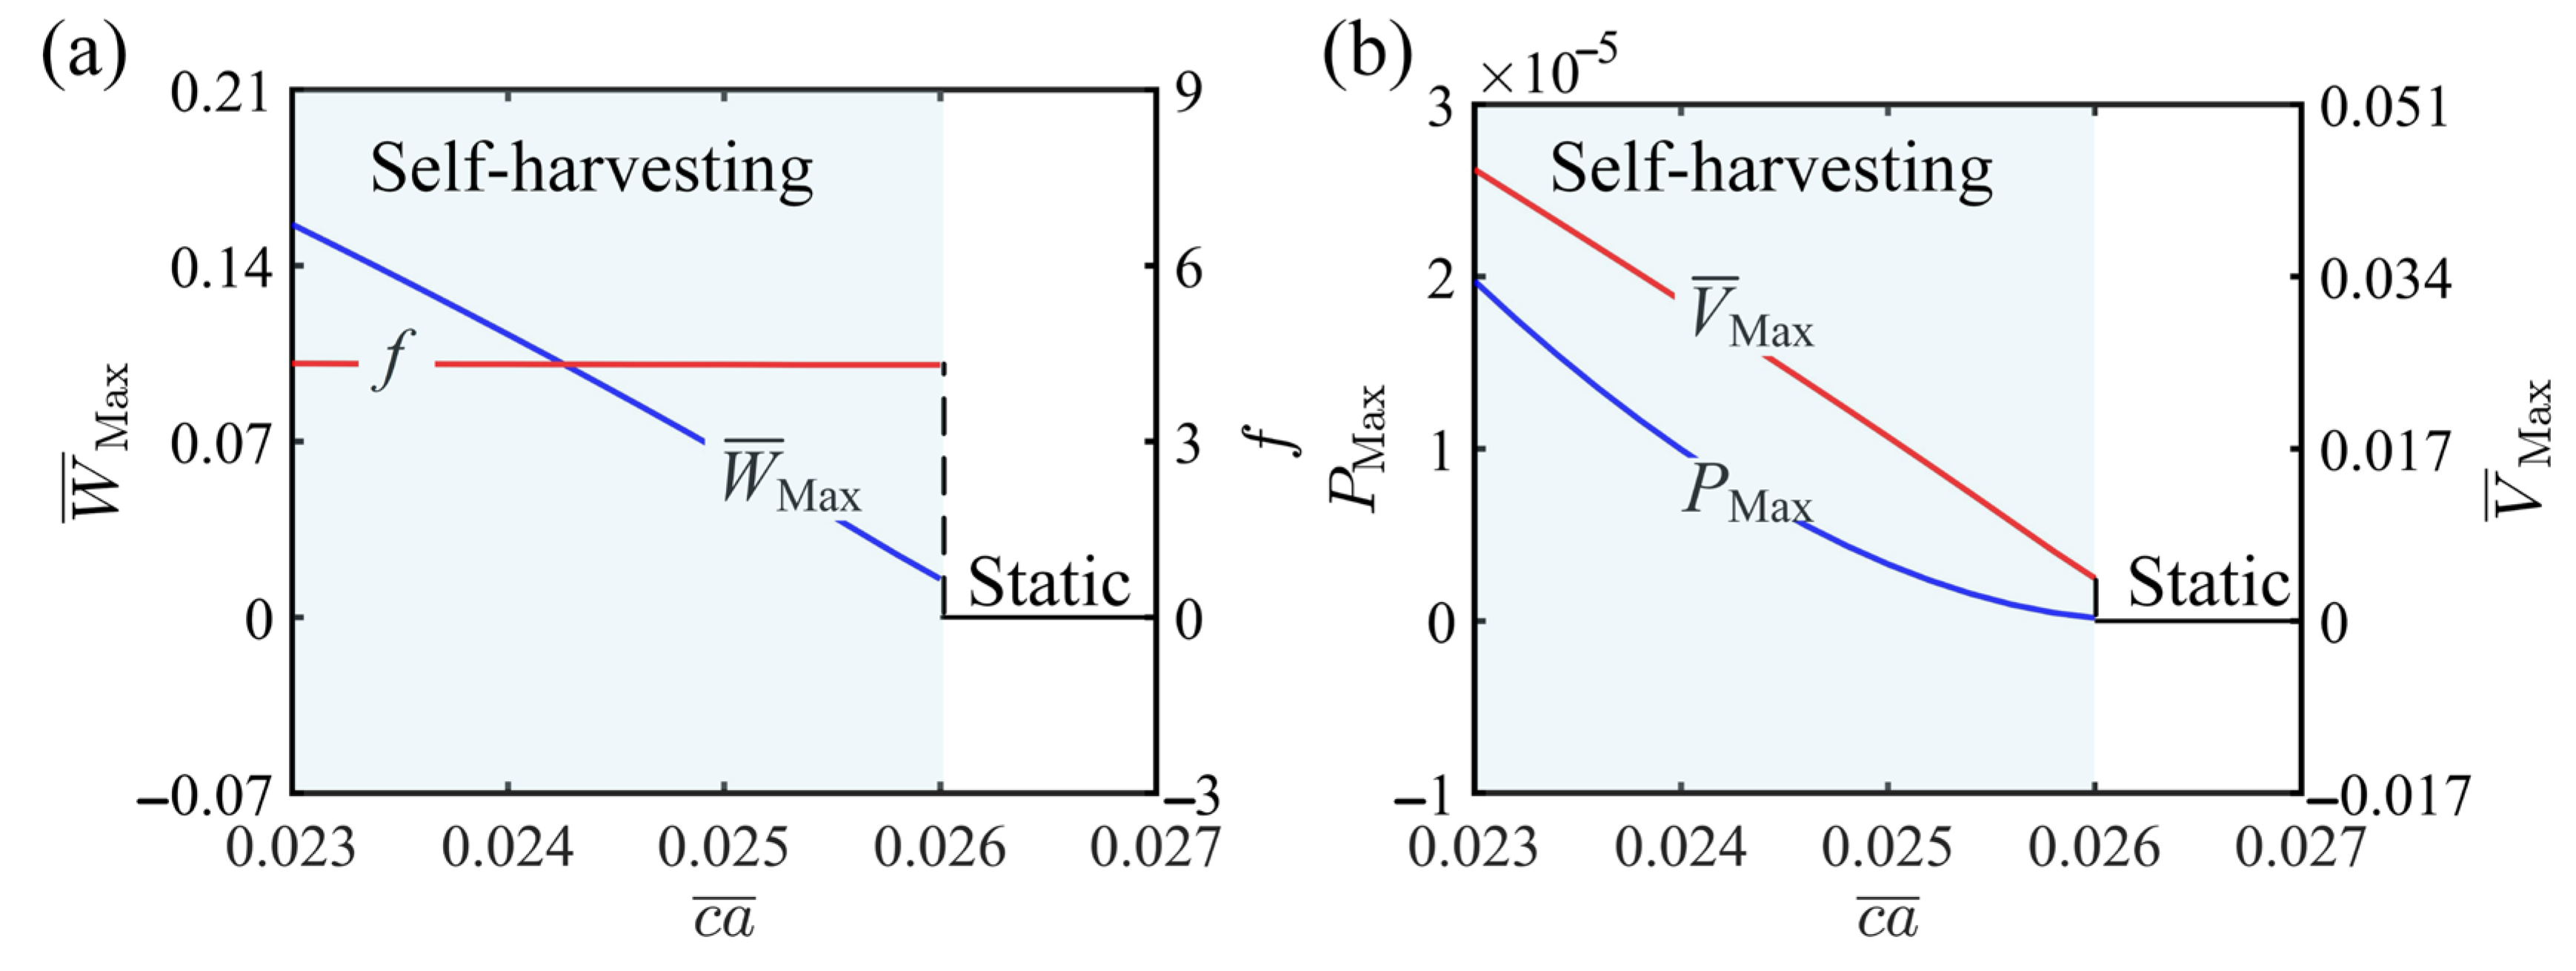
Figure 5 shows the effect of the first-order damping coefficient on light-driven self-harvesting of LCE fiber–piezoelectric beam system, while the remaining parameters are fixed at c ¯ q ¯ = 0.01 , K ¯ = 1.8 , γ ¯ = 3 , α ¯ 1 = 0.35 , τ ¯ = 0.1 , θ = 0.393 , α ¯ 2 = 0.1 , μ ¯ = 0.01 , L ¯ i = 1.2 . In Figure 5a, the amplitude is shown to decline with increasing damping, which is attributed to greater energy dissipation suppressing the system’s vibrational response. The oscillation frequency is largely unaffected by changes in the damping coefficient, implying that the first-order damping does not influence the system’s natural period. In Figure 5b, the voltage decreases as a result of the reduced amplitude, which in turn leads to a substantial decline in power, since power is proportional to the square of the voltage. In Figure 5, under the condition 0.023 < c ¯ a ¯ < 0.026 , the LCE–piezoelectric beam system is in the self-harvesting state, as indicated by the blue shaded region; when c ¯ a ¯ > 0.026 , the system is in the static state. With the continuous increase in the damping coefficient, the system’s energy loss also increases accordingly. This highlights the importance of controlling damping parameters in system design to maintain optimal performance and achieve efficient self-harvesting.

4.2. Parameters Promoting Self-Harvesting

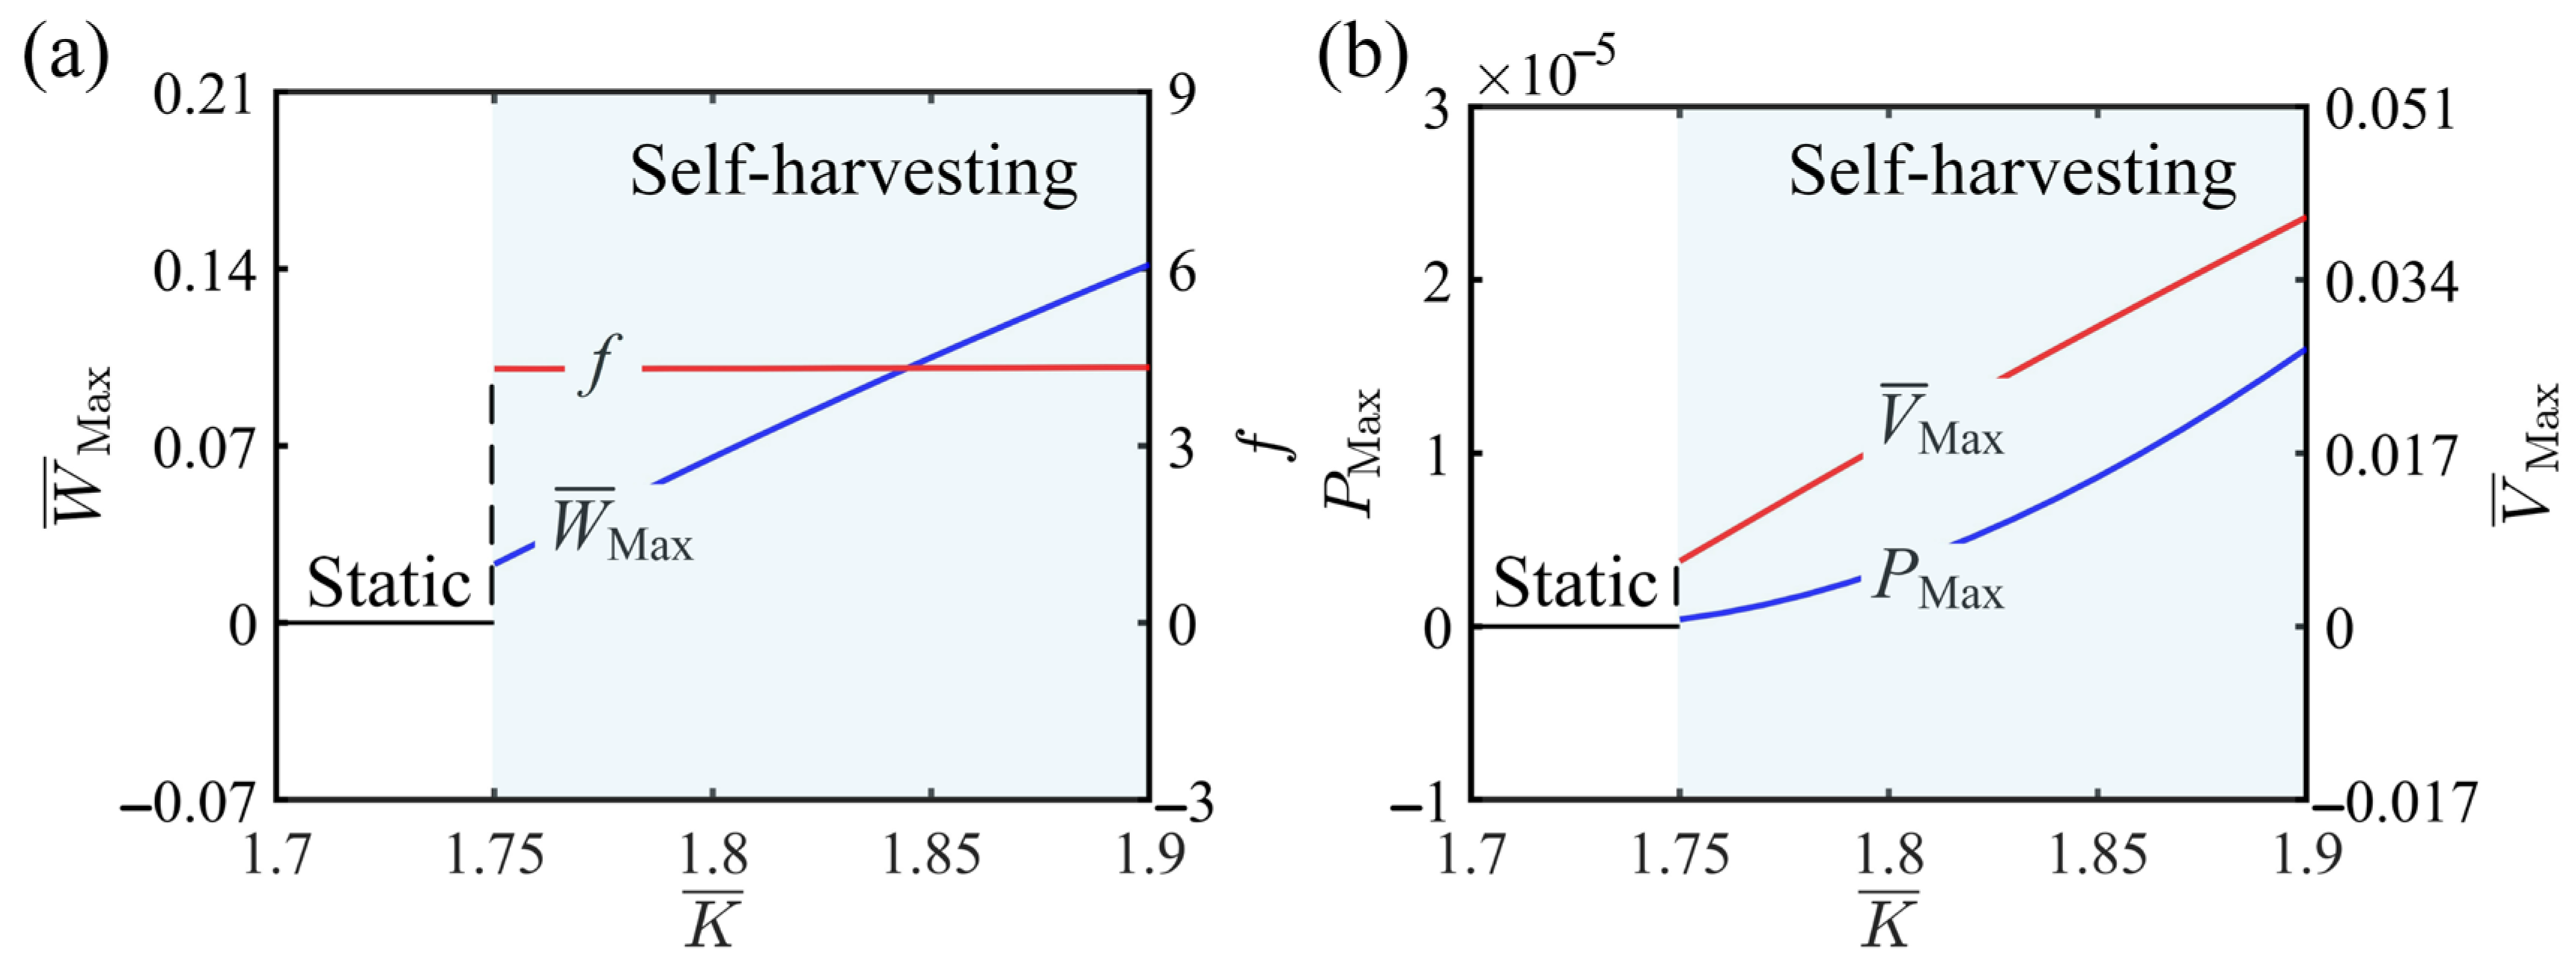
Figure 6 shows the effect of the elastic coefficient of LCE fiber on the LCE fiber–piezoelectric beam system, while the remaining parameters are fixed at c ¯ a ¯ = 0.025 , c ¯ q ¯ = 0.01 , γ ¯ = 3 , α ¯ 1 = 0.35 , τ ¯ = 0.1 , θ = 0.393 , α ¯ 2 = 0.1 , μ ¯ = 0.01 , L ¯ i = 1.2 . In Figure 6a, when K ¯ > 1.75 , the LCE fiber–piezoelectric beam system operates in the self-harvesting state, with the amplitude increasing as the elastic coefficient of the LCE fiber rises, owing to the enhanced rigidity that improves the vibrational response. The self-harvesting frequency remains nearly constant, indicating that changes in the elastic coefficient have little impact on the system’s natural frequency. In Figure 6b, the voltage rises as a result of the increased amplitude, leading to a significant improvement in power output. When K ¯ < 1.75 , the system is in the static state, and the amplitude, voltage, frequency, and power all approach zero. These results highlight the critical role of optimizing the elastic coefficient of the LCE material in enhancing piezoelectric energy harvesting performance, particularly in terms of amplitude, voltage, and power output, and offer valuable theoretical guidance for system design.
Figure 7 reveals the effect of the light gradient on the LCE fiber–piezoelectric beam system, with other parameters set as c ¯ a ¯ = 0.025 , c ¯ q ¯ = 0.01 , K ¯ = 1.8 , α ¯ 1 = 0.35 , τ ¯ = 0.1 , θ = 0.393 , α ¯ 2 = 0.1 , μ ¯ = 0.01 , L ¯ i = 1.2 . γ ¯ = 2.89 is the bifurcation point between the two states of the LCE fiber–piezoelectric beam system. In Figure 7a, when γ ¯ > 2.89 , the LCE fiber–piezoelectric beam system enters the self-harvesting state. As the light intensity gradient increases, the amplitude grows while the vibration frequency remains relatively stable. This behavior is attributed to the greater light absorption by the LCE fiber, which results in a larger internal temperature difference, increased thermal stress, and uneven deformation, thereby enhancing the vibrational response. In Figure 7b, the increase in amplitude leads to a higher piezoelectric voltage, resulting in a significant improvement in power generation. When γ ¯ < 2.89 , the LCE fiber–piezoelectric beam system transitions to a static state. These results demonstrate that precise control of the light intensity gradient is crucial for enhancing energy harvesting performance and optimizing system design.
Figure 8 shows the effect of the contraction coefficient on the LCE fiber–piezoelectric beam system, while the remaining parameters are fixed at c ¯ a ¯ = 0.25 , c ¯ q ¯ = 0.01 , K ¯ = 1.8 , γ ¯ = 3 , τ ¯ = 0.1 , θ = 0.393 , α ¯ 2 = 0.1 , μ ¯ = 0.01 , L ¯ i = 1.2 . As shown in Figure 8a, when α ¯ 1 > 0.33 , the deformation capability of the LCE fiber strengthens with the increase in the contraction coefficient, leading to a substantial increase in amplitude, while the self-harvesting frequency remains relatively unchanged. As illustrated in Figure 8b, the voltage amplitude rises directly with the increase in amplitude, which in turn enhances the power output, as power is proportional to the square of the voltage. However, when α ¯ 1 < 0.33 , the LCE fiber–piezoelectric beam system remains in a static state. These results indicate that rational adjustment of the LCE material’s contraction coefficient is crucial for maintaining stable vibrations and improving self-harvesting efficiency.
Figure 9 illustrates the effect of the thermal relaxation time on the LCE fiber–piezoelectric beam system, while the remaining parameters are fixed at c ¯ a ¯ = 0.025 , c ¯ q ¯ = 0.01 , K ¯ = 1.8 , γ ¯ = 3 , α ¯ 1 = 0.35 , θ = 0.393 , α ¯ 2 = 0.1 , μ ¯ = 0.01 , and L ¯ i = 1.2 . As shown in Figure 9a, the increase in thermal relaxation time leads to a significant rise in self-harvesting amplitude, while the vibration frequency increases only slightly and remains largely unaffected. In Figure 9b, both voltage and power increase significantly with a longer thermal relaxation time. When τ ¯ > 0.094 , the LCE fiber is able to absorb and release thermal energy more smoothly, allowing the material to maintain a higher temperature for a longer duration, thereby keeping the system in the self-harvesting state. Conversely, when τ ¯ < 0.094 , the energy absorption and release processes become too rapid to sustain sufficient temperature, sharply reducing the deformation capability of the LCE material and placing the system in a static state. These findings highlight that appropriate adjustment of the LCE material’s thermal relaxation time is essential for efficient energy harvesting in the design and optimization of the LCE–piezoelectric beam system.
Figure 10 illustrate the effect of the LCE initial length on the LCE fiber–piezoelectric beam system, while the remaining parameters are fixed at c ¯ a ¯ = 0.025 , c ¯ q ¯ = 0.01 , K ¯ = 1.8 , γ ¯ = 3 , α ¯ 1 = 0.35 , τ ¯ = 0.1 , θ = 0.393 , α ¯ 2 = 0.1 , μ ¯ = 0.01 . As the initial length of the LCE increases, both the amplitude and voltage show significant improvements. Figure 10a shows that during self-oscillation, the amplitude increases with the initial length of the LCE, while the self-oscillating frequency slightly decreases. Figure 10b demonstrates that the beam deformation grows with the increase in initial length, leading to a higher voltage output, and the power also rises accordingly, consistent with the trend described in Equation (45). Therefore, the net work performed in one cycle increases with the initial length of the LCE. When L ¯ i > 1 , the LCE–piezoelectric beam system is in the self-harvesting state; when L ¯ i < 1 , the system reaches a static state. To enhance light energy absorption, extending the initial length of the LCE fiber can improve the efficiency of converting light energy into electrical energy.

4.3. Parameters Non-Monotonically Affecting Self-Harvesting

Figure 11 shows the effect of the electromechanical coupling coefficient on the LCE fiber–piezoelectric beam system, while the remaining parameters are fixed at c ¯ a ¯ = 0.025 , c ¯ q ¯ = 0.01 , K ¯ = 1.8 , γ ¯ = 3 , α ¯ 1 = 0.35 , τ ¯ = 0.1 , θ = 0.393 , μ ¯ = 0.01 , L ¯ i = 1.2 . α ¯ 2 = 0.245 is the bifurcation point between the self-harvesting state and the static state of the LCE fiber–piezoelectric beam system. As shown in Figure 11a, the amplitude decreases with the increase in the electromechanical coupling coefficient, while the vibration frequency shows a slight rise, as indicated by the blue solid line. Figure 11b shows that as the electromechanical coupling coefficient increases, the voltage first increases and then decreases. Since power is proportional to the square of the voltage, the power output exhibits the same trend as the voltage. In Figure 11, when 0.005 < α ¯ 2 < 0.245 , the system operates in the self-harvesting state, whereas when α ¯ 2 > 0.245 , the system transitions to a static state. In conclusion, ensuring that the system operates near the optimal electromechanical coupling coefficient is crucial for maximizing energy output.
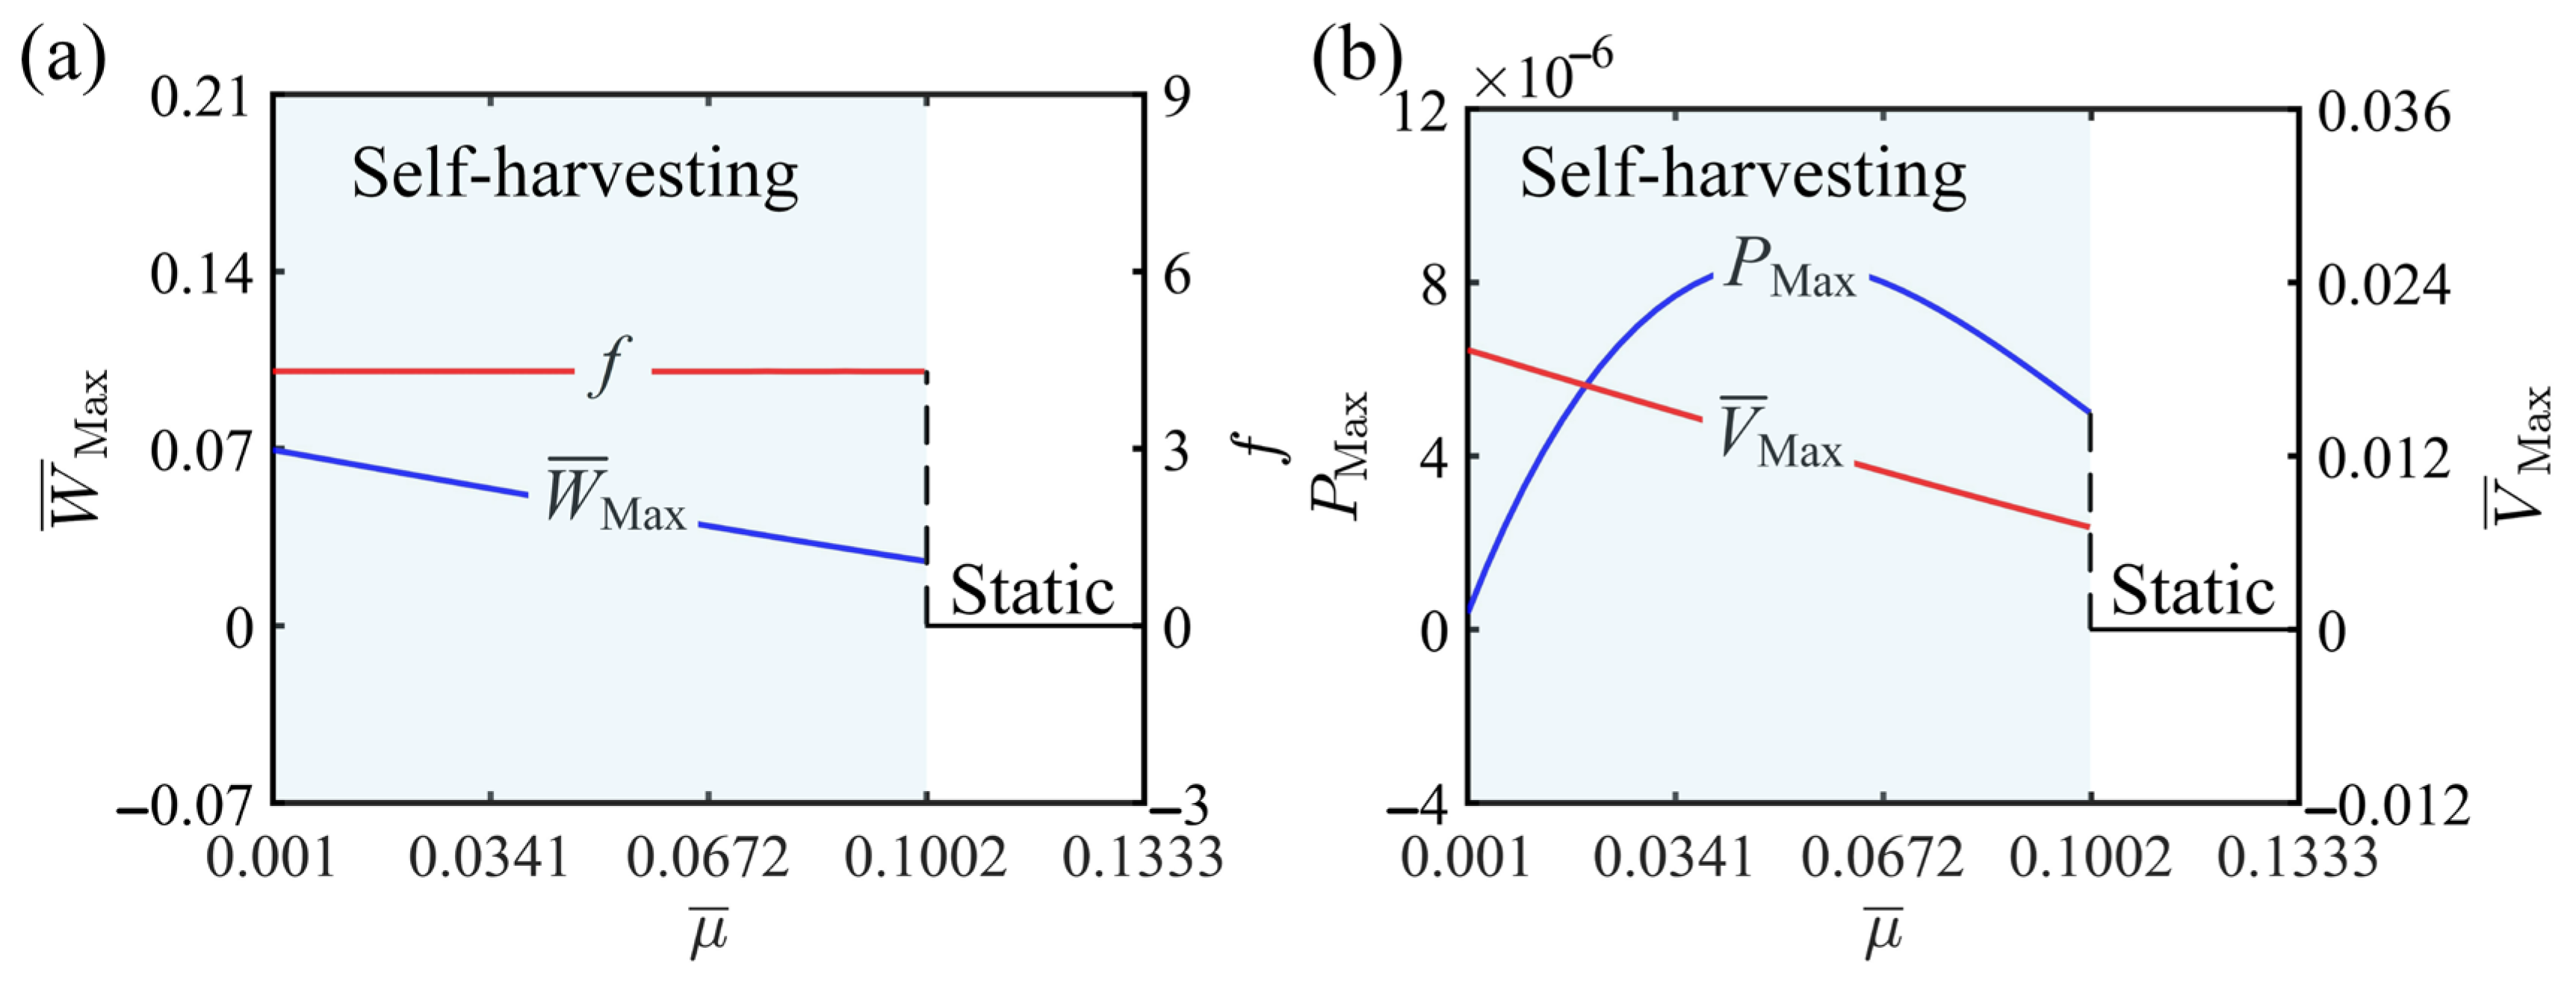
Figure 12 shows the effect of the resistivity on the piezoelectric energy harvesting system, while the remaining parameters are fixed at c ¯ a ¯ = 0.025 , c ¯ q ¯ = 0.01 , K ¯ = 1.8 , γ ¯ = 3 , α ¯ 1 = 0.35 , τ ¯ = 0.1 , θ = 0.393 , α ¯ 2 = 0.1 , and L ¯ i = 1.2 . As shown in Figure 12a, the system’s amplitude decreases with increasing resistivity, while the self-harvesting frequency slightly increases. As illustrated in Figure 12b, the piezoelectric voltage is determined by charge accumulation and load characteristics. When the resistivity is low, charge accumulates in the piezoelectric layer, generating high voltage. However, as resistivity increases, charge release is accelerated, causing the voltage to gradually decrease, with the power initially increasing and then decreasing. When 0.001 < μ < 0.1002 , the LCE–piezoelectric beam system is in a self-harvesting state, where the decrease in amplitude caused by higher resistivity directly reduces the deformation of the piezoelectric material, thereby affecting the voltage. When μ > 0.1002 , the system transitions to the static state. This finding highlights the importance of reasonably selecting the value of μ to optimize the system’s energy harvesting capability and dynamic response, providing a crucial theoretical basis for system design.

5. Conclusions

To address the challenges faced by traditional piezoelectric energy harvesters, such as the need for complex controllers, mechanical component wear, and their complex structures, this study proposes a light-fueled self-harvesting system by introducing self-vibration. The system consists of liquid crystal elastomer fibers, two resistors, and two piezoelectric cantilever beams arranged symmetrically. Light exposure induces mechanical deformation in the LCE fibers, triggers self-excited vibrations of the beam without the need for external periodic input. The integrated piezoelectric layer then converts the mechanical energy, derived from light-induced deformation, into electrical energy. The governing equations of the system are derived, and then identify two distinct states are subsequently identified through numerical analysis. In the self-harvesting state, the work performed by the tension in the LCE fibers equals the sum of the system’s damping dissipation and electrical energy output, thereby ensuring the system’s sustained self-oscillation.
Additionally, this study investigates the influence of various system parameters on the amplitude, frequency, voltage, and power of self-harvesting. The results show that an increase in the first and second damping coefficients reduces the power output. In contrast, an increase in the thermal relaxation time, the elastic coefficient of LCE fiber, light gradient, contraction coefficient, LCE initial length, and inclined angle leads to enhanced power output. Furthermore, both the electromechanical coupling coefficient and resistivity cause the power output to initially increase and then decline.
Compared with traditional vibration-based energy harvesters, the proposed light-driven self-harvesting system overcomes issues of mechanical wear and bulky structures, offering stable and controllable energy harvesting without the need for external mechanical excitation. It also demonstrates excellent environmental adaptability and efficient optomechanical coupling. Future work will focus on further improving the model and system performance by considering environmental perturbations such as thermal noise and illumination instabilities, addressing possible inhomogeneities in the piezoelectric composite layers, and extending the analysis to include additional higher-order modes if needed to capture more detailed dynamic behavior. This study provides a clear theoretical foundation for designing novel light-driven self-powered devices and highlights the potential for developing efficient, autonomously operating miniature energy harvesting systems.

Author Contributions

L.Z.: conceptualization, investigation, methodology, writing—reviewing and editing. H.C.: visualization, data curation, software, writing—original draft. W.B.: data curation, software. X.C.: validation. T.G.: validation, software. D.G.: methodology, supervision, writing—reviewing and editing. All authors have read and agreed to the published version of the manuscript.

Funding

The authors acknowledge the supports from Anhui Provincial Natural Science Foundation (Grant Nos. 2408085QA023 and 2208085Y01), University Natural Science Research Project of Anhui Province (Grant Nos. 2022AH040042 and 2022AH020029), National Natural Science Foundation of China (Grant No. 12172001), Housing and Urban-Rural Development Science and Technology Project of Anhui Province (Grant No. 2022-YF069), and Doctoral Startup Foundation from Anhui Jianzhu University (Grant No. JZ202406).

Data Availability Statement

No new data were created or analyzed in this study. Data sharing is not applicable to this article.

Conflicts of Interest

The authors declare that they have no known competing financial interests or personal relationships that could have appeared to influence the work reported in this paper.

References

  1. Wang, X.; Kang, X.; Ji, L.; Zhang, A.; Xia, G. Low frequency vibration energy harvesting of bio-inspired multi-stable piezoelectric vibration system with an adjustable device. Chaos Solitons Fractals 2025, 192, 116026. [Google Scholar] [CrossRef]
  2. Lv, H.; Liang, L.; Zhang, Y.; Deng, L.; Chen, Z.; Liu, Z.; Wang, H.; Chen, G. A flexible spring-shaped architecture with optimized thermal design for wearable thermoelectric energy harvesting. Nano Energy 2021, 88, 106260. [Google Scholar] [CrossRef]
  3. Zhang, X.; Shiu, B.C.; Li, T.; Liu, X.; Ren, H.; Wang, Y.; Lou, C.; Lin, J. Photo-thermoelectric nanofiber film based on the synergy of conjugated polymer and light traps for the solar-energy harvesting of textile solar panel. Sol. Energy Mater. Sol. Cells 2021, 232, 111353. [Google Scholar] [CrossRef]
  4. Sandelic, M.; Peyghami, S.; Sangwongwanich, A.; Blaabjerg, F. Reliability aspects in microgrid design and planning: Status and power electronics-induced challenges. Renew. Sustain. Energy Rev. 2022, 159, 112127. [Google Scholar] [CrossRef]
  5. Beniwal, R.; Kalra, S.; Beniwal, N.S.; Mazumdar, H.; Singhal, A.K.; Singh, S.K. Walk-to-charge technology: Exploring efficient energy harvesting solutions for smart electronics. J. Sens. 2023, 2023, 6614658. [Google Scholar] [CrossRef]
  6. Kumar, M.; Suhaib, M.; Sharma, N.; Kumar, S.; Kumar, M.; Choudhary, S. Energy harvesting technologies in mechanical systems: A comprehensive review. Int. J. Res. Public Rev. 2024, 5, 2782–2787. [Google Scholar] [CrossRef]
  7. Zhou, W.; Du, D.; Cui, Q.; Lu, C.; Wang, Y.; He, Q. Recent research progress in piezoelectric vibration energy harvesting technology. Energies 2022, 15, 947. [Google Scholar] [CrossRef]
  8. Wang, Y.; Wang, P.; Li, S.; Gao, M.; Ouyang, H.; He, Q.; Wang, P. An electromagnetic vibration energy harvester using a magnet-array-based vibration-to-rotation conversion mechanism. Energy Convers. Manag. 2022, 253, 115146. [Google Scholar] [CrossRef]
  9. Li, M.; Luo, A.; Luo, W.; Liu, X.; Wang, F. Electrostatic vibration energy harvester with a self-rechargeable electret. IEEE Electron. Device Lett. 2023, 44, 540–543. [Google Scholar] [CrossRef]
  10. Ge, D.; Bao, W.; Chen, H.; Li, K. A liquid crystal elastomer-based generator using light-powered self-oscillations. Chaos Solitons Fractals 2025, 199, 116690. [Google Scholar] [CrossRef]
  11. Asadi Jafari, M.H.; Zarastvand, M.; Zhou, J. Doubly curved truss core composite shell system for broadband diffuse acoustic insulation. Vib. Control 2024, 30, 4035–4051. [Google Scholar] [CrossRef]
  12. Kang, X.; Wang, X.; Xia, G. Ultra-low frequency vibration energy harvesting of piezoelectric vibration systems with an adjustable device. Alex. Eng. J. 2024, 100, 92–110. [Google Scholar] [CrossRef]
  13. Zhang, Y.; Wang, W.; Zheng, R.; Nakano, K.; Cartmell, M. A piezoelectric cantilever-asymmetric-conical-pendulum-based energy harvesting under multi-directional excitation. J. Sound Vib. 2024, 569, 118080. [Google Scholar] [CrossRef]
  14. Abdelkefi, A. Aeroelastic energy harvesting: A review. Int. J. Eng. Sci. 2016, 100, 112–135. [Google Scholar] [CrossRef]
  15. Zhou, S.; Lallart, M.; Erturk, A. Multistable vibration energy harvesters: Principle, progress, and perspectives. J. Sound Vib. 2022, 528, 116886. [Google Scholar] [CrossRef]
  16. Zhou, X.; Chen, G.; Jin, B.; Feng, H.; Chen, Z.; Fang, M.; Yang, B.; Xiao, R.; Xie, T.; Zheng, N. Multimodal autonomous locomotion of liquid crystal elastomer soft robot. Adv. Sci. 2024, 11, 2402358. [Google Scholar] [CrossRef] [PubMed]
  17. Zhang, Z.; Jiang, X.; Qiu, Y.; Li, K. Stepwise self-oscillation of a photo-oscillator via time delay. Int. J. Mech. Sci. 2025, 288, 110046. [Google Scholar] [CrossRef]
  18. Dai, L.; Xu, J.; Xiao, R. Modeling the stimulus-responsive behaviors of fiber-reinforced soft materials. Int. J. Appl. Mech. 2024, 16, 2450041. [Google Scholar] [CrossRef]
  19. Zhao, J.; Zhang, Z.; Sun, X.; Zuo, W.; Li, K. Multi-modal self-sustained motions of a silicone oil paper disc on a surface driven by hot steam. Chaos Solitons Fractals 2025, 191, 115898. [Google Scholar] [CrossRef]
  20. Ge, D.; Bao, W.; Li, K.; Liang, H. Self-oscillation-driven locomotion in a liquid crystal elastomer-based robot under constant illumination. Commun. Nonlinear Sci. Numer. 2025, 145, 108706. [Google Scholar] [CrossRef]
  21. Wang, X.; Ho, G.W. Design of untethered soft material micromachine for life-like locomotion. Mater. Today 2022, 53, 197–216. [Google Scholar] [CrossRef]
  22. Liu, J.; Xu, L.; Ji, Q.; Chang, L.; Hu, Y.; Peng, Q.; He, X. A MXene-based light-driven actuator and motor with self-sustained oscillation for versatile applications. Adv. Funct. Mater. 2024, 34, 2310955. [Google Scholar] [CrossRef]
  23. He, Q.; Yin, R.; Hua, Y.; Jiao, W.; Mo, C.; Shu, H.; Raney, J.R. A modular strategy for distributed, embodied control of electronics-free soft robots. Sci. Adv. 2023, 9, eade9247. [Google Scholar] [CrossRef] [PubMed]
  24. Yang, H.; Yin, X.; Zhang, C.; Chen, B.; Sun, P.; Xu, Y. Weaving liquid crystal elastomer fiber actuators for multifunctional soft robotics. Sci. Adv. 2025, 11, eads3058. [Google Scholar] [CrossRef] [PubMed]
  25. Liao, W.; Yang, Z. The integration of sensing and actuating based on a simple design fiber actuator towards intelligent soft robots. Adv. Mater. Technol. 2022, 7, 2101260. [Google Scholar] [CrossRef]
  26. Sun, J.; Wang, Y.; Liao, W.; Yang, Z. Ultrafast, high-contractile electrothermal-driven liquid crystal elastomer fibers towards artificial muscles. Small 2021, 17, 2103700. [Google Scholar] [CrossRef]
  27. Sun, X.; Zhou, K.; Xu, P. Chaotic self-beating of left ventricle modeled by liquid crystal elastomer. Thin-Walled Struct. 2024, 205, 112540. [Google Scholar] [CrossRef]
  28. Wang, Y.; Yin, R.; Jin, L.; Liu, M.; Gao, Y.; Raney, J.; Yang, S. 3D-Printed photoresponsive liquid crystal elastomer composites for free-form actuation. Adv. Funct. Mater. 2023, 33, 2210614. [Google Scholar] [CrossRef]
  29. Wang, L.; Wei, Z.; Xu, Z.; Yu, Q.; Wu, Z.; Wang, Z.; Qian, J.; Xiao, R. Shape morphing of 3d printed liquid crystal elastomer structures with precuts. ACS Appl. Polym. Mater. 2023, 5, 7477–7484. [Google Scholar] [CrossRef]
  30. Lu, D.; Wang, L.; Chen, B.; Xu, Z.; Wang, Z.; Xiao, R. Shape memory behaviors of 3D printed liquid crystal elastomers. Soft Sci. 2023, 3, 5. [Google Scholar] [CrossRef]
  31. Xu, Z.; Chen, Y.; Zhu, L.; Ge, Q.; Wu, Z.L.; Qu, S.; Xiao, R. Tailored helix morphing of 3D-printed liquid crystal elastomer bilayers. Cell Rep. Phys. Sci. 2025, 6, 102835. [Google Scholar] [CrossRef]
  32. Wang, Y.; Dang, A.; Zhang, Z.; Yin, R.; Gao, Y.; Feng, L.; Yang, S. Repeatable and reprogrammable shape morphing from photoresponsive gold nanorod/liquid crystal elastomers. Adv. Mater. 2020, 32, 2004270. [Google Scholar] [CrossRef]
  33. Wang, X.; Shao, H.; Tang, J.; Chen, J.; Huang, Y.; Pan, J.; Zhang, Y.; Wang, W.; Jiang, J.; Chen, N. Braided liquid crystal elastomer fiber actuator with programmable deformation for artificial muscles. Adv. Mater. Technol. 2023, 8, 2300814. [Google Scholar] [CrossRef]
  34. He, Q.; Wang, Z.; Wang, Y.; Wang, Z.; Li, C.; Annapooranan, R.; Zeng, J.; Chen, R.; Cai, S. Electrospun liquid crystal elastomer microfiber actuator. Sci. Robot. 2021, 6, eabi9704. [Google Scholar] [CrossRef] [PubMed]
  35. Li, Y.; Liu, Y.; Luo, D. Polarization dependent light-driven liquid crystal elastomer actuators based on photothermal effect. Adv. Opt. Mater. 2021, 9, 2001861. [Google Scholar] [CrossRef]
  36. Qiu, Y.; Li, K. Light-powered self-striking liquid crystal elastomer hammers inspired by mantis shrimp. Commun. Nonlinear Sci. Numer. 2025, 146, 108802. [Google Scholar] [CrossRef]
  37. Huang, C.; Yang, F.; Li, K.; Dai, Y.; Yu, Y. Modeling and analysis of self-sustaining oscillation behavior of liquid crystal elastomer fiber/baffle system under stable full-field illumination. Chaos Solitons Fractals 2025, 194, 116259. [Google Scholar] [CrossRef]
  38. Zhu, L.; He, M.; Chen, B.; Qian, J.; Xiao, R.; Solids, P. Inflation of a polydomain nematic elastomeric membrane. J. Mech. Phys. Solids 2025, 198, 106075. [Google Scholar] [CrossRef]
  39. Bai, C.; Kang, J.; Wang, Y. Kirigami-inspired light-responsive conical spiral actuators with large contraction ratio using liquid crystal elastomer fiber. ACS Appl. Mater. Interfaces 2025, 17, 14488–14498. [Google Scholar] [CrossRef]
  40. Wu, H.; Zhao, C.; Dai, Y.; Li, K. Light-fueled self-fluttering aircraft with a liquid crystal elastomer-based engine. Commun. Nonlinear Sci. Numer. 2024, 132, 107942. [Google Scholar] [CrossRef]
  41. Liu, J.; Qian, G.; Dai, Y.; Yuan, Z.; Song, W.; Li, K. Nonlinear dynamics modeling of a light-powered liquid crystal elastomer-based perpetual motion machine. Chaos Solitons Fractals 2024, 184, 114957. [Google Scholar] [CrossRef]
  42. Rešetič, A.; Milavec, J.; Domenici, V.; Zupančič, B.; Bubnov, A.; Zalar, B. Deuteron NMR investigation on orientational order parameter in polymer dispersed liquid crystal elastomers. Phys. Chem. Chem. Phys. 2020, 22, 23064–23072. [Google Scholar] [CrossRef]
  43. Xu, T.; Pei, D.; Yu, S.; Zhang, X.; Yi, M.; Li, C. Design of mxene composites with biomimetic rapid and self-oscillating actuation under ambient circumstances. ACS Appl. Mater. Interfaces 2021, 13, 31978–31985. [Google Scholar] [CrossRef]
  44. Dai, Y.; Jiang, X.; Wang, K.; Li, K. A phototunable self-oscillatory bistable seesaw via liquid crystal elastomer fibers. Chaos Solitons Fractals 2025, 200, 117041. [Google Scholar] [CrossRef]
  45. Yu, Y.; Huang, C.; Liu, C.; Wang, Z.; Ma, H.; Xu, P. Heat-driven self-wobbling of a liquid crystal elastomer double-wheel linkage. Thin-Walled Struct. 2025, 217, 113829. [Google Scholar] [CrossRef]
  46. Bai, C.; Kang, J.; Wang, Y. Light-induced motion of three-dimensional pendulum with liquid crystal elastomeric fiber. Int. J. Mech. Sci. 2024, 266, 108911. [Google Scholar] [CrossRef]
  47. Zhao, J.; Wang, X.; Qiu, Y.; Chen, H.; Li, K. Light-powered self-swing of a bistable magnetic pendulum utilizing liquid crystal elastomer fibers. Chaos Solitons Fractals 2025, 198, 116565. [Google Scholar] [CrossRef]
  48. Li, K.; Zhao, C.; Qiu, Y.; Dai, Y. Light-powered self-rolling of a liquid crystal elastomer-based dicycle. Appl. Math. Mech-Engl. 2025, 46, 253–268. [Google Scholar] [CrossRef]
  49. Wu, H.; Ge, D.; Qiu, Y.; Li, K.; Xu, P. Mechanics of light-fueled bidirectional self-rolling in a liquid crystal elastomer rod on a track. Chaos Solitons Fractals 2025, 191, 115901. [Google Scholar] [CrossRef]
  50. Bai, C.; Kang, J.; Wang, Y. Light-induced wrinkling in annulus anisotropic liquid crystal elastomer films. Phys. Rev. E 2025, 111, 015421. [Google Scholar] [CrossRef]
  51. Zhang, Z.; Qiu, Y.; Li, K. Light-fueled self-ejecting liquid crystal elastomer launcher inspired by lizard tail autotomy. Chaos Solitons Fractals 2025, 194, 116265. [Google Scholar] [CrossRef]
  52. Yu, Y.; Dai, Z.; Li, T.; Wang, Z.; Ma, H.; Li, K. Self-tapping of a liquid crystal elastomer thin beam above a hot plate. Chaos Solitons Fractals 2025, 199, 116904. [Google Scholar] [CrossRef]
  53. Fang, X.; Lou, J.; Wang, J.; Chuang, K.; Wu, H.; Huang, Z. A self-excited bistable oscillator with a light-powered liquid crystal elastomer. Int. J. Mech. Sci. 2024, 271, 109124. [Google Scholar] [CrossRef]
  54. Wu, H.; Lou, J.; Dai, Y.; Zhang, B.; Li, K. Multi-scale analysis of the self-vibration of a liquid crystal elastomer fiber-spring system exposed to constant-gradient light. J. Zhejiang Univ.-Sci. A 2025, 26, 652–665. [Google Scholar] [CrossRef]
  55. Sun, X.; Ge, D.; Li, K.; Xu, P. Chaotic self-oscillation of liquid crystal elastomer double-line pendulum under a linear temperature field. Chaos Solitons Fractals 2024, 189, 115653. [Google Scholar] [CrossRef]
  56. Sun, X.; Zhou, K.; Chen, Y.; Gao, J.; Xu, P. Self-oscillation chaotic motion of a liquid crystal elastomer pendulum under gradient-stabilized illumination. Chaos Solitons Fractals 2025, 193, 116128. [Google Scholar] [CrossRef]
  57. Kang, W.; Cheng, Q.; Liu, C.; Wang, Z.; Li, D.; Liang, X. A constitutive model of monodomain liquid crystal elastomers with the thermal-mechanical-nematic order coupling. J. Mech. Phys. Solids 2025, 196, 105995. [Google Scholar] [CrossRef]
  58. Verma, R. Energy harvesting techniques for self-powered electronics: State-of-the-art and challenges. J. Adv. Res. Electron. Eng. Technol. 2023, 10, 6. [Google Scholar]
  59. Wu, N.; Bao, B.; Wang, Q. Review on engineering structural designs for efficient piezoelectric energy harvesting to obtain high power output. Eng. Struct. 2021, 235, 112068. [Google Scholar] [CrossRef]
  60. Zhang, W.; Nan, Y.; Wu, Z.; Shen, Y.; Luo, D.J.M. Photothermal-driven liquid crystal elastomers: Materials, alignment and applications. Molecules 2022, 27, 4330. [Google Scholar] [CrossRef]
  61. Abdelkefi, A.; Nayfeh, A.H.; Hajj, M.R. Global nonlinear distributed-parameter model of parametrically excited piezoelectric energy harvesters. Nonlinear Dyn. 2012, 67, 1147–1160. [Google Scholar] [CrossRef]
  62. Warner, M.; Terentjev, E.M. Liquid Crystal Elastomers; Oxford University Press: London, UK, 2003. [Google Scholar]
  63. Ahn, C.; Liang, X.; Cai, S. Bioinspired design of light-powered crawling, squeezing, and jumping untethered soft robot. Adv. Mater. Technol. 2019, 4, 6004. [Google Scholar] [CrossRef]
  64. Morison, J.; Johnson, J.; Schaaf, S. The force exerted by surface waves on piles. J. Pet. Technol. 1950, 2, 149–154. [Google Scholar] [CrossRef]
  65. Wang, Q.; Cross, L. Constitutive equations of symmetrical triple layer piezoelectric benders. IEEE Trans. Ultrason. Ferroelectr. Freq. Control. 1999, 46, 1343–1351. [Google Scholar] [CrossRef] [PubMed]
  66. Mahmoodi, S.; Jalili, N. Non-linear vibrations and frequency response analysis of piezoelectrically driven microcantilevers. Int. J. Non-Linear Mech. 2007, 42, 577–587. [Google Scholar] [CrossRef]
  67. Xia, G.; Zhang, S.; Kang, X.; Han, T.; Chen, L.; Lim, C.W. Performance analysis of nonlinear piezoelectric energy harvesting system under bidirectional excitations. Compos. Struct. 2023, 324, 117529. [Google Scholar] [CrossRef]
  68. Sadeghian, H.; Rezazadeh, G. Comparison of generalized differential quadrature and Galerkin methods for the analysis of micro-electro-mechanical coupled systems. Commun. Nonlinear Sci. Numer. 2009, 14, 2807–2816. [Google Scholar] [CrossRef]
  69. William, T. Theory of Vibration with Applications; Prentice-Hall Inc.: Saddle River, NJ, USA, 1988. [Google Scholar]
  70. Li, K.; Cai, S. Modeling of light-driven bending vibration of a liquid crystal elastomer beam. J. Appl. Mech. 2016, 83, 031009. [Google Scholar] [CrossRef]
  71. Azimi, M. Stability and bifurcation of Mathieu–Duffing equation. Int. J. Nonlinear Mech. 2022, 144, 104049. [Google Scholar] [CrossRef]
  72. Braun, L.; Hessberger, T.; Pütz, E.; Mueller, C.; Giesselmann, F.; Serra, C.; Zentel, R. Actuating thermo- and photo-responsive tubes from liquid crystalline elastomers. J. Mater. Chem. C 2018, 6, 9093–9101. [Google Scholar] [CrossRef]
  73. Li, H.; Sun, H.; Song, B.; Zhang, D.; Shang, X.; Liu, D. Nonlinear dynamic response of an L-shaped beam-mass piezoelectric energy harvester. J. Sound Vib. 2021, 499, 116004. [Google Scholar] [CrossRef]
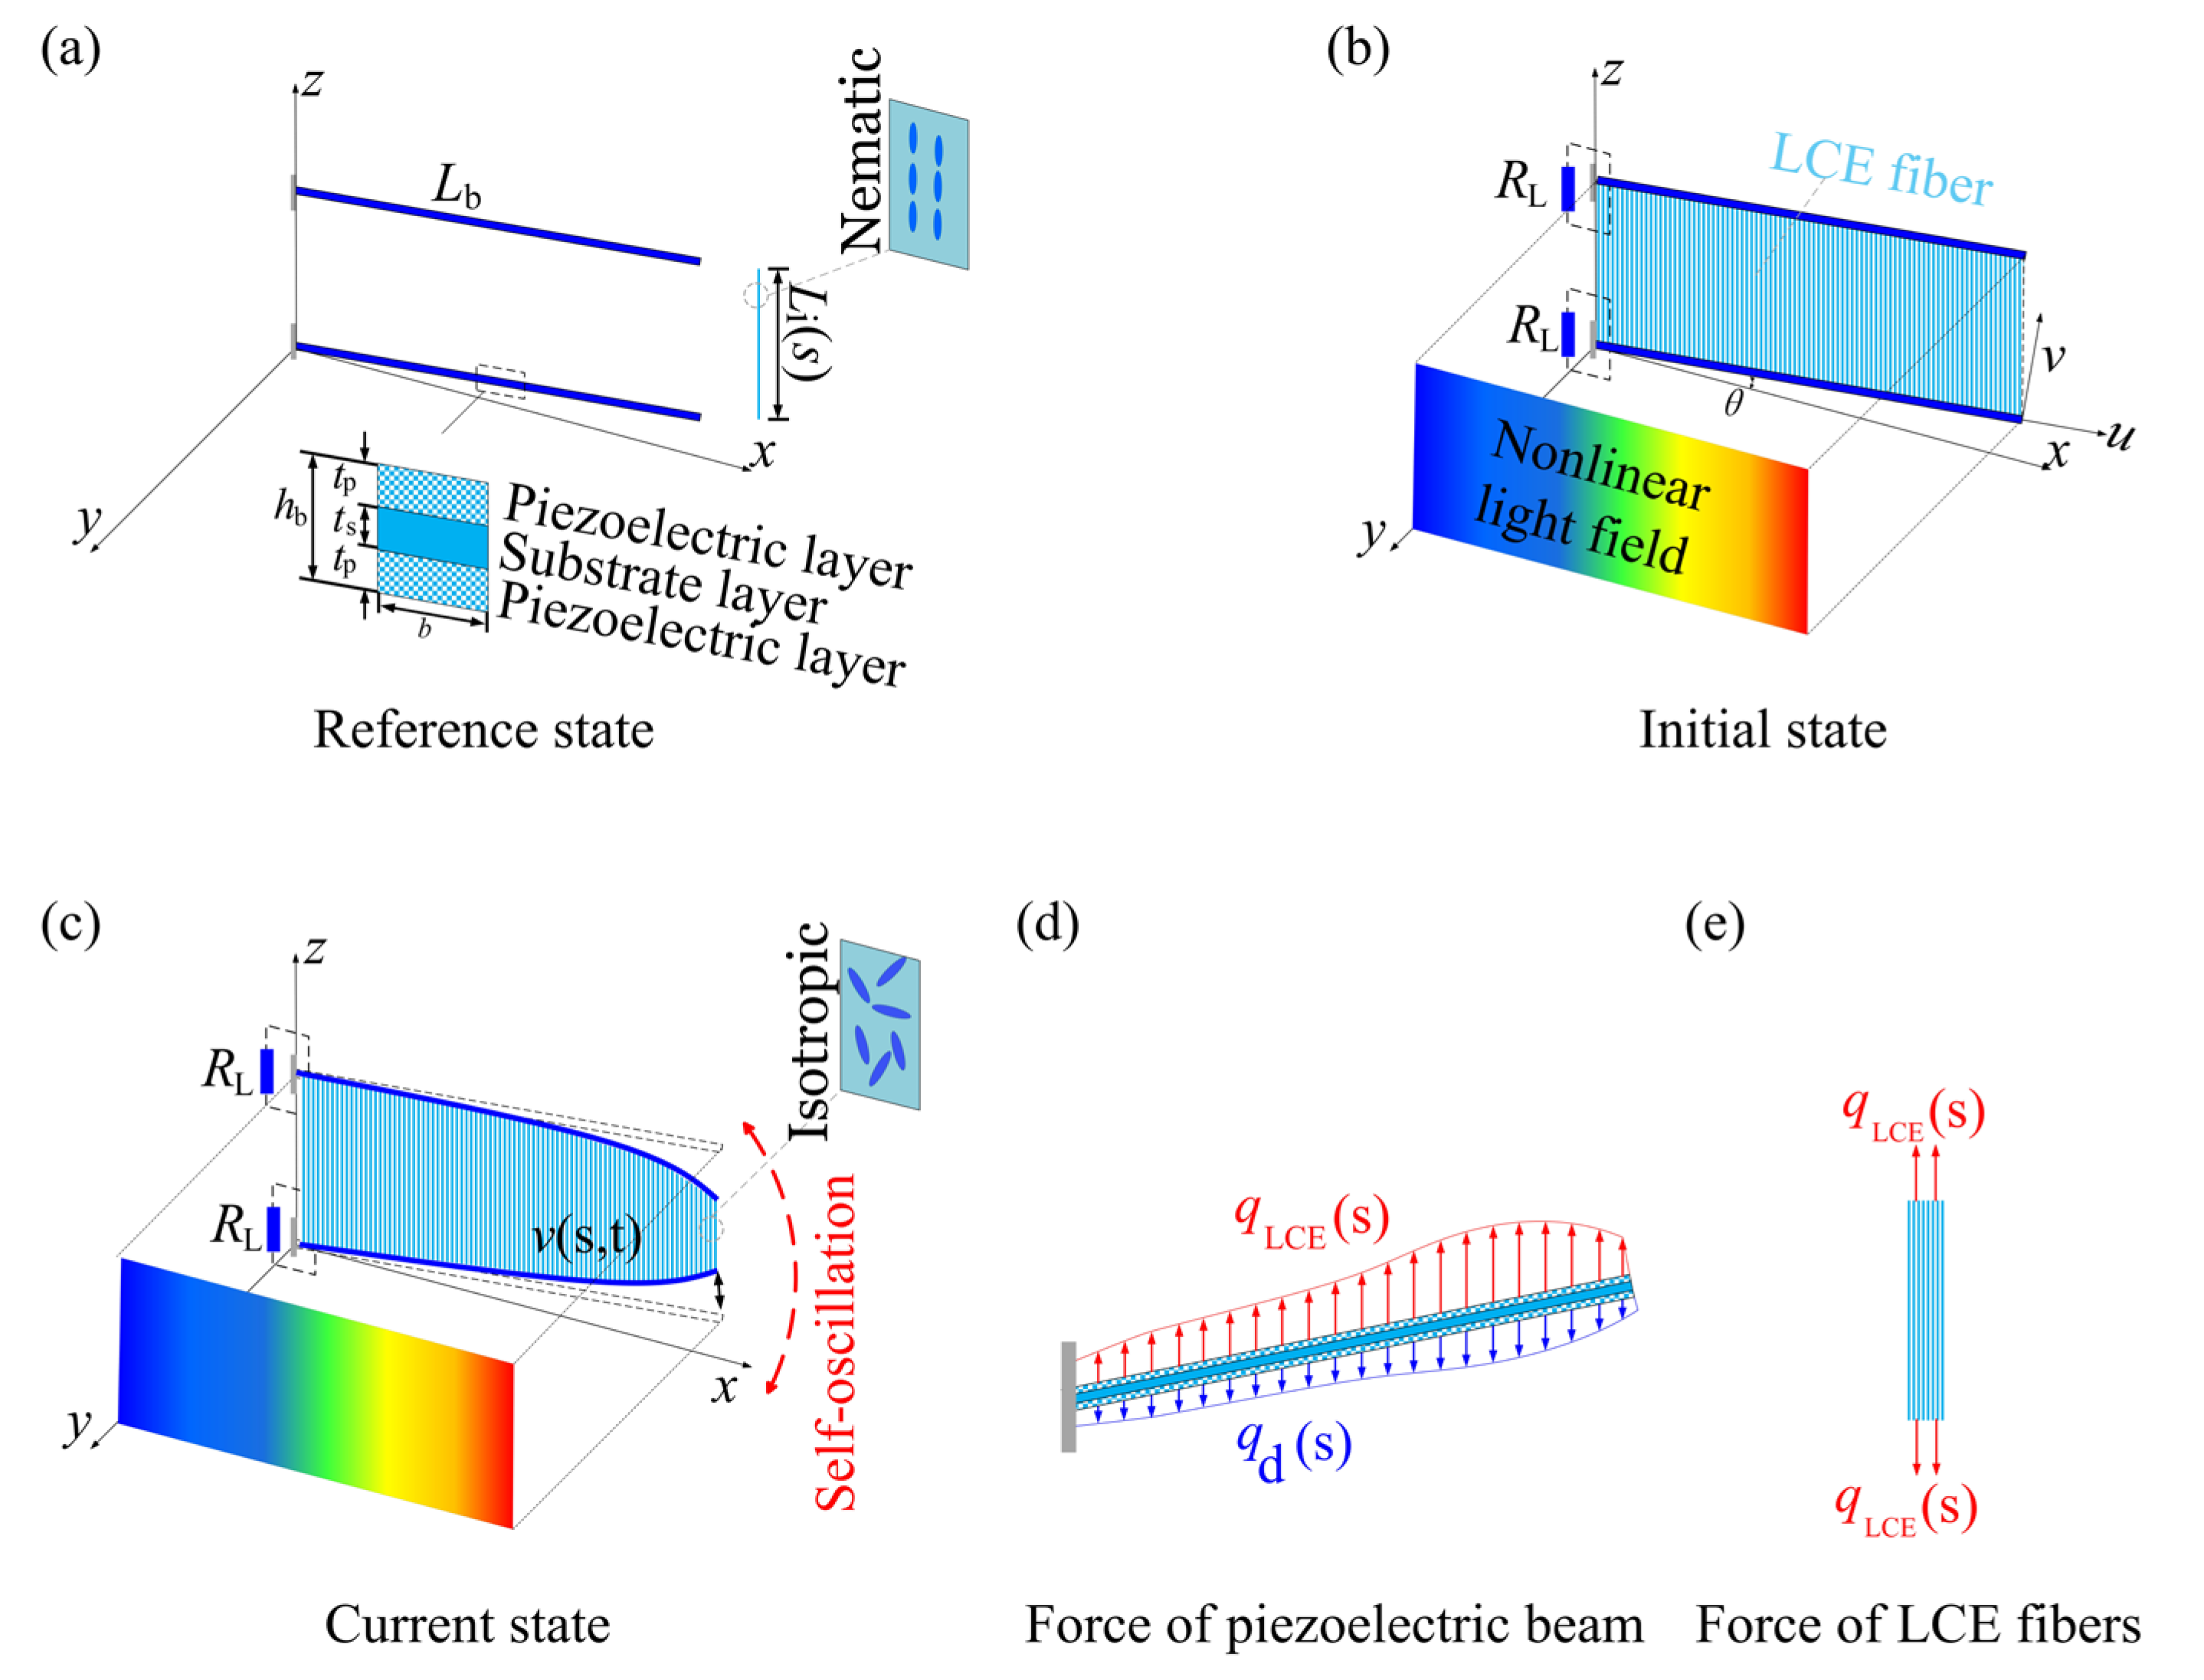
Figure 1. Schematic diagram of the light-fueled self-harvesting of piezoelectric beams actuated by liquid crystal elastomer fibers. (a) Reference state. (b) Initial state. (c) Current state. (d) Force of piezoelectric beam. (e) Force of the LCE fibers. Under illumination, the LCE fibers contract vertically, pulling the piezoelectric beams, causing these beams to self-oscillate periodically, thereby generating voltage.
Mathematics 13 03226 g001
Figure 2. (a) Displacement, (b) phase trajectories, (c) voltage, and (d) displacement–voltage response for the self-oscillation state ( c ¯ a ¯ = 0.025 ). (e) Displacement, (f) phase trajectories, (g) voltage, and (h) displacement–voltage response for the static state ( c ¯ a ¯ = 0.035 ). The system parameters are assigned the following values: c ¯ q ¯ = 0.01 , K ¯ = 1.8 , γ ¯ = 3 , α ¯ 1 = 0.35 , τ ¯ = 0.1 , θ = 0.393 , α ¯ 2 = 0.1 , μ ¯ = 0.01 , L ¯ i = 1.2 . Two distinct motion states of the system—self-harvesting and static—can be achieved by tuning the system parameters.
Mathematics 13 03226 g002
Figure 3. Mechanism of the self-oscillation state. (a) Time–history curve for the displacement; (b) time–history curve for temperature; (c) time–history curve for the tension of the LCE fibers; (d) the relationship between displacement and LCE fibers tension; (e) time–history curve for the damping force; (f) the relationship between displacement and damping force. Under illumination, the work performed by the LCE fiber tension balances the energy dissipated by damping, thereby maintaining the system in a self-harvesting state.
Mathematics 13 03226 g003
Figure 4. Mechanism of the static state. (a) Time–history curve for the displacement; (b) time–history curve for the power of LCE fibers tension; (c) time–history curve for the tension of the LCE fibers; (d) time–history curve for the power of the damping force; (e) time–history curve for the damping force; (f) time–history curve for the difference between the power of LCE fiber tension and the damping power. At a high first-order damping coefficient c ¯ a ¯ = 0.032 , the LCE fibers absorb insufficient light energy to compensate for the energy dissipation, leading the system to a static state due to inadequate kinetic energy.
Mathematics 13 03226 g004
Figure 5. Influence of the first-order damping coefficient c ¯ a ¯ on (a) amplitude W ¯ Max , and frequency f , (b) voltage V ¯ Max , and power P Max . As c ¯ a ¯ increases, with a noticeable decrease in W ¯ Max , V ¯ Max , and P Max , while f shows relatively small variations. The blue shaded region indicates the self-harvesting state of the system.
Mathematics 13 03226 g005
Figure 6. Influence of the elastic coefficient K ¯ of LCE fiber on (a) amplitude W ¯ Max and frequency f , (b) voltage V ¯ Max and power P Max . As K ¯ increases, there is a noticeable increase in W ¯ Max , V ¯ Max , and P Max , while the increase in f is relatively slow. The blue shaded region indicates the self-harvesting state of the system.
Mathematics 13 03226 g006
Figure 7. Influence of the light gradient γ ¯ on (a) amplitude W ¯ Max and frequency f , (b) voltage V ¯ Max and power P Max . As γ ¯ increases, there is a noticeable increase in W ¯ Max , V ¯ Max , and P Max , while the increase in f is relatively slow. The blue shaded region indicates the self-harvesting state of the system.
Mathematics 13 03226 g007
Figure 8. Influence of the contraction coefficient α ¯ 1 on (a) amplitude W ¯ Max and frequency f , (b) voltage V ¯ Max and power P Max . As α ¯ 1 increases, with a noticeable increase in W ¯ Max , V ¯ Max , and P Max , while the increase in f is relatively slow. The blue shaded region indicates the self-harvesting state of the system.
Mathematics 13 03226 g008
Figure 9. Influence of the thermal relaxation time τ ¯ on (a) amplitude W ¯ Max and frequency f , (b) voltage V ¯ Max and power P Max . As τ ¯ increases, there is a noticeable increase in W ¯ Max , V ¯ Max , and P Max , while the increase in f is relatively slow. The blue shaded region indicates the self-harvesting state of the system.
Mathematics 13 03226 g009
Figure 10. Influence of the LCE initial length L ¯ i on (a) amplitude W ¯ Max and frequency f , (b) voltage V ¯ Max and power P Max . As L ¯ i increases, there is a noticeable increase in W ¯ Max , V ¯ Max , and P Max , while the increase in f is relatively slow. The blue shaded region indicates the self-harvesting state of the system.
Mathematics 13 03226 g010
Figure 11. Influence of the electromechanical coupling coefficient α ¯ 2 on (a) amplitude W ¯ Max and frequency f , (b) voltage V ¯ Max and power P Max . As α ¯ 2 increases, the W ¯ Max decreases significantly, the f increases slightly, and both V ¯ Max and P Max increase and then decrease. The blue shaded region indicates the self-harvesting state of the system.
Mathematics 13 03226 g011
Figure 12. Influence of the resistivity μ ¯ on (a) amplitude W ¯ Max and frequency f , (b) voltage V ¯ Max and power P Max . As μ ¯ increases, W ¯ Max and V ¯ Max decrease significantly, f rises slightly, and P Max first increases and then decreases. The blue shaded region indicates the self-harvesting state of the system.
Mathematics 13 03226 g012
Table 1. Material properties and geometric parameters.
ParameterDefinitionValueUnits
L b Length of the cantilever beam 0.01 ~ 0.1 m
L i Initial length of LCE fiber 0.01 ~ 0.02 m
α 1 Contraction coefficient 0 ~ 0.5 /
τ Thermal relaxation time 0 ~ 0.002 s
I Photothermal intensity 0 ~ 200 ° C
γ Light gradient 0 ~ 1200 ° C / m
θ Inclined angle 0 ~ π / 2 /
K Elastic coefficient of LCE fiber 0 ~ 30 N / m
c a First-order damping coefficient 0 ~ 0.01 kg / m s
c q Second-order damping coefficient 0 ~ 0.2 kg / m 2
b Width of the cantilever 0.01 ~ 0.02 m
m Mass per unit length of the cantilever 0.005 ~ 0.1 kg / m
t s Thickness of substrate layer 0 ~ 2 × 10 4 m
Y s Young’s modulus of substrate layer 50 ~ 210 GPa
Y p Young’s modulus of piezoelectric layer 50 ~ 210 GPa
t p Thickness of piezoelectric layer 0 ~ 2 × 10 4 m
ε 33 T Piezoelectric dielectric constant 320 × 10 12 F / m
d 31 Piezoelectric strain constant 320 × 10 12 C / N
R L Resistance of the resistor 100 ~ 2000 k Ω
Table 2. Dimensionless parameters.
Parameter α ¯ 2 γ ¯ K ¯ c ¯ a c ¯ q τ ¯ μ α ¯ 1 L ¯ i θ
Value 0 ~ 0.5 0.5 ~ 4 0.1 ~ 5 0 ~ 0.1 0 ~ 1 0.01 ~ 1 0 ~ 0.2 0 ~ 0.5 0 ~ 2 0 ~ 0.5
Disclaimer/Publisher’s Note: The statements, opinions and data contained in all publications are solely those of the individual author(s) and contributor(s) and not of MDPI and/or the editor(s). MDPI and/or the editor(s) disclaim responsibility for any injury to people or property resulting from any ideas, methods, instructions or products referred to in the content.