Abstract
High-frequency vibrations in annular gap type pressure-regulating valves of wind tunnels can induce fatigue, fracture, and operational failures, posing challenges to safe and reliable operation. This study proposes a hybrid leakage fault diagnosis framework that integrates wavelet packet-based signal analysis with advanced deep learning techniques. Time-domain acceleration signals collected from multiple sensors are processed to extract maximum component energy and its variation rate, identified as sensitive and robust indicators for leakage detection. A fluid–solid coupled finite element model of the valve system further validates the reliability of these indicators under different operational scenarios. Based on this foundation, a Vision Transformer (ViT)-based model is trained on a dedicated database encompassing multiple leakage conditions and sensor arrangements. Comparative evaluation demonstrates that the ViT model outperforms conventional deep learning architectures in terms of accuracy, stability, and predictive reliability. The integrated framework enables fast, automated, and robust leakage diagnosis, providing a comprehensive solution to enhance the monitoring, maintenance, and operational safety of wind tunnel valve systems.
Keywords:
pressure-regulating valve; leakage fault diagnosis; wavelet packet analysis; energy variation rate; deep learning MSC:
65Z05
1. Introduction
The wind tunnel is a ground test facility that artificially generates airflow for conducting various aerodynamic tests. With the rapid development of modern aerospace technology, wind tunnel structures are widely used. In a downflowing transonic wind tunnel, the annular gap-type pressure-regulating valve is an essential component that controls the air pressure within the stable section. It is a key device for regulating the quality of the wind tunnel flow field and is also one of the devices most affected by airflow during operation. During wind tunnel operation, the opening of the pressure-regulating valve can be adjusted through the control system to maintain stable air pressure at a specified operating value, even as the air source pressure decreases. The performance of the regulating valve directly affects the operating pressure of the wind tunnel, the precision of Mach number control in the test section, and the quality of the test-section flow field. Valve failure may cause positive shock wave reflection in the test section and insufficient total pressure protection at different Mach numbers. Such failures frequently lead to a high proportion of wind tunnel shutdowns, and the annual cost of valve maintenance accounts for more than half of the total maintenance expenditure. In addition, the failure of a single component can have a severe impact on the entire system [1,2,3]. Therefore, accurately identifying and predicting valve faults is of great significance for ensuring safe system operation, reducing valve maintenance costs, and preventing safety accidents [4,5].
Research on valve fault diagnosis has mainly focused on improving the accuracy and reliability of detection results, enabling early identification of incipient faults, and investigating valve failure mechanisms. With the rapid development of artificial intelligence [6,7,8], many scholars have emphasized the development of intelligent diagnostic systems. Several studies have applied neural networks and fuzzy recognition techniques to the diagnosis of viscous or sticking faults in pneumatic valves [9,10,11]. Other works have investigated fault diagnosis of reciprocating compressors, abnormality detection of valves under varying operating conditions, fault detection and isolation schemes based on the H∞ control theory, and fault prediction using self-organizing mapping networks [12,13,14]. In China, diagnostic methods based on support vector machines and decision trees have been proposed, improving the accuracy of valve fault diagnosis [15]. Additional studies have employed threshold-based fault detection as well as PSO-BP and LM-BP neural networks for diagnosing faults in pneumatic regulating valves and compressor pneumatic valves [16,17,18]. Probabilistic principal component analysis and support vector machines have also been integrated for valve fault diagnosis, while approaches such as the exponential weighted moving average control chart and SVM-based diagnosis have been developed to enhance the accuracy and reliability of detection [19,20,21]. Overall, artificial intelligence offers promising opportunities for engineering applications [22,23,24]. However, most existing studies focus mainly on fault classification and recognition, without considering preprocessing of fault signals.
Compared with traditional signal processing techniques such as the Fourier transform, wavelet analysis can simultaneously represent signals in both the time and frequency domains, thereby overcoming their limitations. Wavelets form a family of basis functions that capture the local characteristics of a signal in the joint time–frequency domain. Wavelet analysis can reveal structural features embedded in data that are not easily recognized by other methods, making it particularly useful for fault diagnosis. Consequently, wavelet transform has been widely recognized as an effective tool for fault diagnosis [25]. For example, Kitada applied wavelet transform to the identification of nonlinear structural dynamic systems [26]. Wang developed a wavelet-based technique and applied it to spatially distributed structural response signals, demonstrating that wavelet components can capture fluctuations in response signals induced by structural faults [27]. However, the low resolution of wavelet transform at high frequencies limits its ability to detect components near the high-frequency range.
The wavelet packet transform is an enhanced version of the wavelet transform that addresses the limitation of wavelet analysis, which provides high time resolution at low frequencies but poor frequency resolution at high frequencies. Wavelet packet transform offers more precise signal analysis by inheriting the concept of localized analysis from the short-time Fourier transform while overcoming the drawback of a fixed window size. This makes it an effective tool for joint time–frequency analysis, mitigating spectral leakage and picket-fence effects commonly observed in Fourier transform. Owing to these advantages, wavelet packet decomposition has been widely applied in signal denoising and feature extraction. Wavelet packets form a family of basis functions constructed as linear combinations of standard wavelet functions, enabling signal analysis with flexible time–frequency resolution. Given the non-stationary characteristics of impact vibration signals in reciprocating pump valves, Pei et al. [28] employed harmonic wavelet packet energy feature extraction combined with a least squares support vector machine (LSSVM) to identify pump valve faults. Wu et al. [29] proposed a valve fault diagnosis method based on wavelet packet decomposition, kernel principal component analysis (KPCA), and a support vector machine (SVM). They verified the approach using four states—normal valve, valve fragment fracture, spring failure, and valve leakage—and demonstrated that after wavelet packet KPCA feature extraction, the data were reduced from eight to three dimensions, achieving a classification accuracy of 95%. Compared with conventional signal features, their method enabled online diagnosis and identification of reciprocating compressor valve faults. Zhang [30] developed a bearing fault diagnosis method that combined wavelet packet decomposition with an improved BP neural network. The initial weights and thresholds of the neural network were optimized using a genetic algorithm to improve convergence speed and overcome the shortcoming of being trapped in local minima. The feasibility of this hybrid method was validated using laboratory-measured bearing fault data.
In recent years, deep learning has emerged as a powerful tool for automatic feature extraction and classification in complex systems [31,32,33,34]. It has also shown potential benefits for optimizing structural design [35,36,37]. By learning directly from raw or transformed sensor data, deep learning models can capture subtle patterns in non-stationary vibration signals [38,39], providing superior fault detection performance over traditional methods. For example, Tran et al. [40] proposed a hybrid deep belief network (DBN) to diagnose complex fault patterns in compressor valves. Cai et al. [41] applied an enhanced VGG model to valve leakage fault diagnosis in diesel engines. Zhang et al. [42] developed a gated recurrent unit–enhanced CNN architecture to diagnose faults in multi-way directional valves of hydraulic systems. However, these studies largely rely on variants of conventional CNN-based models and have not fully exploited the potential of attention-based architectures. Among deep learning approaches, the Vision Transformer (ViT) has demonstrated remarkable performance in extracting hierarchical features from various types of sequential or image-like data. By applying ViT to continuous wavelet-transformed acceleration signals, we establish a robust and automated diagnostic framework for wind tunnel valve leakage, enabling rapid and accurate classification across multiple leakage scenarios. We also construct a dedicated database by simulating multiple leakage conditions and collecting acceleration signals from various sensor locations. The integration of wavelet-based signal analysis and ViT-based deep learning offers a comprehensive framework that balances signal-level interpretability with data-driven predictive accuracy.
Despite extensive research on valve fault diagnosis using traditional signal processing and machine learning methods, most studies have primarily focused on fault classification or recognition. They often rely on handcrafted features, fail to comprehensively address non-stationary signals, and rarely integrate physics-based simulations with data-driven models. In particular, pre-processing of fault signals to enhance interpretability is seldom considered, and the ability of deep learning models to accurately localize leakage faults under various sensor arrangements remains largely unexplored.
This paper proposes an integrated framework for diagnosing leakage faults in wind tunnel pressure-regulating valves by combining wavelet packet-based signal analysis with ViT-based deep learning. First, two signal-level indices—namely, the maximum component energy and the variation rate of maximum component energy—are extracted from wavelet packet decomposition of acceleration signals to identify leakage conditions. Second, a fluid–structure coupled finite element model of the valve is established to simulate acceleration responses under various leakage scenarios. These indices provide physically interpretable features for fault detection. Finally, the ViT model is trained on a dedicated database comprising multiple leakage scenarios and sensor locations, enabling rapid, automated, and highly accurate classification of valve leakage faults. The proposed approach effectively integrates signal-level interpretability with data-driven predictive capability, providing a robust solution for wind tunnel valve monitoring and maintenance.
2. Research Framework and Workflow
The main steps of this study are summarized as follows:
- Select an appropriate wavelet packet system and extract sub-band energy features from sensor signals.
- Construct diagnostic indicators based on sub-band energy ratios.
- Develop a finite element model of the valve system to validate the sensitivity of the features.
- Build a comprehensive database integrating simulated data.
- Train and evaluate deep learning models (ViT, SwinT, ResNet, and GoogLeNet) using standard evaluation metrics.
- Compare the performance of the models and identify the most effective diagnostic approach.
3. Principle of Wavelet Decomposition
3.1. Basic Concept of Wavelet Transform
Wavelet analysis is a time–frequency method that overcomes the fixed-window limitation of the short-time Fourier transform by adapting the resolution according to frequency, providing high frequency resolution at low frequencies and high time resolution at high frequencies. Building on this, the wavelet packet transform further decomposes both low- and high-frequency components, enabling a more complete and flexible representation of signal features. This makes it particularly suitable for extracting localized characteristics from complex, non-stationary signals.
A wavelet packet is constructed through linear combinations of wavelet functions while retaining their orthogonality and time–frequency localization properties. The wavelet packet function is generally denoted by three indices representing amplitude modulation i, scale j, and translation k, and can be expressed as:
The wavelet function can be solved by the following two-scale equations:
where is the scale function, and the original wavelet function is called the mother wavelet function. The discrete filter coefficient and are integral mirror filter coefficients associated with the scale function and the mother wavelet function, respectively.
The wavelet transform decomposes a signal hierarchically, whereas the wavelet packet transform further decomposes both low- and high-frequency components at each level, providing finer resolution of high-frequency information. The recursive relation for horizontal wavelet packet decomposition of any signal of and orders can be expressed as:
where H and G are filtering operators corresponding to h(k) and g(k), respectively, and their expressions are as follows:
After the wavelet packet decomposition at j level, the initial signal f(t) can be expressed as
The wavelet packet component signal can be expressed as a linear combination of the wavelet packet function :
The wavelet packet coefficient can be obtained by the following equation:
Firstly, the signal energy at the level is defined as
where the component energy of the wavelet packet can be considered as the energy stored in component signal :
The wavelet function at the same scale j superimposes on the component signal during the time domain transformation, as shown −∞ < k < ∞. This indicates that the component energy represents the signal energy in the frequency band determined by the wavelet function . Equation (11) implies that the total signal energy can be expressed as the sum of the energy of wavelet packet components corresponding to different frequency bands.
The component energy of a signal is highly sensitive to variations in its characteristics and can be used to reveal fault-related features. Distinct leakage states of the wind tunnel pressure-regulating valve correspond to specific wavelet packet component energy distributions, making this index a reliable indicator for fault detection. The procedure begins with applying the wavelet packet transform to the dynamic response signals collected by the sensors, with the decomposition level determined according to the structural type and fault severity. Using the db1 wavelet basis, the acceleration signal is decomposed into three levels, yielding eight components whose energies are subsequently computed. The resulting wavelet packet component energy tree quantifies the proportion of energy contained in each decomposed component relative to the original signal, thereby providing a clear representation of the energy distribution across different frequency bands.
3.2. Signal Processing and Analysis
The discrete wavelet transform method was implemented using the wavelet transform function in MATLAB R2022a, which provides various wavelet families for effective analysis of different signal faults. Selecting an appropriate wavelet function for a specific signal is a critical task. Commonly used wavelet functions include the Morlet wavelet function, Mexican Hat wavelet function, Meyer wavelet function, Haar wavelet function (that is, db1 wavelet function), Daubechies wavelet function (dbN), and Symlets wavelet function (symN), among others. The dbN wavelet function is a subset of the Daubechies family, where N represents the number of vanishing moments, also known as taps. The classification of Daubechies wavelet functions is based on the value of N: generally, a larger number of vanishing moments corresponds to smoother scaling and wavelet functions, and the wavelet filter length is twice the value of N. For example, when N equals 1, the Daubechies wavelet function coincides with the Haar wavelet function, and both the scaling and wavelet functions are discontinuous. When N equals 2, the scaling and wavelet functions of the Daubechies wavelet function are continuous but not differentiable. When N equals 3, the scaling and wavelet functions are continuously differentiable.
Due to the absence of universally accepted criteria for optimal wavelet selection for specific signals, multiple tests using known abnormal data are typically required. Previous study [43] indicated that the Haar wavelet is most effective in detecting fault features in gas chamber leakage valve position signals, the db4 wavelet is suitable for analyzing power characteristics of electric valves, and the db3 wavelet is effective in decomposing looseness faults of positioner feedback rods. Based on these considerations, this study employs the Haar wavelet (db1) for multi-level wavelet decomposition and fault analysis of the vibration signals from the pressure-regulating valve.
4. Vibration Monitoring and Leakage Fault Diagnosis of Pneumatic Pressure Regulating Valve
The objective of this experiment was to study a 1.2 m temporary impulse transonic wind tunnel. The wind tunnel is primarily used for conducting aerodynamic characteristic tests on high-speed aircraft. Figure 1 shows the physical layout of the wind tunnel and the annular gap type pressure regulating valve. The regulating valve is capable of achieving linear or nearly linear regulating characteristics and offers several advantages, including good symmetry of air flow downstream of the valve, a wide regulating range, and uniform resistance changes during movement of the valve core, making it suitable for wind tunnel pressure regulation. Due to the large test Mach number and the wide pressure operating range of the supersonic wind tunnel, the valve configuration adopts a parallel arrangement of the main pressure regulating valve and a bypass valve. The bypass valve can be fully open or fully closed. When the Mach number in the test section is low and the flow rate is high, the bypass valve can be opened to improve the pressure regulation performance of the main pressure regulator and meet the pressure regulation requirements under all operating conditions of the wind tunnel.

Figure 1.
Experimental specimens of wind tunnel and main pressure regulating valve.
The main pressure regulating valve was constructed from structural steel with an elastic modulus of 200 GPa, a Poisson’s ratio of 0.3, and a density of 7850 kg/m3. The valve’s air chamber was supported by two support plates, which were in turn fixed to the ground. During a manual inspection conducted on 18 January 2022, a leak was detected in the flange of the pressure regulating valve, prompting close monitoring of the valve. To measure the vibration characteristics of the valve under the influence of the air flow, acceleration sensors were installed along both the longitudinal and circumferential directions of the valve body to collect vibration signals from multiple locations. Subsequently, the wavelet packet analysis method was employed to diagnose and identify any air leakage faults.
4.1. Sensors Arranged Along the Length Direction of the Valve
Figure 2 shows the arrangement of acceleration sensors along the length of the valve. Sensors 1 and 2 were positioned close to the leak site, whereas sensors 3 to 6 were located farther away. Sensors 1–6 correspond to channels 1–6 of the data acquisition instrument, with a sampling frequency of 50 kHz. The collected data file is named DSA-20220118-1934-31. The time-domain acceleration signals recorded by sensors 1–6 are presented in Figure 3, and the corresponding acceleration spectra are shown in Figure 4.
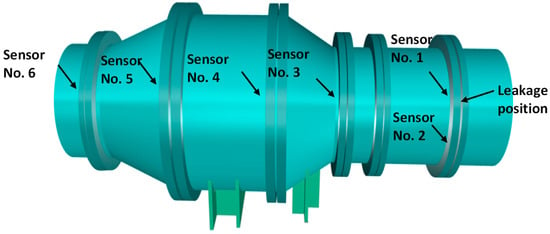
Figure 2.
Sensors arranged along the length direction of the valve.
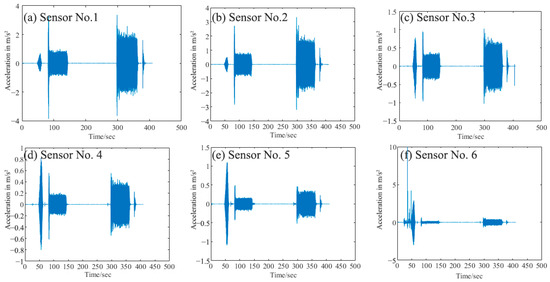
Figure 3.
Time domain signal of acceleration of sensors No. 1–6.
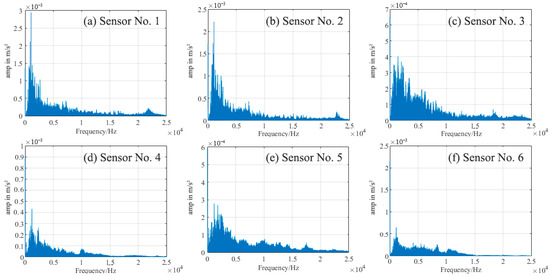
Figure 4.
Spectrum signal of acceleration of sensors No. 1–6.
The key to fault diagnosis based on vibration test data is to identify a characteristic index that can effectively reflect the state of the structural system, also referred to as a diagnostic index. In this study, the acceleration response signals from sensors No. 1 and No. 2, located near the air leakage site, and those from the other sensors did not show any significant visual differences, as illustrated by the time-domain acceleration signals in Figure 3 and the corresponding spectral signals in Figure 4. Because the directly obtained time-domain data and the Fourier-transformed spectral signals exhibit only a weak correlation with the structural fault features, it is necessary to transform the measured data from the test space to the feature space and extract feature vectors that are related to the structural fault state, thereby enabling accurate fault diagnosis.
This study presents a novel approach for fault identification based on the maximum component energy index derived from wavelet packet analysis. First, the dynamic acceleration signal of the measured structure is decomposed into wavelet packet components. Then, the wavelet packet component energy corresponding to the acceleration signals from different sensors is calculated, and the maximum component energy of the wavelet packet is used as the diagnostic index. The selection of the decomposition level in wavelet packet analysis balances frequency resolution and computational efficiency. In this study, a three-level decomposition was adopted considering the sampling frequency of 50 kHz, the frequency range of interest for valve vibration signals, and the computational cost. Three levels provide sufficient frequency resolution to distinguish leakage-induced features, while additional decomposition levels would significantly increase computational cost without noticeable improvement in fault detection performance. Limiting the decomposition to three levels thus achieves a reasonable trade-off between accuracy and efficiency. Figure 5 illustrates the wavelet packet component energy tree for the acceleration signals from sensors No. 1–6, obtained through three-level wavelet packet decomposition. The values in the wavelet packet component energy tree represent the percentage of energy contained in each frequency band relative to the total energy of the original signal at different decomposition levels.
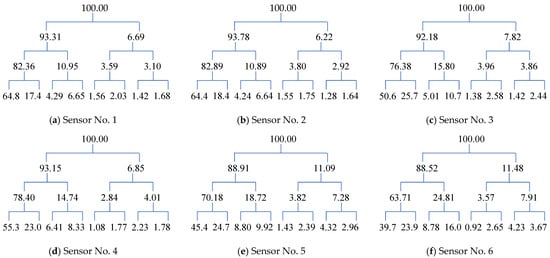
Figure 5.
Component energy tree of wavelet packet of acceleration signal of sensors No. 1–6.
Assuming an original signal energy value of 100 and using the db1 wavelet function, the entire frequency range of the original signal is divided into several independent frequency bands through three-level wavelet packet decomposition, and the energy of the structural response in each frequency band is obtained. The structural response energies for different frequency bands at the first, second, and third decomposition levels are shown from top to bottom. The sampling frequency is 50 kHz. After filtering and sorting, the eight data points in the third level represent the frequency bands 0–3125 Hz, 3125–6250 Hz, 6250–9375 Hz, 9375–12,500 Hz, 12,500–15,625 Hz, 15,625–18,750 Hz, 18,750–21,875 Hz, and 21,875–25,000 Hz, respectively. Figure 6 shows the energy distribution of the third-level wavelet packet components of the acceleration signals from sensors 1–6. It can be observed that the energy in the 0–3125 Hz band is the largest. At the third decomposition level, the energy distributions of the wavelet packet components for sensors 1 and 2 are similar and significantly higher than those of the other sensors. The component energy tree of the acceleration signals from different sensors is also shown in Figure 6, with the original signal energy set to 100 and the db1 wavelet function applied. After three-level wavelet packet decomposition, the first, second, and third decomposition levels are, respectively, divided into several independent frequency bands from top to bottom, and the energy of the structural response in each band is obtained.
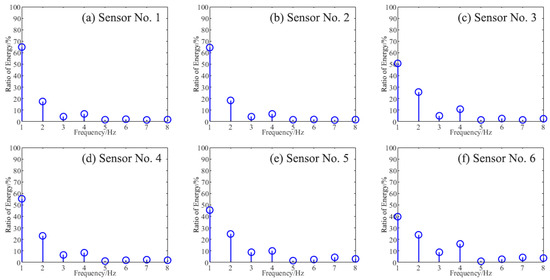
Figure 6.
Energy diagram of the third packet component of the acceleration signal of No. 1–6 sensors.
Figure 7 presents a tree diagram illustrating the wavelet packet decomposition. The numbers preceding the parentheses indicate the decomposition level, while the numbers following the parentheses indicate the nodes. Figure 8 shows the spectrum of the eight nodes obtained from decomposing the signal from sensor No. 1 at the third level, as indicated in Figure 7.

Figure 7.
Wavelet packet decomposition tree.
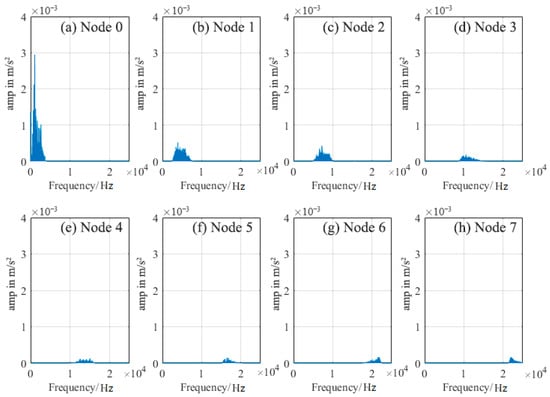
Figure 8.
Spectrum signals after decomposition of acceleration wavelet packets of sensors No. 1.
Table 1 presents the maximum component energy and the corresponding percentage of the maximum component energy at the third decomposition level for the acceleration signals from sensors No. 1–6. The results show that sensors No. 1 and No. 2 have significantly higher maximum component energies of 5.6853 × 10⁵ and 4.5037 × 10⁵, respectively, compared to the other sensors. Furthermore, the percentages of maximum component energy for sensors No. 1 and No. 2 are 64.88% and 64.48%, respectively. These two sensors are located close to the leak site, indicating that this index can accurately reflect fault positions.

Table 1.
Maximum component energy of acceleration signal of sensors 1–6 at the third decomposition level.
4.2. Sensors Arranged Along the Circular Direction
The sensors are arranged circumferentially near the plane of the leak point of the wind tunnel valve, as shown in Figure 9. The leak location is also indicated in Figure 9, highlighting the positioning of the sensors close to the leak plane.
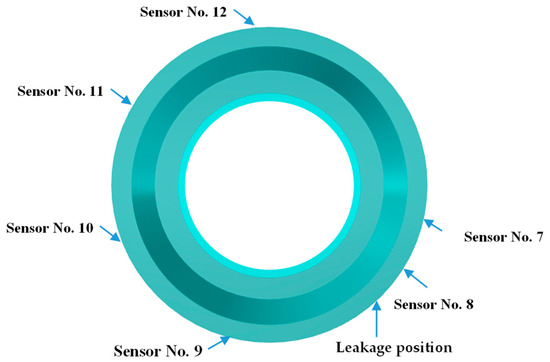
Figure 9.
The layout of the sensors along the circular direction.
Channels No. 1–6 of the acquisition instrument correspond to Sensors No. 7–12, and the sampling frequency remains at 50 kHz. The collected data are saved under the file name “DSA-20220118-1832-14”. Figure 10 shows the time-domain acceleration signals collected by Sensors No. 7–12.
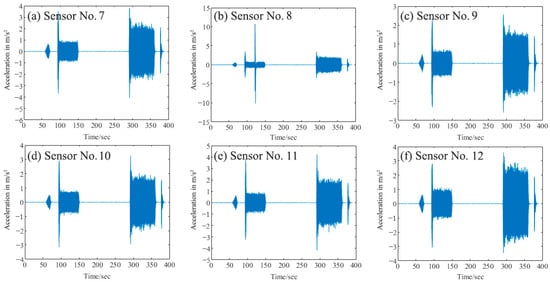
Figure 10.
Acceleration history signals of sensors No. 7–12.
Figure 11 shows the wavelet packet component energy tree of the acceleration signal from sensors 7–12. It can be observed that at the third decomposition level, the energy component distribution of the acceleration signal collected by sensor No. 2 near the leakage site is significantly different from that of other sensors, after wavelet packet energy decomposition. Figure 12 displays the spectrum diagram of the eight nodes, decomposed according to Figure 7, at the third decomposition level.
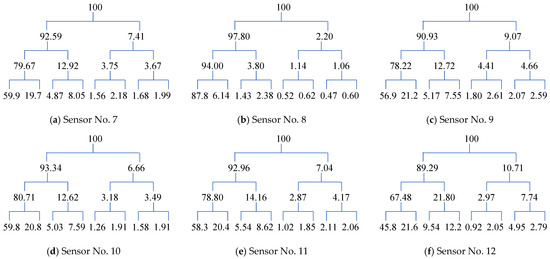
Figure 11.
Energy diagram of the third packet component of the acceleration signal of sensors No. 7–12.
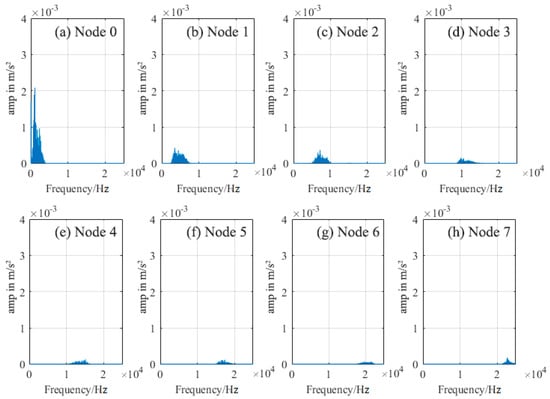
Figure 12.
Spectrum signals after decomposition of acceleration wavelet packets of sensor No. 2.
The results in Table 2 present the maximum component energy and the corresponding percentage of maximum component energy for the acceleration signals of Sensors No. 7–12 at the third decomposition level. It is evident that the maximum component energy and the corresponding percentage for the acceleration signal of Sensor No. 8 are 2.7616 × 10⁶ and 87.85%, respectively, which are considerably higher than those of the other sensors. This observation indicates the presence of a leakage fault near Sensor No. 8, which is consistent with the actual condition.

Table 2.
Maximum component energy of acceleration signals of sensors No. 7–12 at the third decomposition level.
It is evident that, regardless of whether the sensors are arranged along the circular or longitudinal direction, the maximum component energy or its corresponding percentage index obtained from the proposed wavelet packet analysis method can be used to detect valve leakage faults without requiring machine shutdown or causing damage to the valve structure.
5. Numerical Simulations of Pressure Regulating Valve Leakage Failure
To further validate the accuracy of the wavelet packet analysis method in identifying leakage faults, finite element models (ANSYS 2022 R2) of both the leaking and intact pneumatic pressure regulating valve chambers were established, as shown in Figure 13. The finite element method is an approximate computational approach that discretizes a continuum into finite elements and simulates engineering physical fields by numerically solving partial differential equations. In fluid–structure coupling simulations, the finite element method is commonly used to analyze the deformation, displacement, and stress distribution of solid structures. Due to the complexity of the wind tunnel equipment, hexahedral meshing is difficult to implement; therefore, tetrahedral mesh elements were used. The pneumatic pressure regulating valve air chamber is secured by two support plates, with the lower ends of the plates firmly fixed to the ground. The air chamber is connected to the plates via flanges, with the leakage located between two flanges, having a width of approximately 60 mm and a height of approximately 120 mm. The airflow is assumed to enter the inlet part of the air chamber at a 45° angle in the circular direction and impinge on one side of the pneumatic pressure regulating valve air chamber at a speed of 30 m/s. After passing through the chamber, the airflow exits via the opposite side and the leakage region. To improve computational efficiency, the sampling frequency was set to 10 kHz, and the total simulation time was 0.05 s. The elastic modulus, Poisson’s ratio, and density of the material are the same as those in Section 4. The number of nodes in the numerical simulation corresponds to the number of experimental sensors: nodes 1–6 correspond to sensors 1–6 arranged along the valve length, while nodes 7–12 correspond to sensors 7–12 arranged along the circular direction.

Figure 13.
Finite element model of air chamber of pneumatic pressure regulating valve. (a) Finite element model of leakage of pneumatic pressure regulating valve. (b) Intact finite element model of pneumatic pressure regulating valve.
Figure 14 shows the acceleration time history curves of nodes 1–12 of the pressure regulating valve, obtained through fluid–structure coupling analysis to evaluate the structural responses of the valve under both intact and leakage-failure conditions.
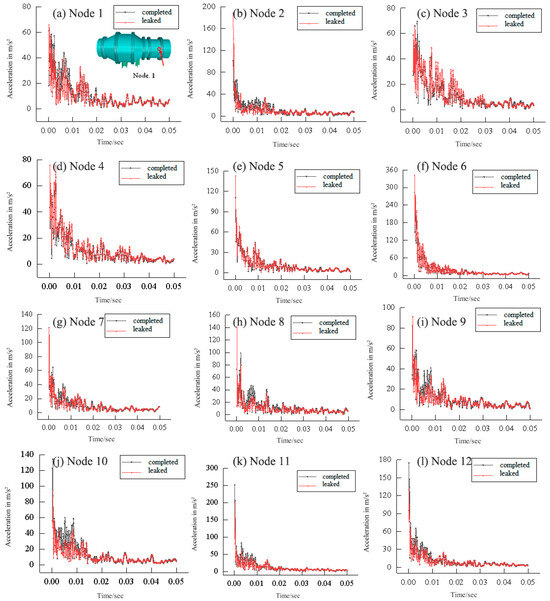
Figure 14.
Time domain signal of acceleration of nodes 1–12.
In Figure 14, the acceleration time history curves of the pressure regulating valve under leakage and intact conditions are represented by the red and black curves, respectively. However, due to the high sampling frequency, the curves alone do not readily reveal information about the leakage fault or differences in signal characteristics. Therefore, further data processing is required.
Figure 15 and Figure 16 show the wavelet packet component energy trees of the acceleration signals of nodes 1–6 along the valve’s length direction, both with and without leakage. The maximum component energy values of nodes 1–6 are similar under leakage conditions, which may be attributed to simplifications in the modeling process. In the absence of leakage, the maximum component energy of node 2 is lower than that of the other nodes, possibly due to its different signal characteristics, as it is located at a different height compared with the other nodes. Nevertheless, being close to the leakage site, the energy at this location is partially compensated in the presence of leakage.


Figure 15.
Component energy tree of wavelet packet of acceleration signal of nodes 1–6 along the length direction in the leakage state.
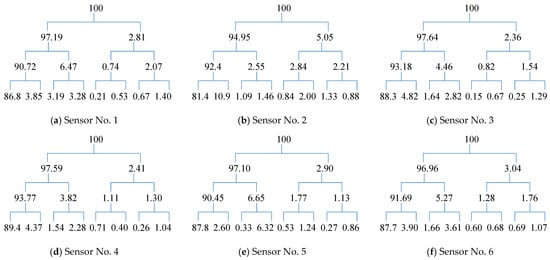
Figure 16.
Component energy tree of wavelet packet of acceleration signal of nodes 1–6 along the length direction in the intact state.
Table 3 presents the percentage of maximum component energy and the variation rate of maximum component energy for nodes 1–6 under two conditions: with and without leakage. The variation rate of maximum component energy, defined as the difference between the percentage of maximum component energy under leakage and that without leakage, divided by the percentage of maximum component energy without leakage, serves as a more sensitive indicator of faults than the percentage of maximum component energy alone. As shown in Table 3, at the third decomposition level, the acceleration signal of node 2 exhibits a variation rate of 6.93%, which is significantly higher than that of the other nodes and corresponds to the actual leakage site. It should be noted that the diagnostic interpretation is based on comparative analysis of variation rates among nodes rather than the magnitude of individual values, ensuring reliable identification of the leakage location.

Table 3.
Maximum component energy of acceleration signals of nodes No. 1–6 at the third decomposition level.
Figure 17 and Figure 18 illustrate the wavelet packet component energy tree of acceleration signals for nodes 7–12 along the valve’s circular direction, under conditions with and without leakage, respectively. It is evident that the data characteristics differ somewhat from those observed in the actual monitoring data. Consequently, neither the maximum component energy nor its percentage can directly indicate the presence of a leakage fault.
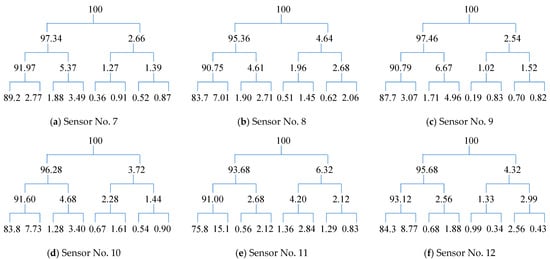
Figure 17.
Component energy tree of wavelet packet of acceleration signal of nodes 7–12 along the circular direction in the leakage state.
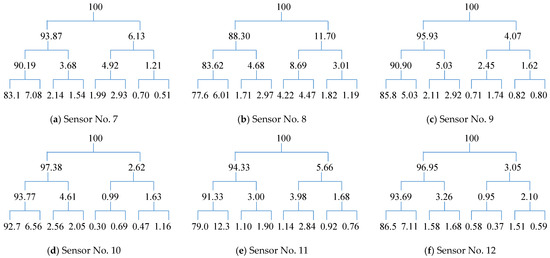
Figure 18.
Component energy tree of wavelet packet of acceleration signal of nodes 7–12 along the circular direction in the intact state.
The results presented in Table 4 show the percentage of maximum component energy and the variation rate of maximum component energy for nodes 1–12 under two conditions: with and without leakage. The variation rate of maximum component energy, as defined above, is more sensitive to faults compared with the percentage of maximum component energy. At the third decomposition level, the acceleration signals of nodes 7 and 8 exhibit significantly higher variation rates of maximum component energy, at 7.33% and 7.9%, respectively, compared to the other nodes, consistent with the actual leakage site.

Table 4.
Maximum component energy of acceleration signals of nodes No. 7–12 at the third decomposition level.
6. Leakage Fault Diagnosis Based on Vision Transformer
In this section, a deep learning-based framework is developed for the efficient diagnosis of valve leakage faults in wind tunnel systems. The core idea is to leverage the ViT architecture to directly infer the leakage location using only the time-domain acceleration signals collected from the valve. By transforming raw vibration responses into feature representations suitable for the ViT, the proposed approach enables accurate localization of leakage points while avoiding reliance on complex handcrafted features or additional sensing modalities.
6.1. Vision Transformer
The ViT model (Figure 19) is employed in this study due to its capability to capture global dependencies across all sensor locations, which is essential for accurately identifying leakage faults involving interactions among multiple measurement points. Unlike convolutional neural networks [44], which rely on local receptive fields and may overlook long-range spatial–temporal correlations, ViT divides the input into patch sequences and employs a multi-head self-attention mechanism to effectively model both local and global patterns. This property renders ViT particularly suitable for processing vibration signals from the wind tunnel valve system, where comprehensive feature representation is critical for precise leakage localization.
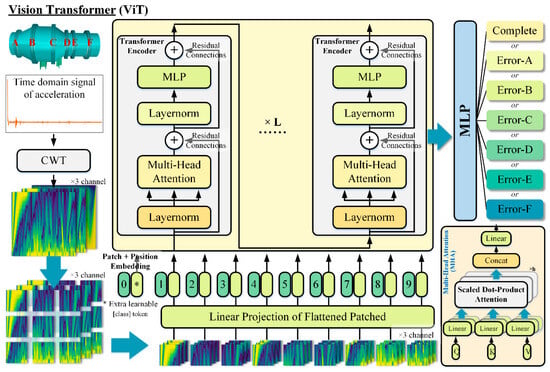
Figure 19.
Model overview.
The core component of the ViT architecture lies in the Transformer encoder. Within the encoder, the multi-head self-attention (MSA) mechanism extracts deep feature representations from the embedded patch sequences, which subsequently facilitates effective decision-making in the Multi-Layer Perceptron (MLP) head. In the conventional self-attention mechanism, the output is computed as the weighted sum of the value vectors v for each element in the sequence z ∈ RN×D. The attention weights Aij are determined by the similarity between the key vector kj and the query vector qi. This process is mathematically formulated in Equations (13)–(16).
6.2. Input Representation and Workflow
Raw acceleration signals are first normalized and reshaped into 2D patch sequences suitable for ViT input. Each patch represents a segment of the temporal signal from a specific sensor. The ViT processes these patches to extract both local and global features across sensors and time. The workflow comprises the following steps:
- Signal preprocessing and normalization.
- Patch creation and embedding.
- Feeding embedded sequences into the ViT encoder with multi-head self-attention.
- Classification of patches to predict leakage locations.
6.3. Database Construction
A well-labeled database is a prerequisite for the effective training of the ViT model [45,46]. To this end, the finite element model established in Section 5 was adopted as the baseline, with the intact valve configuration serving as the reference case. Leakage points were then introduced sequentially at six different valve locations, as illustrated in Figure 20. For each valve, four measurement points were assigned, resulting in time-domain acceleration signals collected under seven operating conditions (one intact and six leakage scenarios). This procedure produced a wind tunnel valve leakage database comprising 168 datasets. The diversity and representativeness of this database are demonstrated in Figure 21, which indicates that the generated time-domain acceleration signals comprehensively capture the characteristics of leakage-induced faults. Therefore, the constructed database provides a reliable foundation for the efficient diagnosis of leakage faults in wind tunnel valves. Data augmentation techniques primarily included color jittering by varying brightness, contrast, saturation, and hue. The final dataset contained 700 labeled samples across seven categories. To ensure reliable evaluation and mitigate overfitting, a 70/30 split was applied for training and testing.

Figure 20.
A schematic of the finite element model.
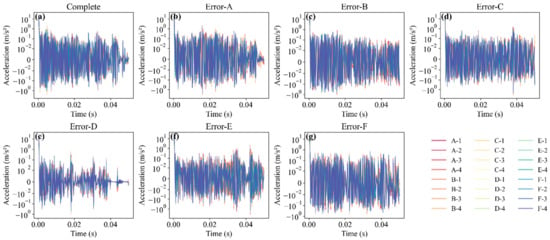
Figure 21.
Acceleration curves of each specimen: (a) intact structure; (b) leakage at point A; (c) leakage at point B; (d) leakage at point C; (e) leakage at point D; (f) leakage at point E; (g) leakage at point F.
6.4. Training Strategy
To fully exploit the potential of the proposed model and improve training efficiency, a transfer learning strategy was employed. To enhance the diversity of the dataset and thereby improve model robustness, data augmentation was performed after applying the continuous wavelet transform (CWT) [38,39].
During the supervised learning phase of ViT, three additional baseline models—Swin Transformer (SwinT) [47], ResNet [44], and GoogLeNet [48]—were trained for performance comparison. For fine-tuning, all candidate models were optimized using stochastic gradient descent (SGD). The batch size b was set to 16, and the learning rate was scaled as 0.1 × b/256. The momentum and weight decay were set to 0.9 and 0.0005, respectively. The training epoch is 100. Moreover, cosine learning rate decay was employed to gradually decrease the learning rate from its initial value, while a warm-up strategy was introduced following the recommendation of Li et al. [49]. The deep learning models were implemented in Python 3.10 with PyTorch 2.0.1 and standard libraries (NumPy, Pandas, Matplotlib), and trained on an NVIDIA RTX 3060 GPU (NVIDIA Corporation, Santa Clara, CA, USA) with 12 GB memory.
6.5. Model Accuracy
The performance of the four models was evaluated using multiple metrics [50,51], as shown in Figure 22. Both ViT and SwinT achieved superior accuracy, reaching 100%, whereas ResNet exhibited a slightly lower accuracy of 98%. In contrast, GoogLeNet performed poorly, with accuracy dropping to 60%. Notably, ViT demonstrated the highest training efficiency, achieving excellent performance within fewer epochs compared to the other models. Collectively, these results confirm that ViT is the most effective deep learning model for leakage fault diagnosis of wind tunnel valves. Although ViT achieved 100% classification accuracy on the constructed dataset, this outcome reflects the controlled, simulation-based environment. In real-world applications, factors such as sensor noise, structural uncertainties, and varying operating conditions may affect accuracy. Therefore, further experimental validation is required prior to large-scale deployment.

Figure 22.
Modeling training: (a) test loss; (b) test accuracy; (c) test f1-score.
Confusion matrices, precision–recall (PR) curves, and receiver operating characteristic (ROC) curves were employed to evaluate the classification performance of the models (Figure 23, Figure 24 and Figure 25). Figure 26 further compares prediction accuracy across different categories. As shown in Figure 23, both ViT and SwinT exhibit outstanding classification performance, whereas GoogLeNet demonstrates considerably weaker predictive capability, particularly for the “Complete” and “Error-A” categories. The PR and ROC curves in Figure 24 and Figure 25 corroborate this observation, consistently highlighting the superior discriminative ability of ViT and SwinT. Moreover, Figure 26 shows that ViT and SwinT maintain consistently high accuracy across all seven categories, while GoogLeNet performs poorly in most cases—achieving 93% accuracy only in the “Error-D” category, with accuracy dropping below 70% for the remaining classes.
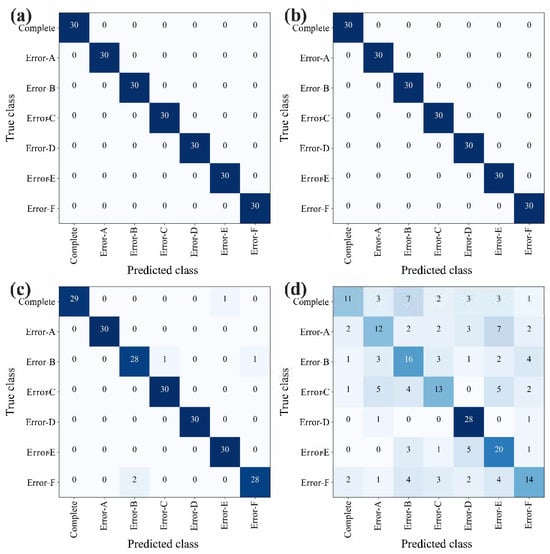
Figure 23.
Confusion matrix: (a) ViT; (b) SwinT; (c) ResNet; (d) GoogLeNet.
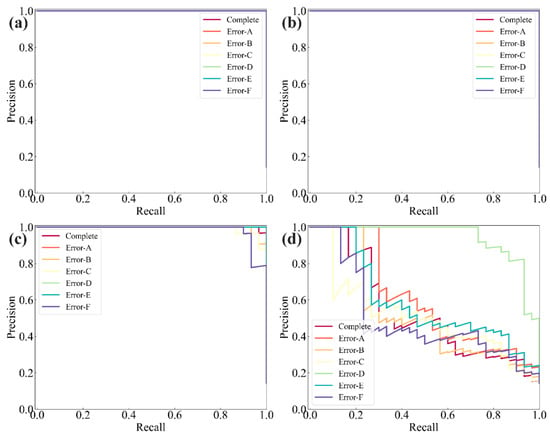
Figure 24.
PR curves: (a) ViT; (b) SwinT; (c) ResNet; (d) GoogLeNet.
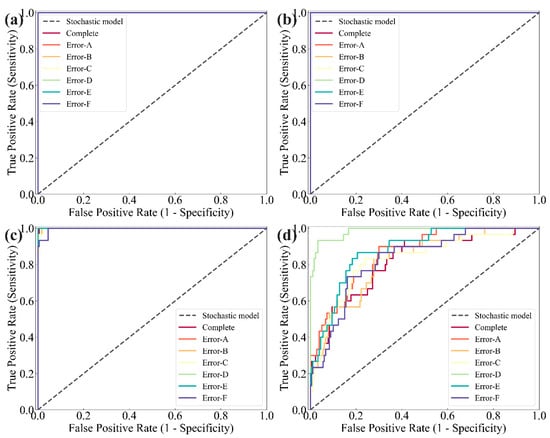
Figure 25.
ROC curves: (a) ViT; (b) SwinT; (c) ResNet; (d) GoogLeNet.
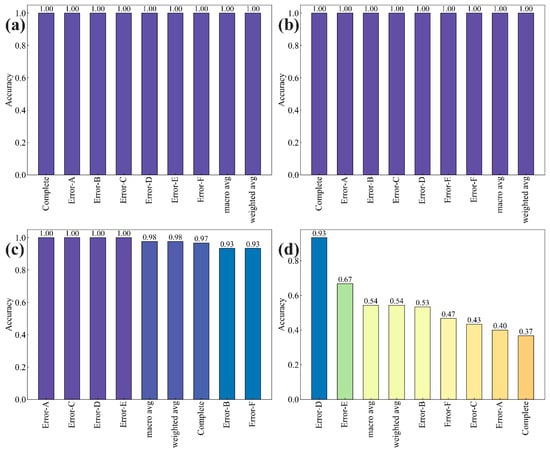
Figure 26.
Accuracy for each category: (a) ViT; (b) SwinT; (c) ResNet; (d) GoogLeNet.
Collectively, these results confirm that ViT is the most effective deep learning model for leakage fault diagnosis of wind tunnel valves. Compared with CNN-based models such as ResNet and GoogLeNet, ViT not only achieves higher classification accuracy but also captures long-range dependencies and global spatial–temporal correlations among sensor signals more effectively. Although SwinT also performs well, ViT offers slightly higher training efficiency and a simpler architecture, making it particularly suitable for rapid and reliable fault localization in this application.
6.6. Prediction Reliability
To further assess the prediction reliability of the four models, representative samples from the test set were randomly selected for evaluation. Four combinations of leakage failure modes and measurement points were considered, as illustrated in Figure 27. Specifically, Figure 27a corresponds to the acceleration signal of measurement point 2 at section A under the “Complete” condition; Figure 27b shows measurement point 1 at section A under the “Error-B” condition; Figure 27c represents measurement point 1 at section B under the “Error-D” condition; and Figure 27d corresponds to measurement point 4 at section D under the “Error-F” condition.
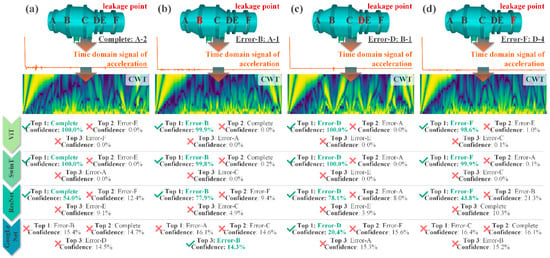
Figure 27.
Leakage fault diagnosis and confidence level: (a) Leakage at point A; (b) Leakage at point B; (c) Leakage at point D; (d) Leakage at point F.
The four trained models were applied to each case to predict the top-three categories along with their associated confidence scores, thereby enabling failure diagnosis. The comparison reveals that GoogLeNet exhibits very low predictive reliability, whereas both ViT and SwinT achieve perfect reliability with 100% accurate predictions. These results indicate that the proposed ViT model provides rapid and reliable failure diagnosis for wind tunnel valve leakage scenarios.
7. Conclusions
This paper investigated the vibration monitoring signals of an annular gap type pressure-regulating valve in a wind tunnel through both experimental monitoring and numerical simulation. Based on wavelet packet decomposition, the maximum component energy and its variation rate were proposed as sensitive indicators for leakage fault detection. In addition, a ViT-based deep learning model was developed to achieve rapid and automated diagnosis from time-domain acceleration signals. The following conclusions were drawn:
- A comprehensive vibration monitoring scheme for an annular gap type pressure-regulating valve in a 1.2 m transonic wind tunnel was established. Acceleration sensors were deployed at multiple locations to capture non-stationary signals, and wavelet packet decomposition effectively separated low- and high-frequency features, providing a reliable basis for leakage fault diagnosis.
- The maximum component energy index, derived from wavelet packet analysis, accurately identified leakage locations. For sensors along the valve’s longitudinal direction, the maximum energy fractions of sensors No. 1 and No. 2 reached 64.88% and 64.48%, respectively, while among circularly arranged sensors, sensor No. 2 recorded 87.85%, all consistent with the actual leakage points.
- The variation rate of maximum component energy served as a highly sensitive indicator in numerical simulations. Circular nodes 2, 7, and 8 exhibited significantly higher variation rates of 6.93%, 7.33%, and 7.9%, respectively, aligning well with the actual leakage positions and demonstrating the robustness of this metric for fault detection.
- The ViT model, trained on a dedicated database covering multiple leakage scenarios and sensor arrangements, achieved rapid and fully accurate classification of valve leakage conditions (up to 100% in the current case). Compared with SwinT, ResNet, and GoogLeNet, ViT demonstrated superior training efficiency, prediction accuracy, and reliability, providing a robust, automated, and practical approach for leakage fault diagnosis in wind tunnel valves, ultimately enhancing operational monitoring, maintenance, and safety.
Although the proposed ViT-based framework demonstrates high accuracy and efficiency in diagnosing leakage faults under the simulated conditions, several limitations should be noted. First, the current study is primarily based on simulation data and a controlled experimental setup; real-world conditions such as sensor noise, structural uncertainties, and varying operating environments may affect model performance. Second, the dataset covers a limited range of leakage scenarios and sensor configurations, which may constrain generalization to other valve systems or wind tunnel setups. Third, the model currently relies solely on acceleration signals; incorporating additional sensing modalities (e.g., pressure or strain measurements) could further improve robustness.
Future work will focus on addressing these limitations by:
- (1)
- Expanding the database with real experimental measurements under diverse operating conditions.
- (2)
- Evaluating the framework on different valve types and more complex wind tunnel configurations.
- (3)
- Investigating multimodal sensor integration and adaptive learning strategies to enhance practical applicability and robustness.
Author Contributions
Conceptualization, L.G. and Y.W.; methodology, L.G., F.Y. and R.Z. (Ruoxi Zhong); software, R.Z. (Ruoxi Zhong), W.Z. and R.Z. (Run Zhou); formal analysis, F.Y.; resources, Y.W.; data curation, R.Z. (Run Zhou); writing—original draft preparation, F.Y.; writing—review and editing, L.G. and Y.W.; supervision, W.Z.; funding acquisition, L.G. All authors have read and agreed to the published version of the manuscript.
Funding
This research was funded by the Fundamental Research Funds for the Central Universities, grant number 2242022k30062, 2242024K30007 and Jiangsu Provincial Department of Science and Technology, grant number BM2023013.
Data Availability Statement
The original contributions presented in this study are included in the article. Further inquiries can be directed to the corresponding author.
Conflicts of Interest
The authors declare no conflicts of interest.
References
- Li, Y.; Zheng, S.; Shang, Z.; Chen, J.; Wang, D. Experimental study on the seismic behavior of ECE corroded reinforced concrete short pier columns. Constr. Build. Mater. 2022, 348, 128681. [Google Scholar] [CrossRef]
- Li, Y.; Sun, Z.; Li, Y.; Zhu, W.; Zheng, H.; Zheng, S. Exploring the shear performance and predictive shear capacity of corroded RC columns utilizing the modified compression-field theory: An investigative study. Eng. Struct. 2024, 302, 117390. [Google Scholar] [CrossRef]
- Li, Y.; Sun, Z.; Li, Y.; Dong, J.; He, W. Time-dependent combined index seismic resilience assessment of shear-critical RC bridge piers with height-varying corrosion. Eng. Struct. 2024, 308, 117957. [Google Scholar] [CrossRef]
- Zhang, J.P.; Yan, H.C.; Feng, G.W.; Wang, X.L. Research on Active Maintenance Expert System for Regulating Valve Failures. Process Autom. Instrum. 2020, 41, 22–25. [Google Scholar]
- Zheng, K.Y.; Chen, Z. Investigation of Qualification Test of Class 1E Electric Actuator for Valves in Generation III Passive Nuclear Power Plants. Nucl. Saf. 2018, 17, 52–57. [Google Scholar]
- Sun, Z.; Wang, X.; Han, T.; Wang, L.; Zhu, Z.; Huang, H.; Ding, J.; Wu, Z. Pipeline deformation prediction based on multi-source monitoring information and novel data-driven model. Eng. Struct. 2025, 337, 120461. [Google Scholar] [CrossRef]
- Sun, Z.; Wang, X.; Han, T.; Huang, H.; Wang, L.; Wu, Z. Pipeline deformation monitoring based on long-gauge FBG sensing system: Missing data recovery and deformation calculation. J. Civ. Struct. Health Monit. 2025, 15, 2433–2453. [Google Scholar] [CrossRef]
- Sun, Z.; Wang, X.; Niu, D.; Luo, D.; Han, T.; Li, Y.; Huang, H.; Wu, Z. Electrical resistivity prediction model for basalt fibre reinforced concrete: Hybrid machine learning model and experimental validation. Mater. Struct. 2025, 58, 89. [Google Scholar] [CrossRef]
- Capaci, R.B.D.; Scali, C. Review and Comparison of Techniques of Analysis of Valve Stiction: From Modeling to Smart Diagnosis. Chem. Eng. Res. Des. 2018, 130, 230–265. [Google Scholar] [CrossRef]
- Ali, S.M.; Hui, K.H.; Hee, L.M.; Leong, M.S.; Al-Obaidi, M.A.; Ali, Y.H.; Abdelrhman, A.M. A Comparative Experimental Study on the Use of Machine Learning Approaches for Automated Valve Monitoring Based on Acoustic Emission Parameters. In Proceedings of the International Conference on Mechanical, Manufacturing and Process Plant Engineering, Penang, Malaysia, 22–23 November 2017. [Google Scholar]
- Miskin, J.; Lindner, B.; Auret, L.; Dorfling, C.; Bradshaw, S. Fault Detection for Simulated Valve Faults in A High Pressure Leaching Process. IFAC-Pap. Line 2016, 49, 394–399. [Google Scholar] [CrossRef]
- Marcos, A.; Peñín, L.F.; Malikov, D.; Reichstadt, S.; Le Gonidec, S. Fault Detection and Isolation for A Rocket Engine Valve. IFAC Proc. Vol. 2013, 46, 101–106. [Google Scholar] [CrossRef]
- Pichler, K.; Lughofer, E.; Pichler, M.; Buchegger, T.; Klement, E.P.; Huschenbett, M. Fault Detection in Reciprocating Compressor Valves Under Varying Load Conditions. Mech. Syst. Signal Process. 2016, 70–71, 104–119. [Google Scholar] [CrossRef]
- Goncalves, L.F.; Schneider, E.L.; Henriques, R.V.B.; Lubaszewski, M.; Bosa, J.L.; Engel, P.M. Fault Prediction in Electrical Valves Using Temporal Kohonen Maps. In Proceedings of the 11th Latin American Test Workshop (LATW), Punta del Este, Uruguay, 28–31 March 2010. [Google Scholar]
- He, H.; Cheng, M. Method for Valve Fault Diagnosis Based on Optimized SVM-DT. Comput. Eng. Des. 2016, 37, 1932–1936. (In Chinese) [Google Scholar]
- Zhang, Z. Fault Detection and Stiction Compensation for Pneumatic Control Valve. Master’s Thesis, East China University of Science and Technology, Shanghai, China, 2015. (In Chinese). [Google Scholar]
- Zhang, H. Study on Fault Diagnosis of Multistage Reciprocating Compressor Valve Based on LM-BP Neural Network. Master’s Thesis, Donghua University, Shanghai, China, 2015. (In Chinese). [Google Scholar]
- Qi, H. Fault Diagnosis of the Nuclear Power Plant Valve Based on Neural Network Technology. Master’s Thesis, Harbin Engineering University, Harbin, China, 2012. (In Chinese). [Google Scholar]
- Sihui, C. Fault Detection and Diagnosis Method Research of Valves. Comput. Simul. 2012, 29, 216–219. (In Chinese) [Google Scholar]
- Luo, T. A Fault Detection and Diagnosis Method Research for Control Valves Based on Support Vector Machine in Air Conditioning Water System. Master’s Thesis, Chongqing University, Chongqing, China, 2016. (In Chinese). [Google Scholar]
- Guofeng, Y.; Shouyin, H. Pattern Recognition Technology in Fault Diagnosis of Electrical Safety Valve Level. Nucl. Power Eng. 2010, 31, 79–82. [Google Scholar]
- Wang, K.; Shen, T.; Wei, J.; Liu, J.; Hu, W. An intelligent framework for deriving formulas of aerodynamic forces between high-rise buildings under interference effects using symbolic regression algorithms. J. Build. Eng. 2025, 99, 111614. [Google Scholar] [CrossRef]
- Liu, J.; Zou, Z.; Gao, K.; Yang, J.; He, S.; Wu, Z. A novel digital unit cell library generation framework for topology optimization of multi-morphology lattice structures. Compos. Struct. 2025, 354, 118824. [Google Scholar] [CrossRef]
- Li, Y.; Sun, Z.; Mangalathu, S.; Li, Y.; He, W.; Xue, X. Machine learning-based full-life-cycle seismic response assessment for in-service bridge piers: Comprehensive analysis of interpretability and seismic fragility. Structures 2025, 80, 110050. [Google Scholar] [CrossRef]
- Daubechies, I. Ten Lectures on Wavelets; CBMS-NSF Regional Conference Series in Applied Mathematics; Society for Industrial and Applied Mathematics: Philadelphia, PA, USA, 1992. [Google Scholar]
- Kitada, Y. Identification of nonlinear structural dynamic systems using wavelets. J. Eng. Mech. Div. 1998, 124, 1059–1066. [Google Scholar] [CrossRef]
- Wang, Q.; Deng, X. Damage detection with spatial wavelets. Int. J. Solids Struct. 1999, 36, 3443–3468. [Google Scholar] [CrossRef]
- Pei, J.F.; Dong, X.; Huang, X.R.; Yu, Z.Y. Harmonic Wavelet Packet Analysis and LS-SVM Method of Reciprocating Pump Valve. Mach. Des. Manuf. 2015, 5, 241–245. [Google Scholar]
- Wu, P.; Ma, C. Research on Compressor Valve Fault Diagnosis Technology Based On Wavelet Packet Decomposition-KPCA-SVM. Petro-Chem. Equip. 2021, 24, 53–56. [Google Scholar]
- Zhang, J.P.; Chen, X.F. Bearing Fault Diagnosis Based on Wavelet Packet and Improved GA-BP Neural Network. Mech. Eng. 2022, 8, 17–19. [Google Scholar]
- Zhang, Y.; Wang, H.; Liu, J.; Liu, F.; Lv, X. Intelligent structural design of composite concrete-encased steel columns based on hybrid machine learning and multiobjective optimization. Struct. Concr. 2025, in press. [Google Scholar] [CrossRef]
- Zhang, Y.; Peng, J.; Wang, Z.; Xi, Z.; Liu, J.; Xu, L. Machine Learning-Assisted Sustainable Mix Design of Waste Glass Powder Concrete with Strength–Cost–CO2 Emissions Trade-Offs. Buildings 2025, 15, 2640. [Google Scholar] [CrossRef]
- Bao, X.; Xu, K.; Liu, J.; Jin, L. A physics-informed transformer model for long-sequence time-history response prediction of containment structures under mainshock-aftershock sequences. Eng. Struct. 2025, 343, 121005. [Google Scholar] [CrossRef]
- Wei, J.; Shen, T.; Wang, K.; Liu, J.; Wang, S.; Hu, W. Transfer learning framework for the wind pressure prediction of high-rise building surfaces using wind tunnel experiments and machine learning. Build. Environ. 2025, 271, 112620. [Google Scholar] [CrossRef]
- Li, Z.; Gao, K.; Wu, Z. Bio-inspired flapping wing design via a multi-objective optimization approach based on variable periodic Voronoi tessellation. Int. J. Mech. Sci. 2025, 291–292, 110160. [Google Scholar] [CrossRef]
- Li, Z.; Wu, Z. A novel multiscale design method for porous structures with tunable anisotropy: Varied-shape Voronoi tessellation. Comput. Methods Appl. Mech. Eng. 2024, 432, 117378. [Google Scholar] [CrossRef]
- Li, Z.; Chu, S.; Wu, Z. A novel bio-inspired design method for porous structures: Variable-periodic Voronoi tessellation. Mater. Des. 2024, 243, 20. [Google Scholar] [CrossRef]
- Li, Y.; Sun, Z.; Li, Y.; Yang, H.; Liu, X.; He, W. A Vision Transformer-based method for predicting seismic damage states of RC piers: Database development and efficient assessment. Reliab. Eng. Syst. Saf. 2025, 263, 111287. [Google Scholar] [CrossRef]
- Li, Y.; Guan, J.; Guo, L. Peridynamic-driven feature-enhanced Vision Transformer for predicting defects and heterogeneous materials locations: Applications of deep learning in inverse problems. Eng. Appl. Artif. Intell. 2025, 151, 110677. [Google Scholar] [CrossRef]
- Tran, V.T.; Al Thobiani, F.; Tinga, T.; Ball, A.; Niu, G. Single and combined fault diagnosis of reciprocating compressor valves using a hybrid deep belief network. Proc. Inst. Mech. Eng. Part C J. Mech. Eng. Sci. 2018, 232, 3767–3780. [Google Scholar] [CrossRef]
- Cai, Y.; Dai, X.; Xu, Z.; Hu, L.; Wen, Q.; Shi, J.; Zhong, F.; Yang, X.; Yang, J.; Zhou, H. A diesel engine valve leakage fault diagnostic method using modified VGG19 and transfer learning. Ships Offshore Struct. 2025, 1–10. [Google Scholar] [CrossRef]
- Zhang, G.; Zhang, K.; Shen, W.; Xu, G.; Lin, Y.J. Intelligent fault diagnosis of multi-way directional valves in hydraulic systems using digital twin and deep learning approaches. Mech. Syst. Signal Process. 2025, 230, 112579. [Google Scholar] [CrossRef]
- Yao, K.; Wang, Y.; Fan, S.; Fu, J.; Wan, J.; Cao, Y. Improved and accurate fault diagnostic model for gas turbine based on 2D-wavelet transform and generative adversarial network. Meas. Sci. Technol. 2023, 34, 075104. [Google Scholar] [CrossRef]
- He, K.; Zhang, X.; Ren, S.; Sun, J. Deep residual learning for image recognition. In Proceedings of the IEEE Conference on Computer Vision and Pattern Recognition, Las Vegas, NV, USA, 26 June–1 July 2016; pp. 770–778. [Google Scholar]
- Sun, Z.; Li, Y.; Yang, Y.; Su, L.; Xie, S. Splitting tensile strength of basalt fiber reinforced coral aggregate concrete: Optimized XGBoost models and experimental validation. Constr. Build. Mater. 2024, 416, 135133. [Google Scholar] [CrossRef]
- Sun, Z.; Wang, X.; Han, T.; Huang, H.; Ding, J.; Wang, L.; Wu, Z. Pipeline deformation monitoring based on long-gauge fiber-optic sensing systems: Methods, experiments, and engineering applications. Measurement 2025, 248, 116911. [Google Scholar] [CrossRef]
- Liu, Z.; Lin, Y.; Cao, Y.; Hu, H.; Wei, Y.; Zhang, Z.; Lin, S.; Guo, B. Swin transformer: Hierarchical vision transformer using shifted windows. In Proceedings of the IEEE/CVF International Conference on Computer Vision, Montreal, BC, Canada, 11–17 October 2021; pp. 10012–10022. [Google Scholar]
- Szegedy, C.; Liu, W.; Jia, Y.; Sermanet, P.; Reed, S.; Anguelov, D.; Erhan, D.; Vanhoucke, V.; Rabinovich, A. Going deeper with convolutions. In Proceedings of the IEEE Conference on Computer Vision and Pattern Recognition, Boston, MA, USA, 7–12 June 2015; pp. 1–9. [Google Scholar]
- Li, Y.; Sun, Z.; Sujith, M.; Li, Y.; Yang, H.; He, W. Seismic damage states prediction of in-service bridges using feature-enhanced Swin Transformer without reliance on damage indicators. Eng. Appl. Artif. Intell. 2025, 159, 111651. [Google Scholar] [CrossRef]
- Sun, Z.; Li, Y.; Han, T.; Su, L.; Zhu, X.; He, J.; Xie, S.; Shi, Y. Performance evaluation of hybrid fiber-reinforced concrete based on electrical resistivity: Experimental and data-driven method. Constr. Build. Mater. 2024, 446, 137992. [Google Scholar] [CrossRef]
- Tukhtaev, A.; Turimov, D.; Kim, J.; Kim, W. Feature selection and machine learning approaches for detecting sarcopenia through predictive modeling. Mathematics 2024, 13, 98. [Google Scholar] [CrossRef]
Disclaimer/Publisher’s Note: The statements, opinions and data contained in all publications are solely those of the individual author(s) and contributor(s) and not of MDPI and/or the editor(s). MDPI and/or the editor(s) disclaim responsibility for any injury to people or property resulting from any ideas, methods, instructions or products referred to in the content. |
© 2025 by the authors. Licensee MDPI, Basel, Switzerland. This article is an open access article distributed under the terms and conditions of the Creative Commons Attribution (CC BY) license (https://creativecommons.org/licenses/by/4.0/).