Multiclass Classification of Sarcopenia Severity in Korean Adults Using Machine Learning and Model Fusion Approaches
Abstract
1. Introduction
- Development of a multiclass classification model to predict sarcopenia severity levels (normal, possible, sarcopenia, and severe) rather than just a binary diagnosis, addressing a critical gap in existing machine learning studies.
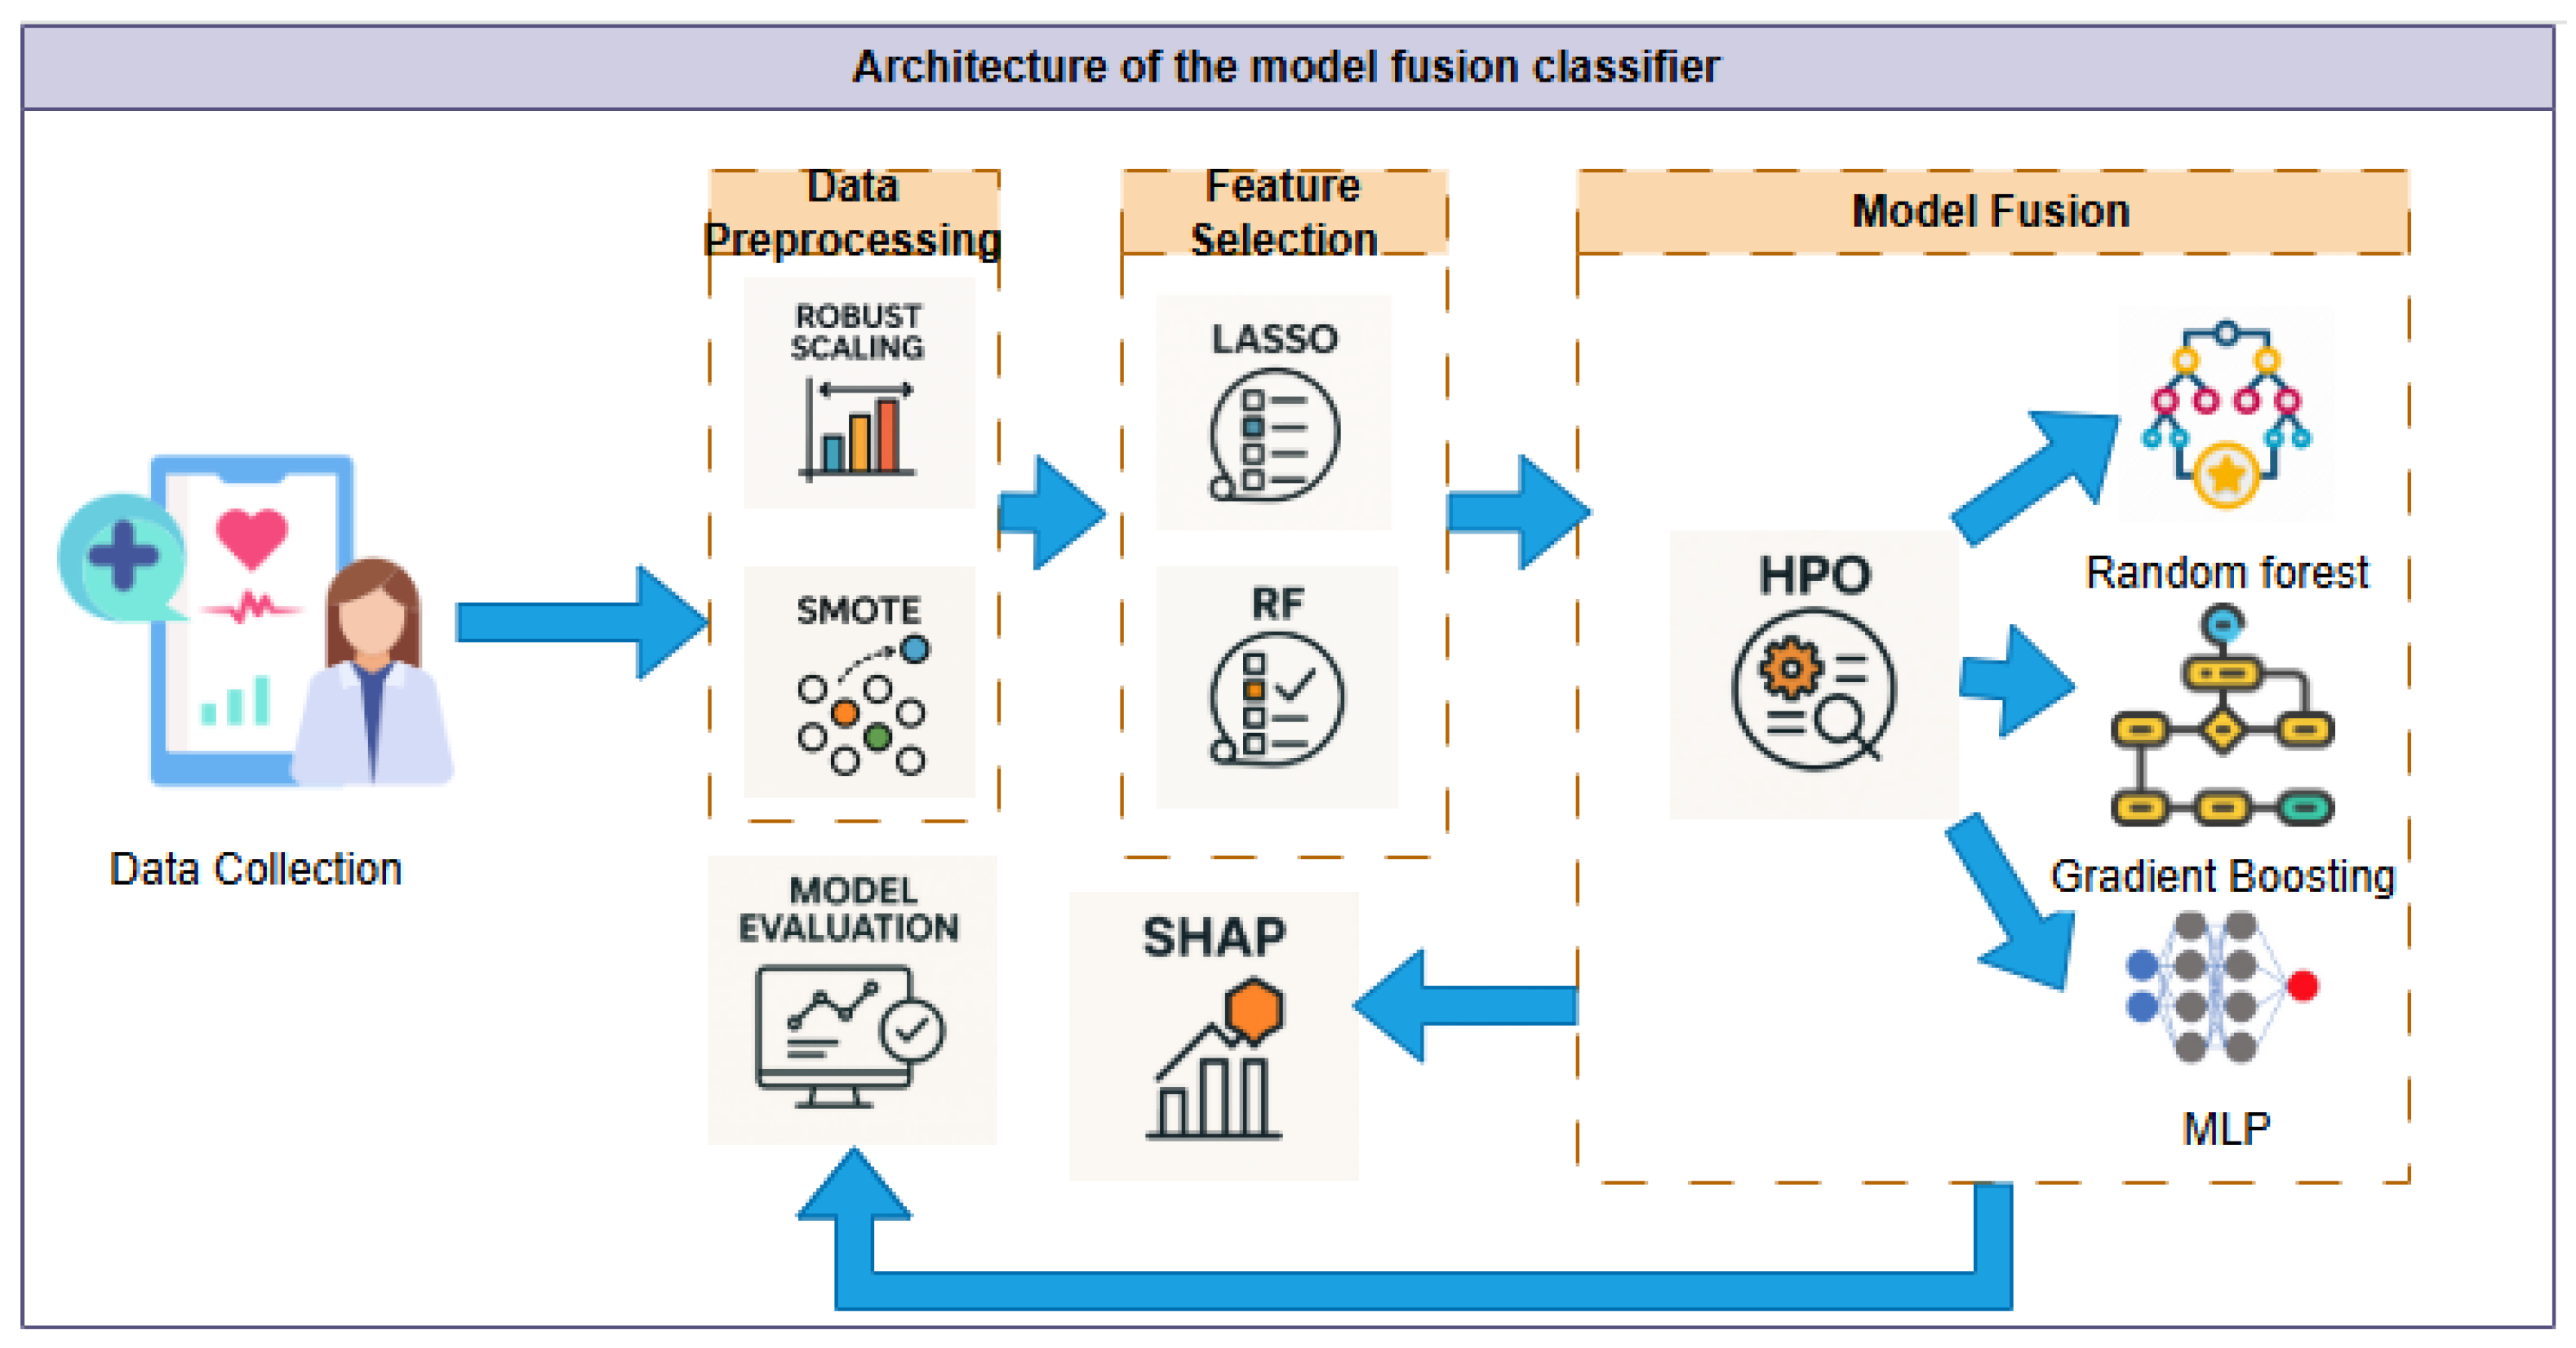
- Design and evaluation of a stacked ensemble classifier that integrates the individually optimized Random Forest, Gradient Boosting, and Multilayer Perceptron models, achieving superior performance across all key metrics.
- Application of dual-path feature selection combining the Least Absolute Shrinkage and Selection Operator(LASSO) and the Random Forest (for nonlinear importance), enhancing both prediction accuracy and model robustness.
- Integration of SHAP explainability analysis, providing transparent interpretation of feature contributions and ensuring clinical interpretability of the model’s predictions.
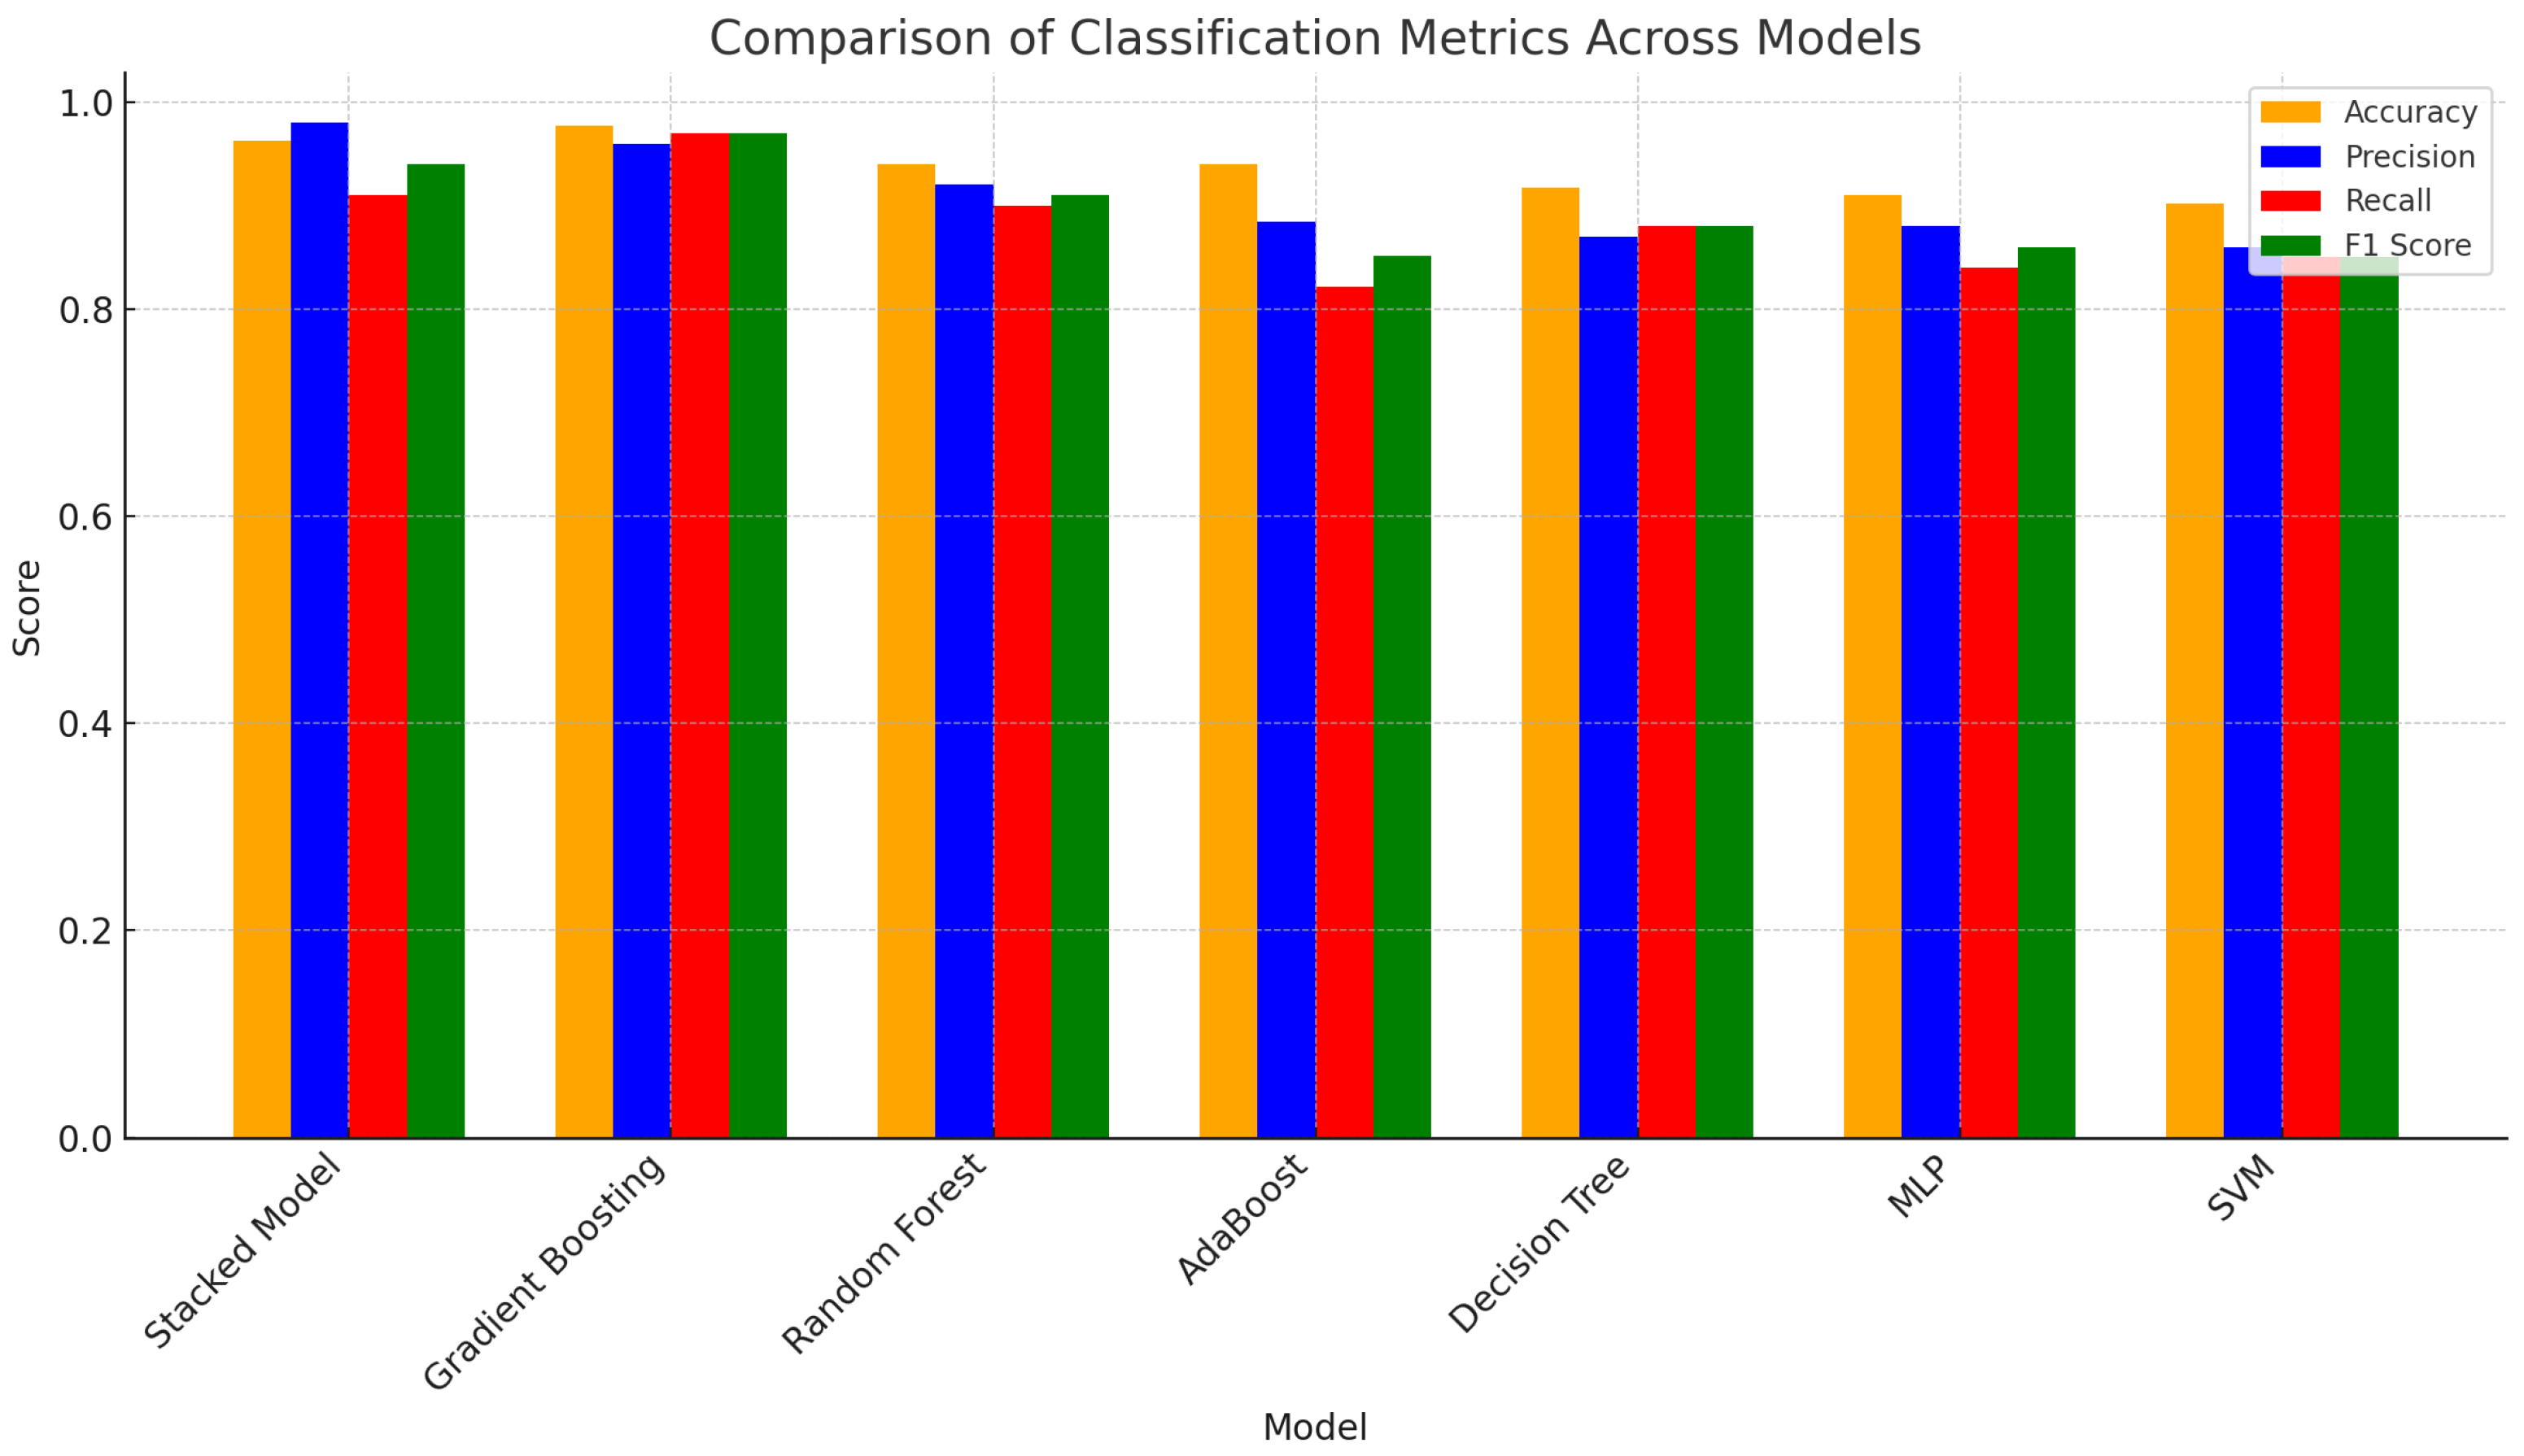
- Comprehensive performance evaluation using accuracy, the macro F1 Score, Cohen’s Kappa, AUROC, and the Brier Score across seven models, demonstrating the proposed model’s superiority in both generalization and calibration.
- Construction of a reproducible pipeline that combines data balancing, the Synthetic Minority Over-sampling Technique(SMOTE), feature engineering, hyperparameter optimization, and post hoc explanation—facilitating practical application in clinical decision support systems.
2. Related Works
2.1. Sarcopenia Assessment and Severity Prediction
2.2. Feature Selection and Interpretability in Clinical ML
2.3. Ordinal and Multiclass Classification Approaches
2.4. Ensemble and Fusion Learning for Robust Prediction
2.5. Data Balancing in Imbalanced Medical Data
2.6. Emerging Modalities and Future Directions
2.7. Advancing Healthcare Diagnostics with Interpretable Ensemble Deep Learning Models
2.8. Description of Interpretability and Evaluation Metrics
3. Materials and Methods
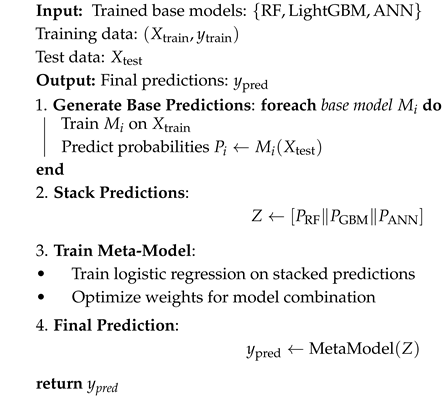
| Algorithm 1: Model fusion algorithm |
 |
3.1. Study Design and Data Description
3.2. Data Preprocessing
3.3. Feature Engineering
3.4. Model Development
- Data was partitioned into training and testing subsets, which were stratified to preserve class distributions.
- SMOTE was employed, withwhere is randomly chosen from k-nearest neighbors and .
- Robust scaling was applied as described earlier.
- Hyperparameter optimization for each model was meticulously conducted using the GridSearchCV and RandomizedSearchCV methods.
- Stratified K-Fold cross-validation was applied, withwhere denotes the model trained excluding fold k and is the validation fold.
- Predictions from base learners were combined using a logistic regression meta-learner, where
3.5. Model Interpretability
3.6. Validation and Performance Metrics
Precision, Recall, and F1 Scores
- Precision (also called the positive predictive value) measures the proportion of correctly predicted positive instances among all instances predicted as positive, withwhere is the number of true positives and is the number of false positives.
- Recall (also known as sensitivity or the true positive rate) measures the proportion of correctly predicted positive instances out of all actual positive instances, withwhere is the number of false negatives.
- The F1 Score is the harmonic mean of Precision and Recall, providing a balance between the two:The F1 Score is particularly useful when the dataset is imbalanced, as it considers both false positives and false negatives.
4. Results
4.1. Feature Selection
4.2. Binary Classification
4.3. Multiclass Classification
4.4. Overfitting
4.5. Model Interpretability
5. Discussion
6. Conclusions
Author Contributions
Funding
Data Availability Statement
Conflicts of Interest
Appendix A
| ID | Feature | Description |
|---|---|---|
| 1 | Sarcopenia | Sarcopenia status (0 = Normal, 1 = Possible, 2 = Sarcopenia, 3 = Severe) |
| 2 | Place | Location where data was collected |
| 3 | sex | Gender of the subject |
| 4 | Age | Age of the subject (years) |
| 5 | height_cm | Height of the subject (cm) |
| 6 | weight_kg | Weight of the subject (kg) |
| 7 | SMM_kg | Skeletal Muscle Mass (kg) |
| 8 | BFM_kg | Body Fat Mass (kg) |
| 9 | BMI_kgm2 | Body Mass Index (kg/m2) |
| 10 | Percent_BF | Body fat percentage (%) |
| 11 | BMR_kcal | Basal Metabolic Rate (kcal) |
| 12 | SBP_mmHg | Systolic Blood Pressure (mmHg) |
| 13 | DBP_mmHg | Diastolic Blood Pressure (mmHg) |
| 14 | BP_Stage | Blood Pressure classification stage |
| 15 | Pulse | Pulse rate (beats per minute) |
| 16 | CC_cm | Calf circumference (cm) |
| 17 | Dominant | Dominant side of the body (hand/leg) |
| 18 | ASM | Appendicular Skeletal Muscle mass (kg) |
| 19 | HG_R_1 | Hand grip strength right (first trial) (kg) |
| 20 | HG_L_1 | Hand grip strength left (first trial) (kg) |
| 21 | HG_R_2 | Hand grip strength right (second trial) (kg) |
| 22 | HG_L_2 | Hand grip strength left (second trial) (kg) |
| 23 | HG_R_M | Maximum hand grip strength right (kg) |
| 24 | HG_L_M | Maximum hand grip strength left (kg) |
| 25 | D_HG | Dominant hand grip strength (kg) |
| 26 | ND_HG | Non-dominant hand grip strength (kg) |
| 27 | Plartar_R_1 | Plantar flexion strength right foot (kg) |
| 28 | Plartar_L_1 | Plantar flexion strength left foot (kg) |
| 29 | Dorsal_R_1 | Dorsal flexion strength right foot (kg) |
| 30 | Dorsal_L_1 | Dorsal flexion strength left foot (kg) |
| 31 | D_Plantar | Dominant plantar flexion strength (kg) |
| 32 | D_Dorsal | Dominant dorsal flexion strength (kg) |
| 33 | ND_Plantar | Non-dominant plantar flexion strength (kg) |
| 34 | ND_Dorsal | Non-dominant dorsal flexion strength (kg) |
| 35 | SLS_R | Single leg stance right (seconds) |
| 36 | SLS_L | Single leg stance left (seconds) |
| 37 | D_SLS | Dominant side single leg stance (seconds) |
| 38 | ND_SLS | Non-dominant side single leg stance (seconds) |
| 39 | SLS_MAX | Maximum single leg stance time (seconds) |
| 40 | SS | Sit-to-stand repetitions (30 s) |
| 41 | SS_SPPB | Sit-to-stand time for 5 repetitions (SPPB protocol) |
| 42 | CSR | Chair sit and reach distance (cm) |
| 43 | MWT2 | 2-Minute Walk Test distance (meters) |
| 44 | TUG | Timed Up and Go test (seconds) |
| 45 | Gaitspeed_SPPB | Gait speed from SPPB (m/s) |
| 46 | SPPB | Short Physical Performance Battery total score |
| 47 | G_HG_R | Grade-adjusted hand grip strength right |
| 48 | G_HG_L | Grade-adjusted hand grip strength left |
| 49 | G_BMI | Grade-adjusted Body Mass Index |
| 50 | G_SS | Grade-adjusted sit-to-stand repetitions |
| 51 | G_2MWT | Grade-adjusted 2-min walk test |
| 52 | G_TUG | Grade-adjusted Timed Up and Go test |
| 53 | G_CSR | Grade-adjusted Chair Sit and Reach test |
| 54 | G_D_SLS | Grade-adjusted dominant single-leg stance test |
| 55 | D1_s | Physical and Mental Health domain (adjusted) |
| 56 | D2_s | Locomotion domain (adjusted) |
| 57 | D3_s | Body Composition domain (adjusted) |
| 58 | D4_s | Functionality domain (adjusted) |
| 59 | D5_s | Activities of Daily Living domain (adjusted) |
| 60 | D6_s | Leisure Activities domain (adjusted) |
| 61 | D7_s | Fears domain (adjusted) |
| 62 | SarQoL_Total_s | Total Sarcopenia Quality of Life score (adjusted) |
| 63 | FES | Fall Efficacy Scale score |
| 64 | SARC_F | SARC-F questionnaire score |
| 65 | SARC_CalF | SARC-F questionnaire with calf circumference |
| 66 | Area_city | Residential city or region |
| 67 | Area_Dong | Residential neighborhood/town |
| 68 | Educationlevel | Education level of the participant |
| 69 | Religion | Religion of the participant |
| 70 | Smoking_ | Smoking status |
| 71 | Smoking_d_ | Smoking duration (years) |
| 72 | Smoking_a_ | Smoking amount (packs per day) |
| 73 | Drinking_f_ | Drinking frequency (times per week) |
| 74 | Drinking_d_ | Drinking duration (years) |
| 75 | Drinking_a_ | Drinking amount (glasses per session) |
| 76 | Family | Family type |
| 77 | House | Housing type |
| 78 | Income | Monthly income |
| 79 | Educationlevel_p | Parents’ education level |
| 80 | RegularPA_ | Regular physical activity status |
| 81 | TypeofPA_1_ | Type of physical activity 1 |
| 82 | TypeofPA_2_ | Type of physical activity 2 |
| 83 | TypeofPA_3_ | Type of physical activity 3 |
| 84 | TypeofPA_4_ | Type of physical activity 4 |
| 85 | TypeofPA_5_ | Type of physical activity 5 |
| 86 | TypeofPA_6_ | Type of physical activity 6 |
| 87 | FVC | Forced Vital Capacity (liters) |
| 88 | PreFVC | Predicted Forced Vital Capacity (L) |
| 89 | FEV1 | Forced Expiratory Volume in 1 s (L) |
| 90 | PEF | Peak Expiratory Flow (L/min) |
| 91 | MIP_Ave | Average Maximum Inspiratory Pressure (cmH2O) |
| 92 | SAF | Skin autofluorescence (AGEs measurement) |
| 93 | HbA1c | Glycated hemoglobin (HbA1c %) |
| 94 | DM | Diabetes Mellitus status |
| 95 | Hypertension | Hypertension diagnosis |
| 96 | Hyperlipidemia | Hyperlipidemia diagnosis |
| 97 | Sleepdisorder | Sleep disorder status |
References
- Cruz-Jentoft, A.J.; Sayer, A.A. Sarcopenia. Lancet 2019, 393, 2636–2646. [Google Scholar] [CrossRef]
- Petermann-Rocha, F.; Balntzi, V.; Gray, S.R.; Lara, J.; Ho, F.K.; Pell, J.P.; Celis-Morales, C. Global prevalence of sarcopenia and severe sarcopenia: A systematic review and meta-analysis. J. Cachexia Sarcopenia Muscle 2022, 13, 86–99. [Google Scholar] [CrossRef]
- Turimov Mustapoevich, D.; Kim, W. Machine learning applications in sarcopenia detection and management: A comprehensive survey. Healthcare 2023, 11, 2483. [Google Scholar] [CrossRef]
- Ozgur, S.; Altinok, Y.A.; Bozkurt, D.; Saraç, Z.F.; Akçiçek, S.F. Performance evaluation of machine learning algorithms for sarcopenia diagnosis in older adults. Healthcare 2023, 11, 2699. [Google Scholar] [CrossRef]
- Lynch, D.H.; Spangler, H.B.; Franz, J.R.; Krupenevich, R.L.; Kim, H.; Nissman, D.; Zhang, J.; Li, Y.Y.; Sumner, S.; Batsis, J.A. Multimodal diagnostic approaches to advance precision medicine in sarcopenia and frailty. Nutrients 2022, 14, 1384. [Google Scholar] [CrossRef]
- Roberts, S.; Collins, P.; Rattray, M. Identifying and managing malnutrition, frailty and sarcopenia in the community: A narrative review. Nutrients 2021, 13, 2316. [Google Scholar] [CrossRef]
- Band, S.S.; Yarahmadi, A.; Hsu, C.C.; Biyari, M.; Sookhak, M.; Ameri, R.; Dehzangi, I.; Chronopoulos, A.T.; Liang, H.W. Application of explainable artificial intelligence in medical health: A systematic review of interpretability methods. Inform. Med. Unlocked 2023, 40, 101286. [Google Scholar] [CrossRef]
- Rane, N.; Choudhary, S.; Rane, J. Explainable artificial intelligence (XAI) in healthcare: Interpretable models for clinical decision support. SSRN 2023. [Google Scholar] [CrossRef]
- Wang, K.; Zhang, H.; Cheng, C.Y.M.; Chen, M.; Lai, K.W.C.; Or, C.K.; Hu, Y.; Vellaisamy, A.L.R.; Lam, C.L.K.; Xi, N.; et al. Multi-Risk-Level Sarcopenia-Prone Screening via Machine Learning Classification of Sit-to-Stand Motion Metrics from Wearable Sensors. Adv. Intell. Syst. 2025, 2025, 2401120. [Google Scholar] [CrossRef]
- Luo, X.; Ding, H.; Broyles, A.; Warden, S.J.; Moorthi, R.N.; Imel, E.A. Using machine learning to detect sarcopenia from electronic health records. Digit. Health 2023, 9, 20552076231197098. [Google Scholar] [CrossRef] [PubMed]
- Guo, J.; He, Q.; She, C.; Liu, H.; Li, Y. A machine learning–based online web calculator to aid in the diagnosis of sarcopenia in the US community. Digit. Health 2024, 10, 20552076241283247. [Google Scholar] [CrossRef]
- Bae, J.H.; Seo, J.w.; Kim, D.Y. Deep-learning model for predicting physical fitness in possible sarcopenia: Analysis of the Korean physical fitness award from 2010 to 2023. Front. Public Health 2023, 11, 1241388. [Google Scholar] [CrossRef] [PubMed]
- Seok, M.; Kim, W.; Kim, J. Machine learning for sarcopenia prediction in the elderly using socioeconomic, infrastructure, and quality-of-life data. Healthcare 2023, 11, 2881. [Google Scholar] [CrossRef]
- Chen, X.D.; Chen, W.J.; Huang, Z.X.; Xu, L.B.; Zhang, H.H.; Shi, M.M.; Cai, Y.Q.; Zhang, W.T.; Li, Z.S.; Shen, X. Establish a new diagnosis of sarcopenia based on extracted radiomic features to predict prognosis of patients with gastric cancer. Front. Nutr. 2022, 9, 850929. [Google Scholar] [CrossRef]
- Tukhtaev, A.; Turimov, D.; Kim, J.; Kim, W. Feature Selection and Machine Learning Approaches for Detecting Sarcopenia Through Predictive Modeling. Mathematics 2025, 13, 98. [Google Scholar] [CrossRef]
- Ghosh, P.; Azam, S.; Jonkman, M.; Karim, A.; Shamrat, F.J.M.; Ignatious, E.; Shultana, S.; Beeravolu, A.R.; De Boer, F. Efficient prediction of cardiovascular disease using machine learning algorithms with relief and LASSO feature selection techniques. IEEE Access 2021, 9, 19304–19326. [Google Scholar] [CrossRef]
- Wang, J.; Xu, Y.; Liu, L.; Wu, W.; Shen, C.; Huang, H.; Zhen, Z.; Meng, J.; Li, C.; Qu, Z.; et al. Comparison of LASSO and random forest models for predicting the risk of premature coronary artery disease. BMC Med. Inform. Decis. Mak. 2023, 23, 297. [Google Scholar] [CrossRef] [PubMed]
- Wang, K.; Zhang, H.; Cheng, C.Y.M.; Chen, M.; Lai, K.W.C.; Or, C.K.; Chen, Y.; Hu, Y.; Vellaisamy, A.L.R.; Lam, C.L.K.; et al. High Accuracy Machine Learning Model for Sarcopenia Severity Diagnosis based on Sit-to-stand Motion Measured by Two Micro Motion Sensors. medRxiv 2023. [Google Scholar] [CrossRef]
- Ayllón-Gavilán, R.; Guijo-Rubio, D.; Gutiérrez, P.A.; Bagnall, A.; Hervás-Martínez, C. Convolutional-and Deep Learning-Based Techniques for Time Series Ordinal Classification. IEEE Trans. Cybern. 2024, 55, 537–549. [Google Scholar] [CrossRef]
- Xu, W.; Gao, Y.; Wang, Y.; Guan, J. Protein–protein interaction prediction based on ordinal regression and recurrent convolutional neural networks. BMC Bioinform. 2021, 22, 485. [Google Scholar] [CrossRef]
- Zakariah, M.; AlQahtani, S.A.; Al-Rakhami, M.S. Machine learning-based adaptive synthetic sampling technique for intrusion detection. Appl. Sci. 2023, 13, 6504. [Google Scholar] [CrossRef]
- Hittawe, M.M.; Harrou, F.; Togou, M.A.; Sun, Y.; Knio, O. Time-series weather prediction in the Red sea using ensemble transformers. Appl. Soft Comput. 2024, 164, 111926. [Google Scholar] [CrossRef]
- Bin Tareaf, R.; Korga, A.M.; Wefers, S.; Hanken, K. Direct vs. Cross-Validated Stacking in Ensemble Learning: Evaluating the Trade-Off between Inference Time and Generalizability on Fashion-MNIST. In Proceedings of the 2024 16th International Conference on Machine Learning and Computing, Shenzhen, China, 2–5 February 2024; pp. 453–461. [Google Scholar]
- Imani, M.; Beikmohammadi, A.; Arabnia, H.R. Comprehensive Analysis of Random Forest and XGBoost Performance with SMOTE, ADASYN, and GNUS Under Varying Imbalance Levels. Technologies 2025, 13, 88. [Google Scholar] [CrossRef]
- Salehi, A.R.; Khedmati, M. A cluster-based SMOTE both-sampling (CSBBoost) ensemble algorithm for classifying imbalanced data. Sci. Rep. 2024, 14, 5152. [Google Scholar] [CrossRef]
- Cullerne Bown, W. Sensitivity and specificity versus precision and recall, and related dilemmas. J. Classif. 2024, 41, 402–426. [Google Scholar] [CrossRef]
- Jung, D.; Lee, D.; Nguyen, Q.H.N.; Kim, J.; Mun, K.R. A Machine Learning Approach to Predict the Risk of Sarcopenia. In Proceedings of the 2023 IEEE EMBS Special Topic Conference on Data Science and Engineering in Healthcare, Medicine and Biology, St. Julians, Malta, 7–9 December 2023; pp. 47–48. [Google Scholar]
- Taghandiki, K. Quantum Machine Learning Unveiled: A Comprehensive Review. J. Eng. Appl. Res. 2024, 1, 29–48. [Google Scholar]
- Zupo, R.; Moroni, A.; Castellana, F.; Gasparri, C.; Catino, F.; Lampignano, L.; Perna, S.; Clodoveo, M.L.; Sardone, R.; Rondanelli, M. A machine-learning approach to target clinical and biological features associated with sarcopenia: Findings from northern and southern Italian aging populations. Metabolites 2023, 13, 565. [Google Scholar] [CrossRef]
- Turimov, D.; Kim, W. Enhancing Sarcopenia Prediction Through an Ensemble Learning Approach: Addressing Class Imbalance for Improved Clinical Diagnosis. Mathematics 2025, 13, 26. [Google Scholar] [CrossRef]
- Kim, B.R.; Yoo, T.K.; Kim, H.K.; Ryu, I.H.; Kim, J.K.; Lee, I.S.; Kim, J.S.; Shin, D.H.; Kim, Y.S.; Kim, B.T. Oculomics for sarcopenia prediction: A machine learning approach toward predictive, preventive, and personalized medicine. EPMA J. 2022, 13, 367–382. [Google Scholar] [CrossRef]
- Ullah, U.; Maheshwari, D.; Castillo Olea, C.; Garcia Zapirain, B. Sarcopenia risk prediction and feature selection by using quantum machine learning algorithms. Quantum Mach. Intell. 2024, 6, 80. [Google Scholar] [CrossRef]
- Nemade, V.; Pathak, S.; Dubey, A.K. Deep learning-based ensemble model for classification of breast cancer. Microsyst. Technol. 2024, 30, 513–527. [Google Scholar] [CrossRef]
- Morsy, S.; Abd-Elsalam, N.; Kandil, A.; Elbialy, A.; Youssef, A.B. A deep learning ensemble framework for robust classification of lung ultrasound patterns: Covid-19, pneumonia, and normal. Int. J. Adv. Intell. Inform. 2025, 11, 1966. [Google Scholar] [CrossRef]
- Yogesh, N.; Shrinivasacharya, P.; Naik, N. Novel statistically equivalent signature-based hybrid feature selection and ensemble deep learning LSTM and GRU for chronic kidney disease classification. PeerJ Comput. Sci. 2024, 10, e2467. [Google Scholar] [CrossRef]
- Deshpande, N.M.; Gite, S.; Pradhan, B. Explainable AI for binary and multi-class classification of leukemia using a modified transfer learning ensemble model. Int. J. Smart Sens. Intell. Syst. 2024, 17, 1–20. [Google Scholar] [CrossRef]
- Panthakkan, A.; Anzar, S.; Mansoor, W.; Al Ahmad, H. A new frontier in hematology: Robust deep learning ensembles for white blood cell classification. Biomed. Signal Process. Control 2025, 100, 106995. [Google Scholar] [CrossRef]
- Selvaraj, K.M.; Gnanagurusubbiah, S.; Roy, R.R.R.; Balu, S. Enhancing skin lesion classification with advanced deep learning ensemble models: A path towards accurate medical diagnostics. Curr. Probl. Cancer 2024, 49, 101077. [Google Scholar] [CrossRef]
- Li, M.; Sun, H.; Huang, Y.; Chen, H. Shapley value: From cooperative game to explainable artificial intelligence. Auton. Intell. Syst. 2024, 4, 2. [Google Scholar] [CrossRef]
- Franceschi, L.; Donini, M.; Archambeau, C.; Seeger, M. Explaining probabilistic models with distributional values. arXiv 2024, arXiv:2402.09947. [Google Scholar] [CrossRef]
- Madadizadeh, F.; Ghafari, H.; Bahariniya, S. Kappa Statistics: A Method of Measuring Agreement in Dental Examinations. Open Public Health J. 2023, 16, e18749445259818. [Google Scholar]
- Li, M.; Gao, Q.; Yu, T. Kappa statistic considerations in evaluating inter-rater reliability between two raters: Which, when and context matters. BMC Cancer 2023, 23, 799. [Google Scholar] [CrossRef]
- Yang, W.; Jiang, J.; Schnellinger, E.M.; Kimmel, S.E.; Guo, W. Modified Brier score for evaluating prediction accuracy for binary outcomes. Stat. Methods Med Res. 2022, 31, 2287–2296. [Google Scholar] [CrossRef] [PubMed]
- Singhal, K.; Azizi, S.; Tu, T.; Mahdavi, S.S.; Wei, J.; Chung, H.W.; Scales, N.; Tanwani, A.; Cole-Lewis, H.; Pfohl, S.; et al. Large language models encode clinical knowledge. Nature 2023, 620, 172–180. [Google Scholar] [CrossRef] [PubMed]
- Zou, J.; Topol, E.J. The rise of agentic AI teammates in medicine. Lancet 2025, 405, 457. [Google Scholar] [CrossRef] [PubMed]

| Study | Input Modality | Model(s) | Task Type | Severity Considered | Accuracy (%) |
|---|---|---|---|---|---|
| [10] | Electronic Health Records (EHR) | LR, MLP, and SVM | Multiclass | Yes | 91.4 |
| [11] | Demographics | XGBoost | Binary | No | 85.2 |
| [12] | Fitness Scores | DNN | Binary | Yes | 87.5 |
| [27] | Electromyography (EMG) | LSTM | Multiclass | Yes | 94.4 |
| [13] | Socioeconomic/Quality Measures | RF and LightGBM | Binary | No | ∼80 |
| [30] | Clinical Vitals | RF, SVM, and NN (Ensemble) | Binary | No | 88.5 |
| [31] | Oculomics | XGBoost | Binary | No | 75.1 |
| [29] | Laboratory Biomarkers | RF and LR | Binary | Yes | - |
| [32] | Clinical + Categorical Features | Quantum SVM and RF | Binary | Yes | 76.7 |
| [18] | IMU (Sit-to-Stand) | Ensemble Stack | Multiclass | Yes | 90.4 |
| Proposed Model | Clinical Vitals | RF, GB, and MLP | Multiclass | Yes | 96.9 |
| Sarcopenia Level | Description | Criteria Based on Assessment |
|---|---|---|
| 0—Normal | No evidence of sarcopenia | All parameters remain within normal ranges: muscular force capacity, functional mobility metrics, and quantitative appendicular muscle mass measurements exceed threshold values. |
| 1—Possible Sarcopenia | Early signs detected mainly in primary care settings | Diminished muscular force (hand dynamometry: males < 28 kg and females < 18 kg) or compromised functional capacity (chair-rise pentad ≥ 12 s). Quantitative muscle mass evaluation not mandatory at this diagnostic stage. |
| 2—Sarcopenia | Confirmed sarcopenia diagnosis | Reduced appendicular skeletal musculature combined with either insufficient grip force (males < 28 kg, females < 18 kg) or suboptimal mobility parameters (6-meter ambulatory velocity < 1.0 m/s, chair-rise pentad ≥ 12 s, or abbreviated physical function index ≤ 9). |
| 3—Severe Sarcopenia | Advanced sarcopenia condition | Concurrent manifestation of all diagnostic indicators: insufficient appendicular muscle volume with compromised muscular force and deteriorated functional performance metrics (triple-domain deficiency syndrome) [1]. |
| Feature | Meaning |
|---|---|
| HG_R_M | Maximum handgrip strength of the right hand. |
| HG_L_2 | Second handgrip strength trial for the left hand. |
| TUG | Timed up-and-go test (mobility and balance assessment). |
| D_HG | Dominant handgrip strength. |
| Age | Age of the subject in years. |
| HG_R_1 | First handgrip strength trial for the right hand. |
| SS_SPPB | Sit-to-stand and short physical performance Battery total score. |
| BFM_kg | Body Fat Mass in kilograms. |
| ND_HG | Non-dominant handgrip strength. |
| G_BMI | Grade body mass index category. |
| SPPB | Short physical performance battery score. |
| BMR_kcal | Basal metabolic rate in kilocalories. |
| G_SS | Grade of the sit-to-stand score category. |
| ASM | Appendicular skeletal muscle mass. |
| Smoking_a_ | Smoking status. |
| HG_R_2 | Second handgrip strength trial for the right hand. |
| SMM_kg | Skeletal muscle mass in kilograms. |
| CC_cm | Calf Circumference in centimeters. |
| sex | Biological sex of the participant. |
| G_HG_L | Grade of handgrip strength for the left hand. |
| BMI_kgm2 | Body mass index in kg/m2. |
| Educationlevel | Highest level of education attained. |
| D3_s | Body composition domain. |
| G_HG_R | Grade of handgrip strength for the right hand. |
| G_TUG | Grade of the timed up-and-go category. |
| HG_L_M | Maximum handgrip strength of the left hand. |
| SS | Sit-to-stand repetitions (30 s). |
| D_Plantar | Plantar flexion strength or delay. |
| Sleepdisorder | Presence of a diagnosed sleep disorder. |
| Dorsal_R_1 | First dorsal flexion strength measurement on the right. |
| weight_kg | Body weight in kilograms. |
| Model | Best Parameters |
|---|---|
| Stacked Model | Ensemble of optimized base models |
| Gradient Boosting | {‘learning_rate’: 0.05, ‘max_depth’: 3, ‘n_estimators’: 200} |
| Random Forest | {‘max_depth’: None, ‘min_samples_split’: 2, ‘n_estimators’: 300} |
| AdaBoost | {‘n_estimators’: 200, ‘learning_rate’: 1.0} |
| Decision Tree | {‘max_depth’: None, ‘min_samples_split’: 2} |
| MLP | {‘activation’: tanh, ‘alpha’: 0.0001, ‘hidden_layer_sizes’: (50), ‘learning_rate_init’: 0.01} |
| SVM | {‘kernel’: rbf, ‘gamma’: 0.001, ‘C’: 100.0} |
| # | Model | Accuracy | Precision | F1 Score | Recall |
|---|---|---|---|---|---|
| 1 | Proposed Model | 0.9624 | 0.9800 | 0.9400 | 0.9100 |
| 2 | Gradient Boosting | 0.9774 | 0.9600 | 0.9700 | 0.9700 |
| 3 | Random Forest | 0.9398 | 0.9200 | 0.9100 | 0.9000 |
| 4 | AdaBoost | 0.9398 | 0.8846 | 0.8519 | 0.8214 |
| 5 | Decision Tree | 0.9173 | 0.8700 | 0.8800 | 0.8800 |
| 6 | MLP | 0.9098 | 0.8800 | 0.8600 | 0.8400 |
| 7 | SVM | 0.9023 | 0.8600 | 0.8500 | 0.8500 |
| Model | Kappa | Brier Score |
|---|---|---|
| Stacked Model | 0.8790 | 0.0243 |
| Gradient Boosting | 0.9330 | 0.0104 |
| Random Forest | 0.8142 | 0.0484 |
| AdaBoost | 0.8142 | 0.1575 |
| Decision Tree | 0.7544 | 0.0827 |
| MLP | 0.7136 | 0.0747 |
| SVM | 0.7021 | 0.0768 |
| # | Model | Best Parameters |
|---|---|---|
| 1 | Stacked (RF + GB + MLP) | Optimized RF, GB, and MLP base models |
| 2 | Random Forest | {‘max_depth’: None, ‘min_samples_leaf’: 1, ‘min_samples_split’: 5, ‘n_estimators’: 300} |
| 3 | Gradient Boosting | {‘subsample’: 0.8, ‘n_estimators’: 300, ‘max_features’: ‘log2’, ‘max_depth’: 7, ‘learning_rate’: 0.05} |
| 4 | MLP | {‘alpha’: 0.0001, ‘hidden_layer_sizes’: (50), ‘learning_rate_init’: 0.01} |
| 5 | SVM | {‘C’: 10, ‘gamma’: ‘scale’, ‘kernel’: ‘rbf’} |
| 6 | Decision Tree | {‘max_depth’: None, ‘min_samples_leaf’: 1, ‘min_samples_split’: 2} |
| 7 | AdaBoost | {‘learning_rate’: 0.01, ‘n_estimators’: 50} |
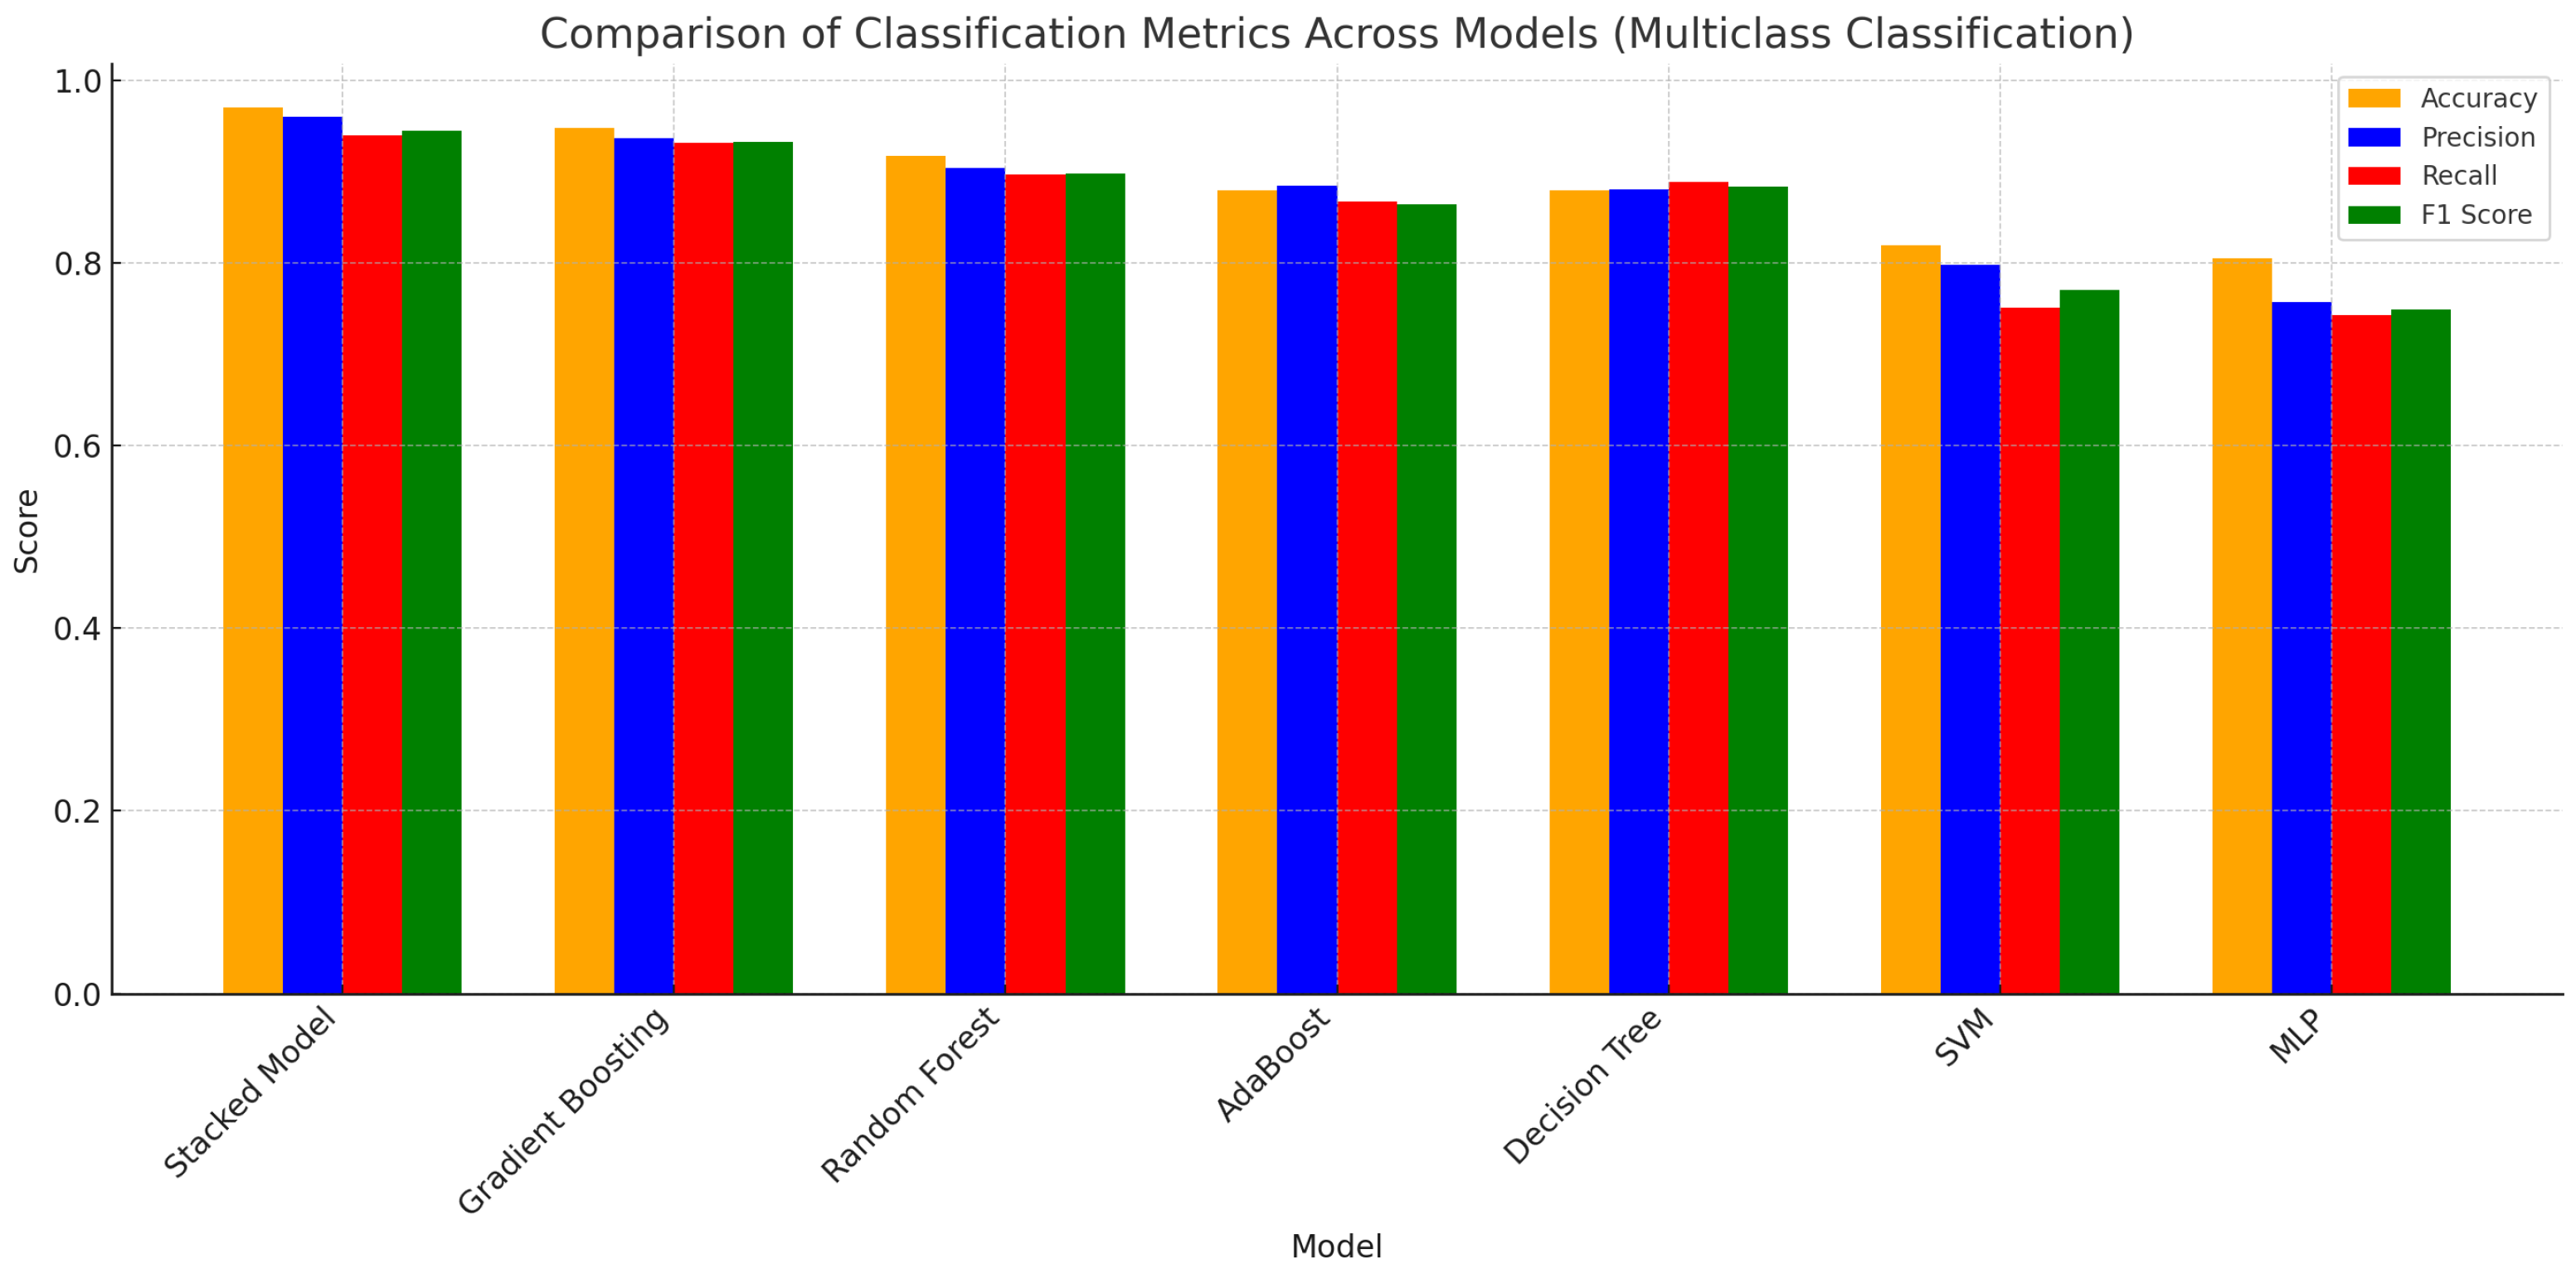
| Model | Accuracy | Precision | Recall | F1 Score |
|---|---|---|---|---|
| Proposed Model | 0.9699 | 0.9600 | 0.9400 | 0.9449 |
| Gradient Boosting | 0.9474 | 0.9367 | 0.9313 | 0.9320 |
| Random Forest | 0.9173 | 0.9034 | 0.8965 | 0.8977 |
| AdaBoost | 0.8797 | 0.8840 | 0.8675 | 0.8646 |
| Decision Tree | 0.8797 | 0.8800 | 0.8890 | 0.8837 |
| SVM | 0.8195 | 0.7981 | 0.7510 | 0.7704 |
| MLP | 0.8045 | 0.7568 | 0.7427 | 0.7485 |
| Model | Kappa | Brier Score |
|---|---|---|
| Stacked Model | 0.9738 | 0.0125 |
| Gradient Boosting | 0.9380 | 0.0256 |
| Random Forest | 0.9106 | 0.0407 |
| AdaBoost | 0.8680 | 0.0602 |
| Decision Tree | 0.8740 | 0.0602 |
| SVM | 0.7972 | 0.0671 |
| MLP | 0.7749 | 0.0901 |
| Base Learner Combination | Accuracy | Macro F1 | Cohen’s Kappa |
|---|---|---|---|
| RF + GB + MLP (Full Model) | 0.9699 | 0.9449 | 0.9738 |
| RF + GB | 0.9474 | 0.9320 | 0.9384 |
| RF + MLP | 0.9474 | 0.9240 | 0.9285 |
| GB + MLP | 0.9624 | 0.9337 | 0.9589 |
Disclaimer/Publisher’s Note: The statements, opinions and data contained in all publications are solely those of the individual author(s) and contributor(s) and not of MDPI and/or the editor(s). MDPI and/or the editor(s) disclaim responsibility for any injury to people or property resulting from any ideas, methods, instructions or products referred to in the content. |
© 2025 by the authors. Licensee MDPI, Basel, Switzerland. This article is an open access article distributed under the terms and conditions of the Creative Commons Attribution (CC BY) license (https://creativecommons.org/licenses/by/4.0/).
Share and Cite
Ruziboev, A.; Turimov, D.; Kim, J.; Kim, W. Multiclass Classification of Sarcopenia Severity in Korean Adults Using Machine Learning and Model Fusion Approaches. Mathematics 2025, 13, 2907. https://doi.org/10.3390/math13182907
Ruziboev A, Turimov D, Kim J, Kim W. Multiclass Classification of Sarcopenia Severity in Korean Adults Using Machine Learning and Model Fusion Approaches. Mathematics. 2025; 13(18):2907. https://doi.org/10.3390/math13182907
Chicago/Turabian StyleRuziboev, Arslon, Dilmurod Turimov, Jiyoun Kim, and Wooseong Kim. 2025. "Multiclass Classification of Sarcopenia Severity in Korean Adults Using Machine Learning and Model Fusion Approaches" Mathematics 13, no. 18: 2907. https://doi.org/10.3390/math13182907
APA StyleRuziboev, A., Turimov, D., Kim, J., & Kim, W. (2025). Multiclass Classification of Sarcopenia Severity in Korean Adults Using Machine Learning and Model Fusion Approaches. Mathematics, 13(18), 2907. https://doi.org/10.3390/math13182907


