Abstract
A new macroscopic traffic model is proposed based on visibility distance and the time to collision (TTC) in foggy conditions. The TTC is obtained from real traffic data. It is shown that the proposed model is hyperbolic and has a well-posed solution. Further, it is string stable. The proposed and Payne–Witham (PW) models are implemented in MATLAB R2019b using the first-order upwind numerical scheme and evaluated over a 3000 m circular road with a ramp at 1500 m. The results show that the proposed model can effectively characterize traffic in poor visibility, while the PW model provides unrealistic results. Thus, the proposed model can be used to accurately predict traffic behavior and alleviate congestion in foggy conditions.
MSC:
76A30; 35A35; 65N06
1. Introduction
Reliable modeling of traffic in adverse weather such as fog is an important problem. Driver response in fog depends on the visibility distance and surrounding environment. The time to collision (TTC) is the time for a collision to occur if vehicles continue at their current speeds and trajectories. This is a crucial parameter to assess collision risk. The TTC is affected by fog, which significantly impacts traffic flow. Therefore, traffic should be characterized considering visibility distance and TTC.
The field of view and TTC have been incorporated in traffic models [1,2,3]. Driver presumption is based on the size of a vehicle visually [4,5]. When the visual angle is smaller than rad/s, the relative velocity to changes ahead cannot be perceived [6]. TTC should be incorporated in intelligent transport systems and driver-assist technologies [7] to account for human cognitive constraints and visual perception [8,9,10]. Reduced visibility caused by fog contributes to many traffic accidents worldwide. According to the US Federal Highway Administration (FHWA), fog results in over 38,700 accidents in the US annually, with around 600 fatalities and 16,300 injuries. Chain reaction crashes are especially common in dense fog as drivers can be unaware of stopped or slowed vehicles ahead. It has been shown that visibility under 200 m can dramatically increase collision risk [11]. Despite advances in vehicle technology such as automatic braking and fog lights, fog is one of the most dangerous weather-related traffic hazards. However, most traffic models do not consider fog. To address this, a traffic flow model is developed based on TTC and visibility distance.
Fog poses a significant risk to road safety, particularly on major highways where reduced visibility often results in serious collisions. In Saudi Arabia, 54 vehicles were involved in a crash, and 15 people were injured, due to dense fog on the Jubail Dammam highway in 2015 [12]. A fog warning system in the southern region of Saudi Arabia resulted in a km/h decrease in speed, but this is not always sufficient considering the visibility hazard [13]. Thus, driver awareness and enforcement remain critical in reducing fog-related accidents.
Reduced visibility compromises the ability to detect hazards, which reduces driver reaction time and thus the TTC [14]. In foggy conditions, drivers often underestimate headway and rely on visual cues from tail lights, which increases collision risk. In [15], it was determined that in dense fog, old drivers maintain headways that are 21% shorter than those of young drivers. Thus, older drivers have a higher collision risk in fog. The risk of an accident is also higher with inexperienced drivers [16]. Highways are designed for high speed uninterrupted traffic flow to provide reliable and efficient transportation of people and goods. Fog significantly affects highway traffic as reduced visibility leads to lower speeds. However, this is often insufficient to avoid accidents [17]. In addition, fog can cause inconsistent driver reactions such as sudden braking, driving slowly, or high speeds, which increase the risk of accidents. Thus, considering TTC and visibility distance in a traffic model is necessary for accurate traffic characterization and improved safety in poor visibility conditions like fog.
A variety of traffic flow models have been proposed [18,19]. A cellular automata model was used in [20] to characterize traffic at intersections. The results indicate that the flow is smooth for low densities, but congestion occurs beyond the critical density. Cellular automata were also used in [21] to characterize traffic. These probabilistic models are based on statistics. Deterministic models are based on traffic dynamics and typically consider small changes in traffic density, speed, and flow. Multilane traffic was considered in [18]. Driver presumption was considered in [22] to improve the sensitivity of traffic models. The velocity difference was employed in [23] to increase traffic stability and mitigate congestion. The lattice hydrodynamic model was proposed in [24] to incorporate the impact of forward and backward vehicles. This was shown to improve traffic stability and reduce congestion. A car-following model was developed in [19] to describe vehicle movement on a single lane spiral road. It was shown that road friction, curvature, and slope significantly impact the traffic flow. While a variety of environments have been considered with existing traffic models, they do not incorporate the TTC and visibility distance.
The Lighthill, Whitham, and Richards (LWR) model [25,26] is a deterministic traffic model based on the law of conservation. This model is
where is traffic density and is the corresponding equilibrium velocity. The subscript x denotes distance, and t denotes time. This is a simple model that considers small changes in traffic. It is suitable for traffic prediction in large road networks and can characterize large variations in density [27,28]. However, vehicles can change position instantaneously, which is unrealistic [29].
The equilibrium velocity is the speed drivers try to maintain, and it decreases as the density increases [30,31]. It is often characterized using the Greenshields distribution [32]
where and are the maximum velocity and density, respectively. Other equilibrium velocity distributions have been proposed [33,34], but (2) is simpler and so is employed here.
The LWR model was modified in [35] to consider driver presumption and velocity alignment. Payne and Witham incorporated acceleration to obtain the (PW) model [36,37]. Traffic changes with this model are based on a constant , which is known as sound speed [32]. As a consequence, driver anticipation is the same for different road and weather conditions, which does not reflect real-world traffic [36,38]. The PW model was extended in [39] to mitigate abrupt changes in velocity by incorporating a term based on a compressible fluid analogy. However, this model assumes homogeneous driver behavior [40], which is not the case in complex traffic environments such as on/off ramps and non-lane-based conditions [41]. Driver reaction time was added to the PW model in [42], and density and anticipation were incorporated in [43,44], but these models cannot characterize traffic behavior in foggy conditions as traffic physics is ignored. Driver response based on a Markov decision process was considered in [45], and deep reinforcement learning (DRL) was employed in [46]. The model in [47] is based on a parallel convolution residual (PCR) network with real-world traffic data. However, these models are more complex than conventional traffic models. They also require significant data, which can be difficult to acquire, while conventional models are based on traffic physics.
The influence of adverse weather conditions, particularly fog, has largely been ignored in the development of traffic models. Further, most existing models assume ideal driving conditions and uniform driver behavior. Thus, they ignore human factors that are crucial for realistic traffic modeling. Some microscopic traffic models consider human behavior, but they have high computational complexity and poor generalizability. Existing macroscopic models either oversimplify the environment or ignore traffic dynamics. In particular, the TTC and visibility distance have not been considered. Thus, a macroscopic traffic model is proposed that explicitly integrates the TTC and visibility distance to provide a realistic representation of traffic behavior under different conditions, in particular, fog.
The proposed model improves the (PW) model by integrating the TTC derived from visibility data [48]. It accounts for adjustments in velocity based on visibility to better reflect traffic behavior. The performance is evaluated on a 3000 m circular road with a ramp located at 1500 m. The results indicate that the velocity and density with the proposed model are more realistic in both poor and good visibility conditions than the PW model. In particular, driver anticipation is smaller with the proposed model.
Objectives and Hypotheses
Reliable and accurate traffic prediction in fog is essential to reflect real-world traffic conditions. The goal is to develop a macroscopic traffic model that captures the effects of reduced visibility on driver behavior and traffic density and velocity. The main objectives are as follows.
- Investigate traffic velocity, density, and driver response (anticipation) in low-visibility conditions such as fog.
- Incorporate the TTC into a macroscopic traffic model to provide realistic traffic characterization in foggy conditions.
- Extend the PW model by integrating driver anticipation based on visibility distance and TTC.
- Evaluate the performance of the proposed model on a circular road with an on-ramp under varying visibility distances and compare the results with the PW model.
The following research hypotheses guide this investigation.
- Reduced visibility due to fog significantly affects driver behavior, leading to changes in traffic density and flow not captured by existing macroscopic models.
- Integrating the TTC into a traffic model improves the traffic behavior prediction in foggy conditions.
- Improving the PW model based on the TTC and visibility distance will produce more stable and realistic results in different weather conditions than existing models.
This study addresses the gap between theoretical traffic flow modeling and real-world traffic behavior in fog. The proposed model is adaptive and can be used to improve traffic safety in adverse weather conditions.
The rest of this paper is organized as follows. Section 2 presents the proposed macroscopic traffic model, and the hyperbolicity is evaluated. The string stability is analyzed in Section 3. Section 4 provides performance results for both poor and good-visibility conditions in terms of the velocity, density, and driver anticipation. A discussion of the results is given in Section 5, and some conclusions are presented in Section 6.
2. Traffic Models
The Payne Whitham (PW) model is
where is the anticipation term that characterizes driver response to density changes. The constant can lead to unrealistic results, particularly when there are abrupt changes in density. In reality, driver anticipation should be based on traffic dynamics and driving conditions [49]. With this model, large changes in anticipation can lead to negative velocities. The term is driver relaxation and characterizes traffic alignment to changes in velocity and density. This alignment is influenced by the relaxation time b.
The acceleration is defined as , and considering the velocity of the leading vehicle and following vehicle , we have
which gives
Since is the velocity difference between the leading and following vehicles, , so then
Thus, the distance headway is a function of the leading and following vehicle velocities. The distance headway is small when is small as this distance is covered quickly. Considering the impact of fog on the visibility distance D, the velocity is , where is the maximum visibility distance. The corresponding change in the velocity of the following vehicle is
Substituting this in (5) gives
Changes in traffic occur during the safe time headway . Using this with (7), we obtain the velocity in fog
The TTC was analyzed in [48] for day and night driving in fog on a highway. The visibility distance was examined with speed differences of 20 and 40 km/h. Let be the TTC after a driver fully releases the gas pedal and be the TTC when the forward vehicle becomes visible. At night, was found to be higher due to the greater visibility of tail lights. This suggests that is primarily influenced by whatever part of the forward vehicle becomes visible first. The minimum time for a driver to avoid a collision is [48]
with correlation coefficient , and
with correlation coefficient . Therefore, there is a delay of s in driver reaction to release the gas pedal once the forward vehicle becomes visible. Substituting (10) in (9) gives
and using this for in (8), we obtain
Replacing in (3) with gives the proposed model
This characterizes traffic flow in fog by incorporating the maximum visibility distance , the time-to-collision when the forward vehicle is first detected, and the safe time headway . These parameters provide realistic driver anticipation , which determines the alignment with forward traffic in low-visibility environments [48]. In the PW model, this alignment is based on the constant , so driver anticipation is . This does not accurately represent real-world traffic dynamics. Note that the first equation in (13) corresponds to the conservation of vehicles and is the same as in the PW model (3).
Traffic flow hyperbolicity ensures that the problem is well posed, and a valid solution exists. This requires that the associated eigenvalues are real and distinct [44]. Then model behavior is physically meaningful [50]. The PW model variables are , the functions of these variables are , and the source term is [35]. From (13), the proposed model variables are , the functions of these variables are , and the source term is the same as in the PW model.
The Jacobian matrix is obtained from the functions of the variables. The eigenvalues of this matrix are used to evaluate model hyperbolicity. The PW model eigenvalues [44] are
They are real and distinct, so the model is hyperbolic. With this model, changes in free-flow conditions are primarily influenced by , while governs traffic behavior during congestion. However, this behavior is based on the constant , which does not reflect real driver response or traffic conditions. The proposed model eigenvalues are
They are real and distinct, so the model is hyperbolic. With this model, governs free-flow conditions, while corresponds to traffic behavior during congestion. Further, both and are influenced by key parameters such as the safe time headway, TTC, and visibility distance. Thus, this model can be used to characterize traffic behavior in fog.
3. String Stability of the Traffic Models
String stability ensures that small changes in velocity by leading vehicles do not increase as they propagate downstream through the following vehicles, so traffic behavior is realistic. Therefore, the string stability of the PW and proposed models is examined in this section. Consider an initial density and the corresponding density-dependent velocity . Then for small changes in density and velocity
Let k denote the spatial change in traffic, and , where f is the oscillation frequency. Traffic is stable if the changes in density and velocity decay spatially and temporally. For small traffic changes
where is the change in flow. Then for the proposed model
where .
The linearized system is
Let be the magnitude for the traffic changes so that
Then
Substituting (20) into (18) and factoring out gives
The solution of
gives as a function of k, .
The Jacobian matrix is
and the source term is
Substituting A and B in (22) gives
which has solution
This can be simplified to
and substituting , we have
The model is string stable if , i.e., the traffic oscillations decay with time
This condition imposes an upper bound on the relaxation time b relative to the anticipation and the slope to ensure that small changes in the leading vehicle decay rather than increase downstream. To assess the string stability, the proposed model was implemented in MATLAB with the parameters s, s, s, m/s, , and the leading vehicle speed achieving the Greenshields distribution. Figure 1 presents the imaginary parts of versus the spatial frequency k. This shows that for all k; hence, the proposed model is string stable.
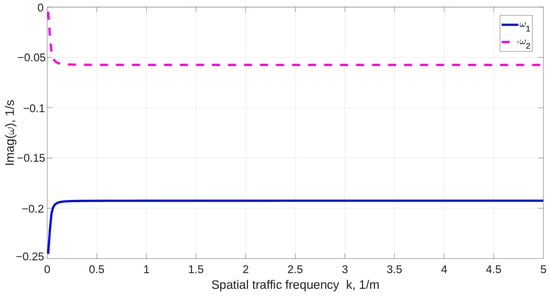
Figure 1.
The imaginary parts of versus the spatial frequency k.
4. Performance Evaluation
The proposed and PW models were implemented in MATLAB R2019b using the first-order centered (FORCE) scheme [51]. This combines the Lax–Friedrichs (LR) and Richtmyer (R) methods to provide robust solutions for second-order systems with lower complexity than the Roe scheme [52]. The FORCE scheme effectively captures large gradients and discontinuities and has been widely used for traffic modeling [52].
The road length is divided into M uniform cells of width . The total simulation time is divided into N time steps of size . Let represent the average density and flow in cell i at position and time . The FORCE flux at the interface between cells i and is the average of the LF and R fluxes
where
The conserved variables are updated using the finite volume formulation
The velocity is then obtained from . The segment travel time (STT) is the time to travel a distance
Total variation is a widely used metric to quantify the changes in . The total variation based on the norm is
This provides a measure of the temporal and spatial variability. A smaller value indicates a smoother profile with fewer abrupt changes, which is generally desirable to ensure stable and realistic results. In this section, is obtained for the velocity, density, and driver anticipation to compare the proposed and PW models.
4.1. Simulation Environment
A circular road of length 3000 m is considered to assess the performance of the models. The road has an ingress ramp at 1500 m with a density of . This can be considered a worst-case scenario for traffic performance analysis as the number of vehicles on the road increases over time. To maintain numerical stability, the Courant–Friedrichs–Lewy (CFL) condition [53] is enforced. For m, this gives s for the proposed model and for the PW model. m is considered for poor visibility, which corresponds to thick fog [54]. The simulation time for both models is 100 s, and the equilibrium velocity distribution is (2). The simulation parameters are given in Table 1.

Table 1.
Simulation parameters for the proposed and PW models in poor visibility.
The minimum safe time headway in free-flow traffic is typically between 4 s and 6 s [55], so here s in fog, which is above the maximum free-flow value. The relaxation time is s [56,57], while s [48]. The density distribution at is
Based on the results in [35], the speed constant in the PW model is between 2.4 m/s and 57 m/s, so here m/s is used. The initial velocity distribution based on (35) is
4.2. Simulation Results
Figure 2 presents driver anticipation with the proposed model before the ramp (1400 m), at the ramp (1500 m), and after the ramp (1600 m) in poor visibility ( m). At the 1st time step, driver anticipation at 1400 m is , while at the 100th time step it is . At the 400th time step, it is and is approximately constant to the 1000th time step. At 1500 m, driver anticipation is at the 1st time step and decreases to at the 5th time step. At the 100th time step, it is and decreases to at the 400th time step and at the 1000th time step. At 1600 m, driver anticipation is at the 1st time step and decreases to at the 100th time step, at the 400th time step, and at the 1000th time step. These results indicate that in poor visibility, driver anticipation at 1500 m is smaller than at 1400 m but larger than at 1600 m. Figure 3 presents the corresponding normalized density with the proposed model. At 1400 m, the density is at the 1st time step and increases to at the 200th time step. It is at the 500th time step and is approximately constant to the 1000th time step. At 1500 m, the density is at the 1st time step and increases to at 200th time step. It is at the 500th time step and is approximately constant to the 1000th time step. At 1600 m, the density is at the 1st time step and decreases to at the 200th time step. It is at the 500th time step and decreases to at the 800th time step and at the 1000th time step. At 1500 m, the density is approximately constant after the 200th time step, while at 1400 m it is approximately constant after the 300th time step, and at 1600 m it is approximately constant after the 600th time step. Figure 4 presents the corresponding velocity with the proposed model. At 1400 m, the velocity is m/s at the 1st time step and decreases to m/s at the 45th time step. It is m/s at the 300th time step and is approximately constant to the 1000th time step. At 1500 m, the velocity is m/s at the 1st time step, decreases to m/s at the 4th time step, and then is approximately constant to the 1000th time step. At 1600 m, the velocity is m/s at the 1st time step and decreases to m/s at the 200th time step. It then increases to m/s at the 300th time step, m/s at the 700th time step, and m/s at the 1000th time step. At 1500 m, the velocity is approximately constant after the 4th time step, while at 1400 m it is approximately constant after the 300th time step. Conversely, at 1600 m it increases to m/s at the 1000th time step.
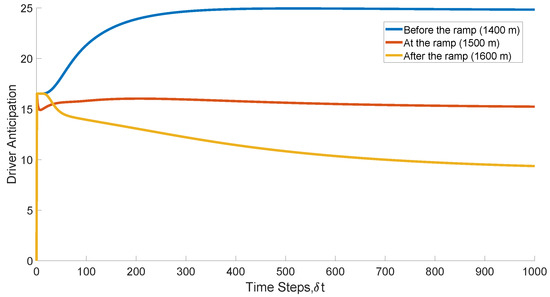
Figure 2.
Driver anticipation with the proposed model at 1400 m (before the ramp), 1500 m (at the ramp), and 1600 m (after the ramp), on a 3000 m circular road in poor visibility.
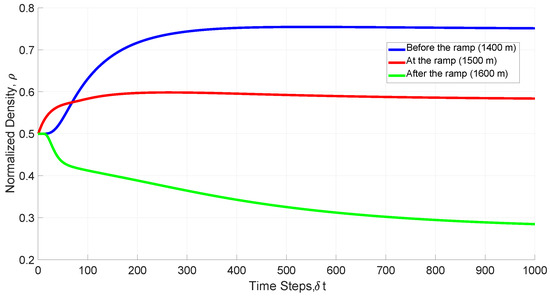
Figure 3.
Normalized density with the proposed model at 1400 m (before the ramp), 1500 m (at the ramp), and 1600 m (after the ramp), on a 3000 m circular road in poor visibility.
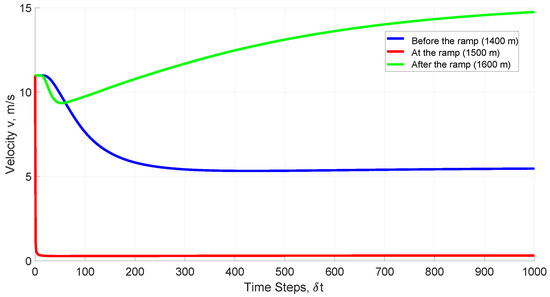
Figure 4.
Velocity with the proposed model at 1400 m (before the ramp), 1500 m (at the ramp), and 1600 m (after the ramp), on a 3000 m circular road in poor visibility.
Figure 5 presents the peak-to-peak normalized density versus the safe time headway with the proposed model before the ramp, at the ramp, and after the ramp on a 3000 m circular road in poor visibility. This is the difference between the maximum and minimum density on the road. At 1400 m (before the ramp), the peak-to-peak density is for safe time headway to . It decreases to at and at , and is at . At 1500 m (at the ramp), the peak-to-peak density is at safe time headway and decreases to at and at . It is at and at . At 1600 m (after the ramp), the peak-to-peak density is at safe time headway and decreases to at , at , and at . Thus, the peak-to-peak density at 1600 m varies little from to , but at 1400 m, the variations decrease from to . At 1500 m, the variations decrease with an increase in safe time headway from to .
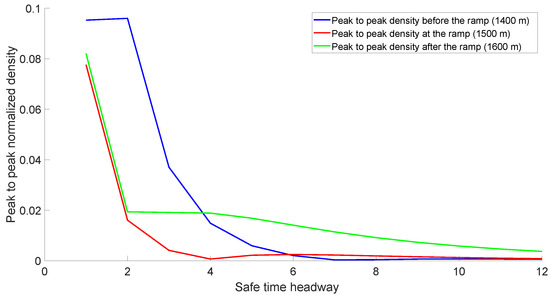
Figure 5.
Peak-to-peak normalized density with the proposed model on a 3000 m circular road versus the safe time headway before the ramp, at the ramp, and after the ramp at 1500 m in poor visibility.
Figure 6 gives the normalized density and velocity with the proposed model for safe time headway , , and on a 3000 m circular road with a ramp at 1500 m in poor visibility. This shows that for safe time headway , the density is at 10 m, increases to at 500 m, and then is approximately constant to 1000 m. It decreases to at 1300 m, increases to at 1460 m, and then decreases at the ramp (1500 m). The density is at 1540 m, increases to at 1830 m, and then decreases to at 2500 m. For safe time headway , the density is at 10 m, increases to at 1000 m, and then decreases to at 1300 m. It is at 1450 m and decreases at the ramp (1500 m). The density is at 1560 m, increases to at 2000 m, and then decreases to at 2500 m. For safe time headway , the density is at 10 m and increases to at 500 m and at 1460 m before decreasing at the ramp (1500 m). It is at 1580 m and increases to at 2500 m. The normalized density for all safe time headway values is within the minimum and maximum of 0 and 1, respectively. Further, the variations in poor visibility for are less than for and . For safe time headway , the velocity in poor visibility is m/s at 10 m, decreases to m/s at 500 m, and is approximately constant to 1000 m. It increases to m/s at 1300 m, decreases to m/s at 1490 m, and then increases after the ramp to m/s at 1540 m. The velocity is m/s at 1830 m and increases to at 2500 m. For safe time headway , the velocity is m/s at 10 m and increases to m/s at 1000 m and m/s at 1300 m. It is to m/s at 1450 m and then increases after the ramp to m/s at 1560 m. The velocity is m/s at 2000 m and m/s at 2500 m. For safe time headway , the velocity is m/s at 10 m and decreases to m/s at 500 m and m/s at 1460 m. It is m/s at 1490 m, increases after the ramp to m/s at 1580 m, and then decreases to m/s at 2500 m. The velocity for all safe time headway values is within the minimum and maximum of 0 and 20 m/s, respectively. In addition, the variations for are less than for and .
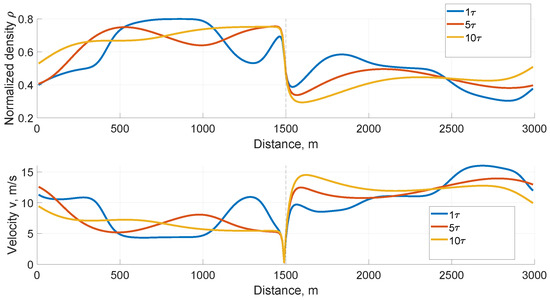
Figure 6.
Normalized density and velocity with the proposed model on a 3000 m circular road for safe time headway , , and in poor visibility.
Figure 7 presents the average peak-to-peak density with the proposed model on a 3000 m circular road versus the safe time headway in poor visibility. The average density for safe time headway is and decreases to at , at , at , and at . Thus, the variations in peak-to-peak density decrease with the safe time headway, and traffic becomes more stable.
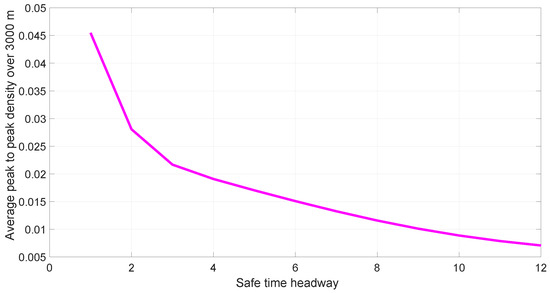
Figure 7.
Peak-to-peak density with the proposed model on a 3000 m circular road versus the safe time headway in poor visibility.
Figure 8 gives the normalized density with the proposed model over a 3000 m circular road with a ramp at 1500 m for 100 s in poor visibility. This shows that the density before the ramp (0 m to 1500 m) is large, whereas after the ramp (1500 m to 3000 m), it is small. Thus, congestion exists before the ramp. Figure 9 gives the corresponding velocity. This shows that the velocity is large when the density is small and small with a large density, as expected. Thus, the velocity before the ramp is smaller than after the ramp.
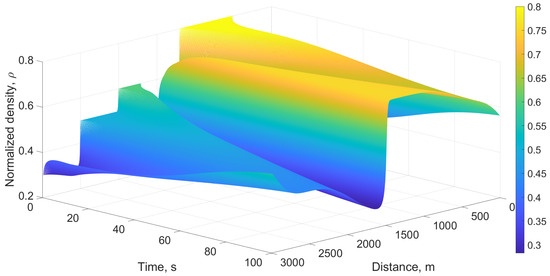
Figure 8.
Normalized density with the proposed model on a 3000 m circular road with a ramp at 1500 m for 100 s in poor visibility.
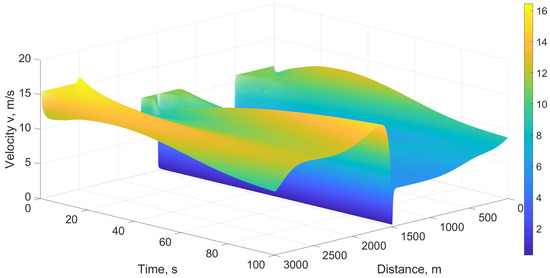
Figure 9.
Velocity with the proposed model on a 3000 m circular road with a ramp at 1500 m for 100 s in poor visibility.
Figure 10 presents driver anticipation in poor visibility with the PW model on a 3000 m circular road before the ramp (1400 m), at the ramp (1500 m), and after the ramp (1600 m). At the 1st time step, driver anticipation at 1400 m is , increases to at the 100th time step, and then decreases to at the 400th time step. It is at the 560th time step, decreases to at the 675th time step, increases to at the 773th time step, decreases to 4000th time step, and then is approximately constant to the 10,000th time step. At the 1st time step, driver anticipation at 1500 m is , increases to at the 100th time step, and then decreases to at the 361st time step. It is at the 500th time step, decreases to at the 675th time step, and then increases to at the 790th time step. At the 4000th time step, driver anticipation is and is approximately constant to the 10,000th time step. At the 1st time step, driver anticipation at 1600 m is , increases to at the 100th time step, and then decreases to at the 350th time step. It is at the 500th time step, decreases to at the 675th time step, and then increases to at the 780th time step. At the 4000th time step, it is and is approximately constant to the 10,000th time step. These results show that driver anticipation with the PW model is higher than with the proposed model, and this produces larger traffic variations. Further, there are oscillations that indicate the PW model is not stable.
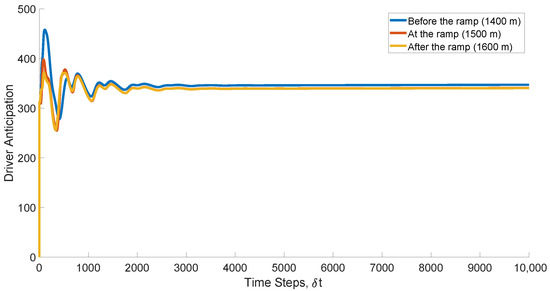
Figure 10.
Driver anticipation in poor visibility with the PW model on a 3000 m circular road before (1400 m), at (1500 m), and after (1600 m) the ramp.
Figure 11 gives the average peak-to-peak density with the PW model in poor visibility versus the relaxation time on a 3000 m circular road. For relaxation time b, the average peak-to-peak density is and decreases to at , at , at , at , and at . It is for a relaxation time greater than . Thus, the variations in density decrease as the relaxation time increases. Further, the variations are greater than with the proposed model.
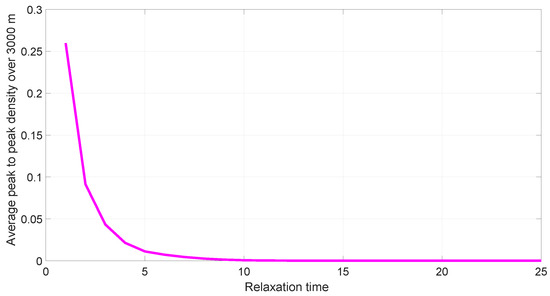
Figure 11.
Average peak-to-peak density in poor visibility with the PW model on a 3000 m circular road versus the relaxation time.
Figure 12 presents the normalized density and velocity in poor visibility with the PW model for relaxation time b, , and on a 3000 m circular road with a ramp at 1500 m. This shows that for relaxation time b, the density is at 10 m and decreases to at 500 m, at 850 m, and at 1300 m. It increases to at 2300 m and then decreases to at m. For relaxation time , the density is at 10 m, increases to at 1000 m, and is at 1470 m. It then decreases at the ramp (1500 m) and is at 2000 m. For relaxation time , the density is at 10 m and is approximately constant to 1450 m. It decreases at the ramp (1500 m) and is at 2000 m. These results show that the density for all values of relaxation time is within the minimum and maximum of 0 and 1, respectively. Further, the variations decrease as the relaxation time increases. However, the density with the PW model is more oscillatory than with the proposed model as shown in Figure 6. For relaxation time b, the velocity with the PW model in poor visibility is m/s at 10 m, decreases to m/s at 210 m, and is m/s at 850 m. It is m/s at 1200 m and m/s at 1490 m. The velocity decreases after the ramp (1500 m) and is m/s at 1740 m. For relaxation time and , the variations in velocity are small, and the velocities are within the minimum and maximum of 0 and 20 m/s, respectively. However, for relaxation time b, the velocity does not stay within these limits, which indicates unrealistic behavior. This is due to the larger driver anticipation as shown in Figure 10.
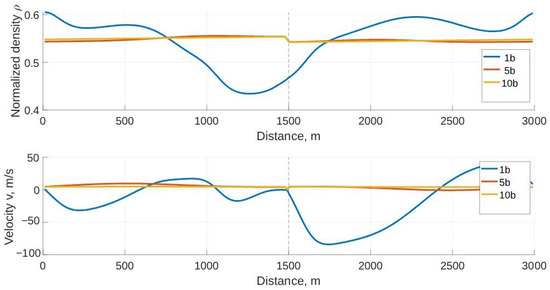
Figure 12.
Normalized density and velocity with the PW model in poor visibility on a 3000 m circular for relaxation time b, , and .
The results above indicate that the PW model produces large driver anticipation values, resulting in negative velocities, which is impossible. In addition, there are large variations in the peak-to-peak density compared to the proposed model. This is because the proposed model incorporates driver anticipation, which provides stable traffic behavior before, at, and after the ramp. Further, the PW model does not capture the effects of visibility as it employs a constant parameter that does not reflect real-world traffic. On the other hand, the proposed model accounts for visibility related effects to accurately characterize traffic flow, in particular, at a ramp.
4.3. Traffic in Good Visibility
The performance of the proposed and PW models is now assessed in good visibility ( m), corresponding to thin fog [54], and the constant for the PW model is m/s. The relaxation time is 2 s, which is shorter than in poor visibility. Following vehicles maintain higher speeds as driver response is quicker, so m/s. The simulation parameters are given in Table 2.

Table 2.
Simulation parameters for the proposed and PW models in good visibility.
Figure 13 gives driver anticipation for the proposed model before the ramp (1400 m), at the ramp (1500 m), and after the ramp (1600 m) in good visibility. At the 1st time step, driver anticipation at 1400 m is , and at the 100th time step it is . It is at the 2000th time step and at the 5000th time step, and then is approximately constant to the 1000th time step. At the 1st time step, driver anticipation at 1500 m is and increases to at the 2000th time step. It is at the 5000th time step and is approximately constant to the 1000th time step. At the 1st time step, driver anticipation is at 1600 m and increases to at the 2000th time step. It is at the 5000th time step and is approximately constant to the 10,000th time step. Driver anticipation is smaller at 1500 m than at 1400 m but is larger at 1600 m. Figure 2 and Figure 13 give driver anticipation in poor and good visibility, respectively. These results show that in good visibility, driver anticipation is increasing by the 3000th time step, but in poor visibility, there are significant variations. Thus, driver response in poor weather conditions is challenging.
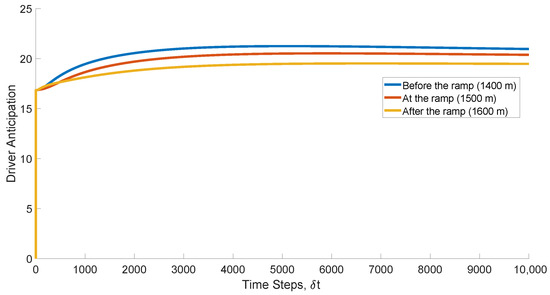
Figure 13.
Driver anticipation with the proposed model at 1400 m (before the ramp), 1500 m (at the ramp), and 1600 m (after the ramp) on a 3000 m circular road in good visibility.
Figure 14 presents the normalized density and velocity with the proposed model for safe time headway , , and on a 3000 m circular road with a ramp at 1500 m in good visibility. This shows that for safe time headway , the density is at 10 m and increases to at 500 m and at 800 m. It is at 1300 m and decreases to at the ramp (1500 m), and is at 1700 m. The density increases to at 2000 m and then decreases to at 2500 m. For safe time headway , the density is at 10 m, increases to at 1400 m, and then decreases to after the ramp at 1640 m. It is at 2500 m and decreases to at 2500 m. At safe time headway , the density is at 10 m, increases to at 1380 m, and then decreases to at 2000 m. The density for all safe time headway values is within the minimum and maximum of 0 and 1, respectively. Further, the variations are smaller for and than for . The velocity at safe time headway is m/s at 10 m, decreases to m/s at 700 m, and then increases to at 1250 m. It is m/s at 1490 m (before the ramp), and increases to m/s at 2500 m. At safe time headway , the velocity is m/s at 10 m, decreases to m/s at 1340 m, and then increases to m/s at 1300 m. It is m/s at 1490 m (before the ramp), and increases to m/s at 2000 m. At safe time headway , the velocity is m/s at 10 m, and decreases to m/s at 1340 m and m/s at 1490 m. It is m/s at 1700 m and increases to m/s at 2000 m. These results show that the velocity is within the minimum and maximum of 0 and 20 m/s, respectively, for all safe time headway values. Further, the variations decrease as the safe time headway increases.
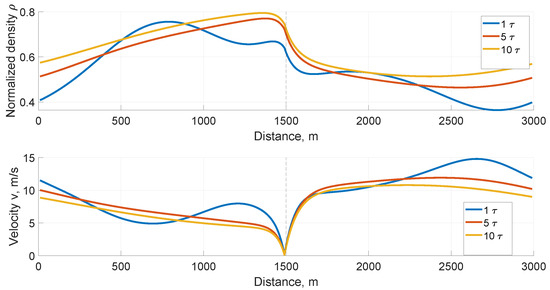
Figure 14.
Normalized density and velocity with the proposed model on a 3000 m circular for safe time headway , , and in good visibility.
Figure 6 and Figure 14 show that for safe time headway , the velocity decreases before the ramp, as expected. However, the velocity with the proposed model is smoother near the ramp. In poor visibility, there are greater variations in the velocity. For safe time headway , the density in poor visibility increases significantly before the ramp and then decreases quickly, while in good visibility, the changes are more gradual. For safe time headway , the variations are smaller with both models, but the results are smoother in good visibility.
Figure 15 presents the normalized density with the proposed model before the ramp, at the ramp, and after the ramp on a 3000 m circular road in good visibility. At 1400 m (before the ramp), the density is at the 1st time step and increases to at the 200th time step. It is at the 3000th time step and is approximately constant to the 7000th time step before decreasing to at the 10,000th time step. At 1500 m (at the ramp), the density is at the 1st time step and increases to at the 500th time step. It is at the 5000th time step and is approximately constant to the 8000th time step. At 1600 m (after the ramp), the density is at the 1st time step and increases to at the 500th time step. It is at the 6000th time step and is approximately constant to the 10,000th time step. These results indicate that in good visibility, the density before the ramp, at the ramp, and after the ramp increases until about the 4000th time step and is smooth. In poor visibility, Figure 3 shows that the density has greater variability with more abrupt changes.
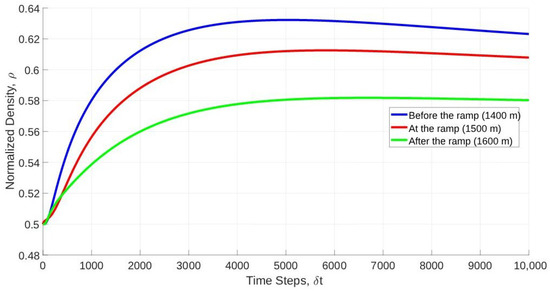
Figure 15.
Normalized density with the proposed model at 1400 m (before the ramp), 1500 m (at the ramp), and 1600 m (after the ramp) on a 3000 m circular road in good visibility.
Figure 16 gives the velocity with the proposed model before, at, and after the ramp on a 3000 m circular road in good visibility. At 1400 m (before the ramp), the velocity is m/s at the 1st time step and decreases to m/s at the 2000th time step. It is m/s at the 4000th time step and is approximately constant to the 10,000th time step. At 1500 m (at the ramp), the velocity is m/s at the 1st time step and decreases to m/s at the 300th time step. It is at the 2000th time step and is approximately constant to the 1000th time step. At 1600 m (after the ramp), the velocity is m/s at the 1st time step, decreases to m/s at the 2000th time step, and is approximately constant to the 1000th time step. These results show that before, at, and after the ramp the velocity varies little after the 2000th time step. Further, in good visibility the velocity is smooth at all road locations, but in poor visibility, Figure 4 indicates there is greater variability. Before the ramp, the velocity decreases, and at the ramp, it decreases further within a few time steps. After the ramp, it increases significantly, which indicates there is congestion at the ramp, which later dissipates.
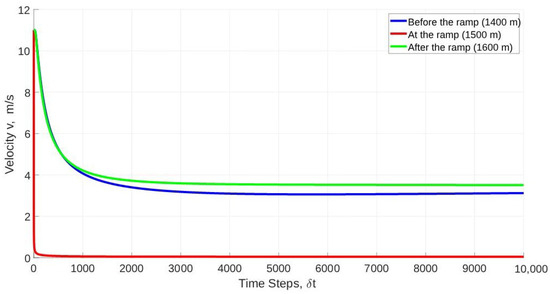
Figure 16.
Velocity with the proposed model at 1400 m (before the ramp), 1500 m (at the ramp), and 1600 m (after the ramp) on a 3000 m circular road in good visibility.
Figure 17 gives the velocity with the proposed model on a 3000 m circular road with a ramp at 1500 m for 100 s in good visibility. This shows that the velocity is smooth before the ramp (0 m to 1500 m), and after the ramp (1500 m to 3000 m), but is slower before 1500 m. The velocity is within the minimum and maximum of 0 and 20 m/s, respectively, so the proposed model is stable. The velocity is not as smooth in poor visibility as shown in Figure 9, but traffic is still slower before the ramp. Figure 18 presents the corresponding velocity with the PW model for 300 s. This shows that the velocity becomes negative with a minimum of m/s, while the maximum is m/s. Thus, the velocity does not stay within the minimum and maximum, so the results are inaccurate and unrealistic.
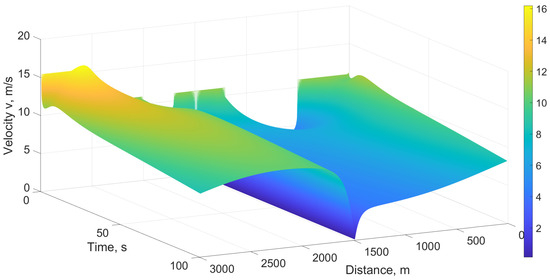
Figure 17.
Velocity with the proposed model on a 3000 m circular road for 100 s in good visibility.
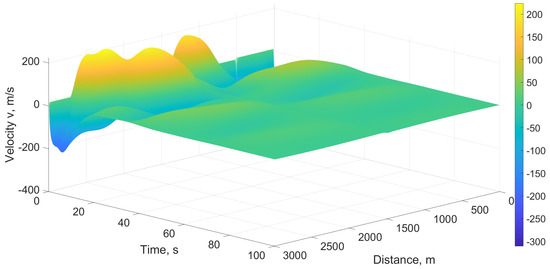
Figure 18.
Velocity with the PW model in good visibility on a 3000 m circular road for 100 s with m/s.
Figure 19 presents the segment travel time (STT) with the proposed model on a 3000 m circular road with a ramp at 1500 m. At the 1350th time step, the STT at 1200 m is s and increases to s at the ramp. At the 9000th time step, it is s at 1000 m and increases to s at 1230 m, s at 1400 m, and s at 1470 m. The maximum is 1985 s at the ramp. This increase in STT as vehicles approach the ramp is realistic as it indicates congestion just before the ramp, as expected. Figure 20 gives the corresponding STT with the PW model. At the 1350th time step, the STT at 1200 m is s, which is impossible. At the ramp (1500 m), it is only s. At the 9000th time step, the STT is s at 1000 m, s at 1230 m, s at 1400 m, s at 1470 m, and then s at the ramp. However, it is −12,800,000 s at 1470 m and time step 3555 and 1,509,000 s at 2860 m and time step 6022. Thus, the proposed model provides realistic and meaningful results, whereas the results with the PW model are unstable and incorrect.
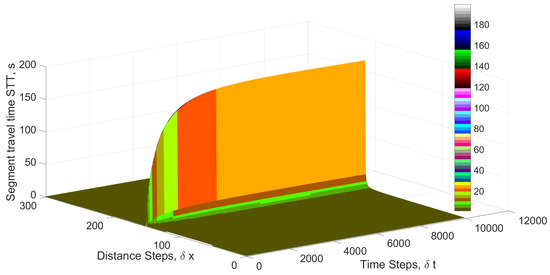
Figure 19.
The segment travel time (STT) with the proposed model on a 3000 m circular road for 100 s in good visibility.
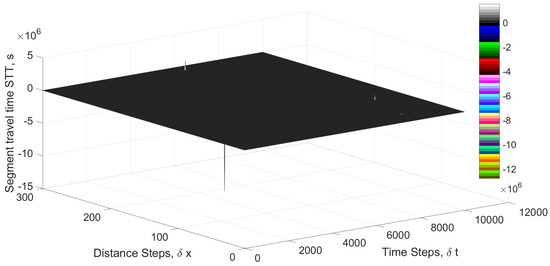
Figure 20.
The segment travel time (STT) with the PW model on a 3000 m circular road for 100 s in good visibility.
The total variation of the velocity, density, and driver anticipation with the proposed and PW models is given in Table 3. This shows that the velocity total variation with the proposed model is more than two orders of magnitude lower, which indicates significantly better numerical stability. The density and driver anticipation total variation are also lower than with the PW model. These results confirm that the proposed model provides more consistent results which are smoother. Further, there are no abrupt changes as with the PW model.

Table 3.
Total variation with the proposed and PW models.
5. Discussion
The performance of the proposed and PW models was evaluated in both good and poor visibility, and the PW model was assessed using two speed constants m/s and m/s. The results obtained indicate that the proposed model provides more realistic and accurate results in both visibility conditions compared to the PW model. In particular, the density and velocity were within the maximum and minimum, whereas the PW model produced negative and very high velocities. Furthermore, the STT with the PW model had impossible values. The density, velocity, and driver anticipation total variation were lower with the proposed model, which confirms that it is more stable.
In good visibility, the proposed model provides smooth and consistent driver anticipation at all road locations. In poor visibility, it increases before the ramp and decreases after the ramp, as expected. Conversely, driver anticipation with the PW model is unstable and oscillatory. The proposed model also provides smooth changes in velocity consistent with traffic evolution and behavior at a ramp. In poor visibility ( m), the maximum velocity is approximately 30% lower than in good visibility. This aligns with the observation in [58] that drivers reduce their speed in fog by 30%. The TTC based on driver anticipation was used in the proposed model to provide realistic traffic behavior in foggy conditions. This model is supported by the results in [59], which show that drivers delay gas pedal release and braking in poor visibility. The PW model was shown to be unsuitable for foggy conditions. It overestimates speeds and produces unrealistic results. This is because driver anticipation is ignored in this model, leading to instability, particularly at ramps and bottlenecks. With the proposed model, the density is smooth and increases before ramps and then decreases. In poor visibility, there is greater congestion as indicated in [60]. The STT is smaller before and after the ramp, as expected. With the PW model, the STT has extreme values that are not possible.
6. Conclusions
This paper introduced a macroscopic traffic flow model that incorporates both visibility distance and time to collision (TTC) to accurately characterize traffic in foggy conditions. A TTC model was obtained from simulated driving data to provide realistic driver response to the visibility conditions. The well-known Payne–Witham (PW) model does not consider driver anticipation, so the response is the same regardless of the visibility. This results in large anticipation values and unrealistic traffic behavior such as very large and negative velocities. With the proposed model, driver anticipation varies according to the conditions, as expected. As a result, the velocity and normalized density were stable and within the minimum and maximum. These results indicate that the proposed approach provides more accurate, robust, and realistic traffic behavior in poor visibility. Thus, it is more suitable for planning traffic control strategies, designing V2X communication protocols, and improving autonomous vehicle behavior. Future research can consider adverse weather such as rain and snow, and the corresponding friction with the road. Model calibration is constrained by the availability and scope of traffic data, so additional data should be obtained to improve the generalizability of the model.
Author Contributions
Conceptualization, Z.H.K.; Methodology, K.S.K. and T.A.G.; Software, Z.H.K. and K.S.K.; Formal analysis, Z.H.K., K.S.K. and T.A.G.; Investigation, Z.H.K. and K.S.K.; Writing—original draft, Z.H.K.; Writing—review & editing, T.A.G.; Visualization, Z.H.K.; Supervision, T.A.G. All authors have read and agreed to the published version of the manuscript.
Funding
This research received no external funding.
Data Availability Statement
The original contributions presented in this study are included in the article. Further inquiries can be directed to the corresponding author.
Conflicts of Interest
The authors declare no conflicts of interest.
References
- Liu, H.; Sun, J. An extended car-following model considering the driver’s field of view. Nonlinear Dyn. 2012, 70, 1441–1452. [Google Scholar]
- Saifuzzaman, M.; Zheng, Z. Human factors affecting the behavior of drivers during car-following: A literature review. Transp. Res. Part C Emerg. Technol. 2014, 48, 379–403. [Google Scholar] [CrossRef]
- Zhou, M.; Ma, W. A new car-following model based on the driver’s visual horizon. Phys. A Stat. Mech. Its Appl. 2015, 419, 693–702. [Google Scholar]
- Michaels, R. Perceptual factors in car following. In Proceedings of the International Symposium on the Theory of Road Traffic Flow; Organisation for Economic Co-Operation and Development: London, UK, 1963; pp. 44–59. [Google Scholar]
- Michaels, R.; Cozan, L. Perceptual and field factors causing lateral displacement. Highw. Res. Rec. 1963, 25, 1–13. [Google Scholar]
- Hoffmann, E.R.; Mortimer, R.G. Scaling of relative velocity between vehicles. Accid. Anal. Prev. 1996, 28, 415–421. [Google Scholar] [CrossRef]
- Kesting, A.; Treiber, M.; Helbing, D. General lane-changing model MOBIL for car-following models. Transp. Res. Rec. 2007, 1999, 86–94. [Google Scholar] [CrossRef]
- Treiber, M.; Hennecke, A.; Helbing, D. Congested traffic states in empirical observations and microscopic simulations. Phys. Rev. E 2000, 62, 1805. [Google Scholar] [CrossRef] [PubMed]
- Brackstone, M.; McDonald, M. Car-following: A historical review. Transp. Res. Part F Traffic Psychol. Behav. 1999, 2, 181–196. [Google Scholar] [CrossRef]
- Ahmed, K.I. Modeling Drivers’ Acceleration and Lane Changing Behavior. Ph.D. Thesis, Massachusetts Institute of Technology, Cambridge, MA, USA, 1999. [Google Scholar]
- Federal Highway Administration. Weather Related Crash Statistics. U.S. Department of Transportation. 2020. Available online: https://ops.fhwa.dot.gov/weather/q1_roadimpact.htm (accessed on 27 June 2025).
- Arab News. 54 Vehicles Crash in Dammam Due to Heavy Fog. Arab News. 25 January 2015. Available online: https://www.arabnews.com/node/695816 (accessed on 27 June 2025).
- Al-Ghamdi, A.S.; AlGadhi, S.A.H. Warning system for reducing fog-related crashes in the Kingdom of Saudi Arabia. Accid. Anal. Prev. 2004, 36, 729–735. [Google Scholar]
- Peng, Y.; Abdel-Aty, M.; Shi, Q.; Yu, R. Assessing the impact of reduced visibility on traffic crash risk using microscopic data and surrogate safety measures. Transp. Res. Part C Emerg. Technol. 2017, 74, 295–405. [Google Scholar] [CrossRef]
- Ni, R.; Kang, J.J.; Andersen, G.J. Age related declines in car following performance under simulated fog conditions. Accid. Anal. Prev. 2010, 42, 818–826. [Google Scholar] [CrossRef]
- Mueller, A.S.; Trick, L.M. Driving in fog: The effects of driving experience and visibility on speed compensation and hazard avoidance. Accid. Anal. Prev. 2012, 48, 472–479. [Google Scholar] [CrossRef]
- Rosey, F.; Aillerie, I.; Espie, S.; Vienne, F. Driver behaviour in fog is not only a question of degraded visibility—A simulator study. Saf. Sci. 2007, 95, 50–61. [Google Scholar] [CrossRef]
- Wagner, P.; Nagel, K.; Wolf, D.E. Realistic multi-lane traffic rules for cellular automata. Phys. A Stat. Mech. Its Appl. 1997, 234, 687–698. [Google Scholar] [CrossRef]
- Zhu, W.-X.; Yu, R.-L. A new car-following model considering the related factors of a gyroidal road. Phys. A 2014, 393, 101–111. [Google Scholar] [CrossRef]
- Regragui, Y.; Moussa, N. A cellular automata model for urban traffic with multiple roundabouts. Chin. J. Phys. 2018, 56, 1273–1285. [Google Scholar] [CrossRef]
- Emmerich, H.; Nagatani, T.; Nakanishi, K. From modified KdV-equation to a second-order cellular automaton for traffic flow. Phys. A 1998, 254, 548–556. [Google Scholar] [CrossRef]
- Peng, G.-H.; Cheng, R.-J. A new car-following model with the consideration of anticipation optimal velocity. Phys. A 2013, 392, 3563–3569. [Google Scholar] [CrossRef]
- Ma, G.; Ma, M.; Liang, S.; Wang, Y.; Zhang, Y. An improved car-following model accounting for the time-delayed velocity difference and backward looking effect. Commun. Nonlinear Sci. Numer. Simul. 2020, 85, 105221. [Google Scholar] [CrossRef]
- Ge, H.-X.; Cheng, R.-J. The ‘backward looking’ effect in the lattice hydrodynamic model. Phys. A 2008, 387, 6952–6960. [Google Scholar] [CrossRef]
- Lighthill, M.J.; Whitham, G.B. On kinematic waves II. A theory of traffic flow on long crowded roads. Proc. R. Soc. Lond. Ser. A Math. Phys. Sci. 1955, 229, 317–345. [Google Scholar]
- Richards, P.I. Shock waves on the highway. Oper. Res. 1956, 4, 42–51. [Google Scholar] [CrossRef]
- Daganzo, C. Requiem for second-order fluid approximations of traffic flow. Transp. Res. Part B Methodol. 1995, 29, 277–286. [Google Scholar] [CrossRef]
- Maerivoet, S.; Moor, B.D. Transportation Planning and Traffic Flow Models; Katholieke Universiteit Leuven: Leuven, Belgium, 2008. [Google Scholar]
- Liu, G.; Lyrintzis, A.; Michalopoulos, P. Improved high-order model for freeway traffic flow. Transp. Res. Rec. J. Transp. Res. Board 1998, 1644, 37–46. [Google Scholar] [CrossRef]
- Jiang, R.; Wu, Q.; Zhu, Z. A new continuum model for traffic flow and numerical tests. Transp. Res. Part B Methodol. 2002, 36, 405–419. [Google Scholar] [CrossRef]
- Bonzani, I.; Mussone, L. On the derivation of the velocity and fundamental traffic flow diagram from the modelling of the vehicle–driver behaviors. Math. Comput. Model. 2009, 50, 1107–1112. [Google Scholar] [CrossRef]
- Khan, Z.H.; Gulliver, T.A. A macroscopic traffic model based on transition velocities. J. Comput. Sci. 2020, 43, 101131. [Google Scholar] [CrossRef]
- Greenberg, H. An analysis of traffic flow. Oper. Res. 1959, 7, 79–85. [Google Scholar] [CrossRef]
- Salter, R.J. The relationship between speed, flow and density of a highway traffic stream. In Highway Traffic Analysis and Design; Macmillan Education: London, UK, 1996; pp. 119–130. [Google Scholar]
- Khan, Z.H.; Imran, W.; Azeem, S.; Khattak, K.S.; Gulliver, T.A.; Aslam, M.S. A macroscopic traffic model based on driver reaction and traffic stimuli. Appl. Sci. 2019, 9, 2848. [Google Scholar] [CrossRef]
- Zhang, H. A theory of non-equilibrium traffic flow. Transp. Res. Part B Methodol. 1998, 32, 485–498. [Google Scholar] [CrossRef]
- Payne, H.J. Models of freeway traffic and control. Math. Model. Public Syst. (Simul. Counc. Proc.) 1971, 1, 51–61. [Google Scholar]
- Whitham, G.B. Linear and Nonlinear Waves; Wiley: New York, NY, USA, 1971. [Google Scholar]
- Kühne, R.D.; Rödiger, M.B. Macroscopic simulation model for freeway traffic with jams and stop-start waves. In Proceedings of the Winter Simulation Conference, Phoenix, AZ, USA, 8–11 December 1991; pp. 762–770. [Google Scholar]
- Kerner, B.S.; Konhäuser, P. Cluster effect in initially homogeneous traffic flow. Phys. Rev. E 1993, 48, R2335. [Google Scholar] [CrossRef]
- Papageorgiou, M.; Blosseville, J.-M.; Hadj-Salem, H. Macroscopic modelling of traffic flow on the Boulevard Peripherique in Paris. Transp. Res. Part B Methodol. 1989, 23, 29–47. [Google Scholar] [CrossRef]
- Castillo, J.D.; Pintado, P.; Benitez, F. The reaction time of drivers and the stability of traffic flow. Transp. Res. Part B Methodol. 1994, 28, 35–60. [Google Scholar] [CrossRef]
- Aw, A.; Rascle, M. Resurrection of second order” models of traffic flow. SIAM J. Appl. Math. 2000, 60, 916–938. [Google Scholar] [CrossRef]
- Morgan, J.V. Numerical methods for macroscopic traffic models. Ph.D. Thesis, University of Reading, Berkshire, UK, 2002. [Google Scholar]
- Song, D.; Zhu, B.; Zhao, J.; Han, J. Modeling lane changing spatiotemporal features based on the driving behavior generation mechanism of human drivers. Expert Syst. Appl. 2025, 284, 127974. [Google Scholar] [CrossRef]
- Kiran, B.R.; Sobh, I.; Talpaert, V.; Mannion, P.; Al Sallab, A.A.; Yogamani, S.; Pérez, P. Deep reinforcement learning for autonomous driving: A survey. IEEE Trans. Intell. Transp. Syst. 2022, 23, 4909–4926. [Google Scholar] [CrossRef]
- Zuo, C.; Zhang, X.; Zhao, G.; Yan, L. PCR: A parallel convolution residual network for traffic flow prediction. IEEE Trans. Emerg. Top. Comput. Intell. 2025, 9, 3072–3083. [Google Scholar] [CrossRef]
- Horst, R.V.; Hogema, J. Time to collision and collision avoidance systems. In Proceedings of the ICTCT Workshop, Salzburg, Austria, 27–29 October 1994. [Google Scholar]
- Yu, C.; Zhang, J.; Yao, D.; Zhang, R.; Jin, H. Speed-density model of interrupted traffic flow based on coil data. Mob. Inf. Syst. 2016, 2016, 7968108. [Google Scholar] [CrossRef]
- Toro, E.F. Riemann Solvers and Numerical Methods for Fluid Dynamics: A Practical Introduction; Springer: Berlin/Heidelberg, Germany, 2011. [Google Scholar]
- Toro, E.F.; Hidalgo, A.; Dumbser, M. Force schemes on unstructured meshes I: Conservative hyperbolic systems. J. Comput. Phys. 2009, 228, 3368–3389. [Google Scholar] [CrossRef]
- Kachroo, P.P.E.; Wadoo, S.A.; Al-Nasur, S.J.; Shende, A. Numerical methods. In Pedestrian Dynamics Feedback Control of Crowd Evacuation; Springer: New York, NY, USA, 2008; pp. 61–93. [Google Scholar]
- de Moura, C.A.; Kubrusly, C.S. The Courant–Friedrichs–Lewy (CFL) Condition: 80 Years After Its Discovery; Springer: Berlin/Heidelberg, Germany, 2013. [Google Scholar]
- Ali, F.; Khan, Z.H.; Khattak, K.S.; Gulliver, T.A. The effect of visibility on road traffic during foggy weather conditions. IET Intell. Transp. Syst. 2023, 18, 47–57. [Google Scholar] [CrossRef]
- Campbell, J.L. Speed perception, speed choice, and speed control. In Human Factors Guidelines for Road Systems, 2nd ed.; NCHRP Report 600; Transportation Research Board: Washington, DC, USA, 2012. [Google Scholar]
- Yi, P.; Lu, J.; Zhang, Y.; Lu, H. Safety-based capacity analysis for Chinese highways. IATSS Res. 2004, 28, 47–55. [Google Scholar] [CrossRef][Green Version]
- Basak, K.; Hetu, S.N.; Azevedo, C.L.; Loganathan, H.; Toledo, T.; Ben-Akiva, M. Modeling reaction time within a traffic simulation model. In Proceedings of the IEEE International Conference on Intelligent Transportation Systems, The Hague, The Netherlands, 6–9 October 2013; pp. 302–309. [Google Scholar]
- Yan, X.; Li, X.; Liu, Y.; Zhao, J. Effects of foggy conditions on drivers’ speed control behaviors at different risk levels. Saf. Sci. 2014, 68, 275–287. [Google Scholar] [CrossRef]
- Hogema, J.H.; van der Horst, A.R.A. Driving Behaviour in Fog: A Simulator Study; Report TM 1994 C-7; TNO Human Factors Research Institute: Soesterberg, The Netherlands, 1994. [Google Scholar]
- Peng, Y.; Jiang, Y.; Lu, J.; Zou, Y. Examining the effect of adverse weather on road transportation using weather and traffic sensors. PLoS ONE 2018, 13, e0205409. [Google Scholar] [CrossRef]
Disclaimer/Publisher’s Note: The statements, opinions and data contained in all publications are solely those of the individual author(s) and contributor(s) and not of MDPI and/or the editor(s). MDPI and/or the editor(s) disclaim responsibility for any injury to people or property resulting from any ideas, methods, instructions or products referred to in the content. |
© 2025 by the authors. Licensee MDPI, Basel, Switzerland. This article is an open access article distributed under the terms and conditions of the Creative Commons Attribution (CC BY) license (https://creativecommons.org/licenses/by/4.0/).