Figure 1.
Scaling of classical linear search vs. Grover search. With and (illustrative), the crossover is at . For , the quantum method is asymptotically more efficient.
Figure 1.
Scaling of classical linear search vs. Grover search. With and (illustrative), the crossover is at . For , the quantum method is asymptotically more efficient.
Figure 2.
Hybrid classical–quantum architecture for the transmission and decoding of genomic blocks. The system implements Reed–Solomon coding, MPPM modulation, M-QAM, and CSS, followed by optical detection in the NLOS channel and quantum processing for accurate classification and reconstruction of the transmitted genetic material.
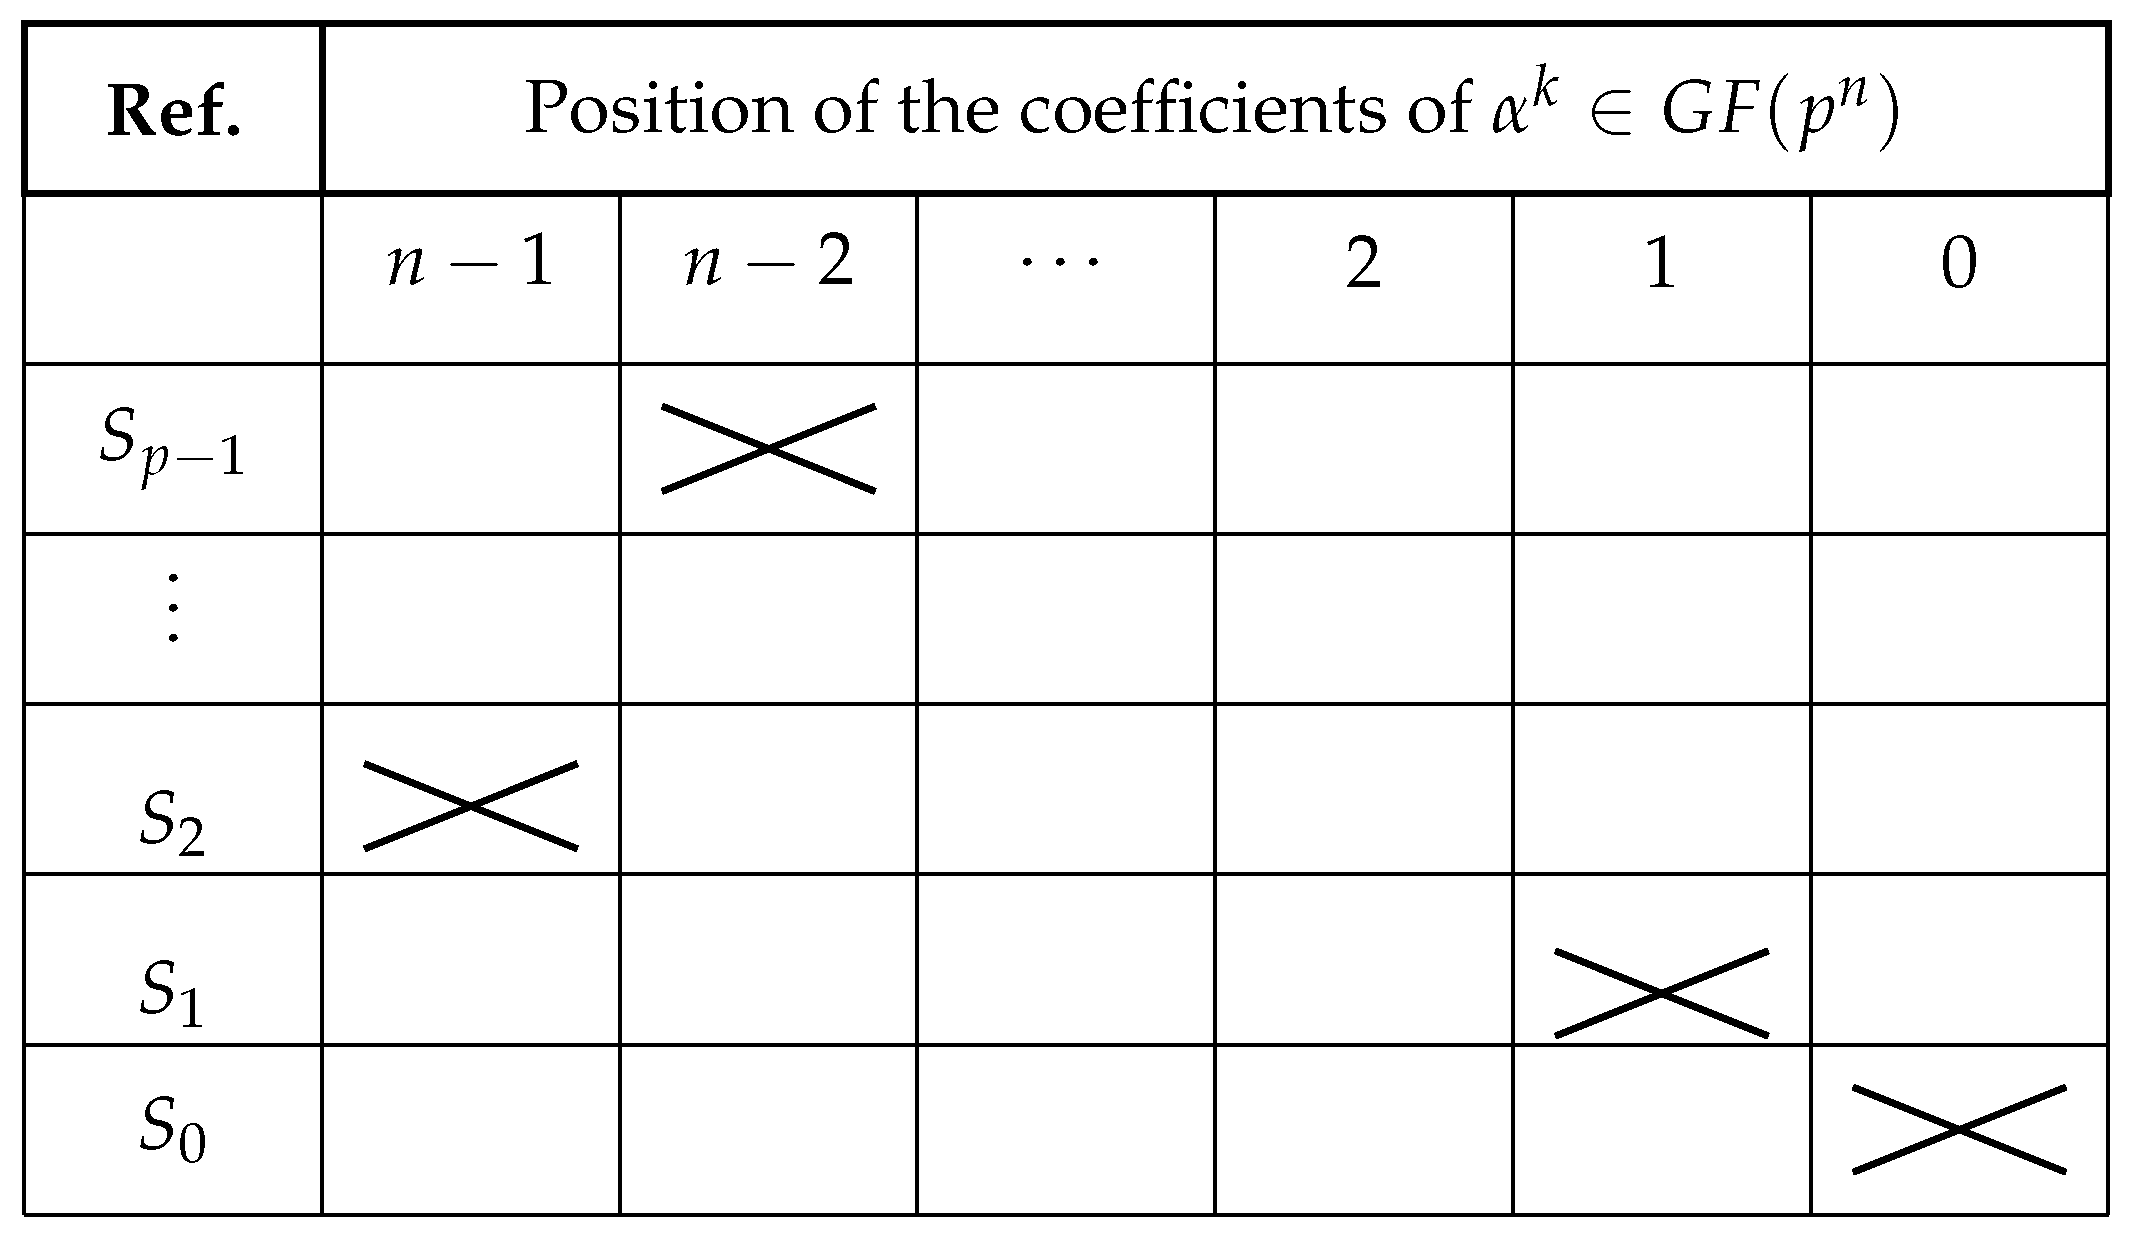
Figure 3.
Matrix illustrating the position of the coefficients in the polynomial representation of an element of . The columns indicate decreasing powers and the rows, different symbols .
Figure 3.
Matrix illustrating the position of the coefficients in the polynomial representation of an element of . The columns indicate decreasing powers and the rows, different symbols .
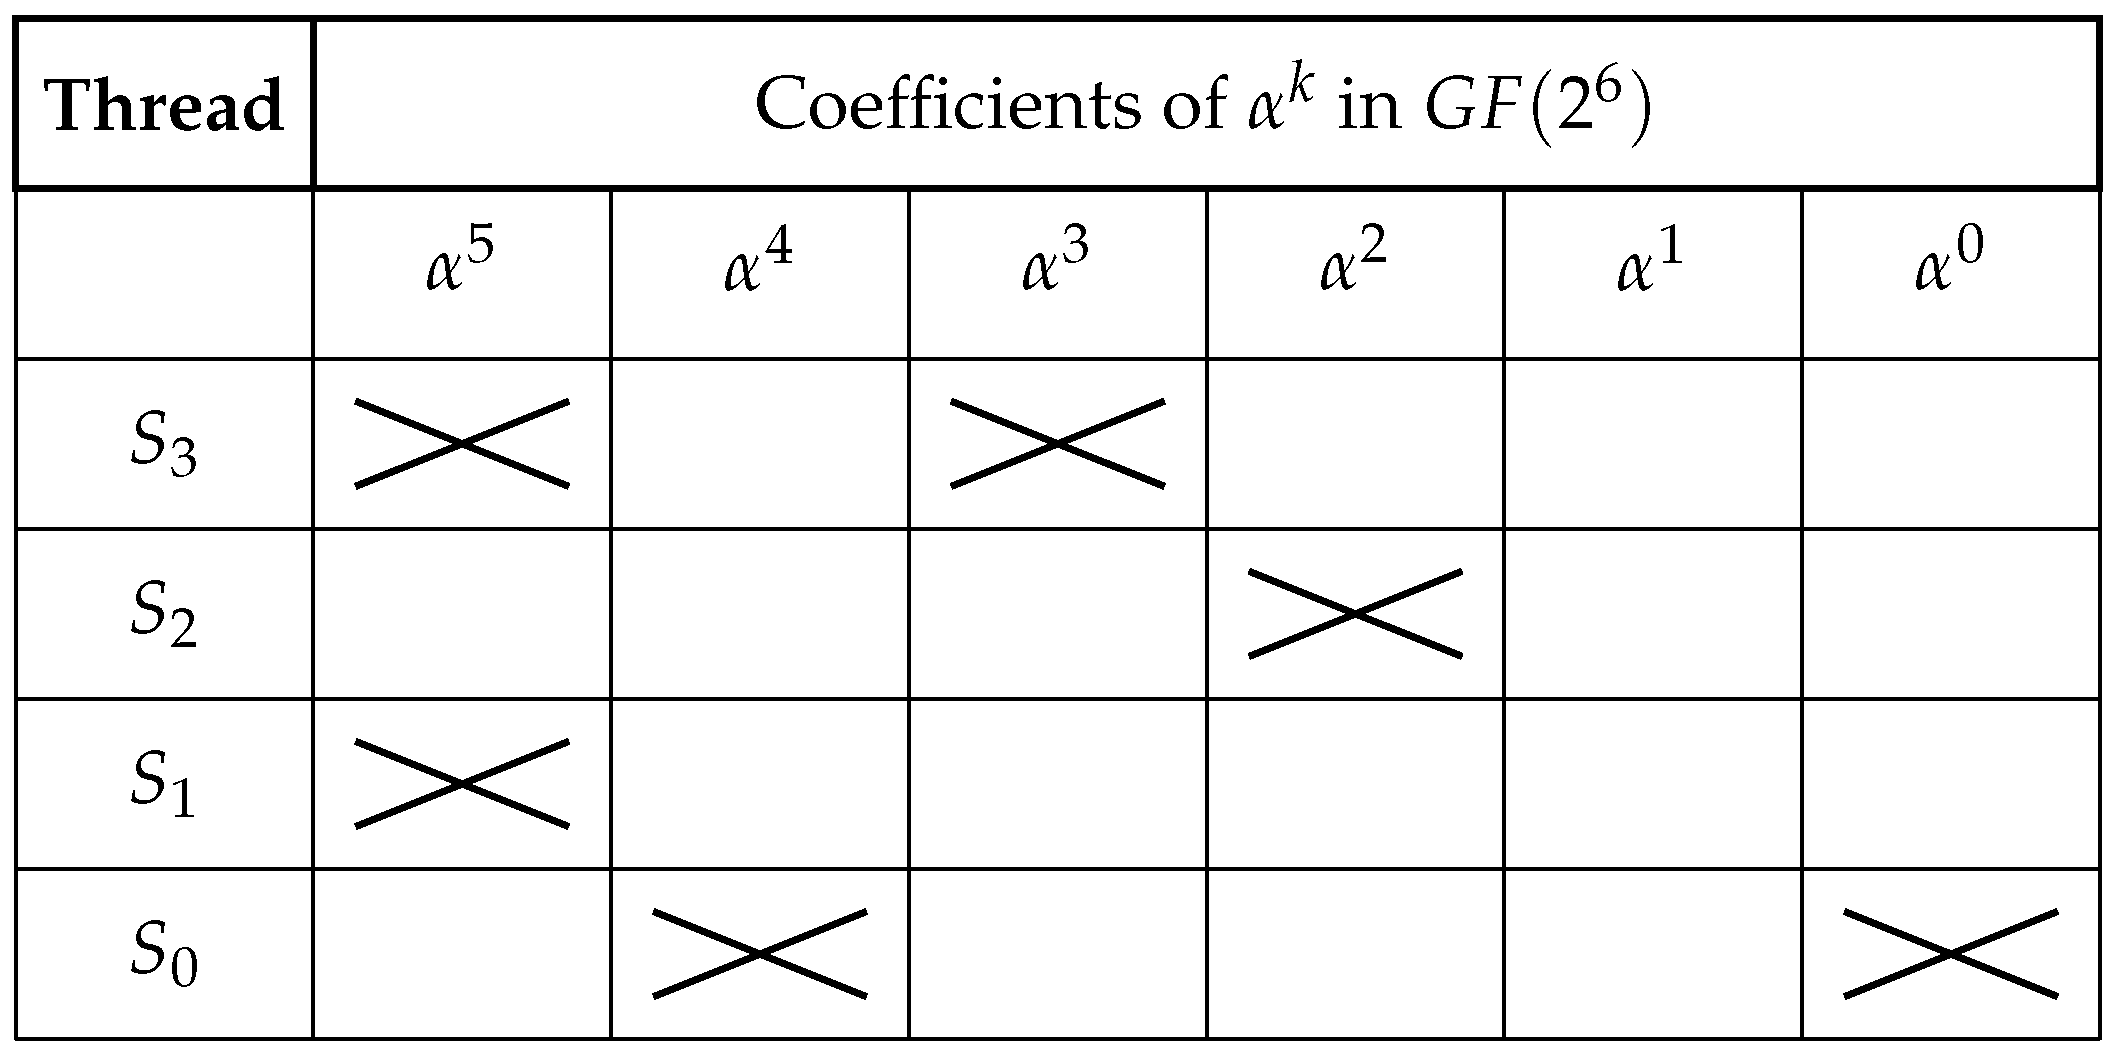
Figure 4.
Polynomial representation matrix of symbols in . Each row represents a strand and each column indicates the power of corresponding to the binary coefficient of the encoded block. The encoded values for each strand are as follows: , , , and . Each row represents a thread and each column indicates the power of corresponding to the binary coefficient of the encoded block. The encoded values for each thread are as follows: , , , and .
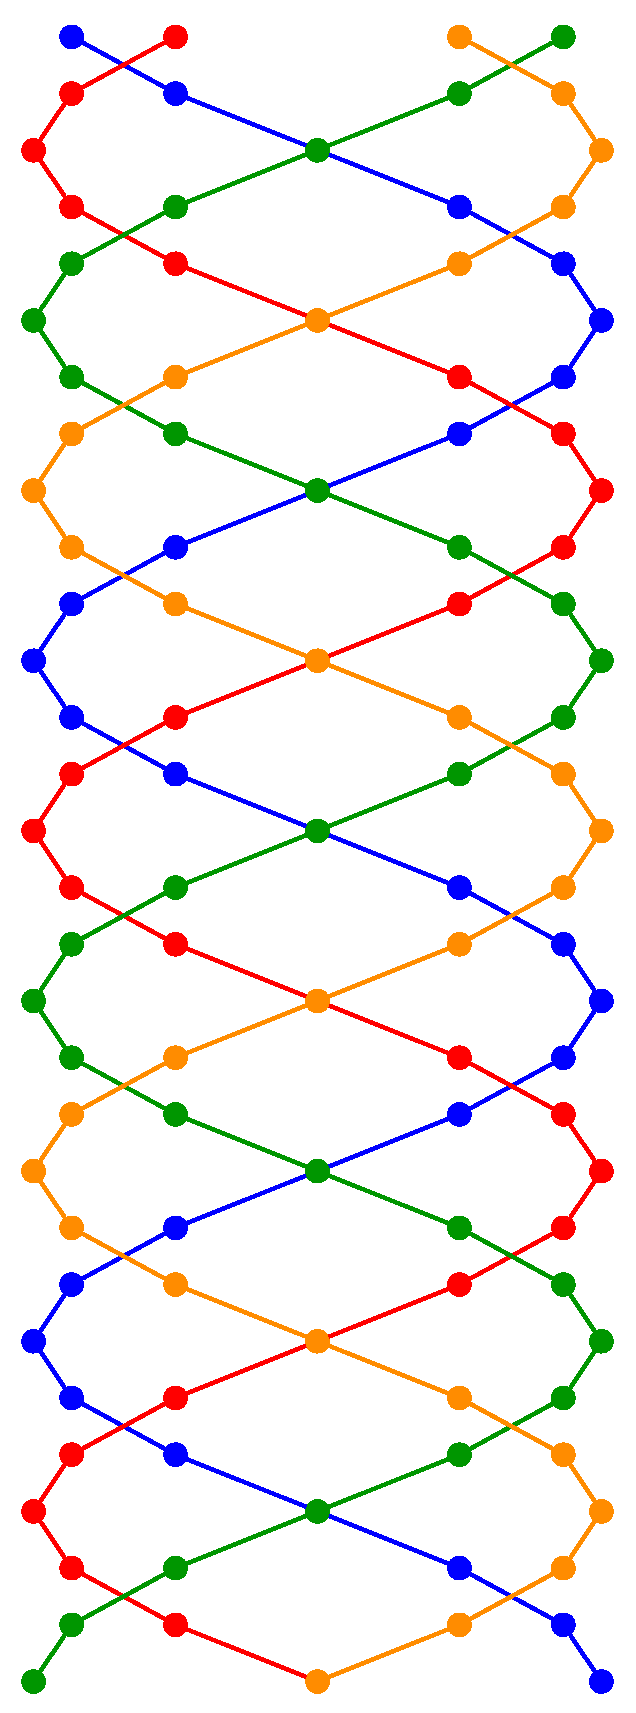
Figure 5.
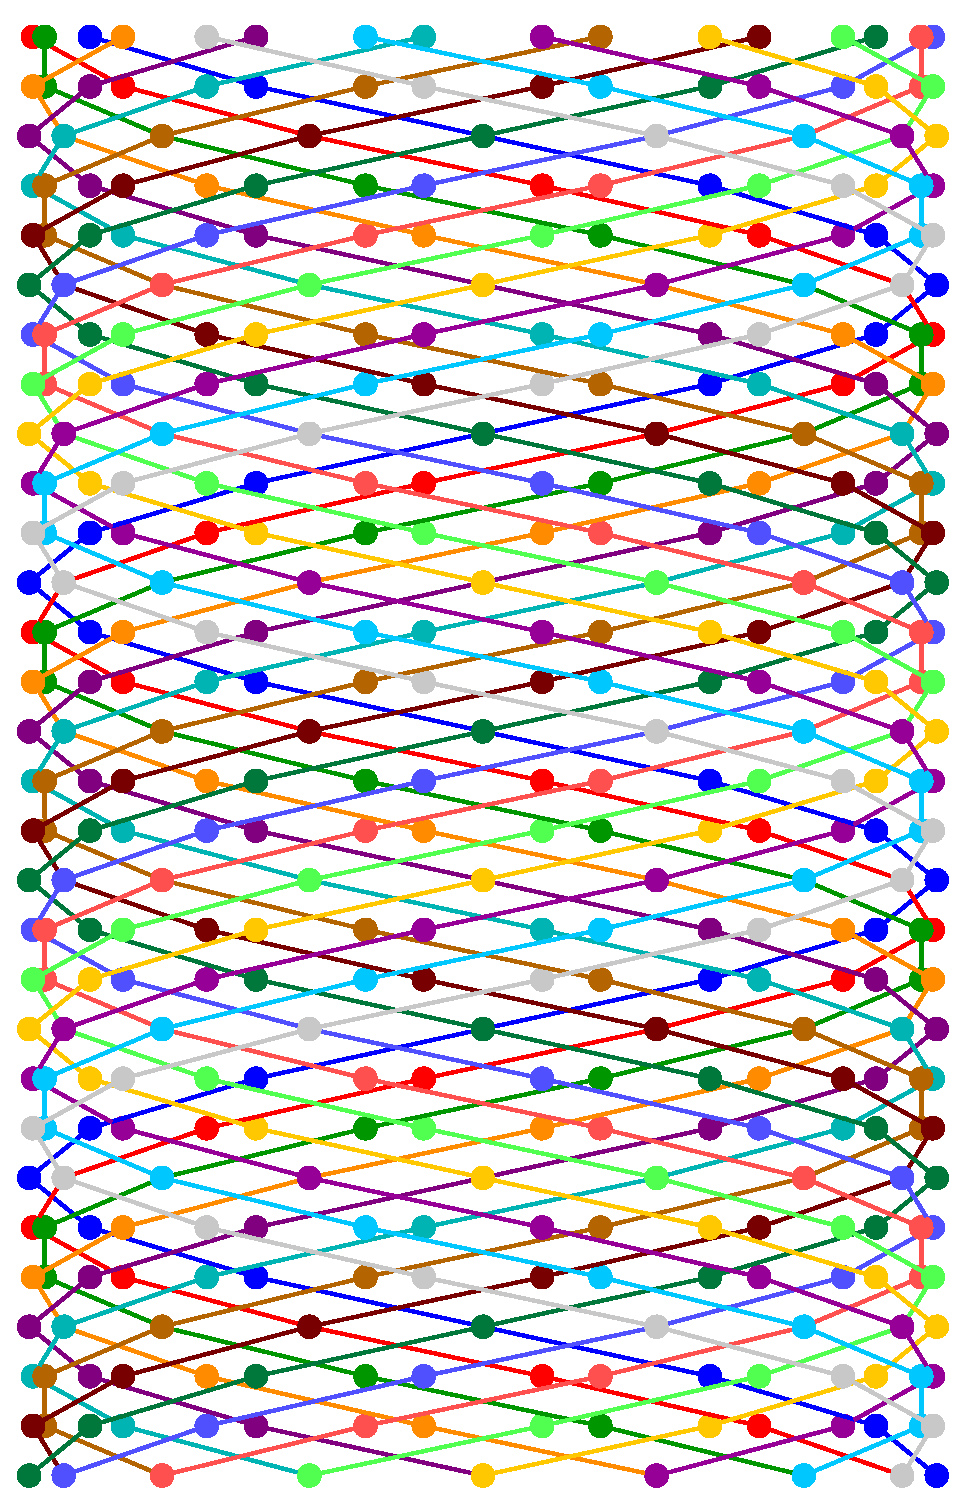
Helical visualization of the digital transmission of blocks encoded in , where each sphere represents a block of three genome bases (6 bits) transmitted by a differentiated strand. This representation illustrates a model of parallel communication through multiple strands, facilitating the encoding and reconstruction of synthetic DNA.
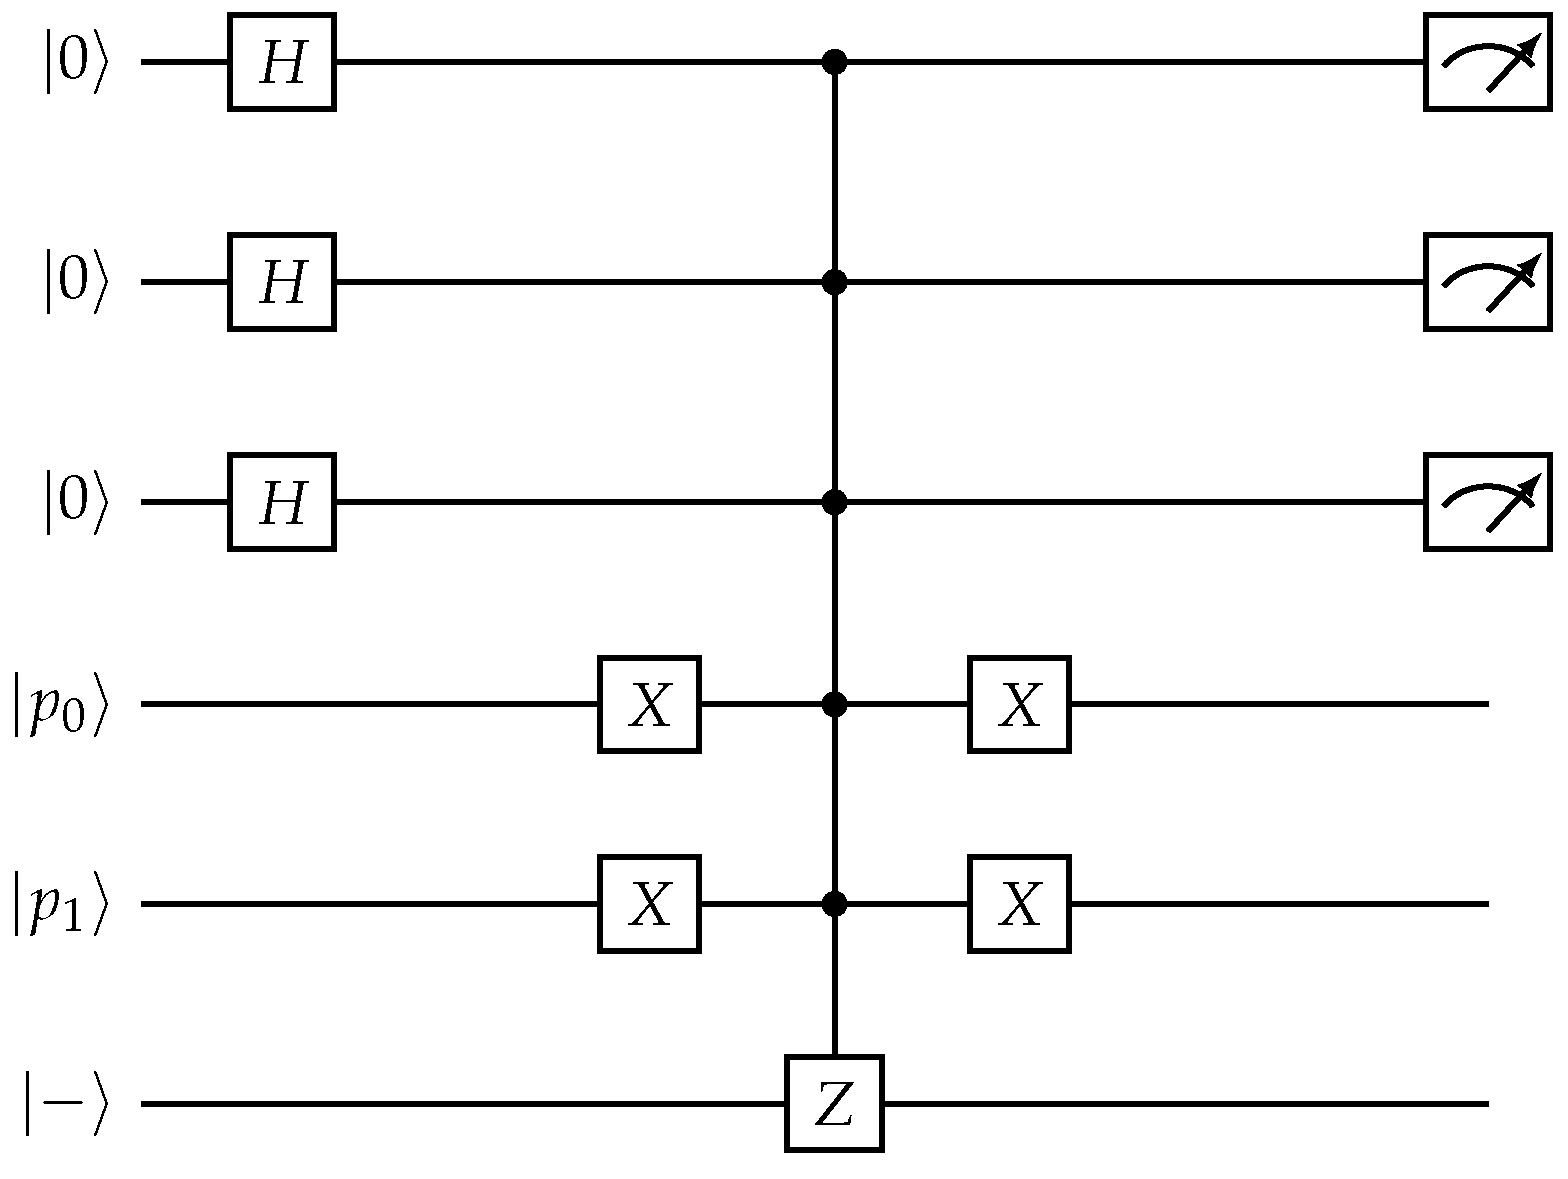
Figure 6.
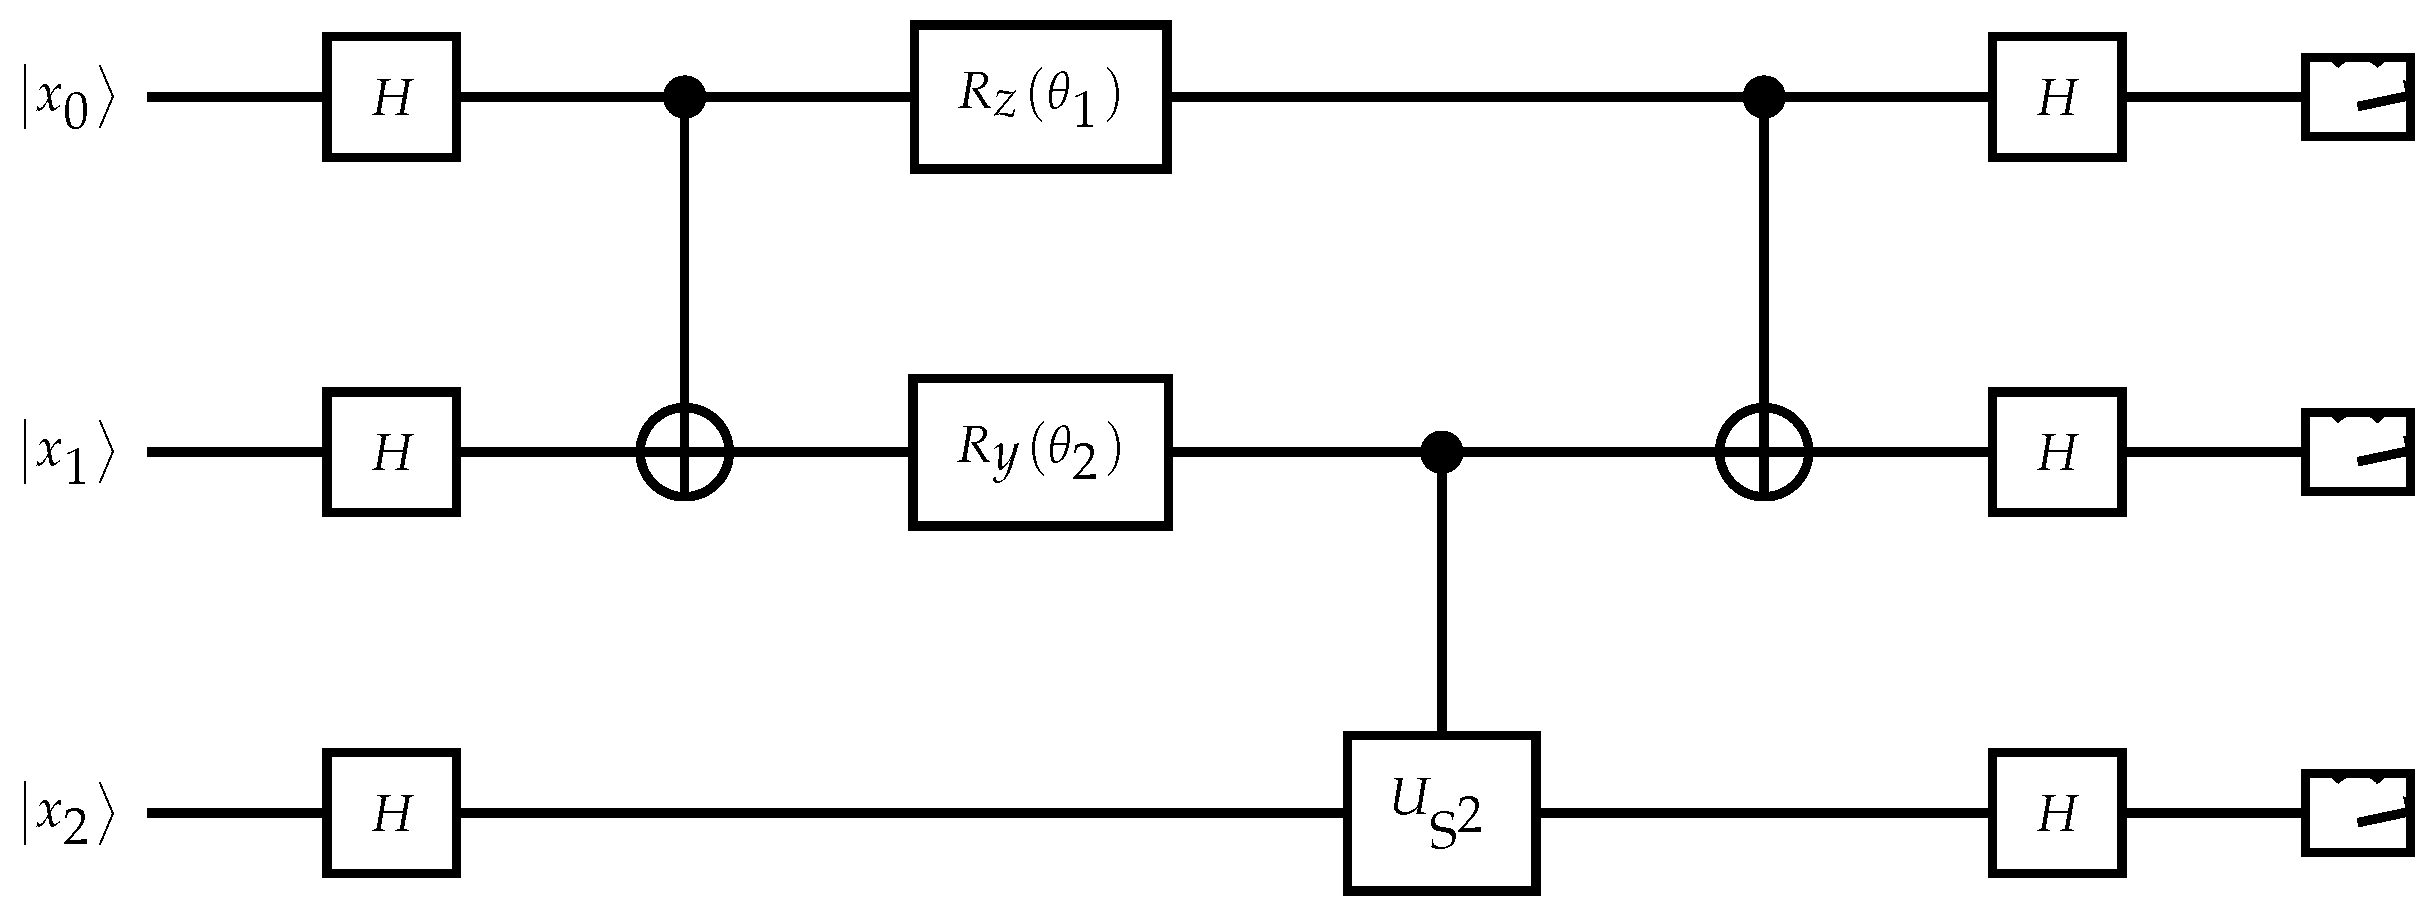
Quantum circuit for Top-L classification via amplitude amplification. Each state represents a candidate symbol; interference selects the most probable.
Figure 6.
Quantum circuit for Top-L classification via amplitude amplification. Each state represents a candidate symbol; interference selects the most probable.
Figure 7.
Quantum list decoding: -CNN-inspired circuit for oracle-based verification of symbol candidates.
Figure 7.
Quantum list decoding: -CNN-inspired circuit for oracle-based verification of symbol candidates.
Figure 8.
Helical visualization of digital transmission using 16 differentiated strands. Each sphere represents a symbol (for example, four bits in 16-QAM) in a parallel channel. This model allows for a massive and parallel architecture for sending data encoded in through multiple synchronized streams.
Figure 9.
Representation of the helical transmission model for different modulation and parallelism schemes.
Figure 9.
Representation of the helical transmission model for different modulation and parallelism schemes.
Figure 10.
Symbol constellation of MPPM(4, 2): each symbol activates two pulses in a frame of four time slots. There are possible combinations.
Figure 10.
Symbol constellation of MPPM(4, 2): each symbol activates two pulses in a frame of four time slots. There are possible combinations.
Figure 11.
BER curves for different modulation and coding techniques over an AWGN channel. The combination RS(4, 2) + MPPM(4, 2) + 16-QAM with Gray coding and CSS achieves the lowest BER across all levels.
Figure 11.
BER curves for different modulation and coding techniques over an AWGN channel. The combination RS(4, 2) + MPPM(4, 2) + 16-QAM with Gray coding and CSS achieves the lowest BER across all levels.
Figure 12.
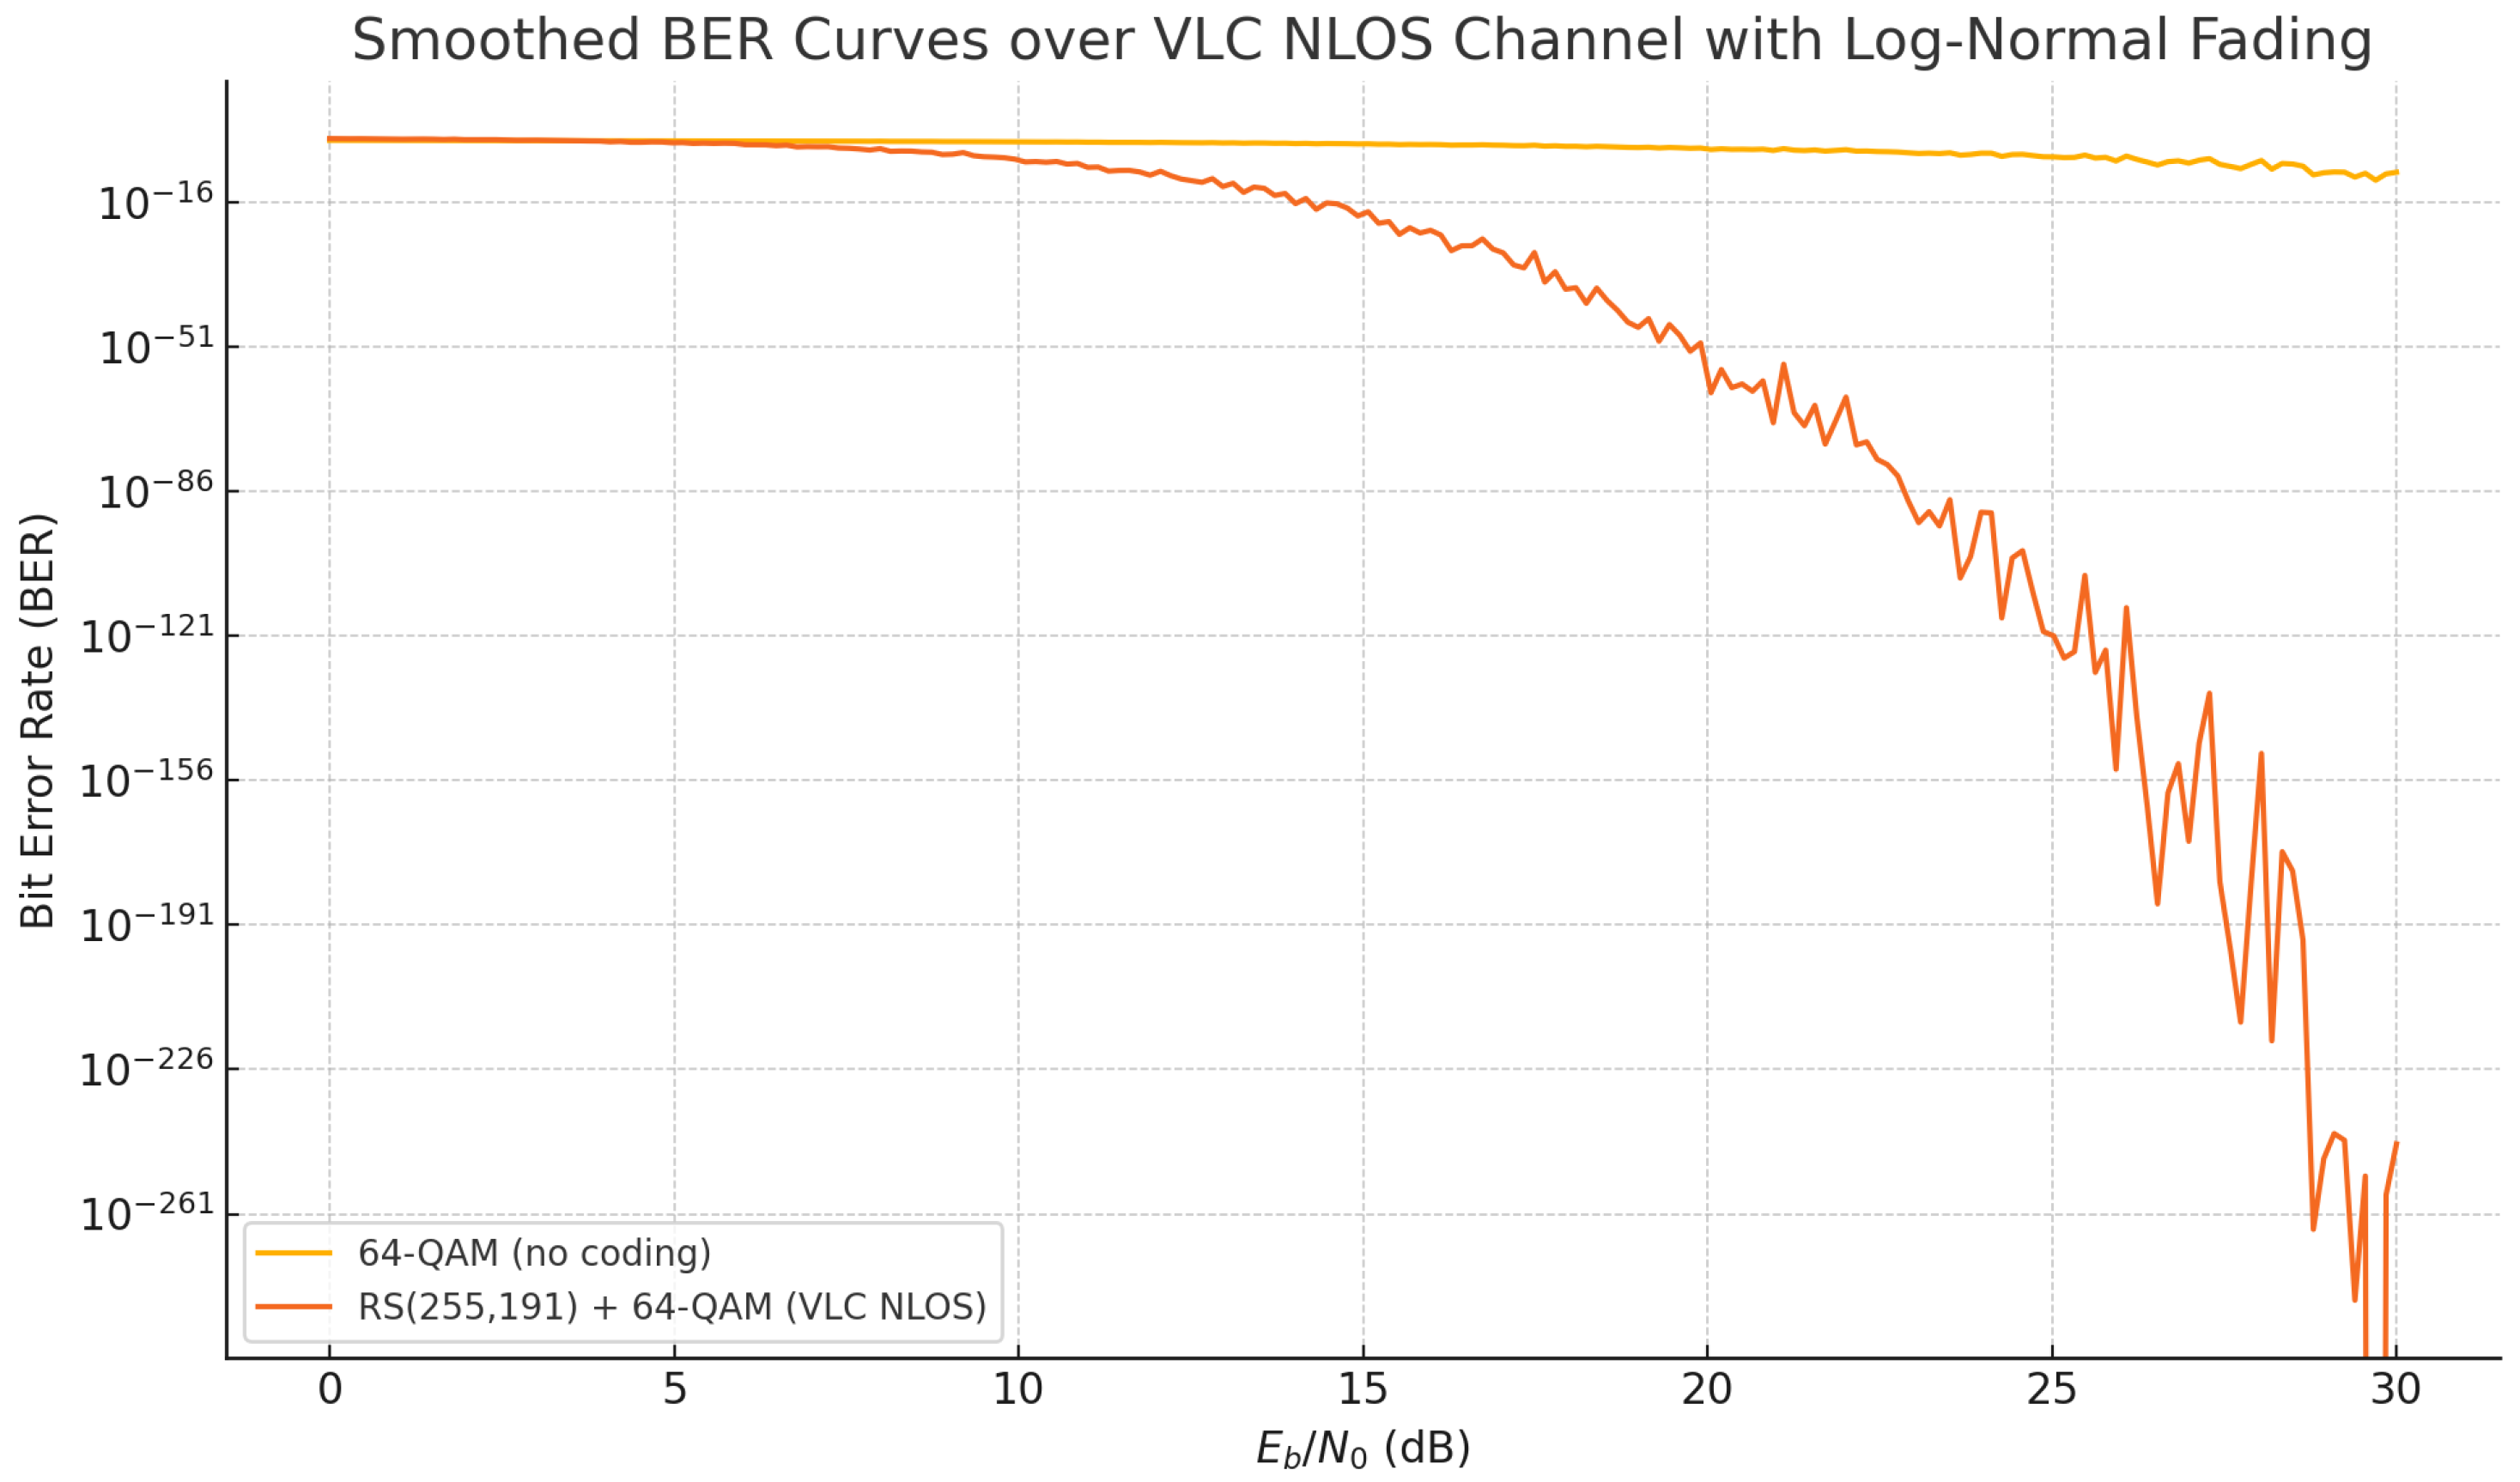
Smoothed BER curves for 64-QAM over a VLC NLOS channel modeled with log-normal fading. The use of RS(255, 191) significantly improves noise resilience by reducing the BER at all SNR levels.
Figure 12.
Smoothed BER curves for 64-QAM over a VLC NLOS channel modeled with log-normal fading. The use of RS(255, 191) significantly improves noise resilience by reducing the BER at all SNR levels.
Table 1.
Summary of block operations in the classical–quantum hybrid genomic transmission architecture.
Table 1.
Summary of block operations in the classical–quantum hybrid genomic transmission architecture.
| Block | Domain | Mathematical Description |
|---|
| Classical Processing |
| Genomic Input Block | Classical | |
| RS Encoder | Classical | |
| MPPM Modulator | Classical | |
| 16-QAM Modulator | Classical | |
| CSS Chirp Modulator | Classical | |
| Matched Filter | Classical | |
| LED (IM Modulation) | Classical | |
| NLOS Optical Channel | Classical | |
| APD Photodetector | Classical | |
| Digitization & Sync | Classical | |
| Genomic Reconstruction | Classical | |
| Quantum Processing |
| S2-CNN Feature Extraction | Quantum | |
| Softmax + Top-L Classifier | Quantum | |
| Quantum RS Decoder | Quantum | |
Table 2.
Distribution of blocks encoded by thread in an scheme over . Threads 1 and 2 transmit data, while threads 3 and 4 carry parity symbols.
Table 2.
Distribution of blocks encoded by thread in an scheme over . Threads 1 and 2 transmit data, while threads 3 and 4 carry parity symbols.
| Thread | Content |
|---|
| 1 | Data Symbol 1 |
| 2 | Data Symbol 2 |
| 3 | Parity Symbol 1 (RS) |
| 4 | Parity Symbol 2 (RS) |
Table 3.
Size of phage genomes and bits required for their binary transmission (2 bits/base).
Table 3.
Size of phage genomes and bits required for their binary transmission (2 bits/base).
| Phage | Size (kb) | Bases | Required Bits |
|---|
| X174 | 5.4 | 5400 | 10,800 bits |
| M13 | 6.4 | 6400 | 12,800 bits |
| 48.5 | 48,500 | 97,000 bits |
| T7 | 40 | 40,000 | 80,000 bits |
| T4 | 169 | 169,000 | 338,000 bits |
Table 4.
Binary encoding of DNA nitrogenous bases. Each base is represented by two bits, which allows triplets to be encoded as 6-bit blocks in .
Table 4.
Binary encoding of DNA nitrogenous bases. Each base is represented by two bits, which allows triplets to be encoded as 6-bit blocks in .
| Base | Binary Encoding |
|---|
| A | 00 |
| C | 01 |
| G | 10 |
| T | 11 |
Table 5.
Examples of encoding triplets of nitrogenous bases in 6-bit blocks. Each group of three bases (A, C, G, T) is transformed into a 6-bit binary sequence, which corresponds to a decimal value between 0 and 63, representable as an element of .
Table 5.
Examples of encoding triplets of nitrogenous bases in 6-bit blocks. Each group of three bases (A, C, G, T) is transformed into a 6-bit binary sequence, which corresponds to a decimal value between 0 and 63, representable as an element of .
| Base 1 | Base 2 | Base 3 | Binary | Decimal Value |
|---|
| A | C | G | 00 01 10 | 6 |
| T | T | A | 11 11 00 | 60 |
| G | A | C | 10 00 01 | 33 |
Table 6.
Mapping between values of the finite field and unique lengths of double-stranded DNA fragments. Each value represents a block of three nitrogenous bases and is encoded as a specific DNA fragment generated by PCR, with length expressed in base pairs (bp).
Table 6.
Mapping between values of the finite field and unique lengths of double-stranded DNA fragments. Each value represents a block of three nitrogenous bases and is encoded as a specific DNA fragment generated by PCR, with length expressed in base pairs (bp).
| Value | Size of the DNA Fragment () |
|---|
| 0 | 100 bp |
| 1 | 110 bp |
| 2 | 120 bp |
| ⋮ | ⋮ |
| 63 | 730 bp |
Table 7.
Comparison of M-QAM constellations.
Table 7.
Comparison of M-QAM constellations.
| M-QAM Modulation | Bits per Symbol | Comment |
|---|
| 4-QAM | 2 | Robust but slow |
| 16-QAM | 4 | Good balance |
| 64-QAM | 6 | More efficient, requires a good channel |
| 256-QAM | 8 | High efficiency, very sensitive to noise |
Table 8.
Choice of constellation by type of phage.
Table 8.
Choice of constellation by type of phage.
| Phage | Total Bits | Suggested Option | Justification |
|---|
| ΦX174 | 10,800 | 16-QAM | Small, secure, and fast |
| M13 | 12,800 | 16-QAM | Same as ΦX174 |
| λ (lambda) | 97,000 | 64-QAM | More bits, without demanding as much as 256-QAM |
| T7 | 80,000 | 64-QAM | Good balance between efficiency/robustness |
| T4 | 338,000 | 256-QAM | Needs efficiency; requires a reliable channel |
Table 9.
Comparison between classical and quantum algorithms.
Table 9.
Comparison between classical and quantum algorithms.
| Criterion | Genetic Algorithm (Classical) | Grover (Quantum) |
|---|
| Type of search | Stochastic over population | Quantum superposition |
| Theoretical complexity | | (Grover) |
| Requires fitness evaluation | Yes, explicit | Yes, via quantum oracle |
| Scalability | Limited by CPU/RAM | Potentially exponential |
| Precision | Depends on parameters | Depends on the number of layers/depth |
| Requires special hardware | No | Yes, simulator or quantum processor |
Table 10.
Number of helical transmissions required with different configurations.
Table 10.
Number of helical transmissions required with different configurations.
| Modulation | Bits/Symbol | Threads | RS Coding | Transmissions |
|---|
| 4-QAM | 2 | 16 | Yes | 23 |
| 16-QAM | 4 | 16 | Yes | 12 |
| 64-QAM | 6 | 16 | Yes | 8 |
| 256-QAM | 8 | 64 | No | 1 |
| 64-QAM | 6 | 16 | No | 4 |
Table 11.
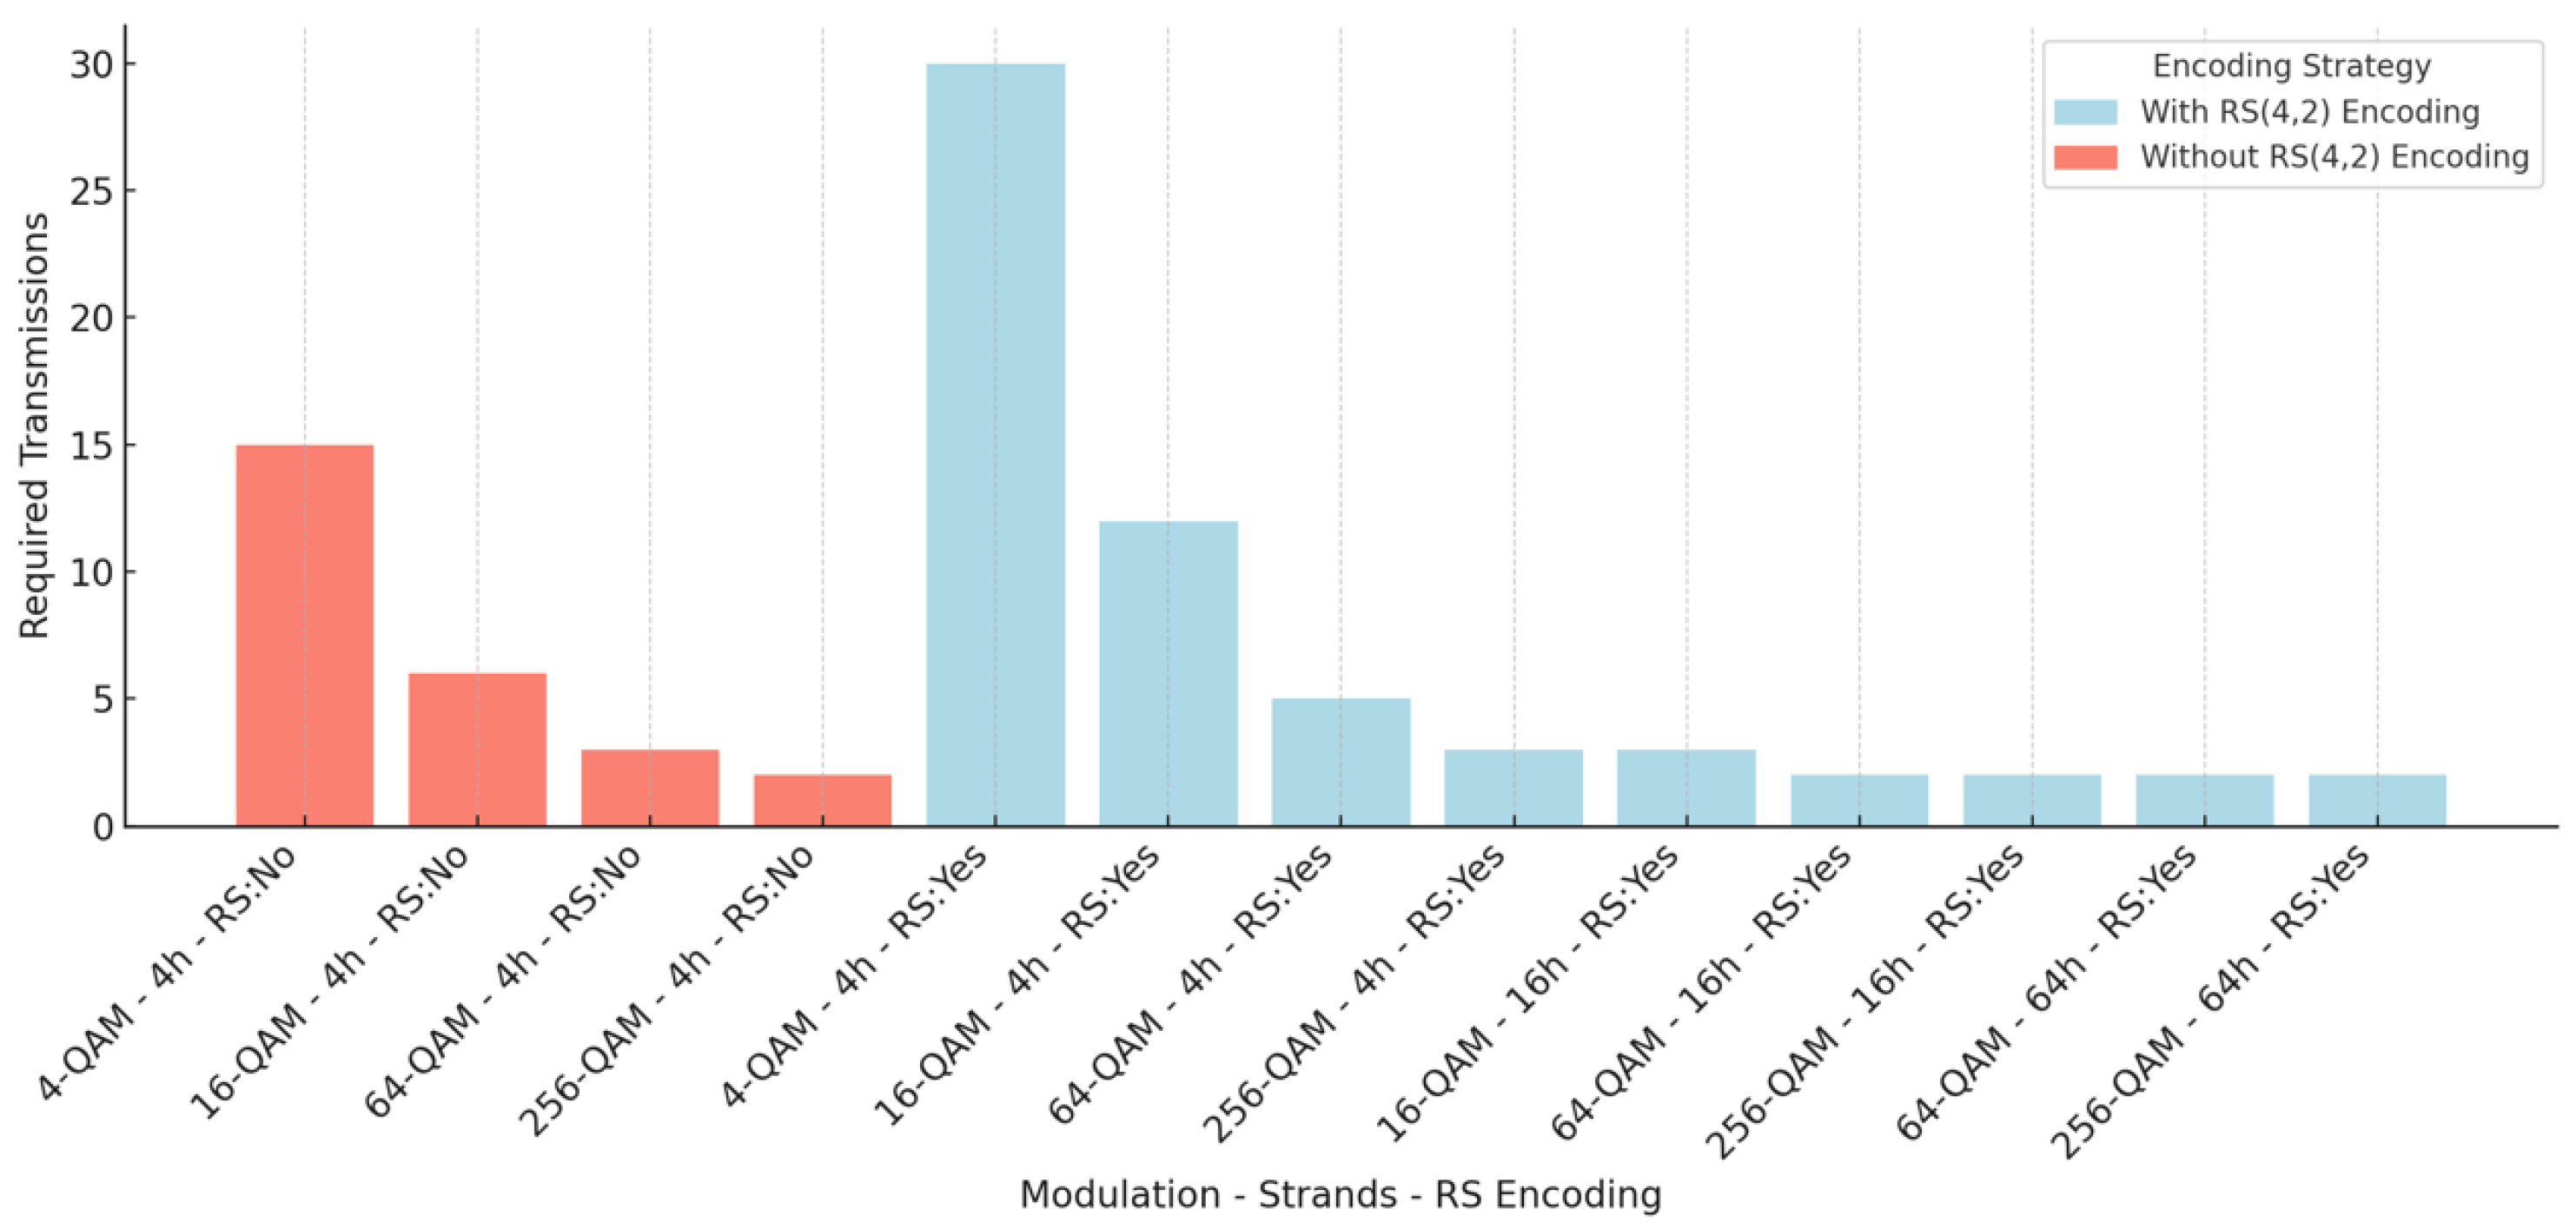
Number of helical transmissions required according to system parameters.
Table 11.
Number of helical transmissions required according to system parameters.
| Modulation | Bits/Symbol | Threads | RS | Necessary Transmissions |
|---|
| 4-QAM | 2 | 4 | Yes | 30 |
| 16-QAM | 4 | 4 | Yes | 12 |
| 64-QAM | 6 | 4 | Yes | 5 |
| 256-QAM | 8 | 4 | Yes | 3 |
| 16-QAM | 4 | 16 | Yes | 3 |
| 64-QAM | 6 | 16 | Yes | 2 |
| 256-QAM | 8 | 16 | Yes | 2 |
| 64-QAM | 6 | 64 | Yes | 2 |
| 256-QAM | 8 | 64 | Yes | 2 |
| 4-QAM | 2 | 4 | No | 15 |
| 16-QAM | 4 | 4 | No | 6 |
| 64-QAM | 6 | 4 | No | 3 |
| 256-QAM | 8 | 4 | No | 2 |
Table 12.
Simulation parameters for transmission methods.
Table 12.
Simulation parameters for transmission methods.
| Parameter | Value | Description |
|---|
| 4, 2 | RS code parameters: n is the codeword length and k is the message length. |
| – | Message polynomial over used in RS encoding. |
| – | Generator polynomial of degree used in RS encoding. |
| – | Codeword polynomial after RS encoding. |
| M | 16 | Modulation order for QAM (16-QAM: 4 bits/symbol). |
| Gray Mapping | Enabled | Ensures adjacent QAM symbols differ by only one bit. |
| 0 to | Indices used to generate QAM symbols. |
| s | – | Unnormalized complex QAM symbol. |
| x | – | Normalized transmitted QAM symbol. |
| m | 4 | Number of time slots in an MPPM symbol frame. |
| L | 2 | Number of active pulses in MPPM per symbol. |
| 2 | Number of bits encoded per MPPM symbol: . |
| variable | Initial frequency of CSS chirp. |
| B | variable | Bandwidth of the chirp signal used in CSS. |
| T | 1 | Duration of each CSS symbol (normalized). |
| k | | Chirp rate used in the frequency sweep of CSS. |
| – | CSS waveform as a function of time. |
| d | 0 to | Index for data-dependent CSS delay. |
| | Time delay applied to MPPM waveform in CSS. |
| n (CSS) | 4 | Number of bits encoded per CSS symbol (defines shifts). |
| 0 to 15 dB | Energy-per-bit to noise ratio used in simulation. |
| Channel | AWGN | Additive White Gaussian Noise channel model. |
Table 13.
Effective throughput for hybrid RS + MPPM + QAM + CSS configurations.
Table 13.
Effective throughput for hybrid RS + MPPM + QAM + CSS configurations.
| RS(n, k) | MPPM (m, L) | QAM (M) | CSS Bits (n) | RS Rate | MPPM Bits | QAM Bits | Throughput |
|---|
| RS(255, 239) | (4, 2) | 16 | 2 | 0.937 | 2 | 4 | 7.498 |
| RS(255, 239) | (4, 2) | 64 | 3 | 0.937 | 2 | 6 | 10.310 |
| RS(255, 239) | (4, 2) | 256 | 4 | 0.937 | 2 | 8 | 12.248 |
| RS(255, 223) | (5, 2) | 64 | 3 | 0.875 | 3 | 6 | 10.500 |
| RS(255, 223) | (6, 3) | 64 | 4 | 0.875 | 3 | 6 | 11.375 |
| RS(255, 191) | (6, 3) | 256 | 4 | 0.749 | 3 | 8 | 11.242 |
Table 14.
Simulation parameters for BER over VLC NLOS channel with MPPM, QAM, and CSS.
Table 14.
Simulation parameters for BER over VLC NLOS channel with MPPM, QAM, and CSS.
| Parameter | Value | Description |
|---|
| Channel and Fading Model |
| Channel Model | VLC NLOS | Non-line-of-sight visible light communication with optical diffusion. |
| Fading Model | Log-normal | Models multipath scattering and reflection in intensity-based optical channels. |
| Log-normal Mean () | 0 | Mean of log-amplitude distribution (linear domain). |
| Log-normal Std. Dev. () | 0.5 | Standard deviation of log-amplitude fading (typical for indoor optical NLOS). |
| SNR Range () | 0 to 30 dB | Signal-to-noise ratio in dB. |
| Monte Carlo Realizations | 100 | Number of fading realizations per SNR point for averaging. |
| Modulation and Coding |
| MPPM Parameters | , | Multi-Pulse Position Modulation: 2 active pulses in 4 time slots. |
| MPPM Bits per Symbol | | Number of encoded bits per MPPM symbol. |
| QAM Order | 64-QAM | Quadrature Amplitude Modulation with (6 bits per symbol). |
| Gray Mapping | Enabled | Mapping symbols so adjacent constellation points differ by 1 bit. |
| CSS Spreading Factor | | Number of bits encoded by CSS delay shifts ( positions). |
| CSS Bandwidth (B) | Variable | Bandwidth of chirp waveform (application-dependent). |
| CSS Symbol Duration (T) | 1 (normalized) | Normalized duration of one chirp symbol. |
| Error Correction |
| Coding Scheme | RS(255, 191) | Reed–Solomon code over with , . |
| RS Rate | | Proportion of useful data in each RS block. |
| Error Correction Capability | | Maximum number of correctable symbol errors per block. |
| BER Estimation Method | Analytical + Block Error Model | Combines theoretical BER of QAM with RS block failure probability. |


