Article

YOLOv11-EMD: An Enhanced Object Detection Algorithm Assisted by Multi-Stage Transfer Learning for Industrial Steel Surface Defect Detection

1
Aulin College, Northeast Forestry University, Harbin 150040, China
2
College of Computer and Control Engineering, Northeast Forestry University, Harbin 150040, China
*
Author to whom correspondence should be addressed.
Mathematics 2025, 13(17), 2769; https://doi.org/10.3390/math13172769
Submission received: 31 July 2025 / Revised: 20 August 2025 / Accepted: 24 August 2025 / Published: 28 August 2025

Abstract

To address the issues of inaccurate positioning, weak feature extraction capability, and poor cross-domain adaptability in the detection of surface defects of steel materials, this paper proposes an improved YOLOv11-EMD algorithm and integrates a multi-stage transfer learning framework to achieve high-precision, robust, and low-cost industrial defect detection. Specifically, the InnerEIoU loss function is introduced to improve the accuracy of bounding box regression, the multi-scale dilated attention (MSDA) module is integrated to enhance the multi-scale feature fusion capability, and the Cross-Stage Partial Network with 3 Convolutions and Kernel size 2 Dynamic Convolution (C3k2_DynamicConv) module is embedded to improve the expression of and adaptability to complex defects. To address the problem of performance degradation when the model migrates between different data domains, a multi-stage transfer learning framework is constructed, combining source domain pre-training and target domain fine-tuning strategies to improve the model’s generalization ability in scenarios with changing data distributions. On the comprehensive dataset constructed of NEU-DET and Severstal steel defect images, YOLOv11-EMD achieved a precision of 0.942, a recall of 0.868, and an mAP@50 of 0.949, which are 3.5%, 0.8%, and 1.6% higher than the original model, respectively. On the cross-scenario mixed dataset composed of NEU-DET and GC10-DET data, the mAP@50 was 0.799, outperforming mainstream detection algorithms. The multi-stage transfer strategy can shorten the training time by 3.2% and increase the mAP by 8.8% while maintaining accuracy. The proposed method improves the defect detection accuracy, has good generalization and engineering application potential, and is suitable for automated quality inspection tasks in diverse industrial scenarios.

1. Introduction

In modern industrial manufacturing processes, quality control is of paramount importance, with surface defect detection playing a critical role in ensuring product performance and safety. As a fundamental industrial material, steel’s surface defects (such as cracks, pits, and scratches) not only directly impact the subsequent processing techniques and service life but may also pose serious safety hazards. Therefore, efficient and precise detection technologies for steel surface defects hold significant engineering application value and theoretical research significance [1]. Object detection, as one of the core tasks in computer vision, aims to automatically locate and identify regions of interest in images. It has gradually replaced traditional manual inspection methods and become a key technology in industrial quality inspection processes. However, the existing surface defect detection algorithms still face multi-dimensional trade-offs between their accuracy, speed, and generalization capabilities. Therefore, there is an urgent need to design object detection models with high accuracy, high speed, and strong generalization capabilities to further enhance the robustness and engineering adaptability of industrial defect detection systems [2].
Currently, data-driven object detection algorithms are primarily categorized into one-stage and two-stage algorithms. Two-stage algorithms include methods such as Faster Region-Based Convolutional Neural Networks (R-CNNs) [3], Mask R-CNNs [4], and Cascade R-CNNs [5], which have achieved significant advancements in the field of object detection. Xia et al. [6] proposed an algorithm, an improved Faster R-CNN, by incorporating bilateral filtering technology to smooth the image background, combined with ResNet50 featuring variable convolutions and the Feature Pyramid Network (FPN), which substantially elevated the accuracy of the surface defect detection on panels. However, this approach still encounters difficulties in locating and identifying small defects within complex backgrounds. To tackle this, Zhang et al. [7] developed an upgraded Mask R-CNN model by substituting the feature extraction network in the Faster R-CNN with the more robust EfficientNet and refining the FPN structure, thereby successfully boosting the accuracy and efficiency of steel surface defect detection. Nevertheless, this method retains potential for further enhancement in recognizing defects amid high-noise backgrounds and intricate shapes. To address these limitations, Wang et al. [8] put forward a method for the detection of metal surface defects based on an improved Cascade R-CNN, integrating advanced elements such as the Region of Interest (ROI) Align module and a cascaded Region Proposal Network (RPN) to strengthen the detection performance for small defects and complex backgrounds. Experimental findings demonstrate that the approach surpasses traditional Cascade R-CNNs in terms of the detection accuracy and effectively bolsters the model’s adaptiveness when dealing with defects across different scales. However, the method still has challenges, including a complex model structure, lengthy training time, and high computational resource dependency, which limit its deployment efficiency and real-time performance in actual industrial environments. Overall, while the two-stage method achieves high accuracy, its limitations in detecting small objects and its complex deployment make it unsuitable within industrial contexts requiring stringent real-time capabilities.
Compared to the two-stage algorithms, one-stage object detectors built on the You Only Look Once (YOLO) family offer efficient inference speeds and real-time applicability, making them commonly utilized within the domain of industrial flaw detection. Hussain et al. [9] systematically evaluated the evolution of the YOLO series from its original version to YOLOv8 for industrial surface defect detection, confirming its strong balance between computational efficiency and detection accuracy, which is particularly suitable for the comprehensive requirements of industrial automation, including high precision, fast response, and edge deployment. For model lightweighting, Chen et al. [10] incorporated MobileNetV2 into YOLOv3 as the backbone network and fused multi-layer features, enhancing the small-object detection performance and embedded deployment efficiency. However, this approach shows an unstable performance when dealing with defects featuring blurred edges, strong noise, or significant scale variations, and its generalization capabilities require further enhancement. Zhou et al. [11] optimized the YOLOv5 architecture by introducing feature enhancement and attention mechanisms to improve small-object detection, achieving promising results on specific datasets. Nevertheless, the increased structural complexity led to reduced inference efficiency, and the lack of systematic validation across multiple scenarios and defect categories limits its generalizability. Ma et al. [12] integrated GhostNet with a multi-scale attention mechanism into the YOLOv8 architecture, reducing the computational overhead while enhancing the feature perception and regression capabilities, demonstrating robust deployment flexibility. However, the model still tends to miss small defects in complex backgrounds, with insufficient detail representation. Xie et al. [13] optimized YOLOv10 by introducing a sliding loss function and modular design, effectively addressing category imbalance and improving the detection accuracy and recall. Wang et al. [14] proposed YOLO-LSDI, an improved model based on YOLOv11, incorporating a fusion module of multi-scale perception and attention-based strategies to boost the ability to detect low-contrast, small-sized, and irregularly shaped defects, which exhibited a strong comprehensive performance. However, the network structure becomes more complex, increasing the inference latency and reducing the deployment flexibility. Tian et al. [15] focused on defects in concrete and other multi-category materials, integrating YOLOv11 with dynamic convolutions and enhanced deformable convolutions to improve the adaptability in complex textured backgrounds while balancing the accuracy and computational cost. Nevertheless, detection instability persists in scenarios with overlapping defects or blurred boundaries. Hence, more efficient object detection algorithms urgently need to be developed to meet the diverse requirements of industrial defect detection across various scenarios.
Additionally, common industrial inspection scenarios include weld defect identification, surface scratch detection, and structural defect localization. These tasks often face challenges such as uneven sample distributions, diverse defect types, and subtle differences between defects. Due to the inherent characteristics of industrial defect detection, such as the high sample acquisition costs, imbalanced category distribution, and significant domain differences across application scenarios, traditional supervised learning methods struggle to build robust and generalizable models [16]. Distribution discrepancies between training data and testing environments can substantially degrade the model performance, particularly under pronounced domain shifts, where generalization is difficult to ensure. Transfer learning effectively enhances the model performance in target domains by leveraging knowledge from source domains, especially in data-limited scenarios, thereby mitigating overfitting risks and improving adaptability [17]. When integrated with the YOLO series of deep object detection models, transfer learning further exploits their advantages to provide real-time, accurate, and efficient solutions for industrial defect detection tasks. Researchers have demonstrated the effectiveness of combining YOLO algorithms with transfer learning in various defect detection applications. Situ et al. [18] addressed data constraints and computational overhead in sewer defect detection by proposing a transfer learning framework based on YOLO, integrating 11 pre-trained CNNs to identify five defect types, and comparing it with mainstream methods such as R-CNNs [19]. This approach alleviates data insufficiency through transfer learning, enhancing feature extraction and generalization. Experiments indicate that the transferred YOLO outperforms in accuracy, speed, and IoU, with ResNet18 [20] achieving the best performance and optimal defect separation, underscoring its value in real-world monitoring. Li et al. [21] proposed an improved YOLOv4 for fabric surface defect detection, incorporating Density-Based Spatial Clustering of Applications with Noise (DBSCAN) clustering to optimize anchor boxes and DenseNet backbone networks to enhance feature extraction, and introducing a dual-channel feature enhancement module. They also applied transfer learning to migrate prior knowledge from large image datasets, addressing scarcity and diversity issues in fabric defect data. Experimental results show an mAP of 98.97% on an expanded textile defect dataset, with superior computational efficiency compared to the original YOLOv4, highlighting its potential for automated quality control in the textile industry. Zhu et al. [22] developed a small-sample transfer learning approach to boost the identification of defects including inclusions, blemishes, cracks, oxide deposit entrapment, scratches, and pits in Laser Directed Energy Deposition (L-DED)-manufactured components. This method utilizes a YOLOv7 model pre-trained on the NEU-DET dataset [23], achieving a significant improvement with an mAP of 0.62. Chen et al. [24] tackled the insufficient detection accuracy and edge deployment challenges by proposing LWFDD-YOLO, a lightweight framework based on YOLOv8n. This framework incorporates the Generalized Elastic Localized Affine Network for Sparse Kernel Approximation (GELAN_SKA) module for selective kernel attention-based feature optimization, integrates Cascaded Group Attention (CGA) for enhanced diversity, and uses Dy_Sample [25] to reduce the computational load, enabling efficient detection. Additionally, it employs transfer learning to transfer features from YOLOv8l, boosting performance. Experiments on a self-built dataset yielded an mAP of 87.9% and an accuracy of 89.4%, improving by 4.5–8.9% over the original model, with a 23.4% parameter reduction and 163.4 FPS speed, demonstrating its suitability for textile automation. Similarly, to address challenges like the size, aspect ratio, and complex background variability in concrete crack detection, Sohaib et al. [26] proposed a systematic evaluation framework for multiple YOLO models, first training a general model on datasets with and without cracks to extract abstract features and then using transfer learning to fuse specialized datasets simulating real-world scenarios (e.g., occlusion, size changes, and rotation) for improved robustness and generalization. Experiments show that this framework balances the inference speed and detection accuracy effectively, with YOLOv10 achieving a 74.52% mAP and 51 FPS, outperforming other variants and exhibiting high efficiency and applicability.
While the current transfer learning methods based on YOLO have demonstrated some success in fields such as industry, materials, and disaster response, they often exhibit limited adaptability to industrial inspection tasks. From a data perspective, mainstream approaches primarily rely on models pre-trained on general-purpose, open-source datasets (e.g., COCO and ImageNet) for transfer learning. However, objects in these datasets differ significantly in their semantics and structure from surface defects in industrial settings, especially under complex real-world conditions like micron-level scratches, highly reflective backgrounds, and fluid contamination. Consequently, effectively modeling small-scale, low-contrast defect features remains challenging, resulting in high false-positive rates, inconsistent accuracy, and inadequate real-time performance in the existing models, which fail to satisfy the requirements of high-precision industrial inspection. From a transfer strategy perspective, the existing methods typically involve full-network weight transfer, directly applying general features from pre-trained models to new tasks. Yet, in novel industrial scenarios, these methods frequently lack targeted fine-tuning and thus fail to adapt adequately to the target domain’s feature distribution. This leads to suboptimal feature extraction, poor adaptability, and a diminished detection accuracy for small defects in complex backgrounds, thereby constraining the models’ effectiveness and robustness in practical applications [27]. More critically, these methods generally lack mechanisms to model the dynamic nature of domain shifts in industrial tasks, hindering adaptation to evolving feature distributions over time or under varying conditions. Furthermore, the current models, predominantly based on deep neural networks, suffer from parameter redundancy and high inference latency, rendering them unsuitable for real-time, edge computing, and lightweight deployment in industrial production. Consequently, the existing research reveals substantial limitations in data source domain adaptability, network structure efficiency, transfer strategy robustness, and framework adaptability. Thus, the application of transfer learning in industrial defect detection requires urgent optimization toward more targeted and practical directions.
As mentioned above, this paper addresses the challenges of inaccurate localization, weak feature extraction, and poor model adaptability in industrial defect detection by proposing a multi-stage transfer learning-assisted enhanced object detection algorithm, YOLOv11-EMD, to fulfill the industrial requirements for high-precision, robust generalization and low-training-cost defect detection. Specifically, to mitigate YOLOv11’s limitations in feature extraction amid intricate backgrounds and the recognition of targets across multiple scales, the InnerEIoU loss function is incorporated to enhance the regression precision of bounding boxes. Furthermore, the multi-scale dilated attention (MSDA) module and Cross-Stage Partial Network with 3 Convolutions and Kernel size 2 Dynamic Convolution (C3k2_DynamicConv) module are integrated to strengthen the model in terms of its capability of multi-scale defect identification and adaptability to diverse defect features in complex environments. Finally, to tackle the prevalent issues of insufficient robustness and weak domain adaptation in cross-domain tasks, a multi-stage transfer learning framework is proposed. This framework employs a dual-driven strategy involving source domain pre-training and target domain fine-tuning to effectively boost the model’s generalization across varying data distributions. The integration of multi-stage transfer learning with the improved YOLOv11 algorithm leverages the benefits of high accuracy, strong generalization, and low training costs, thereby substantially enhancing the reliability and practicality of defect detection in complex industrial scenarios and supporting intelligent, automated quality monitoring. The contributions presented in this study can be summarized as follows:
(1)
With the aim of resolving YOLOv11’s shortcomings in localization accuracy, multi-scale feature extraction, and adaptability to complex defects in industrial detection, this paper introduces an enhanced YOLOv11 algorithm (YOLOv11-EMD). By incorporating InnerEIoU, MSDA, and the C3k2_DynamicConv module, it synergistically improves the feature representation, multi-scale fusion, and localization precision, significantly boosting the model’s robustness and fine-grained recognition in diverse defect scenarios.
(2)
A multi-stage progressive transfer learning framework is proposed to overcome the degraded transfer performance and limited adaptability due to domain-specific differences in defect data distributions. It adopts a collaborative optimization strategy of source domain multi-scene pre-training and target domain adaptive fine-tuning, enabling efficient cross-domain feature transfer and enhancing the model’s generalization and stability in heterogeneous environments.
(3)
The proposed YOLOv11-EMD algorithm and multi-stage transfer learning framework were evaluated on the NEU-DET and GC10-DET datasets. Results demonstrate superior accuracy in defect identification, boundary localization, and robustness in complex backgrounds. Moreover, the framework markedly improves the model adaptability and stability under heterogeneous data distributions, offering efficient and reliable support for high-precision, low-sample defect detection in industrial settings.
The remainder of this paper is structured as follows: Section 2 describes the construction of the steel surface defect dataset and designs multi-scale data augmentation and preprocessing methods to lay a solid foundation for model training. Section 3 details the design rationale for the YOLOv11-EMD algorithm, including the structure and functionality of the InnerEIoU loss function, MSDA feature fusion module, and C3k2_DynamicConv module to optimize the detection performance. Section 4 outlines the multi-stage transfer learning framework, explores its application in cross-domain defect detection, and analyzes the impacts of various transfer stages on the model generalization. Section 5 presents the experimental design and results analysis, including ablation and comparative studies, to ensure that the efficacy of the proposed method across multiple metrics and its potential in real-world industrial applications are comprehensively verified.

2. Materials

2.1. Data Sources

This study utilized two openly accessible datasets for detecting defects on steel surfaces, which were merged and augmented to obtain sufficient training data (total sample size: 7666 defect images): (1) the Severstal steel surface defect dataset [28], provided by the Severstal Steel Company, contains 6666 high-resolution images of steel surfaces. These images capture various defects occurring during steel production and are annotated into four categories: cracks (linear fractures on the surface), patches (irregular color difference areas on the surface), pitting (pits or corrosion on the surface), and scratches (mechanical scratches on the surface). (2) The NEU-DET Dataset, developed by Northeastern University in China, contains 1800 annotated images. The dataset is strictly partitioned into two non-overlapping subsets, comprising 1000 and 800 images, respectively. This guarantees no data leakage across domains. This study used the 1000 annotated images from this dataset as training samples. The dataset covers six types of steel surface defects: crazing (fine, web-like cracks on the surface), inclusions (non-metallic impurities within the material), patches (irregular areas on the surface), pitted surface (corrosion pits on the surface), rolled-in scale (scale-like defects formed during rolling), and scratches (linear mechanical damage on the surface).
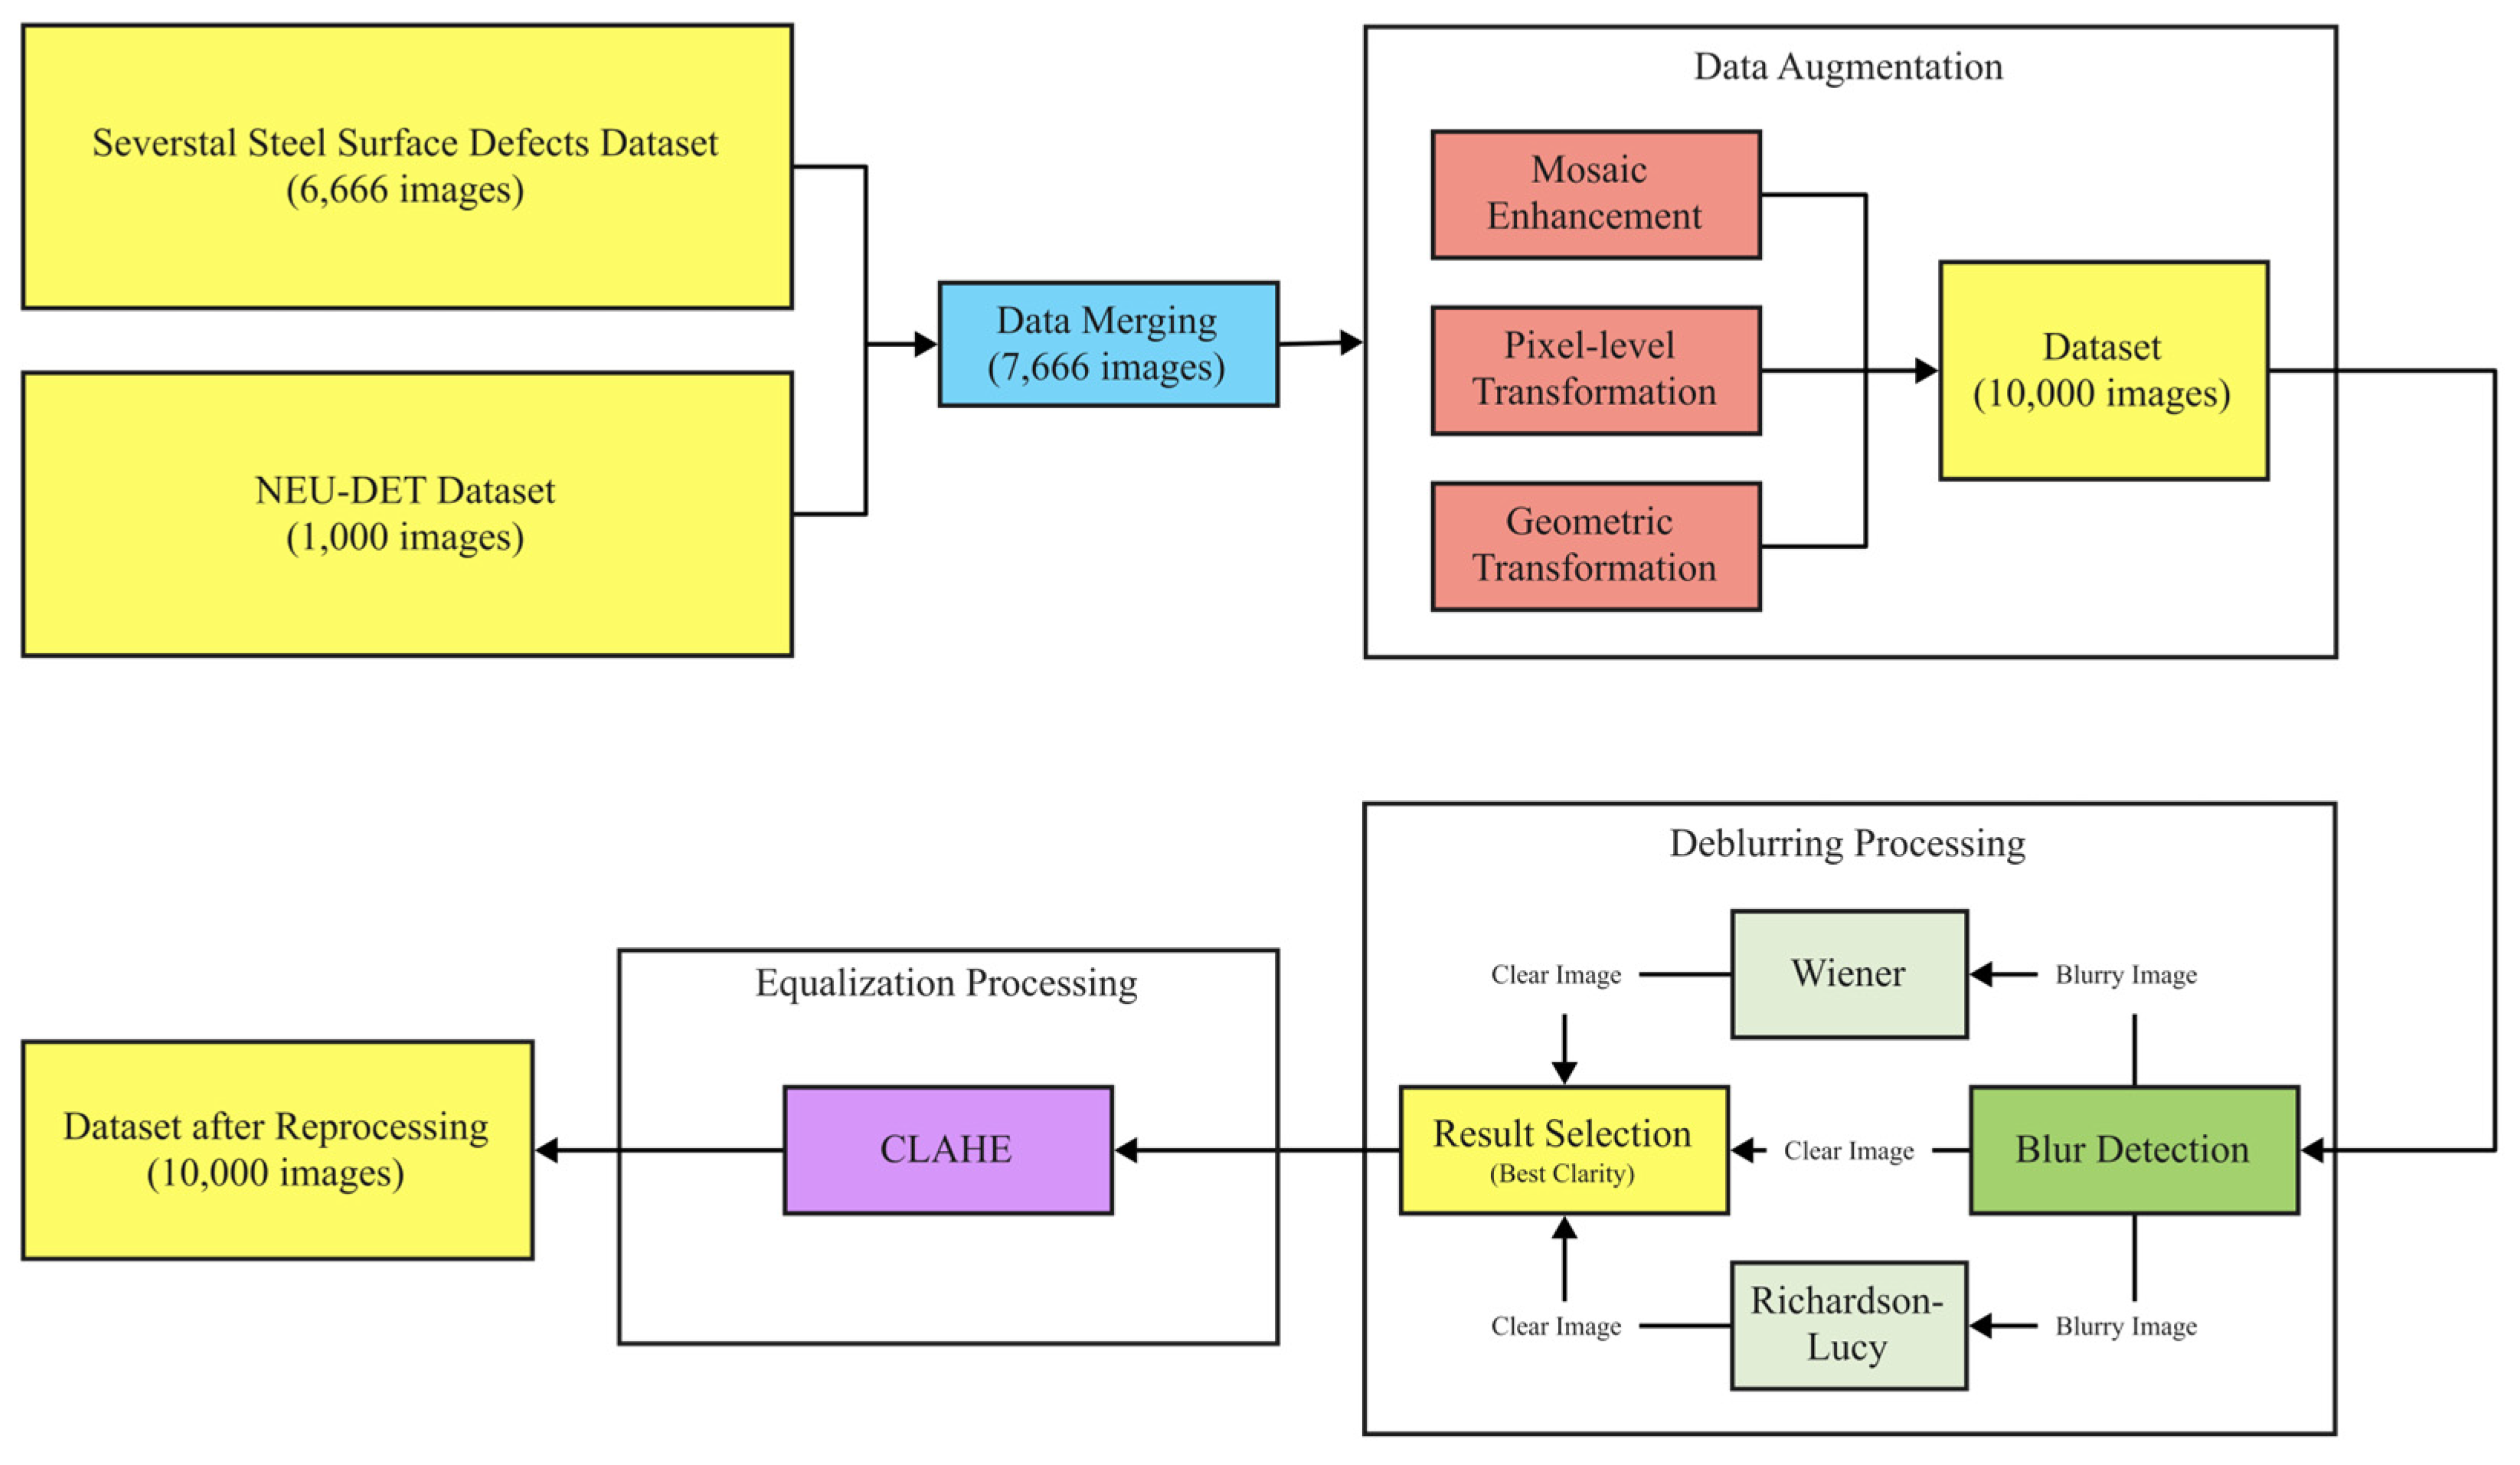
To boost the model’s capacity for generalization and guarantee sufficient training samples, the two datasets were merged, and data augmentation techniques were employed. These techniques included random rotation, flipping, and scaling, as well as brightness and contrast adjustments, thereby expanding the diversity of the training samples. Ultimately, a comprehensive dataset comprising 10,000 images was obtained, categorized into six defect types: crazing, inclusions, patches, pitted surfaces, rolled-in scale, and scratches. This dataset encompasses a wide range of common surface defects in steel production, providing diverse real-world samples to facilitate model development and performance assessment. Figure 1 illustrates examples of steel surface defects from the comprehensive dataset.

2.2. Data Preprocessing

The dataset employed in this study exhibits a wide variety of defect types and complex morphological characteristics. It includes six defect types: crazing, inclusions, patches, pitted surfaces, rolled-in scale, and scratches. Each type features unique visual attributes, such as irregular shapes and blurred edges. These attributes often cause object detection models to deviate when locating irregular or complex-shaped defects during feature learning, thereby reducing the detection accuracy. The dataset also displays a broad range of defect sizes, from micron-level micro-damage to centimeter-level large-area defects. This variation can render the model insufficiently sensitive to small targets, leading to missed detections, while also limiting its ability to capture contextual information for large-area defects, thereby affecting the recognition accuracy. Furthermore, the dataset is subject to significant environmental influences on image quality, including insufficient contrast, uneven brightness, local blurring, and noise interference. These issues primarily arise from complex lighting conditions, varying shooting angles, and environmental noise in industrial settings. Such quality degradation directly diminishes the distinctiveness of defect features, thereby impairing the recognition accuracy, generalization capability, and stability in practical industrial scenarios of the model. To address these challenges, a multi-scale data preprocessing framework built on digital image processing and computer vision techniques is put forward. This framework aims to enhance the defect image quality, improve the feature discriminability, and expand the dataset scale. It optimizes the visual distinguishability of defects and reduces complex backgrounds and noise interference, thereby providing high-quality, standardized input data for subsequent model training and significantly improving the recognition accuracy and stability in tasks of detecting defects in steel. Figure 2 shows the overall process of this data preprocessing framework. This framework is mainly composed of three key submodules: data augmentation, deblurring, and equalization. The data augmentation module expands the dataset size and increases data diversity to boost the model’s capacity for generalization and tackle the complexity and variety of defect types and morphologies. The deblurring module targets local blurring caused by camera shake or out-of-focus conditions during image capture, sharpening defect edges and details to diminish the repercussions of image quality issues on the defect feature prominence. The equalization module optimizes the image contrast distribution, enhances the defect feature prominence, and improves the overall brightness uniformity to counter issues related to the wide range of defect sizes and image quality.
(1)
Data Augmentation
In steel defect detection tasks, the limited number of original images, complex defect shapes, and long-tail distributions often lead to model overfitting or insufficient recognition capabilities for certain defect categories. Data augmentation [29] artificially expands the diversity of training samples through the application of a sequence of transformations to original images while preserving semantic information, thereby enhancing model generalization and mitigating category imbalance. This study employed the Mosaic augmentation technique [30], which combines four different training images into a new image at specific ratios, effectively increasing the sample diversity within a single batch and enriching the background information and contextual environment of defects. This method proves particularly beneficial for detecting small-target defects, such as fine cracks and pitting. Its expression is as follows:
I mosaic = I 1 I 2 I 3 I 4
where I i denotes the i th image, i 1 ,   2 ,   3 ,   4 . The four images are concatenated based on their positions to form a new image ( I mosaic ). This study also incorporated gamma correction [31] as a data augmentation technique. Gamma correction serves as a widely used method in image processing to adjust brightness and contrast, thereby enhancing the overall image quality. The formula for gamma correction is as follows:
I out = I i n 255 γ × 255
where I o u t represents the output pixel value, I i n represents the input original pixel value, and γ represents the gamma value that controls brightness. This study also employed affine transformations [32] for data augmentation. Affine transformations involve a series of geometric operations, such as translation and rotation, that preserve the straightness and parallelism of lines in the image. In this process, any pixel coordinate ( x , y ) maps to new coordinates ( x , y ) using an affine matrix of the following form:
x y 1 = a 11 a 12 t x a 21 a 22 t y 0 0 1 x y 1
where t x and t y denote the translation amounts, and a 11 , a 12 , a 21 , and a 22 denote the control rotation and scaling.
In this work, gamma correction and affine transformation were employed as data augmentation techniques to enhance the diversity and robustness of the training samples. The corresponding parameters (e.g., gamma values, rotation angles, and scaling factors) were not optimized through backpropagation but rather set heuristically within empirically validated ranges. This design choice follows expert experience in industrial vision tasks, ensuring stable augmentation without introducing additional trainable complexity. While these parameters were fixed in the present study, exploring adaptive or learnable augmentation strategies could be an interesting direction for future research.
(2)
Deblurring
Image blurring [33] constitutes one of the primary interfering factors in steel surface defect detection, as it results in the loss of defect edge information and thereby affects the detection accuracy. Deblurring [34] aims to restore detailed information in blurred images and enhance the overall clarity. This study adopts a deblurring strategy that integrates traditional methods with deep learning approaches. Initially, to assess the degree of image blurring, the Laplace operator [35] is employed to detect responses in the image, with the variance in the Laplace response serving as an indicator of the image clarity. This is expressed as follows:
Var L ( I )   =   Var ( L I )
where I denotes the original image, L denotes the Laplace operator, denotes the convolution operation, and Var ( L I ) denotes the variance in the Laplace response. For images identified as blurred, this study initially applies Wiener filtering [36] for frequency domain restoration, expressed as follows:
F ^ ( u , v ) = H * ( u , v ) S f ( u , v ) | H ( u , v ) | 2 S f ( u , v ) + S n ( u , v ) G ( u , v )
where F ^ ( u , v ) denotes the estimated frequency of the original image, G ( u , v ) denotes the frequency of the blurred image, H ( u , v ) denotes the frequency of the blurring kernel, H * ( u , v ) denotes the complex conjugate of H ( u , v ) , and S f ( u , v ) and S n ( u , v ) denote the power spectral densities of the original image and noise, respectively. Building on this foundation, to further enhance the restoration effect, this study employed the Richardson–Lucy iterative deconvolution algorithm [37] for detail restoration. Its iterative formula is as follows:
f ( k + 1 ) = f ( k ) g f ( k ) * h h *
where f k denotes the image estimate at the k th iteration, g denotes the blurred image, h denotes the blurring kernel, h * denotes the conjugate transpose of h , and * denotes the convolution operation.
(3)
Equalization
Steel surface defects often exhibit insufficient contrast due to factors such as uneven lighting and shadows, which makes it challenging to distinguish them from the background. Equalization processing [38] enhances image contrast by redistributing pixel intensities, thereby making defect features more prominent. This study employs contrast-limited adaptive histogram equalization (CLAHE) to improve the image quality, facilitating the more effective detection and identification of surface defects in complex textured backgrounds. Unlike traditional global histogram equalization methods, CLAHE divides the image into multiple small regions (tiles), performs histogram equalization within each region, and applies bilinear interpolation to smooth boundaries between adjacent regions, thereby avoiding edge artifacts. Additionally, CLAHE incorporates a contrast-limiting mechanism to suppress excessive enhancement from local noise, making it particularly suitable for images with complex surface textures and uneven illumination. For regional image equalization, the discrete gray-level transformation function is as follows:
s k   =   T r k   =   ( L 1 ) j = 0 k p r r j   =   ( L 1 ) n j = 0 k n j ( k   =   0 , 1 , ,   L 1 )
where r k denotes the input grayscale level, s k denotes the output grayscale level, L denotes the number of grayscale levels, p r r j denotes the frequency of occurrence of each grayscale value, r j , n j denotes the number of pixels with the grayscale level ( r j ), and n denotes the total number of pixels in the region. Through the integrated application of these data processing techniques, the quality of the dataset in this study was effectively improved.
Figure 3 illustrates a comparison of the impacts of various data preprocessing techniques on four typical steel surface defect images. The first row displays the original images, while the second row shows the images after applying data augmentation, deblurring, and histogram equalization. From left to right, the defects depicted are scratches, crazing, patches, and inclusions. A comparison of the two rows reveals that the preprocessed images exhibit sharper defect boundaries, significantly enhanced contrast, and more detailed texture. Specifically, the characteristic web-like structure of crazing defects becomes more pronounced after postprocessing, while the differentiation between patches and inclusions is notably clearer. These improvements substantially elevate the quality of the images, thereby providing more refined input data for subsequent deep learning models. To ensure scientific rigor in the model training and objectivity in the evaluation process, a stratified random split methodology is employed, based on the proportion of defect categories. The dataset of 10,000 preprocessed images is divided into a training set (7000 images), a validation set (2000 images), and a test set (1000 images), following a 7:2:1 ratio. This splitting strategy ensure as balanced representation of the defect categories across the subsets, thereby facilitating effective learning and preserving a sufficient amount of independent data for the model optimization and performance evaluation.

3. YOLOv11-EMD Algorithm

Although the standard YOLOv11 algorithm performs well in general object detection tasks, it faces limitations when applied directly to detecting fine defects on steel surfaces. These include challenges in accurately locating irregularly shaped defects, insufficient capture of multi-scale defect features, and limited adaptability to the complex visual characteristics of various defect types, such as fine scratches or hidden inclusions. To overcome these issues, this study proposes an enhanced YOLOv11-EMD object detection algorithm that fulfills the practical demands for high-precision localization, multi-scale robustness, and complex shape perception in industrial steel surface defect detection. Specifically, to enhance the bounding box regression accuracy, particularly for defects with high aspect ratios or significant scale discrepancies between predicted and ground-truth boxes, the InnerEIoU loss function is introduced. This function employs a refined penalty mechanism that comprehensively accounts for the overlap area, aspect ratio, and center-point distance between predicted and ground-truth boxes, thereby improving the model’s localization precision and enabling more accurate defect boundary delineation. To tackle multi-scale features prevalent in steel defects, the MSDA module is integrated to bolster the model’s extraction of fine-grained details and fusion of large-scale contextual information. This module effectively merges features from various network levels, strengthens multi-scale defect representation, and heightens sensitivity to both large and small defects. Finally, given that steel defects often display diverse and subtle visual patterns, which demand advanced adaptive feature extraction beyond the capabilities of standard convolutions, the C3k2_DynamicConv module is incorporated. Its core mechanism allows convolution kernel parameters to adjust dynamically based on input features, significantly enhancing the model’s capacity for feature learning and its ability to adapt, thereby facilitating the improved capture of complex, variable defect structures. By integrating these three key enhancements, the InnerEIoU loss function, the MSDA module, and the C3k2_DynamicConv module, the proposed YOLOv11-EMD achieves substantial performance gains in steel surface defect detection. The primary contribution of this study lies in its engineering applicability, focusing on addressing practical challenges in steel surface defect detection. By incorporating and integrating the three modules—InnerEIoU, MSDA, and C3k2_DynamicConv—this work not only enhances the detection accuracy and efficiency but also optimizes the feasibility of real-world industrial applications. Unlike traditional theoretical studies, this approach emphasizes practical value in steel manufacturing and surface quality inspection, particularly in terms of the robustness and real-time performance in complex industrial environments, providing direct technical support and solutions for quality control and production processes in the steel industry. This algorithm not only attains higher accuracy in defect identification and localization but also exhibits superior scale robustness and morphological adaptability, offering an efficient, tailored solution for industrial challenges in this domain. The enhanced YOLOv11 framework is illustrated in Figure 4.

3.1. Traditional YOLOv11 Algorithm

The YOLO (You Only Look Once) family of models has revolutionized object detection with its single-stage paradigm, striking a compelling balance between speed and accuracy. Building upon this legacy, YOLOv11 [39] introduces several architectural refinements that further advance its core design principles. The model is primarily designed to improve the detection accuracy while maintaining real-time efficiency. To this end, it incorporates a more efficient backbone network, a dynamic receptive field mechanism, and an anchor-free decoupled detection head, collectively enhancing robustness in multi-scale object detection and complex-scene understanding. Moreover, improvements in label assignment strategies and loss function design during training contribute to the greater stability and stronger generalization of the model compared to its predecessors.
The architecture of YOLOv11 is shown in Figure 5. It adheres to the classic paradigm of object detection networks, comprising three primary parts: the backbone, the neck component, and the detection head module. The backbone extracts multi-level semantic and spatial features from input images, typically utilizing lightweight and efficient architectures such as Cross-Stage Partial Darknet (CSPDarknet), an enhancement of the CSPNet concept, or variants of EfficientNet and Re-parameterized Vision Transformers (RepVGG). It bolsters feature extraction through residual connections, dense connections, and receptive field enhancement modules while managing computational complexity. The neck primarily fuses feature maps across scales to improve the detection of multi-scale objects. Common implementations include the Bidirectional Feature Pyramid Network (BiFPN) and Path Aggregation Network (PANet), which merge deep semantic features with shallow details via bidirectional information flow, thereby creating a rich, multi-scale representation that facilitates the identification of steel surface defects of varying sizes. The detection head employs a decoupled design, independently predicting bounding box locations, categories, and confidences. This module generates outputs in parallel across multi-scale feature maps, where different levels exhibit distinct receptive fields: shallow layers excel at detecting small targets, while deep layers are better suited for large ones, enabling the precise localization of defects across sizes.
Although YOLOv11 performs well in general object detection tasks, it encounters several key challenges in high-precision industrial applications, such as steel surface defect detection: (1) Limited bounding box localization accuracy: Steel defects often present elongated, irregular, or diffuse shapes, and YOLOv11’s regression loss function struggles with targets exhibiting extreme aspect ratios or complex morphologies, leading to poor alignment between the predicted bounding boxes and actual defect boundaries. (2) Insufficient multi-scale feature representation: Steel defects vary widely in scale, yet YOLOv11’s standard feature fusion mechanism inadequately balances the preservation of small-target details with contextual awareness for large targets, compromising detection completeness and robustness. (3) Inadequate adaptability in feature extraction: In industrial images with complex backgrounds and diverse textures, standard convolution operations fail to dynamically adjust weights according to input features, hindering the model’s ability to distinguish critical defects from background noise and thus impairing the recognition stability and generalization. Consequently, YOLOv11 requires further optimization to effectively handle the diversity and complexity of steel defects.

3.2. InnerEIoU

In object detection tasks, accurate bounding box regression is essential for enhancing the localization accuracy. However, YOLOv11 continues to encounter challenges, including substantial regression errors and localization offsets, particularly in scenes with significant variations in object scales, complex shapes, or dense distributions. Traditional IoU loss functions fail to account for the internal structures of objects during optimization, which hinders the full exploitation of geometric relationships between bounding boxes and thus limits further advancements in the detection performance. To mitigate these issues, this paper introduces the InnerEIoU [40] module, which integrates an internal structure perception mechanism into the IoU regression process and comprehensively incorporates information on object shape consistency and center-point offsets. This strategy improves the discriminative power in bounding box regression tasks, thereby effectively enhancing the localization precision and stability of the detection network in complex scenarios.
The core concept of the InnerEIoU involves introducing a geometry-aware mechanism to traditional IoU-based loss functions, thereby enhancing the modeling of fine-grained differences in bounding boxes. By integrating a strategy that balances focus on the central region with scale consistency constraints, it optimizes both the target localization accuracy and convergence efficiency. This loss function combines the Inner-IoU and EIoU methods to comprehensively model positional, scale, and shape differences between predicted and ground-truth bounding boxes. In particular, the Inner-IoU strengthens the emphasis on the target’s central region, enabling more precise localization in scenarios involving small objects or high-density distributions. Meanwhile, the EIoU incorporates a direct optimization term for the bounding box’s aspect ratio, which improves fitting by minimizing discrepancies in the width, height, and center-point distances. Overall, the InnerEIoU preserves the geometric essence of the traditional IoU while accounting for factors such as center alignment, scale matching, and distance constraints, thereby endowing the model with enhanced geometric perception during regression and significantly boosting the detection performance and training stability.
In the present research, the model substitutes the original CIoU with the enhanced InnerEIoU. This approach not only accelerates model convergence and enhances the bounding box regression accuracy but also incorporates auxiliary boundary constraints into the loss calculation. During training, the InnerEIoU employs smaller auxiliary boundaries for loss computation, which promotes regression for high-IoU samples while moderately suppressing low-IoU samples, thereby optimizing the overall regression performance. Furthermore, to accommodate objects of varying scales, the loss function introduces a scaling factor that dynamically adjusts the auxiliary boundary construction, rendering the loss calculation more adaptive. In the anchor-free detection head of YOLOv11, the network first decodes raw predictions (e.g., center-based coordinates or four-side distances) into explicit rectangular boxes. The InnerEIoU is then computed on these decoded boxes against the ground truth. Because the InnerEIoU operates purely on box geometry, it is parameterization-agnostic and therefore naturally compatible with anchor-free regression: gradients backpropagate through the decode step to the raw outputs. This is consistent with recent anchor-free detectors that apply IoU-style losses directly on decoded boxes [41]. This strategy improves the model’s robustness in multi-scale scenarios and significantly boosts the target prediction speed in industrial applications. Based on Equations (8)–(12), the Inner-IoU integrates effectively into the EIoU loss calculation, yielding a geometrically aware regression optimization scheme:
inter  =   min b r g t , b r max b l g t , b l min b b g t , b b   max b t g t , b t
union = w g t h g t ( ratio ) 2 + ( w h ) ( ratio ) 2 inter
I o U inner = inter union
L EIoU = L IoU + L dis + L asp
L Inner - EIoU = L EIoU + I o U I o U inner
where the ground-truth (GT) box is denoted as B g t and the anchor box is denoted as B . The width of the GT box is w g t and the height is h g t , while the anchor box’s width is w and the height is h . And r a t i o serves as a supporting parameter controlling the auxiliary box size. The EIoU comprises three components: overlap loss ( L IoU ), center distance loss ( L dis ), and aspect ratio loss ( L asp ). The InnerEIoU provides precise focus on the center of the box, functioning as an advanced bounding box regression loss. By utilizing scale-corrected support boxes for loss calculation, it accelerates convergence and excels at detecting small objects.
Compared to the default CIoU, the InnerEIoU performs better when the aspect ratio of objects changes. Specifically, the CIoU loss function is as follows:
L CIoU   =   1 IoU  +   ρ 2 b , b g t c 2   +   α v
v = 4 π 2 arctan w gt h gt arctan w h 2
α = v ( 1 IoU ) + v
Among these, ρ 2 b , b g t represents the squared Euclidean distance between the center of the predicted bounding box and the center of the ground-truth bounding box, c is the diagonal length of the minimum bounding rectangle, v is the aspect ratio consistency metric, and α is the trade-off factor. The aspect ratio term indirectly captures differences in width-to-height ratios via the inverse tangent function. However, when the object’s aspect ratio deviates significantly (e.g., from a nearly 1:1 square object to a 1:10 elongated object), the nonlinear nature of v may lead to gradient instability. Specifically, the partial derivatives of v with respect to width ( w ) and height ( h ) are as follows:
v w = 8 π 2 arctan w gt h gt arctan w h h w 2 + h 2
v h = 8 π 2 arctan w gt h gt arctan w h w w 2 + h 2
These partial derivatives depend on the nonlinear transformation of the inverse tangent function, which can easily cause gradient explosion or vanishing problems under extreme aspect ratios, thereby weakening the convergence speed and accuracy of the regression process, especially when the scale of the prediction box is close to the target but the proportion deviation is large. In contrast, the InnerEIoU loss function directly optimizes these dimensions by explicitly separating the width and height penalty terms, and it is expressed as follows:
L InnerEIoU   =   1 IoU + ρ 2 b , b gt c w 2 + c h 2 + w w gt 2 c w 2 + h h gt 2 c h 2
where c w and c h represent the width and height of the minimum bounding rectangle, respectively. This design avoids the indirect nonlinear representation of the aspect ratio term in the CIoU and instead uses an independent linear penalty mechanism. When the aspect ratio of an object changes, the InnerEIoU provides more stable gradient guidance, and its partial derivatives with respect to w and h are simplified to the following:
L InnerEIoU w   =   2 w w gt c w 2
L InnerEIoU h = 2 h h gt c h 2
These linear gradients ensure that the penalty is directly proportional to the actual deviation in width and height, unaffected by the overall nonlinearity of the aspect ratio. This promotes faster and more accurate convergence in scenarios where the aspect ratio changes significantly (such as objects with high width-to-height ratios or low width-to-height ratios). Mathematical analysis shows that this direct separation mechanism is more robust in gradient flow, better adapting to diverse object shapes and improving the overall performance of bounding box regression. Therefore, the InnerEIoU performs better than the default CIoU when the aspect ratio of objects changes.

3.3. MSDA

In object detection tasks, extracting features across multiple scales and information fusion are critical for achieving high-precision recognition. Although the traditional Contextualized and Contrastive Pairwise Self-Attention (C2PSA) module in YOLOv11 demonstrates success in channel and spatial attention mechanisms, it still faces difficulties like poor adaptability to objects of varying scales and inadequate feature representation in industrial detection settings. To overcome these limitations, this paper proposes the integration of the MSDA [42] module. By dynamically adjusting the fusion weights among features at different scales, this module enhances the network’s perception of small objects and complex backgrounds while strengthening the information transmission and fusion across scales. Consequently, it enhances the network’s stability and precision when handling multi-scale objects.
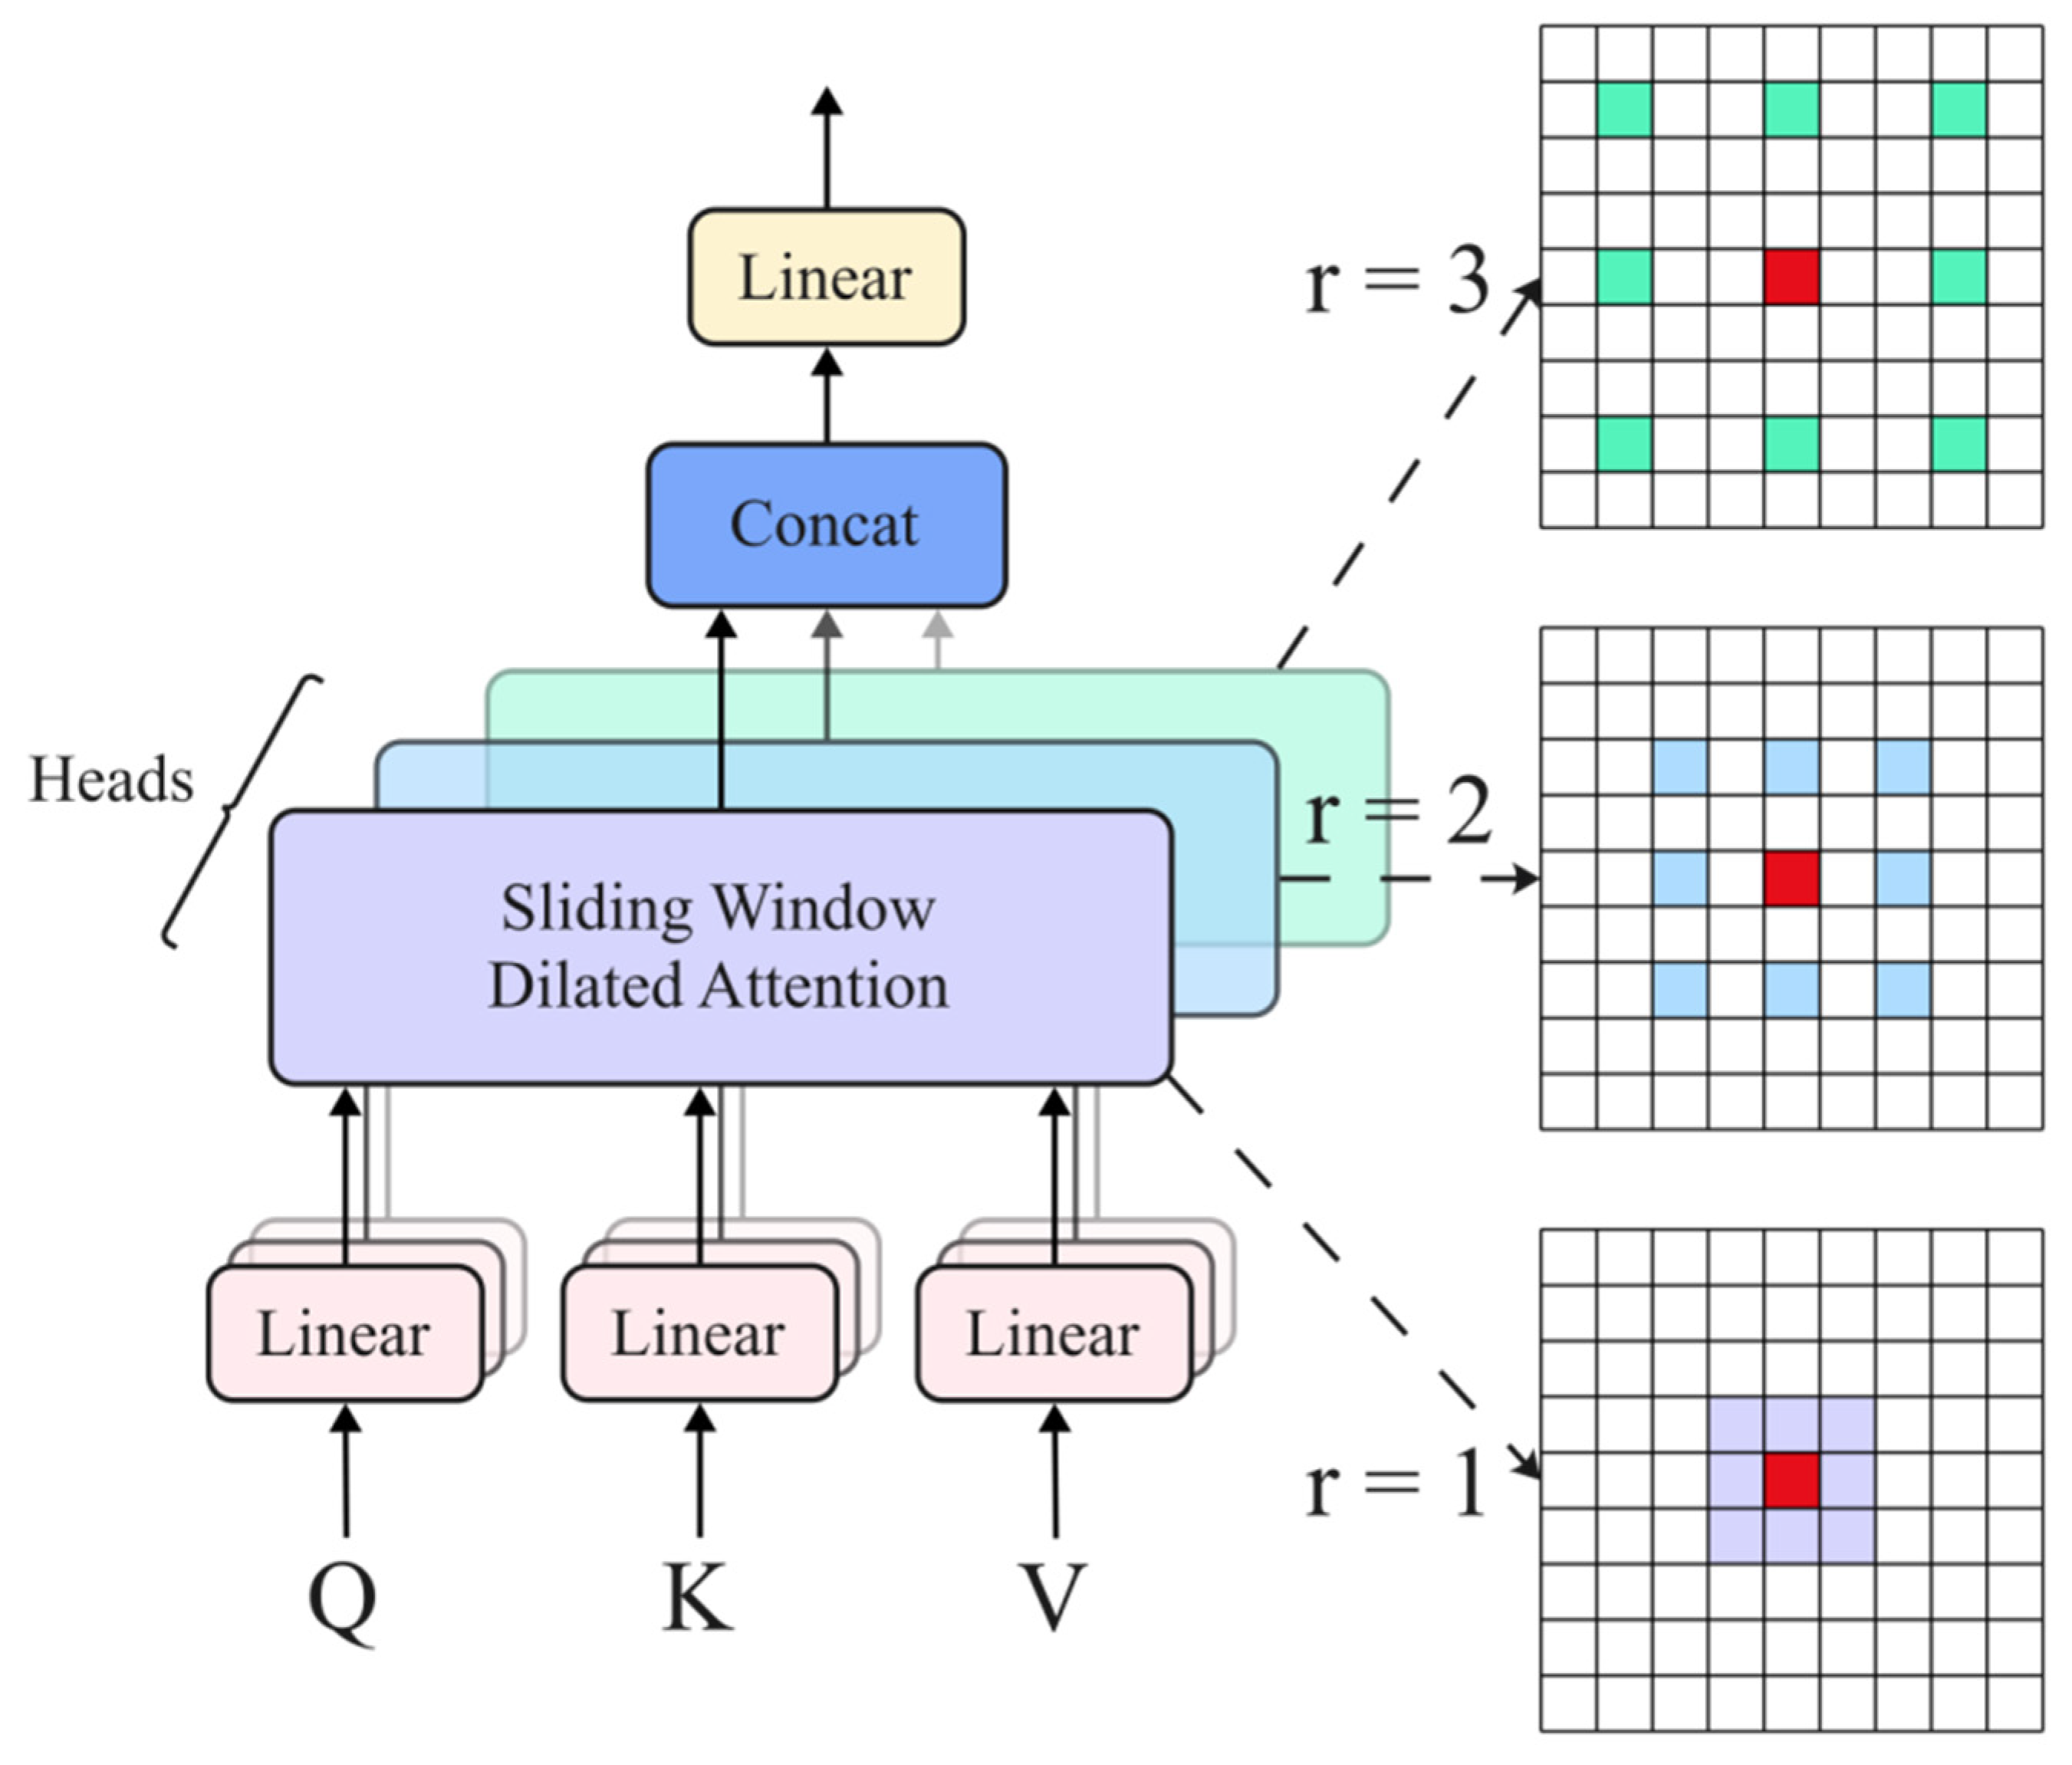
The core concept of MSDA involves introducing a sparse attention mechanism with varying dilation rates within local windows to model multi-scale contextual dependencies while minimizing the computational complexity. This module utilizes a multi-scale dilated attention mechanism to facilitate sparse information exchange across scales, enabling the model to capture long-range dependencies while preserving sensitivity to local structures. It integrates multi-head attention with channel-grouping strategies to achieve information decoupling and reconstruction across scales. Specifically, MSDA divides input features into multiple sub-channels and applies window attention with different dilation rates to each sub-channel. Subsequently, it concatenates and fuses the outputs from various scales to model and dynamically aggregate multi-scale contextual information, thereby enhancing the model’s robustness and expressive power in object recognition and localization tasks.
The MSDA method incorporates a multi-scale dilation rate design based on the Sliding Window Dilated Attention (SWDA) mechanism, which effectively expands the attention mechanism’s receptive field and boosts its representational capabilities. The core concept of SWDA involves introducing a sparse, dilated sampling strategy within a local window, where the dilation rate controls the spatial interval of attention operations. This mechanism is represented as follows:
X   =   SWDA ( Q , K , V , r )
x i j = Attention q i j , K r , V r
where Q denotes the query of the input features, K denotes the key of the input features, and V denotes the value of the input features. r represents the dilation rate, which governs the sparsity of the attention region. q i j signifies the query vector at position ( i , j ) . K r and V r are the key–value sets sampled from a specific neighborhood based on the dilation rate. By integrating dilation operations into the sliding window, SWDA enables perception of a broader range of contextual information while maintaining low computational complexity.
In the SWDA module, the choice of dilation rates is motivated by the need to balance fine-grained detail extraction and global-context modeling. We adopt a fixed dilation schedule of {1, 2, 4}, which progressively enlarges the receptive field and enhances the module’s robustness to multi-scale features without incurring additional computational overhead. Compared to dynamic adaptation strategies, this fixed design avoids potential training instabilities and ensures reproducibility across datasets. Specifically, a smaller dilation rate (e.g., 1) prioritizes the preservation of boundary details, whereas a larger dilation rate (e.g., 4) facilitates the modeling of long-range dependencies. Such multi-scale coverage is particularly beneficial in object detection tasks, where it effectively mitigates missed detections caused by scale variations. This design is inspired by the work of Li et al. [43], who emphasized that fixed dilation rates are a common practice and explicitly provided the sequence {1, 2, 4} as an example.
Building on this foundation, MSDA incorporates a multi-scale design by partitioning input features into multiple attention heads, each of which independently applies SWDA with varying dilation rates for modeling. This approach covers multi-level semantic information ranging from local to global. The computation for the i th attention head proceeds as follows:
h i   =   SWDA Q i , K i , V i , r i ,   1  ≤  i  ≤  n
where Q , K i , and V i represent slices of the input feature block, and SWDA operations are applied to these slices. Outputs from all heads are first concatenated, after which feature aggregation takes place through a linear layer, yielding the final output:
X = Linear Concat [ h 1 , h 2 , , h n ]
Via this design, MSDA captures semantic information at various scales, reduces redundant computations in global attention, and enhances the model performance across multiple visual tasks. Given that MSDA achieves a favorable balance between modeling capability and computational efficiency, this paper integrates it as a key component into the feature extraction module and applies it to detecting defects on steel surfaces, thereby improving the network’s perception of varying-scale defect features. The module’s structural diagram appears in Figure 6.
Compared to the standard multi-head attention (MHA) mechanism, the MSDA module introduced in this paper not only has higher complexity but also higher accuracy. Specifically, regarding the complexity-scaling characteristics of the two, the computational complexity of the standard MHA primarily stems from the calculation of the attention matrix, which is O ( N 2 D ) , where N represents the input sequence length and D denotes the embedding dimension. This complexity grows quadratically with the sequence length, limiting its scalability in high-resolution tasks. In contrast, MSDA introduces a multi-scale dilated attention mechanism to capture feature dependencies across different receptive fields. Specifically, the dilation operation sparsely samples query–key pairs at a dilation rate ( r ) during attention computation, thereby reducing the single-scale attention complexity to approximately O ( N 2 D / r ) . However, since MSDA uses multiple scales (assuming m dilation rate levels), its overall complexity scales to O m N 2 D / r ̄ , where r ̄ is the average dilation rate. While the dilation mechanism mitigates some quadratic overhead, the multi-scale superposition results in an overall complexity higher than that of standard MHA, especially when m > 1 and N is large, manifesting as additional consumption of computational resources.
Although MSDA has a high complexity, this trade-off has been empirically proven to be reasonable: through multi-scale feature extraction, MSDA significantly enhances the model’s ability to capture complex patterns (such as multi-level semantic dependencies), resulting in notable improvements in accuracy metrics (such as the mAP or accuracy) on benchmark datasets. This performance gain is particularly prominent in applications where computational resources are limited but accuracy is prioritized, such as real-time detection tasks. In such scenarios, the additional computational overhead of MSDA can be partially offset through parallel optimization (e.g., GPU acceleration), thereby optimizing the overall efficiency. Mathematical analysis further shows that when the sequence length (N) satisfies N > r, although MSDA’s complexity growth rate is higher than MHA’s, its gradient flow is more robust, supporting more stable training convergence, confirming the effective balance between accuracy and computational overhead in this design.

3.4. C3k2_DynamicConv

In steel surface defect detection tasks, CNNs find widespread application owing to their robust feature extraction capabilities. However, traditional convolutional operations in YOLOv11 encounter limitations when processing defects with complex textures or substantial local variations, mainly due to fixed receptive fields and constrained expressive power. To mitigate this issue, this paper proposes an enhanced strategy that incorporates a dynamic convolutional kernel structure into YOLOv11’s C3k2 module, yielding the C3k2_DynamicConv module [44]. This integration bolsters the network’s capacity to model features across diverse scales and complex contexts, thereby improving the feature representation flexibility and accuracy and ultimately enhancing the model detection precision and stability in detecting defects of steel surfaces.
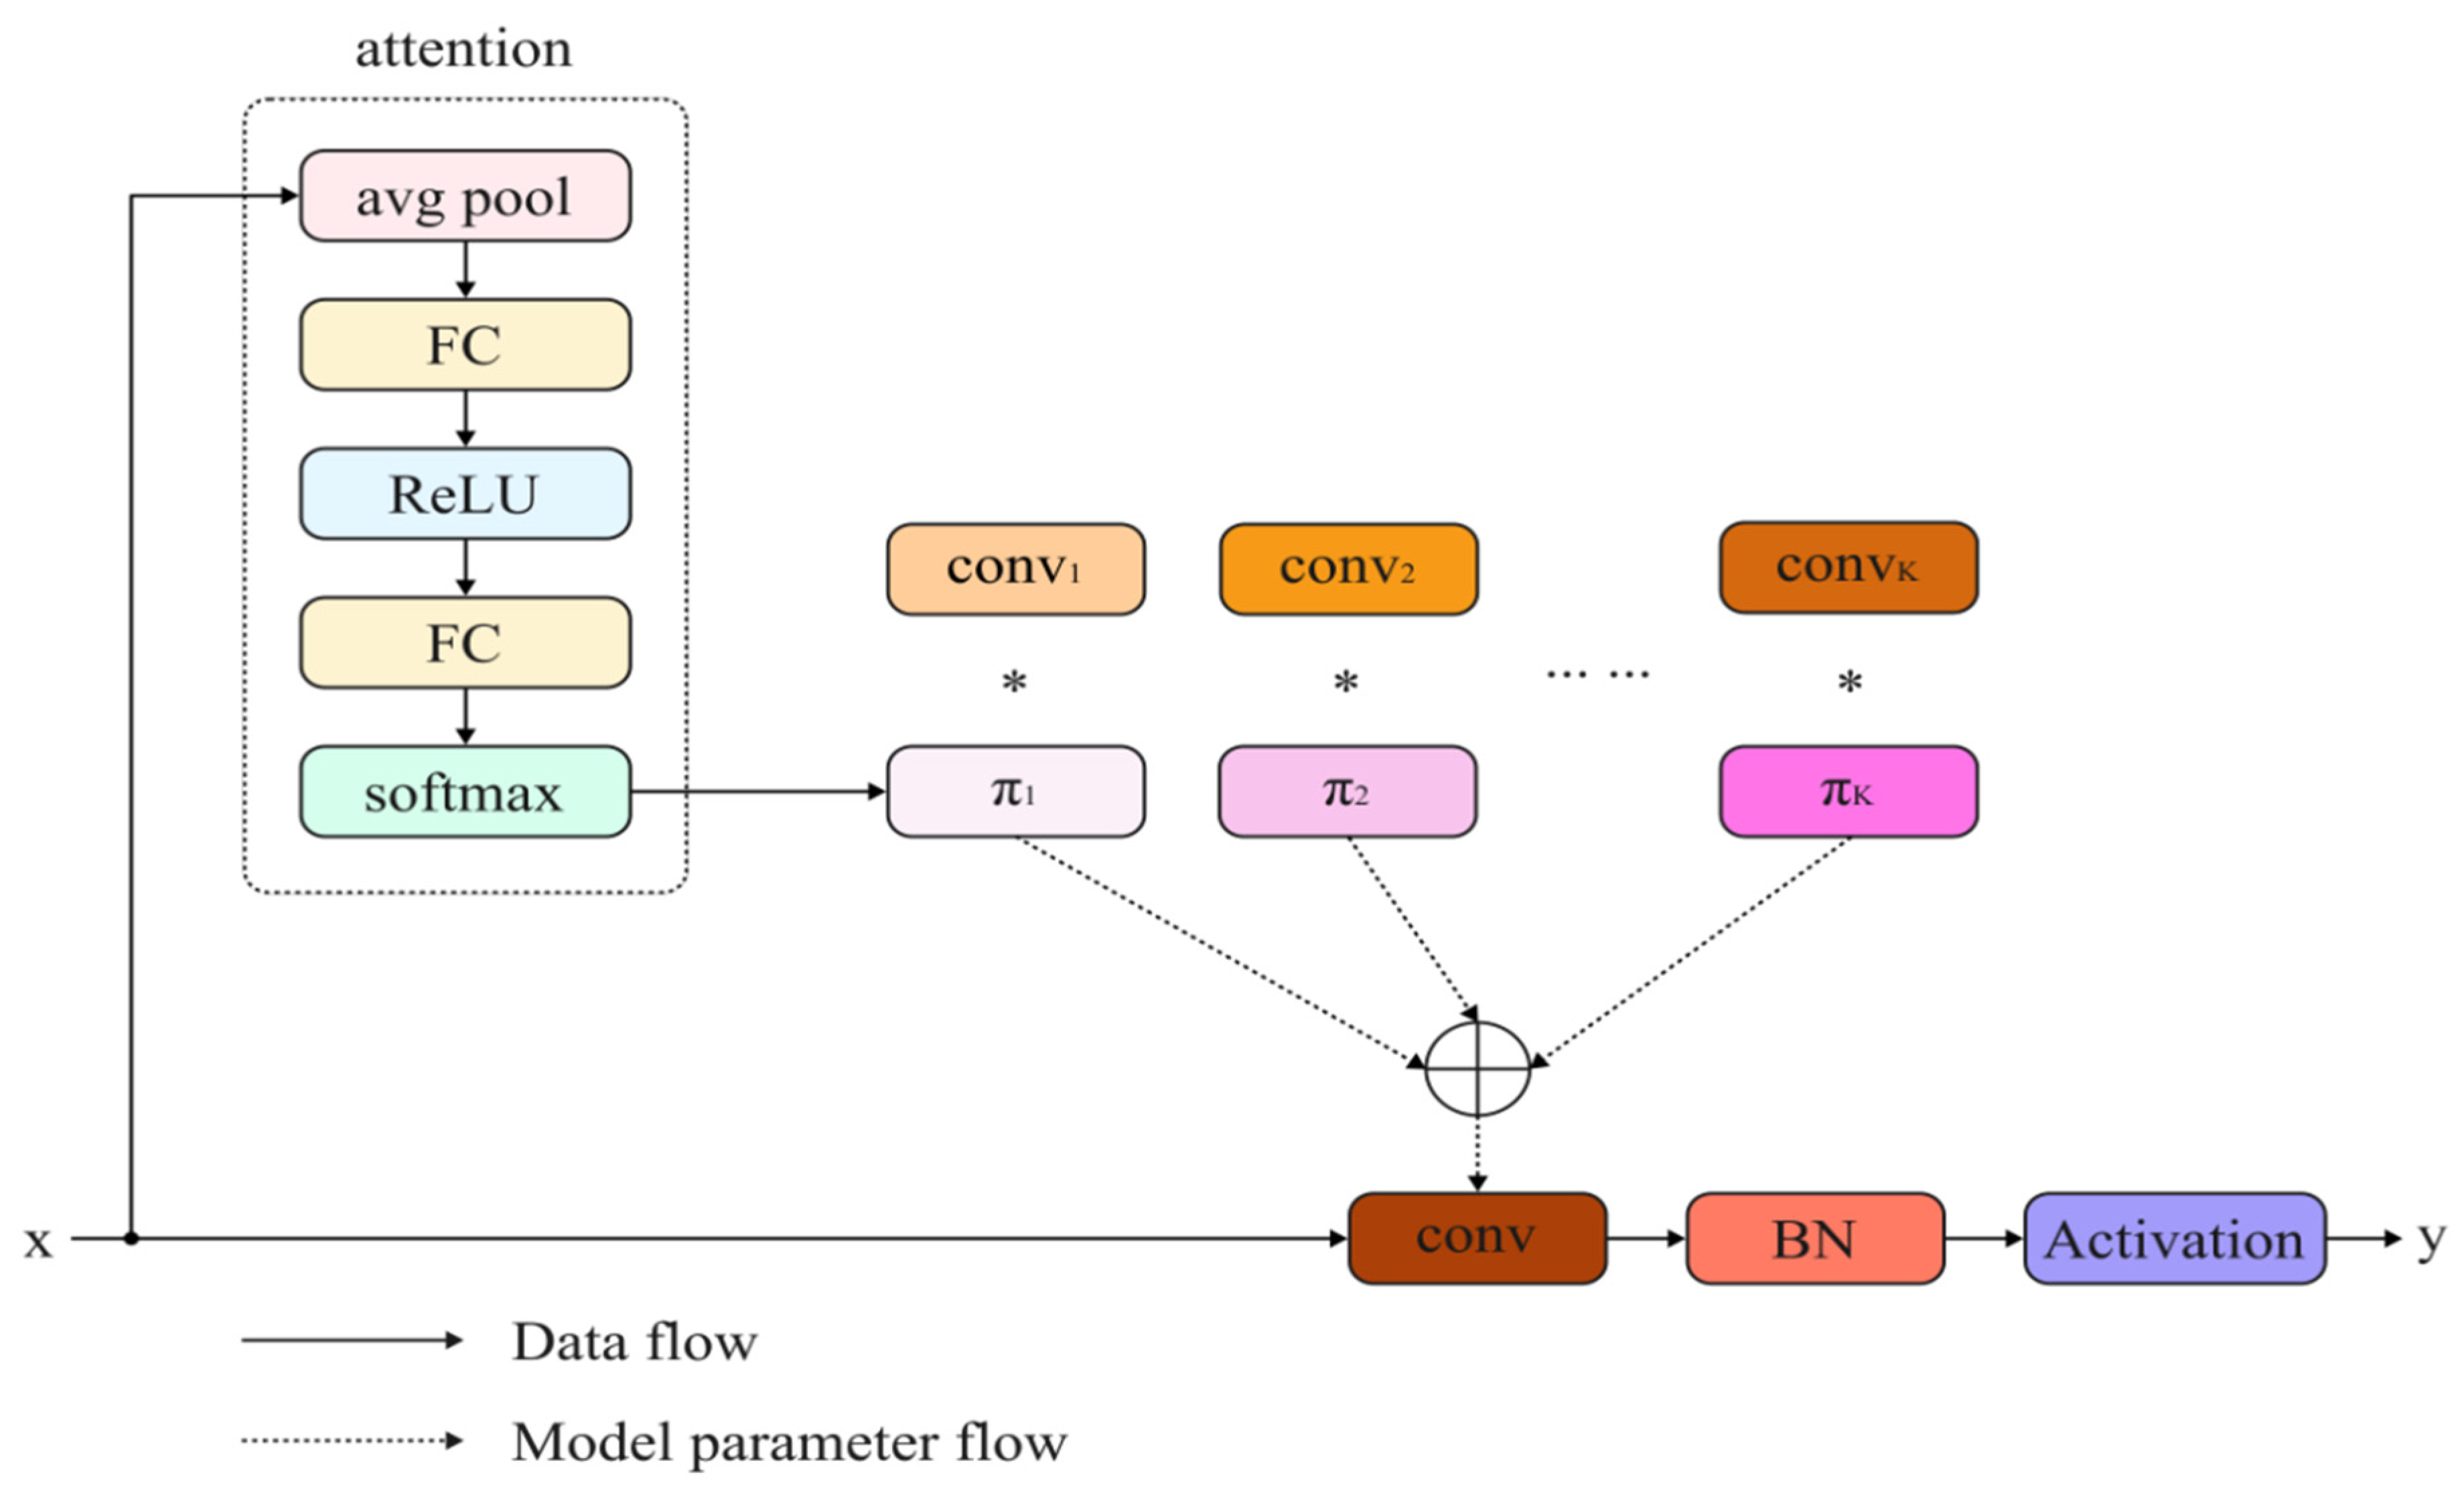
The core concept of C3k2_DynamicConv involves introducing a dynamic convolution mechanism to the traditional convolution structure, enabling the input-adaptive adjustment of kernel weights and, in turn, strengthening the model’s capability of modeling diverse semantic content. This module achieves input-aware kernel combinations through multi-branch convolution kernels and an attention-based weight generation mechanism, ensuring that the kernel weights for each sample during forward propagation are dynamically generated. Specifically, C3k2_DynamicConv employs a lightweight attention module to generate weight coefficients for each convolution branch, extracts features in parallel using K 3×3 kernels, and performs the weighted fusion of the branch outputs based on these weights, thereby improving the model’s flexibility and discriminative power in feature representation. This mechanism not only increases the model’s sensitivity to local details in complex scenes but also avoids the computational overhead associated with deeper networks.
C3k2_DynamicConv employs an input-dependent attention mechanism for weighted aggregation across multiple parallel convolution kernels, thereby dynamically generating convolution weights and enhancing the model’s expressive power. Specifically, let the input feature be denoted as x . The module utilizes K predefined static convolution kernels and bias terms, represented as W ~ k , b ~ k k = 1 K . It introduces input-related attention weights ( π k ( x ) k = 1 K ) to linearly combine these kernels, forming dynamic convolution kernels and bias terms:
W ~ ( x )   =   k = 1 K π k ( x ) W ~ k ,   b ~ ( x )   =   k = 1 K π k ( x ) b ~ k
where π k ( x ) represents the attention weight for the k th kernel, satisfying the normalization constraint:
0  ≤  π k ( x )  ≤  1 ,   k = 1 K π k ( x )   =   1
These attention weights ( π k ( x ) ) depend on the input ( x ). This attention distribution typically employs a Squeeze-and-Excitation module: it begins by performing global average pooling on the input feature tensor to extract global contextual features, then processes them through two fully connected layers (with ReLU activation in between), and, finally, generates normalized attention weights via a Softmax function. Upon integrating the dynamically generated kernel and bias into the standard convolution operation, the final output emerges as follows:
y   =   g ( W ~ ( x ) x   +   b ~ ( x ) )
where * denotes the convolution operation, and g ( · ) represents a nonlinear activation function (e.g., ReLU). This structure adaptively adjusts convolutional behavior based on varying inputs, exhibiting enhanced modeling capabilities for diverse texture features in steel surface defects (e.g., scratches, indentations, peeling).
By incorporating the C3k2_DynamicConv module, the defect detection model achieves improved robustness and discrimination accuracy without substantially increasing the computational load. The module’s structural diagram appears in Figure 7.

4. Multi-Stage Transfer Learning Strategy

This paper addresses the limitations of the YOLOv11-EMD algorithm in scenarios involving changes in target categories, defect shapes, or image feature distributions, including insufficient generalization, robustness, and adaptability, as well as inefficient utilization of knowledge from historical data. To overcome these challenges, it proposes a multi-stage transfer learning framework. This framework enhances the model’s boundary adaptability, cross-domain generalization, and feature expression flexibility during task transfer through pre-trained weights and parameter fine-tuning mechanisms. Consequently, it significantly improves YOLOv11-EMD’s robustness, generalization, and integration of historical knowledge in multi-source data environments, ensuring broad adaptability and sustained effectiveness in industrial steel defect detection.

4.1. Transfer Learning Mechanism

Transfer learning [45] constitutes a machine learning technique that transfers knowledge from a source task to a target task, proving particularly suitable for scenarios with limited target domain data and substantial distribution differences. In visual tasks, it effectively leverages general representations from pre-trained models to achieve faster convergence and a superior performance in the target task. Its advantages include sustaining strong generalization even without large-scale labeled data and mitigating overfitting risks arising from data scarcity or class imbalance. In steel surface defect detection, transfer learning holds particular importance. Models trained on specific datasets often suffer performance degradation under varying data distributions or conditions, exhibiting limited generalization and robustness. Moreover, industrial data sources change frequently, accumulating historical data that models fail to inherit and utilize efficiently. Consequently, transfer learning enhances the model adaptability and generalization across heterogeneous domains while facilitating the effective inheritance and reuse of historical knowledge during multi-stage task evolution, thereby offering theoretical and practical support for addressing performance degradation and inefficient knowledge utilization in industrial contexts.
Within the object detection algorithms of the YOLO family, transfer learning primarily involves utilizing the model weights from pre-training on large-scale, general datasets as initial parameters for YOLO networks in new tasks. Specifically, the YOLO model undergoes pre-training on datasets like ImageNet or COCO, which offer rich and diverse visual features, to develop robust feature extraction and generalization capabilities. Subsequently, these pre-trained parameters transfer to the object detection task and undergo fine-tuning with limited task-specific data, enabling rapid adaptation to the new task’s feature distribution and environment. This approach capitalizes on the strengths of large-scale general datasets in visual feature learning, thereby improving the initial detection performance in specific scenarios. Moreover, incorporating pre-trained features enhances the YOLO model’s adaptability to complex backgrounds, dynamic scenes, and varied object shapes, providing reliable detection in industrial applications.
The Ultralytics team fully open-sources pre-trained weights for YOLO-series models, which support various computer vision tasks, including object detection, instance segmentation, pose estimation, image classification, and oriented object detection. For object detection, the YOLOv11 model provides pre-trained weights in five different scales, as shown in Table 1.
YOLOv11’s pre-trained weights primarily originate from public datasets like COCO and VOC, which encompass natural scenes. However, the object categories in these datasets markedly differ from the morphology and distribution of steel surface defects. Consequently, direct application of the pre-trained model to steel surface defect detection yields limited specificity, with inadequate generalization to adapt to domain-specific features characterized by high background similarity and complex texture interference. Steel surface defects often appear as small cracks, pits, or oxidation, accompanied by metallic luster, scratches, and noisy backgrounds, rendering general pre-trained models ineffective at distinguishing defect regions from normal surfaces during feature extraction. Moreover, the embedded knowledge in the pre-trained parameters remains highly general but lacks domain specificity; when transferred to steel surface defect detection, it frequently activates irrelevant parameter paths, increasing the inference burden and compromising the real-time performance and accuracy in industrial settings. Therefore, in steel surface defect detection, targeted pre-training weights based on defect features become essential to heighten the model’s sensitivity and discrimination for small targets and complex defects, thereby enhancing the feature representation adaptability. Simultaneously, optimizing transfer learning strategies enables high-precision detection while preserving the inference speed, fulfilling industrial demands for efficient and accurate defect detection.

4.2. Source Domain and Target Domain Datasets

In this study, the source domain dataset comprises the Severstal steel surface defect dataset (6666 images) and the NEU-DET dataset (1000 images), merged and preprocessed to yield 10,000 high-quality images. This combined dataset encompasses six typical steel surface defect types: crazing, inclusions, patches, pitted surfaces, rolled-in scale, and scratches, featuring substantial category variations and complex background interference. Data augmentation, deblurring, and balancing preprocessing enhance the data consistency and model training stability. Consequently, the model learns discriminative feature representations amid diverse defect morphologies and intricate textures, improving the transferability and adaptability for downstream tasks. As industrial automation advances and steel surface treatment evolves, defect types diversify, demanding greater accuracy and efficiency in object detection. Thus, balancing robustness and adaptability in model feature representations across varied defect scenarios emerges as a critical research challenge in transfer learning for steel surface defect detection.
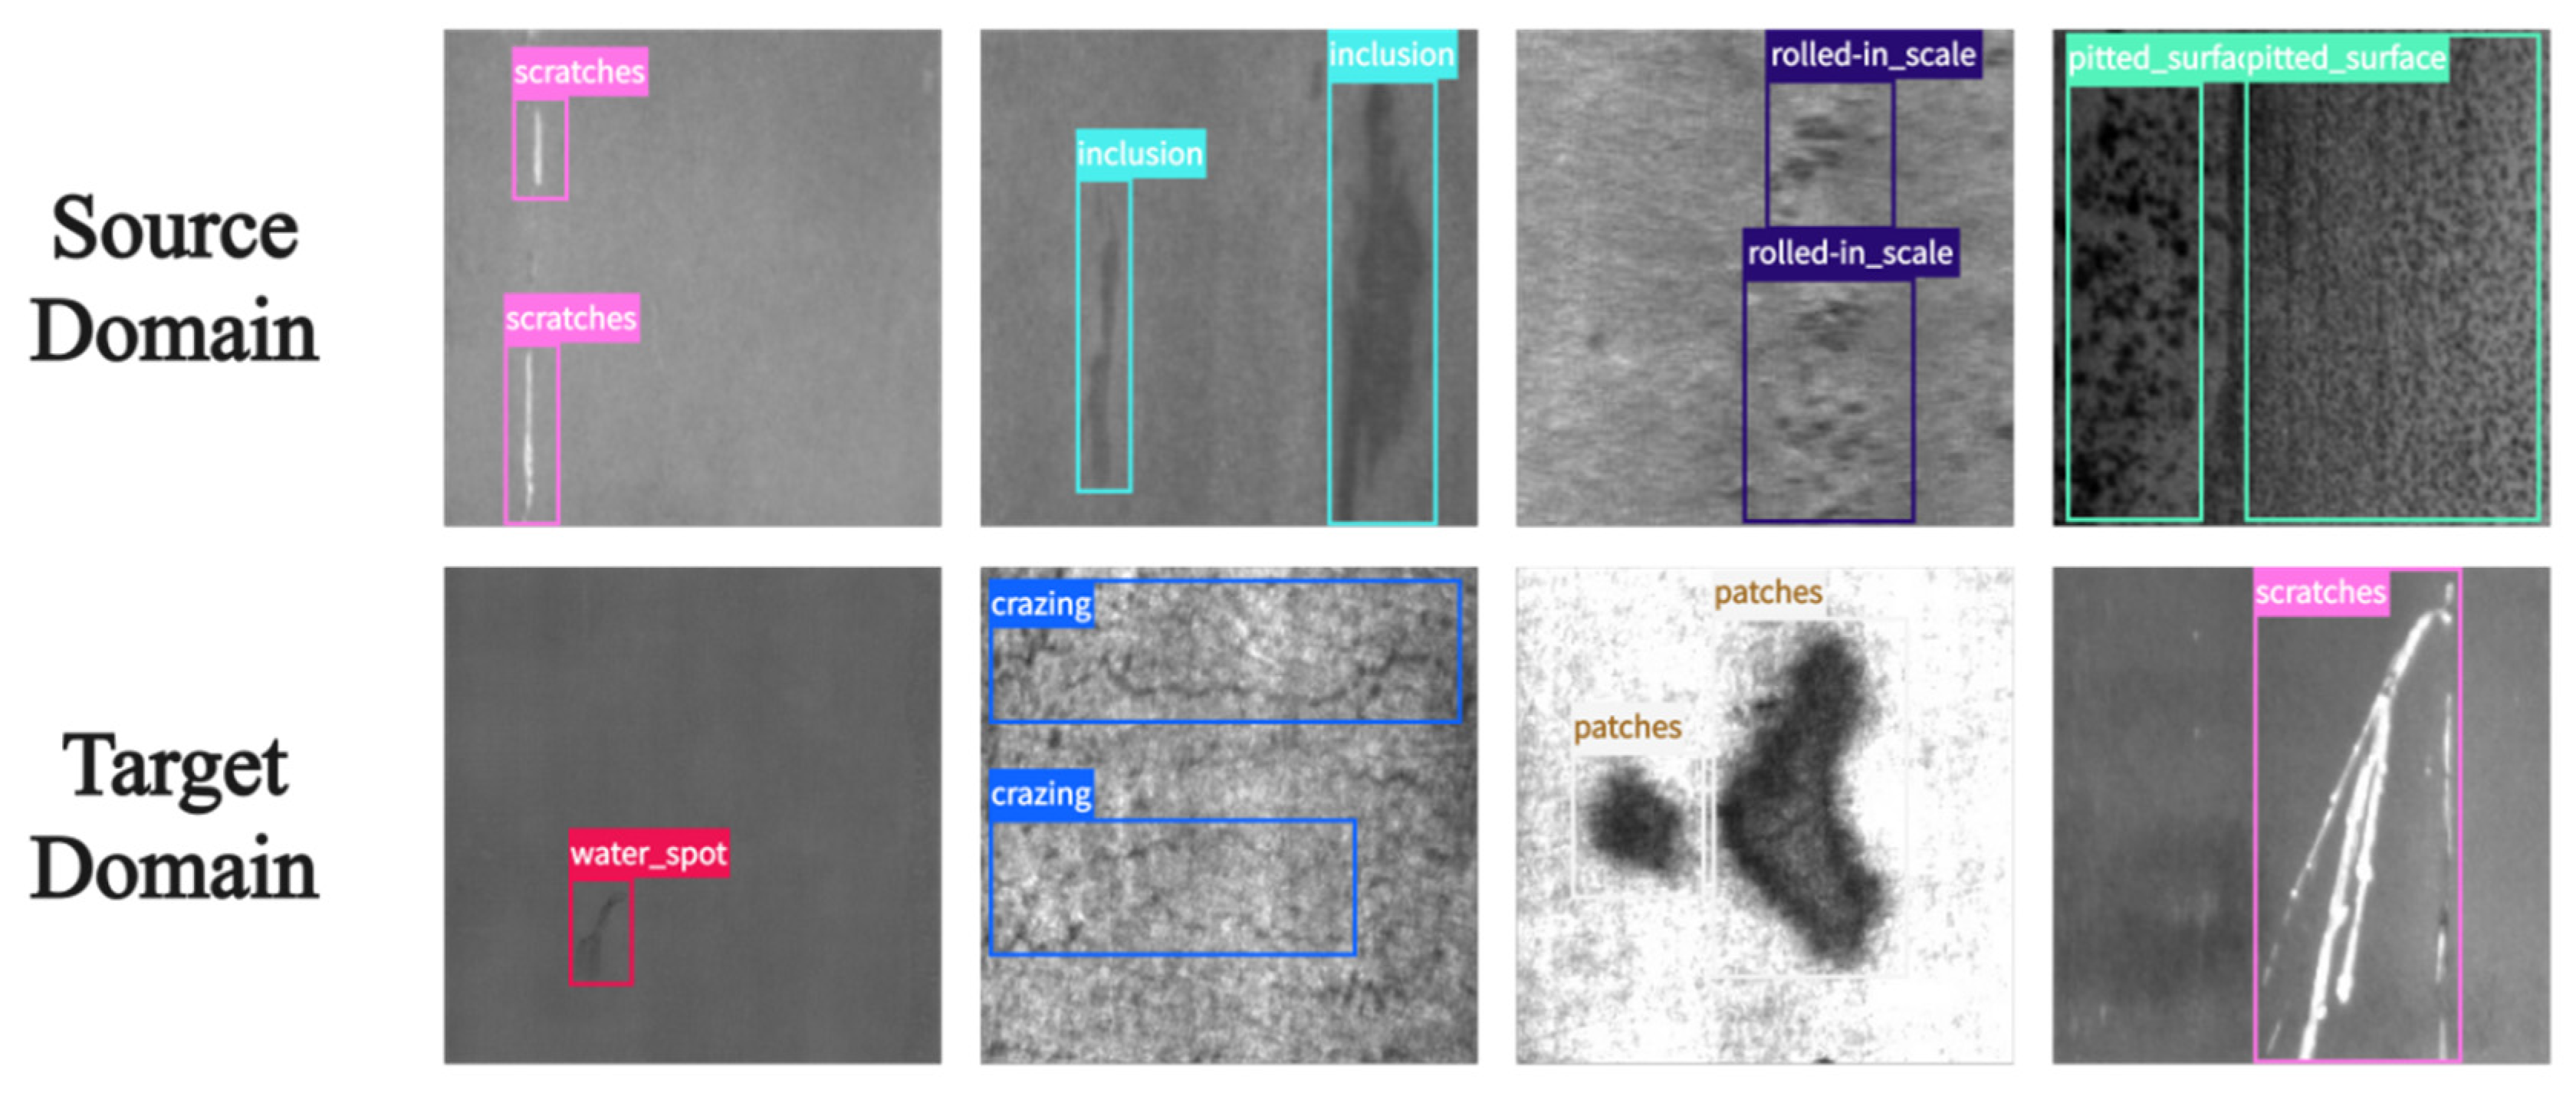
To further validate the proposed model’s adaptability and generalization in practical scenarios of detecting steel surface defects, this study constructs a target domain dataset aligned with industrial practices. Specifically, it includes the remaining 800 images from the NEU-DET dataset unused in the source domain training plus 1200 high-quality images from the GC10-DET dataset [46], forming a 2000-image target domain set. While both NEU-DET source and target images are captured under identical conditions, which may result in distributional similarity, this study supplements the target domain with images from the GC10-DET dataset, which is collected under different acquisition settings. This intentional domain discrepancy helps assess the model’s ability to handle real-world shifts in data distribution. During construction, images undergo uniform format standardization and quality screening, with the manual removal of samples featuring missing annotations, blurred boundaries, or low quality to ensure label accuracy and feature discernibility. This dataset encompasses 15 typical steel surface defect types: crazing, patches, inclusions, creases, water spots, rolled pits, silk spots, crescent gaps, welding lines, punching holes, oil spots, pitted surfaces, rolled-in scale, scratches, and waist folds. It features diverse complex backgrounds and fine-grained defect morphologies, offering strong representativeness and challenge. The mixed-domain target set is deliberately constructed. This design reflects realistic industrial scenarios where models are required to generalize not only to unseen domains but also to subsets of the same domain not used during training. Thus, this setup enables the proposed model, YOLOv11-EMD, to simultaneously examine the intra-dataset generalization (within NEU-DET) and inter-dataset generalization (to GC10-DET). Figure 8 compares source and target domain samples.

4.3. Multi-Stage Transfer Learning Framework

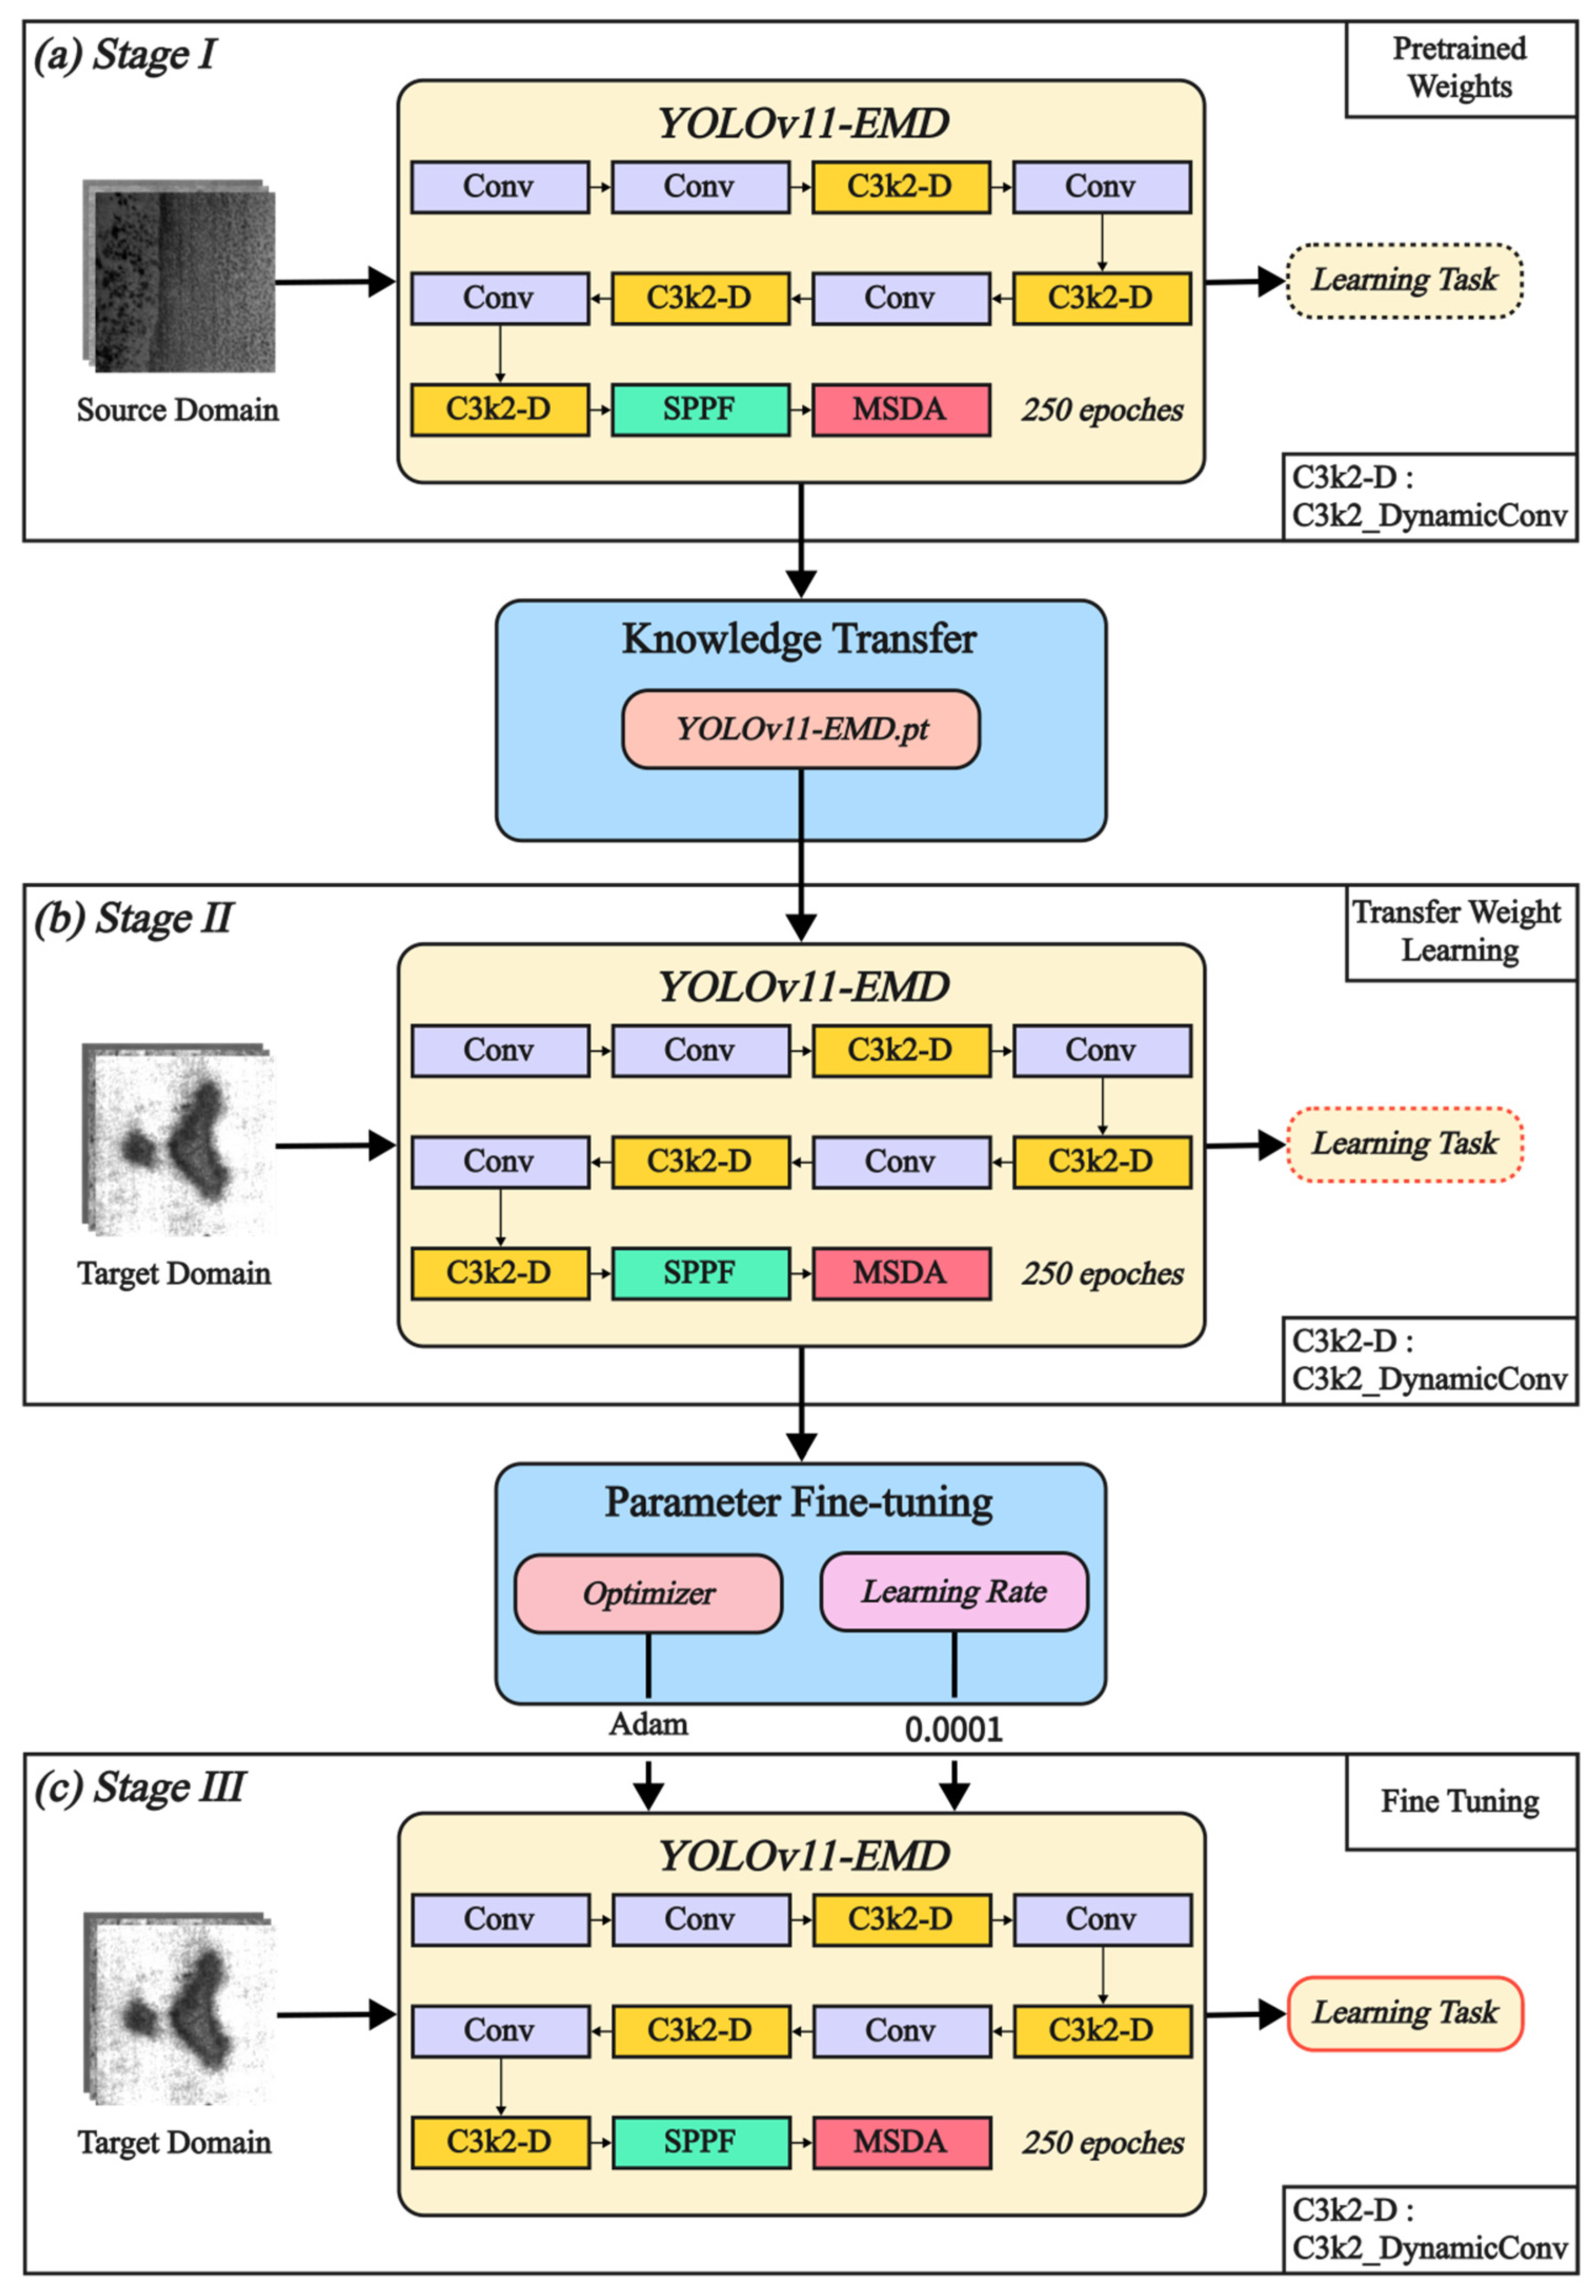
This paper proposes a multi-stage transfer learning framework to address challenges arising from substantial differences in the distribution, background interference, and feature representation in multi-source heterogeneous steel surface defect data, which complicate feature transfer. The framework exploits shared features across data sources, mitigates cross-domain adaptation barriers, and thereby enhances the model’s generalization and robustness in complex industrial environments with diverse defect types. Figure 9 illustrates the multi-stage transfer learning framework.
As illustrated in Figure 9a, the first stage involves the deep training of the model on widely sourced source domain data with ample samples. This study selects 10,000 fused steel surface defect images as the source domain data, encompassing six typical defect types with strong representativeness and diversity. To balance training sufficiency and prevent overfitting, the stage sets 250 training epochs, allowing the model to thoroughly learn general defect features from large-scale data. Additionally, to strengthen feature extraction in the source domain and facilitate effective cross-domain transfer, the stage employs the enhanced YOLOv11-EMD model, ensuring high-quality feature representations and weight initialization. This stage’s core objective centers on acquiring generalizable and discriminative representations through adequate training, providing a robust foundation and parameter support for the second stage’s target domain task transfer, which emphasizes small samples and complex distributions.
As illustrated in Figure 9b, in the second stage, the model initializes its parameters using the weights obtained from training on the source domain in the first stage and applies them to the target domain dataset for further training. Given that the target domain contains only 1080 images of steel surface defects, training from scratch may result in poor convergence and an unstable performance. Therefore, this study transfers the general features learned from the source domain, enabling the model to adapt more rapidly to the new data distribution within the target dataset and, in turn, boosting the stability of the training and initial performance. This stage provides a robust basis for follow-up fine-grained feature adjustments and task-specific performance optimization while the model’s ability to adapt and capacity for generalization in small-sample scenarios are being boosted.
As illustrated in Figure 9c, in the third stage, this study fine-tunes the model parameters to further enhance the detection accuracy and feature specificity in the target domain. Building on the target domain training from the second stage, this stage optimizes the strategy while maintaining the model’s core structure, achieving more precise parameter adjustments. Specifically, Adaptive Moment Estimation (Adam) is employed in the final fine-tuning stage, as its adaptive gradient mechanism enabled more stable optimization and yielded better convergence and accuracy than Stochastic Gradient Descent (SGD) in the conducted experiments. Concurrently, via grid search [47] and general experience, the upper bound is set to 0.1 and the lower bound to 1 × 10⁻⁶, from which the optimal learning rate is selected. Consequently, the learning rate is reduced from 0.1 to 0.0001, minimizing gradient fluctuations during training and bolstering the model’s stable updates under small-sample conditions. By adopting a more moderate optimization approach, the model deeply adapts to the target domain’s specific features while preserving transferred knowledge, thereby improving the recognition precision and stability in complex tasks involving steel surface defect detection.
Compared to two common strategies in traditional transfer learning, (1) directly training the YOLOv11 model on the source domain to obtain initial weights, and (2) loading a general pre-trained model such as YOLOv11n.pt in the target domain as a starting point, this study proposes a more targeted multi-stage transfer learning method. This method first trains the improved YOLOv11-EMD model on fused steel surface defect source domain data to acquire weights with domain-specific feature representation capabilities, then transfers these weights to the target domain for training, and, finally, performs fine-tuning optimization in the third stage. Compared to traditional approaches, this method effectively improves the alignment between model weights and the target task while preserving general feature extraction capabilities, thereby significantly enhancing the model’s adaptability and generalization performance under small-sample conditions. Ultimately, it achieves superior detection accuracy and robustness in complex steel surface defect detection tasks.

5. Experiment and Analysis

5.1. Simulation Environment

5.1.1. Experimental Environment

The simulation environment used in this experiment is based on the Linux operating system, equipped with an Intel(R) Xeon(R) Gold 6430 processor and an NVIDIA GeForce RTX 4090 GPU (with 24,210 MiB of video memory). In terms of the software environment, Python 3.12 is used for programming and experimentation. The deep learning framework selected is Ultralytics version 8.3.50, with underlying computations implemented using PyTorch 2.5.1+cu124. Additionally, CUDA 12.4 is configured to fully leverage the GPU acceleration performance. Table 2 details the specific simulation environment.

5.1.2. Parameter Settings

To accelerate model convergence and enhance the overall performance, this study employs an optimized set of hyperparameter configurations during training. The model is trained for 250 epochs with a batch size of 16. Training occurs in a high-performance RTX 4090 GPU environment, which effectively improves the parallel computing efficiency and training speed. The input image size is uniformly set to 800 × 800 to preserve feature details while managing computational overhead. Additionally, automatic mixed precision (AMP) and data augmentation (Augment) strategies are enabled during training to further optimize the memory utilization and training efficiency. The complete training parameter settings are detailed in Table 3. The YAML configuration file structure diagram of YOLOv11-EMD is provided in Appendix A for readers to reproduce.

5.1.3. Evaluation Indicators

In tasks focused on detecting objects, two critical assessment measures, the precision and recall, gauge a model’s effectiveness, with the former reflecting its accuracy and the latter its comprehensiveness. Additionally, the mAP@50 and mAP@50:95 are widely adopted as evaluation standards. The former gauges the detection accuracy when the IoU threshold is 0.5, while the latter assesses the overall performance across a range of IoU thresholds. Beyond the detection accuracy, the model’s inference speed and computational overhead are critical, typically quantified by frames per second and GFLOPs, where FPS indicates the inference speed and GFLOPs measure the computational complexity. Furthermore, the training time is an essential metric, representing the duration from training initiation to convergence. The ratio of true positives to all detected positive cases is measured by the precision (P), which is defined by the following formula:
P = T P T P + F P
where T P denotes the number of true positives and F P the number of false positives. Higher precision signifies greater accuracy in target detection. The recall (R) measures the ratio of actual positive cases successfully identified by the model, with its calculation defined by the following formula:
R   =   T P T P   +   F N
where F N denotes the number of false negatives. A higher recall indicates a stronger capability in detecting actual targets. In terms of the mean average precision (mAP), the mAP@50 serves as a standard evaluation metric in object detection, representing the average precision across all categories at an IoU threshold of 0.5. It is defined as follows:
m A P @ 50   =   1 N i = 1 N A P i
where N denotes the number of categories, and A P i is the average precision for the i th category. This metric assesses the model’s overall detection performance at a specific IoU threshold. The mAP@50:95 provides a more rigorous evaluation by averaging the precision over IoU thresholds from 0.5 to 0.95 in steps of 0.05, formulated as follows:
m A P @ 50 : 95   =   1 10 t = 50 95 m A P t
where t represents each IoU threshold value. Consequently, the mAP@50:95 comprehensively evaluates the model’s detection performance across varying IoU thresholds. Frames per second (FPS) gauges how many image frames the model can process each second, serving as a key metric for the inference speed. It is defined as follows:
FPS  =   1 P T
where P T denotes the processing time per frame. Higher FPS values indicate greater inference efficiency. Giga Floating-Point Operations (GFLOPs) quantify the total floating-point operations required to process an image, expressed in billions, reflecting the model’s computational resource demands. For a convolutional layer in a neural network, FLOPs are calculated as follows:
FLOPs  =   2  ×  C in  ×  C out  ×  K H  ×  K W  ×  H out  ×  W out
where C i n and C o u t represent the input and output channels, K H and K W the kernel height and width, and H o u t and W o u t the output feature map dimensions. The total FLOPs ( TotalFLOPs ) of the model can be obtained by summing the computational quantities of all network layers, and the GFLOPs can be calculated using the following formula:
GFLOPs  =   TotalFLOPs 1 0 9
where lower GFLOPs signify higher computational efficiency. The training time refers to the duration from training initiation to convergence, measured in hours (h), with shorter times indicating superior training efficiency.

5.2. Model Validation

5.2.1. Training Process Analysis

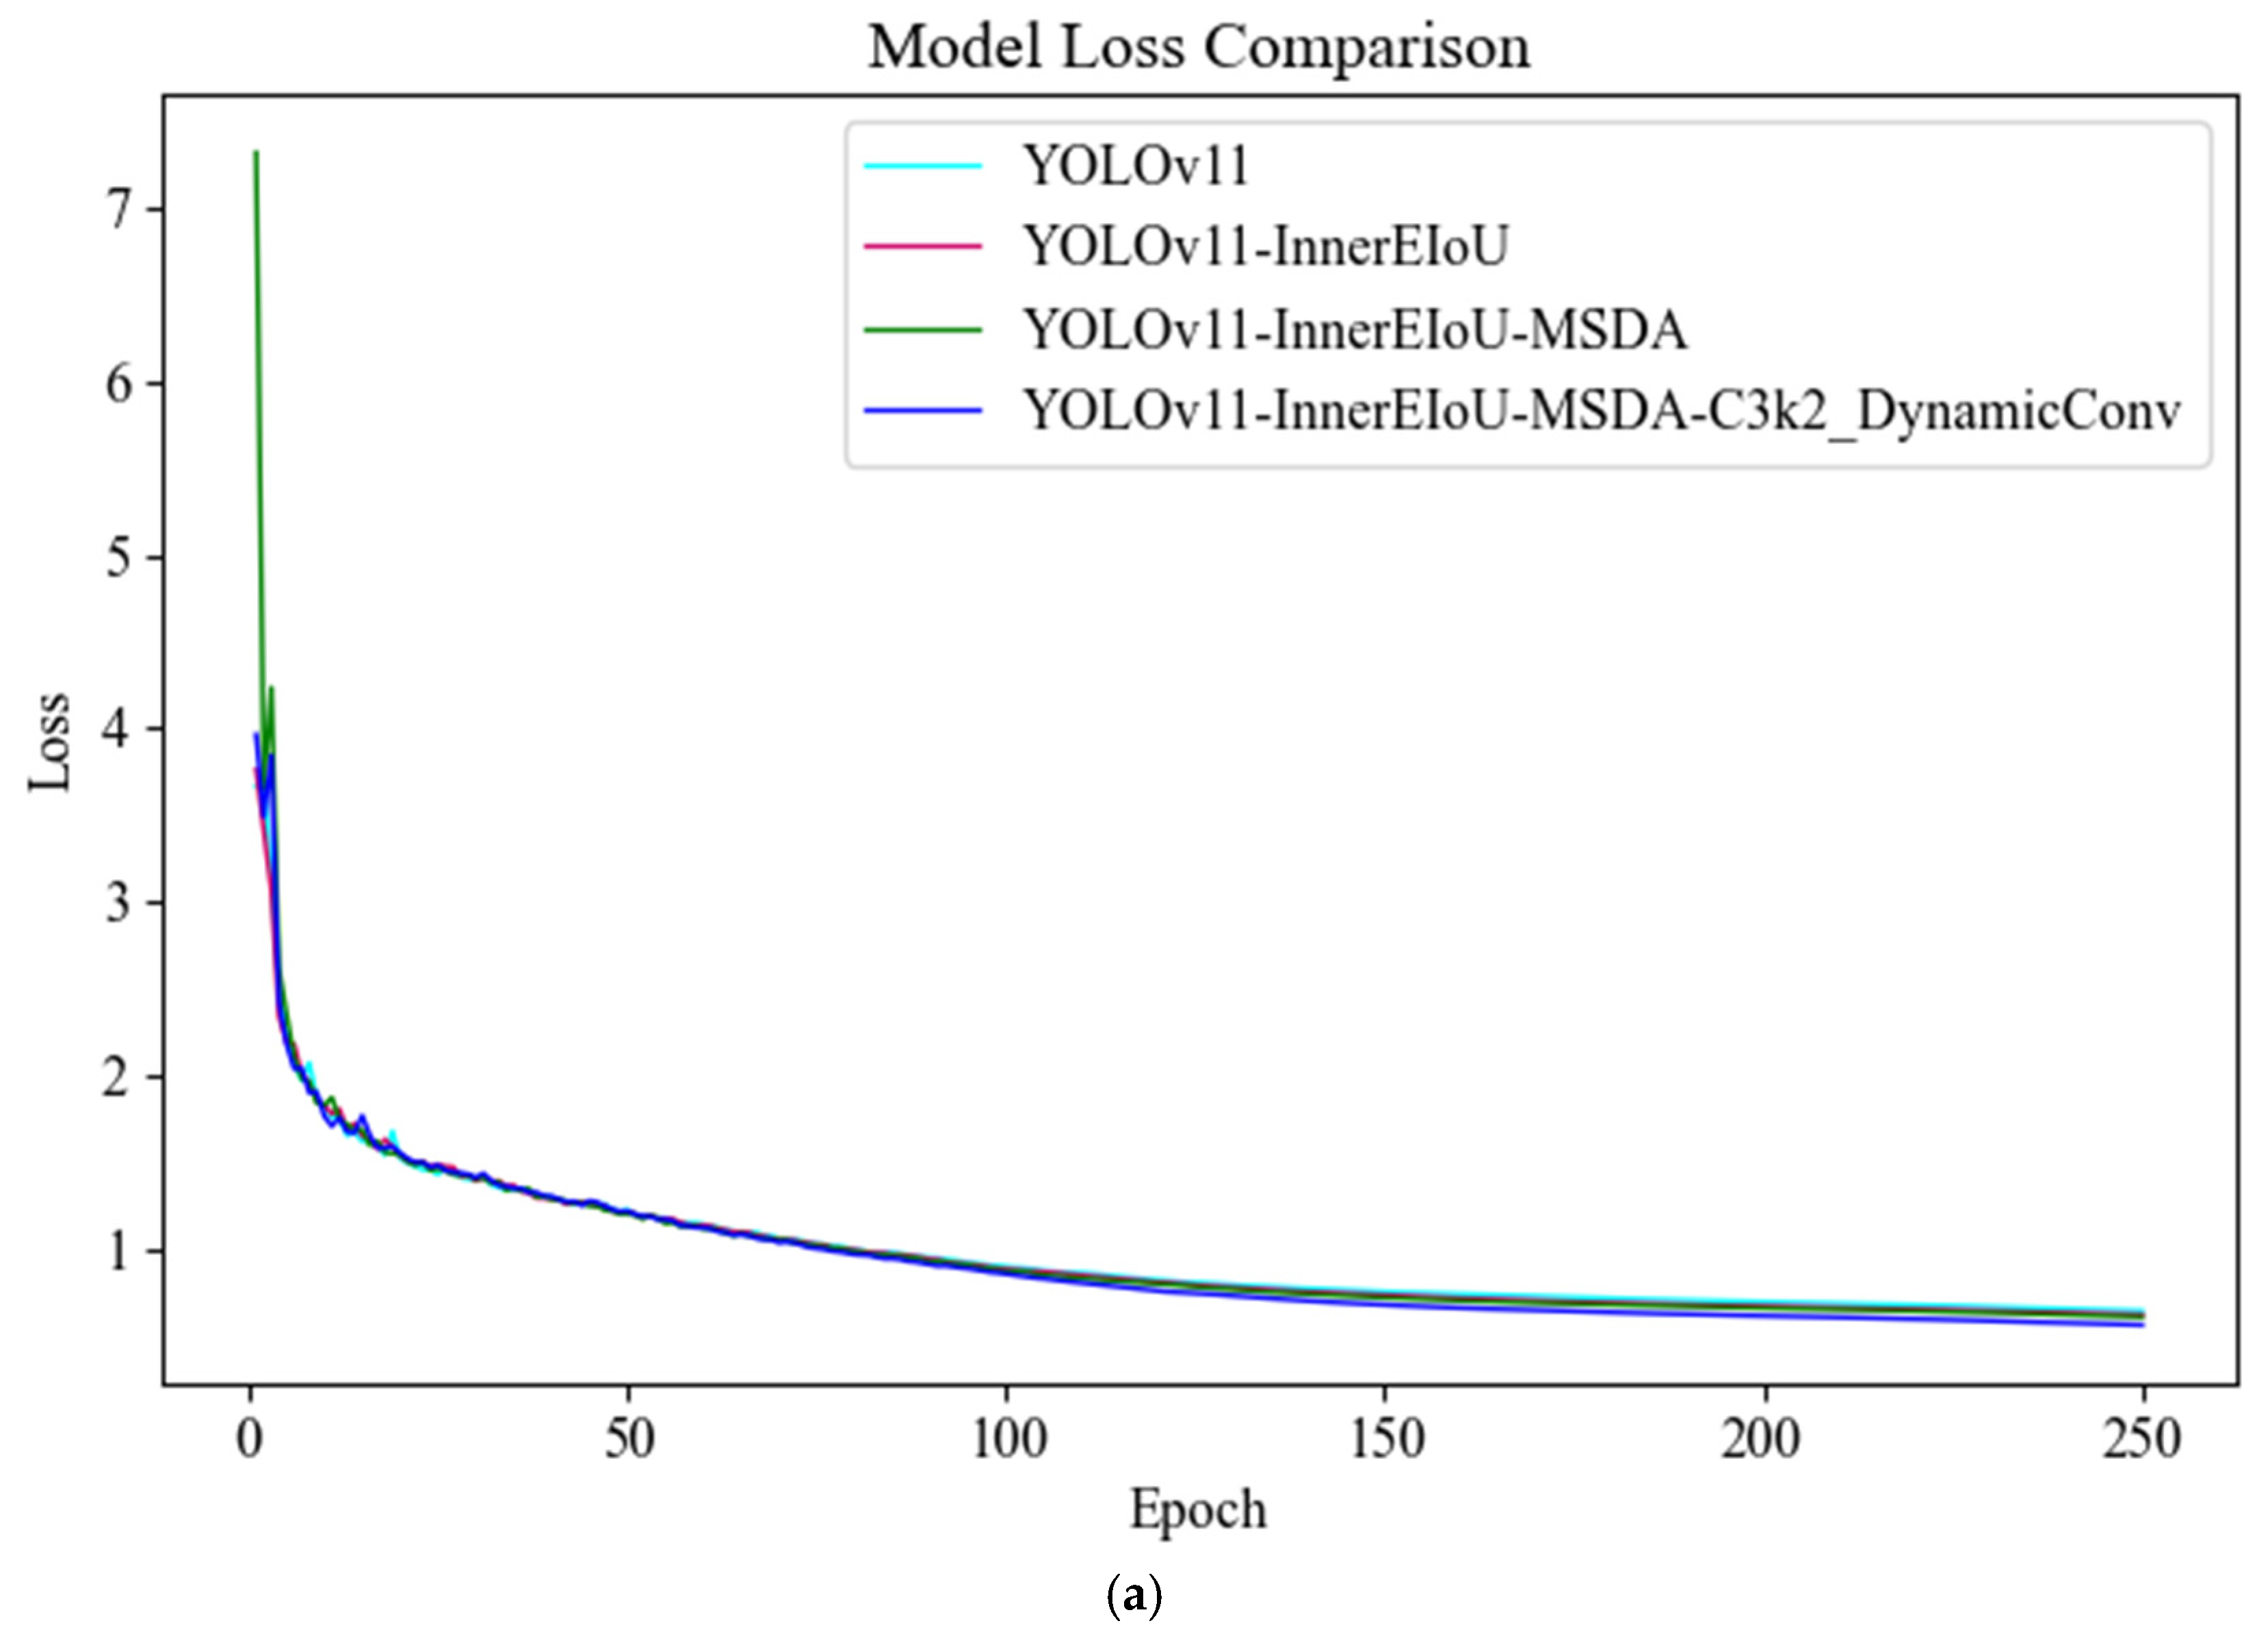
To further validate the effectiveness of the improved model for steel surface defect detection, this study systematically trained the YOLOv11-EMD model on the source domain dataset, with a focus on assessing its feature learning capability, convergence speed, and multi-scale information fusion performance. During training, the model underwent sufficient iterations on a large-scale annotated dataset, while trends in the classification loss and mAP@50 were tracked to comprehensively evaluate the performance in the training stage. Relevant experimental findings are presented in Figure 10.
As illustrated in Figure 10a, the classification loss of the model decreased continuously with increasing training epochs. In the initial phase, the loss dropped rapidly from approximately 4.0 to 1.0, demonstrating the YOLOv11-EMD model’s strong feature extraction and rapid convergence. As training advanced, the loss curve flattened after the 70th epoch, entering convergence and approaching 0 by the 250th epoch. This pattern indicates sustained stability without evident overfitting, underscoring the robustness of the hyperparameter configuration. Correspondingly, as illustrated in Figure 10b, the mAP@50 metric exhibited a steady upward trend. It rose rapidly in the first 40 epochs, stabilized, and converged after the 120th epoch, reaching approximately 0.95. These results affirm the model’s superior target recognition and accuracy in steel surface defect detection. Notably, in industrial scenarios with complex textures and multi-scale defects, the model maintains a high localization and classification performance, confirming its effectiveness and generalization.
To further validate the applicability of the enhanced YOLOv11-EMD model across various types of steel surface defects, this study performed a category-specific performance evaluation. Key metrics, including the P, R, mAP@50, and mAP@50:95, were computed individually for each defect type. Table 4 provides the findings.
As shown in Table 4, the proposed YOLOv11-EMD model demonstrated a remarkable performance in multi-class industrial defect detection. The model achieved an overall average mAP@50 of 0.949 and average mAP@50:95 of 0.747, with corresponding precision (P) and recall (R) values of 0.942 and 0.868, respectively, underscoring its strong overall detection capability. In terms of the scale-aware performance, the model maintained stable accuracy across targets of varying sizes. For small-scale defects (e.g., rolled-in scale), the model achieved an mAP@50 approaching 0.88, highlighting its effectiveness in small-object detection. For medium-scale defects (e.g., pitted surfaces and inclusions), the mAP@50 consistently exceeded 0.92, reflecting a robust detection accuracy. For large-scale defects (e.g., crazing, patches, and scratches), the mAP@50 surpassed 0.97, demonstrating the model’s outstanding ability in detecting large targets. These findings further validate the enhanced adaptability and feature fusion capacity of YOLOv11-EMD in multi-scale defect detection. The corresponding detection results are illustrated in Figure 11.
As shown in Figure 11, the model exhibited an excellent detection performance for medium-sized targets and also achieved a high performance in small-target detection. Overall, the YOLOv11-EMD model exhibited an outstanding performance in terms of its training efficiency, detection accuracy, and adaptability to multi-scale targets, thereby fully validating its practical potential in tasks of detecting industrial defects. Notably, the model’s stable convergence and robust feature extraction capabilities during source domain training lay a solid foundation for the subsequent cross-domain transfer learning, further enhancing its transferability and generalization in multi-scenario intelligent detection.
In industrial inspection tasks, defect instance overlap and boundary blurring or occlusion are common challenges. The MSDA mechanism integrated into the proposed model is designed to effectively alleviate these issues. This mechanism enables the detector to adaptively focus on sparse but informative sampling points around reference features, which improves discrimination of adjacent targets and preserves cues from partially visible defects. Prior studies have shown that deformable attention significantly enhances the detection robustness in crowded or occluded scenes by mitigating the feature confusion between overlapping objects [48]. Representative detection results under such overlapping and occlusion conditions are illustrated in Figure 12.
As illustrated in Figure 12, YOLOv11-EMD exhibited a stable detection performance under overlapping and occluded defect scenarios, with no significant increase in missed or false detections. It can be observed that the model maintained high accuracy in both inter-class overlap and intra-class occlusion cases, with all predicted bounding boxes achieving confidence scores of at least 80%. These results demonstrate that the proposed model retains strong robustness and detection capability even in such complex conditions.
However, the model’s detection performance deteriorates under extreme conditions. As shown in Figure 13a, in low-light settings, the detection confidence decreases moderately but most defects can still be localized. In contrast, Gaussian noise causes a substantial reduction in the detection confidence and introduces false negatives, reflecting the model’s sensitivity to signal distortion, as can be seen in Figure 13b. Figure 13c demonstrates that when images contain dense defects or repetitive textures and there is noise interference, the false-positive rate increases, indicating limited discriminative capacity in such contexts. Figure 13d shows that under overexposed conditions, false negatives remain frequent, suggesting reduced robustness to variations in illumination.
These findings highlight that, although the proposed framework achieves strong results in standard scenarios, its robustness under complex industrial environments remains constrained. Such limitations may reduce its reliability in real production lines, particularly under fluctuating illumination or noisy surface conditions. To mitigate these challenges, potential improvements include advanced data augmentation, adaptive feature denoising, and texture-aware modeling, which could enhance the stability and generalization in practical applications.

5.2.2. Ablation Experiments

To fully verify how well each enhanced module boosts the model performance, ablation experiments were carried out on the preprocessed Severstal steel surface defect dataset and NEU-DET dataset, as detailed in this paper. These experiments were based on the YOLOv11 model, with improvements incorporated module by module to quantify each module’s contribution to the detection accuracy and efficiency. The specific experimental procedure was as follows: First, the default CIoU loss function of YOLOv11 was replaced with the InnerEIoU. Then, the C2PSA layer in the backbone network was substituted with MSDA. And finally, all C3k2 modules in the network were replaced with the dynamic convolution kernel C3k2_DynamicConv module. Experimental findings are provided in Table 5.
As shown in Table 5, each enhanced module plays a significant role in improving the model’s performance for small-target defect detection. The base YOLOv11 model achieved an mAP@50 of 0.933, an mAP@50:95 of 0.706, and GFLOPs of 6.3. After replacing the original CIoU loss function with the InnerEIoU, the mAP@50 increased by 0.5%, and the mAP@50:95 increased by 1.1%. This improvement demonstrates that the InnerEIoU enhances the distinction between positive and negative samples through inner-region constraints while effectively reducing localization bias during regression, thereby improving the bounding box regression accuracy. Furthermore, substituting the original C2PSA structure with the MSDA module yielded a 0.5% increase in the mAP@50 and a 1.1% increase in the mAP@50:95. As a multi-scale dynamic enhancement module, MSDA adaptively extracts feature information across different spatial scales and dynamically adjusts the attention distribution to amplify responses in key regions, enabling the more accurate capture of small defect targets in complex backgrounds and bolstering the network’s stability and perceptual capacity. Additionally, replacing the traditional C3k2 module with C3k2_DynamicConv resulted in a further 0.6% improvement in the mAP@50, a 1.9% increase in the mAP@50:95, and a 0.9 rise in GFLOPs. This outcome underscores the substantial advantages of C3k2_DynamicConv in feature extraction, as it adaptively adjusts convolution kernel parameters based on input features to enhance sensitivity to structural changes, thereby providing stronger expressive power and adaptability for identifying defects with varying shapes and scales. The loss function curve and accuracy curve of the ablation experiment are shown in Figure 14.
As shown in Figure 14a, during the ablation experiment, the loss function values of the model exhibited a steep decline trend in the initial stages. As the number of training iterations increased, the decline in the loss function gradually flattened out after 70 iterations. As can be clearly seen from the figure, as more modules were added, the loss function values of the model continued to decrease, indicating that the introduced modules effectively reduced the model’s loss values. For example, the baseline model YOLOv11 had the highest loss value at around 250 iterations. After introducing the InnerEIoU module, the latter had a lower loss value at the same number of iterations and exhibited greater model stability. Similarly, after gradually introducing the MSDA and C3k2_DynamicConv modules, the model’s loss value further decreased and eventually stabilized around 0.55, fully demonstrating the effectiveness of the introduced modules. As shown in Figure 14b, during the ablation experiment, the model’s accuracy initially exhibited a sharp increase trend. As the number of training epochs increased, the accuracy increase trend stabilized after 40 epochs and began to converge after 120 epochs. From the figure, it can be clearly observed that as modules were continuously added, the model’s accuracy continued to improve, indicating that the introduced modules effectively enhanced the model’s detection accuracy. For example, the baseline model YOLOv11 achieved its lowest accuracy at 250 iterations. After introducing the InnerEIoU, the latter achieved a higher accuracy and faster detection speed at the same number of iterations. Similarly, after gradually introducing the MSDA and C3k2_DynamicConv modules, the model’s accuracy further improved, ultimately converging around 0.95. Therefore, the modules introduced in this paper can effectively enhance the model’s stability, accelerate the model’s detection speed, reduce the model’s loss value, and improve the model’s detection accuracy. Even when faced with issues such as complex steel surface textures and multi-scale defects in industrial scenarios, the model can still maintain a high-level detection performance, fully validating its effectiveness and versatility. Overall, the enhanced model design balances the detection performance with computational complexity, confirming the effectiveness of each strategy.

5.2.3. Comparative Experiments

Systematic comparative experiments were conducted on the preprocessed Severstal steel surface defect dataset and NEU-DET dataset to demonstrate the advantages of the presented YOLOv11-EMD model, selecting several state-of-the-art object detection algorithms as benchmarks to comprehensively assess the enhanced performance of the model in industrial defect detection tasks. The comparison models included CLS-YOLO [49], HCP-YOLO [50], SDS-YOLO [51], InnerGIoU-MSDA-C3k2_ContextGuidedBlock (GMC-YOLO), InnerEIoU-MSDA-C3k2_DBB_backbone (EMDB-YOLO), UIoU-CAA-C3k2_RFAConv (UCR-YOLO), YOLOv8, YOLOv10, and the proposed YOLOv11-EMD model. To ensure a fair comparison, all experiments were conducted under identical conditions, including the dataset, image resolution, optimizer, batch size, learning rate schedule, and training epochs. The only variable across the experiments was the model architecture itself. This controlled design eliminates potential confounding factors and guarantees that any observed performance differences can be attributed solely to the models under evaluation. The results are presented in Table 6.
As shown in Table 6, the CLS-YOLO model achieved an mAP@50 of 0.907 and an mAP@50:95 of 0.659, with GFLOPs of 5.3 and a training time of 3.044 h. Compared with the proposed YOLOv11-EMD model, the latter enhanced the mAP@50 by 4.2% and the mAP@50:95 by 8.8%. Although CLS-YOLO exhibited lower computational complexity, its detection accuracy fell considerably short, and the training time was increased by 5.0%, indicating that the proposed model achieves a better trade-off between accuracy and efficiency. The HCP-YOLO model attained an mAP@50 of 0.911, an mAP@50:95 of 0.666, GFLOPs of 9.1, and a training time of 6.711 h. In contrast, the YOLOv11-EMD model enhanced the mAP@50 by 3.8% and the mAP@50:95 by 8.1% while reducing the computational complexity by 20.9% and the training time by 56.9%, thereby fully demonstrating its dual advantages in detection accuracy and resource efficiency. The SDS-YOLO model recorded an mAP@50 of 0.922 and an mAP@50:95 of 0.681, with GFLOPs of 10.8 and a training time of 3.840 h. The YOLOv11-EMD model surpassed it by 2.7% in the mAP@50, 6.6% in the mAP@50:95, 33.3% in the GFLOP reduction, and 24.7% in the training time reduction, further confirming its comprehensive superiority in performance and efficiency. The InnerGIoU-MSDA-C3k2_ContextGuidedBlock model achieved an mAP@50 of 0.932, an mAP@50:95 of 0.716, GFLOPs of 7.1, and a training time of 3.145 h. By comparison, the YOLOv11-EMD model boosted the mAP@50 by 1.7% and the mAP@50:95 by 3.1%, with only a 1.4% increase in the computational complexity and an 8% decrease in the training time, showcasing a higher detection accuracy alongside controlled computational demands. The InnerEIoU-MSDA-C3k2_DBB_backbone model yielded an mAP@50 of 0.936, an mAP@50:95 of 0.712, GFLOPs of 8.3, and a training time of 5.726 h. The YOLOv11-EMD model outperformed it by 1.3% in the mAP@50 and by 3.5% in the mAP@50:95 while lowering the computational complexity by 13.3% and the training time by 49.5%, indicating superior accuracy and notable efficiency gains. The UIoU-CAA-C3k2_RFAConv model attained an mAP@50 of 0.945, an mAP@50:95 of 0.710, GFLOPs of 7.8, and a training time of 4.619 h, whereas the YOLOv11-EMD model improved the mAP@50 by 0.4% and the mAP@50:95 by 3.7%, with the GFLOPs and training time reduced by approximately 7.7% and 37.4%, respectively, further underscoring its excellence in balancing performance and resource utilization. The YOLOv8 model achieved 0.936 on the mAP@50 and 0.719 on the mAP@50:95, with 8.1 GFLOPs and a training time of 2.987 h. In comparison, the proposed YOLOv11-EMD improved the mAP@50 and mAP@50:95 by 1.3% and 2.8% while reducing the complexity by 11.1% and the training time by 3.2%, indicating enhanced accuracy and efficiency. By contrast, YOLOv10 performed worse, recording an mAP@50 of 0.918 and an mAP@50:95 of 0.696, with higher complexity (8.2 GFLOPs) and longer training (4.298 h). Relative to YOLOv11-EMD, YOLOv10 showed drops of 3.1% and 5.1% in accuracy and increases of 12.2% and 32.7% in the complexity and training time, highlighting the superior performance of YOLOv11-EMD. Overall, when contrasted with other models, the proposed model enhanced the mAP@50 by 0.4–4.2% and the mAP@50:95 by 3.1–8.8% while maintaining lower GFLOPs, thereby validating its superiority.

5.3. Analysis of Transfer Learning Results

5.3.1. Transfer Framework Validation

To comprehensively evaluate the performance improvements offered by the transfer learning framework in steel surface defect detection, this study designed and conducted comparative experiments on a unified target domain dataset. The experiments trained the model using traditional training strategies (before) and transfer learning strategies with fine-tuning (after), with each method repeated five times independently to ensure the robustness and statistical reliability of the results. The fine-tuning strategy involved replacing the optimizer SGD with Adam and adjusting the learning rate to 1 × 10⁻⁴. The comparative results for key performance metrics are presented in Table 7, providing empirical evidence for the effectiveness of transfer learning in this detection task.
As shown in Table 7, the proposed transfer learning framework exhibits significant performance advantages in detecting defects on steel surfaces. By comparing the results of five independent experiments conducted using traditional training methods and transfer learning methods on the same target domain dataset, the model’s overall performance showed comprehensive improvement. After adopting the transfer learning strategy, the average accuracy increased from 69.6% to 80.84%, the recall rate rose from 63.9% to 75.50%, and the mAP@50 improved from 71.1% to 79.8%, with all core performance metrics demonstrating substantial progress. Additionally, transfer learning optimized the training efficiency, reducing the average training duration from 0.829 h to 0.774 h, a 6.6% improvement. The maximum training time for a single experiment decreased by 0.181 h. More importantly, all experiments revealed a consistent trend of performance enhancement, with accuracy improvements ranging from 8.9% to 14.6%, recall rate improvements from 15.3% to 15.8%, and mAP@50 enhancements from 10.6% to 11.1%, fully confirming the stability and reliability of this transfer learning strategy across different experimental conditions. These experimental results indicate that the proposed transfer learning framework not only substantially enhances the accuracy and defect identification capabilities in steel surface defect detection but also effectively shortens the model training time, underscoring its practical potential and technological value in industrial quality inspection scenarios.
Figure 15 provides an intuitive comparison illustrating the substantial improvement in the performance of the steel surface defect detection model before and after fine-tuning. The original model exhibits some missed detections in the results, particularly for fine-grained defect categories such as inclusions, where it shows relatively low recognition accuracy. After fine-tuning, the model’s overall detection performance improved significantly, not only by effectively identifying previously missed defect areas but also by enhancing the detection accuracy, thereby demonstrating greater robustness. Notably, in the detection of oil stain defects, the detection rate jumped from 47% before fine-tuning to 94%, marking the most pronounced improvement. The visualization results further confirm that the fine-tuning strategy preserves the advantages of large-object detection while substantially bolstering the ability to identify small-object defects, thereby more comprehensively addressing the dual requirements of industrial surface defect detection for accuracy and completeness.
In summary, transfer learning exhibits substantial optimization potential and practical effectiveness in steel surface defect detection. This approach not only markedly enhances the accuracy of defect identification, including defect category classification and target area localization, but also effectively broadens the coverage of detection annotations, thereby improving the system’s completeness and robustness. Experimental findings fully confirm the viability and practical value of transfer learning in steel surface defect detection scenarios, indicating its crucial role in providing technical support and its broad prospects for advancing the intelligent and refined development of detection processes.

5.3.2. Transfer Learning Ablation Experiments

To validate the effectiveness of the proposed transfer learning framework in steel surface defect detection, this study designed and conducted systematic ablation studies aimed at comprehensively assessing the influence of various training strategies on the model’s performance. The experiments were based on the YOLOv11-EMD architecture and included three comparison schemes: first, a baseline model without pre-trained weights or fine-tuning; second, a model with pre-trained weights but without fine-tuning; and third, a model with pre-trained weights and fine-tuning. This experimental design thoroughly explored how each component of transfer learning contributed to performance improvements. Table 8 presents a detailed comparison of the core metrics for each scheme, including the precision (P), recall (R), mean average precision (mAP@50), and training duration (Duration), providing robust data support for analyzing how well transfer learning strategies work in detecting defects on steel surfaces.
As shown in Table 8, the transfer learning strategy significantly enhances the performance of the YOLOv11-EMD model in the detection of steel surface defects. A comparison of the experimental results across the three training configurations reveals that simply introducing pre-trained weights without fine-tuning improved the model’s accuracy, recall, and mAP@50 by 3.5%, 7.5%, and 2.4%, respectively, over the baseline model. Further fine-tuning elevated the detection performance even more, with the accuracy and recall increasing by 11.9% and 11.5%, respectively, compared to the baseline, while the mAP@50 reached 79.9%, an 8.8% improvement over the baseline. Notably, the fine-tuned model’s training time was only 0.797 h, compared to the baseline’s 0.824 h, representing a 3.2% reduction. This demonstrates that transfer learning not only boosts the detection performance but also substantially optimizes the training efficiency.
This transfer learning ablation experiment comprehensively evaluated the performance of the YOLOv11-EMD model under different training strategies, thereby revealing the core value of transfer learning in steel surface defect detection. The experiment compared the model’s performance across multiple dimensions, including the accuracy, recall, and training time, to validate the practical advantages of transfer learning strategies in industrial quality inspection. It also explored the synergistic relationship between the pre-training and fine-tuning stages in enhancing performance. These findings not only provide theoretical support for a deeper understanding of transfer mechanisms in detection tasks but also offer valuable guidelines for future optimizations of related models.

5.3.3. Transfer Learning Comparison Experiment

This study systematically evaluated the synergistic effects of transfer learning mechanisms and model structure optimization strategies through controlled variable comparison experiments. It selected six representative advanced object detection methods as benchmarks, including CLS-YOLO, HCP-YOLO, SDS-YOLO, GMC-YOLO, UCR-YOLO, and the proposed enhanced YOLOv11-EMD model (with fine-tuning). In the comparative experiment, all the experimental conditions and parameters were kept constant, with the only variable being the model and weights, which was switched to control for potential confounding factors. As indicated in Table 9, the comparative analysis encompassed key performance metrics, such as the detection accuracy, recall, and average precision, while quantitatively recording the training time for each model to comprehensively assess the overall performance in steel surface defect detection. This experimental design provided detailed data support to validate the effectiveness and advantages of the proposed method.
As shown in Table 9, the YOLOv11-EMD+EMD.pt model exhibits an outstanding overall performance in steel surface defect detection. It achieved an accuracy of 81.5%, significantly outperforming the other models and highlighting its substantial advantage in reducing false positives. Simultaneously, the recall reached 75.4%, surpassing the other solutions and indicating strong defect detection capabilities. Notably, the model attained an mAP@50 of 79.9%, the highest detection accuracy, with a training time of only 0.797 h, comparable to the other models and demonstrating high efficiency. This balance of accuracy and efficiency positions YOLOv11-EMD+EMD.pt as the leading solution for steel surface defect detection, fully validating the practical value of its enhancements in industrial quality inspection scenarios.

5.4. Discussion

5.4.1. Advantages of the Proposed Method

The YOLOv11-EMD algorithm proposed in this paper, combined with a multi-stage transfer learning framework, possesses significant technical advantages:
(1)
Detection accuracy: YOLOv11-EMD achieves a superior defect identification performance, particularly for small-sized and irregularly shaped defects. The model consistently maintains high accuracy and stability across small-, medium-, and large-scale detection tasks, highlighting its strong adaptability and precision in multi-scale defect detection.
(2)
Detection speed: In industrial applications, the detection speed often determines an algorithm’s deployability on production lines. YOLOv11-EMD achieves a balance between efficiency and speed while maintaining high accuracy. Its lightweight, optimized structure significantly reduces computational overhead, enabling real-time deployment on resource-constrained edge devices and satisfying the dual requirements of real-time performance and high throughput in industrial production.
(3)
Training efficiency: The proposed method enhances the model convergence speed through transfer learning strategies and multi-stage training mechanisms. Transfer learning leverages knowledge from existing models and fine-tunes them for new tasks, thereby substantially reducing the training time compared to starting from scratch. The multi-stage mechanism divides the training process into sequential optimization stages, permitting the model to center on distinct learning objectives at each stage and improving the overall efficiency.

5.4.2. Limitations and Future Work

Although the YOLOv11-EMD algorithm proposed in this paper, combined with a multi-stage transfer learning framework, exhibits a good performance in terms of its detection precision, speed, and training efficiency, there remain the following limitations:
(1)
Challenges in extremely complex backgrounds: While YOLOv11-EMD shows good robustness in most industrial defect images, it still faces risks of false positives and negatives in scenarios with complex background textures or extremely low defect contrast. Particularly in the presence of blurring, contamination, or water stains, the localization accuracy for small defects decreases, and feature extraction shifts may lead to blurred boundaries or misidentification.
(2)
Reliance on large-scale labeled data limits generalization: Although the proposed method performs excellently on standard public datasets, it depends on clear labeling and ideal data conditions. In real-world scenarios with numerous unlabeled samples and varying conditions, the model’s performance may decline. Currently, it lacks mechanisms for few-shot learning or unsupervised domain adaptation, which limits cross-domain generalization.
(3)
Room for improvement in detecting specific small-sample defect categories: While YOLOv11-EMD performed well overall, certain low-frequency or small-sample defect categories exhibited low recognition accuracy due to severe sample imbalance. This stemmed from the model’s bias toward dominant categories during training, resulting in an insufficient representation of minority-class features and affecting the overall detection comprehensiveness and balance.
(4)
Limited adaptability to unseen defect categories: Although YOLOv11-EMD enhances the cross-domain generalization between known defect types, it is not yet capable of effectively handling unseen defect categories. In practical industrial settings, novel or rare defect patterns often emerge that are not present in the training data. The current framework does not incorporate few-shot or zero-shot mechanisms, which limits its adaptability to these new defect categories.
To tackle these constraints, upcoming research will incorporate adversarial domain adaptation and multi-scale optimization and adopt additional attention mechanisms to enhance the model’s stability in extremely complex backgrounds. Additionally, self-supervised pre-training and pseudo-label generation will be incorporated to enhance the adaptability to unlabeled data. Furthermore, category re-weighting and small-sample augmentation will be introduced to mitigate imbalance and boost detection for rare defects. In addition, future work will explore few-shot and zero-shot learning to enhance the model’s adaptability to unseen defect categories using meta-learning and generative augmentation techniques.

5.4.3. Application Expansion

(1)
PCB Defect Detection in Electronics Manufacturing:
In electronics manufacturing, surface defect detection on printed circuit boards (PCBs) encounters challenges such as small targets, high density, and complex texture backgrounds. Traditional methods are prone to false positives under varying lighting conditions and board misalignment. YOLOv11-EMD exhibits excellent multi-scale feature extraction and small-target recognition capabilities. When combined with transfer learning and high-resolution image enhancement, it effectively distinguishes solder joints from complex circuits and accurately identifies minor defects. This approach serves as a deep learning supplement to AOI systems, enhancing detection yields and promoting intelligent development in electronics manufacturing.
(2)
Surface Defect Detection in Glass Manufacturing:
Surface defect detection in glass manufacturing is often affected by light spot reflections, imaging angles, and background interference. Traditional methods exhibit low accuracy in identifying low-contrast defects such as micro-cracks and bubbles. YOLOv11-EMD demonstrates superior small-object recognition capabilities. Integrated with data augmentation strategies like reflection simulation and low-contrast texture enhancement, it improves the detection accuracy in high-reflection areas. When applied to float glass production lines, this model enables automated defect grading and removal, thereby increasing the detection efficiency and product consistency.
(3)
Packaging Quality Defect Identification in the Food Industry:
In fast-moving consumer goods production, packaging defects such as blurred printing, missing prints, and misaligned labels can compromise product qualification rates and brand image if not detected promptly. YOLOv11-EMD offers outstanding recognition of small objects and complex patterns, enabling the precise localization of critical areas like printed regions, edge text, and barcodes to detect minor defects. After adaptation, it integrates into high-speed packaging lines for real-time image capture and defect reporting, fulfilling the need for efficient and stable quality inspection in scenarios such as beverage labeling and canned food printing.

6. Conclusions

This paper addresses issues such as inaccurate localization, weak feature extraction capabilities, and poor model adaptability in steel surface defect detection. It proposes an enhanced YOLOv11-EMD algorithm and integrates a multi-stage transfer learning framework to fulfill industrial demands for high-precision, robust generalization and low-training-cost defect detection. Specifically, to mitigate YOLOv11’s insufficient feature extraction in complex backgrounds and multi-scale target recognition, this paper introduces the InnerEIoU loss function to enhance bounding box localization. It incorporates the MSDA module to improve the recognition of defects across different scales. It also embeds the C3k2_DynamicConv module to boost adaptability and expressiveness for complex and diverse defect features. Additionally, to tackle the common challenges of limited robustness and weak domain adaptation in cross-domain tasks, it proposes a multi-stage transfer learning framework. Through source domain pre-training and target domain fine-tuning, this framework effectively strengthens the model’s generalization across varying data distributions.
The proposed YOLOv11-EMD model underwent systematic validation on a comprehensive dataset constructed from the Severstal steel surface defect dataset and the NEU-DET dataset. The experimental results show that the model exhibits an outstanding performance in steel surface defect detection tasks. It achieved an average precision of 0.942, a recall of 0.868, and an mAP@50 of 0.949. Compared to the original YOLOv11 model, these metrics improved by 3.5%, 0.8%, and 1.6%, respectively. The overall training time remains comparable to that of YOLOv11, without significantly increasing the computational burden. In the generalization evaluation on a cross-scenario mixed dataset (comprising NEU-DET and GC10-DET data), the model achieved an mAP@50 of 0.799. This outperformed current mainstream detection methods such as CLS-YOLO, HCP-YOLO, SDS-YOLO, GMC-YOLO, and UCR-YOLO. Furthermore, when combined with a multi-stage transfer learning framework, YOLOv11-EMD reduced the training time by 3.2% while maintaining the detection performance and improving the mAP by 8.8%. This effectively alleviates performance degradation during multi-source data transfer and validates its excellent transferability and resilience in practical industrial applications.
The integration of YOLOv11-EMD with a multi-stage transfer learning framework significantly enhances the robustness and generalization of steel defect detection models in complex environments. This approach not only adapts to steel surface image detection tasks across diverse scenarios but also effectively reduces the training time and dependence on labeled data. As a result, it achieves efficient, low-cost, and automated quality inspection. The method holds substantial industrial value and research significance. It effectively addresses key challenges in steel manufacturing and inspection, such as “high precision but poor generalization” and “cross-domain performance degradation.” For future work, the following directions merit exploration. First, self-supervised learning mechanisms can be introduced to leverage unlabeled data and enhance the model recognition in scenarios with insufficient defect samples. Second, domain-specific adversarial training techniques can be integrated to further improve the transfer adaptability in extreme conditions, including cross-factory and cross-steel-grade environments.

Author Contributions

Conceptualization, W.S. and N.N.; methodology, W.S. and J.D.; software, C.L.; validation, J.D.; formal analysis, W.S. and J.D.; investigation, J.D.; data curation, C.L.; writing—original draft preparation, W.S.; writing—review and editing, W.S., J.D., C.L. and N.N.; visualization, C.L. and N.N.; supervision, N.N.; project administration, N.N.; funding acquisition, W.S. and N.N. All authors have read and agreed to the published version of the manuscript.

Funding

This research received no external funding.

Conflicts of Interest

The authors declare no conflict of interest.

Appendix A

To facilitate readers’ reproduction of this study, the YAML file structure diagram of YOLOv11-EMD has been provided, as shown in Figure A1.
Figure A1. The YAML configuration file structure diagram of the YOLOv11-EMD model.
Mathematics 13 02769 g0a1

References

  1. Gao, Y.; Lv, G.; Xiao, D.; Han, X.; Sun, T.; Li, Z. Research on steel surface defect classification method based on deep learning. Sci. Rep. 2024, 14, 8254–8267. [Google Scholar] [CrossRef]
  2. Bai, J.; Wu, D.; Shelley, T.; Schubel, P.; Twine, D.; Russell, J.; Zeng, X.; Zhang, J. A Comprehensive Survey on Machine Learning Driven Material Defect Detection. ACM Comput. Surv. 2025, 57, 1–36. [Google Scholar] [CrossRef]
  3. Sahin, M.E.; Ulutas, H.; Yuce, E.; Erkoc, M.F. Detection and classification of COVID-19 by using faster R-CNN and mask R-CNN on CT images. Neural Comput. Appl. 2023, 35, 13597–13611. [Google Scholar] [CrossRef]
  4. Qiao, L.; Veltrup, M.; Mayer, B. Comparison of mask R-CNN and YOLOv8-seg for improved monitoring of the PCB surface during laser cleaning. Sci. Rep. 2025, 15, 17185–17199. [Google Scholar] [CrossRef]
  5. Cai, Q.; Pan, Y.W.; Yao, T.; Mei, T. 3D Cascade RCNN: High Quality Object Detection in Point Clouds. IEEE Trans. Image Process. 2022, 31, 5706–5719. [Google Scholar] [CrossRef]
  6. Xia, B.; Luo, H.; Shi, S. Improved faster R-CNN based surface defect detection algorithm for plates. Comput. Intell. Neurosci. 2022, 2022, 3248722. [Google Scholar] [CrossRef]
  7. Zhang, C.; Yu, B.; Wang, W. Steel surface defect detection based on improved MASK RCNN. In Proceedings of the 2022 IEEE 8th International Conference on Computer and Communications (ICCC), Chengdu, China, 9–12 December 2022; IEEE: Piscataway, NJ, USA, 2022; pp. 2176–2181. [Google Scholar]
  8. Wang, Y.; Wang, X.; Hao, R.; Lu, B.; Huang, B. Metal surface defect detection method based on improved cascade R-CNN. J. Comput. Inf. Sci. Eng. 2024, 24, 041002. [Google Scholar] [CrossRef]
  9. Hussain, M. YOLO-v1 to YOLO-v8, the rise of YOLO and its complementary nature toward digital manufacturing and industrial defect detection. Machines 2023, 11, 677. [Google Scholar] [CrossRef]
  10. Chen, X.; Lv, J.; Fang, Y.; Du, S. Online detection of surface defects based on improved YOLOV3. Sensors 2022, 22, 817. [Google Scholar] [CrossRef] [PubMed]
  11. Zhou, C.; Lu, Z.; Lv, Z.; Meng, M.; Tan, Y.; Xia, K.; Liu, K.; Zuo, H. Metal surface defect detection based on improved YOLOv5. Sci. Rep. 2023, 13, 20803–20814. [Google Scholar] [CrossRef]
  12. Ma, S.; Zhao, X.; Wan, L.; Zhang, Y.; Gao, H. A lightweight algorithm for steel surface defect detection using improved YOLOv8. Sci. Rep. 2025, 15, 8966–8978. [Google Scholar] [CrossRef]
  13. Xie, H.; Zhou, H.; Chen, R.; Wang, B. SDMS-YOLOv10: Improved Yolov10-based algorithm for identifying steel surface flaws. Nondestruct. Test. Eval. 2025, 1–21. [Google Scholar] [CrossRef]
  14. Wang, F.; Jiang, X.; Han, Y.; Wu, L. YOLO-LSDI: An Enhanced Algorithm for Steel Surface Defect Detection Using a YOLOv11 Network. Electronics 2025, 14, 2576. [Google Scholar] [CrossRef]
  15. Tian, Z.; Yang, F.; Yang, L.; Wu, Y.; Chen, J.; Qian, P. An Optimized YOLOv11 Framework for the Efficient Multi-Category Defect Detection of Concrete Surface. Sensors 2025, 25, 1291. [Google Scholar] [CrossRef] [PubMed]
  16. Wang, Q.; Hu, H.; Zhou, Y. Memorymamba: Memory-augmented state space model for defect recognition. arXiv 2024, arXiv:2405.03673. [Google Scholar]
  17. Bhuiyan, M.R.; Uddin, J. Deep transfer learning models for industrial fault diagnosis using vibration and acoustic sensors data: A review. Vibration 2023, 6, 218–238. [Google Scholar] [CrossRef]
  18. Situ, Z.; Teng, S.; Feng, W.; Zhong, Q.; Chen, G.; Su, J.; Zhou, Q. A transfer learning-based YOLO network for sewer defect detection in comparison to classic object detection methods. Dev. Built Environ. 2023, 15, 100191. [Google Scholar] [CrossRef]
  19. Yang, S.; Pei, Z.; Zhou, F.; Wang, G. Rotated faster R-CNN for oriented object detection in aerial images. In Proceedings of the 2020 3rd International Conference on Robot Systems and Applications, Chengdu, China, 14–16 June 2020; pp. 35–39. [Google Scholar]
  20. Francis, S.B.; Prakash Verma, J. Deep CNN ResNet-18 based model with attention and transfer learning for Alzheimer’s disease detection. Front. Neuroinformatics 2025, 18, 1507217. [Google Scholar] [CrossRef] [PubMed]
  21. Li, Y.; Song, L.; Cai, Y.; Fang, Z.; Tang, M. Research on fabric surface defect detection algorithm based on improved Yolo_v4. Sci. Rep. 2024, 14, 5537–5558. [Google Scholar] [CrossRef]
  22. Zhu, X.; Jiang, F.; Guo, C.; Xu, D.; Wang, Z.; Jiang, G. Surface morphology inspection for directed energy deposition using small dataset with transfer learning. J. Manuf. Process. 2023, 93, 101–115. [Google Scholar] [CrossRef]
  23. He, Y.; Song, K.; Meng, Q.; Yan, Y. An end-to-end steel surface defect detection approach via fusing multiple hierarchical features. IEEE Trans. Instrum. Meas. 2019, 69, 1493–1504. [Google Scholar] [CrossRef]
  24. Chen, C.; Zhou, Q.; Xiao, L.; Li, S.; Luo, D. LWFDD-YOLO: A lightweight defect detection algorithm based on improved YOLOv8. Text. Res. J. 2025, 95, 1125–1142. [Google Scholar] [CrossRef]
  25. Xu, W.; Zhu, D.; Deng, R.; Yung, K.; Ip, A.W.H. Violence-YOLO: Enhanced GELAN Algorithm for Violence Detection. Appl. Sci. 2024, 14, 6712. [Google Scholar] [CrossRef]
  26. Sohaib, M.; Arif, M.; Kim, J.M. Evaluating YOLO models for efficient crack detection in concrete structures using transfer learning. Buildings 2024, 14, 3928. [Google Scholar] [CrossRef]
  27. Fu, G.; Zhang, Z.; Li, J.; Zhang, E.; He, Z.; Sun, F.; Zhu, Q.; Niu, F.; Chen, H.; Shen, Y. An Evaluation Method for Model Transfer Learning Performance in Industrial Surface Defect Detection Tasks. Expert Syst. Appl. 2025, 293, 128680. [Google Scholar] [CrossRef]
  28. Ashrafi, S.; Teymouri, S.; Etaati, S.; Khoramdel, J.; Borhani, Y.; Najafi, E. Steel surface defect detection and segmentation using deep neural networks. Results Eng. 2025, 25, 103972. [Google Scholar] [CrossRef]
  29. Alomar, K.; Aysel, H.I.; Cai, X. Data augmentation in classification and segmentation: A survey and new strategies. J. Imaging 2023, 9, 46. [Google Scholar] [CrossRef]
  30. Bochkovskiy, A.; Wang, C.Y.; Liao, H.Y.M. Yolov4: Optimal speed and accuracy of object detection. arXiv 2020, arXiv:2004.10934. [Google Scholar] [CrossRef]
  31. Yogapriya, J.; Chandran, V.; Sumithra, M.G.; Elakkiya, B.; Ebenezer, A.S.; Dhas, C.S.G. Automated detection of infection in diabetic foot ulcer images using convolutional neural network. J. Healthc. Eng. 2022, 2022, 2349849. [Google Scholar] [CrossRef]
  32. Kumar, S.; Asiamah, P.; Jolaoso, O.; Esiowu, U. Enhancing Image Classification with Augmentation: Data Augmentation Techniques for Improved Image Classification. arXiv 2025, arXiv:2502.18691. [Google Scholar] [CrossRef]
  33. Zhao, B.T.; Chen, Y.; Jia, X.; Ma, T. Steel surface defect detection algorithm in complex background scenarios. Measurement 2024, 237, 115189. [Google Scholar] [CrossRef]
  34. Zhang, H.; Li, Z.; Wang, C. YOLO-Dynamic: A detection algorithm for spaceborne dynamic objects. Sensors 2024, 24, 7684. [Google Scholar] [CrossRef]
  35. Szandała, T. Convolutional neural network for blur images detection as an alternative for Laplacian method. In Proceedings of the 2020 IEEE Symposium Series on Computational Intelligence (SSCI), Canberra, ACT, Australia, 1–4 December 2020; IEEE: Piscataway, NJ, USA, 2020; pp. 2901–2904. [Google Scholar]
  36. Dong, J.; Roth, S.; Schiele, B. Deep wiener deconvolution: Wiener meets deep learning for image deblurring. Adv. Neural Inf. Process. Syst. 2020, 33, 1048–1059. [Google Scholar]
  37. Chen, L.; Zhang, J.; Li, Z.; Wei, Y.; Fang, F.; Ren, J.; Pan, J. Deep Richardson–Lucy deconvolution for low-light image deblurring. Int. J. Comput. Vis. 2024, 132, 428–445. [Google Scholar] [CrossRef]
  38. Yun, G.; Oh, S.; Shin, S. Image preprocessing method in radiographic inspection for automatic detection of ship welding defects. Appl. Sci. 2021, 12, 123. [Google Scholar] [CrossRef]
  39. Tariq, M.; Choi, K. YOLO11-Driven Deep Learning Approach for Enhanced Detection and Visualization of Wrist Fractures in X-Ray Images. Mathematics 2025, 13, 1419. [Google Scholar] [CrossRef]
  40. Wang, S.; Jiang, H.; Yang, J.; Ma, X.; Chen, J.; Li, Z.; Tang, X. Lightweight tomato ripeness detection algorithm based on the improved RT-DETR. Front. Plant Sci. 2024, 15, 1415297. [Google Scholar] [CrossRef]
  41. Zand, M.; Etemad, A.; Greenspan, M. Objectbox: From centers to boxes for anchor-free object detection. In Proceedings of the European Conference on Computer Vision, Tel Aviv, Israel, 23–27 October 2022; Springer Nature: Cham, Switzerland, 2022; pp. 390–406. [Google Scholar]
  42. Jiao, J.; Tang, Y.M.; Lin, K.Y.; Gao, Y.; Ma, J.; Wang, Y.; Zheng, W.S. Dilateformer: Multi-scale dilated transformer for visual recognition. IEEE Trans. Multimed. 2023, 25, 8906–8919. [Google Scholar] [CrossRef]
  43. Chen, L.; Gu, L.; Zheng, D.; Fu, Y. Frequency-adaptive dilated convolution for semantic segmentation. In Proceedings of the IEEE/CVF Conference on Computer Vision and Pattern Recognition, Seattle, WA, USA, 17–21 June 2024; pp. 3414–3425. [Google Scholar]
  44. Chen, Y.; Dai, X.; Liu, M.; Chen, D.; Yuan, L.; Liu, Z. Dynamic convolution: Attention over convolution kernels. In Proceedings of the IEEE/CVF Conference on Computer Vision and Pattern Recognition, Seattle, WA, USA, 14–19 June 2020; pp. 11030–11039. [Google Scholar]
  45. Iman, M.; Arabnia, H.R.; Rasheed, K. A review of deep transfer learning and recent advancements. Technologies 2023, 11, 40. [Google Scholar] [CrossRef]
  46. Lv, X.; Duan, F.; Jiang, J.; Fu, X.; Gan, L. Deep metallic surface defect detection: The new benchmark and detection network. Sensors 2020, 20, 1562. [Google Scholar] [CrossRef]
  47. Ogunsanya, M.; Isichei, J.; Desai, S. Grid search hyperparameter tuning in additive manufacturing processes. Manuf. Lett. 2023, 35, 1031–1042. [Google Scholar] [CrossRef]
  48. Zhu, X.; Su, W.; Lu, L.; Li, B.; Wang, X.; Dai, J. Deformable detr: Deformable transformers for end-to-end object detection. arXiv 2020, arXiv:2010.04159. [Google Scholar]
  49. Chen, Q.; Xiong, Q.; Huang, H.; Tang, S. An Efficient and Lightweight Surface Defect Detection Method for Micro-Motor Commutators in Complex Industrial Scenarios Based on the CLS-YOLO Network. Electronics 2025, 14, 505. [Google Scholar] [CrossRef]
  50. Gao, Y.; Xin, Y.; Yang, H.; Wang, Y. A lightweight anti-unmanned aerial vehicle detection method based on improved YOLOv11. Drones 2024, 9, 11. [Google Scholar] [CrossRef]
  51. Wang, D.; Tan, J.; Wang, H.; Kong, L.; Zhang, C.; Pan, D.; Li, T.; Liu, J. SDS-YOLO: An improved vibratory position detection algorithm based on YOLOv11. Measurement 2025, 244, 116518. [Google Scholar] [CrossRef]
Figure 1. Example diagram of surface defects of steel.
Mathematics 13 02769 g001
Figure 2. Data preprocessing framework.
Mathematics 13 02769 g002
Figure 3. Comparison chart of the original image and the preprocessed image.
Mathematics 13 02769 g003
Figure 4. Framework diagram of YOLOv11-EMD.
Mathematics 13 02769 g004
Figure 5. Framework diagram of YOLOv11.
Mathematics 13 02769 g005
Figure 6. Structural diagram of MSDA.
Mathematics 13 02769 g006
Figure 7. Structural diagram of C3k2_DynamicConv.
Mathematics 13 02769 g007
Figure 8. Partial image comparison between source domain and target domain.
Mathematics 13 02769 g008
Figure 9. Multi-stage transfer learning training framework.
Mathematics 13 02769 g009
Figure 10. (a) Classification loss function convergence curve. (b) mAP@50 evolution curve.
Mathematics 13 02769 g010
Figure 11. YOLOv11-EMD model target detection effect diagram.
Mathematics 13 02769 g011
Figure 12. Partial predicted image comparison in overlapping and occlusion conditions.
Mathematics 13 02769 g012
Figure 13. Partial predicted image comparison in extreme scenarios.
Mathematics 13 02769 g013
Figure 14. (a) Model loss function curve diagram during the ablation experiment. (b) Accuracy curve diagram of the model during the ablation experiment.
Mathematics 13 02769 g014aMathematics 13 02769 g014b
Figure 15. Comparison of detection results before and after fine-tuning.
Mathematics 13 02769 g015
Table 1. Pre-trained weight files of different versions of YOLOv11.
ModelSize
(Pixels)
mAPval
50–95
Speed
CPU ONNX
(ms)
Speed T4 TensorRT10
(ms)
Params
(M)
FLOPs
(B)
YOLOv11n64039.556.1 ± 0.81.5 ± 0.02.66.5
YOLOv11s64047.090.0 ± 1.22.5 ± 0.09.421.5
YOLOv11m64051.5183.2 ± 2.04.7 ± 0.120.168.0
YOLOv11l64053.4238.6 ± 1.46.2 ± 0.125.386.9
YOLOv11x64054.7462.8 ± 6.711.3 ± 0.256.9194.9
Table 2. Simulation environment.
Hardware EnvironmentApplication Scenario
Operating SystemLinux
CPUIntel(R) Xeon(R) Gold 6430
GPUNVIDIA GeForce RTX 4090
Video Memory Capacity24,210 MiB
Python Version3.12
PyTorch Version2.5.1+cu124
CUDA Version12.4
Table 3. Training parameter configuration.
ParameterValueDescription
Epochs250Number of training iterations
Batch16Batch size per iteration (adjustable based on GPU memory)
Device0GPU device index for training
Imgsz800Input image size
CacheFalseWhether to cache images in memory
AmpTrueEnables automatic mixed precision (AMP) training
Close_mosaic30Enables mosaic data augmentation
OptimizerSGDStochastic Gradient Descent optimizer
Lr00.01Initial learning rate for parameter updates (with cosine decay schedule applied during training)
Momentum0.937Momentum term for optimization
Weight decay0.0005Regularization to prevent overfitting
AugmentTrueEnables basic image augmentation
Workers4Number of parallel data-loading workers
Table 4. Detection indicators for each type of defect in the final model.
ClassPrecisionRecallmAP@50mAP@50:95
Crazing0.9630.8870.970.825
Inclusion0.9350.8860.9470.721
Patches0.9730.9610.9910.858
Pitted Surface0.9370.8060.9280.713
Rolled-In Scale0.8920.7210.8730.627
Scratches0.950.9490.9880.739
Total0.9420.8680.9490.747
Table 5. Ablation experiment results.
MethodInnerEIoUMSDAC3k2_DynamicConvPRmAP@50mAP@50–95GFLOPs
YOLOv11---0.9070.860.9330.7066.3
--0.9240.8560.9380.7176.3
-0.9180.8760.9430.7286.3
0.9420.8680.9490.7477.2
Table 6. Comparison of experimental results.
MethodPrecisionRecallmAP@50mAP@50:95GFLOPsDuration (h)
CLS-YOLO0.8870.8260.9070.6595.33.044
HCP-YOLO0.8950.8290.9110.6669.16.711
SDS-YOLO0.9120.8370.9220.68110.83.840
GMC-YOLO0.910.8570.9320.7167.13.145
EMDB-YOLO0.9090.8660.9360.7128.35.726
UCR-YOLO0.9120.8840.9450.717.84.619
YOLOv80.9130.8590.9360.7198.12.987
YOLOv100.90.8350.9180.6968.24.298
Ours0.9420.8680.9490.7477.22.891
Table 7. Comparison of results before and after application of transfer learning framework.
BeforeAfter
TrailP (%)R (%)mAP@50 (%)Duration (h)P (%)R (%)mAP@50 (%)Duration (h)
169.663.971.10.82881.575.479.90.797
269.663.971.10.82681.575.479.90.801
369.663.971.10.82681.575.479.90.800
469.663.971.10.84076.475.879.50.659
569.663.971.10.82481.575.479.90.814
Mean69.663.971.10.82980.8475.579.80.774
Table 8. Performance comparison using transfer learning.
P (%)R (%)mAP@50 (%)Duration (h)
YOLOv11-EMD69.663.971.10.824
YOLOv11-EMD+EMD.pt (no fine-tuning)73.171.473.50.429
YOLOv11-EMD+EMD.pt (fine-tuning)81.575.479.90.797
Table 9. Performance comparison of various models.
Model + WeightsP (%)R (%)mAP@50 (%)Duration (h)
CLS-YOLO+l.pt73.763.472.00.773
HCP-YOLO+x.pt72.967.271.81.369
SDS-YOLO+m.pt70.467.171.40.786
GMC-YOLO+n.pt70.567.272.90.645
UCR-YOLO+s.pt76.363.771.90.720
YOLOv11-EMD+EMD.pt81.575.479.90.797
Disclaimer/Publisher’s Note: The statements, opinions and data contained in all publications are solely those of the individual author(s) and contributor(s) and not of MDPI and/or the editor(s). MDPI and/or the editor(s) disclaim responsibility for any injury to people or property resulting from any ideas, methods, instructions or products referred to in the content.