Abstract
For an intuitive understanding of traditional remote photoplethysmography (rPPG), this study categorizes existing algorithms into two main types: spatial vector projection and spatial angle projection in RGB color space. The RGB variation induced by noise (RGBnoise) is visualized in color space and approximated by the raw RGB signal. We propose APON (Adaptive Projection plane Orthogonal to Noise) to suppress artifacts. Two rPPG methods, APON_Vector and APON_Angle, are then developed from this adaptive plane. Comparative experiments on the public databases show that APON_Vector is comparable to state-of-the-art methods like CHROM and POS (achieving an Accuracy of 87.35%), while APON_Angle outperforms other angle projection methods (reducing MAE to 0.78 bpm). The results show that the simple yet effective APON contains significant pulse variation and holds potential for more pulse detection methods.
MSC:
68U10
1. Introduction
The technique used for heart rate detection based on facial videos is remote Photoplethysmography (rPPG) [1,2,3,4,5,6,7,8,9,10,11,12]. When light is illuminated on the face, the periodic pulsations of the heart during the cardiac cycle cause changes in blood volume in the capillaries beneath the dermis. These changes in blood volume result in variations in light absorption by the blood, which can be observed as changes in facial skin color. Although these changes are very subtle and difficult for the human eye to perceive, they can be captured by a camera. Compared to contact-based measurements, rPPG methods offer advantages such as simplicity, efficiency, freedom of the subject, and the ability to enable long-term monitoring.
Traditional rPPG methods involve several steps, including initial face detection and tracking to obtain the region of interest on the skin, dimension reduction of three-dimensional RGB signals into a one-dimensional blood volume pulse (BVP) signal, and post-processing for pulse extraction. The most crucial step is the extraction of the pulse signal containing pulse information from the RGB signals captured by the camera.
Extensive research has been conducted in this area. Verkruysse et al. [1] demonstrated that the green channel in the RGB channels carries more information and provides better pulse recovery. Subsequently, the concept of blind source separation (BSS) [2,3,4] was applied in this study to separate the temporal RGB traces into independent or uncorrelated signal sources for pulse retrieval. Additionally, model-based approaches [5,6,7] have gained popularity, utilizing skin-reflection models that combine skin reflectance and physiological characteristics. These methods exploit the relationship between pulse components appearing in different color channels to remove components unrelated to cardiac activity. Furthermore, some studies have applied matrix decomposition-related algorithms for pulse signal extraction. For instance, Pilz et al. [8] proposed the Local Group Invariance (LGI) algorithm, which employs singular value decomposition, while López and Casado [9] introduced the Orthogonal Matrix Image Transformation (OMIT) algorithm, utilizing QR decomposition. These decomposition methods rearrange the energy of the blood volume signal in the vector space, leading to a more concentrated distribution. Wang et al. proposed the SSR algorithm [10], which creates a skin color space based on skin pixels in each frame associated with the subject. It extracts pulsatile information from the temporal rotation of this space, without the prior knowledge of skin color or pulsation. Besides the RGB color space, some studies have utilized other color spaces such as HSV [11,12]. In addition to the traditional schemes mentioned above, deep learning has also been widely applied in pulse rate detection in recent years [13,14,15,16]. These methods are often affected by the training set and degrade across datasets. There are certain shortcomings in interpretability and real-time performance.
Based on the above, the research on rPPG algorithms is diverse. We intend to shed more light on one particular area in the traditional rPPG methods, namely, the algorithms based on color space models. Here, the color space models refer to the models used to extract the pulse signal from the videos captured by the camera. In this paper, we aim to improve the accuracy and robustness of traditional rPPG methods by providing a new theoretical framework and proposing a novel, noise-adaptive algorithm. We first analyze the principles of these traditional rPPG algorithms and classify them into two categories from the perspective of the RGB color space: spatial vector projection and spatial angle projection. This enhances the understanding of the signal distribution in the pulse signal extraction process and lays the foundation for exploring new pulse extraction algorithms. As traditional methods employ different fixed planes in the RGB color space, we hypothesize that an adaptive projection plane orthogonal to noise will perform better than fixed planes in detecting pulse rate. In this paper, we propose an adaptive projection plane, called Adaptive Plane-Orthogonal-to-Noise (APON), that can eliminate the dominant noise interference in the pulse signal extraction process. We then combine it with the feature selection method and the Hue channel algorithm, respectively, to form complete rPPG algorithms, corresponding to the above two categories. This paper not only provides a new framework but also demonstrates its practical importance by improving the performance of rPPG algorithms.
The remainder of this paper is structured as follows. In Section 2, a summary and analysis of the rPPG algorithms from the perspective of color space models are presented. In Section 3, based on the analysis of color variations caused by interference, an algorithm is proposed to determine the adaptive projection plane orthogonal to noise. Two novel pulse extraction algorithms are then developed based on this. In Section 4, the experimental setup, results, and discussions are presented. Finally, the conclusions and contributions are drawn in Section 5.
2. rPPG Algorithms in Color Space Model
In this work, we focus our literature review on rPPG methods that utilize conventional RGB cameras and visible light, as this is the sensing modality relevant to our study. From the perspective of color space, most traditional rPPG algorithms can be classified into two categories: spatial vector projection and spatial angle projection. The former category summarizes the process of pulse signal extraction as the projection of RGB signals onto a spatial vector in color space, while the latter category considers that the pulse information is primarily contained in the angle variation of inter-frame vectors. The classification is summarized in Table 1.

Table 1.
The final projection vector or angle used by various rPPG methods.
2.1. Spatial Vector Projection
Given a sequence of video frames containing a human face, each frame consists of pixels with coordinates i, j. It can be described by a vector , i.e., the transposed red , green , and blue channels. By taking the average of skin pixels within the Region of Interest (ROI) in each frame, we obtain the time-varying original RGB signal as follows.
Then, the temporal mean of each signal over N frames is calculated as , , and . And each raw signal value at time t () is divided by its corresponding channel’s temporal mean. This process is performed independently for each of the three color channels to obtain the normalized RGB signal as follows:
where the operator μ corresponds to the temporal mean. Then the projection operation is performed on the RGB signal in color space:
where p(t) denotes the target BVP signal, and w(t) denotes a 1 × 3 projection vector. In some algorithms, c(t) is the original RGB signal c0(t), and in others, c(t) corresponds to the mean-centered normalized color signal cn(t). The key of each algorithm is the projection vector w(t). It projects the time-varying skin color to the vector where the pulse variation is most significant.
By analyzing the principles of various algorithms, the space vector projection algorithms could be further divided into three sub-categories: chromaticity model, physiological model, and matrix decomposition, and the final projection vectors used by each method are summarized in Table 1. Some algorithms in each sub-category are briefly introduced below.
- GREEN [1]: The algorithm directly takes the green channel as the BVP signal, and the projection vector used is [0, 1, 0]. The reason is that different frequencies of light have different abilities to penetrate the skin. Blue light penetrates shallowly and cannot reach the blood vessels, while red light penetrates too strongly. The penetration of green light is proper. Therefore, the reflected light contains the strongest pulse wave information.
- POS [7]: It uses the projection matrix Pp = [0 1 −1; −2 1 1] to obtain the following two projection signals:It is actually a plane orthogonal to the luminance vector [1 1 1] in the color space. Subsequently, “alpha tuning” is performed on the two signals. Since the obtained projection signals show in-phase pulsation components and out-of-phase specular reflection components, the alpha tuning is performed by summing the two signals:where denotes the standard deviation operation.
- ICA [2,3]: It aims to extract the unknown source signal, namely the pulse signal p(t), from a set of observed mixed RGB signals given by , where A represents the demixing matrix. The approximation of the source signal can be expressed as follows:where W is the separation matrix, which is the inverse of A, and is a 3*3 projection matrix. ICA assumes that the components are statistically independent and non-Gaussian. However, this assumption can be violated by skin tone variations or rapid changes in illumination, which can reduce the method’s effectiveness. Typically, the component with the most prominent peak within the PR bandwidth is selected as the final projection vector, namely the second component.
- OMIT [9]: This algorithm generates an orthogonal matrix to represent the linearly uncorrelated components in the RGB signal and utilizes matrix decomposition to extract the pulse signal. The QR decomposition [17] method is employed in the RGB space with Householder reflections to find the linear least squares solution. According to the following equation:where c(t)n*k is the input RGB matrix, Qn*k is an orthogonal basis, and Rk*k is an invertible upper triangular matrix that indicates which columns of Q are correlated. This method has been proven to be robust against video compression artifacts.
2.2. Spatial Angle Projection
This class of algorithms considers the angular change of inter-frame vectors to be driven by the pulse signal, and therefore can be used to extract the BVP signal, including the Hue channel algorithm and the spatial subspace rotation (SSR).
- Hue [11,12]: It demonstrates that in addition to the RGB color space, other color spaces can also be used for the pulse extraction because the transformed color space may eliminate some optical interferences. The HSV color space is one of them, in which H stands for hue, reflecting what kind of spectral wavelengths the color is closest to, S stands for saturation, and V stands for luminance. This model is schematically shown in Figure 1.
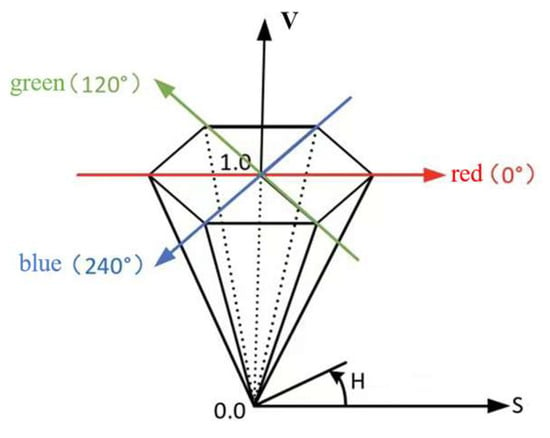 Figure 1. HSV color space.
 - This color space naturally separates luminance from color, thus avoiding the interference of colors by conditions such as light and darkness. Moreover, the luminance is more affected by lighting variation and motion, so the plane perpendicular to the luminance will contain less noise interference. So the Hue channel can be directly selected as the target signal. As shown in Figure 1, the Hue channel values obtained in each frame are changed in the color plane perpendicular to the luminance, representing different colors, and the angular change values between frames can be regarded as the amplitude change of the pulse signal.
- SSR [10]: This method believes that the angle values resulting from the temporal rotation of the spatial subspace constructed by all skin pixels in each frame contain pulsation information. It mainly consists of two steps, as shown in Figure 2. The SSR algorithm is a data-driven approach that does not require prior knowledge of skin color or pulsation. The assumption is that there are enough skin pixels in the spatial domain, and these pixels could be clustered together. The performance depends on the number of skin pixels and the accuracy of the skin mask.
 Figure 2. The SSR algorithm constructs a spatial subspace (represented by red feature vectors) using all skin pixels (blue pixels) in each frame, and calculates the angular variation between adjacent frames (e.g., representing the angle change between the spatial subspaces of frame t − 1 and frame t).
 - Synthesizing these numerous algorithms and exploring their underlying principles will facilitate the optimization of pulse signal extraction algorithms, which is a crucial research direction. Despite the wide variety of existing algorithms, the distribution of noise and pulse signals in RGB signals remains poorly defined, and a common challenge remains in developing a robust color space model that can adaptively and effectively suppress noise, which is the primary focus of this work.
3. The Adaptive Intermediate Projection Plane
Conventional rPPG algorithms in Table 1 are reviewed in the previous section, from the perspective of color space models, and classified into two categories. Among those methods, Hue [11,12], CHROM [5], and POS [7] involve an intermediate projection plane, followed by the “plane to vector” or “plane to angle” step. The variation of BVP is assumed to be strongest in this intermediate plane. Both the Hue channel and POS utilize the chromatic plane perpendicular to the luminance vector [1, 1, 1] in the RGB color space (simplified as 1 usually). On the other hand, CHROM defines a standardized skin-tone vector by large-scale experiment and employs the plane perpendicular to the specular vector [0.37, 0.56, 0.75] as the projection plane. These fixed projection planes are based on assumptions regarding optical distortions, such as variations in specular reflection and light intensity changes. If the physiological and optical priors are only partially valid, the predefined projection planes become less effective and lose robustness against various interferences. In this section, an adaptive projection plane-APON is proposed. With this intermediate plane, two pulse extraction algorithms are raised in the above categories correspondingly: APON-Vector (spatial vector projection) and APON-Angle (spatial angle projection).
3.1. The Visualization of Noise
Besides the skin tone and the illumination variation, motion also has a significant impact on the specular component in the skin-reflection models. To investigate the influence of general noise on the RGB signals without considering the specific noise type, the distribution of RGB signals (denoted as RGBraw) extracted from a set of tested videos from the dataset PURE [18] is plotted in Figure 3. PURE primarily includes videos featuring stationary subjects, conversations, and head movements such as translations and rotations. Figure 3 shows the results of subject 1 in different statuses from PURE. To obtain the desired RGB signals, the skin pixels of each frame are first averaged to calculate the mean value for each frame. These mean values are then concatenated in the time domain to form the RGB sequences. The data in Figure 3 demonstrates approximately linear or spindle-shaped distribution. Given the inherently weak amplitude of the BVP signal, it can be assumed that the major variations along the spindle’s long axis, which represent the primary temporal changes of the signal, are attributable to noise from motion or lighting variations. These changes negatively impact the extraction of the BVP signal.
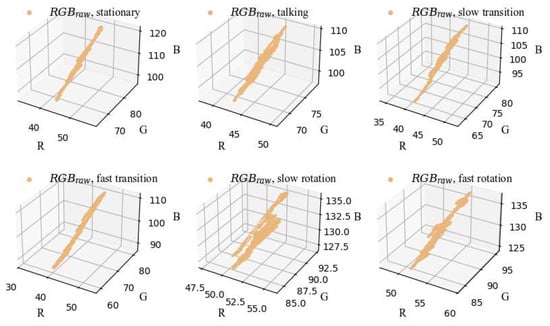
Figure 3.
The 3 × N (denotes N frames)-points RGB signals obtained from different scenarios of the same person (subject 01) in PURE.
To further verify the assumption, the color variations caused by noise are visualized in the color space as follows. As depicted in Figure 4, the BVP frequency fbvp is computed from the spectrum of the corresponding ground-truth PPG signal. Then, the desired BVP signal RGBbvp is filtered from the RGBraw by a bandpass filter with the center frequency of the passband set to fbvp, specifically in the range [fbvp − 0.2 Hz, fbvp + 0.2 Hz]. Simultaneously, the RGB variation induced by noise, denoted as RGBnoise, could be represented by their difference.
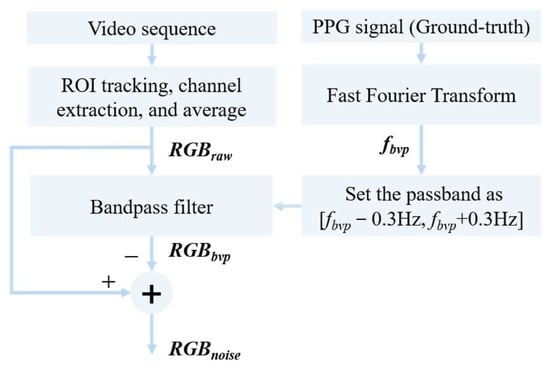
Figure 4.
The flowchart of separating the RGB variation caused by noise and blood volume pulse for visualization.
The RGBraw, RGBbvp, and RGBnoise of the first video (stationary) from Figure 3 are shown in Figure 5. The scatters are fitted to straight lines using the least-squares method [19]. As shown in the figure, the corresponding vectors vnoise and vraw nearly coincide. On the other hand, the angle between vbvp and vraw is far from zero. Besides, the variation range of RGBnoise is close to that of RGBraw, which is about 65~85 in the Green channel. While the variation due to BVP is much smaller and constrained in [−0.4, 0.4]. The angles between vnoise, vbvp, and vraw are plotted in Figure 6 for the whole dataset. The statistical results confirm the hypothesis that the direction of the dominant color variation in the RGB space is due to noise, regardless of whether the target is stationary or undergoing different motions.

Figure 5.
The RGBraw, RGBbvp, and RGBnoise, and the corresponding fit vectors vraw, vbvp, and vnoise of video “01-01” in PURE.
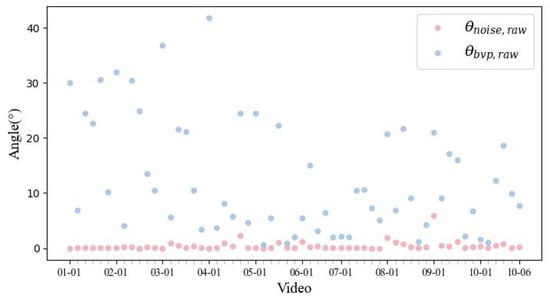
Figure 6.
The distribution of (the angle between and ) and (the angle between and ) for all videos in PURE.
3.2. Adaptive-Plane-Orthogonal-to-Noise (APON)
Based on the verified hypothesis, an intermediate projection plane orthogonal to vnoise is raised. This approach is based on the premise that there exists a dominant noise direction in the RGB space, which is often a more realistic assumption than a simple noise model such as a Gaussian. In other words, the following pulse extraction steps are constrained to a plane whose normal vector is aligned with the dominant variation of raw RGB signals. As discussed above, vraw is very close to the major interference direction vnoise, while a significant angle can be observed between vbvp and vraw. Selecting the plane orthogonal to vraw (a good approximation of vnoise) as the intermediate projection plane will mitigate more environmental noise interference.
The statistics shown in Figure 3, Figure 5 and Figure 6 are computed over the entire video clip. For longer videos with complicated motion, the noise present in the signal may exhibit a more dispersed pattern across multiple directions, as illustrated in the “Slow-rotation” and “Fast-rotation” cases of Figure 3. However, the proposed Plane-Orthogonal-to-Noise is designed to be perpendicular to the dominant noise direction. In practice, a sliding window of frames is employed to estimate the noise vector vnoise and determine the APON in real time. The selection of sliding window size and hop size will be declared in detail in the experiments section. The least squares method is employed to fit the RGB scatter to a straight line. The 3D spatial straight line fitting approach involves deriving the fitted line from the intersection of two planes, which is achieved by solving the equations describing these planes in 3D space. Details of the derivation process could be found in [19].
While this fitting process provides a computationally efficient way to adapt to dominant noise, we acknowledge a limitation in the current implementation: the normal vector estimate does not include confidence intervals to quantify its statistical uncertainty. This design choice was made to prioritize real-time performance. Incorporating such a statistical analysis to evaluate the stability of the normal vector is a promising direction for future work to further enhance the method’s robustness. Then the plane with vraw as the normal vector is determined, and the RGB sequences are projected onto this APON for further operations.
3.3. APON_Vector
With the determined adaptive plane for each window of frames, a feature selection method is proposed to find the most proper vector on the plane for the final projection. The resulting rPPG algorithm is called Adaptive Plane-Orthogonal-to-Noise Vector, simplified as APON_Vector, which belongs to the spatial vector projection category mentioned in Section 2.
Before determining the final vector in the plane, let us confirm “Is APON a better plane?” First, assume the pulsatile vector is defined as [0.33, 0.77, 0.53]T in PBV [6]. Figure 7 visually compares the pulse signal distribution on the planes corresponding to the CHROM, POS, and our proposed APON methods. This figure demonstrates that the pulse signal is significantly stronger on the APON plane. Besides, an evaluation experiment was conducted to compare the optimal vector in this plane with the plane used in existing approaches. All the possible projection vectors within the planes were extracted by exhaustive search with a 1-degree interval, as depicted in Figure 8b. Then, RGB signals were projected onto each vector to get their corresponding projected signals, which were evaluated against the reference PPG signal. Four metrics, namely Root Mean Square Error (RMSE) [20], Concordance Correlation Coefficient (CCC) [20], Accuracy (ACCURACY) [12], and Signal-to-Noise ratio (SNR) [5], were utilized to evaluate the performance of the final projected signals in calculating pulse rate.
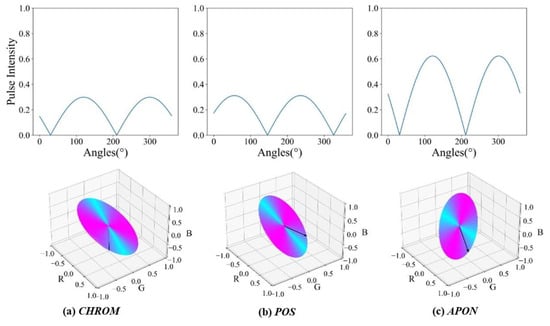
Figure 7.
Distribution of pulse intensity on the projection planes (a) CHROM, (b) POS, (c) APON in PURE “01-01”. The pulsatile vector is defined by the upbv [0.33, 0.77, 0.53]T of PBV [6]. Red means high pulse intensity, and blue means low intensity in the contrast.

Figure 8.
(a) Intermediate projection plane APON. (b) The exhaustive search of all possible vectors within the projection plane. (c) Determining two candidate projection vectors based on two features.
A typical video in Steady state from PURE is used as an example in Figure 9. It shows the evaluation results of the corresponding projection signals obtained from the exhaustive 360 vectors with the adaptive projection plane (green), the results from the CHROM plane (blue), and the POS plane (orange). It is reasonable to observe that the results of the three projection planes exhibit a periodicity of 180 degrees. Hence, only half of the plane is considered in the subsequent analysis. Each evaluation metric has a relatively good performance range, which is consistent across multiple metrics. It could be found that 48.89% of the vectors provide relatively small RMSE values in the CHROM plane, while the percentage is 81.11% for POS, and 86.67% for APON. The wider the range, the easier it is to find the best vector. Moreover, the figures in CCC, SNR, and ACCURACY metrics also show the superiority of the optimal vector obtained in APON over the vector of CHROM and POS. Generally, the proposed APON not only provides a wider good performance range for the vector tuning in the next step, but also contains an optimal vector with better performance than state-of-the-art algorithms.
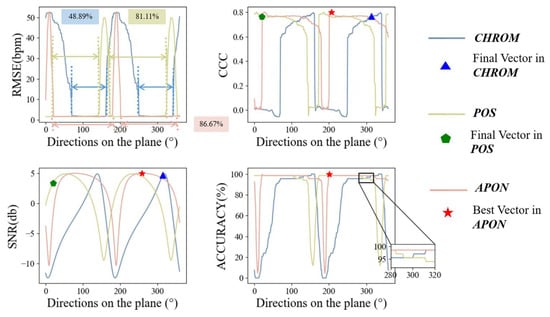
Figure 9.
An example from PURE (“07-01”) to illustrate the pulse rate detection performance of all possible vectors within the proposed APON and the planes from existing approaches.
As shown in Figure 9, alpha tuning used by both CHROM and POS may sometimes not select the optimal vector in its own plane as the final projection vector. In the paper, another vector selection algorithm is raised as follows. First, two quality metrics used by Wang [21] are employed to screen the 180 candidate vectors with their corresponding pulse signals. As illustrated in [21], the metric SNR in frequency-domain analysis and the kurtosis (normalized fourth moment) in time-domain analysis could distinguish pulse from most noise and interference, such as white Gaussian noise, white uniform noise, respiration, heart-rate variability, and non-periodic motion. The only challenge, the periodic motion artifacts, is most likely the dominant direction orthogonal to the APON. In other words, it has been eliminated in the first step of plane selection.
First, the SNR metric was calculated by taking the ratio of the energy around the fundamental frequency plus the first harmonic of the pulse signal to the residual energy contained in the frequency spectrum. The SNR-based candidate selection in the plane can be expressed as:
where H represents the pulse signal that has the largest SNR value, SNRi represents the SNR value of the pulse signal , which is obtained by projecting the original RGB values to ith vector the on the plane, is the spectrum of , is the binary template window, which is ±0.1 Hz wide at the fundamental frequency and ±0.1 Hz at the first harmonic. It is noted that 0.7 Hz~4 Hz is a physiologically normal range for human pulse rate, corresponding to 42~240 beats per minute.
Similarly, the candidate projection signal obtained based on the Kurtosis feature on the fitting plane can be expressed as:
where H represents the pulse signal with the smallest Kurtosis value, and Kurtosisi represents the Kurtosis value of the pulse signal obtained by projecting original RGB values to the ith vector on the plane, and denote the mean and standard deviation operations, respectively.
Instead of relying on a pre-defined threshold, SNR and Kurtosis are utilized as two features to separately select the corresponding optimal vector. Since the SNR and Kurtosis features have their own pros and cons when facing different challenges, to fully utilize the strengths of these two features, a pseudo-reference signal is used as the criterion to make the final decision. The pseudo-reference signal comes from a linear combination GRB algorithm, which could be regarded as the simplified CHROM [5], where α = 1 in the alpha tuning step. The linear combination is also utilized in previous papers, such as [22], where it outperforms all other approaches.
The pulse rate of the pseudo-reference signal and two candidate pulse signals are calculated for comparison. The candidate with the higher ACCURACY is selected as the final result. Besides, the ground-truth PPG could not be directly utilized as a practical reference, but it could be employed to verify the effects of the pseudo-reference signal. All videos in PURE are divided into 3552 10-s clips. The pseudo-reference signal and ground-truth signal are utilized to select the optimal signal out of two candidates, respectively. The same selection is made for 3085 (86.85%) clips in comparison.
The flowchart of the overall APON_Vector scheme is shown in Figure 10. After the candidate screening and vector selection, original RGB values are projected to the final vector on APON for pulse extraction.
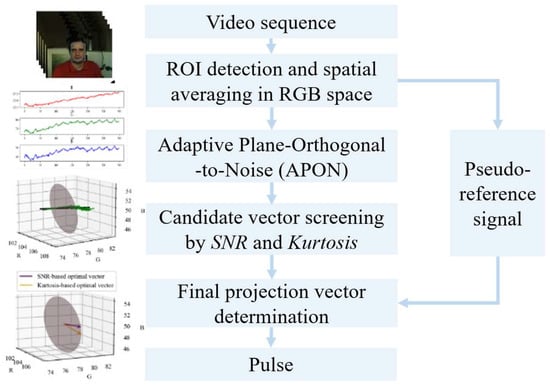
Figure 10.
Flowchart of the APON_Vector scheme.
3.4. APON_Angle
As demonstrated above, the intermediate projection plane APON helps to mitigate the dominant environmental interference. From the perspective of spatial angle projection, a pulse extraction method APON_Angle is raised by integrating APON with the chromatic channel method Hue.
Single channel in other color spaces, e.g., Hue in HSV [11], Q in NTSC [12], was found to benefit the pulse extraction. To verify this conclusion, extensive experiments were performed in PURE with the RMSE of the pulse rate as the evaluation metric. Among the 24 single channels from 8 color spaces (RGB, HSV, YUV, YCbCr, NTSC, XYZ, LAB, LUV), HSV-Hue and NTSC-Q achieved the best and the second-best performance, respectively. Hue channel could be obtained by the following conversion formula:
It is noted that HSV is not a 3D-artesian coordinate system, and the conversion process is not a linear process. The Hue channel signal corresponds to the angular variation value θ on the chromatic plane perpendicular to the luminance axis V, as shown in Figure 11. To fully utilize the advantages of APON, the Hue value θ on the fixed chromatic plane is mapped to the angular variation value α on APON for more robust pulse extraction. The transition is detailed as follows: the two vectors that define angle θ are first obtained, then they are projected onto the current APON. As a result, an angle α on APON is defined by these two projected vectors. The resulting consecutive angular variation value α on APON is taken as the estimated pulse signal. This allows us to fully leverage the noise-adaptive advantages of the APON while retaining the principles of angular projection.
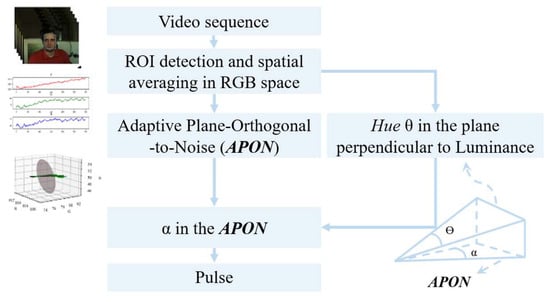
Figure 11.
Flowchart of the APON_Angle scheme.
4. Experimental Results and Discussion
This section illustrates the experimental setup, as well as the corresponding results and discussions. The experimental setup section describes the dataset, evaluation metrics, and signal processing methods employed. The results and discussion sections are organized based on the two main categories mentioned above. The impact of window length on the proposed scheme is also discussed.
4.1. Experimental Setup
This study compares the performance of various algorithms using two public databases: PURE [18] and UBFC2 [23]. The data was collected with ethical approval and informed consent from the participants by the original dataset creators. We have adhered to ethical standards by using the data solely for research purposes and citing the original sources. PURE contains 59 videos from 10 participants, including eight males and two females; each video is about one minute long. It consists of videos captured in six different conditions, including Steady, Talking, Slow translation, Fast translation, Small rotation, and Medium rotation. Some of the videos in this database also include variations in lighting intensity. UBFC2 includes a simulated real-world human-computer interaction scenario. The dataset contains 42 videos from 42 participants, each video is about two minutes long. The videos were captured in a bright indoor environment. The experiments are implemented on the Windows 10 system using Python 3.10.2. The hardware specifications are as follows: an Intel i5-6200CPU @ 2.3 GHz, 8 GB of RAM, 1 TB SSD, and AMD Radeon (TM) R7 M340 (2 GB). The PyVHR [20] is employed as the framework, and Mediapipe [24] is utilized to detect and track faces for all methods.
The down-sampling is performed since the sampling rate of the reference signal and the frame rate of the corresponding video are different in PURE. For the estimated pulse signals extracted by each algorithm, bandpass filtering was performed using a 6th-order Butterworth filter. The passband cutoff range of the filter is [0.7, 4.0] Hz, which is regarded as the normal heart rate range. Evaluating the performance of various pulse signal extraction algorithms by directly comparing the reference signal with the estimated BVP signal in the time domain is not meaningful due to the differences in delay and scale caused by different measurement points on the body and acquisition devices. Therefore, subsequent calculation errors are not based on the time domain waveform, but rather on the heart rate value sequences extracted from the corresponding signals after signal processing. The heart rate value sequences for each segment were obtained using frequency tracking method [25].
The simulation comparison will also be divided into two types: between APON_Vector and other vector projection algorithms; between APON_Angle and other angle projection algorithms, respectively. Different settings were made for different classes of algorithms. For the latter, in order to harmonize with the SSR algorithm, the whole video clip was input without splitting. For the former, the video was segmented into 10 s lengths with 1s steps in order to obtain more measured data for real-time pulse detection. The evaluation indicators employed were RMSE, MAE, MAX, PCC, CCC, and ACCURACY. Besides the metrics RMSE, CCC, and ACCURACY mentioned in Section 3.3, MAE (Mean Absolute Error), MAX (the maximum error), and PCC (Pearson Correlation Coefficient) are also common metrics used in the assessment of pulse rate detection.
4.2. Results and Discussion
4.2.1. Comparison of APON_Vector with Other Spatial Vector Projection Algorithms
Figure 12 shows the comparison among various algorithms, including projection to the optimal vector on the adaptive plane APON_BestVector, the proposed APON_Vector, and other spatial vector projection methods listed in Table 1. It can be observed that the APON_BestVector outperforms the results of other algorithms in terms of different metrics (2.17 bpm, 1.57 bpm, 4.5 bpm, and 94.83% for RMSE, MAE, MAX, and ACCURACY, respectively), particularly in PCC (0.84) and CCC (0.69). The proposed APON_Vector significantly outperforms GREEN, ICA, and PBV algorithms, while having similar performance with others in terms of RMSE (3.61 bpm), MAE (2.45 bpm), MAX (8.40 bpm), PCC (0.32), CCC (0.30), and ACCURACY (87.34%). As depicted in Figure 13, the performance comparison on the UBFC2 shows a similar trend to the PURE, further validating our approach.
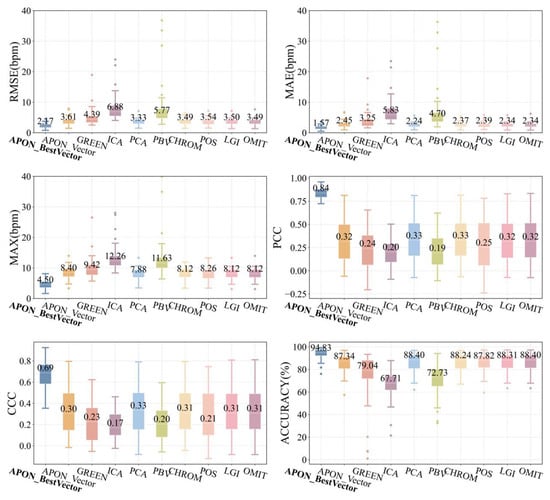
Figure 12.
Comparison of various spatial vector projection schemes in PURE.
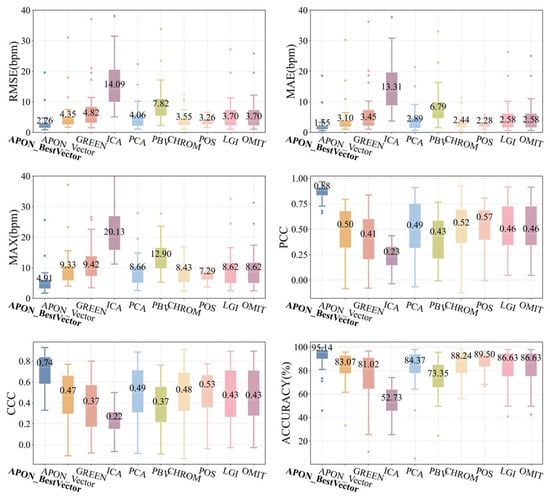
Figure 13.
Comparison of various spatial vector projection schemes in UBFC2.
It confirms that the dominant direction in RGB space is due to the environmental noise, while the plane perpendicular to it contains the desired pulsatile information. The performance difference between the APON_Vector and APON_BestVector indicates that the vector selection process could be further enhanced in the future. An example of a spectrogram is also demonstrated in Figure 14. It could be observed that GREEN, ICA, PCA, and PBV have a weak frequency trace in the middle segment. While POS, LGI, and OMIT have obvious interference at the ending segment around 50 s. It is due to this that the plane APON is always orthogonal to the dominant noise in the current segment of video, while some prior work utilized a fixed plane. When the plane is not orthogonal to the noise, the interference occurs.

Figure 14.
Comparison of spatial vector projection algorithms for subject 22 in UBFC2, where the x- and y-axis denote the time (sec) and frequency (bpm). The red circles highlight noises observed in different methods. Yellow box highlights the pulse rate trace.
4.2.2. Comparison of APON_Angle with Other Spatial Angle Projection Algorithms
The comparison of the APON_Angle with other spatial angle projection algorithms, SSR, and Hue, is shown in Figure 15. It is found that the SNR of Hue and SSR is relatively low for pulse extraction. In contrast, a clear frequency trace could be observed in the proposed scheme. As shown in the time-frequency analysis of Figure 14 and Figure 15, the APON method effectively filters out noise and artifacts (red circle), yielding a cleaner pulse signal (yellow rectangle). This visual evidence directly accounts for our method’s superior performance in the comparative analysis.

Figure 15.
Comparison of spatial angle projection algorithms for subject 45 in UBFC2, where the x- and y-axis denote the time (sec) and frequency (bpm). The red circles highlight noises. Yellow box highlights the pulse rate trace.
Table 2 presents the results of the three algorithms on PURE and UBFC2, with the mean and standard deviation of all metrics. It can be observed that for the PURE, the results of APON_Angle are similar to Hue and better than SSR. For UBFC2, the APON_Angle demonstrates superior performance across all metrics, including error, accuracy, and correlation.

Table 2.
Comparison of the Apon_Angle method with the other two spatial angle projection methods.
Bland–Altman analysis [26] was also employed in UBFC2 to assess the agreement between estimated heart rate values of three algorithms and reference heart rate values. The results are plotted in Figure 16. A total of 2776 measurement pairs were tested, and heart rate values were calculated using frequency tracking [25]. The x-axis of each subplot represents the average of the two variables, and the y-axis represents the difference. The average difference () and standard deviation (SD) of the differences, as well as the 95% limits of agreement ( ± 1.96SD), were also calculated. The SSR algorithm yielded an average bias of −4.8 bpm with a 95% limit of agreement ranging from −35.3 to 25.8 bpm. The Hue algorithm reduced the error with an average bias of −2.5 bpm and a 95% limit of agreement ranging from −23.4 to 18.4 bpm. The APON_Angle exhibited a distribution of points closer to zero compared to the Hue channel algorithm, with an average bias of -2.4 bpm and a 95% limit of agreement ranging from −22.3 to 17.7 bpm. It is observed that the limits of agreement in Figure 16 are relatively large because more motion artifacts are included in the UBFC2 dataset.

Figure 16.
Bland–Altman analysis of the agreement between reference heart rate values and estimated heart rate values obtained from (a) SSR, (b) Hue, and (c) APON_Angle (a total of 2776 measurement pairs). The lines represent the mean and 95% limits of agreement.
In summary, the APON_Angle algorithm outperforms the SSR algorithm and shows comparable performance to the Hue channel algorithm in the PURE database. At the same time, it exhibits a distinct advantage on the UBFC2 database. The reason is that, for the videos in PURE, where the fitted adaptive projection plane is close to the plane where the Hue channel resides (perpendicular to the brightness axis V), the angular variation values on both planes are similar. As a result, there is no substantial difference in the performance of pulse rate detection. However, when the angle between two planes is as significant as the videos in UBFC2, the adaptive projection plane can leverage its advantage to achieve more accurate heart rate detection.
4.2.3. Different Window Lengths for the Adaptive Projection Plane
As mentioned in Section 3.2, the noise in the signal may exhibit a dispersed pattern across multiple directions when the video duration is long. A sliding window of frames is employed to estimate the noise vector vnoise and determine the APON in real time. In this section, the experiments were conducted in PURE for the discussion of APON_Vector with different segment lengths. Results were collected for segment lengths ranging from 5s to 50s with a step size of 1 s, as shown in Figure 17. It can be observed that as the length of the tested video segments increases, the average RMSE of pulse rate gradually decreases. While the decreasing trend becomes less significant between 25 s and 50 s. Besides, the results for subject 02 were included in Figure 17b to demonstrate the effects in different video types. For the stationary videos, e.g., 02-01, a longer window means more values for determining the dominant noise direction and the adaptive plane, and results in more accurate pulse rate detection. While for video 02-06, which contains different noise directions across the timeline, the fitting vector is no longer dominant, and the performance of the projection plane varies when the window length keeps increasing. Considering a balance between accuracy and real-time requirement, the segment length of 20 s to 30 s is suggested in the proposed method for different videos. The determination of the APON plane primarily involves fitting a line to the RGB data points within a sliding time window. This fitted line is then used as a normal vector to define the plane orthogonal to it. With a recommended sliding window of 20 to 30 s, this method is computationally efficient and fully capable of meeting the requirements for real-time heart rate detection, as it only requires a line fitting and plane calculation on the most recent window of data.
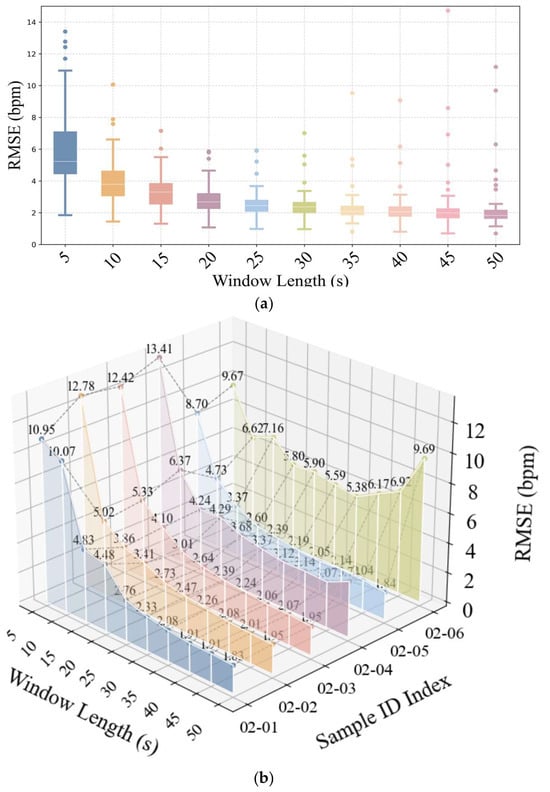
Figure 17.
Effects of different window lengths on the performance of the APON_Vector algorithm for (a) PURE, (b) subject 02 in PURE.
5. Conclusions
This study’s key findings confirm the effectiveness of the proposed APON (Adaptive Projection plane Orthogonal to Noise) approach. We show that our method, which adapts to noise distribution to suppress artifacts, yields robust performance across different scenarios. The APON plane successfully isolates pulse signals from noise, leading to significant performance gains. Specifically, the APON_Vector method achieves performance comparable to state-of-the-art algorithms like CHROM and POS, while the APON_Angle method outperforms other angle-based approaches. This work validates our classification of traditional rPPG methods and demonstrates the potential of our proposed adaptive plane for more accurate pulse rate detection.
Compare with our previous work [27], the main contribution of this paper is concluded as follows: (1) unify the traditional rPPG methods into the RGB color space for intuitive understanding and classifying them into two categories; (2) visualizing the dominant noise in RGB space and proposing a simple but effective adaptive plane orthogonal to noise; (3) developing two rPPG methods APON_Vector and APON_Angle with the adaptive plane, respectively. Experiments show that the best vector in APON exhibits better performance than other similar methods, but it is still worth exploring the vector selection process from APON in the future. Besides, when there is more than one direction of significant noise, e.g., more than one periodic motion in extensive exercises [28], the assumption of “dominant noise” is no longer valid; an additional motion elimination framework [29,30] is required before applying the proposed schemes, as well as other existing traditional methods. We believe this external framework, rather than a more complicated multi-plane analysis, offers a more promising and practical path forward for handling these complex noise scenarios. To ensure full reproducibility and provide complete implementation details, the source code for our APON algorithm is made available as Supplementary Material.
Supplementary Materials
The following supporting information can be downloaded at: https://www.mdpi.com/article/10.3390/math13172749/s1.
Author Contributions
Conceptualization, C.-H.F.; methodology, Y.Z.; software, Y.Z. and X.H.; validation, J.P.; formal analysis, Y.Z.; investigation, C.-H.F. and H.H.; resources, H.H.; data curation, Y.Z.; writing—original draft preparation, Y.Z.; writing—review and editing, C.-H.F. and J.P.; visualization, J.P.; supervision, C.-H.F.; project administration, H.H.; funding acquisition, C.-H.F. and H.H. All authors have read and agreed to the published version of the manuscript.
Funding
This research was funded by the Jiangsu Science and Technology Program (Grant No. BE2023819), the National Natural Science Foundation of China (Grant Nos. 62471232, 62401262, 62301255, 62201259, 62431013, and U24A20230). The APC was funded by the National Natural Science Foundation of China.
Data Availability Statement
The original data and code presented in the study are openly available in gitee at https://gitee.com/yanz256/rppg (accessed on 22 August 2025).
Conflicts of Interest
The authors declare no conflicts of interest. The funders had no role in the design of the study; in the collection, analyses, or interpretation of data; in the writing of the manuscript; or in the decision to publish the results.
References
- Verkruysse, W.; Svaasand, L.O.; Nelson, J.S. Remote Plethysmographic Imaging Using Ambient Light. Opt Express 2008, 16, 21434–21445. [Google Scholar] [CrossRef]
- Poh, M.-Z.; McDuff, D.J.; Picard, R.W. Non-Contact, Automated Cardiac Pulse Measurements Using Video Imaging and Blind Source Separation. Opt Express 2010, 18, 10762–10774. [Google Scholar] [CrossRef]
- Poh, M.-Z.; McDuff, D.J.; Picard, R.W. Advancements in Noncontact, Multiparameter Physiological Measurements Using a Webcam. IEEE Trans. Biomed. Eng. 2011, 58, 7–11. [Google Scholar] [CrossRef]
- Lewandowska, M.; Rumiński, J.; Kocejko, T.; Nowak, J. Measuring Pulse Rate with a Webcam—A Non-Contact Method for Evaluating Cardiac Activity. In Proceedings of the 2011 Federated Conference on Computer Science and Information Systems (FedCSIS), Szczecin, Poland, 18–21 September 2011; pp. 405–410. [Google Scholar]
- de Haan, G.; Jeanne, V. Robust Pulse Rate From Chrominance-Based rPPG. IEEE Trans. Biomed. Eng. 2013, 60, 2878–2886. [Google Scholar] [CrossRef]
- de Haan, G.; van Leest, A. Improved Motion Robustness of Remote-PPG by Using the Blood Volume Pulse Signature. Physiol. Meas. 2014, 35, 1913. [Google Scholar] [CrossRef]
- Wang, W.; den Brinker, A.C.; Stuijk, S.; de Haan, G. Algorithmic Principles of Remote PPG. IEEE Trans. Biomed. Eng. 2017, 64, 1479–1491. [Google Scholar] [CrossRef]
- Pilz, C.S.; Zaunseder, S.; Krajewski, J.; Blazek, V. Local Group Invariance for Heart Rate Estimation from Face Videos in the Wild. In Proceedings of the IEEE Conference on Computer Vision and Pattern Recognition Workshops, Salt Lake City, UT, USA, 18–22 June 2018; pp. 1254–1262. [Google Scholar]
- Casado, C.Á.; López, M.B. Face2PPG: An Unsupervised Pipeline for Blood Volume Pulse Extraction From Faces. IEEE J. Biomed. Health Inform. 2023, 27, 5530–5541. [Google Scholar] [CrossRef]
- Wang, W.; Stuijk, S.; de Haan, G. A Novel Algorithm for Remote Photoplethysmography: Spatial Subspace Rotation. IEEE Trans. Biomed. Eng. 2016, 63, 1974–1984. [Google Scholar] [CrossRef]
- Tsouri, G.R.; Li, Z. On the Benefits of Alternative Color Spaces for Noncontact Heart Rate Measurements Using Standard Red-Green-Blue Cameras. JBO 2015, 20, 48002. [Google Scholar] [CrossRef]
- Ernst, H.; Scherpf, M.; Malberg, H.; Schmidt, M. Color Spaces and Regions of Interest in Camera Based Heart Rate Estimation. In Proceedings of the 2020 11th Conference of the European Study Group on Cardiovascular Oscillations (ESGCO), Pisa, Italy, 15 July 2020; pp. 1–2. [Google Scholar]
- Song, R.; Chen, H.; Cheng, J.; Li, C.; Liu, Y.; Chen, X. PulseGAN: Learning to Generate Realistic Pulse Waveforms in Remote Photoplethysmography. IEEE J. Biomed. Health Inform. 2021, 25, 1373–1384. [Google Scholar] [CrossRef]
- Chen, W.; McDuff, D. DeepPhys: Video-Based Physiological Measurement Using Convolutional Attention Networks. In Proceedings of the European Conference on Computer Vision (ECCV), Munich, Germany, 8–14 September 2018; pp. 349–365. [Google Scholar]
- Liu, X.; Hill, B.; Jiang, Z.; Patel, S.; McDuff, D. EfficientPhys: Enabling Simple, Fast and Accurate Camera-Based Cardiac Measurement. In Proceedings of the 2023 IEEE/CVF Winter Conference on Applications of Computer Vision (WACV), Waikoloa, HI, USA, 2–7 January 2023; pp. 4997–5006. [Google Scholar]
- Zheng, X.; Yan, W.; Liu, B.; Wu, Y.I.; Tu, H. Estimation of Heart Rate and Respiratory Rate by Fore-Background Spatiotemporal Modeling of Videos. Biomed. Opt Express 2025, 16, 760–777. [Google Scholar] [CrossRef]
- Francis, J.G.F. The QR Transformation—Part 2. Comput. J. 1962, 4, 332–345. [Google Scholar] [CrossRef]
- Stricker, R.; Müller, S.; Gross, H.-M. Non-Contact Video-Based Pulse Rate Measurement on a Mobile Service Robot. In Proceedings of the 23rd IEEE International Symposium on Robot and Human Interactive Communication, Edinburgh, UK, 25–29 August 2014; pp. 1056–1062. [Google Scholar]
- Xue, L. Three-Dimensional Point Piecewise Linear Fitting Method Based on Least Square Method. J. Qiqihar Univ. (Nat. Sci. Ed.) 2015, 31, 84–85, 89. (In Chinese) [Google Scholar] [CrossRef]
- Boccignone, G.; Conte, D.; Cuculo, V.; D’Amelio, A.; Grossi, G.; Lanzarotti, R.; Mortara, E. pyVHR: A Python Framework for Remote Photoplethysmography. PeerJ Comput. Sci. 2022, 8, e929. [Google Scholar] [CrossRef]
- Wang, W.; den Brinker, A.C.; de Haan, G. Single-Element Remote-PPG. IEEE Trans. Biomed. Eng. 2019, 66, 2032–2043. [Google Scholar] [CrossRef]
- Zhu, Q.; Wong, C.-W.; Fu, C.-H.; Wu, M. Fitness Heart Rate Measurement Using Face Videos. In Proceedings of the 2017 IEEE International Conference on Image Processing (ICIP), Beijing, China, 17–20 September 2017; pp. 2000–2004. [Google Scholar]
- Bobbia, S.; Macwan, R.; Benezeth, Y.; Mansouri, A.; Dubois, J. Unsupervised Skin Tissue Segmentation for Remote Photoplethysmography. Pattern Recognit. Lett. 2019, 124, 82–90. [Google Scholar] [CrossRef]
- Lugaresi, C.; Tang, J.; Nash, H.; McClanahan, C.; Uboweja, E.; Hays, M.; Zhang, F.; Chang, C.-L.; Yong, M.G.; Lee, J.; et al. MediaPipe: A Framework for Building Perception Pipelines. arXiv 2019, arXiv:1906.08172. [Google Scholar]
- Zhu, Q.; Chen, M.; Wong, C.-W.; Wu, M. Adaptive Multi-Trace Carving for Robust Frequency Tracking in Forensic Applications. IEEE Trans. Inf. Forensics Secur. 2021, 16, 1174–1189. [Google Scholar] [CrossRef]
- Bland, J.M.; Altman, D.G. Statistical Methods for Assessing Agreement between Two Methods of Clinical Measurement. Lancet 1986, 1, 307–310. [Google Scholar] [CrossRef]
- Zhang, Y.; Fu, C.-H.; Zhang, L.; Hong, H. Adaptive Projection Plane and Feature Selection for Robust Non-Contact Heart Rate Detection. In Proceedings of the Fifteenth International Conference on Signal Processing Systems (ICSPS 2023), SPIE, Xi’an, China, 17–19 November 2023; Volume 13091, pp. 218–227. [Google Scholar]
- Spetlik, R.; Franc, V.; Cech, J.; Matas, J. Visual Heart Rate Estimation with Convolutional Neural Network. In Proceedings of the British Machine Vision Conference, Newcastle, UK, 3–6 September 2018; pp. 3–6. [Google Scholar]
- Liu, B.; Zheng, X.; Ivan Wu, Y. Remote Heart Rate Estimation in Intense Interference Scenarios: A White-Box Framework. IEEE Trans. Instrum. Meas. 2024, 73, 1–14. [Google Scholar] [CrossRef]
- Zhu, Q.; Wong, C.-W.; Lazri, Z.M.; Chen, M.; Fu, C.-H.; Wu, M. A Comparative Study of Principled rPPG-Based Pulse Rate Tracking Algorithms for Fitness Activities. IEEE Trans. Biomed. Eng. 2024, 72, 152–165. [Google Scholar] [CrossRef]
Disclaimer/Publisher’s Note: The statements, opinions and data contained in all publications are solely those of the individual author(s) and contributor(s) and not of MDPI and/or the editor(s). MDPI and/or the editor(s) disclaim responsibility for any injury to people or property resulting from any ideas, methods, instructions or products referred to in the content. |
© 2025 by the authors. Licensee MDPI, Basel, Switzerland. This article is an open access article distributed under the terms and conditions of the Creative Commons Attribution (CC BY) license (https://creativecommons.org/licenses/by/4.0/).