Article

Short Video Marketing or Live Streaming Marketing: Choice of Marketing Strategies for Retailers

1
School of Business, Fuyang Normal University, Fuyang 236037, China
2
Anhui Provincial Key Laboratory of Regional Logistics Planning and Modern Logistics Engineering, Fuyang 236037, China
*
Author to whom correspondence should be addressed.
Mathematics 2025, 13(16), 2675; https://doi.org/10.3390/math13162675
Submission received: 11 July 2025 / Revised: 9 August 2025 / Accepted: 18 August 2025 / Published: 20 August 2025

Abstract

This study investigates retailers’ strategic choices between short video marketing (SVM) and live streaming marketing (LSM) in the social media era, with a focus on the synergistic effects and decision-making mechanisms of these two digital marketing models. Using game theory, we construct a game analysis model to analyze retailers’ optimal selection among three marketing strategies: S (sole implementation of SVM), L (sole implementation of LSM), and H (integration of both SVM and LSM). The findings reveal that retailers should make different strategic choices based on the different stages of development. In the early market entry phase, characterized by both a low mixed commission rate and a low slotting fee, the H strategy emerges as the optimal choice. As the market enters its growth phase, retailers should shift to the L strategy, driven by “influencer LSM”. When the market enters a mature stage, retailers should be more inclined to adopt the S strategy or the L strategy dominated by “merchant self-LSM”. These findings provide new theoretical insights into the dynamic selection mechanisms of digital marketing strategies while offering practical decision-making guidance for retailers in allocating marketing resources across different development stages. The conclusions have direct implications for optimizing corporate marketing mix strategies.

1. Introduction

1.1. Background and Motivation

With the rapid development of social media applications, short video marketing (SVM) and live streaming marketing (LSM) models have become favored by many users. According to the China Internet Network Information Center (CNNIC) statistics, by December 2024, the number of short video users in China had reached 1.04 billion, constituting 93.8% of total internet users. During the same period, the number of live streaming users had grown to 0.83 billion, representing 75.2% of the total internet users [1]. This vast user base has considerable business potential for SVM and LSM, making the two emerging sales models play an increasingly important role in promoting product sales and market promotion [2].
The SVM model, with its powerful editing and customization functions, provides retailers with flexible and diverse product promotion methods. Retailers can customize unique advertising styles through third-party intermediaries (such as Multichannel Networks, MCNs), ingeniously integrating products into the storylines of short videos, thereby attracting consumers’ attention and enhancing their interest in the products [3]. The “little yellow cart (shopping cart)” function embedded in these short videos has greatly simplified the user’s purchasing process, achieving an immediate conversion from content viewing to product purchase, and effectively promoting the improvement of sales efficiency. Meanwhile, the social attributes of short videos, such as the like, share, and comment mechanisms, have built a two-way interactive bridge between retailers and consumers, enhancing user stickiness and brand loyalty [4]. In contrast, the LSM model has attracted a large number of consumers’ attention with its real-time interactivity and the authenticity of product display. During the live broadcast, consumers can ask the host questions in real time, and the host stimulates consumers’ purchasing intention by answering the questions and showcasing the products [5]. This direct interaction method not only enhances consumers’ sense of participation and trust but also effectively boosts the conversion rate and sales volume of the product. Statistics indicate that the TikTok platform experienced an impressive 83% growth rate in SVM transaction volume during 2023 [6], while during Taobao’s “Double 11” promotion, multiple live streaming rooms surpassed RMB 100 million in transactions [7]. These fundamental differences imply that retailers need to make strategic choices among SVM, LSM, and hybrid strategies based on their specific needs. Notably, as both SVM and LSM become increasingly mature, hybrid strategies are emerging as a new trend. However, existing studies mostly analyze a single model and fail to reveal the dynamic selection mechanism among the three strategies [8]. It should be emphasized that consumer decision-making in these three sales models inherently involves large-scale group interactions (e.g., viral diffusion of short videos or real-time feedback in live streaming rooms) [9]. Their underlying mechanisms can be quantified through social network analysis methods—such as modeling influencer impact based on user trust relationships or integrating multi-source heterogeneous review data. This provides a micro-level behavioral foundation for constructing the retailer strategy game model in subsequent sections [10].
However, while SVM and LSM strategies create significant business opportunities for retailers, they also pose complex challenges at the level of strategy selection. In both of these emerging sales models, retailers need to pay a certain percentage of commission to the MCN. In line with Huang et al.’s [11] findings, the commission rate demanded by MCNs for the services of top-tier talent can increase to 50%. Notably, there are differences in the commission rates charged by MCNS under SVM and LSM. Moreover, LSM also involves additional cost expenditures such as slotting fees [12]. Based on whether the slotting fee is zero or not, LSM can be further subdivided into two types: merchant self-LSM and influencer LSM. Merchant self-LSM refers to retailers using their own employees to carry out live streaming activities. Its characteristic lies in the fact that the slotting fee is zero. Influencer LSM, on the other hand, involves retailers hiring outstanding hosts through the MCN for live promotion. Under this model, the slotting fee is indispensable. Therefore, in this study, we adopt the criterion of whether the slotting fee is zero to distinguish between these two LSMs. When retailers opt for a hybrid strategy, the resulting cost superposition issue (e.g., simultaneously bearing short video production costs and live streaming slotting fees) further complicates strategic decision-making. In view of this, retailers need to comprehensively evaluate the advantages, limitations, and cost structures of the two sales models in the decision-making process in order to carefully select the sales model combination that best suits their own development stage. In practical business operations, brands such as Florasis, Estée Lauder, and Lancôme adopt different marketing strategies at distinct stages of their development. Taking Florasis as an example, the brand strategically combined SVM with LSM strategies in its initial market entry phase to quickly penetrate the market. Subsequently, the company further expanded brand awareness through “influencer LSM”. As the brand matured, its marketing strategy gradually shifted toward “merchant self-LSM” or promoting products through SVM. This series of changes raises the following intriguing questions: What factors influence retailers’ choices of marketing strategies? Previous studies have focused primarily on single strategies, such as examining the marketing effectiveness of SVM [13,14] or LSM [15,16,17] separately. However, this study aims to comprehensively examine the SVM strategy, the LSM strategy, and the combined application of the two strategies to fill a gap in the current research. The two factors mentioned above—namely, the commission rate and the slotting fee—are common influencing factors. Therefore, we incorporated these factors into the research.

1.2. Research Questions and Major Findings

We consider a market scenario where a platform such as TikTok exists. Its huge user base and active SVM and LSM provide retailers with diversified sales channels. Depending on whether the retailer introduces an SVM strategy, an LSM strategy, or a combination of the two, the following three strategies are derived, (1) the SVM strategy (Strategy S), (2) the LSM strategy (Strategy L), and (3) the hybrid strategy (Strategy H), which involves simultaneously employing SVM and LSM strategies for consumer sales and product promotion. Meanwhile, we consider that there are three significant differences between SVM and LSM. Firstly, in terms of the degree of consumer sensitivity to these two formats, the SVM strategy demonstrate higher appeal and acceptance due to their embedded storylines, personalized styles of creators, and frequent browsing features (such as an average daily browsing time of over 50 min for American adults [18] and 85 min for Chinese users [19]). Therefore, in this study, we assume that the sensitivity of consumers to SVM is higher than LSM. Secondly, in terms of the mechanism for promoting demand growth, the SVM strategy focuses on increasing the number of videos to enhance the viewing probability and indirectly boost sales. The LSM strategy, on the other hand, relies more on the hosts’ real-time promotional activities, directly stimulating consumers’ purchasing intentions through interaction and product recommendations. Finally, in terms of the effect of stimulating demand growth, although SVM is widely popular due to its short nature (with an average duration of about 5 min) [20,21], in terms of stimulating purchases, it is slightly inferior to LSM [22]. LSM, with its longer duration, rich product introductions, and the interactive atmosphere and promotional strategies within the live-streaming room (such as time-limited flash sales and limited supply), can more effectively enhance consumers’ purchasing enthusiasm. Therefore, in this study, we hypothesize that in the SVM mode, the number of short videos has a positive driving effect on market demand, but the marginal utility is decreasing; while in the LSM mode, the promotional effort of streamers also has a positive pulling effect on market demand, and there is a positive correlation. Based on the above analysis, this study aims to deeply explore the following issues:
(1) What are the key factors that influence retailers’ strategic choices, and how do retailers rely on these factors to make decisions?
(2) How do different strategic choices affect retailers’ pricing and demand?
(3) How does consumer sensitivity to different strategies impact the effectiveness of retailers’ strategic implementation?
Our primary findings are summarized as follows. First, as the development stage of the market changes, retailers should be flexible in adjusting their marketing strategies accordingly. In the initial market entry stage, characterized by a low mixed commission rate and a low slotting fee, retailers should embrace Strategy H and leverage the use of widespread marketing and brand-building approaches to swiftly penetrate the market. As the market enters its growth stage with an increasing mixed commission rate but a relatively low slotting fee, particularly when the LMS commission rate for influencers remains low, retailers should utilize primarily Strategy L centered on “influencer LSM”. During the market maturity stage, when both commission rates and the slotting fee are high, particularly if the slotting fee increases significantly, retailers should consider adopting Strategy S or L focused on “merchant self-LSM”. Second, Strategy H is more effective than the other two strategies in helping retailers increase product selling prices while simultaneously boosting market demand and consumer surplus. In contrast, the impact of Strategy L and Strategy S on retailers’ pricing power and market demand depends on certain conditions, specifically, which commission rate is higher and offers a greater incentive advantage. Third, during the implementation of the strategy, retailers must prioritize consumers’ sensitivity to SVM and LSM promotions, as the higher the sensitivity, the greater the pricing space for products and the increase in market demand. In addition, collaborating with influencers boasting a substantial fan base can significantly bolster the effectiveness of LMS promotions, thereby attracting more potential consumers and broadening market share.

1.3. Contribution Statement and Structure of This Paper

This study contributes to both the academic literature and practical operations in three key aspects. First, we deepen and extend existing research on short video marketing (SVM) and live streaming marketing (LSM). By constructing a game-theoretic model between retailers and multichannel networks (MCNs), we employ Nash equilibrium and mathematical analysis to derive optimal strategies for both parties while uncovering how parameter variations influence equilibrium outcomes. To our knowledge, this paper is the first to comprehensively analyze strategic choices between SVM, LSM, and hybrid strategies. By systematically examining the conditions under which these strategies succeed, we provide retailers with an actionable decision-making framework, thereby addressing a critical gap in the literature. Second, through mathematical properties of the optimal solutions (e.g., monotonicity, concavity/convexity), we reveal how retailers should select and adapt their strategies across different market development phases. Specifically, we clarify how commission rates and slotting fees dynamically shape the optimal choice of SVM, LSM, or a hybrid approach during the initial entry, growth, and maturity stages. These findings empower retailers to align their strategies with market evolution for maximum profitability. Finally, we demonstrate the pivotal role of consumer sensitivity in strategy effectiveness. Our results show that as consumer responsiveness to SVM or LSM promotions grows, retailers can raise prices, expand demand, and boost profits—regardless of the chosen strategy. This offers actionable insights for tailoring strategies to observed consumer behavior.
The subsequent sections of this paper are organized as follows. Section 2 provides a comprehensive review of the relevant literature. In Section 3, we construct a model and examine the equilibrium prices, market demand levels, and profits under different strategies. In Section 4, a comprehensive comparison is conducted, and optimal strategic recommendations and managerial insights are provided for retailers. Some extensions are explored in Section 5. Finally, Section 6 outlines the conclusions, discusses the managerial implications and limitations of this study, and suggests potential directions for future research.

2. Literature Review

The focus of our research aligns closely with the following two primary areas of the literature: (i) short video marketing and (ii) live streaming marketing.

2.1. Short Video Marketing

Recent research on short video marketing (SVM) has systematically examined its mechanisms through three primary lenses. First, content design elements have been shown to significantly drive engagement, with Xiao et al. [4] identifying four core components (content matching, information relevance, storytelling, and emotional expression) that enhance consumer interactions on TikTok, while also demonstrating the moderating role of posting timing. Complementing this, Li and Zhang [23] and Li et al. [24] established the importance of sensory appeal and interactivity in creating emotional connections and behavioral responses. Second, creator influence has been highlighted by Yuan et al. [25], who found that exceptional creators generate universal effectiveness regardless of product price, particularly with substantial content exposure. Third, studies have explored behavioral outcomes, revealing SVM’s dual impact on purchase intentions [26,27], viewer engagement [28], and sharing motivations [29,30], while also identifying potential adverse effects [31,32] that require consideration.
In summary, while these studies have provided valuable insights into SVM, they have primarily focused on empirically examining its underlying mechanisms. Although some scholars, such as Chen [33] and Lu et al. [34], have begun exploring the implications of adopting SVM strategies through modeling approaches, they have overlooked the interactive relationship between SVM and LSM. This study effectively addresses this research gap by developing an integrated model of SVM and LSM that simultaneously incorporates commission rate differentials.

2.2. Live Streaming Marketing

The robust development of live streaming marketing (LSM) has fundamentally transformed consumer shopping habits and prompted brands to refine their marketing strategies. Existing research on LSM can be categorized into two main streams: (1) streamer characteristics and consumer behavior; (2) strategic adoption and mode selection.
With respect to the streamer characteristics and consumer behavior, scholars have extensively examined how streamer attributes influence purchase decisions. Zhang et al. [35] highlight the importance of interactive methods (e.g., entertainment- and information-based engagement) in enhancing user engagement metrics. Wang et al. [36] further classify streamer–viewer interactions into relationship-oriented and transaction-oriented types, demonstrating the dominance of relationship-focused engagement. Additionally, studies explore the impact of streamer personality traits [37] and content topics [38] on consumer behavior.
With respect to the strategic adoption and mode selection, research on LSM adoption examines key influencing factors, such as spillover effects in competitive markets [39] and the role of product quality [15,40]. Meanwhile, mode selection studies compare merchant self-LSM and influencer LSM, identifying optimal strategies based on commission rates [12,16], product characteristics [41], and platform dynamics [42]. Some studies caution against universal LSM adoption, noting potential profit risks for manufacturers [43].
Despite these contributions, the existing literature has rarely investigated the synergistic optimization between SVM and LSM, nor has it adequately addressed the strategic selection mechanisms under different commission structures. This study bridges these gaps by integrating marginal utility analysis with Nash equilibrium methods, thereby providing retailers with a more comprehensive perspective for marketing channel decision-making.

2.3. Literature Review Summary

We summarize the differences between our work and the related research work in Table 1, thereby highlighting the research gaps and underscoring our contributions.
In summary, two key streams emerge from the literature: (1) SVM, primarily focusing on content dissemination and user engagement mechanisms; and (2) LSM, mainly examining how promotional efforts influence consumer purchasing behavior, determinants of live streaming sales performance, and modality selection in live commerce. However, few studies have explored the interaction between these factors, particularly in the context of marketing synergy strategies and dynamic market evolution. This study contributes to the literature by (1) expanding the research perspective from single-strategy analysis to combinatorial optimization of SVM and LSM strategies, with live streaming modalities categorized by the presence or absence of slotting fees (merchant self-LSM or influencer LSM); (2) developing stage-adaptive decision rules based on commission rate thresholds, translated into more intuitive market development phases (initial entry, growth, and maturity stages); and (3) simulating retailers’ pricing decisions, market share dynamics, and profitability variations under different channel mix strategies (S/L/H strategy), providing actionable guidance for marketing strategy selection.

3. Model

3.1. Problem Description

In this paper, we consider the existence of a short video and live streaming platform in the market, such as TikTok, which operates primarily as a social platform centered on short videos and live streaming commerce and boasts a substantial user base.
To address the research question of whether retailers should adopt an SVM model, an LSM model, or a combination of both, we outline the following three strategies for retailers, (1) a SVM strategy (Strategy S); (2) a LSM strategy (Strategy L); and (3) a hybrid strategy (Strategy H), which involves simultaneously employing both SVM and LSM strategies for product sales and promotion to consumers. The symbols and definitions presented in Table 2 are adopted in this paper. The three strategies, Strategies S, L, and H, are subsequently discussed.
In summary, this study is grounded in a game framework, assuming that the retailer and MCN form a Nash equilibrium in their strategic interactions. Both parties simultaneously optimize their decisions with profit maximization as their objective, where the concavity of profit functions ensures the uniqueness of equilibrium solutions. The model further assumes symmetric decision-making power between the parties and risk-neutral preferences, indicating their exclusive focus on expected payoffs without risk considerations.

3.2. Strategy S

When retailer adopts Strategy S, their operating model relies on short video channel. By cooperating with short video creators, the retailer delivers short videos on a large scale to achieve the growth of product exposure. To enhance the operationality of the analysis, we make the following assumption: with respect to consumer demand, based on the empirical research of Lodish et al. [47] and Schmidt and Eisend [48], advertising number has a significant positive driving effect on consumer demand, but its marginal utility follows the law of diminishing returns, that is, as the expenditure increases, the additional demand gradually weakens. Furthermore, referring to the research framework of He et al. [13] and Siqin et al. [49] (that is, the price dimension follows the classical law of demand), the market demand function under Strategy S is constructed as follows:
D S = Q p + θ α
where Q represents the potential market size, and the unit sales price p has a linear negative relationship with demand, reflecting consumers’ immediate sensitivity to price changes; the number of short videos α , on the other hand, exerts a positive driving effect through a square root function form ( α ), indicating diminishing marginal utility. That is, the initial increase in short video placements can efficiently activate demand, but as the number continues to grow, the additional demand generated by each unit of short video placement gradually diminishes; θ embodies the sensitivity coefficient of consumers to SVM, not only reflecting the matching efficiency between short videos and market demand but also determining the intensity of the demand pull from short video placements.
With respect to the retailer and MCN profit, the retailer and MCN form a revenue-sharing cooperation mechanism under Strategy S. Specifically, the retailer must pay a commission to the MCN responsible for hiring short video creators to produce short videos, with the commission rate designated as k S . Meanwhile, the revenue structure of the MCN presents two characteristics: on the one hand, the MCN earns sales commission through the commission rate k S ; on the other hand, they need to bear the production costs that are linearly related to the number of short videos, including creators’ revenue sharing, content production, and equipment loss, etc. [21]. Assume that the production cost of a single short video is f . Based on the above mechanism design, the retailer, and the MCN profit functions under Strategy S are constructed as follows:
π r S ( p ) = ( 1 k S ) p D S
π m S ( α ) = k S p D S f α
The game sequence for Strategy S is as follows. First, the retailer chooses the optimal strategy. Second, if Strategy S is subsequently chosen, then since the retailer and the MCN possess equal power, they proceed to engage in a Nash equilibrium game (due to the sufficient number of retailers and MCNs engaged in short video and live streaming commerce in the market, we postulate that retailers and MCNs possess equal decision-making authority and engage in a Nash equilibrium game). In this game, the retailer determines the sales price p , whereas the MCN concurrently determines the number of advertising short videos α .
Through the equilibrium solution, the optimal results under Strategy S can be obtained; these results are summarized in Lemma 1. See the Appendix A, Appendix B, Appendix C and Appendix D for all mathematical proofs.
Lemma 1.
Under Strategy S, the optimal sales price for the retailer is  p S = 2 f Q 4 f k S θ 2 , and the optimal number of short videos is  α S = k S 2 Q 2 θ 2 ( 4 f k S θ 2 ) 2 .
On the basis of Lemma 1, the retailer’s market demand is D S = 2 f Q 4 f k s θ 2 , and the retailer’s profit is Π r S = 4 ( 1 k S ) f 2 Q 2 ( 4 f k S θ 2 ) 2 under Strategy S.
Corollary 1.
Under Strategy S, the sensitivity analysis of each parameter is as follows:
(1)  p S θ = D S θ > 0 ;  p S f = D S f > 0 ;  p S k S = D S k S > 0 .
(2)  α S θ > 0 ;  α S f < 0 ;  α S k S > 0 .
(3)  Π r S θ > 0 ;  Π r S f < 0 . When  k S < 2 4 f θ 2 ,  Π r S k S > 0 ; when  k S > 2 4 f θ 2 ,  Π r S k S < 0 .
Corollary 1 shows that the sales price, the number of short videos, market demand, and the retailer’s profit increase with increasing consumer sensitivity to SVM. The number of short videos and the retailer’s profit decrease with the increasing production costs of short videos. These results are intuitive. Furthermore, as the commission rate k S increases, the sales price, number of short videos, and market demand increase. This finding suggests that despite the retailer adopting an increasing price strategy to offset cost increases, market demand remains resilient to such price hikes because of the increased number of advertising short videos (indicating intensified promotional effort). In essence, the positive impact of Strategy S on market demand surpasses the adverse effects of elevated prices and costs. Nonetheless, when k S reaches a certain threshold, the retailer’s profit begins to decline. In fact, this is a new finding. In fact, this is a novel discovery. Previous studies have shown that a low commission rate makes retailers more inclined to use the SVM mode [14,50]. However, our findings reveal that only when the commission rate is lower than a certain threshold do retailers’ profits increase as the commission rate increases. The reason might be that only when the commission rate is at a relatively low level can a higher commission be exchanged for better traffic support, advertising exposure or data services from the platform, thereby driving up sales and offsetting the commission cost. Consequently, retailers should aim to maximize consumer sensitivity to SVM and choose an appropriate commission rate to increase the profits of implementing Strategy S, rather than blindly increasing the number of short videos.

3.3. Strategy L

For Strategy L, we make the following assumption: with respect to consumer demand, when retailer adopts the L strategy, its operation model relies on the LVM and organically combines product display, interactive Q&A, and promotion incentives through the real-time shopping guide service with the contracted streamer team in the live streaming process, which directly triggers the purchase demand of consumers. According to the study of live streaming shopping behavior by [51], consumers form instantaneous purchase decisions during the process of watching live streaming, and their demand is not only linearly affected by the potential market size Q and price p , but also driven by the streamer’s promotional effort level, represent as s . Based on the quantitative studies of streamer performance in [52,53,54], we assume that the market demand is positively correlated with the streamer’s promotional effort level.
D L = Q p + β s
where β represents the sensitivity coefficient of consumers to LSM, it not only represents the matching efficiency between the professional ability of the streamer and the market demand, but also determines the intensity of the demand-pull caused by the input of the promotional effort level of each streamer.
With respect to the retailer and MCN profit, the retailer must pay a commission to the MCN responsible for hiring the influencer streamer for live streaming, with the commission rate designated as k L under Strategy L. Furthermore, a slotting fee, T , for live streaming is incurred, which specifically refers to the slotting fee of products within the live streaming room [12,55]. To ensure a comprehensive analysis, different scenarios, T = 0 and T 0 , are considered. Specifically, T = 0 implies that the retailer employs its own staff for LSM, termed “merchant self-LSM”, whereas T 0 implies that the retailer engages influencers for LSM through an MCN, termed “influencer LSM”. The specific marketing format of live streaming is contingent on the value of T . The MCN profit consists of the following three parts: the slotting fee, the sales commission, and the live streaming promotional costs. Moreover, as the intensity of LSM promotional efforts escalates, the promotional cost also increases, exhibiting a marginal cost escalation trend. This cost can be approximated as a convex function of the LSM promotional effort, i.e., as 1 2 s 2 [56,57,58]. Based on the above mechanism design, the retailer and MCN profit functions under Strategy L are constructed as follows:
π r L ( p ) = ( 1 k L ) p D L T
π m L ( s ) = k L p D L + T 1 2 s 2
The game sequence for Strategy L is similar to that of Strategy S. First, the retailer selects the optimal strategy. Second, if Strategy L is subsequently selected, then the retailer determines the sales price p . Concurrently, the MCN determines the promotional effort s of the LSM.
Through the equilibrium solution, the optimal results under Strategy L can be obtained; these results are summarized in Lemma 2.
Lemma 2.
Under Strategy L, the retailer’s optimal selling price is  p L = Q 2 k L β 2 , and the optimal LSM promotional effort is  s L = k L β Q 2 k L β 2 .
On the basis of Lemma 2, the retailer’s market demand is D L = Q 2 k L β 2 , and the retailer’s profit is Π r L = ( 1 k L ) Q 2 ( 2 k L β 2 ) 2 T under Strategy L.
Corollary 2.
Under Strategy L, the sensitivity analysis of each parameter is as follows:
(1)  p L β = D L β > 0 ;  p L k L = D L k L > 0 .
(2)  s L β > 0 ;  s L k L > 0 .
(3)  Π r L β > 0 ;  Π r L k L < 0 .
Through Corollary 2, it is evident that the sales price, market demand, promotional effort of LSM, and retailer’s profit increase with increasing consumer sensitivity to LSM. However, in contrast to Strategy S, although the sales price, promotional effort, and market demand increase with increasing commission rate k L , the retailer’s profit paradoxically decreases. This observation underscores the potential for retailers to adopt a “merchant self-LSM” approach as Strategy L to mitigate costs. By doing so, retailers may need to adjust their pricing strategies to remain competitive and attract a larger consumer base, but ultimately, this approach can facilitate the attainment of greater profits through reduced commission expenses and optimized marketing efforts.

3.4. Strategy H

For Strategy H, we make the following assumption: with respect to consumer demand, when the retailer adopts the H strategy, its operation mode is reflected in the dual-wheel-drive mechanism of SVM and LSM. On the one hand, it builds high-frequency exposure touchpoints by cooperating with short video creators, and on the other hand, it relies on the MCN’s streamer team to create a high-converting interactive scenario. Therefore, the market demand is subject to the combined influence of SVM and LSM, expressed as follows:
D H = Q p + θ α + β s
Compared to Strategy S ( D S = Q p + θ α ), the Strategy H incorporates a linear driving effect ( β s ) through the promotional effort s of LSM, which compensates for the diminishing marginal utility of the number of short videos α . This dual mechanism maintains long-term brand exposure while significantly enhancing immediate conversion capabilities. In contrast to Strategy L ( D L = Q p + β s ), Strategy H preserves the square root effect of short videos ( θ α ). This strategic design prevents the potential cost inefficiencies arising from sole reliance on streamer efforts, thereby achieving more comprehensive market coverage with greater stability.
With respect to the retailer and MCN profit, the retailer and MCN also form a revenue-sharing partnership under Strategy H. Specifically, the retailer not only needs to pay the MCN a mixed commission k H = k S + k L on its sales revenue at the commission rate, but also needs to pay a slotting fee. The MCN’s revenue consists of four components: slotting fee, mixed commission, short video production cost, and live streaming promotion cost. Notably, LSM within Strategy H is further divided into the following two categories, “merchant self-LSM” and “influencer LSM”, each of which is characterized by different slotting fees, denoted as T = 0 and T 0 , respectively. Similarly, if the retailer adopts the method of “merchant self-LSM”, then the slotting fee is zero, i.e., then T = 0 , and the MCN is actually equivalent to its own staff. Based on the above mechanism design, the retailer and MCN profit functions under Strategy H are constructed as follows:
π r H ( p ) = ( 1 k H ) p D H T
π m H ( α , s ) = k H p D H + T f α 1 2 s 2
The game sequence for Strategy H is similar to that of Strategies L and S. First, the retailer selects the optimal sales strategy. Second, if Strategy H is subsequently selected, then the retailer determines the sales price p . Concurrently, the MCN determines the number of short videos α (i.e., the promotional effort of SVM) and the promotional effort of LSM s .
Through the equilibrium solution, the optimal results under Strategy H can be obtained; these results are summarized in Lemma 3.
Lemma 3.
Under Strategy H, the retailer’s optimal selling price is  p H = 2 f Q 2 f 2 ( k L + k S ) β 2 ( k L + k S ) θ 2 , the optimal number of short videos is  α H = ( k L + k S ) 2 θ 2 Q 2 2 f 2 ( k L + k S ) β 2 ( k L + k S ) θ 2 2
, and the optimal live streaming promotional effort is  s H = 2 β f ( k L + k S ) Q 2 f 2 ( k L + k S ) β 2 ( k L + k S ) θ 2 .
According to Lemma 3, the retailer’s market demand is D H = Q 2 f + ( k L + k S ) θ 2 ( θ Q 1 ) 2 f 2 ( k L + k S ) β 2 ( k L + k S ) θ 2 , and the retailer’s profit is Π r H = 2 f Q 2 1 ( k L + k S ) 2 f + ( k L + k S ) θ 2 ( θ Q 1 ) 2 f 2 ( k L + k S ) β 2 ( k L + k S ) θ 2 2 T under Strategy H.
Corollary 3.
Under Strategy H, the sensitivity analysis of each parameter is as follows:
(1)  p H θ > 0 ;  p H β > 0 ;  p H k S = p H k L > 0 .
(2)  α H θ > 0 ;  α H β > 0 ;  α H k S = α H k L > 0 .
(3)  s H θ > 0 ;  s H β > 0 ;  s H k S = s H k L > 0 .
(4)  D H θ > 0 ;  D H β > 0 ;  D H k S = D H k L > 0 .
(5)  Π r H θ > 0 ;  Π r H β > 0 ; when  k L + k S < 4 f 2 β 2 f + θ 2 ( 4 Q θ 5 ) ,  Π r H k S = Π r H k L > 0 ; and when  k L + k S > 4 f 2 β 2 f + θ 2 ( 4 Q θ 5 ) ,  Π r H k S = Π r H k L < 0 .
Similarly to Corollary 1, Corollary 3 demonstrates that as consumers exhibit greater sensitivity to SVM and LSM, the sales price, market demand, and retailer’s profit increase. With an increase in the mixed commission rate, the sales price, market demand, LSM promotional effort, and the number of short videos (i.e., the SVM promotional effort) all exhibit an upward trend. In contrast, the retailer’s profit initially increases and subsequently decreases as the mixed commission rate continues to increase. By synthesizing the insights from Corollaries 1 and 2, it becomes evident that the SVM commission rate positively influences the retailer’s profit. In contrast, the commission rate for LSM exerts a negative influence. When the positive impact outweighs the negative impact, the retailer’s profit increases. These findings offer several strategic implications for retailers operating under Strategy H. First, retailers should strive to enhance consumer sensitivity to SVM and LSM by investing in high-quality content and engaging influencers with large followings. By doing so, retailers can capitalize on the positive effects of increased sensitivity on the sales price, market demand, and, ultimately, profit. Second, retailers must carefully manage the mixed commission rate to optimize profits. While an increase in the mixed commission rate may initially drive up the sales price, market demand, and promotional effort, it is crucial to recognize that the profit will eventually decline as the commission rate continues to rise. Therefore, retailers should aim to find the optimal balance between commission rates for SVM and LSM that maximizes profits. Third, retailers should leverage the positive impact of SVM commission rates on profits, which can be achieved by seeking short video creators with large fan bases to maximize brand exposure and sales growth at a relatively low SVM commission rate. By implementing these strategies, retailers can effectively navigate the complex dynamics of SVM and LSM commission rates to increase their overall profitability under Strategy H.

4. Strategy Comparison and Analysis

4.1. Analysis of the Impact of Different Strategies on the Retailer’s Pricing and Demand

Through a comprehensive comparison and analysis of sales prices, market demand, and promotional efforts across different strategies, we formulate Propositions 1 and 2 below.
Proposition 1.
The comparison results of sales prices and market demand under the three strategies are as follows:
(1) When  k L / k S > θ 2 2 f β 2 ,  p H > p L > p S  and  D H > D L > D S .
(2) When  k L / k S < θ 2 2 f β 2 ,  p H > p S > p L  and  D H > D S > D L .
(3)  ( k L / k S ) θ 2 > 0 , and  ( k L / k S ) β 2 < 0 .
Proposition 1 reveals the specific impact of the three strategies on sales prices and market demand. First, under any circumstances, retailers that adopt Strategy H consistently achieve higher market demand while increasing the sales price. This phenomenon can be interpreted from the following two perspectives: on the one hand, the mixed method (combination of SVM and LSM) of product display provides consumers with a deeper understanding, effectively mitigating return risks and subsequently augmenting consumer purchase intentions, which grants the retailer an opportunity to augment profit margins by setting a higher selling price, and on the other hand, due to increased operating costs, the retailer is inclined to increase the sales price to sustain profitability, e.g., after adopting Strategy H, the makeup brand Florasis significantly surpassed its product sales prices and market demand levels from the implementation of Strategy L or S.
Second, the ratio of the commission rate ( k L / k S ) plays a pivotal role in determining the comparison of the sales prices and market demand under Strategy L versus Strategy S. Specifically, when this ratio is high, both the sales price and market demand under Strategy L surpass those under Strategy S. Conversely, when the ratio is low, the opposite holds true. This finding is different from previous studies, such as Liu et al. [16] and Pan et al. [59], which indicated that higher selling prices would suppress market demand. The underlying reason for this conclusion stems primarily from the incentive effect of a high commission rate ratio. When the commission rate for LSM is higher than that for SVM, this implies that the streamer can garner greater revenue. This incentive effect may motivate the streamer to more vigorously promote and sell products, further increasing the sales price and market demand. Taking the apparel brand Semir as an example, upon the rise in the commission rate for LSM, the brand intensified its LSM efforts. Following a collaboration with the renowned film and television star and streamer Jia Nailiang, the brand further partnered with the couple Batu & Bogu, increasing sales volume while maintaining increased prices.
Third, the threshold of the aforementioned ratio is influenced by consumer sensitivity to SVM and LSM. A higher sensitivity to SVM results in a higher threshold, whereas a higher sensitivity to LSM leads to a lower threshold. Therefore, to refine pricing strategies and marketing methods, retailers must adopt highly consumer-centric strategies and must actively listen to and analyze consumer feedback across different marketing channels. This approach enables them to tailor their marketing messages and pricing structures to better resonate with specific consumer segments, ultimately stimulating stronger purchase intentions.
Proposition 2.
The comparison results of promotional efforts under the three strategies are as follows:  α H > α S  and  s H > s L .
Proposition 2 reveals the specific impacts of the three strategies on promotional efforts. According to this proposition, the promotional effort of Strategy H surpasses that of both Strategies S and L. The superiority of Strategy H in terms of promotional effort is attributed primarily to its diverse display methods and interactivity. By integrating SVM with LSM, Strategy H not only presents product features and advantages in an interspersed storyline and intuitive manner but also facilitates real-time responses to consumers’ questions, significantly enhancing the effectiveness of promotion. Therefore, retailers should harness the advantages of mixed media to fortify product promotion and marketing endeavors. Through the amalgamation of SVM and LSM, enterprises can forge a richer, more three-dimensional product image, ultimately augmenting consumer purchase intention and loyalty.

4.2. Analysis of the Retailer’s Strategic Choices

Proposition 3.
When the slotting fee  T = 0 , the retailer’s comprehensive equilibrium strategy selection is as follows:
(1) When  k H { k H < k H L k H < k H S } , if  k L < k L S , then  Π r H > Π r L > Π r S , whereas if  k L > k L S , then  Π r H > Π r S > Π r L .
(2) Otherwise, if  k L < k L S , then  Π r L > Π r S > Π r H , and if  k L > k L S , then  Π r S > Π r L > Π r H . Among them,  k H = k L + k S .
All parameter values for numerical analysis align with real-world physical meanings and model assumptions. According to TikTok’s 2023 White Paper, production costs for a single apparel short video typically range RMB 500–2000, while marginal costs for live streaming sessions (including venue and host fees) reach RMB 5000–20,000. Based on industry profit margin analysis, we normalized parameters as follows: potential market size Q = 100 (representing 1% sampling of 120 million active users), short video production cost f = 0.15 (derived from the ratio of 1000 RMB/video to RMB 300 average order value). To avoid extreme results (such as explosive growth in sales along with the promotion volume) caused by excessive sensitivity coefficients in numerical simulation, we assume that the sensitivity coefficients are all less than 1. Furthermore, based on the previous text, we assume that the sensitivity coefficient of consumers to SVM is higher than that to LSM. Following Zhang et al. [12] and He et al. [14], we assume β = 0.15 and θ = 0.16  based on the above principle, we set the parameters to Q = 100 ;   β = 0.15 ;   θ = 0.16 ;   f = 0.15 . Therefore, we obtain Figure 1, which graphically presents the result of Proposition 3.
Proposition 3 reveals that when the slotting fee is zero or the form of LSM is “merchant self-LSM”, the retailer’s strategic choice is determined mainly by the level of the respective commission rate. Specifically, when the mixed commission rate ( k H ) is at a low level, the retailer tends to choose Strategy H because it can maximize sales performance while controlling costs. However, when the mixed commission rate increases, the choice becomes more complicated. If the LSM commission rate ( k L ) is relatively low, then the retailer is more inclined to choose the Strategy L strategy. In contrast, the retailer is more inclined to choose Strategy S to reduce the high LSM commission cost.
Let us take the brands Florasis, Estée Lauder, and Lancôme as examples. During the nascent stages of SVM and LSM, these brands opted for Strategy H because of the relatively low mixed commission rate. This strategy involves combining LSM and SVM for product sales and promotion with the aim of swiftly enhancing brand recognition and sales volume. SVM can be utilized by companies to exhibit the unique characteristics and application effects of their products, effectively capturing the attention of potential consumers. Concurrently, LSM can facilitate real-time interaction with consumers to address their inquiries and offer personalized recommendations and purchase advice. For example, Florasis initiated a short video on TikTok for the “Unloading Makeup to Reveal Face Painting” challenge that garnered significant user participation and sharing. Additionally, the brand leveraged live streaming on the platform to demonstrate various classical makeup imitation tutorials and promote related products, ultimately boosting sales performance and brand visibility. These endeavors underscore the advantages and efficacy of Strategy H in marketing. However, with the rise in the mixed commission rate, Florasis has curtailed its investment in SVM promotions on these platforms and, upon reaching the mature stage of the market, has adopted primarily the “merchant self-LSM” model for product sales and promotion.
Proposition 4.
When the slotting fee  T 0 , the retailer’s comprehensive equilibrium strategy selection is as follows:
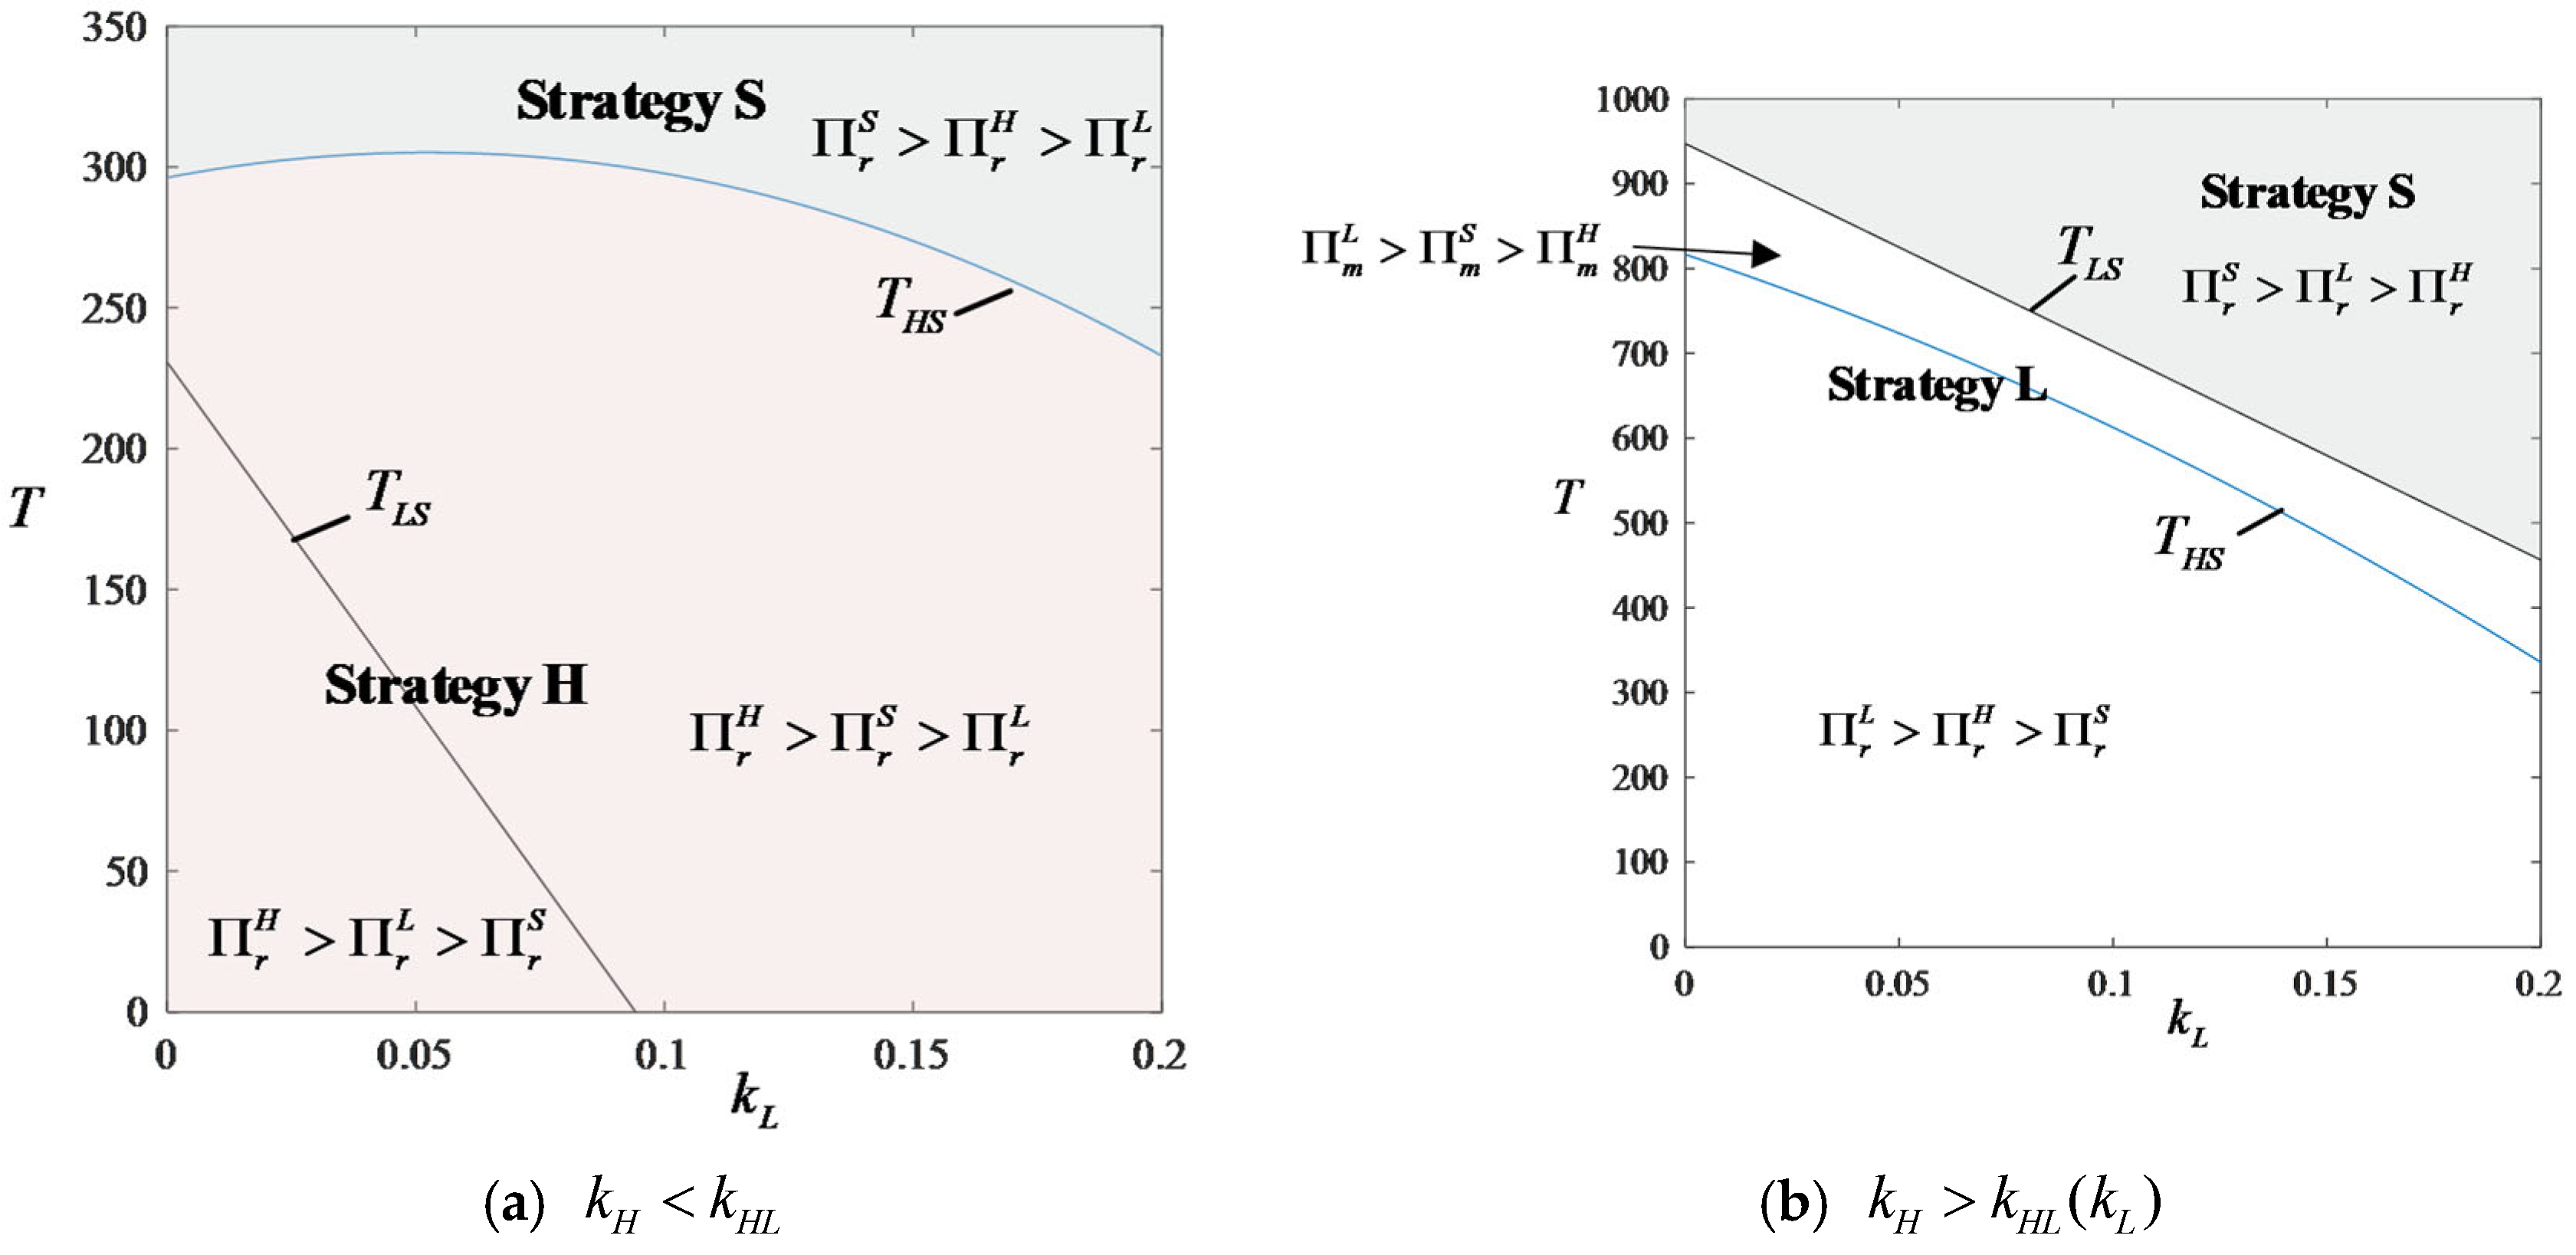
(1) When  k H < k H L , if  0 < T < T L S , then  Π r H > Π r L > Π r S ; if  T L S T T H S , then  Π r H > Π r S > Π r L ; and if  T > T H S , then  Π r S > Π r H > Π r L .
(2) When  k H > k H L , if  0 < T < T H S , then  Π r L > Π r H > Π r S ; if  T H S T T L S , then  Π r L > Π r S > Π r H ; and if  T > T L S , then  Π r S > Π r L > Π r H . Among them,  k H = k S + k L .
Figure 2 visually depicts the conclusions of Proposition 4 and highlights that the retailer’s strategic choices are influenced primarily by the mixed commission rate ( k H ) and the slotting fee ( T ) when the slotting fee is nonzero or the LSM approach is “influencer LSM”. Specifically, the retailer’s preferences are manifested as follows.
(i) When both the mixed commission rate and the slotting fee are relatively low, the retailer is more inclined to choose Strategy H. This preference is driven primarily by the economic incentives provided by low costs, which facilitate broader market expansion through Strategy H. The dual stimulation of SVM and LSM often enhances consumers’ willingness to accept a slightly increasing sales price, as noted in Proposition 1. For example, during its initial market entry, the Florasis brand opted for Strategy H because of the relatively low commission rate and slotting fee associated with influencer LSM, such as those offered by Li Jiaqi. This approach involved initiating the “Unloading Makeup to Reveal Face Painting” short video challenge on the TikTok platform and conducting live sales on the Taobao live streaming platform with Li Jiaqi.
(ii) When the mixed commission rate is relatively high and the slotting fee is relatively low, the retailer tends to favor Strategy L. This is different from the research of Zhang and Zhang [60], who found that even if both the commission rate and the slotting fee are relatively high, brand owners may still adopt the “influencer LSM” strategy. We show that when the slotting fee is low, the “influencer LSM” strategy is better for retailers. This preference arises from the advantages of LSM, including strong real-time interaction, an authentic and intuitive product display, and high-level transaction conversion efficiency. These advantages make LSM an ideal choice in such scenarios. Additionally, the reduced cost burden associated with a lower slotting fee further contributes to this preference. For example, the apparel brand Semir has achieved stable sales growth through frequent collaborations with influencers such as Jia Nailiang and the couple Batu & Bogu for LSM.
(iii) When both the mixed commission rate and, in particular, the slotting fee are relatively high, the retailer is more inclined to adopt Strategy S and to rely on SVM for market promotion. This discovery is different from previous studies, such as He et al. [14] and He et al. [13]. These studies suggested that it is advisable to adopt SVM when the slotting fee and the commission rate are both low. However, considering that retailers can choose between SVM and LSM modes, we find that even when both the mixed commission rate and the slotting fee are high, retailers may still opt for the SVM mode. This preference arises because, despite the strong interactivity of LSM, the increased costs associated with higher slotting fees and LSM commission rates make SVM more attractive due to its cost effectiveness. For example, the Qumei Home Furnishing brand successfully attracted a substantial number of target customers by inviting renowned bloggers on the RED platform to create high-quality short videos.
Upon synthesizing Propositions 3 and 4, it becomes evident that the commission rates and the slotting fees are crucial factors influencing retailers’ strategic decisions. Retailers must flexibly adjust their marketing strategies on the basis of different combinations of marketing costs (slotting fee and commission rates). First, during the early phase of market entry or when both the mixed commission rate and the slotting fee are relatively low, retailers should fully capitalize on Strategy H and harness the dual benefits of SVM and LSM to maximize market expansion and promptly secure market share. Second, as the market transitions into its growth phase or when the mixed commission rate is high but the slotting fee is relatively low, particularly when the slotting fee for influencers is low, retailers should pivot toward Strategy L centered on “influencer LSM”. At this time, low-cost LSM through influencers is particularly advantageous. Finally, when the market reaches maturity or when both the mixed commission rate and the slotting fee are high, especially when the slotting fee is relatively high, retailers should increasingly rely on Strategy S or L, which focuses on “merchant self-LSM”, leveraging SVM and merchant self-LSM for market promotion to mitigate marketing costs while sustaining brand exposure and market share.

5. Expansion

5.1. Consumer Surplus and Social Welfare

In this subsection, we analyze consumer surplus and social welfare. According to Ye et al. [58], we express consumer surplus under Strategies S, L, and H as C S S = p min S p max S D S d p S = ( D S ) 2 2 , C S L = p min L p max L D L d p L = ( D L ) 2 2 , and C S H = p min H p max H D H d p H = ( D H ) 2 2 , respectively. The corresponding social welfare levels under these strategies are denoted as U S = r S + m S + C S S , U L = r L + m L + C S L and U H = r H + m H + C S H .
Proposition 5.
The comparison results of consumer surplus under the three strategies are as follows:
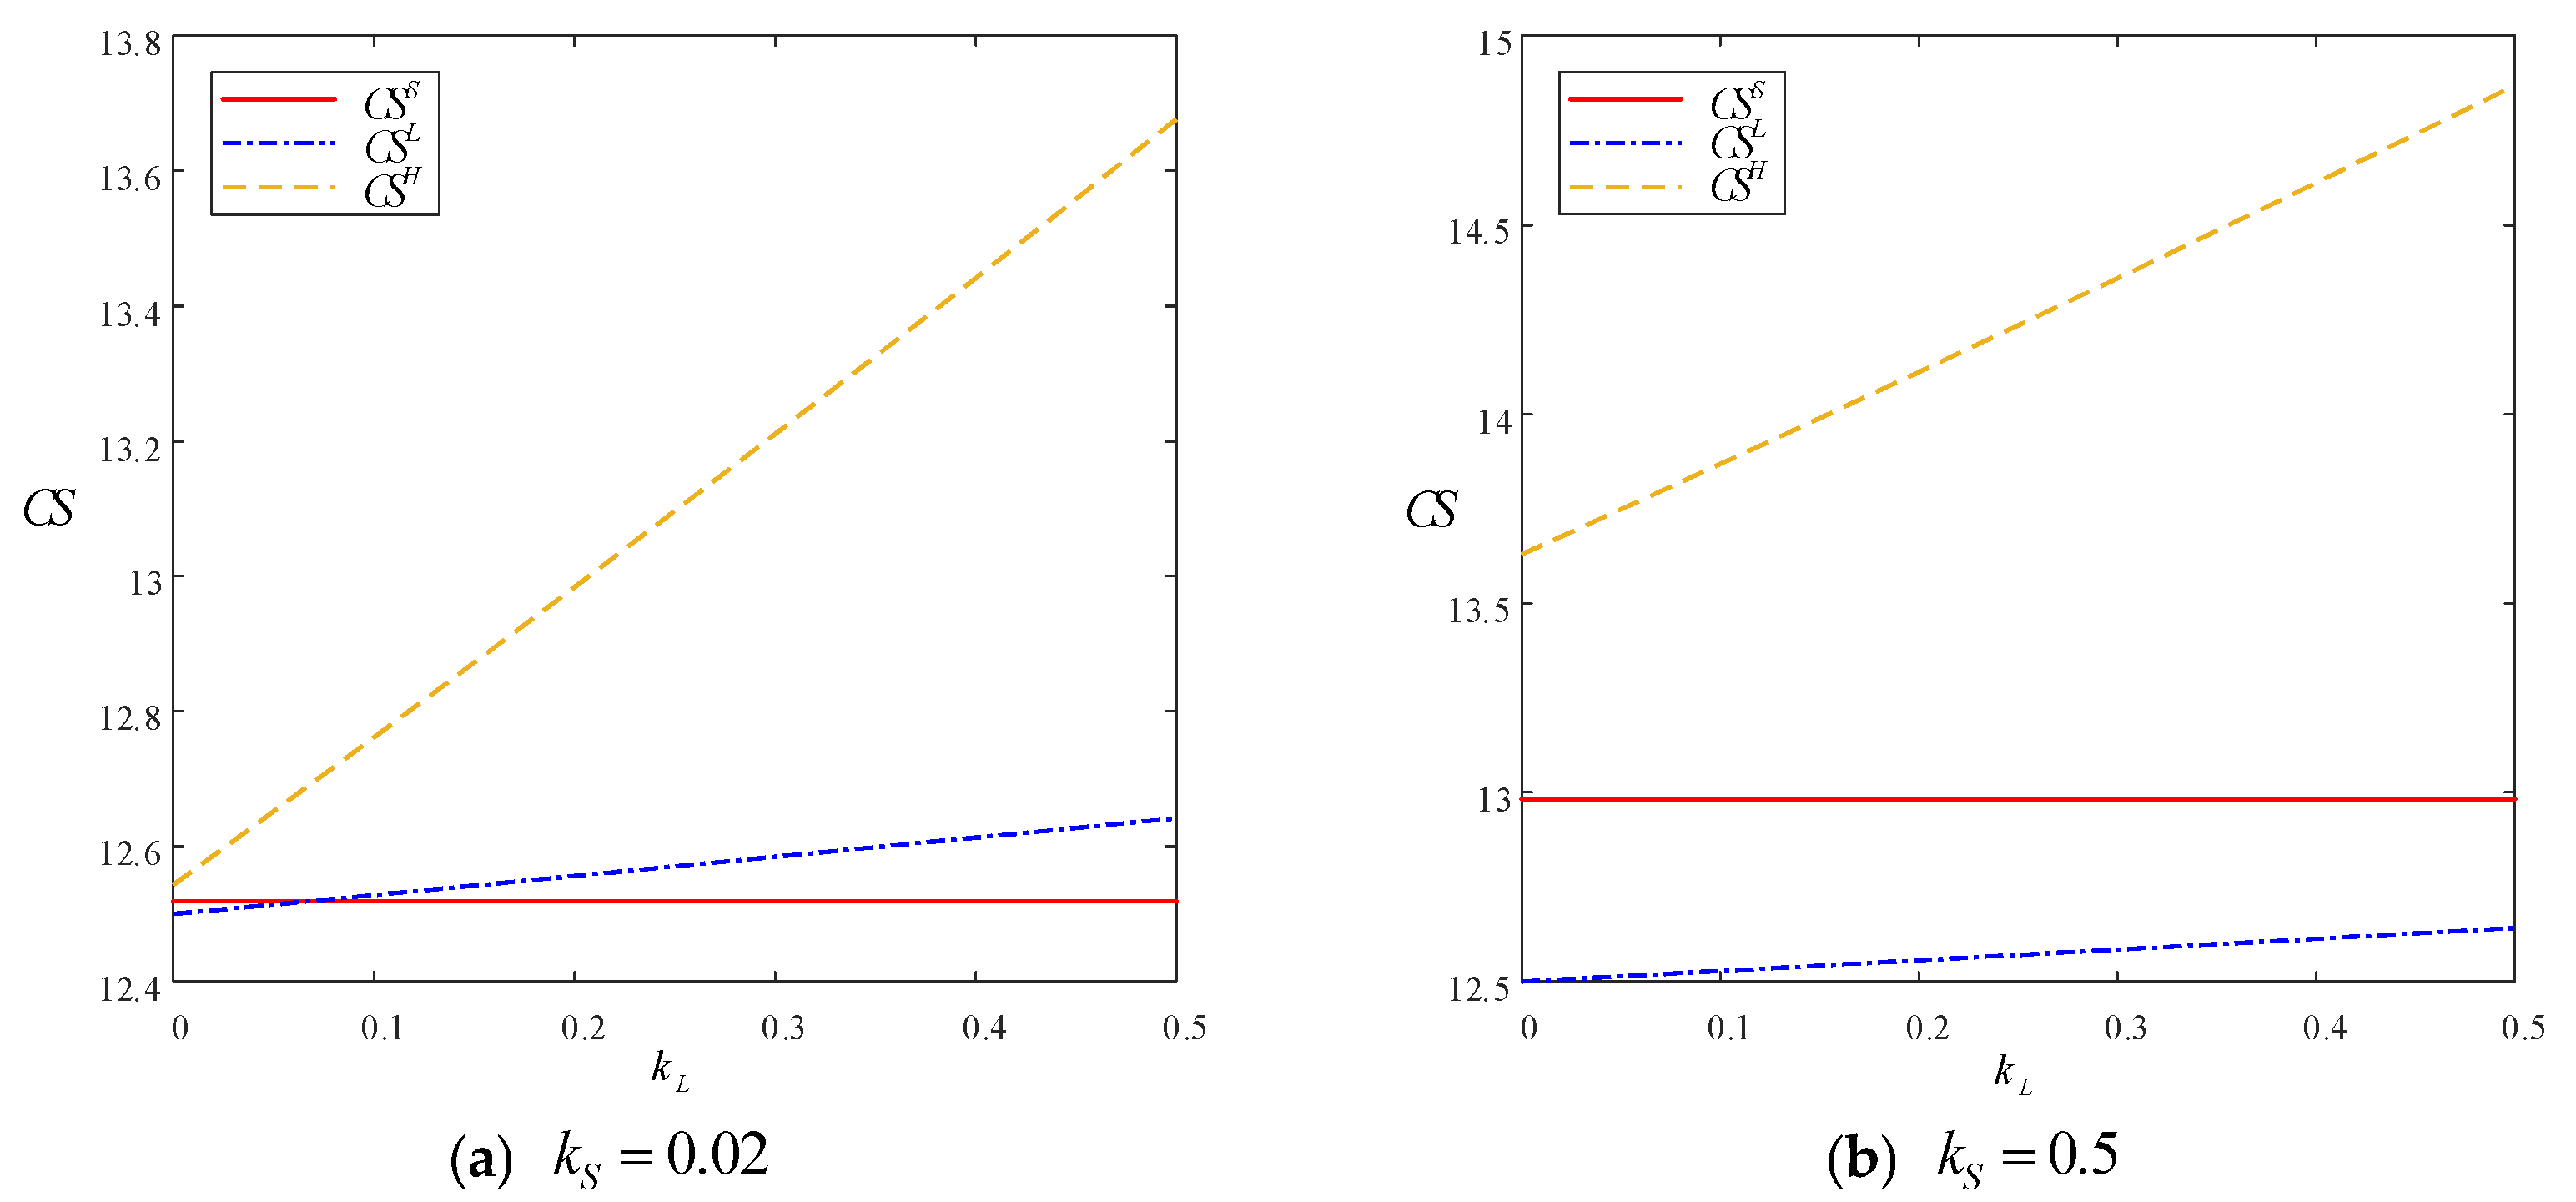
(1) When  k L / k S > θ 2 2 f β 2 ,  C S H > C S L > C S S .
(2) When  k L / k S < θ 2 2 f β 2 ,  C S H > C S S > C S L .
Figure 3 graphically illustrates the findings of Proposition 5. First, Proposition 5 demonstrates that Strategy H consistently enables consumers to attain greater consumer surplus, attributed to the dual exhibition of SVM and LSM, which empowers consumers with a deeper comprehension of products, effectively mitigating return risks and subsequently augmenting consumer surplus. Second, the ratio of commission rates between LSM and SVM has a decisive influence on the comparison of consumer surplus between Strategies L and S. Specifically, when this ratio is higher, consumer surplus under Strategy L surpasses that under Strategy S. Conversely, when this ratio is lower, the opposite holds true. This phenomenon aligns with the principle outlined in Proposition 1, suggesting that a higher commission rate for LSM than for SVM can more effectively incentivize streamers and prompt them to promote and showcase products with greater vigor. Consequently, in scenarios with a higher ratio, consumers can obtain more surplus under Strategy L than under Strategy S.
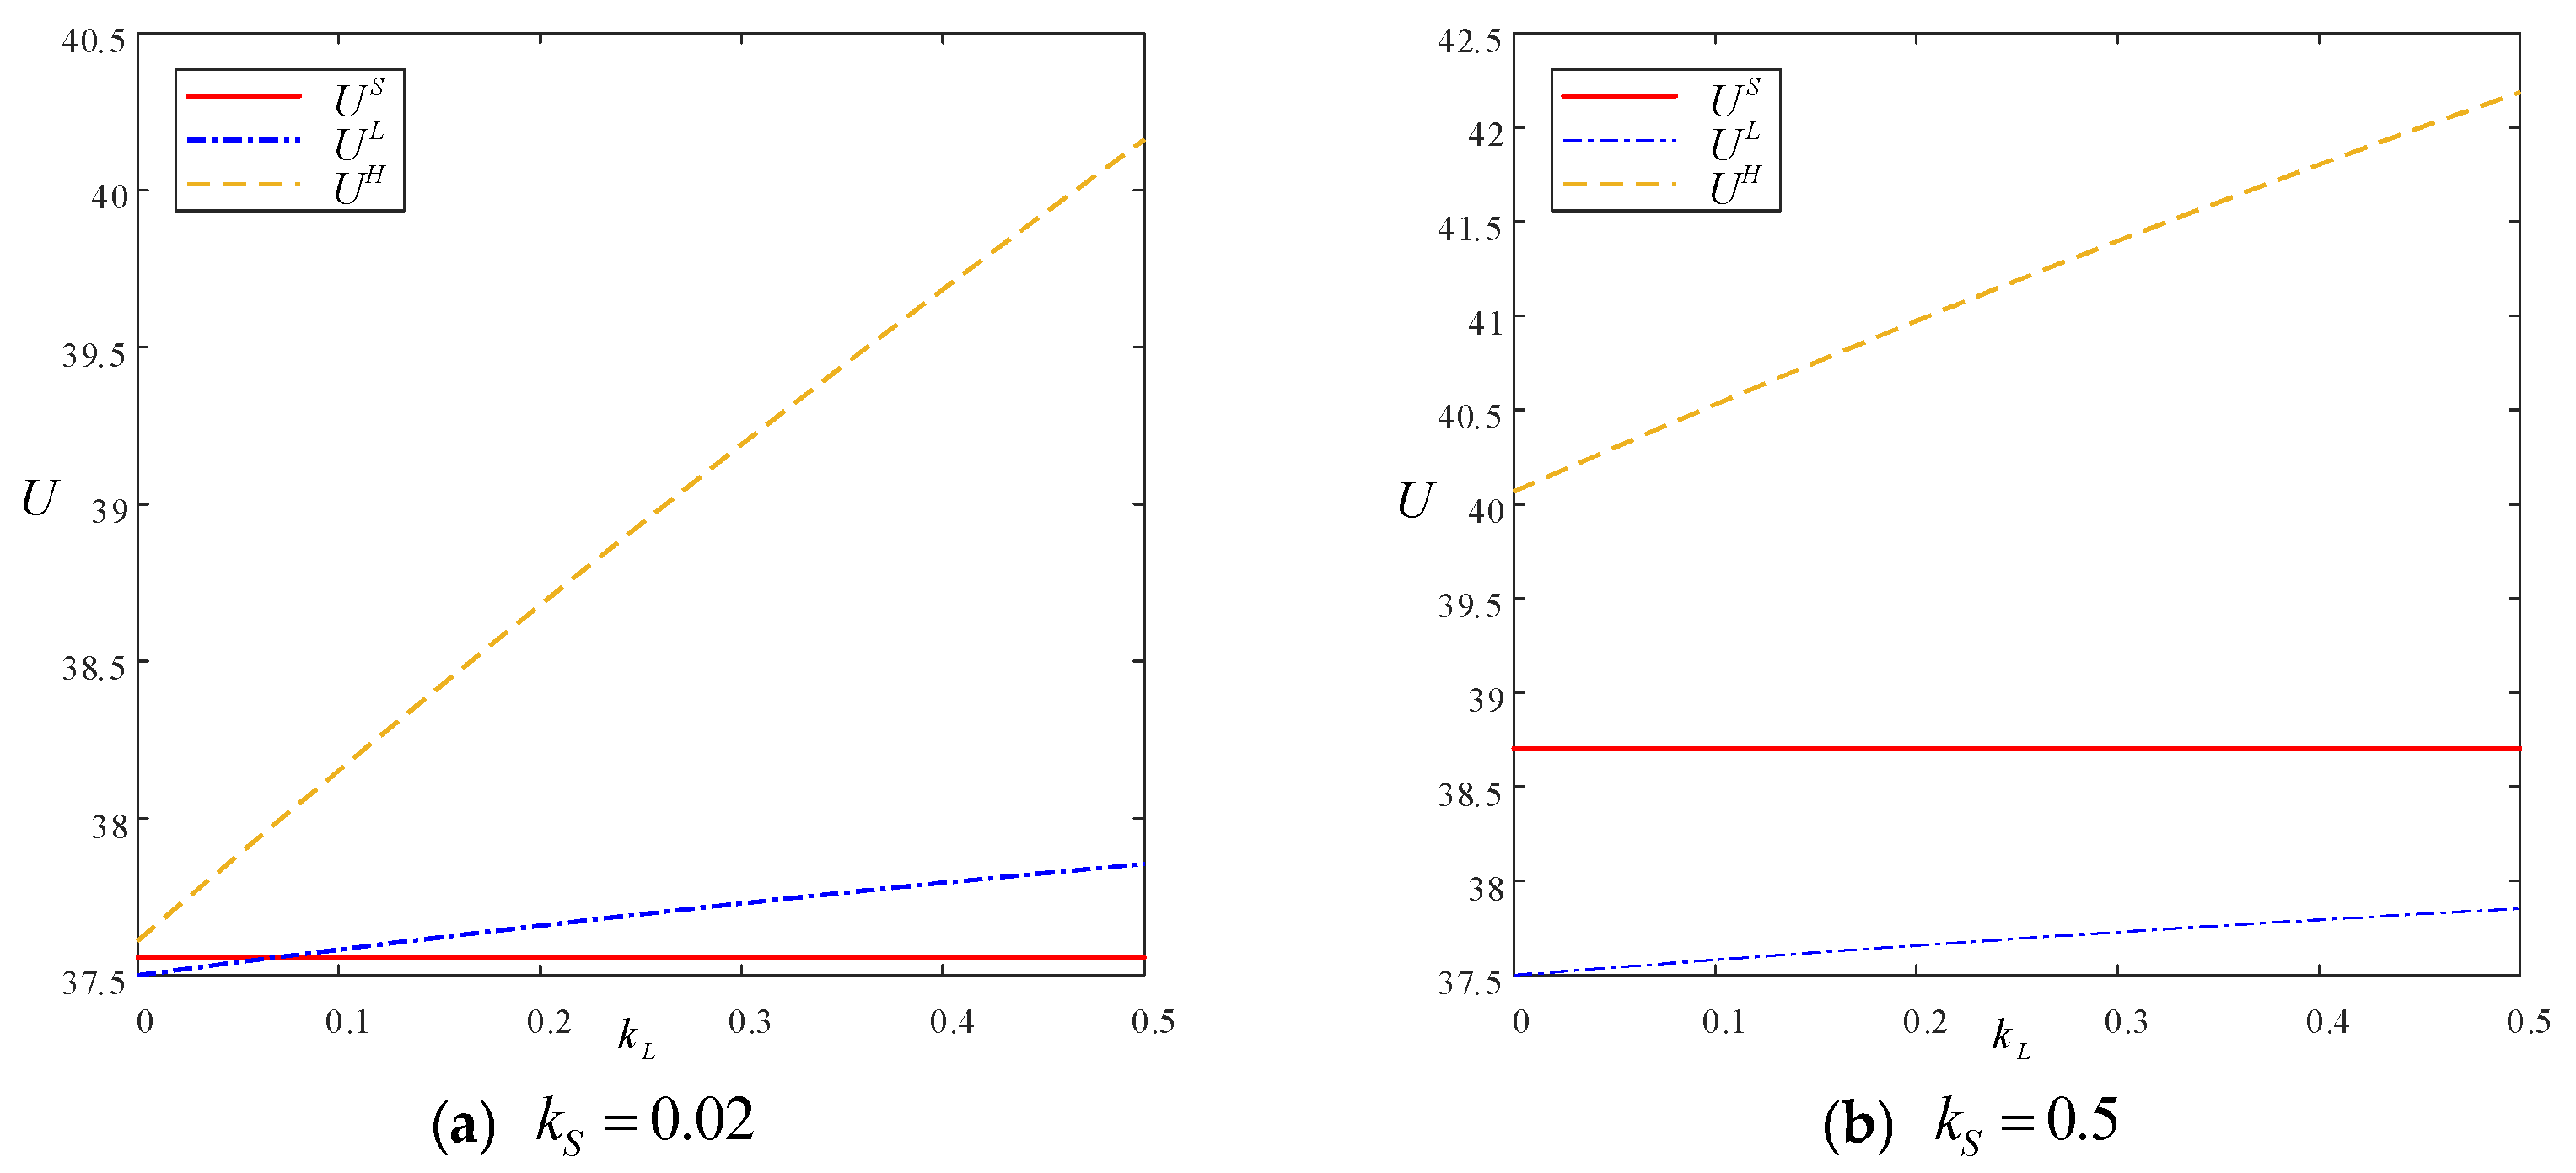
Given the complexity of the results, a comparison of social welfare under the three strategies is exhibited through numerical analysis, as depicted in Figure 4. A comparison of Figure 3 and Figure 4 shows that social welfare and consumer surplus demonstrate strikingly similar outcomes. This observation implies that the magnitude of social welfare is influenced predominantly by consumer surplus rather than by supply chain profits. Consequently, augmenting consumer surplus holds substantial importance for elevating social welfare. Furthermore, the congruence between social welfare and consumer surplus underscores the critical role of consumer-centric strategies in fostering overall societal benefits. Policies and practices aimed at enhancing consumer surplus are likely to have positive spillover effects on social welfare. Therefore, enterprises and policymakers should prioritize strategies that empower consumers, such as providing detailed product information through multiple channels (e.g., SVM and LSM channels), ensuring transparency in product specifications, and facilitating easy return policies. These measures not only bolster consumer trust and satisfaction but also contribute to the elevation of social welfare.

5.2. Impact of Fan Quantity

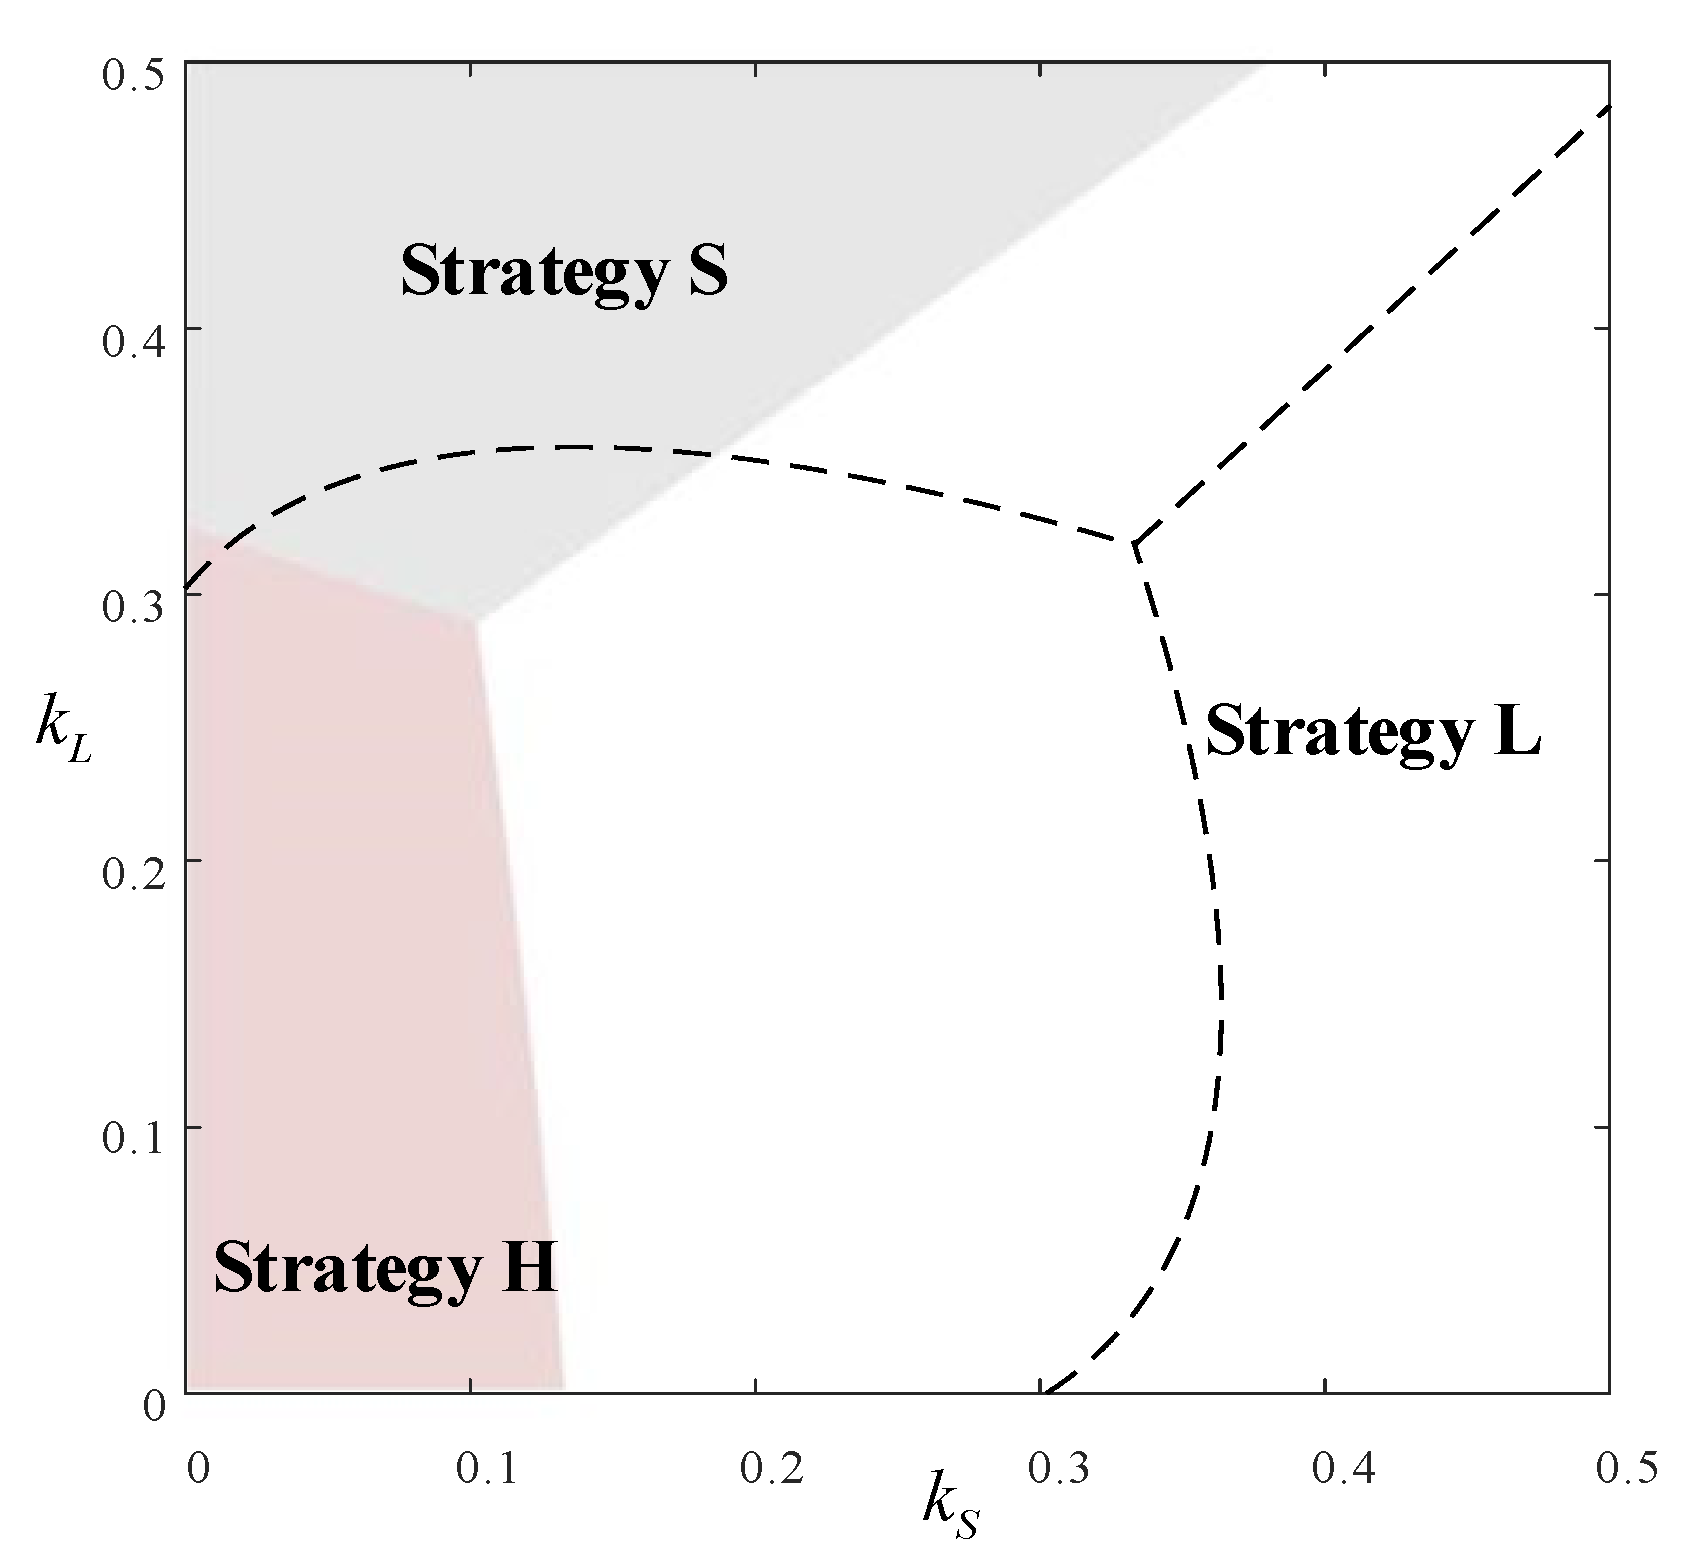
In this subsection, we contemplate the impact of the fan quantity of short video creators and live streamers on the retailer’s strategic choices. The fan quantity of short video creators is denoted as x 1 , and the fan quantity of live streamers is denoted as x 2 . On the basis of observations from commercial practices, live streamers typically possess a vast fan base. For example, the renowned top live streamer Li Jiaqi boasts an astonishing 160 million fans across all platforms, and with a single LSM, on average, more than 2 million viewers. Short video creators generally have fewer fans than live streamers, marking a notable distinction between the two. Hence, we assume that x 1 < x 2 . Another significant difference lies in the fact that, despite having a larger fan base, live streamers usually do not focus on promoting a specific product during an LSM. Taking the prominent live streamer Li Jiaqi as an example, during an LSM, he may sell multiple beauty products and potentially venture into other unrelated product categories. In contrast, short video creators tend to concentrate on promoting a specific product within a single video they post. This disparity leads to different purchase rates among fans. In this subsection, we assume that the purchase rate of short video creator fans is γ 1 and that the purchase rate of live streamer fans is γ 2 . On this basis, we can derive the demand functions under Strategies S and L as D S = Q p + θ α + γ 1 x 1 and D L = Q p + β s + γ 2 x 2 , respectively. When the retailer adopts Strategy H, which involves the use of both SVM and LSM for sales, the construction of the demand function requires special consideration of potential overlap between the fan bases of short video creators and that of live streamers. In other words, some consumers may simultaneously be followers of both the short video creator and the live streamer. To more accurately reflect this market situation, we assume that under Strategy H, the actual purchase volume generated by fans of both is b ( γ 1 x 1 + γ 2 x 2 ) , where b represents the nonoverlapping fan ratio and 0 < b < 1 . Consequently, we can derive the demand function under Strategy H as D H = Q p + θ α + β s + b ( γ 1 x 1 + γ 2 x 2 ) . Other assumptions remain consistent with the main model. Owing to the complexity of the results, we similarly present the outcomes through numerical analysis. The key parameters are assigned values of b = 0.8 ;   x 1 = 40 ;   x 2 = 70 ;   γ 1 = 0.5 ;   γ 2 = 0.5 , whereas the other parameters remain consistent with those of the main model. In Figure 5, the gray area represents Strategy S, the pink area represents Strategy H, and the white area represents Strategy L. To more intuitively illustrate the impact of fan quantity on the retailer’s optimal strategic choices, we outline the optimal strategic regions from the main model via dashed lines. The areas enclosed by these dashed lines carry the same implications as those in Figure 1.
Figure 5 illustrates the impact of fan quantity on the retailer’s optimal strategic choices. Upon reviewing Proposition 3, it is observed that while the results in Figure 5 align with the main model’s outcomes, significant disparities exist in the applicable scope of different strategies. Specifically, when accounting for the fan quantity of short video creators and live streamers, the applicability of Strategy L notably expands, whereas those of Strategies H and S contract. This phenomenon suggests that for retailers, leveraging the fan base of influencers becomes a strategic imperative, particularly in saturated markets where differentiation is crucial. The expansion of the applicability of Strategy L underscores the efficacy of aligning with influencers who possess a significant following because this partnership can amplify product reach and enhance brand visibility. Conversely, the contraction of the scope of Strategies H and S indicates that SVM may be a less influencer-focused strategy than LSM.
From a managerial perspective, retailers should prioritize partnerships with short video creators and live streamers who possess a large fan base. Such collaboration can significantly enhance market penetration and consumer engagement. However, in light of the varying applicability of strategies on the basis of influencer fan quantity, retailers must remain agile in their strategic approach. This includes the readiness to shift to influencer-centric strategies when the market context dictates the need for such a shift. While leveraging influencer fan quantity is important, retailers should also ensure that their overall marketing strategy integrates complementary tactics. This holistic approach can optimize market impact and customer acquisition. For example, as the main model indicates, partnering with short video creators with a substantial fan base and adopting Strategy S can lead to unexpected commercial success when new products are introduced or expanded into new markets.

6. Results

In this study, we examine a market scenario where a prominent short video and live streaming platform, akin to TikTok or RED, exists. The platform focuses primarily on SVM and LSM, boasts a substantial user base, and engages in commerce through short videos and live streaming. The ecosystem of this platform includes consumers (users), a third-party intermediary MCN (that supplies live streamers and short video creators), and a brand retailer. To provide strategic insights for retailers, we construct and analyze the following three distinct scenarios: S (sole implementation of SVM), L (sole implementation of LSM), and H (integration of both SVM and LSM). The main findings are as follows:
(1) The retailer’s strategic choices should vary across different stages of market development. Specifically, in the initial market entry phase or when both the mixed commission rate and the slotting fee are maintained at lower levels, retailers should actively adopt Strategy H. During the market growth phase or when the mixed commission rate is high but the slotting fee is relatively low, particularly when the commission rate for LSM influencers remains low, retailers should prioritize Strategy L centered on “influencer LSM” in a timely manner. In the market maturity phase, or when both the mixed commission rate and the slotting fee escalate to higher levels, especially with a notable rise in the slotting fee, retailers should lean more toward adopting Strategy S or L focused on “merchant self-LSM”.
(2) In terms of the relationship between price and demand, Strategy H, which integrates the advantages of SVM and LSM, is always more beneficial than are the other two strategies for retailers because it enables them to increase product selling prices while simultaneously increasing market demand and consumer surplus.
(3) Retailers need to closely monitor consumer feedback to different marketing approaches, namely, consumer sensitivity to SVM and LSM activities. The reason for this is that greater consumer sensitivity to a particular marketing method provides retailers with greater pricing power for their products under that strategy.
In summary, this paper proposes the following suggestions.
(1) For Retailers:
Retailers should dynamically adjust their marketing strategies according to market development stages. In the initial phase, adopting a hybrid strategy (Strategy H) combining SVM and LSM can help quickly penetrate the market. During the growth stage, shifting focus to influencer live streaming (Strategy L) can expand sales scale, while in the mature stage, merchant self-streaming or focusing on SVM (S strategy) helps optimize costs. Retailers must closely monitor consumer feedback to different formats, optimize content to improve conversion rates, and carefully select creators/streamers with large, engaged audiences while balancing commission and slotting fee to ensure cost effectiveness. Leveraging platform analytics tools to evaluate performance and continuously refine strategies is key to maintaining competitive advantage.
(2) For Platforms:
Platforms should develop differentiated commission policies tailored to different development stages—offering preferential rates to encourage hybrid marketing adoption initially, then optimizing live streaming commission structures during growth phases to enhance profitability. Strengthening data analytics capabilities to provide merchants with precise traffic insights and performance metrics is equally important. Additionally, platforms should establish incentive mechanisms (e.g., traffic support, commission discounts) to encourage high-quality content creation, thereby improving overall ecosystem quality while increasing user engagement and monetization potential.
(3) For Short Video Creators and Live Streamers:
Content professionals should focus on quality enhancement—crafting creative, story-driven short videos while developing strong interactive demonstration skills for live streams to better engage target audiences. Building and nurturing fan communities through regular interactions and exclusive benefits is crucial for establishing a solid foundation for commercial collaborations. Proactively providing brands with audience insights (e.g., user profiles, peak traffic periods) helps establish long-term partnerships that benefit both content monetization and brand growth. Staying attuned to platform policy changes and promptly adjusting content direction ensures continued access to traffic support opportunities.
Theoretically, this study contributes to the marketing literature by incorporating SVM, LSM, and their hybrid strategies into a unified analytical framework, addressing the current research gap where most studies focus solely on single strategies. Through modeling and comparing the pricing, demand and profit differences among these three strategies, we provide retailers with dynamic strategy selection guidelines based on different development stages.
This study has several limitations that suggest directions for future research. First, our model assumes deterministic consumer behavior; future studies could incorporate random utility models to analyze behavioral uncertainty more thoroughly. Second, while we conducted simulation analysis through theoretical modeling, empirical verification through case studies on major platforms like TikTok or RED could assess whether simulation results align with real-world enterprise behavior. Finally, although we calibrated key parameters using industry reports, the lack of longitudinal consumer behavior data limits our ability to validate the model’s dynamic predictive performance. Future research should employ panel data or field experiments to further test the theoretical model’s applicability.

Author Contributions

Conceptualization, S.F. and J.L.; methodology, S.F.; formal analysis, R.Y.; data curation, R.Y.; writing—original draft, R.Y.; writing—review and editing, S.F. and J.L.; supervision, J.L.; funding acquisition, J.L. All authors have read and agreed to the published version of the manuscript.

Funding

This research was funded by the National Natural Science Foundation of China, grant numbers 72171067 and 72401002, the University Natural Science Research Project of Anhui Province, grant numbers 2022AH051323, the Excellent Young Talents Fund Program of Higher Education Institutions of Anhui Province, grant numbers gxyqZD2022063 and JNFX2024036, the Doctoral Foundation of Fuyang Normal University, grant numbers 2021KYQD0007 and 2021KYQD0015. These funding sources do not lead to any conflicts of interest with the publication of this paper.

Data Availability Statement

The original contributions presented in this study are included in the article material. Further inquiries can be directed to the corresponding author.

Conflicts of Interest

The authors declare no conflicts of interest.

Abbreviations

The following abbreviations are used in this manuscript:
SVMshort video marketing
LSMlive streaming marketing
MCNmultichannel networks

Appendix A. Proofs of Lemmas and Corollaries

Proof of Lemma 1.
  • By substituting D S into π r S and π m S , since d 2 π r S d p 2 = 2 ( 1 k S ) < 0 and d 2 π m S d α 2 = k S p θ 4 α 3 / 2 < 0 , we can conclude that π r S   ( π m S ) is a concave function of p   ( α ) and that there exists a unique optimal solution. Setting d π r S d p = d π m S d α = 0 , the optimal solution under Strategy L can be obtained as p S = 2 f Q 4 f k S θ 2 , where α S = k S 2 Q 2 θ 2 ( 4 f k S θ 2 ) 2 . Notably, because p S 0 , it is necessary to ensure that 4 f k S θ 2 > 0 holds true.
  • By substituting p S and α S into the retailer’s demand and profit functions, the optimal demand D S = 2 f Q 4 f k S θ 2 is obtained, and the optimal profit Π r S = 4 ( 1 k S ) f 2 Q 2 ( 4 f k S θ 2 ) 2 is obtained. □
Proof of Corollary 1.
 
(1) p S θ = D S θ = 4 f k S Q θ ( 4 f k S θ 2 ) 2 > 0 ; p S f = D S f = 2 k S Q θ 2 ( 4 f k S θ 2 ) 2 < 0 ; p S k S = D S k S = 2 f Q θ 2 ( 4 f k S θ 2 ) 2 > 0 .
(2) α S θ = 2 k S 2 Q 2 θ ( 4 f + k S θ 2 ) ( 4 f k S θ 2 ) 3 > 0 ; α S f = 8 k S 2 Q 2 θ 2 ( 4 f k S θ 2 ) 3 < 0 ; α S k S = 8 f k S Q 2 θ 2 ( 4 f k S θ 2 ) 3 > 0 .
(3) Π r S θ = 16 f 2 ( 1 k S ) k S Q 2 θ ( 4 f k S θ 2 ) 3 > 0 . Because Π r S k S = 4 f 2 Q 2 ( 2 θ 2 4 f ) k S θ 2 ( 4 f k S θ 2 ) 3 , when k S < 2 4 f θ 2 , Π r S k S > 0 ; when k S > 2 4 f θ 2 , Π r S k S < 0 . □
Proof of Lemma 2.
  • By substituting D L into π r L and π m L , since d 2 π r L d p 2 = 2 ( 1 k S ) < 0 and d 2 π m L d α 2 = 1 < 0 , we can conclude that π r L   ( π m L ) is a concave function of p   ( s ) and that there exists a unique optimal solution. Setting d π r L d p = d π m L d s = 0 , the optimal solution under Strategy L can be obtained as p L = Q 2 k L β 2 , where s L = k L β Q 2 k L β 2 . Notably, because p L 0 , it is necessary to ensure that 2 k L β 2 > 0 holds true.
  • By substituting p L and s L into the retailer’s demand and profit functions, the optimal demand D L = Q 2 k L β 2 is obtained, and the optimal profit Π r L = ( 1 k L ) Q 2 ( 2 k L β 2 ) 2 T is obtained. □
Proof of Corollary 2.
 
(1) p L β = D L β = 2 β k L Q ( 2 β 2 k L ) 2 > 0 ; p L k L = D L k L = β 2 Q ( 2 β 2 k L ) 2 > 0 .
(2) s L β = k L ( 2 + β 2 k L ) Q ( 2 β 2 k L ) 2 > 0 ; s L k L = 2 β Q ( 2 β 2 k L ) 2 > 0 .
(3) Π r L β = 4 β ( 1 k L ) k L Q 2 ( 2 β 2 k L ) 3 > 0 ; Π r L k L = 2 ( 2 k L ) β 2 Q 2 ( 2 β 2 k L ) 3 < 0 . □
Proof of Lemma 3.
  • By substituting D H into π r H , since d 2 π r H d p 2 = 2 ( 1 k S k L ) < 0 , we can conclude that π m H is a concave function of p and that there exists a unique optimal solution. Setting d π r H d p = 0 , the optimal price under Strategy H can be obtained as p H = 2 f Q 2 f 2 ( k L + k S ) β 2 ( k L + k S ) θ 2 .
  • By substituting D H into π m H , since the Hessian matrix H = 2 Π p H α 2 2 Π p H α s 2 Π p H s α 2 Π p H s 2 = ( k L + k S ) θ p 4 α 3 / 2 0 0 1 is negative definite, i.e., since H 1 = ( k L + k S ) θ p 4 α 3 / 2 < 0 and H 2 = ( k L + k S ) θ p 4 α 3 / 2 > 0 , we can conclude that π m H   is a concave function of α and s and that there exists a unique optimal solution. Setting π p H d α = π m H d s = 0 , the optimal solution under Strategy H can be obtained as α H = ( k L + k S ) 2 θ 2 Q 2 2 f 2 ( k L + k S ) β 2 ( k L + k S ) θ 2 2 , where s H = 2 β f ( k L + k S ) Q 2 f 2 ( k L + k S ) β 2 ( k L + k S ) θ 2 . Notably, because p H 0 , it is necessary to ensure that 2 f 2 ( k L + k S ) β 2 ( k L + k S ) θ 2 > 0 holds true.
  • By substituting p H , α H , and s H into the retailer’s demand and profit functions, the optimal demand D H = Q 2 f + ( k L + k S ) θ 2 ( θ Q 1 ) 2 f 2 ( k L + k S ) β 2 ( k L + k S ) θ 2 is obtained, and the optimal profit Π r H = 2 f Q 2 1 ( k L + k S ) 2 f + ( k L + k S ) θ 2 ( θ Q 1 ) 2 f 2 ( k L + k S ) β 2 ( k L + k S ) θ 2 2 T is obtained. □
Proof of Corollary 3.
 
(1) p H θ = 4 f ( k L + k S ) θ Q 2 f 2 ( k L + k S ) β 2 ( k L + k S ) θ 2 2 > 0 ; p H β = 8 β f 2 ( k L + k S ) Q 2 f 2 ( k L + k S ) β 2 ( k L + k S ) θ 2 2 > 0 ; p H k S = p H k L = 2 f Q ( 2 β 2 f + θ 2 ) 2 f 2 ( k L + k S ) β 2 ( k L + k S ) θ 2 2 > 0 .
(2) α H θ = 2 ( k L + k S ) 2 θ Q 2 2 f 2 ( k L + k S ) β 2 + ( k L + k S ) θ 2 2 f 2 ( k L + k S ) β 2 ( k L + k S ) θ 2 3 > 0 ; α H β = 8 β f ( k L + k S ) 3 Q 2 θ 2 2 f 2 ( k L + k S ) β 2 ( k L + k S ) θ 2 3 > 0 ; α H k S = α H k L = 8 f ( k L + k S ) Q 2 θ 2 2 f 2 ( k L + k S ) β 2 ( k L + k S ) θ 2 3 > 0 .
(3) s H θ = 4 β f ( k L + k S ) 2 Q θ 2 f 2 ( k L + k S ) β 2 ( k L + k S ) θ 2 2 > 0 ;
s H β = 2 f ( k L + k S ) Q 2 f 2 + ( k L + k S ) β 2 ( k L + k S ) θ 2 2 f 2 ( k L + k S ) β 2 ( k L + k S ) θ 2 2 > 0 ;
s H k S = s H k L = 8 β f 2 Q 2 f 2 ( k L + k S ) β 2 ( k L + k S ) θ 2 2 > 0 .
(4) D H θ = ( k L + k S ) Q θ ( 3 Q θ 2 ) 2 f 2 ( k L + k S ) β 2 ( k L + k S ) θ 2 + 2 ( k L + k S ) Q θ 2 f + ( k L + k S ) θ 2 ( Q θ 1 ) 2 f 2 ( k L + k S ) β 2 ( k L + k S ) θ 2 2 > 0 ; D H β = 4 β f ( k L + k S ) Q 2 f + ( k L + k S ) θ 2 ( Q θ 1 ) 2 f 2 ( k L + k S ) β 2 ( k L + k S ) θ 2 2 > 0 ; D H k S = D H k L = 2 f Q 2 β 2 f + θ 2 ( 2 Q θ 1 ) 2 f 2 ( k L + k S ) β 2 ( k L + k S ) θ 2 2 > 0 .
(5) Π r H θ = 2 f ( 1 k L k S ) ( k L + k S ) Q 2 θ ( 3 Q θ 2 ) 2 f 2 ( k L + k S ) β 2 ( k L + k S ) θ 2 2 + 8 f ( 1 k L k S ) ( k L + k S ) Q 2 θ 2 f + ( k L + k S ) θ 2 ( Q θ 1 ) 2 f 2 ( k L + k S ) β 2 ( k L + k S ) θ 2 3 > 0 ;
Π r H β = 16 β f 2 ( 1 k L k S ) ( k L + k S ) Q 2 2 f + ( k L + k S ) θ 2 ( Q θ 1 ) 2 f 2 ( k L + k S ) β 2 ( k L + k S ) θ 2 3 > 0 .
Because Π r H k S = Π r H k L = 4 f 2 Q 2 4 f ( k L + k S ) 2 β 2 f + θ 2 ( 4 Q θ 5 ) 2 f 2 ( k L + k S ) β 2 ( k L + k S ) θ 2 3 , when k L + k S < 4 f 2 β 2 f + θ 2 ( 4 Q θ 5 ) , Π r H k S = Π r H k L > 0 ; when k L + k S > 4 f 2 β 2 f + θ 2 ( 4 Q θ 5 ) , Π r H k S = Π r H k L < 0 . □

Appendix B. Pairwise Comparisons of the Three Strategies

(1) Comparison between Strategies L and S.
p L p S = Q ( 2 f β 2 k L θ 2 k S ) ( 2 β 2 k L ) ( 4 f k S θ 2 ) . Therefore, when k L > θ 2 2 f β 2 k S , p L > p S ; when k L < θ 2 2 f β 2 k S , p L < p S .
D L D S = Q ( 2 f β 2 k L θ 2 k S ) ( 2 β 2 k L ) ( 4 f k S θ 2 ) . Therefore, when k L > θ 2 k S 2 f β 2 , D L > D S ; when k L < θ 2 k S 2 f β 2 , D L < D S .
Π r L Π r S = Q 2 1 k L ( 2 β 2 k L ) 2 4 f 2 ( 1 k S ) ( 4 f k S θ 2 ) 2 T ; then, we can obtain the following.
(i) When T 0 , if T < T L S , then Π r L > Π r S , whereas if T > T L S , then Π r L < Π r S . Among them, T L S = Q 2 1 k L ( 2 β 2 k L ) 2 4 f 2 ( 1 k S ) ( 4 f k S θ 2 ) 2 .
(ii) When T = 0 , the numerator after combining the fractions in the bracket of Π r L Π r S is a quadratic equation for one variable k L , namely, A 1 k L 2 + B 1 k L + C 1 , where A 1 = 4 β 4 f 2 ( 1 k S ) , B 1 = 16 β 2 f 2 ( 1 k S ) ( 4 f f θ 2 ) 2 , and C 1 = k S 4 f f θ 2 2 . Because A 1 < 0 and C 1 > 0 , according to Veda’s theorem, the roots of the above quadratic equation are one positive and one negative, and it is a concave function with respect to k L . The positive root is denoted as k L S ( k S ) = B 1 + B 1 2 4 A 1 C 1 2 A 1 . Therefore, when k L < k L S ( k S ) , Π r L > Π r S ; when k L > k L S ( k S ) , Π r L < Π r S .
(2) Comparison between Strategies H and L.
p H p L = Q 2 β 2 f k S + ( k L + k S ) θ 2 2 f 2 ( k L + k S ) β 2 ( k L + k S ) θ 2 ( 2 k L β 2 ) > 0 ; therefore, p H > p L .
D H D L = Q θ 2 ( 2 θ Q 1 ) + β 2 k L θ 2 ( θ Q 1 ) ( k L + k S ) + 2 β 2 f k S 2 f 2 ( k L + k S ) β 2 ( k L + k S ) θ 2 ( 2 k L β 2 ) > 0 ; therefore, D H > D L .
Π r H Π r L = Q 2 2 f ( 1 k L k S ) 2 f + ( k L + k S ) θ 2 ( θ Q 1 ) 2 f 2 ( k L + k S ) β 2 ( k L + k S ) θ 2 2 1 k L ( 2 β 2 k L ) 2 ; by setting k H = k L + k S , the numerator after combining the fractions in the bracket of Π r H Π r L is a quadratic equation for one variable k H , namely, A 2 k H 2 + B 2 k H + C 2 , where A 2 = ( 1 + k L ) ( 2 β 2 f + θ 2 ) 2 + 2 ( 2 β 2 k L ) 2 f θ 2 ( θ Q 1 ) , B 2 = 2 f ( 2 β 2 k L ) 2 2 f θ 2 ( θ Q 1 ) 4 ( 1 k L ) ( 2 β 2 f + θ 2 ) , and C 2 = 4 f 2 k L 4 β 2 ( 4 β 2 k L ) . Because A 2 < 0 and C 2 > 0 , according to Veda’s theorem, the roots of the above quadratic equation are one positive and one negative, and it is a concave function with respect to k H . The positive root is denoted as k H L ( k L ) = B 2 + B 2 2 4 A 2 C 2 2 A 2 . Therefore, when k H < k H L ( k L ) , i.e., when k S < k H L ( k L ) k L , Π m H > Π m L ; when k H > k H L ( k L ) , i.e., when k S > k H L ( k L ) k L , Π m H < Π m L .
(3) Comparison between Strategies H and S.
p H p S = 2 f Q 2 β 2 f ( k L + k S ) + k L θ 2 2 f 2 ( k L + k S ) β 2 ( k L + k S ) θ 2 ( 4 f k S θ 2 ) > 0 ; therefore, p H > p S .
α H α S = θ 2 Q 2 ( 4 f k S θ 2 ) 2 k H 2 + k S 2 2 f ( 2 β 2 k H ) k H θ 2 2 2 f 2 ( k L + k S ) β 2 ( k L + k S ) θ 2 2 ( 4 f k S θ 2 ) 2 > 0 ; therefore, α H > α S .
D H D S = Q ( k L + k S ) 4 β 2 f 2 + θ 2 ( 4 f k S θ 2 ) ( θ Q 1 ) + 2 f k L θ 2 2 f 2 ( k L + k S ) β 2 ( k L + k S ) θ 2 ( 4 f k S θ 2 ) > 0 ; therefore, D H > D S .
Π r H Π r S = 2 f Q 2 1 ( k L + k S ) 2 f + ( k L + k S ) θ 2 ( θ Q 1 ) 2 f 4 β 2 ( k L + k S ) ( k L + k S ) θ 2 2 2 f ( 1 k S ) ( 4 f k S θ 2 ) 2 T ; then, we can obtain the following.
(i) When T 0 , if T < T H S , then Π r H > Π r S , whereas if  T > T H S , then Π r H < Π r S . Among them, T H S = 2 f Q 2 1 ( k L + k S ) 2 f + ( k L + k S ) θ 2 ( θ Q 1 ) 2 f 4 β 2 ( k L + k S ) ( k L + k S ) θ 2 2 2 f ( 1 k S ) ( 4 f k S θ 2 ) 2 .
(ii) when T = 0 , by setting k H = k L + k S , the numerator after combining the fractions in the bracket of Π r H Π r S is a quadratic equation for one variable k H , namely, A 3 k H 2 + B 3 k H + C 3 , where A 3 = 8 β 2 f 2 ( 1 k S ) ( β 2 f + θ 2 ) + 2 f ( 1 k S ) θ 4 + 2 ( 4 f k S θ 2 ) 2 θ 2 Q ( θ Q 1 ) , B 3 = 16 f 2 ( 1 k S ) ( 2 β 2 f + θ 2 ) ( 4 f k S θ 2 ) 2 2 f θ 2 ( θ Q 1 ) , and C 3 = 2 f k S 8 f ( 2 f θ 2 ) + k S θ 4 . Because A 3 < 0 , C 3 > 0 , according to Veda’s theorem, the roots of the above quadratic equation are one positive and one negative, and it is a concave function with respect to k H . The positive root is denoted as k H S ( k S ) = B 3 + B 3 2 4 A 3 C 3 2 A 3 . Therefore, when k H < k H S ( k S ) , i.e., when k L < k H S ( k S ) k S , Π r H > Π r S ; when k H > k H S ( k S ) , i.e., when k L > k H S ( k S ) k S , Π r H < Π r S .

Appendix C. Proofs of Propositions

Proof of Proposition 1.
  • Combining the results of the price comparison, we obtain the following:
(1) When k L / k S > θ 2 2 f β 2 , p H > p L > p S , D H > D L > D S .
(2) When k L / k S < θ 2 2 f β 2 , p H > p S > p L , D H > D S > D L .
(3) ( k L / k S ) θ 2 = 1 2 f β 2 > 0 , and ( k L / k S ) β 2 = θ 2 2 f β 4 < 0 . □
Proof of Proposition 2.
  • α H α S = θ 2 Q 2 ( 4 f k S θ 2 ) 2 k H 2 + k S 2 2 f ( 2 β 2 k H ) k H θ 2 2 2 f 2 ( k L + k S ) β 2 ( k L + k S ) θ 2 2 ( 4 f k S θ 2 ) 2 > 0 ; therefore, α H > α S .
  • s H s L = β Q 4 f k S + k L ( k L + k S ) θ 2 2 f 2 ( k L + k S ) β 2 ( k L + k S ) θ 2 ( 2 k L β 2 ) > 0 ; therefore, s H > s L . □
Proof of Proposition 3.
  • Combining the results of the profit comparison when T = 0 , we obtain the following:
(1) When k H { k H < k H L k H < k H S } , if k L < k L S , then Π r H > Π r L > Π r S ; if k L > k L S , then Π r H > Π r S > Π r L .
(2) Otherwise, if k L < k L S , then Π r L > Π r S > Π r H ; if k L > k L S , then Π r S > Π r L > Π r H . Among them, k H = k L + k S . □
Proof of Proposition 4.
 
  • The thresholds for profit comparison are comprehensively compared when T 0 and T H S T L S = ( Π r H Π r S ) ( Π r L Π r S ) = Π r H Π r L . Thus, when k S < k H L ( k L ) k L , T H S > T L S and Π r H > Π r L ; when k S > k H L ( k L ) k L , T H S < T L S and Π r H < Π r L .
  • Therefore, the following synthesis can be obtained:
(1) When k H < k H L , if 0 < T < T L S , then Π r H > Π r L > Π r S ; if T L S T T H S , then Π r H > Π r S > Π r L ; and if T > T H S , then Π r S > Π r H > Π r L .
(2) When k H > k H L , if 0 < T < T H S , then Π r L > Π r H > Π r S ; if T H S T T L S , then Π r L > Π r S > Π r H ; and if T > T L S , then Π r S > Π r L > Π r H . □
Proof of Proposition 5.
  • Because C S S = ( D S ) 2 2 , C S L = ( D L ) 2 2 , and C S H = ( D H ) 2 2 , while D S , D L and D H are greater than zero, by combining the results of the demand comparison, we can obtain the result of Proposition 5 as follows:
(1) When k L / k S > θ 2 2 f β 2 , C S H > C S L > C S S .
(2) When k L / k S < θ 2 2 f β 2 , C S H > C S S > C S L . □

Appendix D. Sensitivity Analysis and Parameter Rationality Explanation

This part provides formal proofs of Corollaries 1–3. The sensitivity analyses in Corollaries 1–3 demonstrate clear monotonic trends, e.g., p S θ = D S θ > 0 , which can be intuitively inferred from the mathematical expressions. Therefore, we selectively plot representative cases where visualizations add value (e.g., Corollary 1(3) and Corollary 3(5)).
Figure A1a illustrates the relationship between the retailer’s profit and the short video commission rate k s under Strategy S. As proven in Corollary 1, the profit initially increases with k s (when k S < 2 4 f θ 2 ), but declines beyond this threshold ( f = 0.005 ) as the commission cost outweighs the benefits. This confirms the existence of an optimal commission rate for retailers. This also indirectly verifies the robustness of our results. Figure A1b The results in Figure A1b are also consistent with the findings of Corollary 3(5), so we will not elaborate further.
Figure A1. Sensitivity of Profit to Commission Rate under Strategy S and Strategy H. (a) Sensitivity of Profit to Commission Rate under Strategy S. (b) Sensitivity of Profit to Commission Rate under Strategy H.
Mathematics 13 02675 g0a1
Table A1. Parameter Rationality Explanation.
ParametersDefinitionBoundOriginRationale
p Sales price of a retailer’s product p > 0 Classical demand function theory (such as linear price-demand relationship)Refer to Liu et al. [16]
α Number of short videos, reflecting the promotional effort of SVM α > 0 The law of diminishing marginal utilityRefer to Cheng et al. [31]
s Promotional effort of LSM s > 0 The law of increasing marginal costRefer to He et al. [13]
Q Potential market size Q 0 The active user base of the platform (for example, Douyin‘s clothing market has approximately 120 million users)Refer to Niu et al. [61]
f Production cost per unit of short video f > 0 Cost control for short video production (Clothing category: 500–2000 yuan per video)Need to ensure that the profit is greater than 0
θ Sensitivity coefficient of consumers to SVM 0 < θ < 1 Suppose consumers are more sensitive to SVM than to LSM (based on user browsing duration data)Refer to He et al. [14]
β Sensitivity coefficient of consumers to LSM 0 < β < θ Assumed that the direct pull effect of LSM’s real-time interactivity on demand is relatively weakRefer to Zhang et al. [12]
k S Commission rate for SVM 0 < k s < 0.5 The actual commission rate range of the platform (for example, the commission rate of Douyin is usually less 50%)Refer to Niu et al. [62]
k L Commission rate for LSM 0 < k L < 0.5 The reasons are the same as above.Refer to Niu et al. [62]
k H = k L + k S Mixed commission rate 0 < k H = k L + k s The reasons are the same as above.Make assumptions based on the actual situation
T Slotting fee T 0 Distinguish between merchant self-LSM and influencer LSMRefer to Wang et al. [50]

References

  1. CNNIC. The 55nd Statistical Report on the Development of the Internet in China. 2025. Available online: https://www.cnnic.net.cn/n4/2025/0117/c88-11229.html (accessed on 11 February 2025).
  2. Jiang, S.; Wang, Z.; Sun, Z.; Ruan, J. Determinants of Buying Produce on Short-Video Platforms: The Impact of Social Network and Resource Endowment-Evidence from China. Agriculture 2022, 12, 1700. [Google Scholar] [CrossRef]
  3. Yang, J.; Zhang, J.; Zhang, Y. Engagement That Sells: Influencer Video Advertising on TikTok. Mark. Sci. 2024, 44, 247–267. [Google Scholar] [CrossRef]
  4. Xiao, L.; Li, X.; Zhang, Y. Exploring the factors influencing consumer engagement behavior regarding short-form video advertising: A big data perspective. J. Retail. Consum. Serv. 2023, 70, 103170. [Google Scholar] [CrossRef]
  5. Guo, Y.; Zhang, K.; Wang, C. Way to success: Understanding top streamer’s popularity and influence from the perspective of source characteristics. J. Retail. Consum. Serv. 2022, 64, 102786. [Google Scholar] [CrossRef]
  6. 36Kr. 2023 Tik Tok Review: 16 Influencers Gained over 10 Million Followers, and 8 Accounts Achieved over 3 Billion yuan in Live-Streaming Sales. 2024. Available online: https://www.36kr.com/p/2629563654225032 (accessed on 19 May 2024).
  7. EWS. Three New Growth Engines Drove the Overall Growth of Tmall’s Double 11 in 2023. 2023. Available online: http://www.news.cn/tech/20231112/6f1bb144ae01480f87101f32cf3622a6/c.html (accessed on 19 June 2024).
  8. Zhou, C.; Yu, J.; Qian, Y. Should live-streaming platforms nonexclusively promote brands from traditional retail platforms? J. Retail. Consum. Serv. 2024, 80, 103930. [Google Scholar] [CrossRef]
  9. Jiang, J.; Liu, X.; Wang, Z.; Ding, W.; Zhang, S.; Xu, H. Large group decision-making with a rough integrated asymmetric cloud model under multi-granularity linguistic environment. Inf. Sci. 2024, 678, 120994. [Google Scholar] [CrossRef]
  10. Jiang, J.; Liu, X.; Wang, Z.; Ding, W.; Zhang, S. Large group emergency decision-making with bi-directional trust in social networks: A probabilistic hesitant fuzzy integrated cloud approach. Inf. Fusion 2024, 102, 102062. [Google Scholar] [CrossRef]
  11. Huang, L.; Liu, B.; Zhang, R. Channel strategies for competing retailers: Whether and when to introduce live stream? Eur. J. Oper. Res. 2023, 312, 413–426. [Google Scholar] [CrossRef]
  12. Zhang, W.; Yu, L.; Wang, Z. Live-streaming selling modes on a retail platform. Transp. Res. Part E Logist. Transp. Rev. 2023, 173, 103096. [Google Scholar] [CrossRef]
  13. He, P.; Shang, Q.; Pedrycz, W.; Chen, Z.-S. Short video creation and traffic investment decision in social e-commerce platforms. Omega 2024, 128, 103129. [Google Scholar] [CrossRef]
  14. He, P.; Shang, Q.; Chen, Z.-S.; Mardani, A.; Skibniewski, M.J. Short video channel strategy for restaurants in the platform service supply chain. J. Retail. Consum. Serv. 2024, 78, 103755. [Google Scholar] [CrossRef]
  15. Wang, X.; Han, X.; Chen, Y. Optimal manufacturer strategy for live-stream selling and product quality. Electron. Commer. Res. Appl. 2024, 64, 101372. [Google Scholar] [CrossRef]
  16. Liu, Z.; Chen, H.; Zhang, X.; Gajpal, Y.; Zhang, Z. Optimal channel strategy for an e-seller: Whether and when to introduce live streaming? Electron. Commer. Res. Appl. 2024, 63, 101348. [Google Scholar] [CrossRef]
  17. Lu, W.; Ji, X.; Wu, J. Retailer’s information sharing and manufacturer’s channel expansion in the live-streaming E-commerce era. Eur. J. Oper. Res. 2025, 320, 527–543. [Google Scholar] [CrossRef]
  18. Statista. Mobile Video in the United States-Statistics & Facts. 2023. Available online: https://www.statista.com/topics/2725/mobile-video-in-the-united-states/#topicOverview (accessed on 19 June 2024).
  19. CSM. The Seventh Annual Research Report on the Value of Short Video Users. 2024. Available online: https://mp.weixin.qq.com/s/fqFdCjHGbb6ynuSQ0OcQvA (accessed on 5 February 2025).
  20. IIMEDIA. Survey Data on User Behavior in China’s Short Video Industry. 2023. Available online: https://www.iimedia.cn/c1077/97043.html (accessed on 19 June 2024).
  21. Chi, X.; Fan, Z.P.; Wang, X.H. Pricing mode selection for the online short video platform. Soft Comput. 2021, 25, 5105–5120. [Google Scholar] [CrossRef]
  22. CAAS. One Million Likes but Less than 5,000 Monthly Sales, What Did the Product Do Wrong in Short Video Marketing? 2020. Available online: https://www.niaogebiji.com/article-36539-1.html (accessed on 6 January 2025).
  23. Li, Z.; Zhang, J. How to improve destination brand identification and loyalty using short-form videos? The role of emotional experience and self-congruity. J. Destin. Mark. Manag. 2023, 30, 100825. [Google Scholar] [CrossRef]
  24. Li, B.; Chen, S.; Zhou, Q. Empathy with influencers? The impact of the sensory advertising experience on user behavioral responses. J. Retail. Consum. Serv. 2023, 72, 103286. [Google Scholar] [CrossRef]
  25. Yuan, L.; Xia, H.; Ye, Q. The effect of advertising strategies on a short video platform: Evidence from TikTok. Ind. Manag. Data Syst. 2022, 122, 1956–1974. [Google Scholar] [CrossRef]
  26. Gan, J.; Shi, S.; Filieri, R.; Leung, W.K.S. Short video marketing and travel intentions: The interplay between visual perspective, visual content, and narration appeal. Tour. Manag. 2023, 99, 104795. [Google Scholar] [CrossRef]
  27. Zhang, Y.; Zhang, T.; Yan, X. Understanding impulse buying in short video live E-commerce: The perspective of consumer vulnerability and product type. J. Retail. Consum. Serv. 2024, 79, 103853. [Google Scholar] [CrossRef]
  28. Dong, X.; Liu, H.; Xi, N.; Liao, J.; Yang, Z. Short video marketing: What, when and how short-branded videos facilitate consumer engagement. Internet Res. 2023, 34, 1104–1128. [Google Scholar] [CrossRef]
  29. Shi, R.; Wang, M.; Liu, C.; Gull, N. The Influence of Short Video Platform Characteristics on Users’ Willingness to Share Marketing Information: Based on the SOR Model. Sustainability 2023, 15, 2448. [Google Scholar] [CrossRef]
  30. Yuan, Y.; Wang, Q. Characteristics, hotspots, and prospects of short video research: A review of papers published in China from 2012 to 2022. Heliyon 2024, 10, e24885. [Google Scholar] [CrossRef]
  31. Cheng, X.; Su, X.; Yang, B.; Zarifis, A.; Mou, J. Understanding users’ negative emotions and continuous usage intention in short video platforms. Electron. Commer. Res. Appl. 2023, 58, 101244. [Google Scholar] [CrossRef]
  32. Zhu, C.; Jiang, Y.; Lei, H.; Wang, H.; Zhang, C. The relationship between short-form video use and depression among Chinese adolescents: Examining the mediating roles of need gratification and short-form video addiction. Heliyon 2024, 10, e30346. [Google Scholar] [CrossRef]
  33. Chen, R. Multimodal cooperative learning for micro-video advertising click prediction. Internet Res. 2022, 32, 477–495. [Google Scholar] [CrossRef]
  34. Lu, W.; Wu, J.; Ji, X. Consumer environmental preference information sharing with green manufacturer’s short video platform-selling. Ann. Oper. Res. 2023, 1–23. [Google Scholar] [CrossRef]
  35. Zhang, Y.; Li, K.; Qian, C.; Li, X.; Yuan, Q. How real-time interaction and sentiment influence online sales? Understanding the role of live streaming danmaku. J. Retail. Consum. Serv. 2024, 78, 103793. [Google Scholar] [CrossRef]
  36. Wang, H.; Li, G.; Xie, X.; Wu, S. An empirical analysis of the impacts of live chat social interactions in live streaming commerce: A topic modeling approach. Electron. Commer. Res. Appl. 2024, 65, 101397. [Google Scholar] [CrossRef]
  37. Peng, L.; Zhang, N.; Huang, L. How the source dynamism of streamers affects purchase intention in live streaming e-commerce: Considering the moderating effect of Chinese consumers’ gender. J. Retail. Consum. Serv. 2024, 81, 103949. [Google Scholar] [CrossRef]
  38. Luo, L.; Xu, M.; Zheng, Y. Informative or affective? Exploring the effects of streamers’ topic types on user engagement in live streaming commerce. J. Retail. Consum. Serv. 2024, 79, 103799. [Google Scholar] [CrossRef]
  39. Li, Z.; Liu, D.; Zhang, J.; Wang, P.; Guan, X. Live streaming selling strategies of online retailers with spillover effects. Electron. Commer. Res. Appl. 2024, 63, 101330. [Google Scholar] [CrossRef]
  40. Gong, H.; Zhao, M.; Ren, J.; Hao, Z. Live streaming strategy under multi-channel sales of the online retailer. Electron. Commer. Res. Appl. 2022, 55, 101184. [Google Scholar] [CrossRef]
  41. Jin, D.; Lai, D.; Pu, X.; Han, G. Self-broadcasting or cooperating with streamers? A perspective on live streaming sales of fresh products. Electron. Commer. Res. Appl. 2024, 64, 101367. [Google Scholar] [CrossRef]
  42. Chen, Q.; Yan, X.; Zhao, Y.; Bian, Y. Live streaming channel strategy of an online retailer in a supply chain. Electron. Commer. Res. Appl. 2023, 62, 101321. [Google Scholar] [CrossRef]
  43. Zhang, T.; Tang, Z. Should manufacturers open live streaming shopping channels? J. Retail. Consum. Serv. 2023, 71, 103229. [Google Scholar] [CrossRef]
  44. Wang, T.-Y.; Chen, Y.; Mardani, A.; Chen, Z.-S. Live streaming service introduction and optimal contract selection in an e-commerce supply chain. IEEE Trans. Eng. Manag. 2024, 71, 8088–8102. [Google Scholar] [CrossRef]
  45. Lei, B.; Li, G.; Cheng, T.C.E. Friend or foe? Examining local service sharing between offline stores and e-tailers. Omega 2024, 123, 102988. [Google Scholar] [CrossRef]
  46. Yang, X.; Gou, Q.; Wang, X.; Zhang, J. Does bonus motivate streamers to perform better? An analysis of compensation mechanisms for live streaming platforms. Transp. Res. Part E Logist. Transp. Rev. 2022, 164, 102758. [Google Scholar] [CrossRef]
  47. Lodish, L.M.; Abraham, M.; Kalmenson, S.; Livelsberger, J.; Lubetkin, B.; Richardson, B.; Stevens, M.E. How TV advertising works: A meta-analysis of 389 real world split cable TV advertising experiments. J. Mark. Res. 1995, 32, 125–139. [Google Scholar] [CrossRef]
  48. Schmidt, S.; Eisend, M. Advertising repetition: A meta-analysis on effective frequency in advertising. J. Advert. 2015, 44, 415–428. [Google Scholar] [CrossRef]
  49. Siqin, T.; Choi, T.-M.; Chung, S.-H. Optimal E-tailing channel structure and service contracting in the platform era. Transp. Res. Part E Logist. Transp. Rev. 2022, 160, 102614. [Google Scholar] [CrossRef]
  50. Wang, T.-Y.; Chen, Y.; Chen, Z.-S.; Deveci, M.; Delen, D. Maximizing sales: The art of short video creation in livestream e-commerce. Comput. Ind. Eng. 2025, 200, 110824. [Google Scholar] [CrossRef]
  51. Du, Z.; Fan, Z.-P.; Sun, F. Live streaming sales: Streamer type choice and limited sales strategy for a manufacturer. Electron. Commer. Res. Appl. 2023, 61, 101300. [Google Scholar] [CrossRef]
  52. Liu, X.; Zhou, Z.; Zhong, F.; Hu, M. Resolving the information reliability issue in live streaming through blockchain adoption. Transp. Res. Part E Logist. Transp. Rev. 2024, 189, 103652. [Google Scholar] [CrossRef]
  53. Xu, X.; Yan, L.; Choi, T.-M.; Cheng, T.C.E. When Is It Wise to Use Blockchain for Platform Operations with Remanufacturing? Eur. J. Oper. Res. 2023, 309, 1073–1090. [Google Scholar] [CrossRef]
  54. Zhang, X.; Chen, H.; Liu, Z. Operation strategy in an E-commerce platform supply chain: Whether and how to introduce live streaming services? Int. Trans. Oper. Res. 2022, 31, 1093–1121. [Google Scholar] [CrossRef]
  55. Zhang, Z.; Chen, Z.; Wan, M.; Zhang, Z. Dynamic quality management of live streaming e-commerce supply chain considering streamer type. Comput. Ind. Eng. 2023, 182, 109357. [Google Scholar] [CrossRef]
  56. Li, G.; Zhang, T.; Tayi, G.K. Inroad into omni-channel retailing: Physical showroom deployment of an online retailer. Eur. J. Oper. Res. 2020, 283, 676–691. [Google Scholar] [CrossRef]
  57. Wang, S.; Guo, X. Strategic introduction of live-stream selling in a supply chain. Electron. Commer. Res. Appl. 2023, 62, 101315. [Google Scholar] [CrossRef]
  58. Ye, F.; Ji, L.; Ning, Y.; Li, Y. Influencer selection and strategic analysis for live streaming selling. J. Retail. Consum. Serv. 2024, 77, 103673. [Google Scholar] [CrossRef]
  59. Pan, R.; Feng, J.; Zhao, Z. Fly with the wings of live-stream selling—Channel strategies with/without switching demand. Prod. Oper. Manag. 2022, 31, 3387–3399. [Google Scholar] [CrossRef]
  60. Zhang, X.; Zhang, J. Pricing and Channel Selection Strategies in E-Commerce Supply Chain with Hybrid Channels and Live Streaming. J. Syst. Manag. 2025, 34, 27–39. [Google Scholar]
  61. Niu, B.; Dong, J.; Yu, X.; Wang, Y. Online quality endorsement to improve consumer trust: Blockchain or self-hosted livestream? Eur. J. Oper. Res. 2025, in press. [Google Scholar] [CrossRef]
  62. Niu, B.; Chen, Y.; Zhang, J.; Chen, K.; Jin, Y. Brands’ livestream selling with influencers’ converting fans into consumers. Omega 2025, 131, 103195. [Google Scholar] [CrossRef]
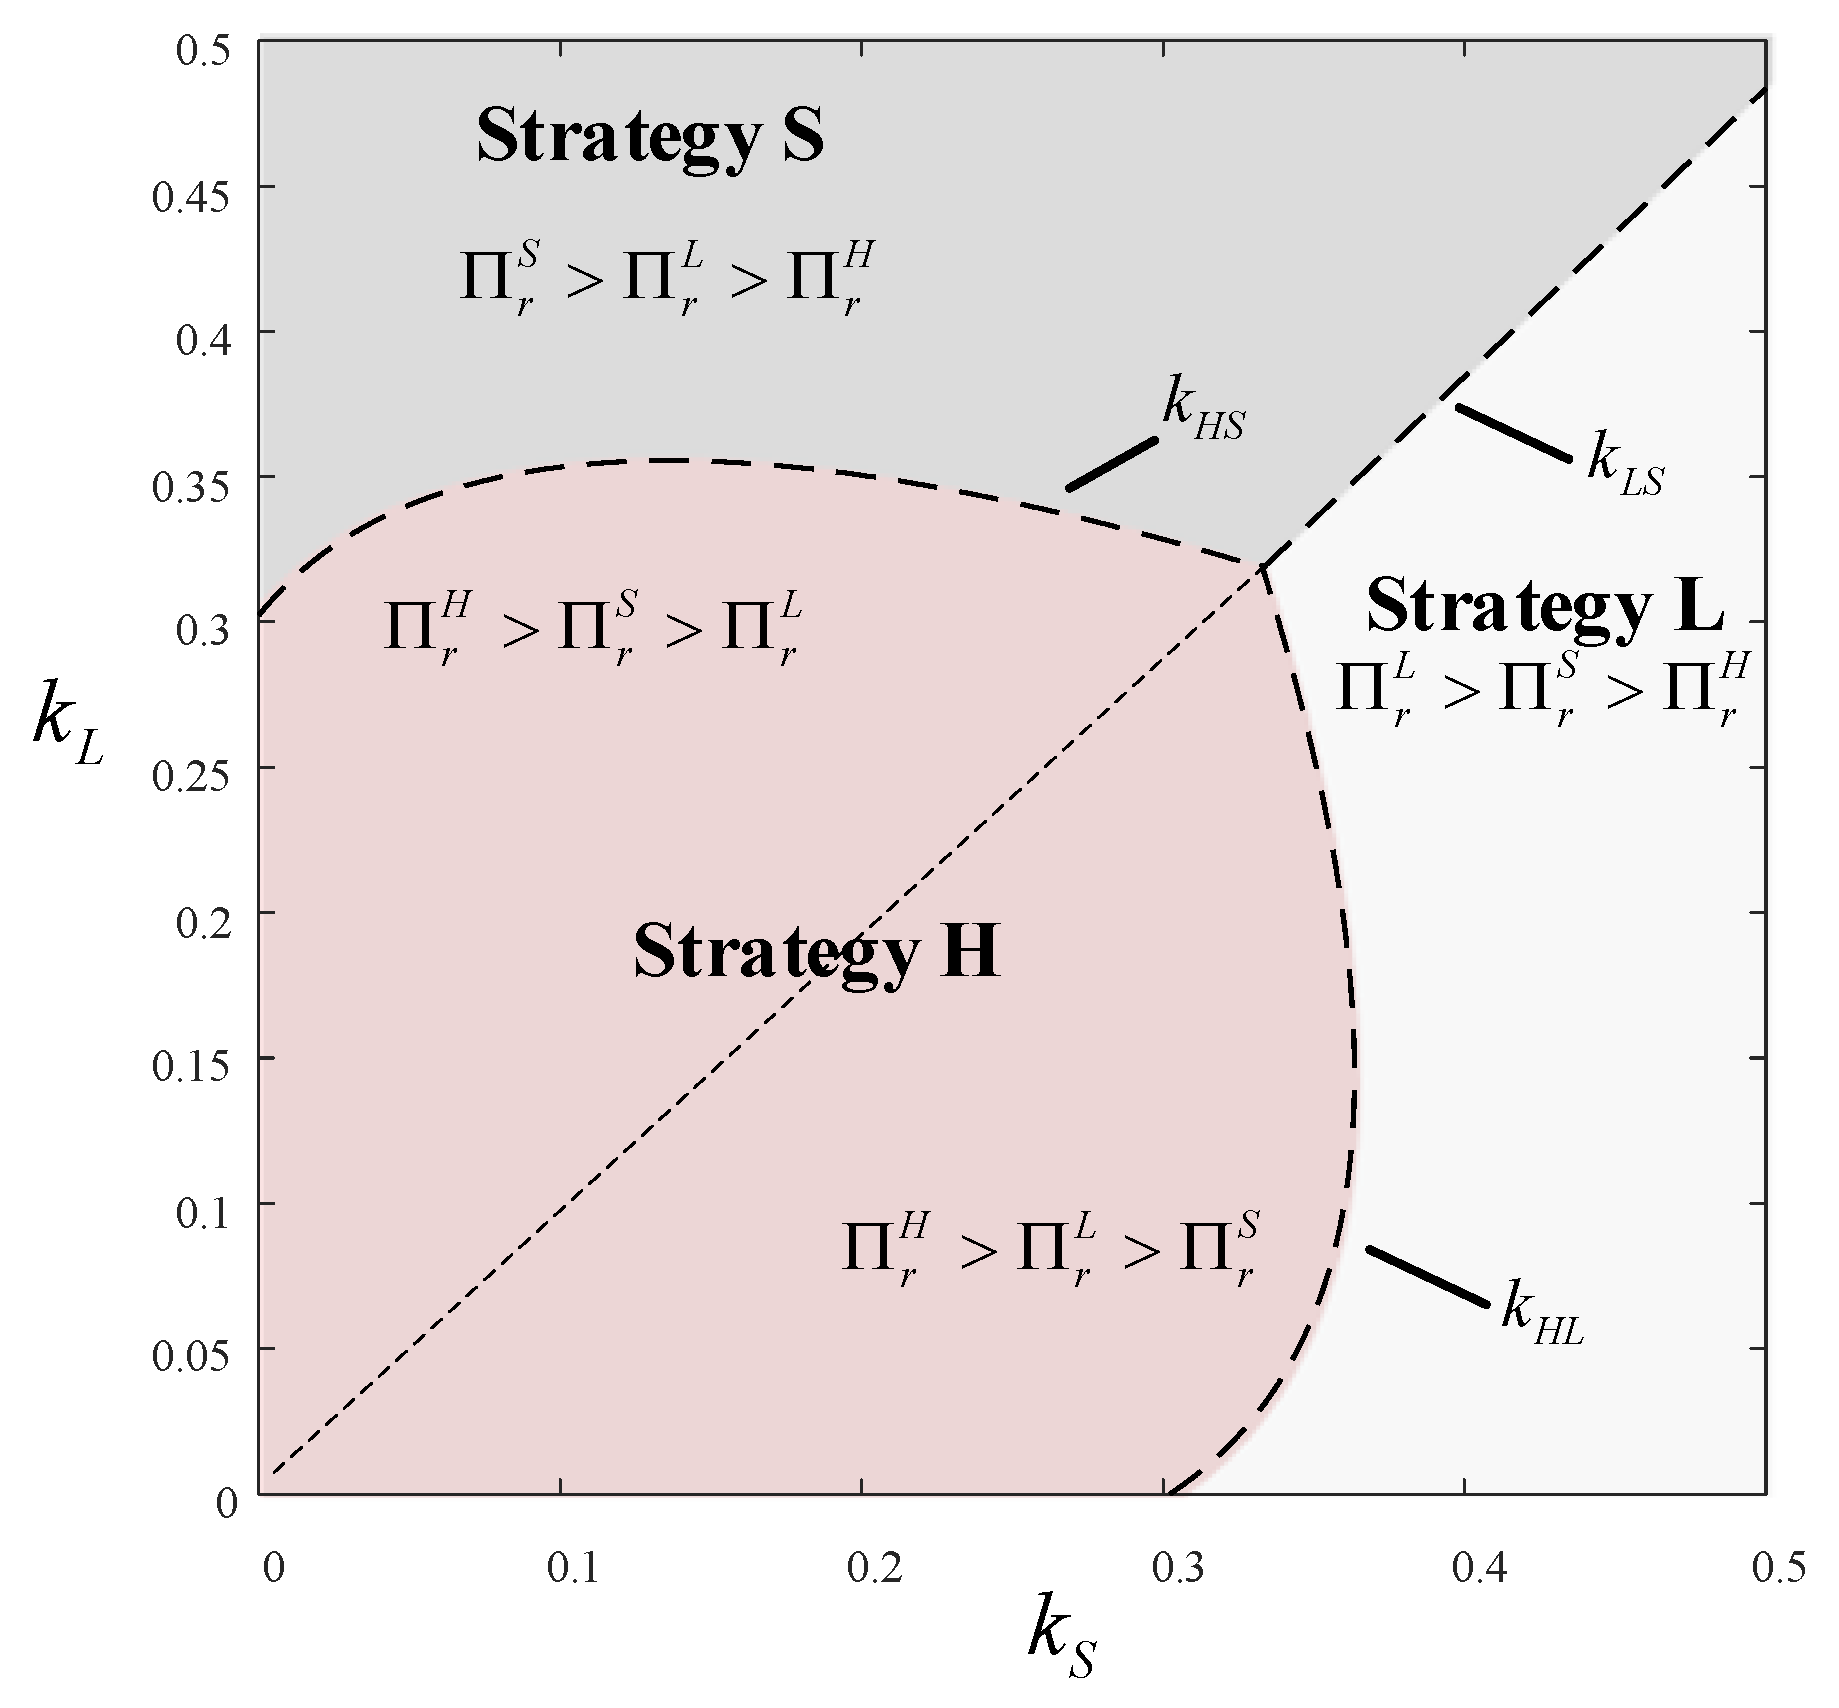
Figure 1. Selection of the retailer’s comprehensive equilibrium strategies ( T = 0 ).
Mathematics 13 02675 g001
Figure 2. Selection of the retailer’s comprehensive equilibrium strategies ( T 0 ).
Mathematics 13 02675 g002
Figure 3. Comparison results of consumer surplus ( β = 0.15 ,   θ = 0.16 ,   Q = 10 ,   f = 0.15 ).
Mathematics 13 02675 g003
Figure 4. Comparison results of social welfare ( β = 0.15 ,   θ = 0.16 ,   Q = 10 ,   f = 0.15 ).
Mathematics 13 02675 g004
Figure 5. Impact of fan quantity on the retailer’s optimal strategic choices.
Mathematics 13 02675 g005
Table 1. Differences between our work and the related research work.
StudySVMLSMDual-ChannelInfluencer Contract DesignCost StructureDemand FormCompetitive Setting
Wang et al. [15]××××Nonlinear×
Chen et al. [42]××Commission + slotting feeLinear×
Lu et al. [17]××Commission + slotting feeStochasticDual-channel competition
Wang et al. [44]×Commission×Dual-channel competition
Lu et al. [34]××CommissionStochasticDual-channel competition
He et al. [14]××Commission + slotting feeLinearDual-channel competition
Lei et al. [45]××××LinearCo-opetition
Zhang et al. [12]××Commission + slotting feeLinear×
Yang et al. [46]××Commission + slotting feeNonlinear demand×
Our work×Commission + slotting feeNonlinear×
Table 2. Basic symbols.
SymbolMeaning
Decision variables
p Sales price of a retailer’s product
α Number of short videos, measured as the total count obtained from the platform’s backend data
s Promotional effort of LSM, measured as the proportion of time spent on product demonstrations
Parameters
Q Potential market size
f Production cost per unit of short video
θ Sensitivity coefficient of consumers to SVM
β Sensitivity coefficient of consumers to LSM
k S Commission rate for SVM
k L Commission rate for LSM
k H = k L + k S Mixed commission rate
T Slotting fee
Superscripts
SShort video strategy
LLive streaming strategy
HHybrid strategy
Subscripts
rRetailer
mMCN
Disclaimer/Publisher’s Note: The statements, opinions and data contained in all publications are solely those of the individual author(s) and contributor(s) and not of MDPI and/or the editor(s). MDPI and/or the editor(s) disclaim responsibility for any injury to people or property resulting from any ideas, methods, instructions or products referred to in the content.