Article

Probabilistic Analysis of Shield Tunnel Responses to Surface Surcharge Considering Subgrade Nonlinearity and Variability

1
School of Civil Engineering, Central South University, Changsha 410075, China
2
School of Civil Engineering, Sun-Yatsen University, Guangzhou 510275, China
*
Author to whom correspondence should be addressed.
Mathematics 2025, 13(16), 2620; https://doi.org/10.3390/math13162620
Submission received: 19 June 2025 / Revised: 28 July 2025 / Accepted: 2 August 2025 / Published: 15 August 2025

Abstract

Accidental surface surcharge will generate additional load in the stratum, which then leads to unfavorable impacts on the underlying shield tunnel. This paper proposes a probabilistic analysis method to address this problem. In this framework, an improved soil–tunnel interaction model considering the nonlinearity of the subgrade is established at first, and the Newton–Raphson iterative solution algorithm is employed to acquire tunnel responses. Then, the random field models of the initial stiffness and the ultimate reaction of the subgrade are constructed to realize the spatial variability of soil properties. Finally, with the aid of the Monte Carlo Simulation method, the probabilistic analyses on tunnel responses are performed by combining the improved soil–tunnel interaction model and the random field model of subgrade parameters. The applicability and the superiority of the improved soil–tunnel interaction model are validated by a historical case from Shanghai Metro Line 9. The results prove that the traditional linear foundation model will overestimate the bearing capacity of the subgrade, thereby leading to overly optimistic assessments of surcharge-induced tunnel responses. This shortcoming could be addressed by the improved nonlinear soil–tunnel interaction model. The influences of spatial variability of soil properties on tunnel responses are nonnegligible. The stronger the uncertainties of subgrade parameters, in terms of the initial stiffness and the ultimate reaction concerned in this work, the higher the failure risk of the shield tunnel subjected to the surcharge. The failure modes of the tunnel subjected to the surcharge are controlled by the longitudinal curvature radius of the tunnel within the current assessment criteria, which means if this evaluation indicator can be restricted within the allowable value, then the opening of the circumferential joint and the longitudinal settlement can also meet the requirements. Compared with the influences of the uncertainty of the subgrade ultimate reaction, the spatial variability of the subgrade initial stiffness has greater influences on tunnel failure risk under the same conditions. An increase in the range of surcharge will raise the risk of tunnel failure, while the influence of tunnel burial depth is just the opposite.

1. Introduction

The shield tunnel is the major component of the urban rail transit, and its safety is closely related to the reliability and the serviceability of the rail transit system [1,2,3]. However, due to the enormous commercial value along the metro lines, more and more engineering activities frequently occur in the vicinity of in-service metro shield tunnels [4,5,6]. According to statistics on the number of recorded tunnel accidents, the engineering activity most threatening to the existing metro tunnels is the accidental surcharge on the ground surface caused by dumped soil without permission [7]. The accidental surcharge will inevitably disrupt the equilibrium state between the stratum and the tunnel, and produce new additional loads acting on the existing tunnels [8]. As a slender structure with numerous circumferential joints, the shield tunnel is highly prone to suffering from longitudinal deformations, including uneven settlement and joint opening under the additional load generated by the accidental surcharge. Once the induced deformations exceed the thresholds, a series of serious defects such as cracking of the segments and failure of joint waterproofing performance will occur, threatening the safety of the tunnel structure and the rail transit operation [3]. In the face of the in-depth development of the underground space, the risks of the existing metro tunnels subjected to adjacent accidental surcharge may be more significant [9]. Therefore, it is an extremely urgent task to conduct a reliable assessment on the safety risks of the existing shield tunnels subjected to accidental surcharge. This is conducive to improving the emergency responses system upon the urban rail transit in sudden situations.
In the last decades, many efforts have been devoted to investigating the influence of surcharge loading on the existing shield tunnels via various approaches, such as in-site measurements [10,11,12], model tests in the laboratory [13,14,15,16,17], numerical simulations [18,19,20], simplified theoretical analysis [21,22,23,24,25,26], etc. Among these methods, when the conditions of the investigated case are changed, such as the acting range of the surcharge, soil properties, tunnel geometry, etc., the results obtained by the model tests or numerical simulations cannot be directly applied to quantitatively evaluate the surcharge-induced tunnel responses in new scenarios [27]. At this time, the advantages of the simplified theoretical method are manifested. It can rapidly quantify the tunnel responses caused by accidental surcharge and effectively evaluate the associated risks without being constrained by the aforementioned factors. Therefore, the theoretical research on the mechanical behavior of existing shield tunnels suffering from accidental surface surcharge has attracted much attention over the years.
The intrinsic mechanism underlying the tunnel responses induced by surcharge can be explained by the surcharge generating the additional stress within the stratum, thereby leading to soil–tunnel interaction under the addition load. Consequently, this problem is usually analytically solved by the widely used two-stage method [28]. In the first stage, the additional load in the stratum generated by the surcharge is evaluated using Boussinesq’s formulas by neglecting the existing tunnel. In the second stage, the shield tunnel is treated as a continuous or discontinuous beam resting on elastic foundations, and subjected to the additional load obtained in the first stage. Considering the differences of dealing with the soil–tunnel interaction and the shield tunnel modelling in the second stage, abundant analytical models have been developed. Typically, the shield tunnel is often simplified as a longitudinal equivalent continuous model (LECM) or a longitudinal beam-spring model (LBSM) [29,30]. In the LECM, the shield tunnel is treated as a continuous beam with reduced rigidity to account for the impact of the circumferential joint between the adjacent two segmental rings. In the LBSM, the segmental linings and the circumferential joints are modeled using a series of uniform beam elements and connecting springs, respectively. Comparing with the LBSM, the LECM offers advantages such as a clear conceptual framework, simplified computation, and well-established methodologies for determining key parameters (i.e., the longitudinal equivalent stiffness of shield tunnels). With appropriately selected parameter values, this model can yield reasonably accurate results, and therefore it has been widely adopted in the analysis of longitudinal mechanical behavior in shield tunneling [29]. Meanwhile, in these developed analytical models of surcharge-induced tunnel responses, the soil–tunnel interaction is usually described using various elastic foundation models, such as the classical Winkler model [22], Pasternak model [24], and Vlasov model [26,31]. Among them, the well-known Winkler foundation model has gained widespread acceptance by the virtue of its fascinating mathematical clarity [32].
Although considerable progress has been made in addressing the response issues of existing shield tunnels affected by surface surcharge, particularly in the development of theoretical models, some deficiencies remain that require immediate attention and improvement. On the one hand, the mechanical behavior of soil mass exhibits significant nonlinearity [27]; however, it is usually simplified using the linear elastic hypothesis in the existing achievements. Currently, the nonlinear analysis of soil–structure interaction has been involved in the fields of passive piles [33] and soil–pipeline interaction [34], while it remains insufficiently developed in the mechanical analysis of shield tunnels subjected to surface surcharge. Validated through the centrifuge tests of soil–pipeline interaction, the nonlinear model proved more accurate than traditional linear approaches [35]. It is evident that incorporating the nonlinear characteristics of the foundation into the soil–tunnel interaction analysis under surcharge loading represents a critical and indispensable approach to improving the robustness and applicability of the associated theoretical models.
On the other hand, the longitudinal length of the shield tunnel typically spans from hundreds to thousands of meters, leading to significant variations in the geological model along the tunnel’s longitudinal direction [36]. Meanwhile, it is widely acknowledged in the geotechnical community that soil exhibits pronounced spatially variable properties [37,38]. Furthermore, it has been demonstrated that the influence of the inherent spatial variability of soil properties on geotechnical engineering structures, such as tunnels, is non-negligible [32,39]. Nevertheless, the previous works upon the problem of existing shield tunnels subjected to surface surcharge are generally conducted within a deterministic framework, which failed to consider the inherent spatial variability of soil properties. The widespread uncertainty factors represented by spatial soil variability in geotechnical engineering serve as the intrinsic driving force for probabilistic analysis and risk management in this field [40]. Deterministic analysis ignoring these uncertainties may fail to capture the true failure mechanisms of existing shield tunnels under surcharge loading. Consequently, accounting for the inherent variability of foundation parameters, it is imperative to investigate the response of existing shield tunnels under surcharge loading from a probabilistic risk analysis perspective.
The objective of this paper is to propose a probabilistic analysis framework for assessing the failure risk of shield tunnels subjected to surface surcharge loading. The organizational structure of this paper is as follows: First, a deterministic model is developed to predict the tunnel responses induced by surface surcharge, incorporating both the nonlinearity and variability of soil behavior into the analytical model. Second, random field models are employed to characterize the spatial variability of subgrade properties along the longitudinal direction of the tunnel. Subsequently, using the Monte Carlo Simulation (MCS) method, a probabilistic analysis framework is established to evaluate the risk of tunnel failure under surcharge loading by integrating the deterministic model and the random field representation of soil parameters. Finally, a series of probabilistic analyses are carried out based on an engineering case from Shanghai Metro Line 9.

2. Deterministic Model for Predicting Tunnel Responses

2.1. Statement of the Problem

The problem studied in this work is the influences of the surface surcharge on the longitudinal performance of an existing shield tunnel, as illustrated in Figure 1. For convenience, the surface surcharge is assumed as a uniform distributed load with an amplitude of q 0 , and the length and the width of the surcharge are L and B , respectively. The depth of the centerline of the existing shield tunnel is z 0 , and its outer diameter is D t . Meanwhile, for facilitating presentation, the global and local Cartesian coordinate systems are established, which locate at the existing shield tunnel and the surface surcharge, respectively, as shown in Figure 1. The origin of the local coordinate system is established at the center of the rectangular surcharge, the x -axis and y -axis are parallel to the direction of the length and width of the surcharge, and the z -axis is determined by the right-hand rule and is pointing downward. In the global coordinate system, the coordinate origin locates at the center of the existing shield tunnel, the x-axis is parallel to the centerline of the tunnel, the y-axis is perpendicular to the x-axis, and the z-axis is determined by the right-hand rule and is parallel to the z -axis of the local coordinate system. The relative position of the surface surcharge and the existing shield tunnel is described as the parameters α , β , and d , as shown in Figure 1b.
The two-stage analysis method is employed herein to solve the investigated problem; the specific steps are as follows. First, the surcharge-induced additional load in the greenfield is evaluated by the classical Boussinesq’s solution. Then, the additional load is imposed on the existing shield tunnel to obtain the longitudinal deformation and internal forces of the existing shield tunnel.
As illustrated in Figure 1, the additional load acting on the shield tunnel generated by the surface surcharge can be determined by
q x = B 2 B 2 L 2 L 2 3 q 0 z 0 3 2 π R 5 d x d y
R = x c o s α + d c o s β x 2 + x s i n α + d s i n β y 2 + z 0 2
where α denotes the angle between the x -axis and x -axis, β is the angle between the x -axis and the line of O O , and d is the projection distance between the origins of global and local coordinate systems.

2.2. Improved Soil–Tunnel Interaction Model

To obtain the mechanical responses of the existing shield tunnel induced by the surface surcharge, an improved soil–tunnel interaction model is established, as illustrated in Figure 2. In the mechanical model, the shield tunnel is simplified as a continuous beam, and the Euler–Bernoulli beam is employed to mainly capture the bending deformation characteristics of the tunnel. In particular, a series of nonlinear foundation springs with varying parameters along the longitudinal direction of the tunnel are utilized to model the soil–tunnel interaction; thereby, the nonlinearity and spatial variability of the subgrade are considered.
According to the research achievements in the field of pipe–soil interaction and pile–soil interaction, a hyperbolic relationship between the subgrade deformation and reaction is employed to model the nonlinear soil–tunnel interaction in this study. It is expressed as
p = w 1 k i n i + w p u
where p represents the subgrade reaction, w denotes the subgrade deformation (represents the tunnel deformation as well, owing to the assumption of deformation compatibility between the soil and tunnel), and k i n i and p u are the initial stiffness and the ultimate reaction of the subgrade, respectively. Obviously, the nonlinear foundation model will degrade to the classical Winkler foundation model if the ultimate reaction of the subgrade is treated to be infinite, i.e., p = k w .
Based on the Euler–Bernoulli beam theory, the relationships between the tunnel deformations and internal forces can be given by
M = E I e q d 2 w d x 2
Q = E I e q d 3 w d x 3
where M and Q represent the bending moment and shear force on the section of the tunnel; and E I e q denotes the longitudinal equivalent bending stiffness of the shield tunnel.
The following equilibrium equations can be determined by the force analysis on the micro element of the calculation model shown in Figure 2, such that
Q + d Q + q D t d x = Q + p D t d x
M + Q d x + p D t d x 2 2 = M + d M + q D t d x 2 2
Combining Equations (2)–(4), the governing differential equation for the tunnel deflection w ( x ) can be determined as
E I e q d 4 w d x 4 + D t w 1 k i n i + w p u = D t q

2.3. Solution of the Analytical Model

The governing equation of the calculation model, Equation (8), is a fourth-order nonhomogeneous differential equation including nonlinear terms, which is difficult to solve analytically. Thus, the Newton–Raphson iteration method combining with the finite difference method is adopted to this equation numerically. The discretization of the shield tunnel is illustrated in Figure 3, where the tunnel is divided into n + 5 elements with a length of l e , including extra four virtual elements at the two ends of the tunnel.
Based on the principle of the central difference method, Equation (8) can be transformed to the finite difference form as
E I e q w i 2 4 w i 1 + 6 w i 4 w i + 1 + w i + 2 l e 4 + D t w i 1 k i n i , i + w i p u , i = D t q i
where w i denotes the tunnel deflection at the i -th node and i = 0 , , n ; k i , i and p u , i represent the initial stiffness and ultimate reaction of the subgrade at node i , respectively; and q i is the additional load acting on the tunnel at node i .
There are only n + 1 equations can be generated by Equation (9), while the number of total unknown arguments is n + 5 . Thus, the other four equations will be supplemented by the boundary conditions. In this work, the two ends of the tunnel are supposed to be free. Thus, the bending moment and shear force at the ends of the tunnel can be given by
M 0 = M n = 0
Q 0 = Q n = 0
Rewriting Equations (4) and (5) in finite difference form and substituting Equations (10) and (11) into that, the boundary conditions can be expressed as
M 0 = E I e q w 1 2 w 0 + w 1 l e 2 = 0 M n = E I e q w n 1 2 w n + w n + 1 l e 2 = 0
Q 0 = E I e q w 2 2 w 1 + 2 w 1 w 2 2 l e 3 = 0 Q n = E I e q w n 2 2 w n 1 + 2 w n + 1 w n + 2 2 l e 3 = 0
Decoupling the above equations, the tunnel deflection at the four extra virtual nodes can be obtained by
w 2 = 4 w 0 4 w 1 + w 2 w 1 = 2 w 0 w 1 w n + 1 = 2 w n w n 1 w n + 2 = 4 w n 4 w n 1 + w n 2
Substituting Equation (14) into Equation (9), and assembling the finite difference equations, a matrix equation about the tunnel deflections can be determined by
K b w + f p w = q
where K b is defined as the bending stiffness matrix of the shield tunnel; f p w is defined as a vector of subgrade nonlinear deformation; q is a vector including the additional load at every node; and w is the displacement vector along the longitudinal direction of the tunnel. The specific expressions of the abovementioned matrix and vectors are given by
K b = E I e q l e 4 2 4 2         2 5 4 1       1 4 6 4 1             1 4 6 4 1       1 4 5 2         2 4 2 n + 1 × n + 1
w = w 0 w 1 w i w n 1 w n T
f p w = D t p 0 p 1 p i p n 1 p n T
f p w = D t q 0 q 1 q i q n 1 q n T
where p i = w i 1 k i n i , i + w i p u , i .
To solve the nonlinear equation, Equation (15), the Newton–Raphson iterative method is employed. By introducing a nonlinear matrix function F ( w ) , it is defined by
F w = K b w + f p w
Thus, Equation (15) can be rewritten as
F w = q
It is assumed that the nodal displacements w j are known in the j -th iteration. According to the first-order Taylor series of the nonlinear function F w , the following equation can be determined:
F w j + 1 F w j + K J j Δ w j = q
where K J j denotes the Jacobian matrix of F w , and is defined by
K J j = F w j / w j
Substituting Equation (20) into Equation (23), K J can be given as
K J = K b + K f
where K f is written as follows:
K f = D t d f p , 0               d f p , 1                             d f p , i                             d f p , n 1               d f p , n n + 1 × n + 1
Note that
d f p , i = 1 1 k i n i , i + w i p u , i w i p u , i 1 k i n i , i + w i p u , i 2
Equation (22) can be rewritten as
K J j Δ w j = q F w j
The increment of nodal displacements in the j -th iteration, Δ w j , can be obtained by solving Equation (27). Thus, the nodal displacements in the j + 1 -th iteration, w j + 1 , can be given by
w j + 1 = w j + Δ w j
After that, the residual of the nodal force in the j + 1 -th iteration, R j + 1 , can be obtained by
R j + 1 = q F w j + 1
Repeating the above processes and stopping the iteration until the residual of the nodal force is smaller than the allowed tolerance. The convergence criterion of the iteration can be determined by the ratio of nodal force residual and external load, such that
ε N R = i = 1 N n o d R i j + 1 2 1 + i = 1 N n o d q i j + 1 2 < ε t o l
where the subscript i and the superscript j represent the node number and the iteration times, respectively; N n o d is the number of total nodes of the tunnel; and ε t o l is the allowed tolerance.
Based on the above mathematical equations, the specific flow for calculating the tunnel responses of the tunnel induced by surcharge is described as follows:
(1)
Determine the related parameters, such as L , B , q 0 , α , β , d , k i , p u , and E I e q ;
(2)
Determine the calculation domain and evaluate the additional load induced by surface surcharge using Equations (1) and (2);
(3)
Set initial approximations of nodal displacements, i.e., w = w 0 , and for convenience, the initial condition of the iteration can be set as w 0 = 0 ;
(4)
Calculate the nonlinear function F ( w ) and its Jacobian matrix using K J Equations (20) and (24), respectively;
(5)
Solve the increment of nodal displacements Δ w using Equation (27);
(6)
Substitute Δ w into Equation (28) and obtain the initial values of nodal displacements in the next iteration;
(7)
Evaluate the nodal force residual and the iterative error using Equations (29) and (30), respectively;
(8)
If the iterative error ε N R is smaller than the allowed tolerance ε t o l (e.g., ε t o l = 1.0 × 10 6 ), the obtained values of w in the current iteration step are considered to be the tunnel deformation induced by the surcharge. If not, steps (4) to (7) should be repeated until the convergence criterion is reached.

2.4. Recommendation for Related Parameters

2.4.1. Subgrade Parameters

Considering the shield tunnel is buried at a certain depth below the ground surface, the method suggested by Attewell et al. [41] is adopted to determine the initial stiffness of the subgrade underlying the shield tunnel, such that
k i n i = 1.3 E s D t 1 ν s 2 E s D t 4 E I e q 12
where E s and ν s are the elastic modulus and Poisson’s ratio of the soil, respectively.
Based on the suggestion of the American Lifelines Alliance, when the pipeline moves downward, the ultimate reaction of the subgrade can be evaluated by
q u = N c c + N q γ H p + N γ γ D p 2
where c is the cohesion of soil; γ and γ are natural weight and effective weight of soil, respectively; H p and D p are the buried depth and the diameter of the pipeline; and N c , N q and N γ are bearing capacity factors, and are, respectively, given by
N c = cot ϕ + 0.001 e π tan ϕ + 0.001 tan 2 45 + ϕ + 0.001 2 1 N q = e π tan ϕ tan 2 45 + ϕ 2 N γ = e 0.18 ϕ 2.5
where ϕ represents the internal fraction angle of soil.

2.4.2. Longitudinal Equivalent Bending Stiffness of Shield Tunnels

The longitudinal equivalent bending stiffness of the shield tunnel can be determined by Shiba’s method [42], that is
E I e q = cos 3 φ cos φ + φ + π 2 sin φ E c I c φ + cot φ = π 1 2 + k r l s E c t
where φ denotes the position of the neutral axis of the cross section of the tunnel; E c is the elastic modulus of the segment concrete; I c is the inertia moment of the segmental lining; l s and t are the width and thickness of the segment, respectively; and k r = n E b A b / 2 π r l b denotes the average line stiffness of the bolt ring, where n is the number of bolts, E b , A b , and l b are the elastic modulus, area of cross section, and length of the bolt, respectively, and r is the distance between the center of the segmental lining and the bolt ring.
Furthermore, the opening of the circumferential joint of the shield tunnel Δ and the curvature radius of the longitudinal deformation r c can be respectively evaluated by
Δ = M l s E I e q D t 2 + r s i n φ
r c = E I e q M

3. Probabilistic Analysis Method

3.1. Random Field Model of Subgrade Variability

The spatial variability of soil properties is usually described by the random field theory. In this theory, the parameters of soil in arbitrary position are treated as random variables following some kinds of probabilistic distributions, and which are restricted by the introduced concepts of correlation function, scale of fluctuation, etc.
In this work, a nonlinear Winkler foundation is introduced to describe the soil–tunnel interaction, as shown in Figure 2. The key parameters of soil involved in this foundation model are k i n i and p u . Thus, in this section, the random field models for the two key parameters are established to describe the spatial variability of one. It is noted that the correlation between soil parameters is not concerned in this work; therefore, the independent random fields of k i n i and p u are established, respectively.
Based on the central limit theorem, the lognormal distribution could be regarded as a limit distribution form resulting from the accumulation of large uncertain factors, which is consistent with the forming process of the rock and soil mass [32,39]. Meanwhile, the random variables produced by lognormal distribution are strictly non-negative, which is also consistent with the statistical characteristics of soil parameters. Given these considerations, it is considered that the initial stiffness k i n i and the ultimate reaction p u of the subgrade underlying the tunnel are followed by lognormal distribution in this work. The random fields of the two subgrade parameters along the longitudinal direction of the tunnel are given by
H m x = exp μ ln m + σ ln m G ln m x m = k i n i , p u
where x denotes the spatial position along the longitudinal direction of the tunnel; G ln m x is a standard Gaussian random field of the target soil parameter; μ ln m and σ ln m are mean value and standard deviation of the normal random variable ln m , respectively, and are expressed by
σ ln m = ln 1 + σ m 2 μ m 2 = ln 1 + c o v m 2 μ ln m = ln μ m 1 2 σ ln m 2
where μ m , σ m , and c o v m represent the mean values, standard deviations, and coefficients of variation of k i n i and p u , respectively.
In the random field model, the correlation of soil parameters at two arbitrary spatial points is defined by the autocorrelation function. In this work, the single exponential function is selected to evaluate the correlations of the initial stiffness and the ultimate reaction of subgrade along the longitudinal direction of the tunnel. For a one-dimensional problem investigated herein, the selected autocorrelation function reads
ρ x i , x j = exp 2 x i x j θ x
where x i and x j denote the spatial positions along the longitudinal direction of the tunnel; and θ x is the horizontal autocorrelation distance of the target soil parameter.
To combine with the established random field and the finite difference solution of the calculation model, the random field H m should be discretized firstly. The efficient Karhunen–Loève expansion (KLE) technique is employed to discretize the random field.

3.2. Reliability Evaluation Based on Monte Carlo Method

The Monte Carlo simulation (MCS) method is a most robust reliability analysis method. Although this method requires a large number of computations, the mathematical formula is relatively simple, and regardless of the complexity of the model, it has the ability to handle almost all possible situations.
In order to evaluate the tunnel responses induced by the surface surcharge within a probabilistic framework, the performance functions of the shield tunnel should be established first. In this work, the longitudinal settlement of the tunnel, the opening of the circumferential joint, and the curvature radius of the tunnel are selected as the evaluating indicators, which reflect the response characteristics of the whole tunnel and the circumferential joint, respectively. Based on the two indicators, the performance functions of the shield tunnel are defined by
G 1 = w a w m a x G 2 = Δ a Δ m a x G 3 = r c , m i n r c , a
where G i   i = 1 , 2 , 3 represents the performance functions corresponding to different indicators; w a , Δ a , and r c , a are the allowed deformation thresholds of the longitudinal settlement, joint opening, and curvature radius of the tunnel, respectively; w m a x , Δ m a x , and r c , m i n are the maximum or minimum values corresponding to the two indicators.
The allowable deformation thresholds of the shield tunnel are listed in Table 1, referring to related standards and existing works. Based on the defined performance functions of the tunnel, the failure probability P f of the tunnel can be further calculated by
P f , i = 1 N M C S m = 1 N M C S H G i i = 1 ,   2,3
where N M C S is the total number of samples for performing MCS; H G i = 1 for G i < 0 and H G i = 0 for G i 0 .
The coefficient of the failure probability is introduced to determine the number of Monte Carlo simulations, which is defined by
C O V P f = 1 P f N M C S P f
By increasing N M C S , C O V P f will converge with the speed of 1 / N M C S . Thus, the total number of Monte Carlo simulations can be determined by selecting an appropriate convergence criterion of C O V P f . In this work, the convergence criterion is set to C O V P f = 0.05 .

3.3. Procedure of the Probabilistic Analysis Method

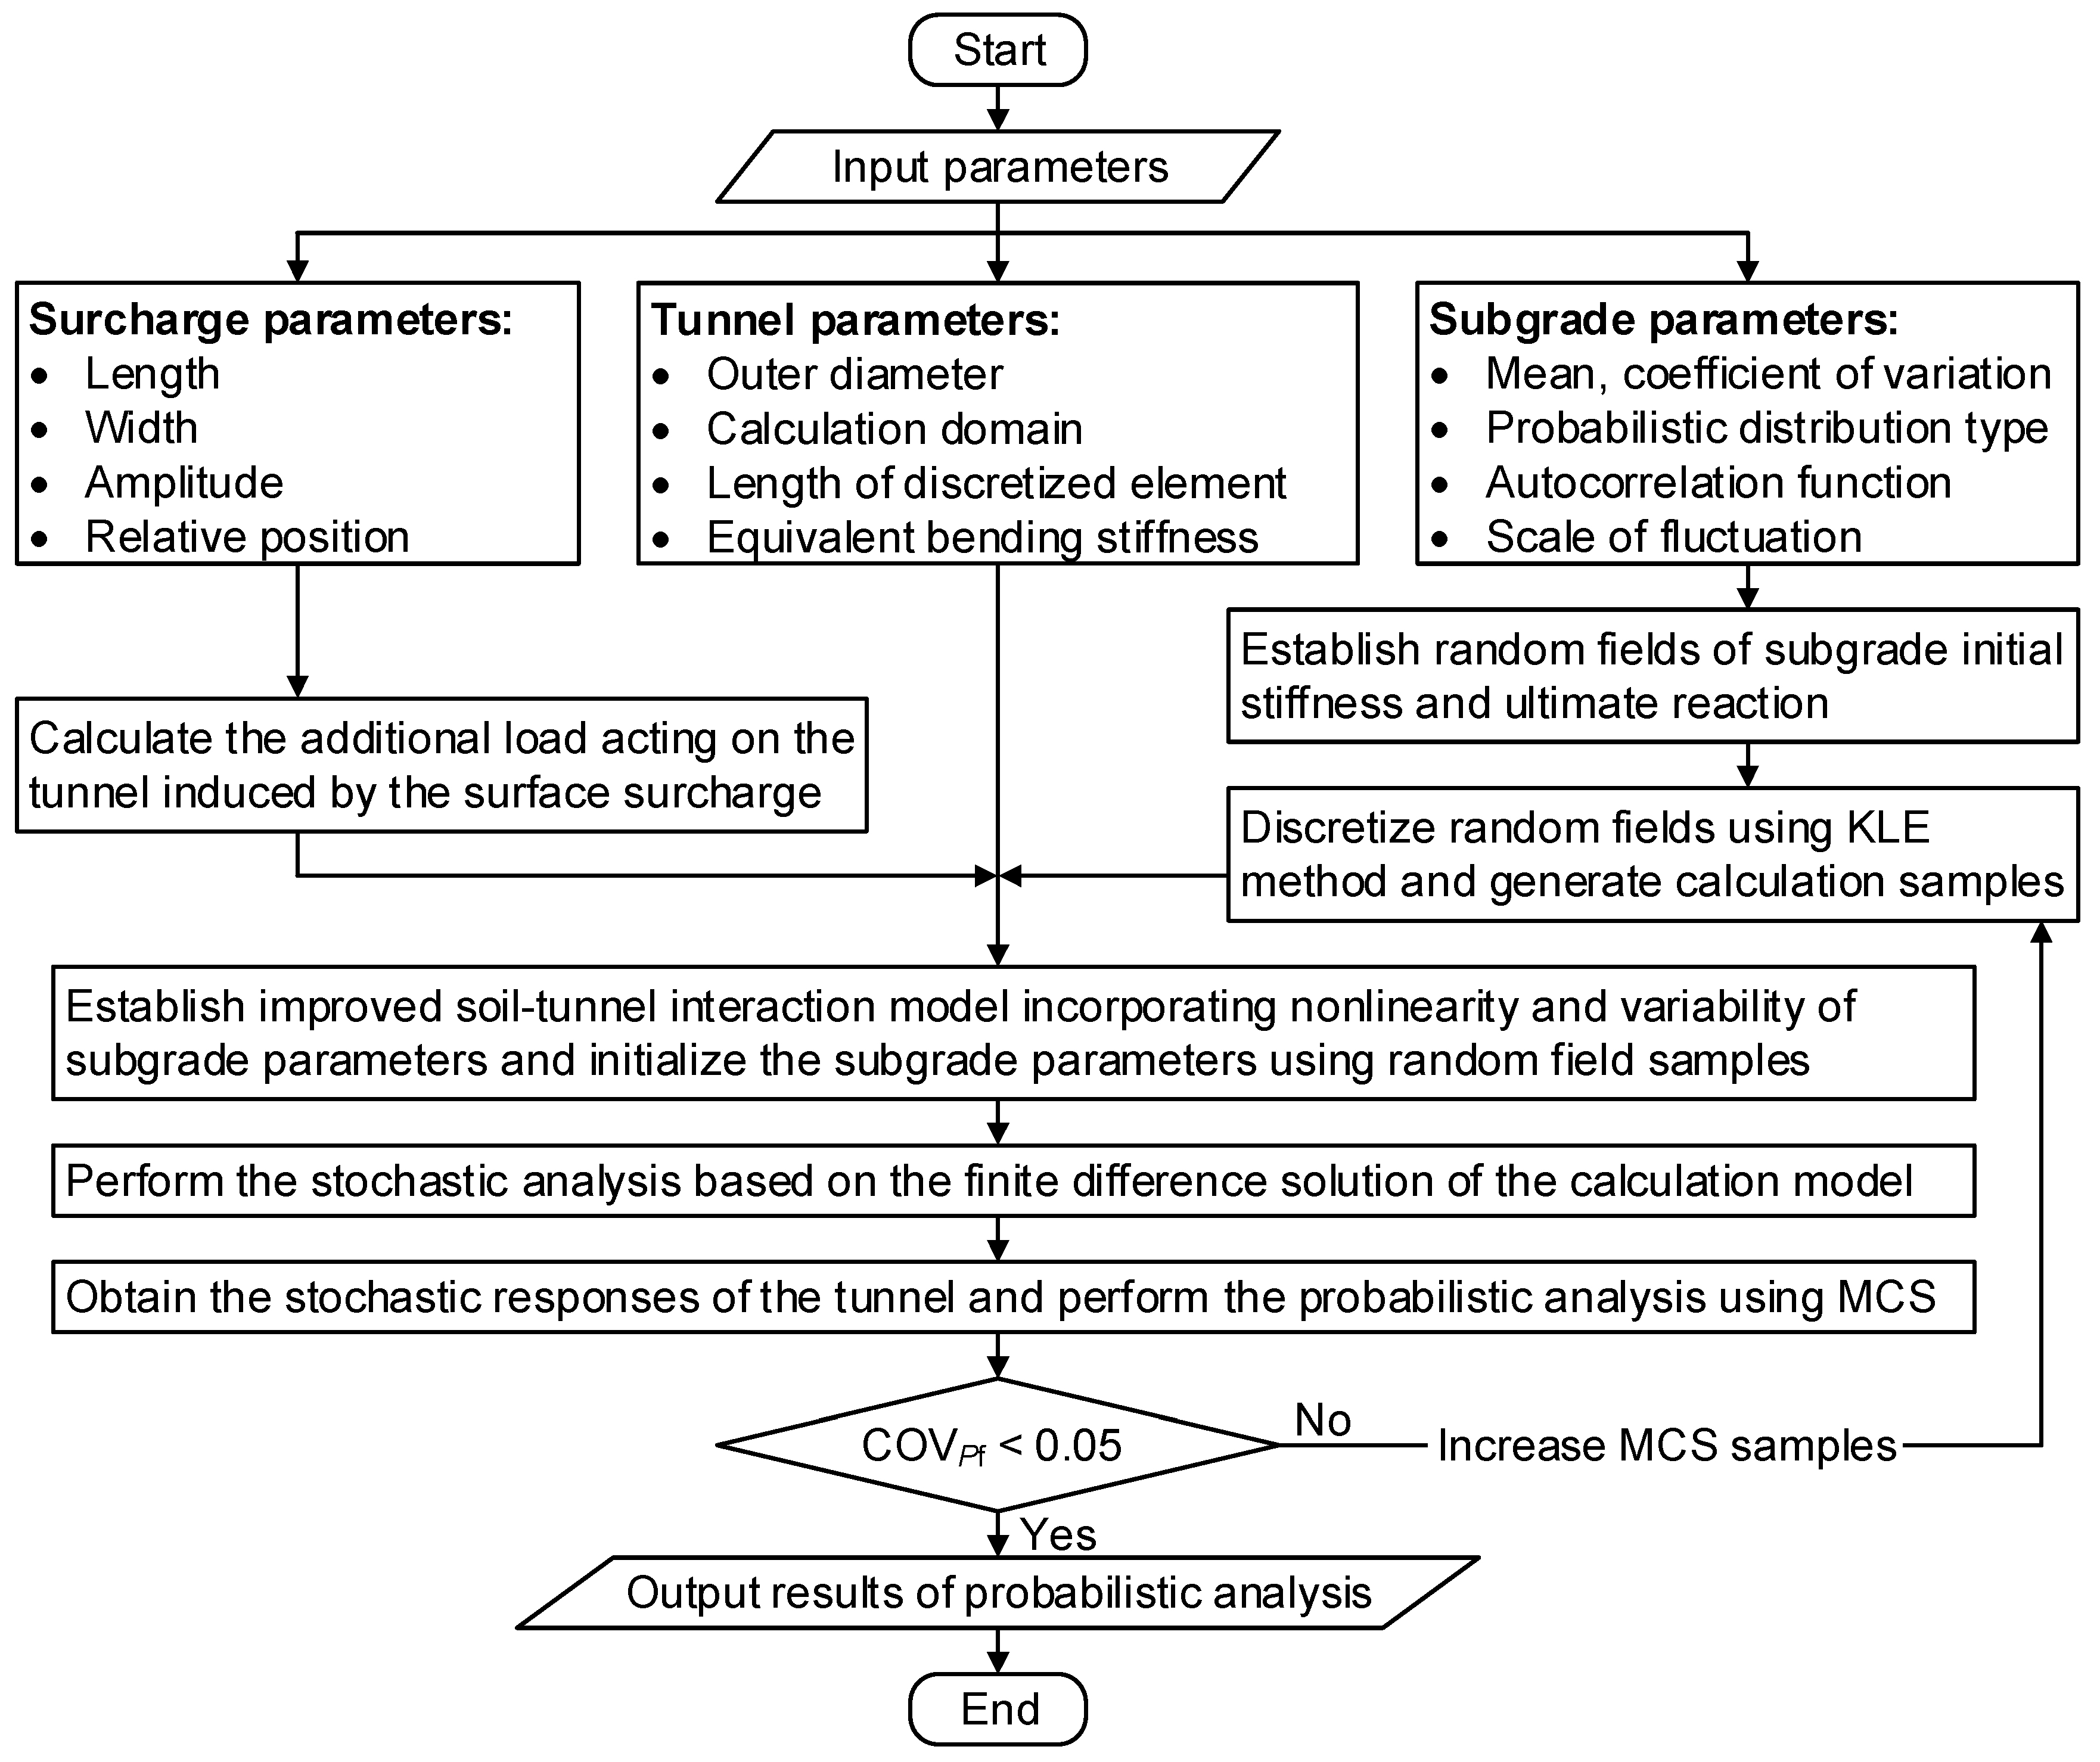
Combining the developed finite difference solution of the calculation model in Section 2.3 and the discretized random field model of subgrade parameters in Section 3.1, the random responses of the tunnel induced by the surface surcharge can be obtained by conducting stochastic calculations involving the uncertainty of subgrade parameters. Then, based on the stochastic calculation results, the probabilistic analysis on the tunnel responses can be further implemented using the Monte Carlo method presented in Section 3.2. The implementation procedure of the probabilistic analysis method is presented in Figure 4, and its main steps are outlined as follows:
Step 1: Determine the surface surcharge parameters and evaluate the additional load acting on the shield tunnel induced by the surface surcharge.
Step 2: Based on the basic parameters of the subgrade underlying the tunnel, construct random fields of the initial stiffness and the ultimate reaction of the subgrade. Then, discretize the established random fields of subgrade parameters using the KLE method, and generate MCS samples of subgrade parameters.
Step 3: Construct the improved soil–tunnel interaction model and initialize the subgrade parameters (initial stiffness and ultimate reaction) along the longitudinal direction of the tunnel using the discretized random fields samples.
Step 4: Perform stochastic computations using the finite difference solution of the soil–tunnel interaction model and conduct probabilistic analysis utilizing the stochastic computational results. Calculate the coefficient of variation of failure probability of the tunnel, and output analysis results if C O V P f < 0.05 , while increasing MCS samples and repeat Steps 2 and 3 if C O V P f 0.05 .

4. Illustrative Example

4.1. Presentation of the Investigated Case

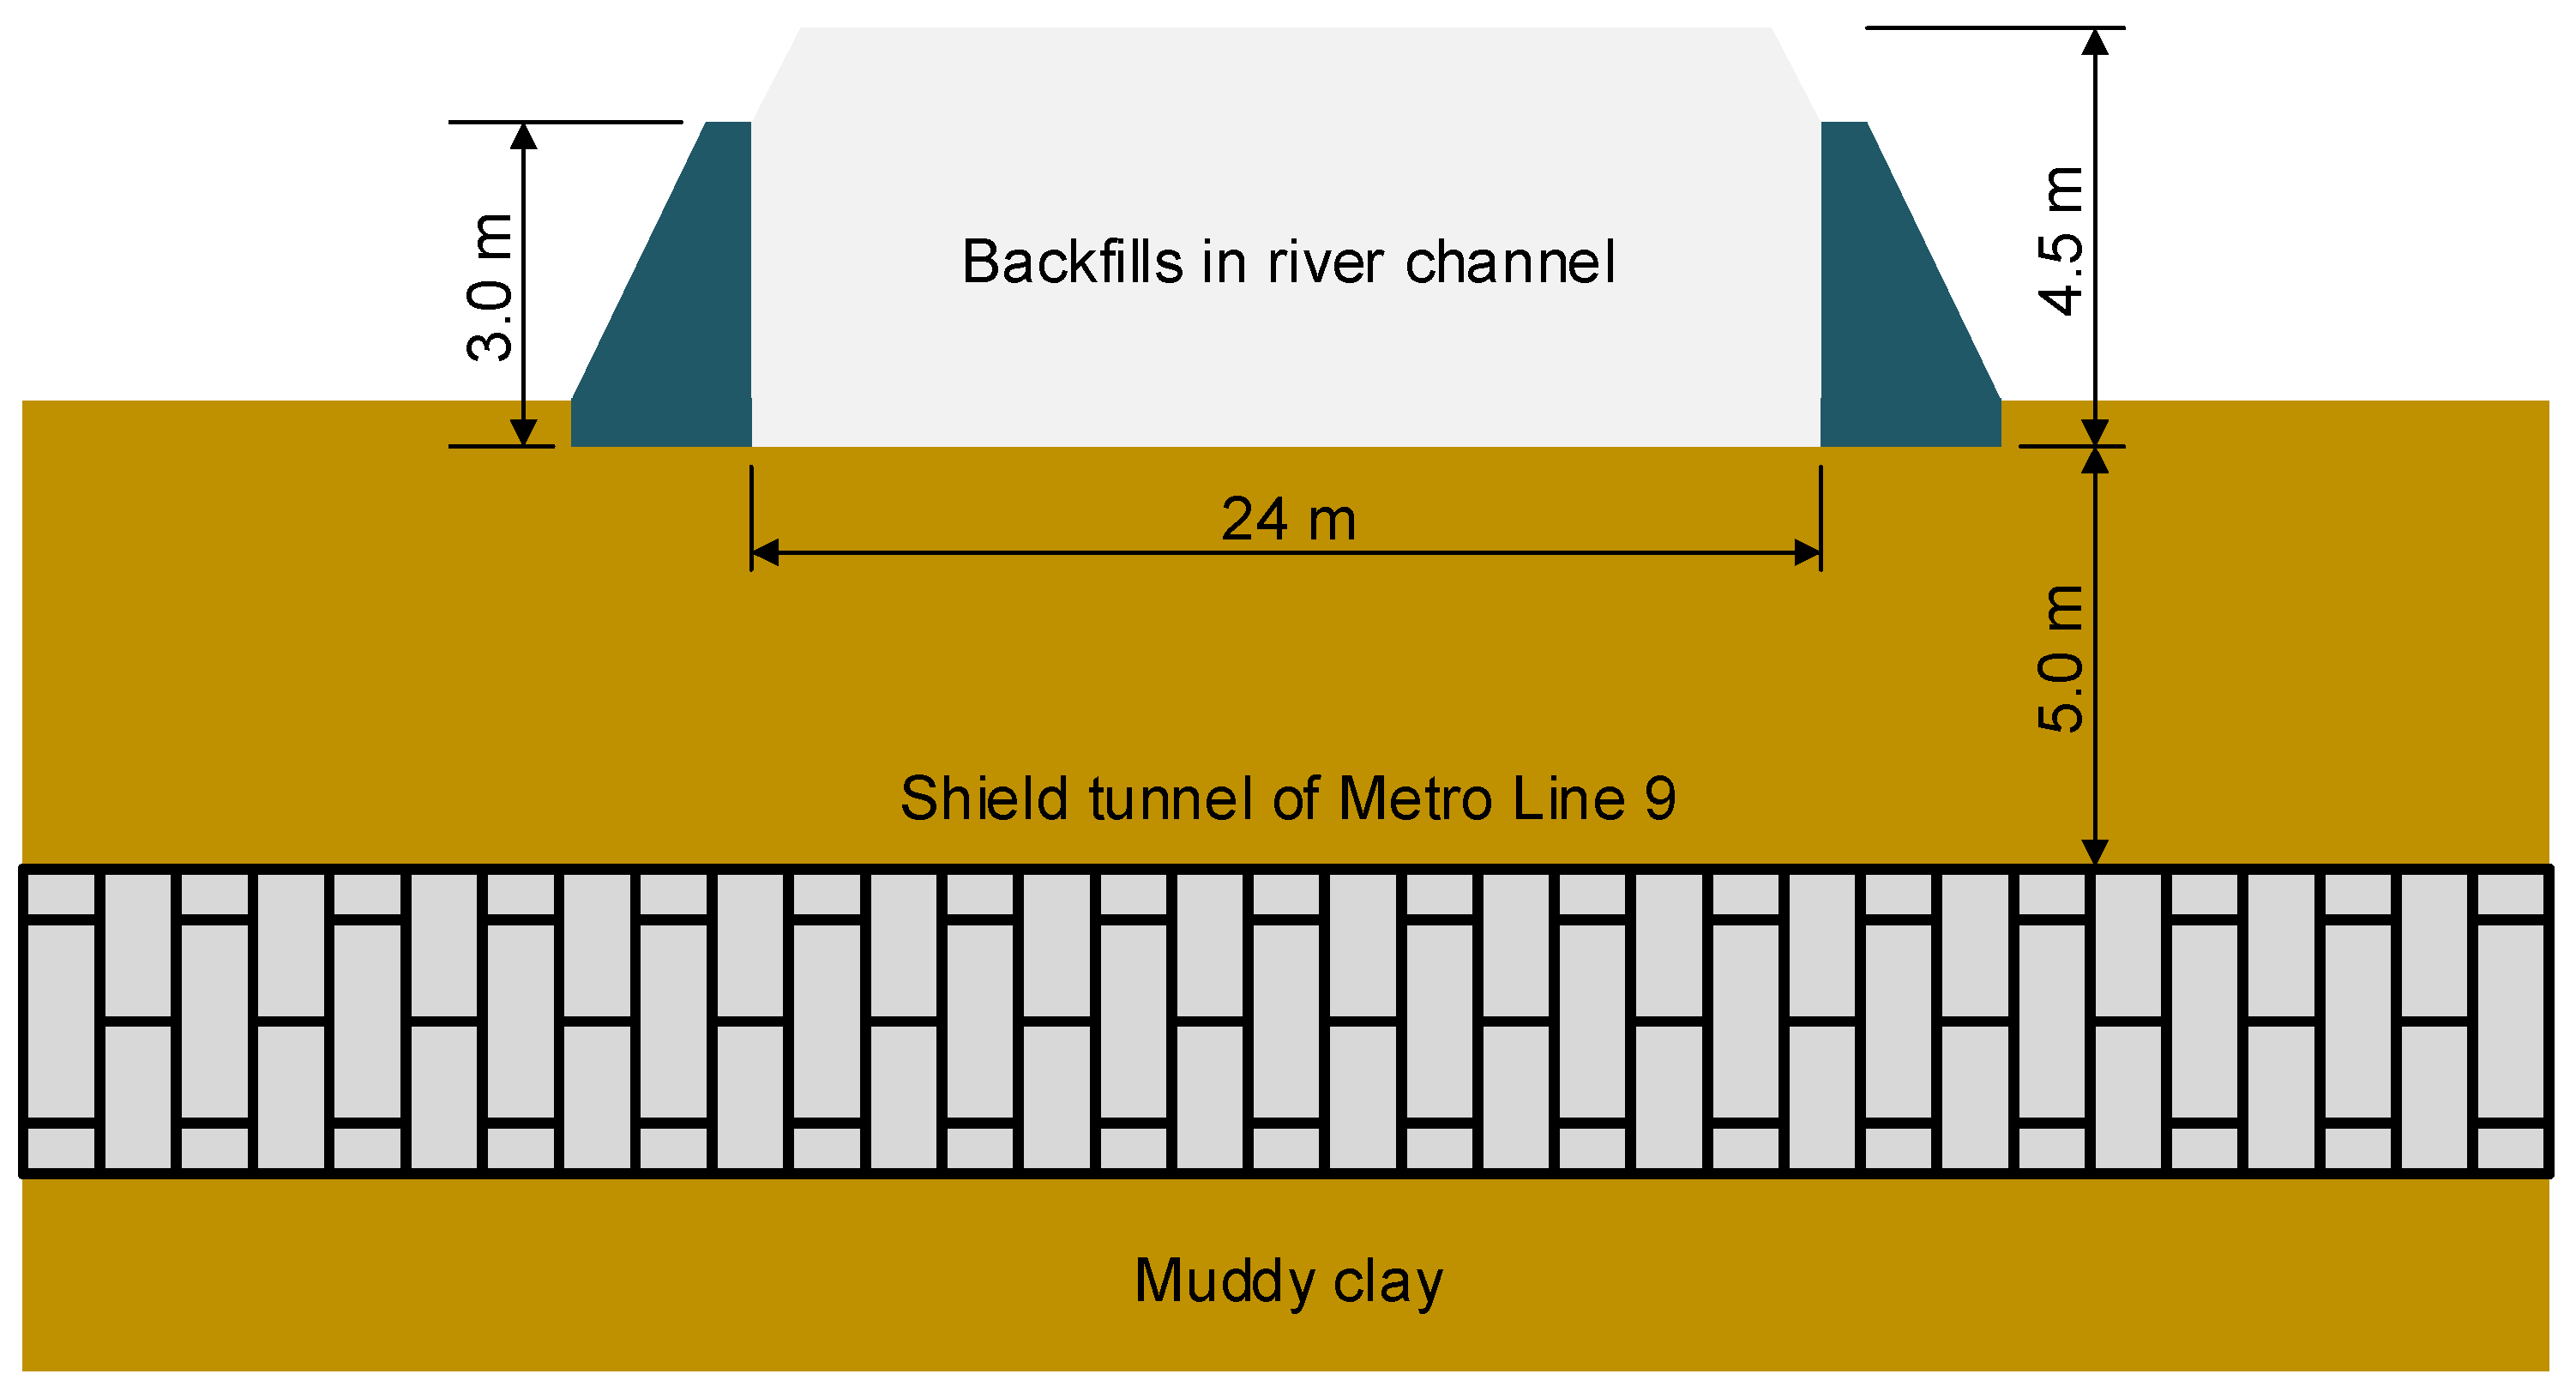
To demonstrate the proposed probabilistic analysis method, a historical case of a metro tunnel affected by the backfill soils is analyzed in this Section. This case has also been investigated by many scholars [21,22,23]. In this case, the shield tunnel of Shanghai Metro Line 9 experienced longitudinal differential settlement due to the river channel filling activities above the tunnel. The length and the width of the river channel are 100 m and 24 m, respectively. The depth of the river channel is 3.0 m while the height of the filling soil reaches 4.5 m, and the weight of backfills is about 17 kN/m3 [10]. The relative position of the river channel and the underlying shield tunnel is illustrated in Figure 5.
The clearance from the bottom of the backfill soil to the top of the tunnel is 5.0 m. The design parameters of the shield tunnel are listed in Table 2. According to Shiba’s method, the longitudinal equivalent bending stiffness of the shield tunnel is 7.8 × 10 7   k N m 2 . The shield tunnel primarily locates at the third soil layer, i.e., the muddy clay layer. The related parameters of the soil recommended by the Code for Investigation of Geotechnical Engineering (DGJ08-37-2012) are as follows: γ = 17.1 ~ 18.6   k N / m 3 , c = 8.5 ~ 14.2   k P a , and ϕ = 12.1 ° ~ 28 ° . Considering the redundancy of the assessment, the smaller values of these parameters are employed in calculations. The compression modulus of the soil is employed to evaluate its elastic modulus. According to the Code, the compression modulus of the third layer soil in Shanghai varies from 2.2 MPa to 5.97 MPa, corresponding to a coefficient of variation of 0.292. Thus, the elastic modulus of the third layer soft soil is considered as 12.3 MPa by experience, which is three times the average of its compression modulus. In addition, the Poisson’s ratio of the soil is set to 0.33. Based on these basic parameters of the soil, the initial stiffness and the ultimate reaction of the soil determined by Equations (26) and (27) are 2.56 × 10 3   k N / m 3 and 290 kPa, respectively.
As demonstrated in Equations (26) and (27), the variation of the initial stiffness of the subgrade is directly affected by that of the elastic modulus of the soil, while the variations of the soil’s cohesion and friction angle will directly influence the variation of the ultimate reaction of the subgrade. Therefore, in the following probabilistic analysis on the investigated case, the coefficients of variation of the initial stiffness and the ultimate reaction of the subgrade underlying the shield tunnel are set to 0.292 and 0.245 according to the Code, respectively. Meanwhile, based on the existing experiences, the scales of fluctuation of both of the two parameters are evaluated as 5 times of the tunnel diameter, i.e., θ x = 5 D t . The influences of the spatial variations of the subgrade initial stiffness and ultimate reaction will be carefully discussed later.

4.2. Probabilistic Analysis Results

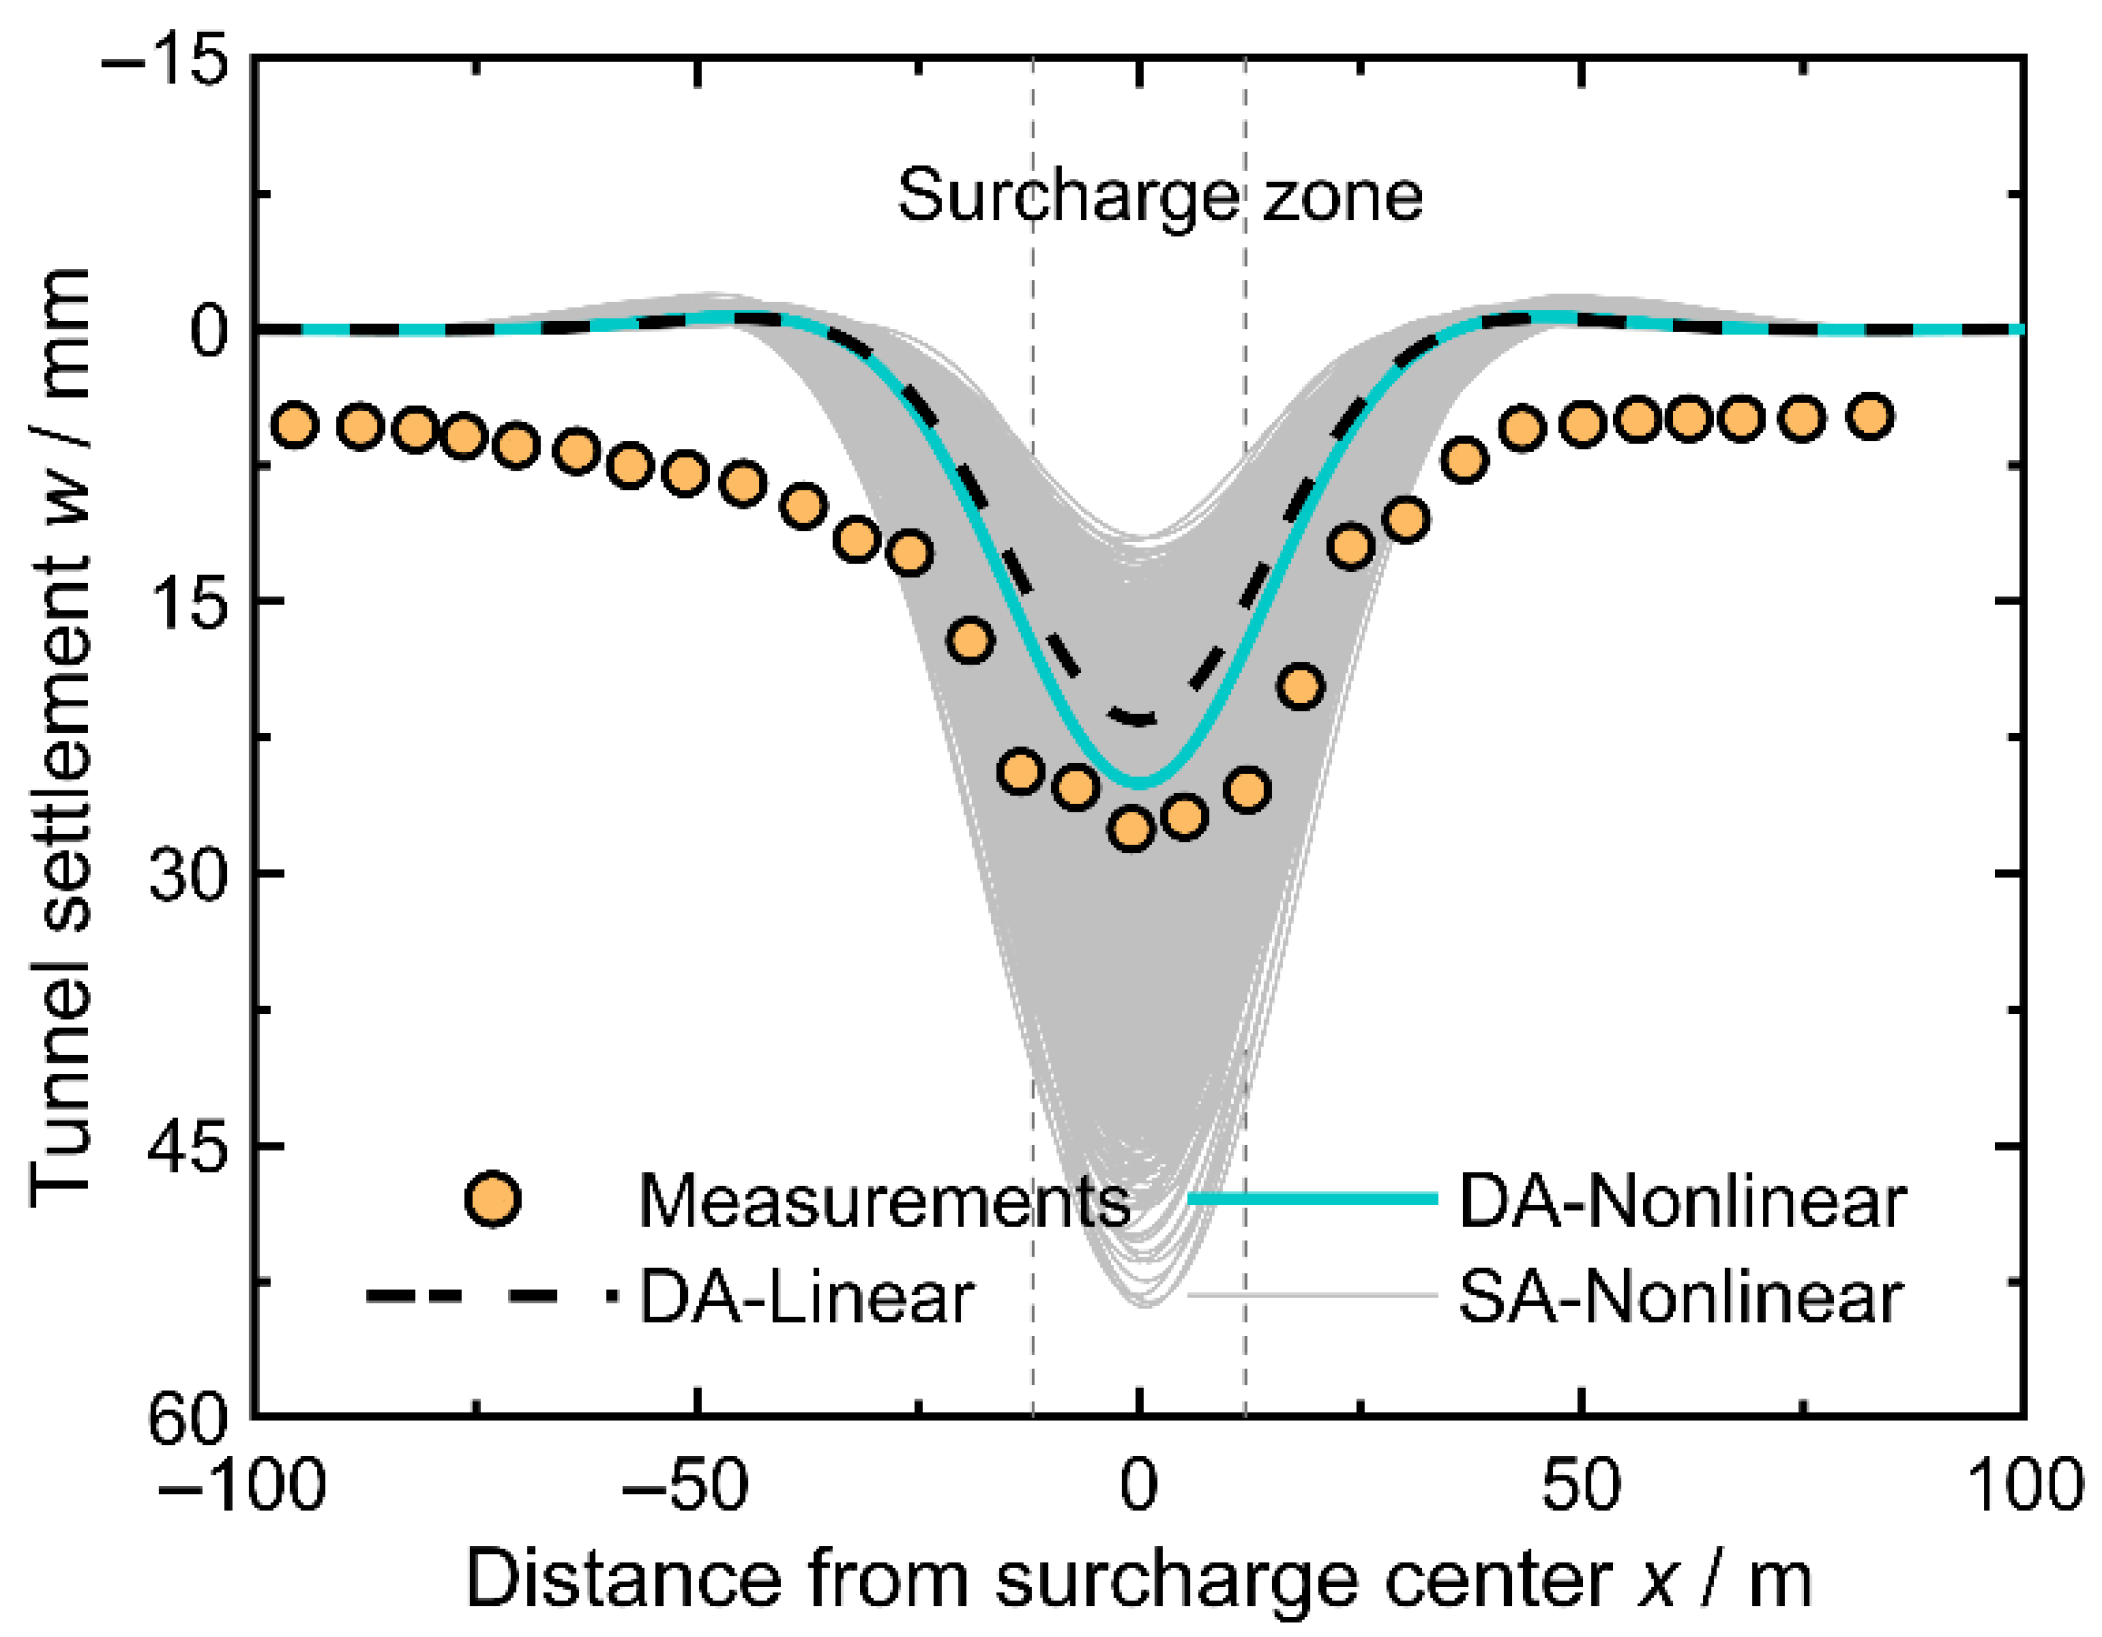
Figure 6 plots the longitudinal deformations of the shield tunnel obtained by measurement and different theoretical methods. In the figure, the cyan solid line and the black dashed line denote the deterministic analysis (DA) results using the nonlinear and linear subgrade models, respectively. The gray lines represent the stochastic analysis (SA) results with the proposed nonlinear model, which are generated by 10,000 random computations. As shown in the figure, the overlapping results from 10,000 random computations collectively contribute to the observed shading effect. The same legends apply to the following figures. During calculations, the proposed nonlinear model will easily degrade into a linear model when the ultimate reaction of the subgrade is set to infinity.
It is observed that the theoretical calculation results could capture the main characteristics of the tunnel longitudinal deformation induced by the surface surcharge. Both the monitoring data and the calculation results show that the settlement curves of the tunnel are approximately similar to the Gaussian curve, and the maximum settlement locates at the center of the surface surcharge. According to the calculation results, the maximum tunnel deformations predicted by the linear and nonlinear foundation models are 21.6 mm and 25.6 mm, respectively, yielding errors of 21.7% and 7.2% relative to the measured maximum deformation of 27.6 mm. Furthermore, across all monitoring points, the mean absolute error (MAE) and root mean square error (RMSE) between the predictions of the linear foundation model and the measured data are 7.2 and 7.5, respectively, whereas the corresponding values for the nonlinear foundation model are 6.6 and 6.8. These quantitative comparisons demonstrate that the proposed nonlinear foundation–tunnel interaction model offers higher computational accuracy and reliability compared to the linear model. It is proved that the DA results obtained by nonlinear foundation model yield closer agreement with the measurements than the linear foundation model. However, the DA results regardless of employing linear or nonlinear foundation models are relatively poor in providing the information of surcharge induced-tunnel deformations, especially at key positions adjacent to the loaded area. In contrast, SA incorporating soil uncertainty proves more effective in addressing this shortcoming. As shown in Figure 6, the monitoring data adjacent the loaded area are enveloped by the SA results based on the nonlinear foundation model. Meanwhile, both the potential influencing range of the surcharge and the deformation range of the tunnel can also be predicted by the SA results. The findings prove that the SA results can provide more robust predictions of tunnel responses. It is beneficial to making appropriate management decisions by using this effective information.
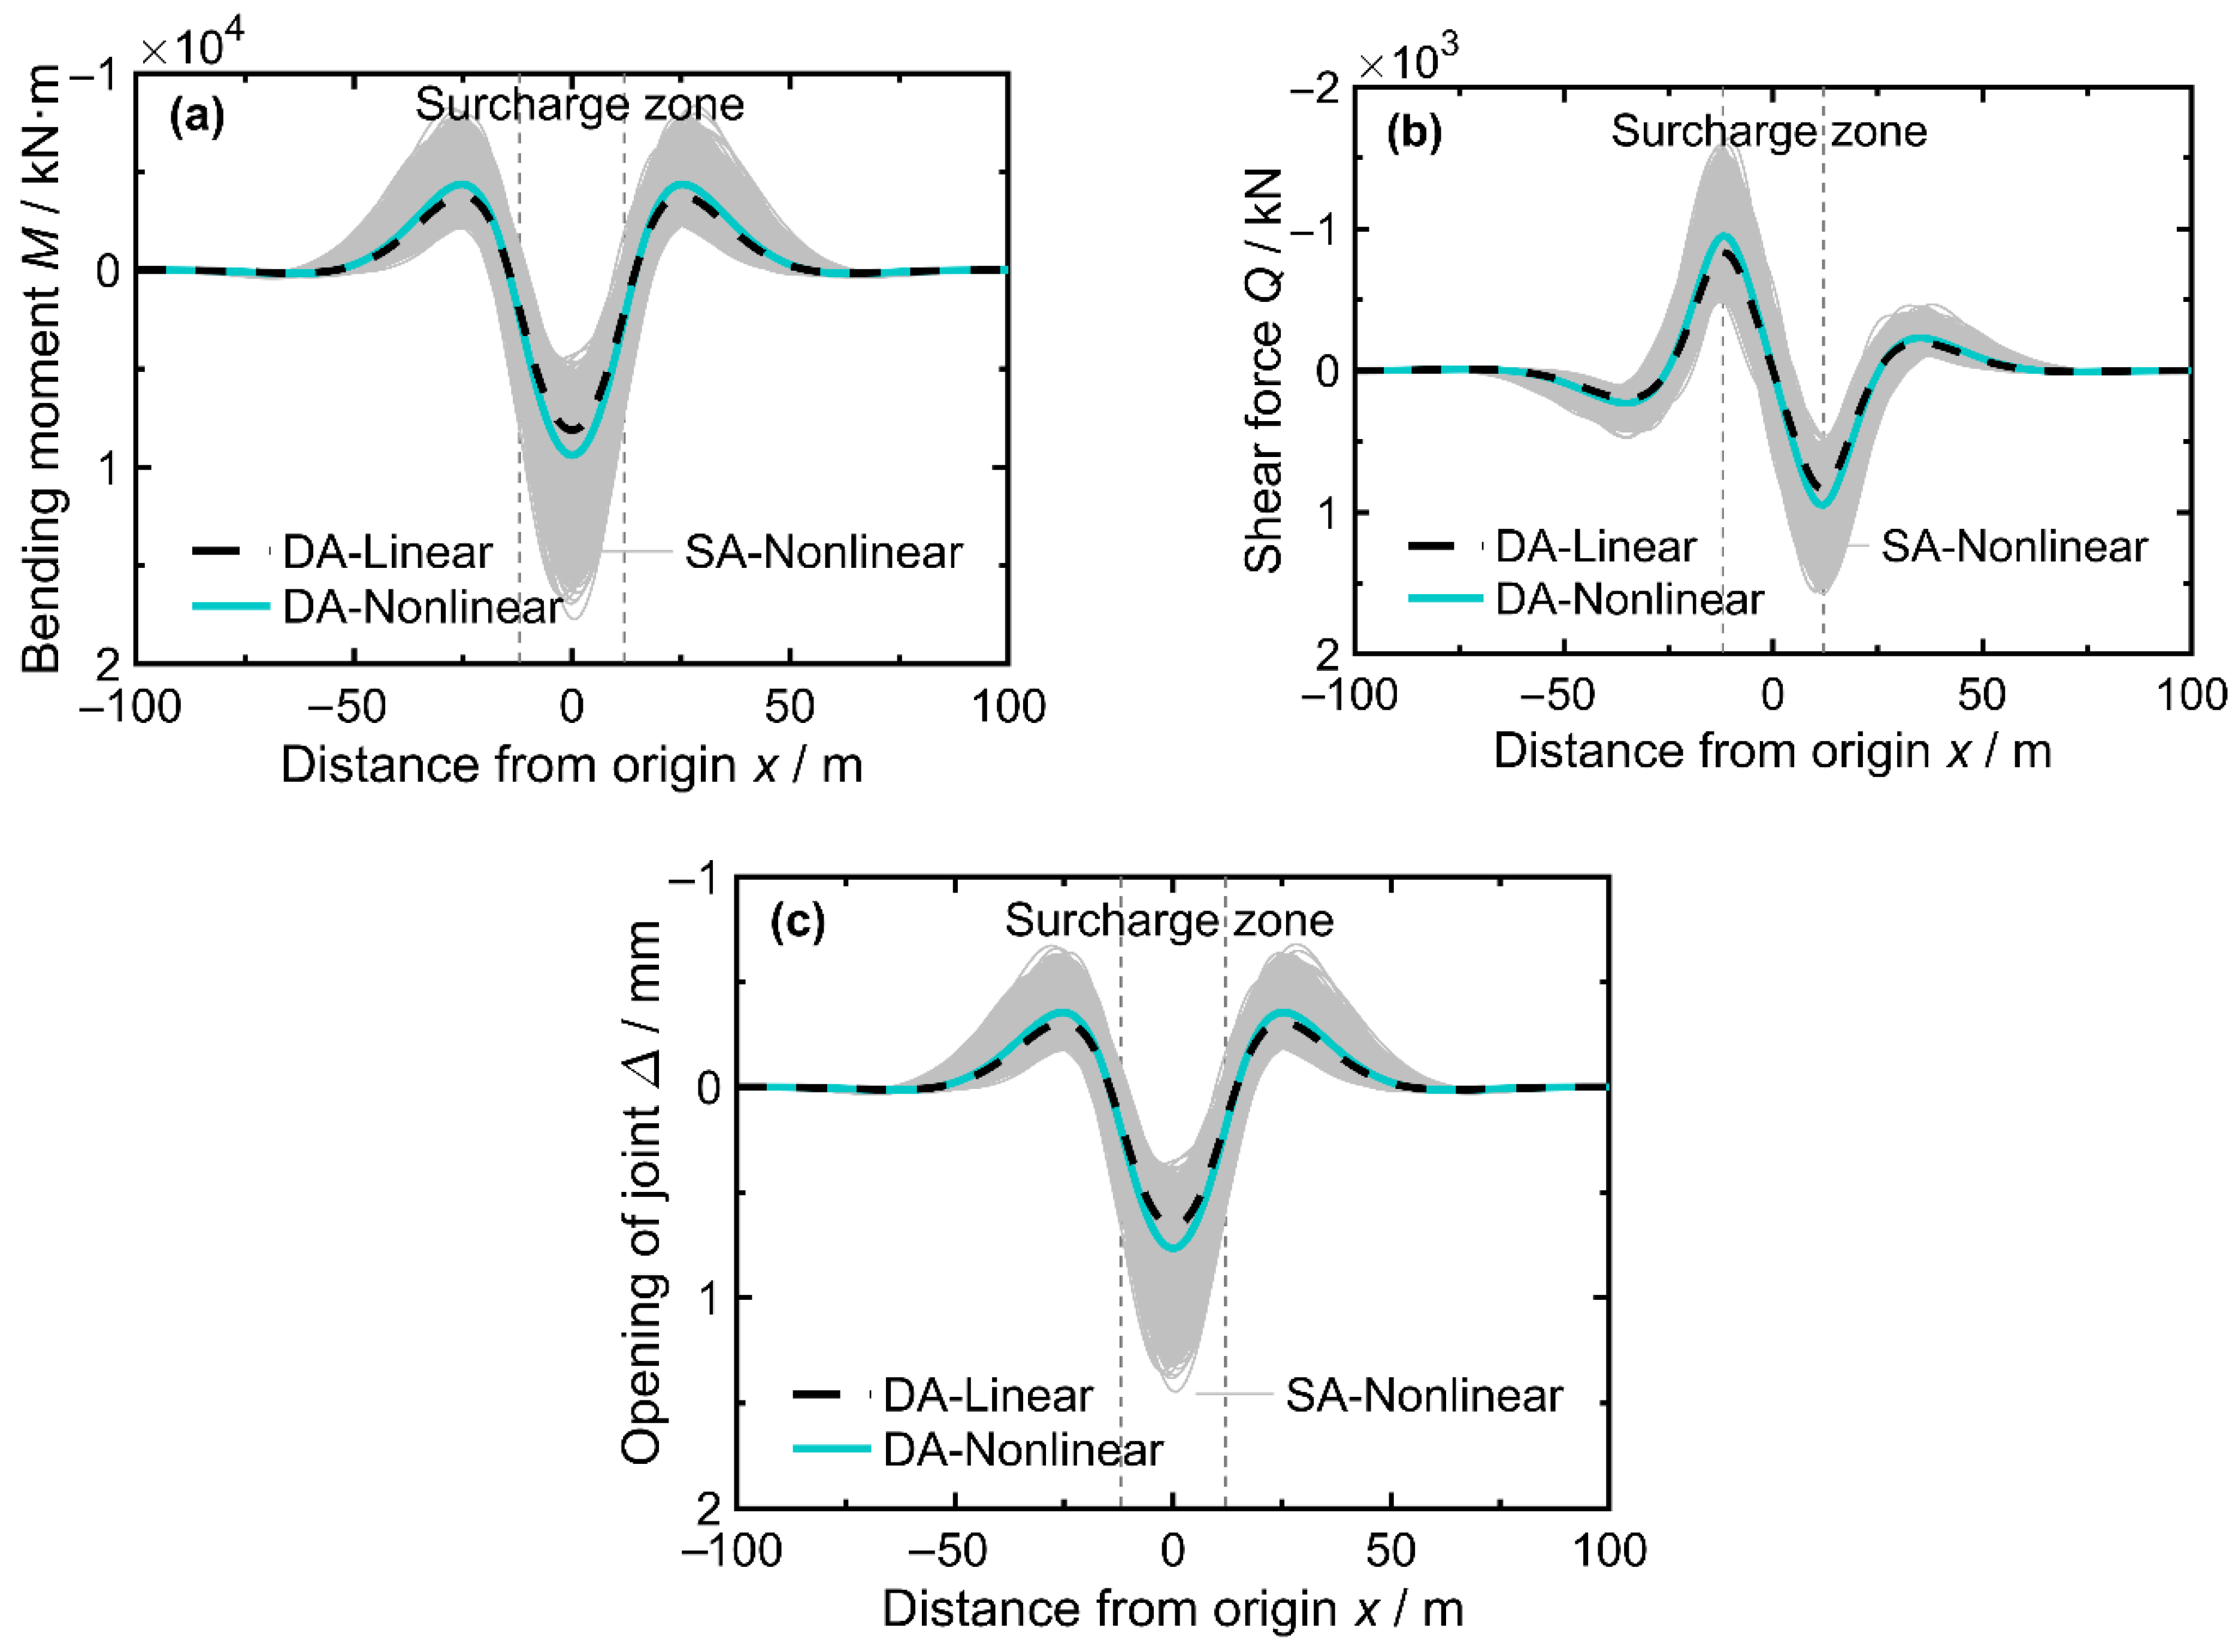
Figure 7 further shows the DA and SA results of the tunnel bending moment, shear force, and joint opening. According to the calculation results, the maximum bending moment, shear force of the tunnel, and the opening of the circumferential joint obtained by DA analysis with the linear model are 8.12 × 10 3   k N m , 833.00 kN, and 0.66 mm, respectively; while the corresponding results provided by the nonlinear model are 9.40 × 10 3   k N m , 949.33 kN, and 0.77 mm, respectively. It is observed that the linear foundation model will underestimate the surcharge-induced tunnel responses if the nonlinearity of soils is neglected. As illustrated in the figures, the DA results based on both linear and nonlinear foundation models are enveloped by the SA results. According to the SA results, the maximum bending moment of the tunnel varies from 4.53 × 10 3   k N m to 1.77 × 10 4   k N m ; the maximum shear varies from 555.78 kN to 1.64 × 10 3 kN; and the potential varying range of the maximum opening of the circumferential joint is 0.37~1.44 mm.
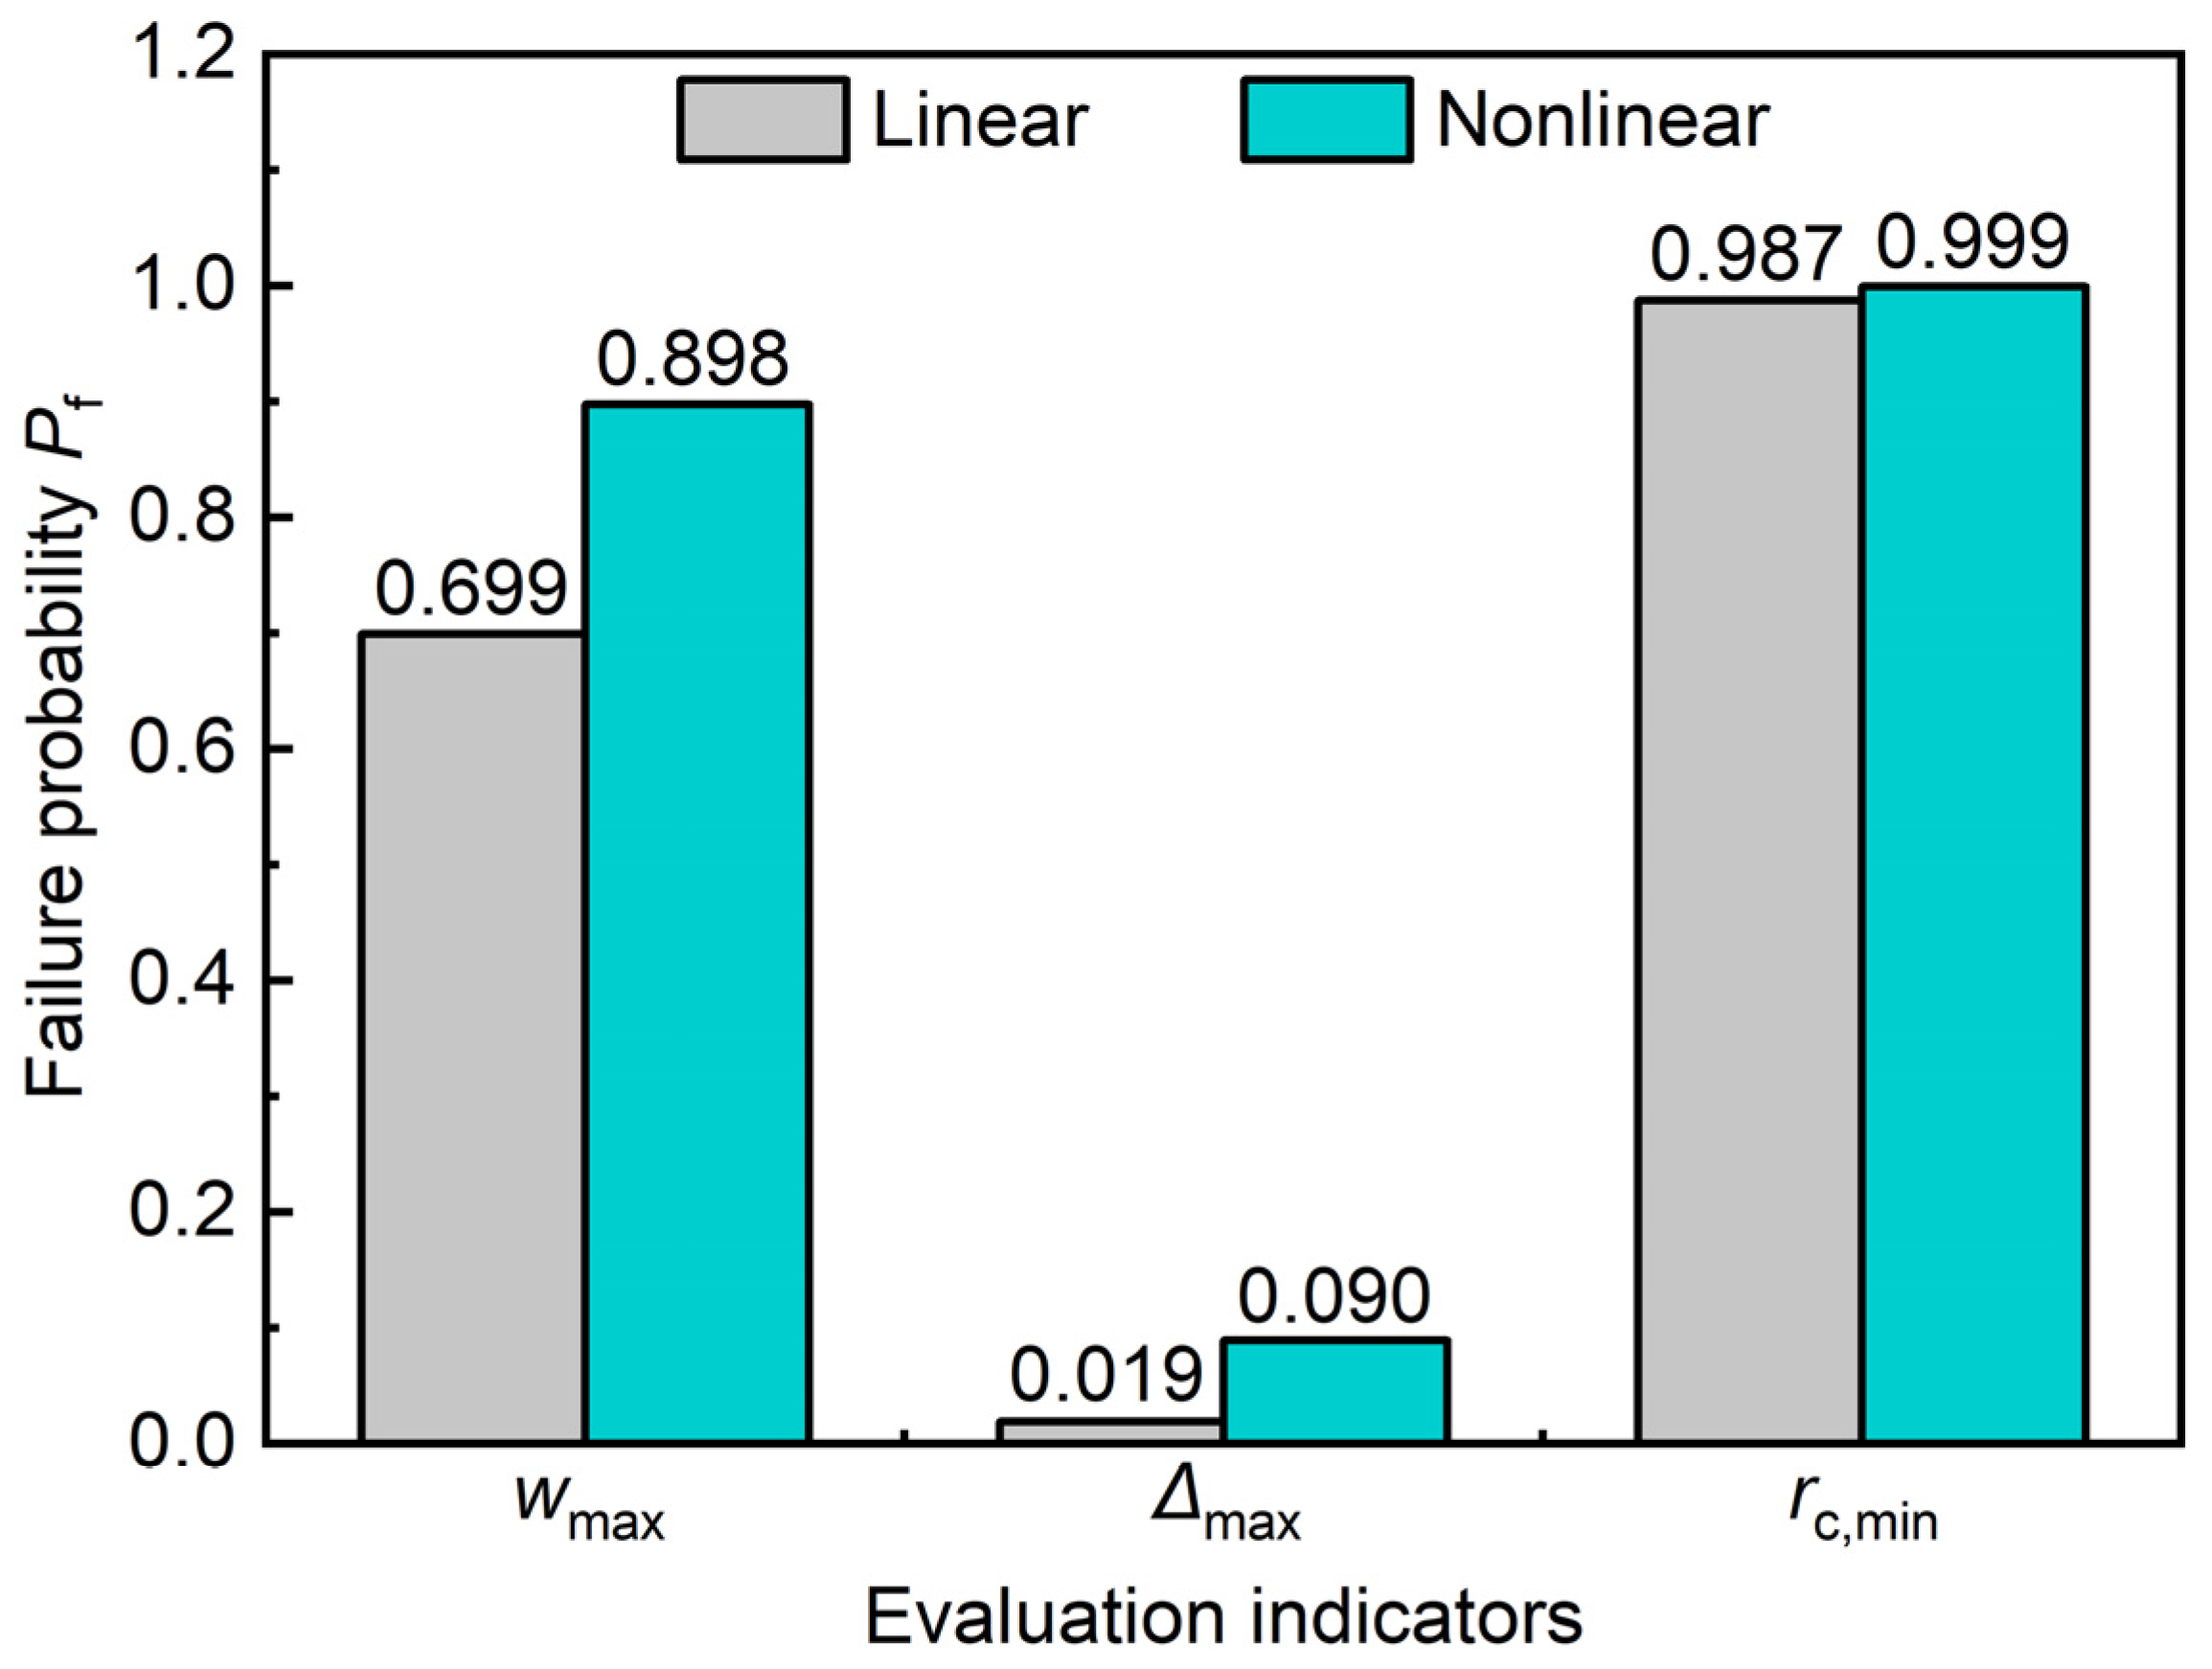
Figure 8a–c plots the probability density function (PDF) curves upon the maximum tunnel settlement, circumferential joint, and minimum curvature radius of the tunnel, respectively. In the figures, the PDF curves of these evaluation indicators are determined by kernel density estimation on random calculation samples. For comparison, the PDF curves obtained by both the linear and nonlinear foundation model are simultaneously plotted. As presented in Figure 8a,b, compared with the PDF curves of w m a x and Δ m a x obtained by the linear foundation model, the corresponding PDF curves based on the nonlinear foundation model are more to the right in the horizontal axis position. Interestingly, an opposite phenomenon is observed in Figure 8c, where the position of the PDF curves of r c , m i n generated by the nonlinear foundation model is further to the left. However, it is worth noting that the underlying logics of these phenomena are consistent, that is, the SA results obtained by the nonlinear foundation model are more likely to exceed the deformation thresholds of the tunnel compared with the linear mode-based results. It is easy to draw a conclusion that the SA results obtained by the conventional linear foundation model are more conservative.
Meanwhile, it is intuitively observed that, whether the results are obtained by linear or nonlinear foundation models, the skew characteristic of the PDF curve of r c , m i n is more obvious compared with one of the PDF curves of w m a x and Δ m a x . The statistical results also prove this finding. The skewness values of the nonlinear model-based PDF curves of w m a x , Δ m a x , and r c , m i n are 0.57, 0.34, and 0.76, respectively, while the results based on the linear model are 0.56, 0.33, and 0.95.
Figure 9 further provides the failure probabilities defined on w m a x , Δ m a x , and r c , m i n . It is found that the failure probabilities obtained by the nonlinear foundation model are larger than ones obtained by the linear foundation model. Moreover, there are significant differences among the failure probabilities of the shield tunnel upon different evaluation indicators. As presented in the figure, when the nonlinear foundation model is employed in the stochastic analyses, the w m a x -, Δ m a x -, and r c , m i n -based failure probabilities of the tunnel are 0.898, 0.090, and 0.990, respectively, while the corresponding results based on the linear foundation model are 0.699, 0.019, and 0.987, respectively. It indicates that there will be two oppositely extreme evaluation results, when the risk assessments of a shield tunnel subjected to the surface surcharge are conducted using the minimum curvature radius of the tunnel and the maximum opening of the circumferential joint. The former considers the failure risk of the tunnel to be extremely high, while the latter considers the potential risk borne by the tunnel to be very low. However, the risk assessment results based on the maximum deformation of the tunnel appears to be relatively rational. Thus, in practice, when the methodology proposed in this work is adopted for the risk assessment of an existing shield tunnel subjected by the surface surcharge, it is preferred to utilize the maximum longitudinal deformation of the tunnel as the risk assessment index.

5. Discussion

The analysis results in Section 4.2 have proved that considering the nonlinear behavior of the subgrade is extremely necessary because the traditional linear foundation model will overestimate the bearing capacity of the foundation and thereby underestimate the tunnel deformation caused by surcharge. Based on the illustrative case in Section 4.1, the influences of subgrade variability, surcharge loading conditions, and tunnel burial depth on the probabilistic analysis results are further discussed.

5.1. Influences of Subgrade Variability

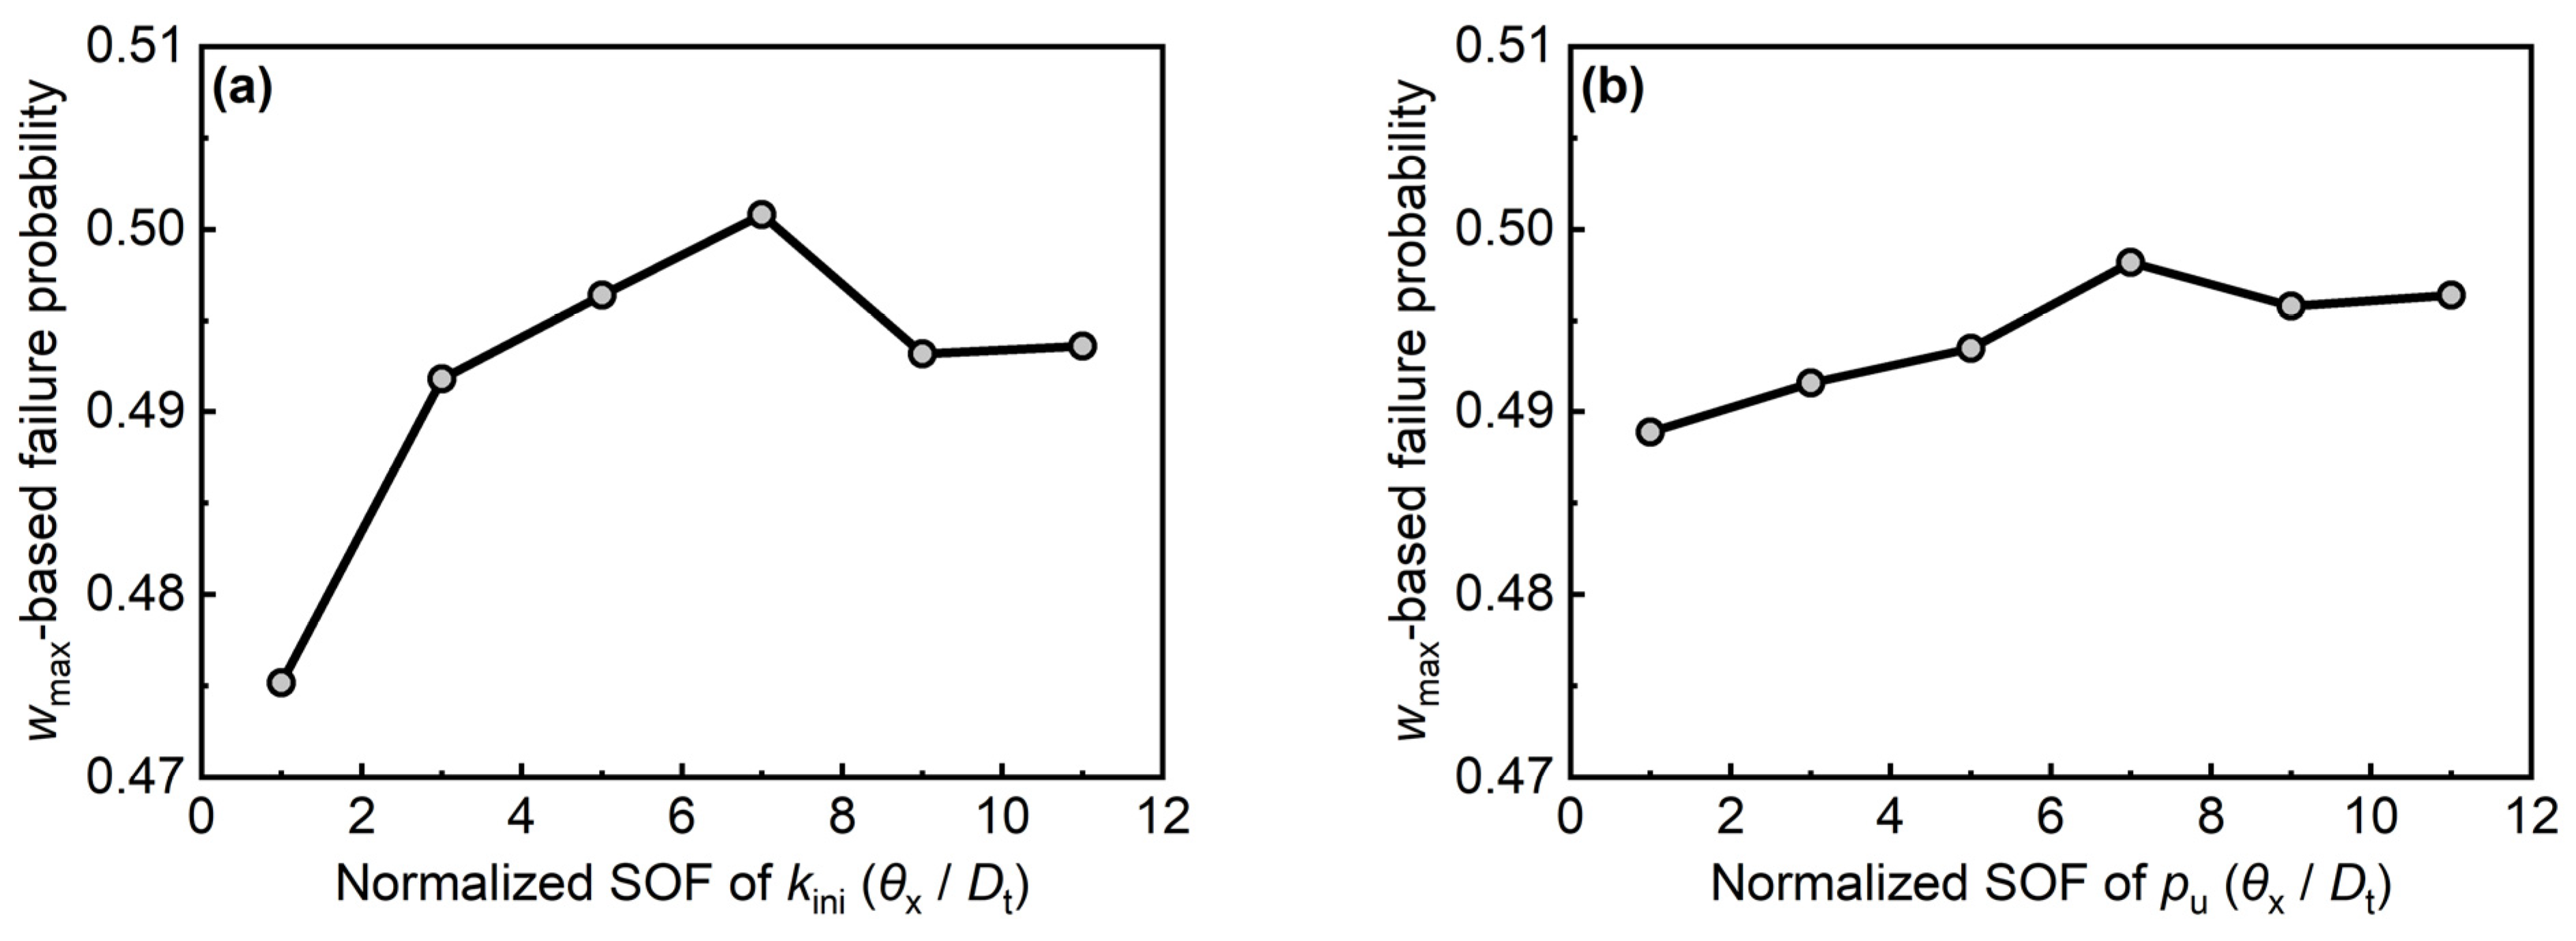
Figure 10a,b shows the w m a x -based failure probabilities ( P f , 1 ) versus different values of the coefficient of variation (COV) of k i n i and p u , respectively. To obtain a relatively ideal result, the amplitude of the surface surcharge is set to be 60 kPa during calculations. As presented in the figures, the failure probabilities of the tunnel grow nonlinearly with the increase of the COV of k i n i and p u . This indicates that under the same surcharge load conditions, the stronger the uncertainty of the circumstance around the tunnel, the higher the failure risk of the existing shield tunnel.
According to the calculation results, when the COV of k i n i increases from 0.1 to 0.2, the tunnel failure probability rapidly rises from 0.305 to 0.433 by an increase of 42.0%. Conversely, when the COV of k i n i varies from 0.5 to 0.6, the failure probability only grows marginally from 0.565 to 0.585, representing a mere 3.2% increase. This indicates that the growth rate of the tunnel failure probability gradually decreases with the increase in the COV of k i n i , while the impact of the COV of p u on tunnel failure probability exhibits the opposite trend. As shown in Figure 10a,b, the variation patterns of tunnel failure probability with the COV of k i n i and p u can be captured by an asymptotic and an allometric model, respectively. The fitting results demonstrate that the correlation coefficients between the fitted and calculated values for both models exceed 0.99.
Figure 11a,b presents the variations of the tunnel failure probabilities versus the scale of fluctuation (SOF) of k i n i and p u , respectively. For convenience, the SOF of the subgrade parameters is normalized by tunnel diameter in the figures. In addition, the COV of k i n i and p u are set to be 0.3 during calculations. It is seen that, on the whole, the tunnel failure probability shows a nonlinear increasing trend with the growth of the SOF of k i n i and p u , and the influence of the SOF of k i n i seems more obvious than that of the SOF of p u . It is also found that the tunnel failure probability no longer changes significantly when the SOF of k i n i and p u reaches a certain level. Compared with the influences of the COV of subgrade parameters, the influences of the SOF of the subgrade parameters on probabilistic analysis results are very slight. The computational results show that when the SOF of k i n i and p u increases of D t to 11 D t , the corresponding failure probabilities of the tunnel merely increase from 0.475 to 0.493 and from 0.489 to 0.496, respectively.
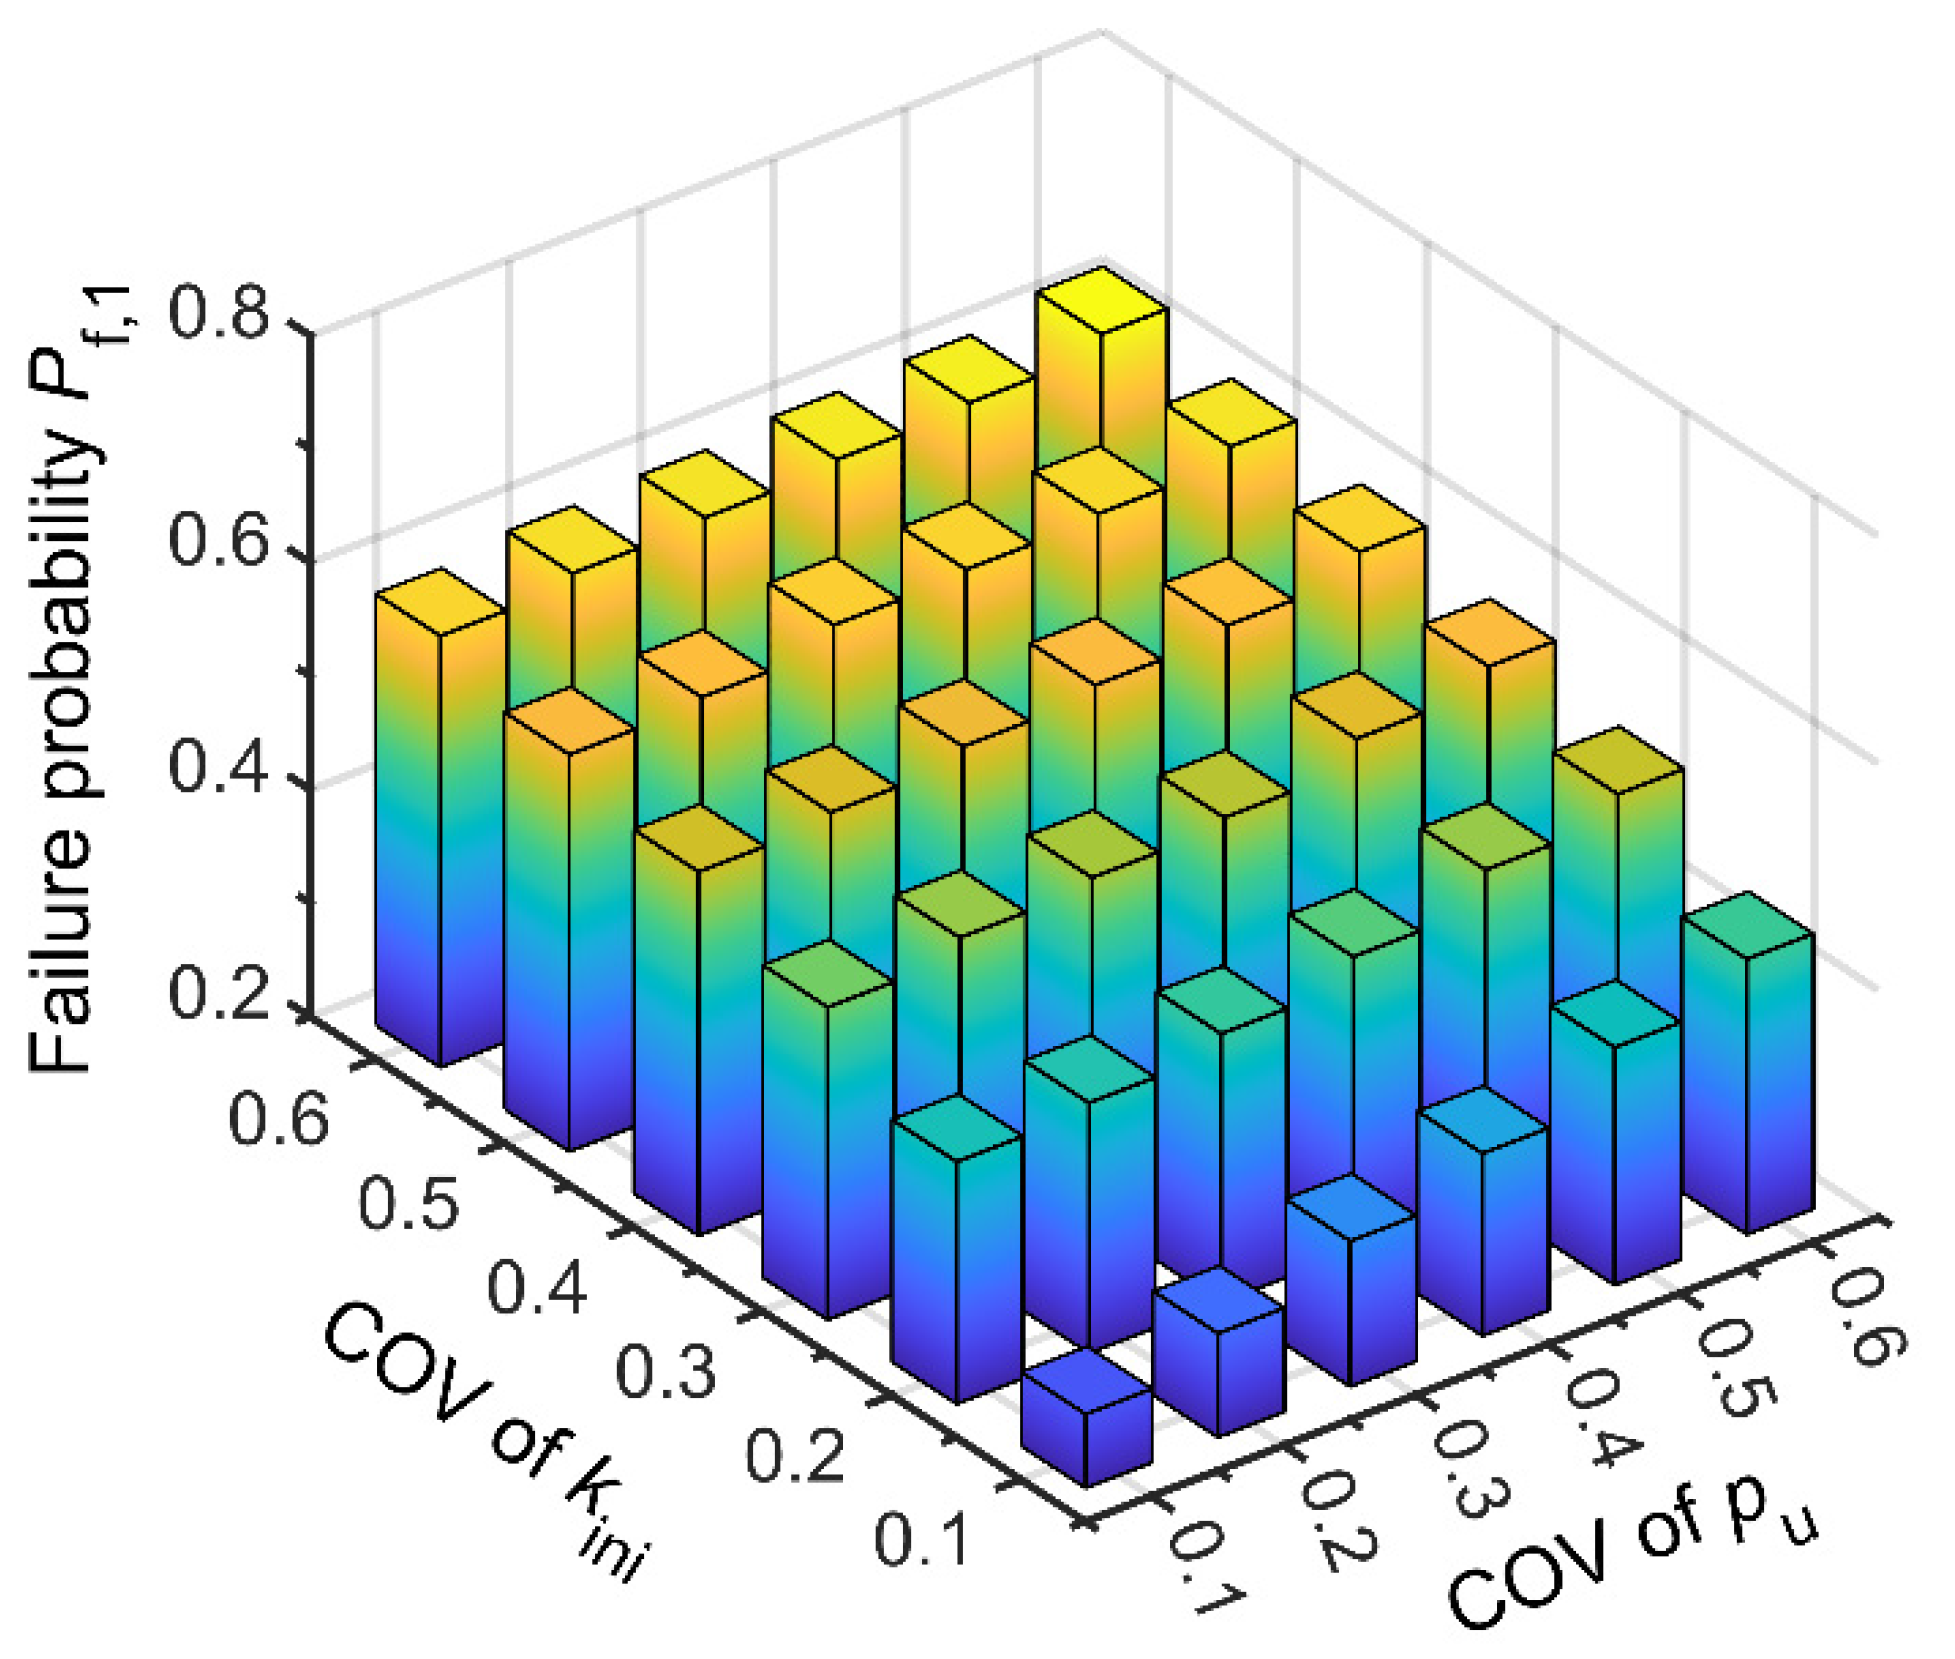
Figure 12 provides a comprehensive comparison of the influences of the uncertainties in k i n i and p u on the failure risk of the tunnel. As anticipated, greater uncertainties in k i n i and p u will lead to a higher failure risk of the tunnel. When the COV of k i n i and p u increases from 0.1 to 0.2, the failure probability of the tunnel grows from 0.265 to 0.622, representing an increase of 134.7%. Additionally, the comparison result reveals that the variability of k i n i exerts a more obvious influence on tunnel failure probability than the variability of p u under the same conditions. Considering the case where the COV of p u is 0.3, when the COV of k i n i increases from 0.1 to 0.6, the tunnel failure probability rises from 0.328 to 0.595 with an increase of 81.4%. However, under the identical conditions, the same variation of p u only elevate the tunnel failure probability from 0.475 to 0.552, representing a growth of 16.2%. Another interesting finding reveals that when k i n i exhibits a higher COV, the uncertainty of p u contributes to a limited impact on the tunnel failure probability compared to scenarios with lower variability of k i n i . Correspondingly, this inverse dependency relationship equally governs how the uncertainty of k i n i influences the tunnel failure probability under different variabilities of p u .

5.2. Influences of Surcharge Loading Conditions

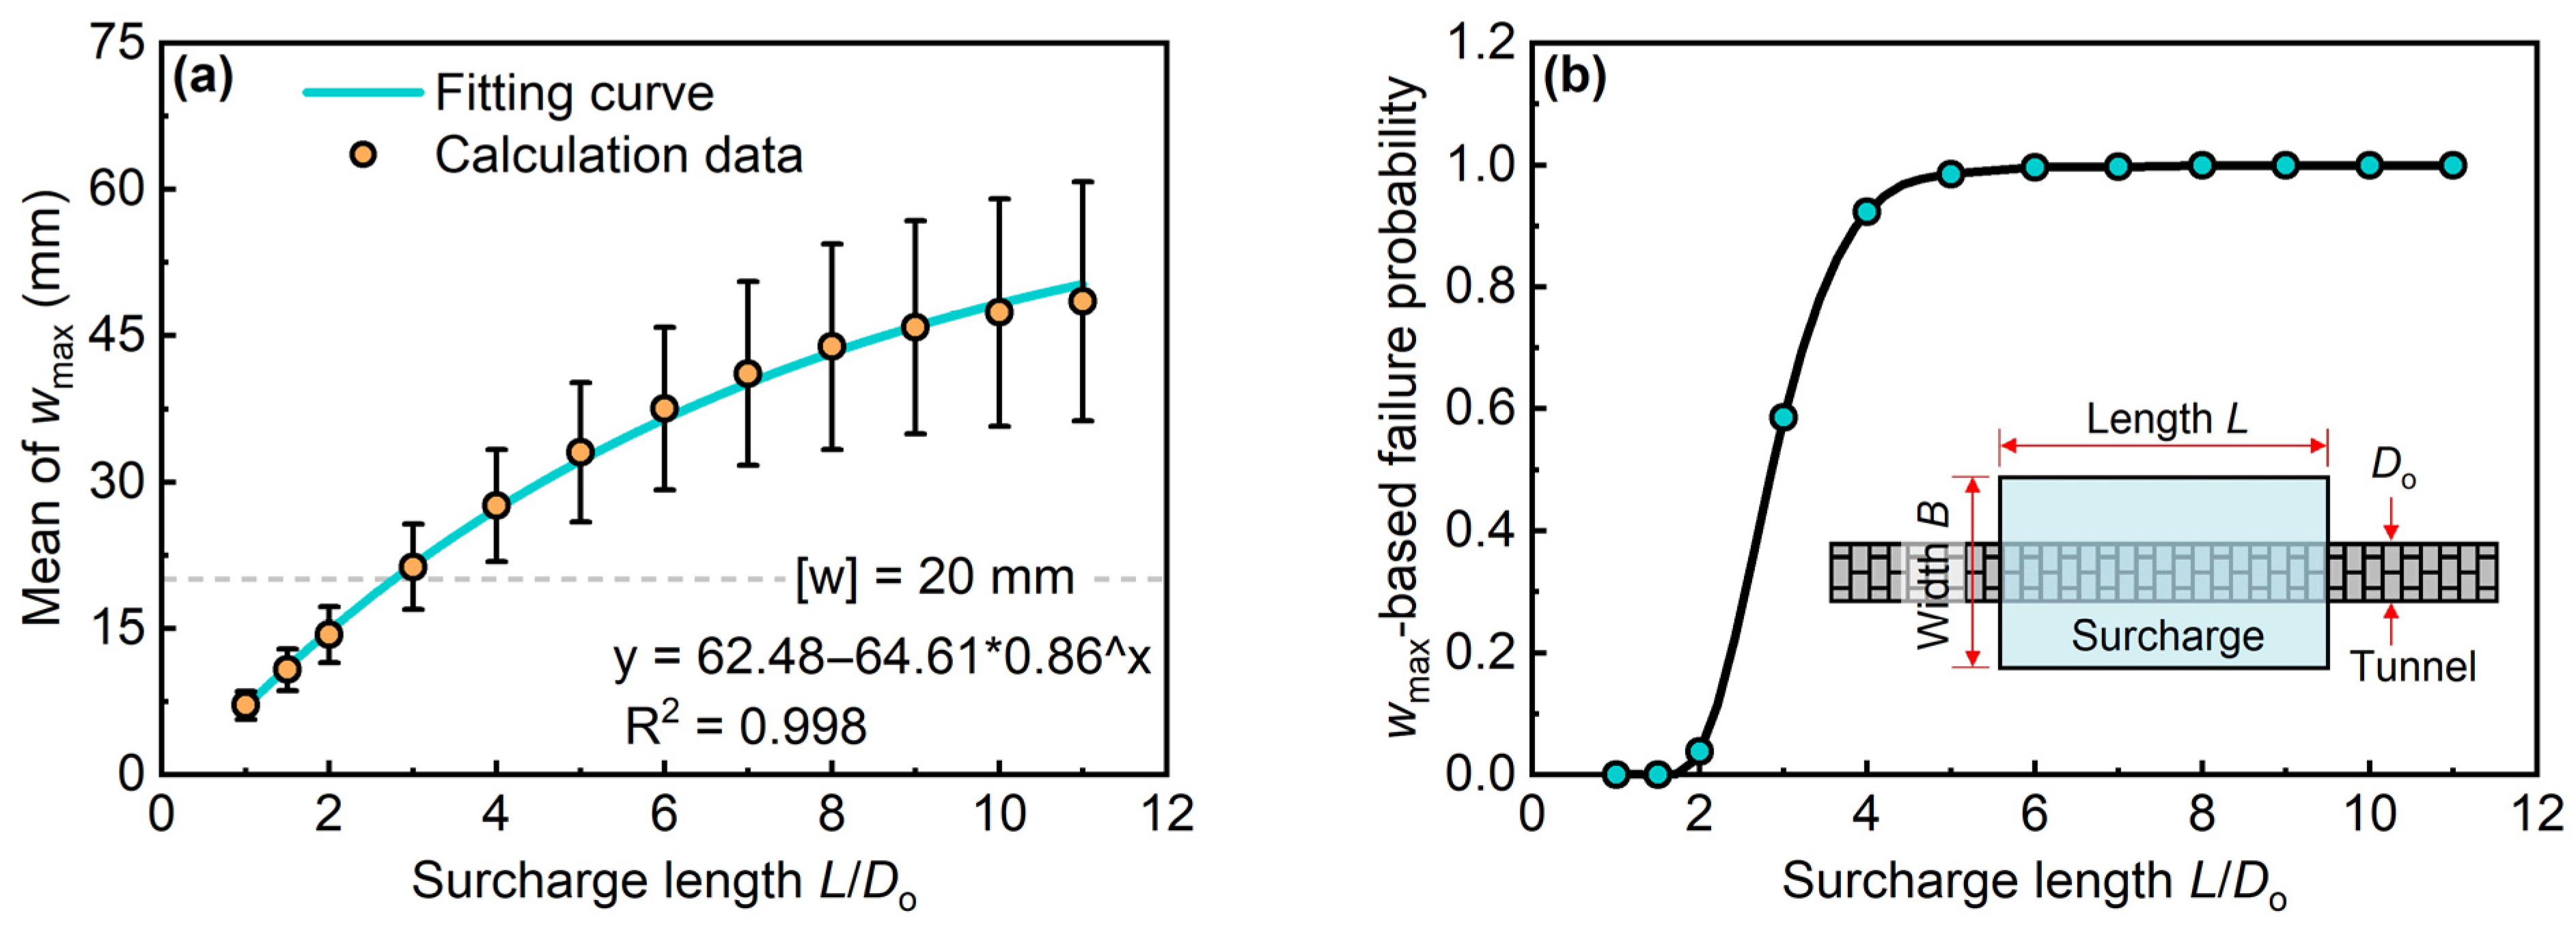
Figure 13a shows the relationship between the maximum deformation of the shield tunnel and the length of the surcharge load during the random analysis. The orange circular markers represent the mean values of the maximum tunnel deformation obtained from 10,000 stochastic simulations under corresponding loading scenarios, while the height of the error bars corresponds to the associated standard deviation. A greater error bar height indicates higher dispersion in the simulation results. It can be seen from the figure that the length of the surcharge load has a significant impact on the tunnel deformation, and the tunnel deformation increases nonlinearly with the increase of the surcharge load length, but the growth trend gradually slows down. Fitting analysis reveals that the correlation between the mean maximum tunnel deformation and surcharge length can be effectively characterized using an asymptotic model. A more interesting finding is that the dispersion of the maximum tunnel deformation (the height of the error bars) also increases nonlinearly with the increase of the surcharge load length. This indicates that a larger surcharge load will amplify the uncertainty of the soil–tunnel system.
Figure 13b illustrates the variation of the tunnel failure probability based on w m a x with the length of the surcharge. It can be seen from the figure that under the current calculation conditions, when the surcharge length exceeds twice the tunnel diameter ( D o ), that is, L > 2.0 D o , the failure probability of the tunnel will increase rapidly until it approaches 1.0. According to the calculation results, when the surcharge length increases from 2.0 D o to 4.0 D o , the failure probability of the tunnel increases rapidly from 0.038 to 0.924. However, from the perspective of deterministic analysis (referencing the mean value of the maximum deformation of the tunnel in Figure 13a), when the surcharge length is 2.0 D o , the maximum deformation of the tunnel caused by the surcharge is still within the control value (20 mm), suggesting that the tunnel still has a certain safety redundancy. However, this evaluation result is clearly unfavorable for the risk prevention and control of the tunnel.
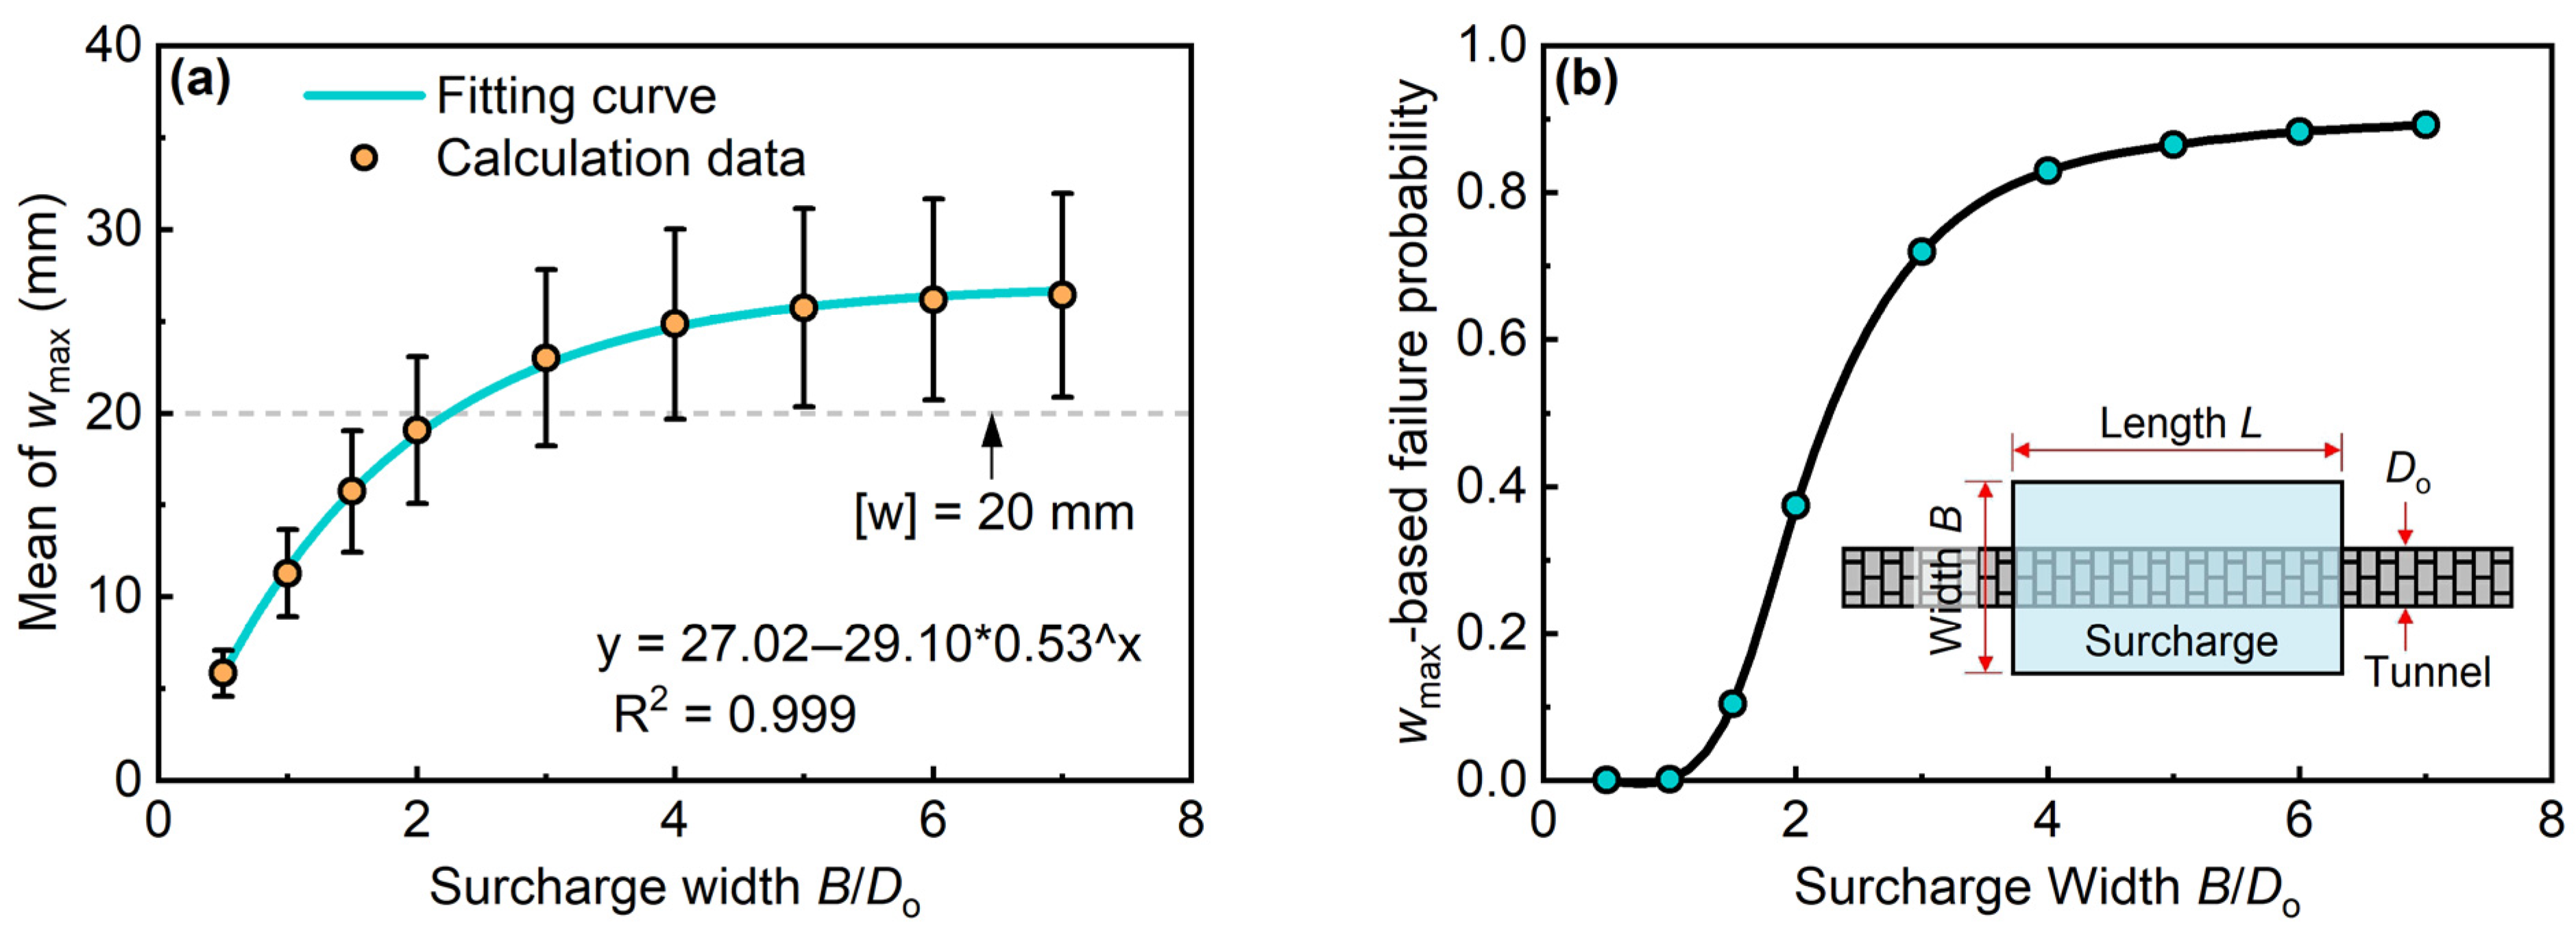
Figure 14 further illustrates the variations in tunnel deformation and its associated failure probability with respect to surcharge width. Overall, the influence pattern of surcharge width on the probabilistic analysis results closely resembles that of surcharge length shown in Figure 13. The relationship between the mean value of the maximum tunnel deformation and surcharge width can also be effectively described using an asymptotic model. Moreover, as the surcharge width increases, the standard deviation of the maximum tunnel deformation exhibits a nonlinear increase and eventually tends toward a stable asymptotic value. Compared to surcharge length, surcharge width exerts a relatively weaker influence on tunnel deformation. Furthermore, the variation of maximum deformation with surcharge width demonstrates a more pronounced convergence trend.
The probabilistic analysis results demonstrate that as the surcharge width increases from 1 D o to 4 D o , the tunnel failure probability rises sharply from 0.0015 to 0.83 and subsequently approaches a stable value. This suggests that beyond a surcharge width of 4 D o , further increases have a minimal effect on the tunnel’s failure risk. From a deterministic analysis perspective, when the surcharge width reaches 2 D o , the maximum tunnel deformation is only 19.1 mm, which is below the control threshold of 20 mm. This implies that the tunnel remains within acceptable safety limits under the current loading conditions. However, the probabilistic risk assessment reveals that the tunnel’s failure probability already exceeds 37% at this stage, indicating a significantly elevated level of potential risk.

5.3. Influences of Burial Depth of the Tunnel

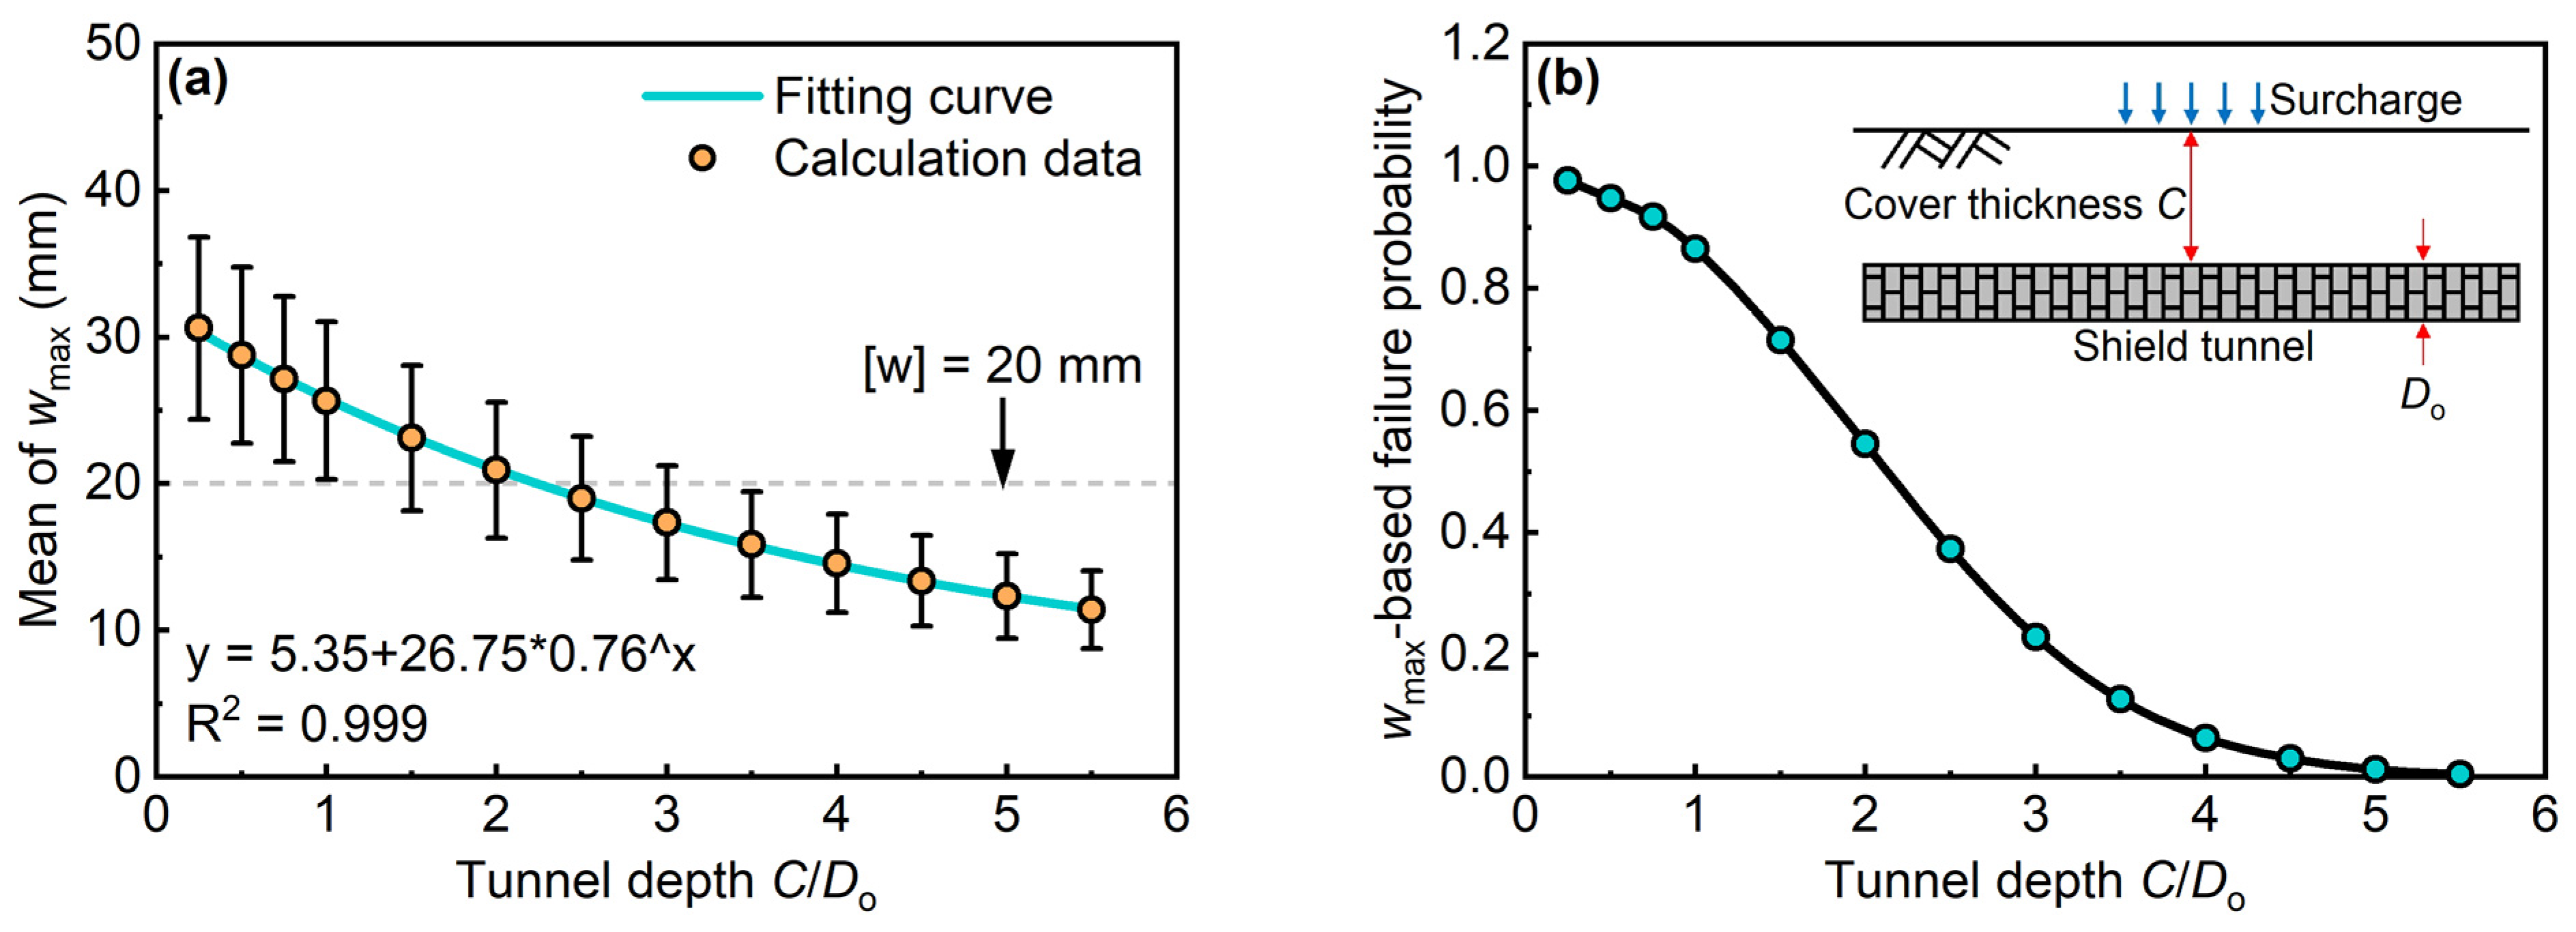
Figure 15 illustrates the variation patterns of the maximum tunnel deformation and the corresponding failure probability based on w m a x with respect to burial depth of the tunnel under a constant surcharge dimension. It is evident that both the maximum deformation and the failure probability exhibit a nonlinear decreasing trend as the burial depth increases. The relationship between the mean value of maximum deformation and burial depth can be characterized by a diminishing asymptotic model. Furthermore, the standard deviation of the maximum deformation derived from stochastic analysis decreases gradually with increasing burial depth, suggesting that the influence of stratum uncertainty on the tunnel’s mechanical behavior diminishes at greater depths. This observation implies that increasing the burial depth can partially mitigate the propagation of uncertainty within the stratum–tunnel interaction system.
As shown in Figure 15b, when the thickness of the cover soil at the top of the tunnel increases from 1 D o to 4 D o , the failure probability of the tunnel caused by surcharge loading rapidly decreases from 0.865 to 0.064. It can be seen from this that the influence of the tunnel burial depth on the failure probability is mainly concentrated within this burial depth range; when the burial depth exceeds 4 D o , its influence tends to weaken and no longer has a significant effect.
It should be emphasized that the aforementioned parameter analysis is entirely based on the baseline case presented in Section 4.1, in which the tunnel is embedded in a soft soil formation. Due to space constraints, this study does not provide an in-depth exploration of other ground conditions. Future research should investigate the applicability of the proposed method under diverse geological conditions through the analysis of additional engineering cases.

6. Conclusions

From the findings of the current work, the following conclusions can be drawn:
  • An improved soil–tunnel interaction model is developed to assess the longitudinal responses of a shield tunnel under surface surcharge loading, incorporating both the nonlinearity and spatial variability of the subgrade. The Newton–Raphson iterative algorithm is applied to solve the nonlinear equations, in conjunction with the derived finite difference solutions.
  • A probabilistic-based analysis method for performing failure risk analysis of a tunnel subjected to surcharge is proposed, where the established soil–tunnel interaction model is treated as deterministic model to acquire the tunnel responses, and the random field theory is introduced to realize the spatial variabilities of subgrade along the longitudinal direction of the tunnel.
  • The proposed probabilistic-based method is applied in a historical case from Shanghai Metro Line 9 to evaluate the failure risk of a shield tunnel subjected to surface surcharge. The results indicate that the predicted tunnel settlement considering the subgrade nonlinearity is closer to the measurements compared with the results provided by the linear foundation model; thereby, the advantage of the proposed nonlinear soil–tunnel interaction model is proved.
  • The probabilistic results demonstrate that the influence of spatial variability of subgrade parameters on tunnel responses is non-negligible. Within the proposed probabilistic analysis framework, the assessment upon the opening of the circumferential joint produces the lowest failure probability of the tunnel, whereas longitudinal curvature radius-based analysis generates the highest failure risk, and longitudinal settlement-based evaluation yields an intermediate failure probability.
  • The stronger the uncertainty of subgrade parameters, the higher the failure risk of the shield tunnel subjected to surcharge. Compared with the influence of the variability of the ultimate reaction of the subgrade, the influence of the uncertainty of subgrade initial stiffness on the tunnel failure risk is more obvious. An increase in the surcharge area significantly elevates the failure probability of existing tunnels. Furthermore, variations in surcharge length demonstrate a more substantial influence on tunnel stability than corresponding changes in surcharge width. As tunnel depth increases, the risk of failure under surcharge loading progressively diminishes.

Author Contributions

P.S.: data curation, formal analysis, methodology, writing—original draft. Z.X.: conceptualization, methodology, writing—review and editing. Z.W.: conceptualization, methodology, data curation, validation. Y.L.: formal analysis, validation, funding acquisition. All authors have read and agreed to the published version of the manuscript.

Funding

This work is supported by the National Natural Science Foundation of China (No. 52208381, 52278422), Guangdong Basic and Applied Basic Research (Grant No. 2024A1515012179).

Data Availability Statement

The original contributions presented in this study are included in the article. Further inquiries can be directed to the corresponding author.

Conflicts of Interest

The authors declare that they have no known competing financial interests or personal relationships that could have appeared to influence the work reported in this paper.

References

  1. Liu, J.; Shi, C.; Gong, C.; Lei, M.; Wang, Z.; Peng, Z.; Cao, C. Investigation of ultimate bearing capacity of shield tunnel based on concrete damage model. Tunn. Undergr. Space Technol. 2022, 125, 104510. [Google Scholar] [CrossRef]
  2. Liu, J.; Shi, C.; Lei, M.; Wang, Z.; Cao, C.; Lin, Y. A study on damage mechanism modelling of shield tunnel under unloading based on damage-plasticity model of concrete. Eng. Fail. Anal. 2021, 123, 105261. [Google Scholar] [CrossRef]
  3. Huang, L.; Ma, J.; Lei, M.; Liu, L.; Lin, Y.; Zhang, Z. Soil-water inrush induced shield tunnel lining damage and its stabilization: A case study. Tunn. Undergr. Space Technol. 2020, 97, 103290. [Google Scholar] [CrossRef]
  4. Liang, R.; Wu, J.; Sun, L.; Shen, W.; Wu, W. Performances of adjacent metro structures due to zoned excavation of a large-scale basement in soft ground. Tunn. Undergr. Space Technol. 2021, 117, 104123. [Google Scholar] [CrossRef]
  5. Lin, Y.; Lai, Z.; Ma, J.; Huang, L.; Lei, M. A FDEM approach to study mechanical and fracturing responses of geo-materials with high inclusion contents using a novel reconstruction strategy. Eng. Fract. Mech. 2023, 282, 109171. [Google Scholar] [CrossRef]
  6. Lin, Y.; Lai, Z.; Ma, J.; Huang, L. A Combined weighted Voronoi tessellation and random field approach for modeling heterogeneous rocks with correlated grain structure. Constr. Build. Mater. 2024, 416, 135228. [Google Scholar] [CrossRef]
  7. Zhang, J.; Huang, H.; Zhang, D.; Zhou, M.; Tang, C.; Liu, D. Effect of ground surface surcharge on deformational performance of tunnel in spatially variable soil. Comput. Geotech. 2021, 136, 104229. [Google Scholar] [CrossRef]
  8. Zhang, J.; Duan, X.; Zhang, D.; Zhai, W.; Huang, H. Probabilistic performance assessment of shield tunnels subjected to accidental surcharges. Struct. Infrastruct. Eng. 2019, 15, 1500–1509. [Google Scholar] [CrossRef]
  9. Zhang, J.; Huang, H.; Zhang, D.; Phoon, K.K. Experimental study of the coupling effect on segmental shield tunnel lining under surcharge loading and excavation unloading. Tunn. Undergr. Space Technol. 2023, 140, 105199. [Google Scholar] [CrossRef]
  10. Fan, Y.; Guo, X.; Deng, Z.; Xu, Y. Deformation analysis of shield tunnel with loading and unloading above. Constr. Technol. 2014, 43, 107–109. [Google Scholar]
  11. Huang, H.; Shao, H.; Zhang, D.; Wang, F. Deformational responses of operated shield tunnel to extreme surcharge: A case study. Struct. Infrastruct. Eng. 2017, 13, 345–360. [Google Scholar] [CrossRef]
  12. Liu, T.; Chen, S.; Ye, Z. Analysis of disease and structural safety of shield tunnel under accidental surface surcharge. J. Railw. Eng. Soc. 2019, 36, 67–73. [Google Scholar]
  13. Ding, Z.; Zhang, X.; He, S.; Qi, Y.; Lin, C. Experimental and theoretical study on longitudinal deformation and internal force of shield tunnel under surcharge. Tunn. Undergr. Space Technol. 2024, 144, 105506. [Google Scholar] [CrossRef]
  14. Liang, R.; Cao, S.; Xiang, L.; Kang, C.; Chen, F.; Li, Z.; Ke, Z.; Guo, Y. Experimental investigation on longitudinal mechanical mechanism of shield tunnels subjected to ground surface surcharge. Chin. J. Rock Mech. Eng. 2023, 42, 736–747. [Google Scholar]
  15. Wei, G.; Zhang, S.; Xiang, P. Model test study on the influence of ground surcharges on the deformation of shield tunnels. Symmetry 2021, 13, 1565. [Google Scholar] [CrossRef]
  16. Xiang, P.; Wei, G.; Zhang, S.; Cui, Y.; Guo, H. Model test on the influence of surcharge, unloading and excavation of soft clay soils on shield tunnels. Symmetry 2021, 13, 2020. [Google Scholar] [CrossRef]
  17. Liu, T.; Xiao, J.; Luo, L. Failure mechanisms of a shield tunnel in composite strata under surface surcharge: Physical model tests and numerical simulations. Int. J. Civ. Eng. 2025, 23, 869–884. [Google Scholar] [CrossRef]
  18. Huang, Z.; Zhang, H.; Fu, H.; Ma, S.; Liu, Y. Deformation response induced by surcharge loading above shallow shield tunnels in soft soil. KSCE J. Civ. Eng. 2020, 24, 2533–2545. [Google Scholar] [CrossRef]
  19. Li, Z.; Liu, X.; Wang, J. Elaborate numerical investigation on surcharge-induced mechanical responses and strengthening effects of single-line shield tunnels with typical cross-sections. Tunn. Undergr. Space Technol. 2025, 156, 106237. [Google Scholar] [CrossRef]
  20. Ruan, H.; Liang, R.; Kang, C.; Li, Z.; Ke, Z. Three-dimensional elaborate numerical modelling analysis on the deformation mechanism of metro shield tunnel induced by sudden surface surcharge. Saf. Environ. Eng. 2023, 30, 35–45+77. [Google Scholar]
  21. Cao, S.; Liang, R.; Kang, C.; Wu, W.; Ke, Z.; Guo, Y. Analytical prediction for longitudinal deformation of shield tunnel subjected to ground surface surcharge considering the stiffness reduction. Int. J. Numer. Anal. Methods Geomech. 2024, 48, 925–950. [Google Scholar] [CrossRef]
  22. Kang, C.; Mei, G.; Liang, R.; Wu, W.; Fang, Y.; Ke, Z. Analysis of the longitudinal deformation of existing shield tunnel induced by temporary surface surcharge. Rock Soil Mech. 2018, 39, 4605–4616. [Google Scholar]
  23. Wei, G.; Yu, G.; Hong, W. Study on calculation of shield tunnel shearing dislocation platform deformation due to adjacent ground stacked load. J. Cent. South Univ. (Sci. Technol.) 2018, 49, 1775–1783. [Google Scholar]
  24. Wei, Z.; Jiang, Y. A simplified analysis method for the deformation response of an existing tunnel to ground surcharge based on the pasternak model. Appl. Sci. 2021, 11, 3255. [Google Scholar] [CrossRef]
  25. Zhang, Z.; Huang, M.; Pan, Y.; Jiang, K.; Li, Z.; Ma, S.; Zhang, Y. Analytical prediction of time-dependent behavior for tunneling-induced ground movements and stresses subjected to surcharge loading based on rheological mechanics. Comput. Geotech. 2021, 129, 103858. [Google Scholar] [CrossRef]
  26. Wu, H.; Shen, S.; Yang, J.; Zhou, A. Soil-tunnel interaction modelling for shield tunnels considering shearing dislocation in longitudinal joints. Tunn. Undergr. Space Technol. 2018, 78, 168–177. [Google Scholar] [CrossRef]
  27. Liang, R. Simplified analytical method for evaluating the effects of overcrossing tunnelling on existing shield tunnels using the nonlinear pasternak foundation model. Soils Found. 2019, 59, 1711–1727. [Google Scholar] [CrossRef]
  28. Liang, F.; Jiang, Z.; Yuan, Q.; Li, L.; Wang, R. Time-dependent longitudinal responses of a shield tunnel induced by surcharge load: Theoretical prediction and analysis. Undergr. Space 2024, 14, 219–238. [Google Scholar] [CrossRef]
  29. Wang, Z.; Shi, C.; Gong, C.; Lei, M.; Liu, J.; Cao, C. An enhanced analytical model for predicting the nonlinear longitudinal equivalent bending stiffness of shield tunnels incorporating combined n-m actions. Tunn. Undergr. Space Technol. 2022, 126, 104567. [Google Scholar] [CrossRef]
  30. Zhang, Z.; Zheng, G.; Cheng, X.; Liang, R.; Li, C.; Zhong, Z.; Zhao, J. Analytical approach for longitudinal deformation of shield tunnels considering bending-shear-torsional effects of circumferential joints. Tunn. Undergr. Space Technol. 2024, 152, 105946. [Google Scholar] [CrossRef]
  31. Wang, Z.; Shi, C.; Gong, C.; Cao, C.; Peng, Z.; Sun, Y. Difference solutions for responses of foundation-beams with arbitrary boundary conditions considering spatial soil variability and its applications. Comput. Geotech. 2022, 151, 105002. [Google Scholar] [CrossRef]
  32. Wang, Z.; Shi, C.; Chen, H.; Peng, Z.; Sun, Y.; Zheng, X. Probabilistic analysis of the longitudinal performance of shield tunnels based on a simplified finite element procedure and its surrogate model considering spatial soil variability. Comput. Geotech. 2023, 162, 105662. [Google Scholar] [CrossRef]
  33. Ghazavi, M.; Mahmoodi, E.; El Naggar, H. Load-deflection analysis of laterally loaded piles in unsaturated soils. Acta Geotech. 2023, 18, 2217–2238. [Google Scholar] [CrossRef]
  34. Lin, C.; Wang, Z.; Liu, Z.; Luo, X.; Ma, B.; Chen, Y. Tunnelling-induced nonlinear responses of continuous pipelines resting on tensionless winkler foundation. Transp. Geotech. 2024, 49, 101386. [Google Scholar] [CrossRef]
  35. Pejman, M.; Habibagahi, G.; Veiskarami, M. Response of buried pipelines subjected to ground subsidence using a nonlinear pasternak approach. Transp. Geotech. 2025, 51, 101504. [Google Scholar] [CrossRef]
  36. Zhao, C.; Gong, W.; Juang, C.H.; Tang, H.; Liu, Z.; Hu, X. Probabilistic performance analysis of longitudinal tunnels based on coupled characterization of stratigraphic and geo-properties uncertainties. Tunn. Undergr. Space Technol. 2025, 161, 106552. [Google Scholar] [CrossRef]
  37. Jiang, Q.; Zhang, J.; Zhang, D.; Huang, H.; Shi, J.; Li, Z. Influence of geological uncertainty on longitudinal deformation of tunnel based on improved coupled markov chain. Eng. Geol. 2024, 337, 107564. [Google Scholar] [CrossRef]
  38. Huang, H.W.; Xiao, L.; Zhang, D.M.; Zhang, J. Influence of spatial variability of soil young’s modulus on tunnel convergence in soft soils. Eng. Geol. 2017, 228, 357–370. [Google Scholar] [CrossRef]
  39. Wang, Z.; Shi, C.; Chen, H.; Lei, M. Probabilistic evaluation for excavation-induced longitudinal responses of existing shield tunnel in spatially random soils. Comput. Geotech. 2024, 167, 106110. [Google Scholar] [CrossRef]
  40. Peng, Z.; Shi, C.; Wang, Z.; Lei, M.; Peng, L. Longitudinal structural vulnerability analysis of shield tunnels under adjacent excavation disturbances. J. Cent. South Univ. 2025, 32, 2256–2272. [Google Scholar] [CrossRef]
  41. Attewell, P.B.; Yeates, J.; Selby, A.R. Soil Movements Induced by Tunnelling and Their Effects on Pipelines and Structures; Methuen, Inc.: New York, NY, USA, 1986. [Google Scholar]
  42. Shiba, Y.; Kawashima, K.; Obinata, N.; Kano, T. An evaluation method of longitudinal stiffness of shield tunnel linings for application to seismic response analyses. Doboku Gakkai Ronbunshu 1988, 1988, 319–327. [Google Scholar] [CrossRef]
Figure 1. Illustration of a shield tunnel affected by surface surcharge: (a) overview and (b) plane view.
Mathematics 13 02620 g001
Figure 2. Improved soil–tunnel interaction model incorporating subgrade nonlinearity and variability.
Mathematics 13 02620 g002
Figure 3. Discretization of the shield tunnel.
Mathematics 13 02620 g003
Figure 4. Flowchart of the probabilistic analysis on tunnel responses induced by surcharge.
Mathematics 13 02620 g004
Figure 5. Relative position of the shield tunnel and the backfills in the river channel.
Mathematics 13 02620 g005
Figure 6. Comparison of measurements and computational results with different methods.
Mathematics 13 02620 g006
Figure 7. Stochastic responses of the shield tunnel: (a) bending moment; (b) shear force; and (c) opening of the circumferential joint.
Mathematics 13 02620 g007
Figure 8. PDF curves of different evaluation indicators of the shield tunnel: (a) maximum deformation; (b) maximum opening of the circumferential joint; and (c) minimum curvature radius.
Mathematics 13 02620 g008
Figure 9. Failure probabilities of the shield tunnel corresponding to different evaluation indicators.
Mathematics 13 02620 g009
Figure 10. Influences of COV of subgrade parameters on tunnel failure probability: (a) initial stiffness k i n i and (b) ultimate reaction p u .
Mathematics 13 02620 g010
Figure 11. Influences of SOF of subgrade parameters on tunnel failure probability: (a) initial stiffness k i n i and (b) ultimate reaction p u .
Mathematics 13 02620 g011
Figure 12. Failure probabilities based on w m a x versus the variation of COV of k i n i and p u .
Mathematics 13 02620 g012
Figure 13. Influences of surcharge loading length: (a) variation of the mean and standard deviation of the maximum tunnel settlement and (b) variation of the tunnel failure probability.
Mathematics 13 02620 g013
Figure 14. Influences of surcharge loading width: (a) variation of the mean and standard deviation of the maximum tunnel settlement and (b) variation of the tunnel failure probability.
Mathematics 13 02620 g014
Figure 15. Influences of burial depth of the tunnel: (a) variation of the mean and standard deviation of the maximum tunnel settlement and (b) variation of the tunnel failure probability.
Mathematics 13 02620 g015
Table 1. Thresholds of the tunnel deformation.
Assessment IndicatorsThreshold Values
Longitudinal settlement, w (mm)20
Opening of the circumferential joint, Δ (mm)1.0
Curvature radius of the longitudinal deformation, r c (m)15,000
Table 2. The design parameters of the shield tunnel of Metro Line 9 in Shanghai.
Segment Bolt of Circumferential Joint
Outer diameter (m)6.2Number17
Thickness (m)0.35Diameter (mm)30
Width (m)1.2Length (mm)400
Young’s modulus (kPa)3.45 × 10⁷Young’s modulus (kPa)2.06 × 10⁸
Poisson’s ratio0.2Poisson’s ratio0.3
Disclaimer/Publisher’s Note: The statements, opinions and data contained in all publications are solely those of the individual author(s) and contributor(s) and not of MDPI and/or the editor(s). MDPI and/or the editor(s) disclaim responsibility for any injury to people or property resulting from any ideas, methods, instructions or products referred to in the content.