Abstract
In this study, the effects of speed and red-light cameras (SRLCs) and traffic signal countdown timers (TSCTs) on the operation of pre-timed signalized intersections were studied through startup lost times (SLTs) and saturation time headways (STHs). The study used the beanplots package version 1.3.1 in R statistical software to graph and find the first STH that occurred in a queue. Then, one-way analysis of variance was used twice to explore the effects of the separate and joint use of SRLCs and TSCTs on the operation of pre-timed signalized intersections. The results show that SRLC use does not have a significant direct impact on the operation of pre-timed signalized intersections, but SRLC interacts negatively with TSCT use. In addition, TSCT use was shown to improve the operation of pre-timed signalized intersections by decreasing the SLT and STH. For SLT, the effect size of TSCT use depends on the presence or absence of SRLC use, and its reduction ranges from 0.5 to 1.25 s per queue. As for STH, the effect size of TSCT use does not depend on the presence or absence of SRLC use, and its reduction ranges from 0.08 to 0.12 s per vehicle, corresponding to 0.8–1.2 s per queue, given that there are 10 vehicles in the queue.
Keywords:
speed and red-light camera; traffic signal countdown timer; startup lost time; saturation time headway MSC:
93C99
1. Background Study
Signalized intersections represent a critical component of urban infrastructure, designed to optimize both operational efficiency and user safety at roadway junctions. By allocating the shared physical space to distinct user groups through sequenced time intervals, traffic signals effectively minimize potential conflict points. This temporal separation, structured into distinct signal phases, cyclically alternates access rights using green (go), yellow (transition/warning), and red (stop) indications. The primary outcome of this phased approach is a significant enhancement in safety for all road users, including drivers, pedestrians, and cyclists. At the onset of green indication, the queue of vehicles waiting behind the stop line starts up and moves through the intersection. The first few vehicles take a longer time to react and start moving through the intersection. This extra time taken by the first few vehicles in the queue is regarded as the startup lost time (SLT). This lost time decreases the usable portion of the green light, which in turn reduces the capacity of the intersection. After the first few vehicles pass the intersection, the remaining vehicles generally maintain a constant time for clearing the intersection. This can be viewed as the saturation time headway (STH) and can be measured in the field as the time elapsed between consecutive vehicles traveling at full speed. As STH increases, the capacity of the intersection decreases. Thus, SLT and STH play vital roles in determining the capacity of signalized intersections.
Various studies have highlighted the complex interplay of driver behavior, vehicle characteristics, and environmental conditions in determining SLT and STH at signalized intersections. For example, the impact of driver distraction, particularly cellphone usage, has been shown to significantly increase SLT by approximately 0.7 s, which can degrade intersection capacity and level of service [1]. Another study using simulation models demonstrated that connected and automated vehicles (CAVs) could drastically reduce SLT and improve saturation flow, potentially increasing intersection capacity by up to 80% with 100% CAV penetration [2]. Additionally, lane-specific factors such as heavy vehicle presence and lane utilization were found to alter saturation headways significantly, such as the impact of downstream bus stop and bicycle lane [3]. Moreover, behavioral factors such as driver alertness and age have been observed to contribute to wide variations in SLT, with recorded values ranging from 0.75 to 6.5 s depending on demographics and intersection design. Calibration efforts have emphasized the need to tailor SLT and STH parameters to local traffic patterns and vehicle compositions to ensure accuracy in signal timing optimization [4]. These findings underline the dynamic and context-sensitive nature of SLT and STH, and their critical importance in efficient traffic signal design.
Furthermore, studies have extensively investigated the influence of speed and red-light cameras (SRLCs) and traffic signal countdown timers (TSCTs) on the performance and safety of pre-timed signalized intersections. TSCTs have been shown to improve driver behavior and reduce hesitation in the dilemma zone, particularly with green light countdowns set between 5 and 10 s, optimizing safety and intersection throughput [5]. Similarly, innovative green-phase forewarning systems such as visual message signs (VMS) and synchronized red–yellow displays significantly improved start-up behavior and reduced lost time at intersections without inducing risky behaviors [6]. Speed cameras, particularly when installed in series, led to long-term reductions in average vehicle speeds and fatalities by up to 38.6%, with even greater safety effects when paired with speed limit reductions [7]. In parallel, red-light violation detection systems using AI-powered surveillance effectively enhanced compliance and allowed proactive enforcement at intersections [8].
Recent advancements in intelligent traffic signal control have leveraged artificial intelligence to improve urban mobility. Kodama et al. (2022) [9] proposed a decentralized traffic signal control system using deep reinforcement learning (DRL) with a dual-targeting algorithm that emphasizes reinforcing successful experiences. Their method significantly reduced average vehicle waiting times by 33% in multi-agent environments without requiring inter-signal communication, making it practical for real-world deployment [9]. Complementing this, Beklaryan et al. (2023) [10] developed a simulation model for smart cities that uses adaptive control of traffic lights based on fuzzy clustering, integrated with a real-coded genetic algorithm to optimize control parameters. Their approach demonstrated superior performance in maximizing traffic flow, particularly under varying traffic conditions. Both studies highlight the potential of machine learning and adaptive algorithms in enhancing the efficiency and responsiveness of urban traffic management systems [10].
Studies on countdown displays also found behavioral benefits for motorcyclists, encouraging idle engine stopping and lowering emissions, reinforcing environmental advantages alongside traffic efficiency [11]. Moreover, all-red light violations were found to be influenced by intersection geometry and signal timing, highlighting the need for strategic placement of cameras and redesigned signal layouts to mitigate crash risks [12]. Complementing these, dynamic SPAT (Signal Phase and Timing) estimation technologies and real-time traffic-responsive algorithms have shown promise in optimizing pre-timed signal operations, suggesting that a hybrid integration of enforcement and adaptive control can further elevate intersection safety and efficiency [13].
In Saudi Arabia, numerous pre-timed signalized intersections have been augmented with two complementary technologies: SRLCs and TSCTs. SRLC systems serve as automated enforcement tools designed to detect and deter speeding violations and red-light infractions at these junctions. While the existing literature has extensively examined the safety implications of SRLC deployment, their potential influence on intersection operational efficiency—specifically regarding start-up lost time (SLT) and saturation headway (STH)—remains underexplored. Conversely, TSCTs are visual displays positioned adjacent to traffic signals, indicating the remaining duration for the current signal phase (green, yellow, or red), typically through color-coded digital numerals. These timers aim to enhance driver preparedness for signal transitions, thereby promoting smoother traffic flow. This study empirically investigates the individual and combined effects of SRLCs and TSCTs on critical capacity parameters, namely SLT and STH.
Despite their growing deployment, there is limited empirical evidence on how these technologies influence intersection efficiency, either individually or in tandem. More importantly, the absence of a formalized modeling framework in existing studies limits their applications. This study aims to fill that gap by not only empirically assessing the impact of SRLCs and TSCTs on SLT and STH, but also by incorporating a structured analytical approach to model these effects. By integrating field observations with mathematical modeling techniques, the study provides actionable insights for traffic engineers and policymakers. The proposed methodology provides a replicable framework for evaluating intersection performance enhancements attributable to enforcement and information-based technologies.
1.1. Startup Lost Time and Saturation Time Headway
The discharge time headway is the passage time between two consecutive vehicles passing a stop line. The values for the first few discharge time headways have a descending trend until they reach a stable condition, where the two consecutive headways do not differ significantly. SLT is defined as the sum of the additional time taken to start up the vehicle, which extends to more than the STH, from the first discharge time headway to the point where the discharge time headway becomes stable. STH is the discharge time headway at which a stable condition is reached (Figure 1). Saturation flow rate (SFR), an essential parameter for computing the capacity of a signalized intersection, is calculated as the reciprocal of STH, with vehicles per hour per lane (veh/h/ln) as its unit.
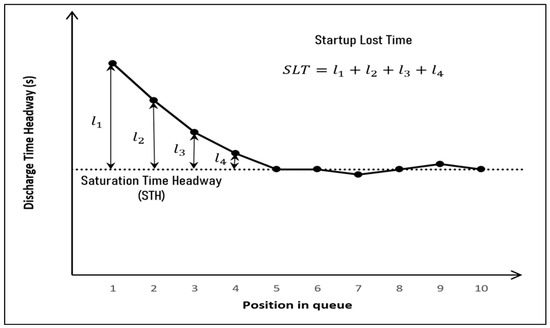
Figure 1.
Graphical illustration of startup lost time and saturation time headway.
The aforementioned parameters play an important role in improving signal timing and traffic performance at signalized intersections. The Highway Capacity Manual [14] recommends the use of 2 s as the default value for SLT and the fifth headway in a queue as STH (1.9 s; SFR = 1900 veh/h/ln) under the prevailing conditions (e.g., 12 ft lane width, no heavy vehicles, flat grade, no parking, no turning vehicles). These fixed recommended values vary across different populations and countries. Çalışkanelli et al. (2017) [15] studied the STL at eight signalized intersections in Turkey and found that it was 2.32 s on average. The study concluded that the STL values differed largely from each other [15]. Majeed et al. (2014) investigated the STH in three cities in the U.S. state of Alabama and compared the obtained values with the value recommended by HCM (2010): 1.9 s. The study found that the observed STH in two of the three cities were significantly different from 1.9 s, and the results differed among the cities [16]. Another study by Hamad and Abuhamda (2015) [17] reported an STH of 1.55 s (SFR = 2323 veh/h/ln) in Doha, Qatar. The study concluded that the observed STH was significantly different from the value recommended by HCM (2010), a finding that coincides with those of the other studies conducted in the region [17]. Alam et al. (2010) found that the STH in Makkah province in Saudi Arabia is 1.44 s (SFR = 2500 veh/h/ln), but the position of the first STH in the queue is imperative in determining SLT [18]. Joseph and Chang (2005) employed a sequential statistical testing method to find the position of the first vehicle’s sustained STH, and they concluded that it varied with the behaviors of the drivers of the third to the seventh vehicles in the queue [19]. Thus, despite the fact that these parameters vary across populations and countries, they may be affected by the presence or absence of SRLC and TSCT use.
1.2. Speed and Red-Light Cameras and Traffic Signal Countdown Timer Effects
This study examines the potential impact of SRLC and TSCT implementation on the operational capacity of pre-timed signalized intersections. Traffic enforcement represents the predominant strategy for modifying driver behavior and enhancing compliance with traffic regulations [20]. However, intensive enforcement measures do not invariably yield their intended outcomes only. SRLC systems constitute a rigorous enforcement tool widely deployed in Saudi Arabia and numerous other nations, primarily intended to bolster driver adherence to traffic rules and thereby improve safety. Nevertheless, SRLC deployment may induce unintended consequences, such as heightened driver stress or anxiety, potentially altering driver behavior during green signal phases. Such behavioral shifts could consequently impact key capacity parameters—including Start-up Lost Time (SLT), Saturation Headway (STH), and Saturation Flow Rate (SFR)—at signalized intersections. This potential is underscored by research indicating that while SRLC use effectively reduces right-angle crash incidence, its influence on rear-end crashes remains less consistent [21,22,23]. However, few studies have focused on the effects of SRLC use on the capacity of signalized intersections. Baratian-Ghorghi et al. (2016) studied the impact of red-light running cameras at eight intersections in the U.S. state of Alabama and concluded that the capacity of the intersections decreased due to the observed increase in clearance lost times in the presence of red-light running cameras [24]. Al-Mistarehi et al. (2021) developed a linear regression model to classify the factors that affect the SFR in Jordan [25]. Their model included traffic camera enforcement as a predictor/indicator and showed that traffic camera enforcement significantly increased the SFR, thus increasing the capacity of the intersections. However, the last two studies did not provide information about whether traffic camera enforcement also detects speeders. Thus, identifying the effects of SRLC use on the capacity of intersections will enable good countermeasures to be devised and implemented.
The TSCTs are predominantly deployed at pre-timed signalized intersections, with the principal objective of enhancing driver responsiveness to signal transitions. These devices provide road users with advanced information regarding signal phase status and right-of-way allocation—explicitly indicating the imminent transfer of right-of-way between phases through a countdown display. Positioned adjacent to the signal head, TSCTs present the remaining duration in seconds for the current indication. Dedicated displays for each signal phase (green, yellow, red) utilize color-coded digital numerals corresponding to their respective indications, thereby facilitating anticipation and mitigating uncertainty during signal changes. Several studies have been conducted to explore the impact of TSCT use on the capacities of intersections in different countries. Limanond et al. (2009) investigated the influence of TSCT use on SLT and STH at one intersection for 2 days in Thailand: 1 day with the TSCT in operation and 1 day with the TSCT turned off [26]. The study concluded that TSCT use significantly reduces the SLT (by 1–1.92 s) but does not have a significant impact on the STH. Islam et al. (2016) arrived at the same conclusion with respect to SLT by conducting a driving simulator study in the U.S. state of Oregon [27]. Moreover, in a recent study conducted in India, the SLT was significantly reduced when a TSCT was in operation [28]. However, in a study conducted in Taiwan, TSCT use was shown to have effectively reduced both the startup delay and the saturated headway [29]. In their respective studies, Limanond et al. (2009) and Chiou and Chang (2010) used different methods of determining the STH, which led to conflicting findings and conclusions [26,29].
The foregoing shows that SRLCs and TSCTs both affect drivers’ responses to signal changes. Despite this, their operational benefits are not being actively studied, especially SRLC. Apart from examining the SLT and STH in Saudi Arabia, this study also investigated the effects of joint and separate SRLC and TSCT use on them. The R package beanplot version 1.3.1 was utilized to visualize and analyze the discharge time headways to define the position of the first STH in a queue. Then, the SLTs and STHs were estimated according to HCM. One-way analysis of variance (ANOVA) and Tukey’s method were run on the estimated SLTs and STHs to identify the significant effects of SRLC and TSCT use. The following section explains the details of the research method used in this study.
2. Study Method
A field-based observational study was conducted at two comparable pre-timed signalized intersections within the same urban area. The sites were selected to form a controlled comparison: one intersection featured a speed and red-light camera (SRLC), while the other did not. Critically, both intersections were equipped with TSCTs. To isolate the impact of TSCT operation, each intersection was observed during two separate daytime periods: one with TSCTs active and another with TSCTs deactivated. The intersections shared key geometric and operational characteristics: four legs, identical lane configurations on the studied approach, and equivalent yellow-light intervals. Two four-leg, pre-timed intersections with identical lane configurations and yellow-light intervals were selected because they represent the prototypical signalized intersections found throughout Saudi Arabian cities. This layout accounts for the majority of urban signal designs in the country.
The discharge time headway in a queue was measured as the passage time between consecutive vehicles passing the stop line, except for the first discharge time headway, which was measured as the passage time between yellow-light onset and the first vehicle crossing the stop line [14]. The front wheels of the vehicles were used as the reference points for measuring the discharge time headways. The discharge time headways were collected for each intersection case. They were then visualized for each intersection case using the beanplot package in R programming. A beanplot is a plot for comparing univariate data between groups. It is similar to a boxplot, but shows the overall mean for all the groups, the mean for each group, all the observations, and the estimated density of distribution for each group [30]. The groups in this study were based on the positions of the discharge time headway in the queue. This plot was used to identify the position of the first STH. Then, the SLT and STH were calculated for each intersection case, as follows:
where,
Hi: the discharge time headway of the ith vehicle in the queue in seconds;
Hsat: the saturation time headway in seconds, STH;
q: the observed number of queues in each intersection case;
n: the position of the first STH in the queue; and
Nj: the number of vehicles in the jth queue.
Equations (1) and (2) compute the SLT per queue and STH. However, the one-way ANOVA model was used two times in this study, once for SLT and once for STH. For SLT, one-way ANOVA was run on all the SLTs calculated from each queue. For STH, one-way ANOVA was run on all discharge time headways at the stable condition, the discharge time headway from “n” to “N,” for all the queues. The one-way ANOVA model is as follows:
where,
µ: the grand mean for SLT or STH in seconds;
τi: the ith effect of the intersection case (no SRLC and TSCT = 1; SRLC = 2; TSCT = 3; SRLC and TSCT = 4); and
ϵij: error term.
The model tested whether an intersection case affected SLT or STH. Thus, the hypotheses below were set.
Tukey’s multiple-comparison test was further used to identify the significant effect of each intersection case. It compared each intersection case with the others. Tukey’s test is as follows:
where,
CD: critical difference; if it is exceeded, the comparison is denoted as significant;
qα(k,T − k): Studentized range statistic;
α: the significance level (e.g., 0.05 for 95% confidence);
MSE: mean square error;
ti, tj: number of observations in each intersection case;
k: number of total effects; and
T: number of total observations.
Equations (1) and (2) define start-up lost time (SLT) and saturation time headway (STH), providing a means to quantify variations in vehicle discharge under different control scenarios. The one-way ANOVA model (Equation (3)) and its associated hypothesis testing (Equation (4)) assess whether the type of intersection treatment leads to statistically significant differences in SLT or STH. Furthermore, Tukey’s multiple comparison test (Equation (5)) identifies which specific intersection cases differ from others. This mathematical structure offers a transparent and transferable methodology for evaluating the operational effectiveness of SRLC and TSCT, contributing to the broader field of traffic signal performance analysis and enforcement technology modeling.
The site description and data were used to run these models, as explained in the next section.
3. Site Description and Data Collection
The two signalized intersections in Buraydah, Saudi Arabia, exhibit highly comparable geometric layouts. Both feature three primary lanes (each 3.5 m wide) on the studied approaches: two lanes dedicated exclusively to through movements and one lane accommodating shared through–left movements. While both intersections incorporate auxiliary right-turn lanes, a notable distinction exists: the intersection equipped with the Speed and Red-Light Camera (SRLC) includes an auxiliary left-turn lane, whereas the comparison site does not. Geographically, both four-legged intersections reside along the same arterial corridor within Buraydah—one situated in the northern sector of the city, the other in the southern sector. Operationally, they share an identical yellow interval duration of 3 s. The SRLC system was installed at its respective intersection in 2012, serving its core functions of detecting and deterring speeding violations and red-light infractions. The TSCTs were installed at both study intersections in 2009. These timers activate synchronously with each signal phase change, displaying the remaining duration for the current indication (green, yellow, or red) as illustrated in Figure 2. Comprehensive traffic control details for each observed approach are provided in Table 1
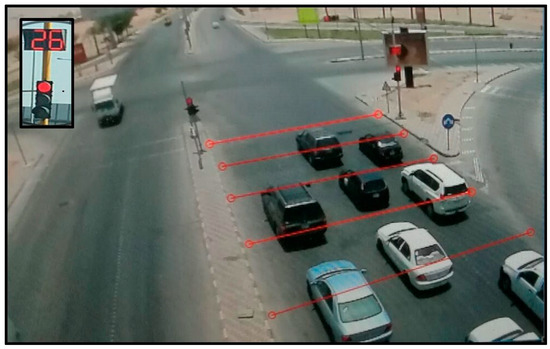
Figure 2.
An image of the observed intersection with a TSCT.

Table 1.
Traffic control information.
Video data collection was conducted at the selected approaches of both intersections using two synchronized cameras per site. The primary camera focused on the stop line and signal heads, while the secondary camera captured the approach from an upstream perspective (Figure 3). Both video feeds were synchronized and displayed concurrently on a single monitoring screen. To facilitate spatial analysis, grid lines spaced at 5 m intervals, extending 120 m upstream from the stop line, were digitally superimposed on the footage using physical pavement markings as reference points. Monitoring occurred during daylight hours (dawn to dusk) over four consecutive days. Data collection specifically targeted through movements, with analysis restricted to queues of 7–10 small-to-medium-sized vehicles. Equipment was mounted on light columns along the central median island, housing both cameras and a digital video recorder (DVR). Given the high ambient temperatures during the late-July data collection period in this hot climate region, custom-designed enclosures incorporated reverse-flow fans to maintain internal air circulation and prevent thermal damage to recording equipment (Figure 4).
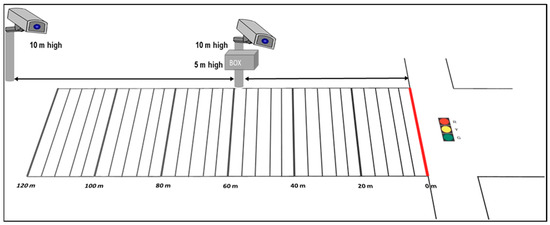
Figure 3.
Installation locations of the two cameras at the observed approaches of the two intersections.
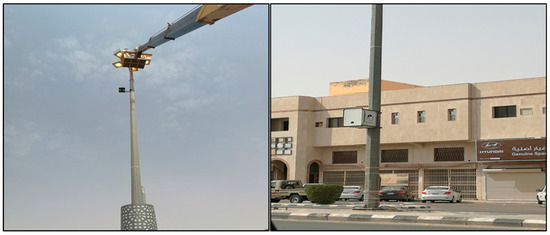
Figure 4.
Images of the installation.
Videos were recorded at 25 frames per s and with a 720 p resolution. Thus, the discharge time headway was calculated using the number of frames passing between two consecutive vehicles and the frame rate. The following section explains and discusses the study results.
4. Results and Discussion
A total of 3671 discharge time headways were collected across the four intersection cases. Each discharge time headway was measured as the number of frames passed divided by the frame rate at the stop line. Then, the discharge time headways were visualized using the beanplot for each intersection case, with the order or position of the discharge time headway on the x-axis and the discharge time headways in seconds on the y-axis (Figure 5, Figure 6, Figure 7 and Figure 8). The mean discharge time headway for each position is presented herein with a bold black horizontal line. All the discharge time headway observations are presented herein with thin horizontal lines, where the discharge time headways that are close to each other are stacked together by increasing the lengths of the lines relatively to the others. The dashed line across the plots represents the overall mean discharge time headway.
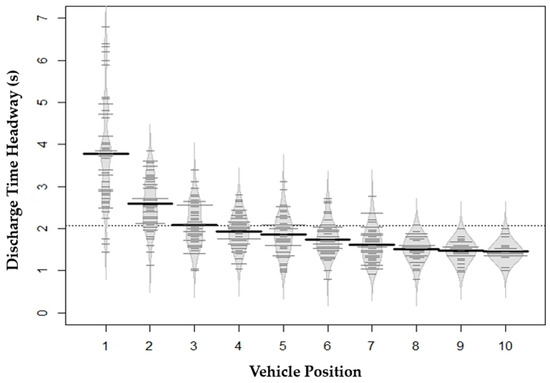
Figure 5.
Intersection without an SRLC and a TSCT.
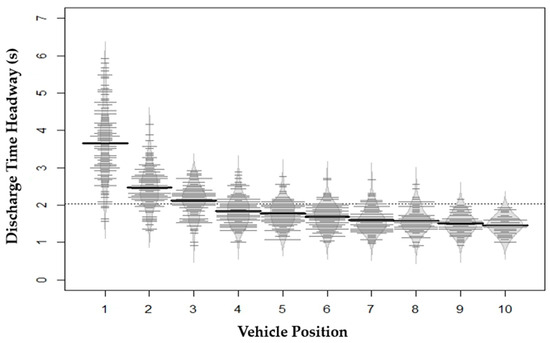
Figure 6.
Intersection with an SRLC.
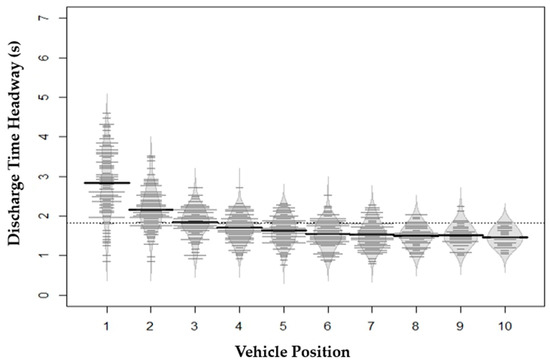
Figure 7.
Intersection with a TSCT.
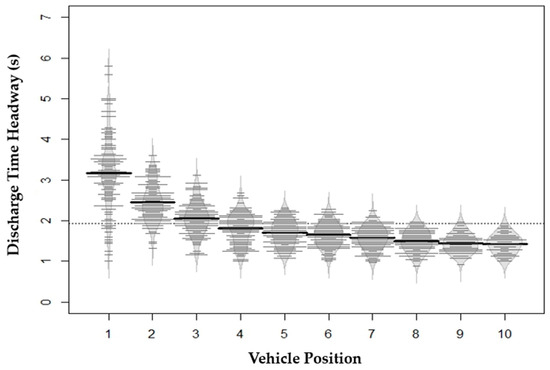
Figure 8.
Intersection with an SRLC and a TSCT.
Figure 5 shows the observed discharge time headways at the intersection without an SRLC and a TSCT. Each position’s mean and distribution spread clearly decreased as the position increased. The means of the first three discharge time headways were approximately 3.77, 2.58, and 2.09 s, respectively. After the third position, the mean discharge time headways fell below the dashed line representing the overall mean (2.07 s), showing slight differences. Additionally, the distribution densities for the first three positions were obviously different, while the other positions’ distribution densities were roughly similar. Figure 6 shows the observed discharge time headways at the intersection with an SRLC. The means of the first three discharge time headways were approximately 3.66, 2.48, and 2.11 s, respectively. The decrease in mean was larger for the first three discharge time headways than for the others, which showed only slight differences and fell below the overall mean of 2.03 s. The same was true for the density of distributions, which showed a similar trend to that in Figure 5 but with a slight decrease in the mean and distribution spreads. However, SRLC use seems to improve the discharge time headways. Figure 7 shows the observed discharge time headways at the intersection with a TSCT. The means of the first three discharge time headways were approximately 2.84, 2.16, and 1.85 s, respectively. Similarly, the decreases in the discharge time headway mean and distribution spreads for the first three positions were larger than those in the other discharge time headway means in the higher positions, falling below the overall mean of 1.82 s. Clearly, Figure 7 shows a significant reduction in discharge time headway means compared to those in Figure 5 and Figure 6, implying that TSCT use improves discharge time headways.
Figure 8 shows the observed discharge time headways at the intersection with an SRLC and a TSCT. The means of the first three discharge time headways were approximately 3.16, 2.45, and 2.05 s, respectively. Similarly, the decreases in discharge time headway mean and distribution spreads for the first three positions were larger than those in the discharge time headway means for the higher positions, falling below the overall mean of 1.93 s. However, Figure 8 shows discharge time headways that are higher than those in Figure 7 but lower than those in Figure 5 and Figure 6.
Obviously, the first STH occurred after the third position, where the discharge time headway means showed slight differences and were below the overall means for all the intersection cases. Therefore, the SLTs were the additional time taken for the first three discharge time headways and were calculated using Equation (1), while the STHs were the averages of all the discharge time headways after the third position and were calculated using Equation (2). Table 2 shows the descriptive statistics of the calculated SLT and STH for each intersection case.

Table 2.
Descriptive statistics of the calculated SLT and STH.
One-way ANOVA was performed on the calculated SLTs to determine if the means were significantly different among intersection cases, as explained in the Study Method Section. Table 3 shows the output for this model. One-way ANOVA assumes that the residuals are normally distributed and the variance of the observations is approximately the same in each intersection case. The residuals are approximately normally distributed, as shown in Figure 9. The histogram appears to be a normal distribution, and the Q-Q plot shows that all the points fall approximately along the reference line. Moreover, the skewness and kurtosis of the residuals are 0.10 and 2.9, respectively, which are very close to the 0.00 and 3.00 skewness and kurtosis of the normal distribution, respectively. As for the homogeneity of variances, Figure 10 shows no evident pattern between the residuals and the fitted values, indicating that homogeneity of variances can be roughly assumed; therefore, the ANOVA assumptions were approximately met.

Table 3.
ANOVA outputs for SLT.
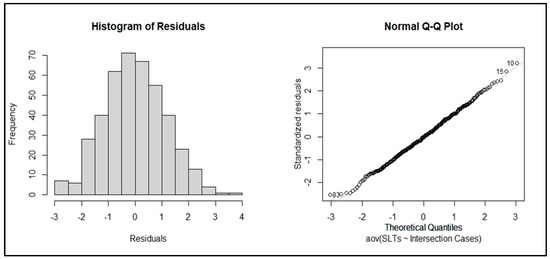
Figure 9.
Normality plots of the residuals for SLT.
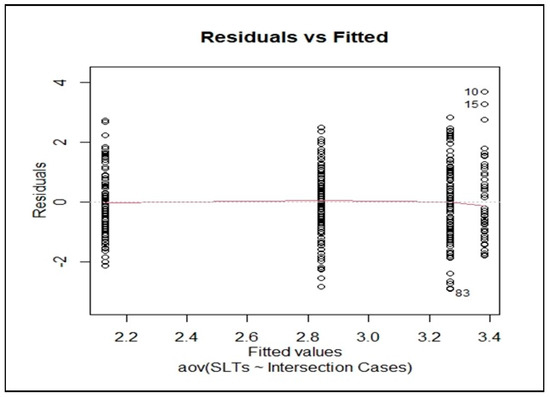
Figure 10.
Homogeneity-of-variances plot for SLT.
Table 3 shows the results of the ANOVA and Tukey’s multiple comparison of means. The ANOVA results indicate at least one SLT mean that is significantly different from the others (as shown by the 5.26 × 10⁻¹⁴ p-value). Thus, Tukey’s method was run, and the comparisons of six combination intersection cases are shown in Table 3. Shown are the differences in means, the range of the difference values with a 95% confidence interval, and the p-values for the differences. SRLC use was shown not to significantly affect the SLT directly, while TSCT use was shown to significantly reduce the SLT by 1.25 s. Apparently, this reduction was limited by the influence of SRLC use. This limited reduction was shown in the “Both—None,” “Both—SRLC,” and “Both—TSCT” comparisons. The first comparison showed that the joint use of SRLC and TSCT significantly reduced the SLT by 0.54 s, with the upper bound nearly reaching zero, but not by 1.25 s. The second comparison showed a trend similar to that in the first comparison. The last comparison showed that the effect of SRLC use could minimize the influence of TSCT use, as shown by the 0.71 s increase, with the upper bound nearly reaching 1.25 s. This clearly indicates that TSCT use significantly reduces the SLT, and the reduction ranges from 0.5 to 1.25 s depending on whether an SRLC is used.
One-way ANOVA was performed on the observed STHs to determine if the means were significantly different among the intersection cases, as explained in the Study Method Section. Table 4 shows the outputs of the model. The assumption of normality was roughly met, as shown in Figure 11. The histogram resembles a normal distribution, and the Q-Q plot shows that all the points fall approximately along the reference line. Moreover, the skewness and kurtosis of the residuals are 0.38 and 3.12, respectively, which are close to the 0.00 and 3.00 skewness and kurtosis of the normal distribution, respectively. Figure 12 shows no evident pattern between the residuals and the fitted values, indicating that homogeneity of variances can be roughly assumed; therefore, the ANOVA assumptions were approximately met.

Table 4.
ANOVA outputs for STH.
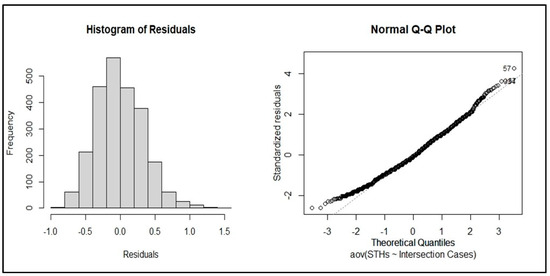
Figure 11.
Normality plots of the residuals for the STHs.
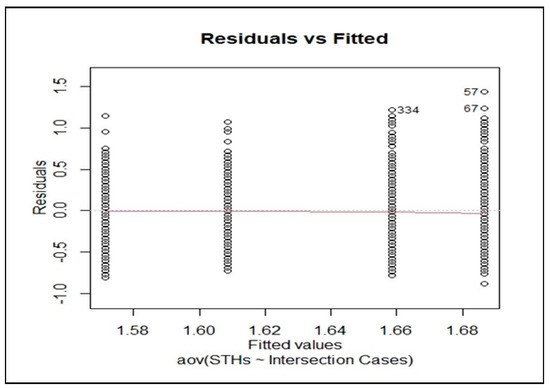
Figure 12.
Homogeneity-of-variances plot for the STHs.
Table 4 shows the results of the ANOVA and Tukey’s multiple comparison of means. The ANOVA results indicate that at least one STH was significantly different from the others (as shown by the 1.76 × 10⁻⁷ p-value). Thus, Tukey’s method was performed, and the comparisons of six combination intersection cases are shown in Table 4. SRLC use was shown not to significantly affect the STH, while TSCT use was shown to significantly reduce STH by 0.12 s. For example, if there are 10 vehicles in the queue, the reduction will be 1.2 s; however, this reduction is unbounded by the presence of SRLC, as the other comparison cases showed roughly similar values.
The results of TSCT use are consistent with those in the studies mentioned in the Background Section [26,27,28,29]. Intuitively, drivers will use the TSCT to quickly respond to signal changes as they want to minimize their travel time, but they do not want to increase their risk of receiving a traffic violation ticket. This is a potential reason for SRLC use’s negative interaction with TSCT use. When both TSCTs and SRLCs are active at a signalized intersection, drivers must weigh the marginal time savings offered by precise countdown information against the certain penalty of a camera-enforced violation. TSCTs provide exact remaining red-light durations, allowing drivers to time their departures and minimize headways. However, the guaranteed detection provided by SRLCs raises the cost of any miscalculation, encouraging a more cautious approach—waiting an extra moment to confirm a full green rather than risking a ticket. As a result, the headway reduction achieved by TSCTs is partially offset by the presence of SRLC enforcement, yielding the observed negative interaction. However, in this study, SRLC use did not have a significant effect on the STH. This is contrary to the result obtained by [25], which did not explicitly mention whether traffic camera enforcement detects both the speeders and red-light runners or only the red-light runners. This may be a potential reason for the different conclusions, as drivers do not want to increase their risk of receiving a traffic violation ticket. Thus, SRLC use does not affect the operation of signalized intersections but interacts negatively with and reduces the impact of TSCT use.
5. Conclusions
This study was an observational study at pre-timed signalized intersections that aimed to investigate the effects of SRLC and TSCT use on the operation of pre-timed signalized intersections through SLTs and STHs. The study used beanplots in R statistical software to visualize and identify the first STH. It was found that the first STH occurred after the third position, where all the discharge time headways showed little differences and fell below the overall mean for each intersection case. Then, a one-way ANOVA model was run two times, once on the calculated SLTs and once on the observed STHs, to explore the effects of the separate and joint use of SRLC and TSCT. SRLC use does not have a significant direct influence on the operation of pre-timed signalized intersections, but it interacts negatively with TSCT use. Moreover, TSCT use improves the operation of pre-timed signalized intersections as it decreases the SLT and STH. As for SLT, the effect size of TSCT use depends on the presence or absence of SRLC use, and its reduction ranges from 0.5 to 1.25 s per queue. As for STH, the effect size of TSCT use does not depend on the presence or absence of SRLC use, and its reduction ranges from 0.08 to 0.12 s per vehicle, corresponding to 0.8–1.2 s per queue, given that there are 10 vehicles in the queue.
It can thus be concluded that the combined empirical and statistical approach used in this study provides a simple yet effective framework for evaluating intersection performance compared to more complex simulation-based methods. It can also be concluded that SRLC use does not affect the operation of pre-timed signalized intersections, except in the presence of TSCT use. In addition, it can be concluded on the basis of the obtained results that TSCT use significantly improves the operation of pre-timed signalized intersections. However, these results were based on the observations collected under the base conditions (e.g., 3.5 m lane width, no heavy vehicles, flat grade, no parking, and no turning vehicles) for four-legged intersections.
A limitation of the current study is that the findings are based only on base traffic conditions (e.g., 3.5 m lane width, no heavy vehicles, flat grade, no parking, and no turning vehicles) at four-legged intersections. Further study is recommended to investigate the effects of SRLC and TSCT use for conditions other than the base ones or for different types of intersections; however, it is expected that the same directional effects of SRLC and TSCT use will be obtained from such a study.
Author Contributions
Conceptualization, O.A.; methodology, O.A.; software, O.A.; validation, O.A. and M.I.K.; formal analysis, O.A.; investigation, O.A. and M.I.K.; resources, O.A. and M.I.K.; data curation, O.A. and M.I.K.; writing—original draft preparation, O.A. and M.I.K.; writing—review and editing, O.A. and M.I.K.; visualization, O.A. and M.I.K.; supervision, O.A. and M.I.K.; project administration, O.A. and M.I.K.; funding acquisition, O.A. and M.I.K. All authors have read and agreed to the published version of the manuscript.
Funding
This work was supported and funded by the Deanship of Scientific Research at Imam Mohammad Ibn Saud Islamic University (IMSIU) (grant number IMSIU-DDRSP2502).
Data Availability Statement
Data is available on reasonable request from the corresponding author.
Acknowledgments
We gratefully acknowledge the support provided by the Deanship of Scientific Research at Imam Mohammad Ibn Saud Islamic University (IMSIU) through grant number IMSIU-DDRSP2502.
Conflicts of Interest
The authors declare no conflicts of interest.
References
- Alshabibi, N. Impact Assessment of Driver Distraction by Cellphone on Start-up Lost-time and Average Saturation Headway at Signalized Intersections Based on Vehicle Position in the Queue. Period. Polytech. Transp. Eng. 2021, 49, 359–368. [Google Scholar] [CrossRef]
- Hajbabaie, A.; Tajalli, M.; Bardaka, E. Effects of Connectivity and Automation on Saturation Headway and Capacity at Signalized Intersections. Transp. Res. Rec. J. Transp. Res. Board 2024, 2678, 31–46. [Google Scholar] [CrossRef]
- Ranasinghe, W.; Bunker, J.; Bhaskar, A. (Eds.) Saturation Headway Variation at a Signalised Intersection Approaches with a Downstream Bus Stop and Bicycle Lane; Australasian Transport Research Forum: Auckland, New Zealand, 2017. [Google Scholar]
- Zhao, Y.; Zhang, W.; Lu, J.; Zhang, W.; Ma, Y. Estimation of Saturation Flow Rate and Start-Up Lost Time for Signal Timing Based on Headway Distribution. J. Discret. Dyn. Nat. Soc. 2015, 2015, 304823. [Google Scholar] [CrossRef]
- Yan, M.; Zhuang, M.; Kwok, A.P.K. Exploring the effects of traffic light countdown displays on the driving behaviours of drivers with different personality dispositions: A VR-simulated study. Transp. Res. Part F Traffic Psychol. Behav. 2024, 105, 99–115. [Google Scholar] [CrossRef]
- Hussain, Q.; Alhajyaseen, W.K.M. Nudging drivers: The influence of innovative green-phase forewarning systems on drivers’ start-up behavior at signalized intersections. IATSS Res. 2025, 49, 1–9. [Google Scholar] [CrossRef]
- Vadeby, A.; Howard, C. Spot speed cameras in a series—Effects on speed and traffic safety. Accid. Anal. Prev. 2024, 199, 107525. [Google Scholar] [CrossRef]
- Sinha, D.; Divya, S.; Anjali, C.; Keethigha, R. (Eds.) Traffic Signal Violation Detection System Using Computer Vision. In Proceedings of the International Conference on Cognitive Robotics and Intelligent Systems (ICC-ROBINS), Coimbatore, India, 17–19 April 2024; IEEE: New York, NY, USA, 2024. [Google Scholar]
- Kodama, N.; Harada, T.; Miyazaki, K. Traffic Signal Control System Using Deep Reinforcement Learning With Emphasis on Reinforcing Successful Experiences. IEEE Access 2022, 10, 128943–128950. [Google Scholar] [CrossRef]
- Beklaryan, A.L.; Beklaryan, L.A.; Akopov, A.S. Simulation model of an intelligent transportation system for the “smart city” with adaptive control of traffic lights based on fuzzy clustering. Bus. Inform. 2023, 17, 70–86. [Google Scholar] [CrossRef]
- Bhandari, R.; Lama, A.; Dhital, N.B. Waiting Time Countdown Displays Affect the Idle-Stopping Behavior of Motorcyclists at Signalized Traffic Intersections. J. Environ. Sci. 2024, 10, 54–62. [Google Scholar] [CrossRef]
- Sadeghi-Bazargani, H.; Hazegh, E.; Afshari, A.; Anbardan, M.A.; Yazdani, M. Investigating the all-red-light violation and the increase in front-to-side crashes at signalized intersections. Med. J. Tabriz Univ. Med. Sci. 2024, 46, 210–216. [Google Scholar] [CrossRef]
- Zhou, W.; Wang, Y.; Liu, M.; Liu, T.; Zhang, P.; Ma, Z. Traffic Signal Phase and Timing Estimation Using Trajectory Data From Radar Vision Integrated Camera. IEEE Trans. Intell. Transp. Syst. 2024, 25, 18279–18291. [Google Scholar] [CrossRef]
- Transportation Research Board, N.R.C. Highway Capacity Manual; The National Academies of Sciences, Engineering, and Medicine: Washington, DC, USA, 2010. [Google Scholar]
- Çalışkanelli, S.P.; Coşkun Atasever, F.; Tanyel, S. Start-up lost time and its effect on signalized intersections in Turkey. J. Promet Traffic Transp. Res. Part D Transp. Environ. 2017, 29, 321–329. [Google Scholar] [CrossRef]
- Majeed, A.A.; Zephaniah, S.O.; Mehta, G.; Jones, S. Field-based saturation headway model for planning level applications. Int. J. Traffic Transp. Eng. 2014, 3, 207–215. [Google Scholar]
- Hamad, K.; Abuhamda, H. Estimating base saturation flow rate for selected signalized intersections in Doha, Qatar. J. Traffic Logist. Eng. 2015, 3, 168–171. [Google Scholar] [CrossRef]
- Alam, M.J.B.; Osra, K.A.; Al-Bar, H.O.; Zahran, S.Z. Signalized intersection capacity adjustment factors for Makkah, Saudi Arabia. Can. J. Transp. 2010, 4, 54–66. [Google Scholar]
- Joseph, J.; Chang, G.-L. Saturation flow rates and maximum critical lane volumes for planning applications in Maryland. J. Transp. Eng. 2005, 131, 946–952. [Google Scholar] [CrossRef]
- Stanojević, P.; Jovanović, D.; Lajunen, T. Influence of traffic enforcement on the attitudes and behavior of drivers. Accid. Anal. Prev. 2013, 52, 29–38. [Google Scholar] [CrossRef]
- Fitzsimmons, E.J.; Hallmark, S.L.; Orellana, M.; McDonald, T.; Matulac, D. Investigation of violation reduction at intersection approaches with automated red light running enforcement cameras in Clive, Iowa, using a cross-sectional analysis. J. Transp. Eng. 2009, 135, 984–989. [Google Scholar] [CrossRef]
- Retting, R.A.; Ferguson, S.A.; Hakkert, A.S. Effects of Red Light Cameras on Violations and Crashes: A Review of the International Literature. Traffic Inj. Prev. 2003, 4, 17–23. [Google Scholar] [CrossRef]
- Shin, K.; Washington, S. The impact of red light cameras on safety in Arizona. Accid. Anal. Prev. 2007, 39, 1212–1221. [Google Scholar] [CrossRef]
- Baratian-Ghorghi, F.; Zhou, H.; Wasilefsky, I. Effect of Red-Light Cameras on Capacity of Signalized Intersections. J. Transp. Eng. 2016, 142, 04015035. [Google Scholar] [CrossRef]
- Al-Mistarehi, B.W.; Alomari, A.H.; Zoubi, M.S.A. Investigation of saturation flow rate using video camera at signalized intersections in Jordan. Open Eng. 2021, 11, 216–226. [Google Scholar] [CrossRef]
- Limanond, T.; Chookerd, S.; Roubtonglang, N. Effects of countdown timers on queue discharge characteristics of through movement at a signalized intersection. Transp. Res. Part C Emerg. Technol. 2009, 17, 662–671. [Google Scholar] [CrossRef]
- Islam, M.R.; Hurwitz, D.S.; Macuga, K.L. Improved driver responses at intersections with red signal countdown timers. Transp. Res. Part C Emerg. Technol. 2016, 63, 207–221. [Google Scholar] [CrossRef]
- Jatoth, J.; Singh, N.K.; Mehar, A. Evaluating the Performance of Signalized Intersection with Signal Countdown Timer. Int. J. Intell. Transp. Syst. Res. 2021, 19, 182–190. [Google Scholar] [CrossRef]
- Chiou, Y.-C.; Chang, C.-H. Driver responses to green and red vehicular signal countdown displays: Safety and efficiency aspects. Accid. Anal. Prev. 2010, 42, 1057–1065. [Google Scholar] [CrossRef] [PubMed]
- Kampstra, P. Beanplot: A Boxplot Alternative for Visual Comparison of Distributions. J. Stat. Softw. Code Snippets 2008, 28, 1–9. [Google Scholar] [CrossRef]
Disclaimer/Publisher’s Note: The statements, opinions and data contained in all publications are solely those of the individual author(s) and contributor(s) and not of MDPI and/or the editor(s). MDPI and/or the editor(s) disclaim responsibility for any injury to people or property resulting from any ideas, methods, instructions or products referred to in the content. |
© 2025 by the authors. Licensee MDPI, Basel, Switzerland. This article is an open access article distributed under the terms and conditions of the Creative Commons Attribution (CC BY) license (https://creativecommons.org/licenses/by/4.0/).