Abstract
This paper analyzed the current development status of the economy, transportation, and ecology in Xi’an and constructed a coupling coordination evaluation index system. Employing the entropy weight method to determine indicator weights, it adopted the coupling coordination degree model and the obstacle degree model to examine the coupling coordination development level of the three subsystems and identified key obstacle factors at the criterion layer and the indicator layer. The results showed the following: (1) From a temporal perspective, the coordination degree among the three subsystems in Xi’an increased significantly from 0.217 in 2013 to 0.712 in 2023. Its coupling coordination development level showed a steady evolutionary trend, evolving from “Moderately Imbalanced” to “Moderately Coordinated;” (2) The comprehensive ranking of the obstacle degrees of the three system layers was as follows: from 2013 to 2017, economy > transportation > ecology; in 2018, ecology > economy > transportation; in 2019, ecology > transportation > economy; from 2020 to 2023, transportation > ecology > economy; (3) The top five in the ranking of obstacle degree calculation results at the indicator layer were as follows in sequence: investment in environmental pollution control, built forestry areas, road passenger turnover, highway density, and length of highways; (4) The key obstacle factors at the indicator layer exhibited an evolutionary trend of “economic dominance → transportation dominance → interweaving of ecology and transportation.” Ultimately, it proposed corresponding implementation paths, aiming to promote the collaborative development of economic growth model innovation, green transformation of transportation, and ecological protection.
Keywords:
“dual carbon” goals; economic development; transportation; ecological construction; coupling coordination degree MSC:
91B02; 91D10
1. Introduction
On 18 July 2024, the Third Plenary Session of the 20th Central Committee of the Communist Party of China deliberated and adopted the Decision of the Central Committee of the Communist Party of China on the Further Comprehensively Deepening Reform and Advancing the Chinese Path to Modernization. The Decision emphasized the guiding ideology for further comprehensively deepening reform. It pointed out that focusing on building a beautiful China, accelerating the comprehensive green transformation of economic and social development, improving the ecological environment governance system, and promoting development that prioritizes ecology, conserves resources, and is green and low-carbon are among the goals of comprehensively deepening reform. These efforts aim to facilitate harmonious coexistence between humanity and nature [1].
China is currently transitioning from a phase of high-speed growth to one of high-quality development. However, the traditional extensive development model continues to exert pressure on the quality of the ecological environment. In September 2020, President Xi Jinping proposed that “China will achieve carbon peak before 2030 and strive to achieve carbon neutrality before 2060.” This declaration signified that China had entered a new stage of fully implementing green and low-carbon development. The demand for low-carbon development not only necessitated new breakthroughs and innovations in the socioeconomic growth model, but also posed new challenges for environmental quality and the green development of transportation. In February 2022, the Ninth Ministerial–Provincial Consultative Meeting on the Development of Transportation in the Yangtze River Economic Belt was convened by the Ministry of Transport. Li Xiaopeng emphasized the need to “focus on enhancing the sustainable development level of integrated transportation and accelerate the development of green transportation,” thereby implementing the concept of “ecological priority and green development” [2]. Economic development serves as the core task, ecological construction forms the foundation for development, and transportation acts as a critical support. The three systems of economy, transportation, and ecology are inherently inseparable, and their coordinated development is of vital significance for the high-quality development of cities [3].
The transportation network serves as a dynamic system for economic development, connecting various links of social production, distribution, exchange, and consumption within and outside regions to promote high-quality economic growth. Meanwhile, high-quality economic development generates new transportation demands, drives the improvement of the functional and structural integrity of transportation systems, and provides financial support for the renewal of the transportation infrastructure. As one of China’s national central cities and a core hub of the Belt and Road Initiative, Xi’an acts as a geographic pivot connecting the east and the west, as well as the north and the south. As a center of the economy, culture, and transportation, it is essential for Xi’an to achieve comprehensive and coordinated development.
This paper puts forward the following research questions:
- (1)
- What exactly is the current development status of Xi’an’s economy, transportation, and ecology? Under the requirements of the “dual carbon” goals, how can a scientific and systematic evaluation index system for the coupling and coordination of Xi’an’s economy, transportation, and ecology be constructed?
- (2)
- From 2013 to 2023, how did the degree of coordinated development of Xi’an’s economy, transportation, and ecology evolve under the constraints of “dual carbon”?
- (3)
- In different historical stages, which of the three subsystems (economy, transportation, or ecology) constitutes the main obstacle to the overall synergistic effect? What specific indicators are the key factors hindering their development? How do the obstacle degrees of these factors rank over the entire timespan?
- (4)
- Based on quantitative diagnosis, how can low-carbon transportation development, green industrial transformation, and ecological carbon sink expansion be simultaneously promoted to continuously support Xi’an’s high-quality growth?
Therefore, this paper took Xi’an, a national central city, as the research object for the first time, integrated the requirements of the “dual carbon” goals, broke through the traditional dualistic perspective, and constructed an economy–transportation–ecology ternary coupling coordination evaluation index system, thus filling the dual gaps in research objects and dimensions. Meanwhile, it was committed to applying mathematical methods and models to new research issues. Based on the statistical data from 2013 to 2023, it used the entropy weight method to determine weights and adopted the coupling coordination degree model and the obstacle degree model to analyze the complex interactions and coordinated development of the economic, transportation, and ecological systems under the background of the “dual carbon” goals, so as to put forward the realization path for the coordinated development of Xi’an’s economic, transportation, and ecological systems and provide scientific decision-making support for the sustainable development of urban research.
The remaining sections are organized as follows. Section 2 sorts out and reviews the relevant literature. Section 3 analyzes the current development status of Xi’an from the aspects of economy, transportation, and ecology, respectively. Section 4 constructs an economic–transportation–ecological coupling coordination evaluation index system under the “dual carbon” goals. Section 5 presents the research methods of the paper. Section 6 adopts the entropy weight method to determine the index weights. The system coupling coordination degree model is used to study the coupling coordination development degree of the three subsystems and their temporal evolution characteristics. With the help of the obstacle degree model, the key obstacle factors in the criterion layer and indicator layer are identified and judged. Section 7 presents the results of the paper, along with policy implications and relevant recommendations. Section 8 provides a summary of the paper and elaborates on the academic, theoretical, and practical values of this study, as well as directions for further research.
2. Literature Review
At present, scholars at home and abroad have achieved certain research results on the related themes of the coupling relationship in the coordinated development of economy, transportation, and ecology.
2.1. Research on the Relationship Between Economy and Transportation Development
Urban transportation systems are critical infrastructure supporting urban development, directly impacting economic productivity and quality of life [4]. Transport accessibility and economic development complement each other and are inseparable from each other, serving as a crucial component of regional integrated development [5]. As early as in 1776, British economist Adam Smith first mentioned the issue of transportation in his seminal work “The Wealth of Nations,” stating that “[a]mong all the means of promoting economic development, transportation is the most ideal instrument.” The World Bank emphasized in its 1994 Development Report that the success of transportation infrastructure construction directly determines a country’s level of economic development, and that the development of transportation is inevitably intertwined with economic growth. Transportation development can strengthen the spillover effect of economic growth among regions. Accurate detection of traffic images can effectively reduce the incidence of traffic accidents and improve social, economic, and life safety [6]. Rational prediction of traffic flow can optimize resource scheduling, improve the efficiency of road network resource utilization, help travelers plan their routes, and save social, economic, and human resources [7,8]. One study analyzed panel data from the Middle East and North Africa (MENA) region for the years 2000 to 2016, examining the impact of transportation energy consumption and transportation infrastructure on economic growth. The study confirmed the positive contribution of transportation infrastructure to economic growth in all regions [9]. A PVAR model was constructed, selecting gross domestic product (GDP) and road transportation infrastructure density as evaluation indicators, to assess the relationship between transportation and economic development in 12 cities in Inner Mongolia from 2000 to 2016. The results indicated that regions with higher road transportation infrastructure density experienced more rapid economic development [10]. Another study employed the Granger causality test model to analyze the relationship between economic development and transportation in 18 countries from 1970 to 2017. This research found that transportation development helps expand the scope of business activities and improve the efficiency of goods transportation, thereby promoting economic growth [11]. Arguments showed that transportation, as a crucial factor for regional economic development, provides impetus, support, and security for regional economic growth [12]. One study pointed out that the development of transportation can enhance the accessibility of various regions within an area, enabling the natural flow of production materials, labor, and other factors. By improving transportation conditions, regions can achieve more rational division of labor, attract more talent, and thereby enhance the core competitiveness of enterprises [13].
2.2. Research on the Relationship Between Economic and Ecological Development
The consensus that economic development and ecological environment should be coordinated has been widely reached. In 2000, an analytical framework was proposed to explore the interactions between socioeconomic systems and ecological environments, advocating that harmonious development between the two could be achieved through such mechanisms [14]. The relationship between per capita income and environmental quality in 30 countries was analyzed using the environmental Kuznets curve (EKC) and assessed sustainable development [15]. Energy consumption and economic growth will exacerbate the ratio of transportation CO2 emissions [16]. The identification of emission sources and the design of emission reduction pathways have become crucial components of air quality prevention and control [17]. To alleviate resource conflicts, it is necessary not only to coordinate scarce resources, but also to allocate shared resources. Consequently, the contradiction between social economy and ecological environment in most resource-based cities has become increasingly prominent [18]. The greater the negative production effects of pollution, the more investment in pollution control and the lower the consumption and economic growth rate [19]. The coupling coordination degree model for economy and ecology was constructed, using 34 cities in Northeast China as research objects. The model deeply analyzed the evolution trends of coordination degree from both temporal and spatial dimensions. Additionally, corresponding optimization strategies were proposed based on the characteristics of the evolution [20]. An indicator system was developed to evaluate the development levels of ecological environment, social, and economic subsystems in five cities along China’s Yellow Sea coast over the past decade, and the coupling coordination degree between subsystems using the coupling coordination degree model was calculated [21]. The coupling coordination model was used, relying on data related to tourism economy and transportation from 2007 to 2019, to objectively analyze the interactive and coordinated state of tourism economy and transportation in Anhui Province over the past 13 years [22].
2.3. Research on the Relationship Between Transportation and Ecological Development
The ecological environment is the foundation for transportation development, while transportation development, to a certain extent, can exert external effects on the ecological environment. It is essential to achieve sustainable transportation development with minimal negative impact on the environment [23]. Researchers have pointed out that transportation activities not only directly affect air quality, but also further influence society by altering living environments [24]. From a greening perspective, process-based supply chain assessment methods have been proposed for the development of environmental strategies in the railway transportation sector [25]. From the perspective of integrated transportation, multimodal transport has a lower environmental impact compared to single-mode transport and is considered a feasible eco-friendly transportation method [26]. Taking Lhasa as a case study, challenges faced by mountainous towns in coordinating transportation development and ecological environment have been thoroughly analyzed, with targeted suggestions and measures proposed [27]. Based on diverse data sources, including the Guizhou Statistical Yearbook, national economic and social development statistical bulletins, high-resolution satellite remote sensing images, and GIS spatial analysis methods, a quantitative analysis and evaluation of the transportation development level and ecological environment quality in various cities (prefectures) in 2015 and 2020, as well as the coupling and coordination relationship between the two, have been conducted [28]. Using Chinese provincial panel data from 2009 to 2020, the comprehensive development level of rapid transportation systems and tourism ecological efficiency was measured through the entropy weight method, the tourism carbon emission estimation model, and the Super-SBM model. The Tapio decoupling model and the Markov model were employed to reveal the spatiotemporal evolution patterns and state transition characteristics of the decoupling relationship between the two, providing references for the high-quality development of transportation systems and tourism ecology [29].
2.4. Research on the Integrated and Coordinated Development Relationship Among the Three
In 1998, Hans W. Gottinger proposed that once planners had made decisions regarding the political, social, and other practical aspects of the problem that were difficult to quantify, models would facilitate the selection of the most economical system [30]. Taking Anhui Province as a research object, an in-depth analysis was conducted on the coordination between the binary and ternary systems of energy, economy, and environment. A system dynamics (SD) model was constructed, and scenario analysis was used to thoroughly examine the coordination of the three systems under four different scenarios in Anhui Province [31]. A model was developed to evaluate the coordination among the economy, ecology, and society in Shaanxi Province and to predict the coordination development trend over the next five years. The study employed the data envelopment analysis (DEA) model to deeply analyze the effectiveness of coordinated development among these three areas. The results showed that the coordination in Shaanxi Province is currently in a transitional phase from disharmony to harmony [32]. Research has found that the integrated development level of economy, transportation, and ecological environment in the regions along the New Western Land–Sea Corridor is steadily increasing. The main obstacles to coordinated development in this region, calculated using the obstacle degree model, include passenger volume, passenger turnover, and the proportion of the secondary industry [33]. The coupling coordination degree model was used to analyze the evolution characteristics and spatial distribution features of the coordinated development degree among the transportation, regional economy, and ecological environment systems in the nine provinces along the Yellow River from 2010 to 2020. The study concluded that there are breakpoints in the comprehensive evaluation values of different provinces, all of which show a slow upward trend, and the coupling degree is in a state of high-quality coordination [34]. Based on the panel data of 16 major prefecture-level cities in the Chengdu–Chongqing region from 2010 to 2020, a quantitative study found that the coupling coordination level of transportation, economy, and ecology increases year by year. The transportation system and the economic system are Granger causes of each other, the transportation system is a Granger cause of the ecological system, and the economic system is a Granger cause of the ecological system [35]. The mutual coordination and cooperation among the three have a positive promoting effect on the comprehensive development of cities [36].
In summary, based on the sustainable development and synergetic theories, various systems such as the economy, transportation, and ecology, as well as their internal elements, should achieve mutual cooperation and coordinated synchronization during operation and implementation. Therefore, research on the intrinsic connections between transportation, economy, and ecological environment can generally be divided into two aspects: examining the development relationships among these systems and exploring ways to achieve organic integration and benign coordinated development among them. However, there are still several shortcomings:
- (1)
- In terms of research objects, most studies have been conducted at the national or provincial levels. In recent years, research has begun to extend to urban agglomerations. There have also been studies focusing on major strategic regions for development, such as the Beijing–Tianjin–Hebei area, the Yangtze River Economic Belt (Yangtze River Delta), the Guangdong–Hong Kong–Macao Greater Bay Area (Pearl River Delta), the Northeast region, the Central Yangtze River Urban Agglomeration, and the Yellow River Basin. However, there are relatively few studies that focus on national central cities as research objects.
- (2)
- From the perspective of research focus, the existing studies on coupling coordination have predominantly concentrated on the coordinated development between economic growth and the ecological environment, as well as between economic growth and transportation. In contrast, research on the coupling coordination between transportation and the ecological environment is relatively limited. Moreover, studies that explore the coupling coordination among transportation, economy, and ecology are even scarcer, especially those examining the coordinated development of these three aspects under the “dual carbon” goals. Additionally, research on the influencing factors and obstacles to the coordination of ternary systems is also relatively insufficient.
- (3)
- From the perspective of research methods, scholars have employed various models and methods such as the autoregressive (AR) model, vector autoregressive (VAR) model, synthetic control method, data envelopment analysis (DEA) method, game theory, Super-SBM model, improved gravity model combined with GIS methods, etc., to analyze the coordinated development relationship between transportation, economy, and ecology. However, there are relatively few relevant models, and most studies rely on establishing coordination degree models for evaluation. The use of a single method has its limitations. It is also necessary to consider constructing an obstacle degree model to study the interactive promotion relationships among the subsystems and the influencing factors of coordinated development.
Therefore, the core innovations of this paper lie in achieving dual breakthroughs in cross-method integration and the perspective of the national central city.
- (1)
- It constructed a core framework for comprehensively evaluating the coupling and coordination status by integrating multiple mathematical methods. The entropy weight method was used for objective weighting to ensure the scientific validity of the evaluation. The coupling model was employed to quantify the synergistic relationship of the economic–transport–ecological ternary system, and the obstacle degree model was applied to identify the key restrictive factors for system coordination. Finally, a complete “evaluation–diagnosis–optimization” method chain was formed. Thus, it applied relatively mature and applicable methodologies to study new themes and issues, verifying the practicality and innovativeness of the approach.
- (2)
- Taking Xi’an (2013–2023) as a sample, it filled the gap in the research on the transport–economic–ecological ternary coupling of the national central city under the “dual carbon” goals, broke through the limitations of traditional dualistic research, and broadened the research scope while deepening the research level.
- (3)
- It first drew on the Evaluation Index System for Building a Powerful Transportation Country, determined the criterion layer and the indicator layer through extensive literature review, and compared, screened, and updated relevant indicators. By comprehensively considering the consistency between economic, transportation, and ecological development and policies, an evaluation index system was established. The connotations, screening logic, and interrelationships of the indicators were clarified to ensure the timeliness and comprehensiveness of the system.
3. Current Status of Economic, Transportation, and Ecological Development in Xi’an Under the Dual Carbon Goals
3.1. Current Status of Economic Development in Xi’an
3.1.1. Significant Growth in Economic Aggregate
Xi’an is located in the Guanzhong Plain in the middle reaches of the Yellow River Basin. As a major economically developed city in northwest China, it boasts relatively balanced social resources [37]. In recent years, Xi’an has shown a strong momentum of economic development, with its economic scale continuing to expand. As shown in Figure 1, the regional GDP of Xi’an showed a year-on-year increasing trend from 2019 to 2024. Among them, the growth rates in 2020 and 2021 fell slightly, while those in 2022 and 2023 rebounded. In 2024, the regional GDP of Xi’an reached 1331.78 billion yuan, with a year-on-year growth of 4.6%, indicating that Xi’an’s economy is steadily recovering, and economic activities have started smoothly and continued to develop in a good direction.
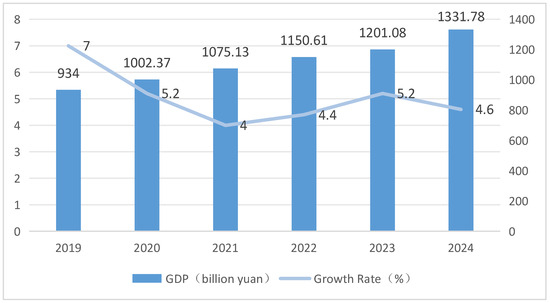
Figure 1.
Regional gross domestic product (GDP) and growth rate of Xi’an from 2019 to 2024. Data source: Xi’an Statistical Yearbook 2024 and the Statistical Bulletin of National Economic and Social Development.
3.1.2. Continuous Optimization of the Industrial Structure
Data in Table 1 show that from 2010 to 2024, the industrial structure of Xi’an changed from 4.17:40.40:55.43 to 2.40:29.09:68.51.Except for certain individual years, the proportions of the primary and secondary industries generally exhibited a downward trend, while the tertiary industry steadily increased and became the most important engine driving Xi’an’s economic growth, showing the distinct characteristics of “the tertiary industry leading, the secondary industry being stable, and the primary industry shrinking.” The leading industries mainly include five types: high-technology industries, equipment manufacturing, tourism, cultural industries, and modern service industries. These industries not only play a crucial role in Xi’an’s economic development, but also serve as key drivers for promoting the optimization and upgrading of its industrial structure.

Table 1.
Gross domestic product (billion yuan) and proportion (%) of three industries in Xi’an from 2010 to 2024.
3.1.3. Sustained Increase in Investment Intensity
Investment, as one of the most important modes of economic growth, can stimulate economic activities, increase demand and supply, and ensure stable and healthy operation of the economy. Figure 2 reflects the changes in the growth rate of the total social fixed asset investment in Xi’an from 2010 to 2024. It can be seen that except for 2015 and 2021, the investment maintained a growth trend, and the investment growth rate was relatively high before 2015, indicating that Xi’an had a strong intensity of fixed asset investment during these years. However, a relatively obvious negative growth occurred in 2015, which is consistent with the decline in Xi’an’s total GDP in 2015 mentioned above, further illustrating the close relationship between investment and economic growth.
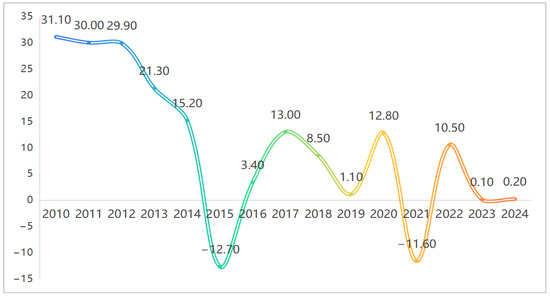
Figure 2.
Growth rate of the total social fixed asset investment in Xi’an from 2010 to 2024 (%). Data source: Xi’an Statistical Yearbook 2024 and the Statistical Bulletin of National Economic and Social Development.
3.2. Current Status of Transportation Development in Xi’an
3.2.1. Infrastructure
In recent years, Xi’an has maintained a high level of investment in transportation and made simultaneous efforts in green infrastructure construction.
According to data from the Xi’an Statistical Yearbook and the Statistical Bulletin of National Economic and Social Development, in 2022, infrastructure investment in Xi’an increased by 0.7%, among which investment in transportation, storage, and postal services grew by 18.4% compared with the previous year. By the end of the year, the production of urban rail transit vehicles reached 548, a year-on-year increase of 45.7%, and the number of international routes rose to 104, 7 more than that at the end of the previous year. By the end of 2023, the number of motor vehicles in Xi’an was 5.3 million, among which private cars accounted for 4.21 million, an increase of 284,600. In 2024, transportation investment amounted to 7.84 billion yuan. From January to November, Xi’an Airport opened 15 new international routes. By the end of the year, the number of motor vehicles reached 5.74 million, with private cars totaling 5.21 million. The T5 terminal building and the integrated transportation center of the Xi’an Xianyang International Airport were put into operation. The Xi’an Land Port-type National Logistics Hub operated 4985 China–Europe freight trains, and the Airport-type National Logistics Hub handled 290,500 tons of cargo and mail, a year-on-year increase of 9.31%.
Meanwhile, in response to the goals of “carbon peak” and “carbon neutrality” as well as the requirements of ecological civilization construction, Xi’an has vigorously promoted the construction of greenways. It has made full use of natural advantages such as the Qinling Mountains, the Weihe River, the Fenghe River, and the Chanba River to build the “Three Rivers and One Mountain” circular greenway. In 2023, Xi’an added 5.56 million square meters of urban green space, completed 208 km of greenways, and opened 4 urban parks and 109 pocket parks to the public. In 2024, Xi’an built 60 km of new greenways and added 2.09 million square meters of green space throughout the year, expanding the urban green space and enabling citizens to fully enjoy the benefits brought by green development.
3.2.2. Transportation Environmental Protection
Transportation environmental protection serves as a key indicator for evaluating the development of green transportation. In 2023, the urban green coverage rate in Xi’an reached 44.42%, and the cleaning area of urban roads expanded to 150 million square meters. The overall air quality significantly improved, with the number of excellent and good air days accumulating to 228 days throughout the year, an increase of 38 days compared to the previous year. The annual average concentrations of major air pollutants also decreased, among which the concentrations of nitrogen dioxide, inhalable particulate matter (PM10), and fine particulate matter (PM2.5) dropped by 2.6%, 4.7%, and 5.9% year-on-year, respectively. In 2021, the average traffic flow decreased by 923 vehicles per hour compared to 2020, and the road traffic noise level was reduced by 0.7 decibels from the previous year, with an overall good evaluation, indicating that the pollution degree was effectively mitigated (Table 2).
Table 2.
Road noise detection results in Xi’an from 2013 to 2021.
3.2.3. Green Travel
With the acceleration of urbanization and motorization, the population density in Xi’an has been continuously rising, and travel demand has surged accordingly. As a result, per capita road resources have become increasingly scarce, and energy consumption costs have increased significantly. According to the 2023 Xi’an Transportation Development Annual Report, the daily travel volume of urban residents in Xi’an reached 12.87 million person-times. The motorized travel share of public transportation reached 55.90%, an increase of 0.3 percentage points compared to 2022. The average travel frequency of residents was 1.79 person-times per day. In 2023, the average straight-line commuting distance remained at 8.4 km. As shown in Table 3, in terms of travel mode choices, the proportions of walking and bus riding among residents in the central urban area of Xi’an decreased, stabilizing at approximately 25% and 15%, respectively. The proportion of rail transit use increased, from 16% in 2020 to 19.20% in 2023. Meanwhile, the proportion of car travel also increased, reaching 21.20%, and the total share of motorized travel rose to 61.4%.
Table 3.
Changes in travel indicators in the central urban area of Xi’an (units: %).
A questionnaire survey was conducted to study the green travel situation of Xi’an residents. The survey results show that 89.01% of the residents are aware of the importance of green travel and believe that travel modes will have an impact on the environment. In addition, 72.38% of the residents stated they are willing to install purification devices on the exhaust pipes of private cars. The proportion of green travel has reached 78%, which still needs to be further improved.
3.2.4. Public Transportation
In 2023, Xi’an had 8635 public transport vehicles and 15,457 taxis, among which green energy vehicles accounted for 100%. The public transport motorized travel share rate stood at 63.6%.The city had a total of 418 public transport routes with a combined length of 7420.6 km, and the 500-m radius coverage rate of bus stops in the central urban area reached 100%. To advance the diversification of public transport services and cater to the travel demands of different groups, Xi’an has launched various services such as community buses, customized buses, and online-hailed buses. In terms of integration between rail transit and ground public transport, the connection rate of regular bus routes within a 100-m radius of rail transit stations in the central urban area achieved 100%. Xi’an had opened 11 rail transit lines, with a total operating mileage of 353 km. However, there remain issues at individual stations, including low bus departure frequency and inadequate transfer connections, which require further optimization.
3.2.5. Slow-Moving Traffic
Slow-moving traffic mainly covers such travel modes as walking and cycling. According to the feedback from the questionnaire survey, the proportion of Xi’an residents choosing slow-moving traffic modes is approximately 38%. Statistical data show that compared with 2020, the walking network density in Xi’an decreased by 2.7 km/km2 in 2021, reaching 6.3 km/km2 in 2023, but it is still lower than the national recommended standard of 8.0 km/km2. In addition, the number of public bicycles put into use in Xi’an has increased to 79,000 with the service scope covering the entire main urban area in 2022. The number of shared bicycles put into use is stable at about 280,000, and the market structure remains stable [38].
3.3. Current Status of Ecological Development in Xi’an
3.3.1. Synergistic Innovation for Pollution Reduction and Carbon Emission Mitigation
Xi’an has been selected as one of the first batch of national pilot cities for synergistic innovation in pollution reduction and carbon emission mitigation. It is actively implementing measures to achieve synergistic effects in pollution reduction and carbon emission mitigation across multiple sectors, including energy, industry, urban–rural construction, and transportation, to promote the comprehensive green and low-carbon transformation of the economy and society. In the energy sector, Xi’an is dedicated to rapidly constructing a green and low-carbon energy system by implementing winter clean heating renovations, waste incineration power generation projects, and natural gas boiler retrofits. Meanwhile, in light of local conditions, Xi’an is rationally utilizing renewable energy sources such as solar energy and geothermal energy.
3.3.2. Green Transportation System Construction
Xi’an actively promotes the use of new energy vehicles and is committed to achieving the electrification transformation of urban public service vehicles. All newly added or updated buses, taxis (including online car-hailing vehicles), garbage collection trucks, and light sanitation vehicles each year will fully adopt new energy or clean energy-driven models. In addition, the city is dedicated to the energy-saving and carbon-reduction renovation and upgrading of the existing transportation infrastructure, aiming to build low-carbon (near-zero carbon) stations, airports, and highway service areas.
3.3.3. Ecological Restoration and Biodiversity Protection
Xi’an has actively promoted the integrated protection and restoration project of mountains, waters, forests, farmlands, lakes, grasses, and deserts at the northern foot of the Qinling Mountains, significantly enhancing the water conservation capacity and regional ecosystem stability of the northern Qinling foot. Over the past decade, Xi’an’s forest coverage rate has increased by 3.04%, the total standing timber volume has increased by 4.65 million cubic meters, and forest land has increased by 194,100 mu.
3.3.4. Circular Resource Utilization and Green Disposal
Xi’an has established a professional recycling system for domestic renewable resources, promoted the agglomerated development of renewable resource processing and utilization industries, and improved the pre-treatment capacity of waste materials after recycling. Meanwhile, it has improved the closed-loop treatment system for agricultural waste, promoted the “five-way” comprehensive utilization of straw, and the comprehensive utilization rate of major crop straw in the city has reached and remained above 97%.
4. Evaluation Index System for Economic–Transportation–Ecological Coupling Coordination in Xi’an
On 17 March 2022, the Ministry of Transport of the People’s Republic of China released the Evaluation Indicator System for the Construction of a Transportation-Powerful Country, which is guided by the five core concepts of “safety, convenience, efficiency, greenness, and economy.” It designed 20 evaluation indicators around a three-level framework of “basic characteristics, evaluation dimensions, and evaluation indicators.” Based on the principles of systematicity, scientific validity, operability, and sustainability, this paper closely integrates the content of the Evaluation Index System for Building a Transportation Power and industry characteristics, analyzing urban transportation within the social and economic system. Through comparative studies of a large number of literature sources [23,24,25], repeated screening and optimization of redundant indicators, and comprehensive consideration of the consistency among economic, transportation, and ecological development and policies, this paper constructs an evaluation index system for the coupling and coordination of economy, transportation, and ecology in Xi’an, as shown in Table 4.
Table 4.
Evaluation index system for economic–transportation–ecological coupling coordination in Xi’an.
The selection of indicators for each dimension in the evaluation index system follows the principles of functional positioning orientation, systematic logical consistency, and controllable data quality. The selected indicators must have stable data sources and unified statistical standards to ensure data availability and comparability. In this system, 9 indicators are selected for the economic field, 10 for the transportation field, and 10 for the ecological field. The target layer, the criterion layer, and the indicator layer are formulated according to the corresponding logical relationships, and the nature of each indicator is described and explained. Except for the three indicators of the volume of industrial wastewater discharged, the total volume of industrial waste gas emissions, and general solid waste generation, which are negative indicators, all indicators are positive. The specific principles for indicator selection and their interpretations are as follows:
- (1)
- Economic indicators. For the selection of indicators in the economic dimension, the “scale–structure–people’s livelihood” three-dimensional balance criterion is followed, with simultaneous consideration of alignment with the core objectives and comprehensive data representativeness. GDP and fixed asset investment by the whole society are used to characterize the macroeconomic scale and potential for reproduction. The added-value structure of the three industries (primary, secondary, and tertiary) reflects the path of industrial evolution, transformation, and upgrading. Per capita disposable income, total retail sales of social consumer goods, and regional government revenue reveal residents’ welfare levels, consumption potential, and public service supply capacity. Together, these indicators enable a systematic measurement of the quantity, quality, and inclusiveness of economic growth. They cover the key links in economic activities, including economic growth, consumption, investment, and income. The indicators mainly include the following:
- GDP: refers to the final results of production activities of all resident units in a country (or region) within a certain period (usually one year). As a core indicator for measuring economic scale and development level, it reflects the overall economic activity and market capacity and can be used for comparing economic strength among different countries or regions.
- Per capita GDP: calculated by dividing GDP by the total population, it reflects the average economic output of residents and is commonly used to compare the living standards and economic development stages of different regions.
- Total retail sales of social consumer goods: reflect the scale of the consumer market and residents’ consumption capacity. As one of the key drivers of economic growth, it demonstrates the fundamental role of consumption in the economy.
- Regional government revenue: measures the financial resources of local governments. The level of revenue affects investment in public services, infrastructure construction, and other fields.
- Fixed asset investment by the whole society: represents the total workload and related expenses of construction and acquisition of fixed assets by the entire society within a certain period. Reflecting the scale of investment, it directly stimulates economic growth and serves as an important driver of economic development.
- Value added of the primary/secondary/tertiary industry: reflect the contributions of agriculture, industry and construction, and the service sector, respectively, to the economy and can be used to analyze the rationality of the industrial structure and trends in economic transformation.
- Per capita disposable income of urban households: a key indicator for measuring residents’ living standards, consumption capacity, and quality of life, it directly influences the potential of the consumer market and trends in consumption upgrading.
- (2)
- Transportation indicators. The construction of indicators in the transportation dimension follows a hierarchical logic of “facility supply–operational efficiency–bearing resilience” while meeting the requirements of balancing infrastructure and operational efficiency, functional adaptation, and objective and dynamic data. Road length and length of expressways, as well as per capita area of paved roads, are used to reflect the scale and layout of transportation infrastructure, thereby measuring the supply of transportation networks. Multimodal transport efficiency and regional mobility are evaluated through indicators such as passenger and freight turnover and number of aircraft takeoffs and landings. Additionally, highway density and the number of public transport vehicles in operation are employed to assess the internal urban transportation bearing capacity and resilience of green travel. Collectively, these indicators form a progressive evaluation system ranging from macro-level networks to micro-level bearing capacities. The indicators mainly include the following:
- Length of highways and length of expressways: reflect the scale of transportation infrastructure. An increase in mileage facilitates regional connectivity and economic exchanges and serves as a key indicator for measuring the level of transportation modernization, regional economic connectivity, and investment attractiveness.
- Highway density: measures the density of the road network. A higher density indicates better traffic convenience and stronger regional economic development potential, which helps reduce logistics costs and promote industrial development.
- Road passenger turnover, railway passenger turnover, and civil aviation passenger volume: reflect the passenger transport scale and market demand for different transportation modes, indicating the activity level of population mobility.
- Freight turnover: comprehensively reflects the freight transport workload of the transportation sector. An increase in turnover indicates improved logistics efficiency, supporting the operation of economic activities.
- Per capita area of paved roads: measures the supply of road resources per urban resident, affecting urban traffic congestion, residents’ travel convenience, and urban operation efficiency.
- Number of aircraft takeoffs and landings: reflects the busyness of airports and the activity level of air transportation and is an important indicator of the competitiveness of aviation hubs.
- Number of public transport vehicles in operation: reflects the capacity of urban public transportation, influencing residents’ travel convenience and the green level of urban transportation.
- (3)
- Environmental indicators. The indicator design for the environmental dimension follows the “pressure–response–well-being” closed-loop paradigm, integrating three criteria: coordination of pollution control and ecological improvement, sustainable development orientation, and cross-system relevance. Volume of industrial wastewater discharged, volume of industrial waste gas emissions, and volume of industrial solid wastes produced are used to quantify the intensity of stress exerted by human activities on ecosystems. Investment in environmental pollution control, rate of non-harmful disposal of garbage, and accumulated area of soil and water loss control measure the input and performance of environmental governance, with an emphasis on assessing environmental friendliness and resource recycling capacity. Per capita park green space, greening coverage rate of the built-up area, and built forestry areas characterize the supply of ecosystem services and the level of residents’ ecological well-being, reflecting improvements in ecological and environmental quality. Together, these indicators form a whole-process “source–control–effect” assessment framework for environmental sustainability. The indicators mainly include the following:
- Volume of industrial wastewater discharged, total volume of industrial waste gas emissions, and volume of industrial solid wastes produced: measure the degree of industrial pollution. Excessive emissions impose pressure on the ecological environment.
- Rate of non-harmful disposal of garbage and volume of industrial solid wastes utilized: reflect the environmental protection level of waste treatment and the ability of resource recycling. A higher ratio indicates a more environmentally friendly approach.
- Investment in environmental pollution control: demonstrates the importance attached to environmental protection and the level of investment, affecting the effectiveness of environmental governance.
- Accumulated area of soil and water loss control: reflects the achievements of soil and water conservation efforts, helping to improve the ecological environment and prevent natural disasters.
- Per capita public green areas, greening coverage rate of the built-up area, and built forestry areas: important indicators for measuring the ecological environment quality of cities and residents’ living comfort, playing a crucial role in enhancing urban livability and biodiversity.
5. Methodology
5.1. Entropy Weight Method
The concept of entropy was proposed by the German physicist Rudolf Clausius in 1865. In the late 1940s, driven by the demands of information theory, entropy was put forward as a mathematical measure to quantify uncertainty [39]. The entropy weight method is an objective weighting technique that determines entropy weights by calculating information entropy based on the dispersion degree of indicator data. The smaller the entropy value, the more dispersed the data, the greater the information content, and the higher the weight, and vice versa [40,41]. The specific implementation steps are as follows:
Step 1: Construct the judgment matrix. Assuming there are m items to be evaluated and n evaluation indicators, a judgment matrix is constructed as follows:
where is the evaluation value of the ith project under the jth index.
Step 2: Normalize the initial matrix. Indicators are generally divided into benefit-type indicators and cost-type indicators. For benefit-type indicators, higher values are better, while for cost-type indicators, lower values are better. Therefore, the first step is to perform dimensionless normalization to eliminate the differences in polarity and units of different indicators [42], which may affect the analysis results.
The normalization formula for benefit-type indicators is as follows:
The normalization formula for cost-type indicators is as follows:
The data are standardized within to avoid the influence of dimensionality.
Step 3: Calculate the weight of the index value of the ith project under the jth index:
Thus, the weight matrix of the data is established.
Step 4: Calculate the entropy weight of the jth index:
In the formula, the constant is as follows:
Step 5: Calculate the index difference coefficient, that is, the information utility value :
The information utility value of an index depends on the difference between its information entropy and 1, which directly affects the weight. The greater the information utility value, the more important it is for the evaluation, and the larger the weight.
Step 6: Calculate the entropy weight of each index. The entropy weight of the jth index is calculated as follows:
5.2. Coupling Coordination Degree Model
In 1781, French mathematician Monge proposed the optimal transportation problem concerning material distribution. Coupling methods began to be applied in the analysis of stochastic processes in fields such as social sciences and economics [43,44]. The coupling degree is an indicator that measures the extent of interaction and influence among multiple systems [45,46]. The coupling coordination degree, on the other hand, is based on the capacity coupling coefficient model in physics. It assesses the coupling and coordination among the economy, transportation, and ecology in Xi’an by drawing on the coupling degree model.
This paper adopts the standard formula of the coupling degree model proposed by Wang Shujia (2021) et al. [47].
In the formula, n is the number of subsystems; represents the value of each subsystem, with a distribution interval of [0, 1], so the coupling degree ranges from 0 to 1. The larger the , the smaller the dispersion degree between subsystems, and the higher the coupling degree; conversely, the lower the coupling degree between subsystems.
Step 1: When n = 3, calculate the coupling degree :
In the formula, represents the coupling degree among the economy, transportation, and ecology, with its value ranging from 0 to 1. The closer the value of is to 1, the higher the coupling degree among the three. If the development levels of the three systems are completely consistent, that is, :
If the development level of one system is extremely low (e.g., ), then:
Step 2: Calculation of the comprehensive development level :
In the formula, , , and represent the weights, and they satisfy the condition . This implies that the importance of each subsystem is assumed to be equal, hence , , and are all set to 1/3.
Step 3: Derivation of the coordination degree formula:
The value of the coupling coordination degree ranges from 0 to 1. The higher the the value, the better the coordination among the systems. Based on the coupling coordination degree classification criteria proposed by relevant scholars [48], the degree of coordination and its levels were meticulously divided. A detailed coupling coordination degree evaluation standard has been established accordingly, as shown in Table 5.
Table 5.
Classification standards for coupling coordination degree levels.
5.3. Obstacle Degree Model
The obstacle degree model is composed of three main components: factor contribution, indicator deviation, and obstacle degree [49,50]. The factor contribution measures the extent to which a specific indicator contributes to the overall objective, which is essentially the indicator weight. The indicator deviation describes the difference between the actual value of the indicator and the optimal result set by the system, and is used to represent this difference in this paper. The obstacle degree refers to the extent to which the indicator restricts the evaluation objective. The obstacle degree model is constructed as follows:
In the model, represents the obstacle degree of the jth evaluation index in the ith year, is the standardized evaluation index value, represents the weight of the jth evaluation index, and n is the number of evaluation indexes. In the formula, represents the obstacle contribution degree of an index. The index with a larger weight and a higher deviation degree has a greater contribution degree. The denominator is the sum of the obstacle contribution degrees of all indices, which is used for normalization processing to make .
Based on this, is set as the obstacle degree of each system layer as follows:
6. Empirical Analysis
6.1. Analysis of Coupling and Coordinated Development of Economy–Transportation–Ecology in Xi’an
6.1.1. Data Sources
All data in this paper were sourced from the China Environmental Statistics Yearbook, the China Financial Statistics Yearbook, the China Urban Statistics Yearbook, the Shaanxi Provincial Statistical Yearbook, Xi’an Statistical Yearbook, statistical bulletins, and civil aviation airport production statistical bulletins from 2013 to 2023.
6.1.2. Determining Indicator Weights
First, dimensionless processing was performed on the relevant indicators. Then, the weights of each indicator were calculated. The weights of the secondary indicators were obtained by summing the corresponding tertiary indicators, while the weights of the primary indicators were obtained by summing the corresponding secondary indicators. The weight of the target layer was 1, and the final calculation results are shown in Table 6.
Table 6.
Summary of weight calculation results using the entropy method.
6.1.3. Calculation of the Coupling Coordination Degree
The coupling degree and the coupling coordination degree between the regional economy, transportation, and ecological environment subsystems in Xi’an from 2013 to 2023 were calculated using the formula. The data were then classified. The detailed results are shown in Table 7.
Table 7.
Calculation results of the coupling coordination degree.
The research findings indicated that from 2013 to 2023, the coupling and coordinated development level among the economy, transportation, and ecology in Xi’an showed a steadily improving trend, evolving from being moderately imbalanced to moderately coordinated. By 2021, the coupling degree value (C) was higher than both the coordination index value (T) and the coupling coordination degree value (D), indicating that during this research period, the interactions between the regional economy, transportation, and ecological environment in Xi’an were strong and strengthened year by year. The coupling coordination degree was 0.223 in 2013, belonging to the moderately imbalanced category. Although it improved slightly in 2014 and 2015, it was still in a state of being on the brink of imbalance. It entered the marginally coordinated state starting from 2016 and reached the moderately coordinated state in 2023, which shows that Xi’an’s overall planning capability for the three systems has been continuously improving, and the synergistic effect has been significantly enhanced.
As clearly shown in Figure 3, indicators declined in 2022 due to large discharges of the total volume of industrial waste gas emissions and the volume of industrial solid wastes produced, which negatively affected the ecological environment. However, due to the developmental disparities among the systems, the results of the coordination degree showed that from a temporal perspective, the coordination degree among the three subsystems in Xi’an increased significantly from 0.217 in 2013 to 0.712 in 2023. This represented a transition from moderately imbalanced, to slightly imbalanced, to on the brink of imbalance, to marginally coordinated, and finally to moderately coordinated. The data showed that the coordination degree changed little in the early years, but because Xi’an actively promoted the construction of ecological civilization, the coordination degree among the systems had shown a clear upward trend since 2016, shifting from an imbalanced stage to a coordinated stage. The current state of moderate coordination indicates that the coordinated development of Xi’an’s economy, transportation, and ecological environment has entered a more mature phase.
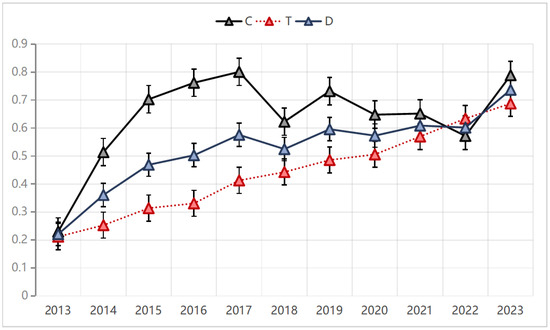
Figure 3.
Coupling coordination degree diagram.
6.2. Analysis of Obstacle Degrees in Coupling and Coordinated Development of Xi’an’s Economy–Transportation–Ecology
In this paper, the obstacle degree model was employed to measure and rank the criterion layers and indicator layers of the economy, transportation, and ecology in Xi’an from 2013 to 2023. The primary obstacle factors restricting the synergistic development of the three were identified, and the degree of obstruction was analyzed. The calculation results and the corresponding analysis are as follows:
6.2.1. Criterion Layer Obstacle Factors
Based on the calculation results, a systematic analysis of obstacle degree rankings revealed the comprehensive hindrance levels of the three system layers across different years, as summarized in Figure 4. The findings showed the following:
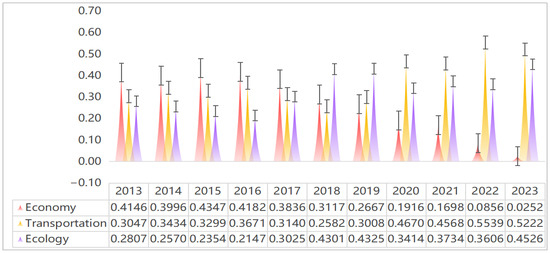
Figure 4.
Summary of criterion layer obstacle degrees.
- 2013–2017: Economy > Transportation > Ecology
- 2018: Ecology > Economy > Transportation
- 2019: Ecology > Transportation > Economy
- 2020–2023: Transportation > Ecology > Economy
Based on the annual average values and the intuitive radar chart in Figure 5, the overall ranking of obstacle degrees was as follows: Transportation > Ecology > Economy. Moreover, the calculation results showed that the obstacle degree of transportation factors has remained above 45% in recent years, making it the most dominant obstacle factor at the system level. This indicated that Xi’an’s economic growth had a relatively small impact on the coordinated development of the three systems. Transportation constituted a significant hindrance to the coordinated development of the economy and ecology in the process of achieving the “dual carbon” goals. It also reflected that although Xi’an has been vigorously promoting ecological civilization construction in recent years, the overall effect has been limited, and further efforts should be made to strengthen ecological protection.
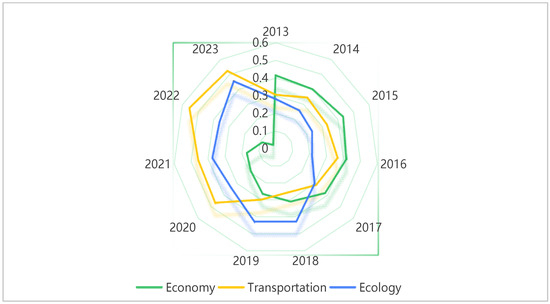
Figure 5.
Radar chart of obstacle degree factors for economy–transportation–ecology in Xi’an.
6.2.2. Indicator Layer Obstacle Factors
This paper identified the obstacle degree corresponding to the indicator layer in Xi’an from 2013 to 2023, and the calculation results are shown in Table 8. A larger O-value indicated a stronger hindrance of the indicator to the system layer.
Table 8.
Calculation results of obstacle degrees at the indicator layer.
The top 10 indicators in terms of the obstacle degree (O-value) at the indicator layer were selected, and the sorted results are presented in Figure 6. Based on the overall distribution of obstacle factors at the indicator layer, the following observations could be made: For the economic system layer, the indicator with the larger O-value was the value added of the secondary industry. For the transportation system layer, the indicators with larger O-values included road passenger turnover, highway density, length of highways, number of public transport vehicles in operation, freight turnover, and per capita area of paved roads. For the ecological system layer, the indicators with the largest O-value were investment in environmental pollution control, built forestry area, and accumulated area of soil and water loss control.
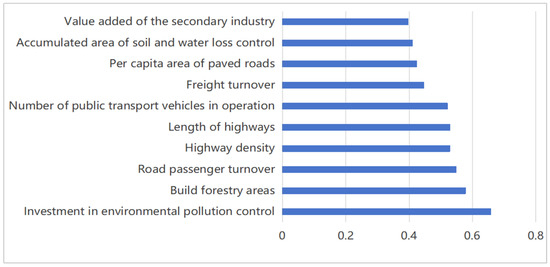
Figure 6.
Top 10 obstacle degrees at the indicator layer.
Overall, the investment in environmental pollution control exhibited the highest obstacle degree among all indicators, indicating that insufficient investment or low efficiency in pollution control constitutes the most prominent restrictive factor in the ecological domain. As core indicators for ecological restoration, the built forestry areas and the accumulated area of soil and water loss control ranked second in terms of obstacle degree, reflecting a gap between the intensity of ecological restoration efforts and actual demands. The transportation system layer contained the largest number of indicators, with obstacle degrees concentrated in the range of 0.4433–0.5484, showing an overall high level. Among these, road passenger turnover, highway density, length of highways, freight turnover, and per capita area of paved roads were the primary obstacles in Xi’an’s transportation sector, which reflected inadequacies in highway transportation capacity, including coverage scope and passenger transport efficiency. The number of public transport vehicles in operation followed closely, suggesting that the matching degree between urban public transport supply and demand needs to be improved. Compared with transportation and ecology, the economic domain had a relatively weak restrictive effect on the system. However, as a core indicator of economic structure, the obstacle degree of the secondary industry’s added value still reflected certain shortcomings in the quality or scale of this industry’s development. Therefore, priority should be given to high-obstacle degree indicators, such as increasing investment in environmental pollution control, improving highway network coverage and transportation capacity, and balancing public transport supply, to reduce the overall obstacle effect.
The indicators ranked among the top 5 in terms of obstacle degree for each year from 2013 to 2023 are summarized in Table 9. Furthermore, based on Table 9, the arrangement and proportions of the key obstacle factors within each system were further organized, as presented in Figure 7. The period from 2013 to 2023 was divided into two stages, with significant differences observed in the key obstacle factors between the stages.
Table 9.
Summary of the key obstacle factors at the indicator layer from 2013 to 2023.
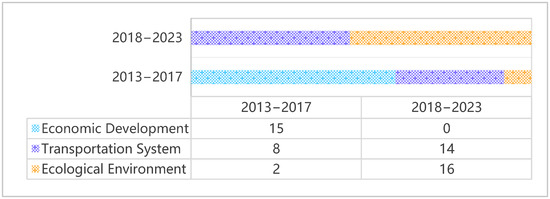
Figure 7.
Proportion of obstacle degrees in the top five indicator layers in the criterion layer.
- (1)
- 2013–2017: dominated by the economic system, with transportation beginning to emerge as a prominent factor.
During this period, the primary obstacle factors were at the economic system level, including the value added of the secondary industry, value added of the primary industry, fixed asset investment by the whole society, and per capita disposable income of urban households. Data indicated that these indicators grew slowly in Xi’an during this period. Specifically, the growth rate of the value added of the secondary industry was lower than that of the city’s total GDP, reflecting insufficient growth momentum in the secondary industry. The declining growth rate of fixed asset investment by the whole society hindered Xi’an’s economic growth and industrial upgrading. Additionally, the relatively low growth rate of per capita disposable income of urban households indicated slow income growth, which constrained consumer demand and quality of life, thereby affecting overall economic development. At the transportation system level, indicators such as the number of public transport vehicles in operation, length of highways, and highway density reflected a mismatch between early transportation supply (particularly public transport) and demand. The ecological system layer accounted for a relatively low share, indicating that during this stage, the quality or scale of economic development strongly constrained system coordination, and transportation issues began to emerge, while ecological obstacles remained insignificant.
- (2)
- 2018–2023: dominated by the transportation system, with ecological obstacles rising.
The key obstacle factors shifted to the transportation system, including indicators such as road passenger turnover, freight turnover, per capita area of paved roads, length of highways, highway density, railway passenger turnover, civil aviation passenger volume, and number of aircraft takeoffs and landings. Notably, both passenger and freight turnover in Xi’an declined, reflecting reduced transportation demand, which was influenced by factors such as the macroeconomic environment, policy changes, cost fluctuations, market supply–demand relationships, and the development status of the logistics industry itself. Per capita area of paved roads, length of highways, and highway density restricted the efficiency of cargo and passenger flow, increased transportation costs, and impeded regional economic development. Transportation obstacles expanded from “infrastructure” to “passenger–freight turnover efficiency” and coordination among multiple transportation modes, indicating an upgraded constraint from diversified transportation demands on the system.
At the ecological system level, the key obstacle factors included investment in environmental pollution control, built forestry areas, greening coverage rate of the built-up area, per capita public green areas, total volume of industrial waste gas emissions, and volume of industrial solid wastes utilized. Xi’an’s investment in environmental pollution control was 2.29 billion yuan in 2017, dropping to 1.421 billion yuan in 2018 and continuing to decrease annually, which hindered the effectiveness and progress of environmental governance. The built forestry areas also declined from 14.7 hm2 in 2014, implying a reduction in green space, which negatively impacted urban ecological balance, air quality, and residents’ quality of life. Greening coverage rate of the built-up area and per capita public green areas may have diminished urban ecological services, such as climate regulation and air purification. The total volume of industrial waste gas emissions and volume of industrial solid wastes utilized as major obstacles further indicated that ecological barriers in Xi’an were shifting from “insufficient greening” to “pollution control.”
In summary, the key obstacle factors at the indicator layer in Xi’an from 2013 to 2023 exhibited an evolutionary trend of “economic dominance → transportation dominance → interweaving of ecology and transportation.” In 2013–2017, economic development was the primary constraint, reflecting the fundamental role of economic scale and quality in system coordination. Since 2018, transportation system obstacles have gradually become prominent and evolved into core constraints, reflecting the rapid growth of transportation demand amid urbanization. Concurrently, the urgency of ecological issues has increasingly emerged, mirroring the coordinated development dynamics under the “dual carbon” goals.
7. Results and Discussion
7.1. Results
This paper took Xi’an as the research object, established 29 specific evaluation indicators from three aspects of economy, transportation, and ecology, and constructed an evaluation index system of economy–transportation–ecology under the “dual carbon” goal. The measurement results showed the following:
- (1)
- From a temporal perspective, the coordination degree among the three subsystems in Xi’an increased significantly from 0.217 in 2013 to 0.712 in 2023. Its coupling coordination development level showed a steady evolutionary trend, progressing in sequence from moderately imbalanced, to slightly imbalanced, to on the brink of imbalance, to marginally coordinated, and finally to moderately coordinated.
- (2)
- The comprehensive ranking of the obstacle degrees of the three system layers in different years was as follows: from 2013 to 2017, economy > transportation > ecology; in 2018, ecology > economy > transportation; in 2019, ecology > transportation> economy, and from 2020 to 2023, transportation > ecology > economy.
- (3)
- The top ten in the ranking of obstacle degree calculation results at the indicator layer were as follows in sequence: investment in environmental pollution control, built forestry areas, road passenger turnover, highway density, length of highways, number of public transport vehicles in operation, freight turnover, per capita area of paved roads, accumulated area of soil and water loss control and value added of the secondary industry.
- (4)
- The key obstacle factors at the indicator layer in Xi’an from 2013 to 2023 exhibited an evolutionary trend of “economic dominance → transportation dominance → interweaving of ecology and transportation.”
7.2. Policy Implications
Under the “dual carbon” goals, achieving coordinated development of Xi’an’s economy, transportation, and ecology is a multidimensional and systemic project. Based on empirical results combined with the current situation analysis, this paper proposed the following policy implications.
7.2.1. Optimize Top-Level Design and Strengthen Policy Guidance
- (1)
- Adhere to the concept of coordinated development: It is necessary to deeply understand the importance of achieving carbon peaking and carbon neutrality and always place ecological civilization construction in an important position in economic and social development. By promoting the construction of “Ecological Xi’an,” it should coordinate the joint progress of high-quality economic and social development and high-level ecological environmental protection, optimize the industrial structure, energy structure, and transportation structure to support socioeconomic development and ecological environmental protection, and simultaneously promote the coordinated advancement of green and high-quality development.
- (2)
- Establish and improve policy guidance: Policy guidance forms the fundamental guarantee for the development of economy, transportation, and ecology. Xi’an has established a leading group for carbon peaking and carbon neutrality, responsible for the overall deployment and systematic promotion of carbon peaking and carbon neutrality work, formulated an action plan to implement carbon peaking by 2030, and forward-lookingly outlined the implementation path for carbon neutrality by 2060, accelerating the establishment of a “two-step” goal-oriented backtracking mechanism for carbon peaking and carbon neutrality. In the future, policies should further guide the formulation of preferential policies to encourage the development of low-carbon industries [51], establish and improve various operational systems and related safeguard mechanisms for transportation, ecological environment, economic construction, etc.
- (3)
- Continuously improve the planning system: Xi’an has integrated the carbon peaking and carbon neutrality strategies into its current five-year plans and territorial spatial planning systems, clearly defining the target positioning, indicator systems, and control measures for carbon neutrality at all levels. It should continuously explore financial policies for synergistic pollution reduction and carbon emission reduction, enrich green transition financial instruments such as green credit, green equity financing, green financial leasing, and green trusts, and guide financial institutions and social capital to increase support for projects in areas such as the construction of new energy systems, transformation and upgrading of traditional industries, and green low-carbon technological innovation.
7.2.2. Promote Green Industrial Transformation to Facilitate High-Quality Economic Development
- (1)
- Accelerate green and high-quality industrial upgrading: It indicated that industrial added value was a key obstacle factor in the coordinated development of Xi’an’s economy, transportation, and ecology. Guided by green and low-carbon principles, Xi’an should increase the proportion of non-fossil energy, eliminate outdated production capacity, reshape the industrial chains of high-carbon industries, accelerate the digital and intelligent upgrading of traditional manufacturing, and fully implement green supply chain management. At the same time, it should focus on advantageous fields such as aerospace, electronic information, biomedicine, new energy, and new materials, cultivate low-carbon, zero-carbon, and negative-carbon industries, expand the proportion of green industries through technological innovation, and comprehensively promote the achievement of the “dual carbon” goals relying on characteristic advantages, so as to realize the green transformation of the industrial structure.
- (2)
- Foster green, high-quality, and efficient agriculture: Given that the added value of the primary industry ranks high among the obstacle indicators, Xi’an should proactively refine its agricultural industrial layout, restructure the agricultural sector, and deepen the integrated development of primary, secondary, and tertiary industries. This involves strengthening the grain and livestock sectors, enhancing the deep processing of agricultural products, vigorously promoting rural cultural tourism, and diversifying income streams. Moreover, a comprehensive shift in agricultural production methods is essential. Xi’an needs to embed the green development ethos throughout the entire agricultural production cycle, optimize production structures and product assortments, enforce end-to-end quality control of agricultural products, and elevate their green credentials, quality standards, unique characteristics, and brand value [52].
- (3)
- Elevate the green development standard of the service sector: By fostering close linkages between producer services and advanced manufacturing, modern agriculture, as well as deepening the integration of modern services and the information industry, the city can effectively unleash inter-industry synergies and boost innovation capabilities. Meanwhile, Xi’an can accelerate the green upgrading of its commercial and trade services, promote the green transformation of the information service industry, and actively drive the green development of the convention and exhibition sector, thereby ensuring the long-term viability of the service sector. Additionally, leveraging digital technologies can propel the service sector’s evolution. This includes deepening the application of big data, cloud computing, the Internet of Things, blockchain, and other advanced technologies within the service industry [53]. By expediting reforms in institutional mechanisms, the city can optimize the service sector’s structure and enhance its overall development quality. Through the comprehensive implementation of green development principles, Xi’an can make significant strides towards achieving its carbon peaking and carbon neutrality targets.
7.2.3. Improve Infrastructure Levels and Perfect the Transportation Network System
- (1)
- Strengthen infrastructure construction: Increase government investment and the share of fiscal expenditure on infrastructure to ensure financial support [54]. Xi’an should also accelerate the deployment and application of “new infrastructure”, promote infrastructure reconstruction and industrial upgrading, improve infrastructure planning and construction standards, and advance low-carbon and intelligent transformations. In the process of urban planning and construction, the concept of sponge cities should be fully integrated, while simultaneously promoting the renovation of old residential areas, treatment of black and odorous water bodies, and drainage and waterlogging prevention. It is also advisable to rationally plan road traffic lighting systems, new energy vehicle parking lots, charging piles, etc., to meet citizens’ travel needs. Meanwhile, strictly control pollutant emissions, enhance urban environmental protection, increase urban green coverage, reduce road noise pollution, improve urban air quality, create low-carbon urban-rural spaces, expand urban public green spaces and open areas, optimize and integrate existing community construction standards, build carbon-neutral oriented green and low-carbon residential communities, and enhance the city’s ecological service functions [55].
- (2)
- Improve the comprehensive transportation network: Xi’an should accelerate the construction of a “meter-shaped” high-speed railway network, a “chessboard + ring + radial” metro layout, an expressway framework of “four-ring and twelve-radiation”, and a fast road system of “seven horizontal and seven vertical”, so as to achieve the transportation goals of 1-hour commuting within the Xi’an metropolitan area, 2-hour accessibility between urban agglomerations, and 3-hour coverage of major cities across the country. Actively promote the information-based and intelligent management of transportation infrastructure, and carry out green-oriented renovation and upgrading for transportation infrastructure as well as transportation hubs and stations. In addition, continuously optimize the transportation structure, give full play to the backbone role of railways in the long-distance transportation of bulk cargo, and construct a logistics and distribution system featuring external collection, internal distribution, and green intermodal transportation with road-rail intermodal transportation as the core. Furthermore, accelerate the construction of an urban green public transport system, which takes rail transit as the backbone [56], electric buses as the foundation, electric taxis as a supplement, and slow traffic systems (such as public bicycles and shared bikes) as extensions. Xi’an should also vigorously promote new energy vehicles, accelerate the electrification of construction waste trucks and garbage collection vehicles, and speed up the supporting construction of electric vehicle charging piles (stations). Through these measures, Xi’an can improve the city’s comprehensive transportation network to build a low-carbon multimodal transport system [57].
7.2.4. Leverage Ecological Advantages to Expand Carbon Sink Reserves
- (1)
- Strengthen ecological and environmental protection: While promoting economic development and the construction of transportation infrastructure, efforts should be made to increase the investment intensity in environmental pollution control, and ecological and environmental protection should be placed at the core. Establish and optimize the ecological environment monitoring system [58,59], strengthen measures for the prevention and control of soil erosion, to effectively curb the spread of soil erosion, thereby addressing various uncertain risks both inside and outside the system [60]. Meanwhile, efforts should be made to increase the planting of artificial forests, expand the afforestation area, and construct green ecological corridors. Additionally, it is essential to enhance key ecological service functions such as water conservation, soil and water retention, and biodiversity.
- (2)
- Optimize the city-wide carbon sink pattern: Xi’an should further leverage the ecological advantages of its landscape, continuously promote large-scale national afforestation, and advance the protection of biodiversity and the integrated governance of mountains, rivers, forests, farmlands, lakes, grasslands. By enhancing the carbon sequestration capacity of the ecosystem, the city should systematically expand the areas of carbon sinks such as farmlands, forests, grasslands, and water bodies, and construct a climate-friendly urban ecosystem. It is necessary to promote intensive and compact urban construction layout, focus on optimizing the structure of construction land, implement spatial control of carbon emissions, and reasonably control the intensity of development and the amount of carbon emissions [61].
- (3)
- Strengthen regional carbon sink collaboration: Enhance collaborative cooperation on carbon neutrality within the Xi’an metropolitan area, clarifying the differentiated development timelines and collaborative relationships for urban carbon neutrality among central cities, secondary cities, county towns, and super-large towns. Promote the establishment of cross-regional carbon compensation and carbon emission trading mechanisms within the metropolitan area, and improve the green financial cooperation platform [62].
8. Conclusions
This study aims to explore the current status of coordinated development and coupling mechanism among economy, transportation, and ecology in Xi’an under the “dual carbon” goals, as well as to analyze the obstacle factors and propose policy recommendations. The results show that the economic-transportation-ecological coupling coordination degree of Xi’an increased from 0.217 to 0.712 during 2013–2023, achieving a four-level leap; the system obstacles shifted from “economic dominance → transportation dominance → interweaving of ecology and transportation”; and the top five key obstacle factors are ranked as follows: investment in environmental pollution control, build forestry areas, road passenger turnover, highway density, length of highways. The closed-loop framework constructed in this study can provide a replicable paradigm for cross-system synergy under the “dual carbon” goals.
This study pioneers the research on the economic-transportation-ecological ternary coupling under the “dual carbon” goals, filling the gap in three-dimensional synergy research of national central cities. Through the research framework of “entropy weight-coupling coordination-obstacle degree model”, a closed-loop system of “indicator construction-model quantification-obstacle diagnosis-path design” is developed, which provides a replicable mathematical practice methodology for urban multi-system coupling research and enriches the research results of multi-system coupling coordination from a mathematical perspective. In practice, the constructed indicator system and proposed policy implications help relevant departments understand the current status and problems of the economic-transportation-ecological system under the “dual carbon” goals, thereby formulating targeted policies to promote the coordinated development of these systems. The research results have significant theoretical and practical value.
Building on this research, future work will focus on four key directions: (1) This study is limited to Xi’an, subsequent research will expand the research objects to test the universality of conclusions and policy recommendations and reveal regional heterogeneity. (2) Optimize the indicator system by introducing more micro-level indicators and incorporating the dimension of social equity to meet the policy needs of “just transition”. (3) Since the objectivity of the entropy weight method may affect the weights of low-variability indicators, Fuzzy Delphi or AHP questionnaires can be introduced for comprehensive weighting in the future to combine objective entropy weights with decision-makers’ value judgments, reflecting the robustness and scientific validity of the research. (4) Upgrade the annual static panel to quarterly/monthly high-frequency data streams to realize data dynamization, and integrate the existing entropy weight-coupling coordination framework with models such as system dynamics to evaluate long-term effects and further optimize research methods. Through these expansions, it is expected to effectively promote the coordinated development of economy, transportation, and ecology, contribute to the achievement of the “dual carbon” goals, and provide more regional wisdom and solutions for global climate change governance.
Author Contributions
Conceptualization, Q.Y.; data curation, H.Y.; formal analysis, H.Y. and Q.Y.; investigation, H.Y.; methodology, H.Y. and Q.Y.; resources, H.Y.; writing—original draft preparation, H.Y.; writing—review and editing, H.Y. and Q.Y. All authors have read and agreed to the published version of the manuscript.
Funding
The research was funded by the [Scientific Research Program Funded by the Xi’an Social Science Planning Fund] grant number [24GL20]. [Shaanxi Xueqian Normal University Horizontal Research Project] grant number [2023HXKT031]. [Shaanxi Xueqian Normal University Horizontal Research Project] grant number [2024HXKT089]. [College Students’ Innovation and Entrepreneurship Training Program Project] grant number [2025DC059].
Data Availability Statement
The data that support the findings of this study are available from the corresponding authors upon reasonable request.
Acknowledgments
The authors sincerely appreciate the guidance provided by colleagues in shaping the logical framework and writing of this paper. Their valuable discussions have been instrumental in refining the research. We also wish to acknowledge the projects that enabled the utilization of data during the research process.
Conflicts of Interest
The authors declare no conflicts of interest.
References
- Yu, H. Implementing the Concept of Green Development and Deepening the Reform of the Ecological Civilization System [N]. Shaanxi Dly. (Theor. Ed.) 2024, 8, 26. [Google Scholar]
- Li, X.P. Emphasized at the Ninth Ministerial and Provincial Joint Meeting on Promoting the Development of Transportation in the Yangtze River Economic Belt: Further Strengthen the Protection and Restoration of the Ecological Environment in Transportation Work, and Accelerate the Construction of a Comprehensive and Three-dimensional Transportation Network to Promote High-quality Development. Transp. Enterp. Manag. 2022, 37, 4. [Google Scholar]
- Lai, F.B.; Sun, T.; Li, Q.J.; Liu, M.; Yang, Z.; Cheng, Y. Spatio-temporal Evolution Track of Coupling Coordination of Transportation-Regional Economy-Ecological Environment in Shandong Province. J. Univ. Jinan (Sci. Technol.) 2024, 38, 526–532+540. [Google Scholar] [CrossRef]
- Ren, L.H.; Li, X.Y.; Song, R.J.; Wang, Y.N.; Gui, M.Y.; Tang, B. Multiphase Transport Network Optimization: Mathematical Framework Integrating Resilience Quantification and Dynamic Algorithm Coupling. Mathematics 2025, 13, 2061. [Google Scholar] [CrossRef]
- Cao, X.S.; Zhu, D.; Wu, C.Q.; Yang, R.Y. Impact of Transport Accessibility-on Economic Development Level in Yellow River Basin, China and Its Spatial Heterogeneity. J. Earth Sci. Environ. 2025, 47, 1–14. [Google Scholar] [CrossRef]
- Xia, S.F.; Yin, H.N.; Qu, Z. ETF-YOLO11n: An Object Detection Method Based on Multi-scale Feature Fusion for Traffic Images. Comput. Sci. 2025, 1–10. Available online: https://link.cnki.net/urlid/50.1075.tp.20250331.1410.032 (accessed on 4 August 2025).
- Yan, J.H.; Li, H.H.; Sun, J.; Liu, J.; Zhang, J.W.; Yang, X.R.; Xu, Y. The Development of Spatio-Temporal Graph Neural Networks for Traffic Flow Prediction: A Review. Comput. Eng. Appl. 2025, 1–22. Available online: https://link.cnki.net/urlid/11.2127.TP.20250523.1502.004 (accessed on 4 August 2025). [CrossRef]
- Song, N.N.; Ge, Y.; Cheng, H.T. Mathematical Modeling and Simulation of Travel Time Prediction of Dense Traffic Flow in the City. Comput. Simul. 2024, 41, 211–215. [Google Scholar]
- Saidi, S.; Shahbaz, M.; Akhtar, P. The long-run relationships between transport energy consumption, transport infrastructure, and economic growth in MENA countries. Transp. Res. Part A Policy Pract. 2018, 111, 78–95. [Google Scholar] [CrossRef]
- Tong, S. Research on the Relationship Between Economic Growth and Road Traffic Infrastructure in Inner Mongolia. IOP Conf. Ser. Earth Environ. Sci. 2019, 237, 032135. [Google Scholar] [CrossRef]
- Yetkiner, H.; Beyzatlar, A.M. The Granger-causality between Wealth and Transportation: A Panel Data Approach. Transp. Policy 2020, 97, 19–25. [Google Scholar] [CrossRef] [PubMed]
- Liu, H.X. Research on Regional Economic Development Strategy Based on Transportation. China Shipp. Gaz. 2023, 39, 47–49. [Google Scholar]
- Ren, Y.M.; Zhang, X.; Zhang, Y.; Mo, M.L.; Qian, F. Thoughts and Practices on the Comprehensive Three-Dimensional Transportation Network Planning of Small and Medium-Sized Cities under the Background of a Transportation Power. In Spatial Governance for High-Quality Development: Proceedings of the 2020 China Urban Planning Annual Conference (06 Urban Transportation Planning); Chinese Society for Urban Studies and Chengdu Municipal People’s Government, Ed.; China Construction Design Group Co., Ltd.: Chengdu, China, 2021; pp. 828–833. [Google Scholar]
- Norgaard, B.R. Ecological Economics. BioScience 2000, 50, 291. [Google Scholar] [CrossRef][Green Version]
- Waslekar, S.S. World Environmental Kuznets Curve and the Global Future. Procedia-Soc. Behav. Sci. 2014, 133, 310–319. [Google Scholar] [CrossRef]
- Binsuwadan, J. Transport Sector Emissions and Environmental Sustainability: Empirical Evidence from GCC Economies. Sustainability 2024, 16, 10760. [Google Scholar] [CrossRef]
- Peng, Z.; Zhang, C.X.; Hong, Z.T. Identification of Key Enterprise Sources and Design of Target Emission Reduction Pathways Contributing to Air Quality Based on Unsupervised Learning and Explainable Prediction-A Case Study of Beijing. Comput. Ind. Eng. 2025, 206, 111260. [Google Scholar] [CrossRef]
- Bai, L.B.; Zhang, L.W.; Zhang, L.Y.; Shao, K.; Luo, X. Unlocking the Potential of Project Portfolio: Value-Oriented Interactive Risk Management. Humanit. Soc. Sci. Commun. 2025, 12, 1012. [Google Scholar] [CrossRef]
- Zhang, X.Q.; Wang, H.J. Inconsistent Time Preferences, Pollution Abatement and Economic Growth. Math. Appl. 2017, 30, 370–378. [Google Scholar] [CrossRef]
- Gao, L.A. Research on Judgment and Optimizing Path of Coupling and Coordination between Economy and Eco-environment in Northeast China. J. Stat. Inf. 2020, 35, 74–81. [Google Scholar]
- Fang, J.; Xu, M.; Liu, B.Q.; Chen, Z. An Evaluation of the Coordinated Development of Coastal Zone Systems: A Case Study of China’s Yellow Sea Coast. J. Mar. Sci. Eng. 2022, 10, 919. [Google Scholar] [CrossRef]
- Yang, L.Y.; Ming, Q.Z.; Li, X.F. Research on the Coupled and Coordinated Development of Tourism Economy and Transportation in Anhui Province. J. Chizhou Univ. 2023, 37, 58–61. [Google Scholar]
- Pirogova, O.; Androsova, I.; Anisimov, A. Countries Ecology and Transport Infrastructure Sustainable Development Based on Partnership Between the State and Business. BIO Web Conf. 2024, 141, 04047. [Google Scholar] [CrossRef]
- Bezborodov, Y.N.; Kovaleva, S.A.; Sokolnikov, A.N.; Shram, V.G.; Lysyannikova, N.N.; Karkashenko, A.O. Influence of Transport on the Ecology of Big Megapolis. J. Phys. Conf. Ser. 2019, 1399, 055008. [Google Scholar] [CrossRef]
- Majerčák, J.; Kurenkov, P.V.; Ostashevskaya, O. A Systematic Approach to the Design of Logistics Solutions and a Methodology for their Evaluation in the Field of Greening Freight Transport. Transp. Res. Procedia 2024, 77, 193–200. [Google Scholar] [CrossRef]
- Ingrao, C.; Scrucca, F.; Matarazzo, A.; Arcidiacono, C.; Zabaniotou, A. Freight Transport in the Context of Industrial Ecology and Sustainability: Evaluation of Uni-and Multi-modality Scenarios Via Life Cycle Assessment. Int. J. Life Cycle Assess. 2020, 26, 127–142. [Google Scholar] [CrossRef]
- Zhou, Q. Research on the Coordination between Transportation Development and Ecological Environment in Mountainous Towns-A Case Study of Lhasa. In Proceedings of the 2017 Urban Development and Planning Conference; Chinese Society for Urban Studies, Hainan Provincial Planning Commission, Haikou Municipal People’s Government, Eds.; Jiangsu Provincial Urban Planning and Design Institute: Haikou, China, 2017; Volume 6. [Google Scholar]
- Yuan, S.M.; Huang, L.F.; Xiang, S.J.; Li, D.N.; Liu, Y. Research on the Coupling Coordination of Ecological Environment and Transportation Development in Guizhou Province. J. Mt. Meteorol. 2023, 47, 90–95. [Google Scholar]
- Bai, Y.; Li, Y.R. Decoupling Relationship and Spatiotemporal Pattern Evolution between China’s Rapid Transportation System and Tourism Eco-Efficiency. Ecol. Econ. 2025, 41, 176–184. [Google Scholar]
- Gottinger, H.W. A computational model for solid waste management with application. Eur. J. Oper. Res. 1988, 35, 350–364. [Google Scholar] [CrossRef]
- Wang, X.Q. Coupling Coordination Measurement and Simulation of Provincial Energy-Economy-Environment Systems. Master’s Thesis, Anhui University of Science and Technology, Huainan, China, 2019. [Google Scholar]
- Tang, M. Research on Coupling Coordinated of Shaanxi Agricultural Ecology-Economy-Society Systems; Shaanxi University of Science and Technology: Xi’an, China, 2019. [Google Scholar]
- Xiao, H.; Hu, Y.H.; Wang, X.K.; Gong, H.J. Coupling and Coordinated Development and Obstacle Degree of Regional Economy, Transportation, and Ecological Environment of New Western Land-Sea Corridor. Railw. Transp. Econ. 2022, 44, 1–7. [Google Scholar] [CrossRef]
- Sun, T.; Lai, F.B. Analysis on the Spatial Evolution and Obstacle Factors of the Coupling Coordination of Transportation, Regional Economy, and Ecosystem in the Yellow River Basin. J. Guangzhou Marit. Univ. 2023, 31, 73–78. [Google Scholar]
- Huang, C.F.; Wu, Y.S.; Lei, Y. Spatial Characteristics of the Coordinated Development of Transportation-Economy-Ecology—Take the Chengdu Chongqing Twin Cities Economic Circle as an example. China Transp. Rev. 2023, 45, 10–18. [Google Scholar]
- Huang, C.F.; Tian, S.B.; Zeng, Y. The Spatial and Temporal Evolution of the Coordinated Development of Traffic Accessibility and Tourism Economic Linkages; Based on the Cross-sectional Data of Chengdu-Chongqing Economic Circle. Sci. Technol. Manag. Land Resour. 2022, 39, 63–73. [Google Scholar]
- Xia, Y.F.; Zhang, L.; Yin, H. Application of the Multivariate Economic Dispersion Index in Inequality Evaluation of the Provincial Capitals (in Chinese). Sci. Sin. (Math.) 2020, 50, 679–694. [Google Scholar]
- Yu, H. Analysis of the Development Status of Green Transportation in Xi’an under the Dual-Carbon Context. China Storage Transp. 2023, 12, 186–187. [Google Scholar] [CrossRef]
- Li, T.Y. Entropy. Adv. Math. (China) 1990, 3, 301–320. [Google Scholar]
- Ma, Z.L.; Gao, Y.; An, T.; Xiong, Y.; Ma, F. Research on the Green Transportation Level Measurement of National Central Cities Based on DPSIR Model: A Case Study of Xi’an City. Ecol. Econ. 2022, 38, 85–93+114. [Google Scholar]
- Gao, X. Research on Comprehensive Urban Transport Planning under Concept of Green Transport Based on Entropy Weight TOPSIS Method-Taking Yangzhou City as An Example. Yantai Vocat. Coll. 2018, 24, 81–85. [Google Scholar]
- Zhang, Q.H.; Jiang, Y. Spatiotemporal Evolution and Influencing Factors of Carbon Reduction-Pollution Reduction-Green Expansion-Growth Coupled Development. Stat. Decis. 2025, 41, 90–94. [Google Scholar] [CrossRef]
- Zhang, S.Y.; Zhang, R. Optimal Coupling in Probability Theory and Optimal Cooperation in Game Theory. Sci. Sin. (Math.) 2020, 50, 197–210. (In Chinese) [Google Scholar]
- Zhu, Z.F.; Zhou, J.C. F-Geometric Ergodic of Continuous Time Markov Processes by Coupling Method. J. Math. 2025, 1–9. [Google Scholar] [CrossRef]
- Liu, Y.; He, W.; Zuo, Q. Calculation and Influencing Factors of the Coupling Coordination Degree between Economic Development and Atmospheric Environmental Quality in the Beijing-Tianjin-Hebei Agglomeration. Res. Environ. Sci. 2025, 1–18. [Google Scholar] [CrossRef]
- Xu, J.W. Research on the Coordinated Development of High-Quality Economic Development and Ecological Environmental Protection under the “Dual Carbon” Goal—A Case Study of Beijing-Tianjin-Hebei Region. Reform Econ. Syst. 2023, 1, 61–69. [Google Scholar]
- Wang, S.J.; Kong, W.; Ren, L.; Zhi, D.D. Research on Misuses and Modification of Coupling Coordination Degree Model in China. J. Nat. Resour. 2021, 36, 793–810. [Google Scholar] [CrossRef]
- Liao, C.B. Quantitative Judgment and Classification System for Coordinated Development of Environment and Economy: A Case Study of the City Group in the Pearl River Delta. Trop. Geogr. 1999, 2, 76–82. [Google Scholar]
- Gu, R.; Hu, Y.L.; Chen, Y.Y. Analysis of the Coupling Coordination Degree and Barrier Factors between Urban Resilience and the Development Level of Technology Service Industry. Stat. Decis. 2025, 41, 85–89. [Google Scholar] [CrossRef]
- Wang, W.; Li, A.; Li, Y.; Zhou, X.; Yang, Y. Spatiotemporal Distribution and Obstacle Factors of New-Quality Productivity in Water Conservancy in China Based on RAGA-PP and Obstacle Degree Model. Sustainability 2025, 17, 4534. [Google Scholar] [CrossRef]
- Bao, J.Q.; Miao, Y.; Cheng, F. Low Carbon Economy: Revolution in the Way of Human Economic Development. China Ind. Econ. 2008, 4, 153–160. [Google Scholar] [CrossRef]
- Liao, W.M.; Yu, J.J.; Yuan, R.L. Coupling Synergy between Poverty Alleviation and Rural Revitalization: A Comparison between Poverty Alleviation Counties (cities) based on Different Time Series. China Popul. Resour. Environ. 2020, 30, 132–142. [Google Scholar]
- Ye, T.L.; Zhang, Y.S.; Wang, X.Y. Can Digital Economy Service Industry Improve Regional Green Innovation Efficiency?—From the Dual Perspective of Industrial Co-agglomeration and Public Environmental Awareness. Res. Econ. Manag. 2025, 46, 45–60. [Google Scholar] [CrossRef]
- Yu, H.; Yang, Q. Evaluation of the Development Level of Green Transportation in National Central Cities. Sustainability 2024, 16, 7270. [Google Scholar] [CrossRef]
- Wang, Z.F.; Du, Y.Y. A Study on the Coupling of Traffic-tourism Industry-ecological Environment in the middle of the Yangtze River. Resour. Environ. Yangtze Basin 2020, 29, 1910–1921. [Google Scholar]
- Zhu, H.; Liu, Y.; Yu, L.; Liang, W.B.; Jiang, J.; Ye, Q.; Zhang, S.; Zhao, M.Y.; Bo, C.; Wang, G.D.; et al. Development Strategies for Urban Transportation under Carbon Neutrality: The 27th Seminar of the China Urban Transportation Development Forum. Urban Transp. China 2021, 19, 111–128. [Google Scholar] [CrossRef]
- Cheng, Z.L.; Li, Y.L.; Tang, H.L.; Zeng, M.J. Prediction of Carbon Peak for China-Europe Transportation of Trade under “The Belt and Road Initiative” Based on Machine Learning. Ecol. Econ. 2025, 41, 41–53. [Google Scholar]
- Xu, M.; Ou, F.D.; Xu, J.J. Coupling Coordination Between Tourism Economy and Ecological Environment in Changsha City. J. Hunan Univ. Technol. (Soc. Sci. Ed.) 2025, 30, 84–92. [Google Scholar] [CrossRef]
- Yang, Z.W.; Li, X.D.; Chen, X.J.; Guo, X. Spatiotemporal Evolution Characteristics and Obstacle Factors of the Coupling and Coordination Level among the Population-Economy-Ecosystem in the Central Guizhou Urban Agglomeration. J. Guizhou Norm. Univ. (Nat. Sci.) 2025, 1–11. Available online: https://link.cnki.net/urlid/52.5006.n.20250603.0916.002 (accessed on 4 August 2025).
- Bai, L.B.; Wang, C.S.; Sun, Y.C.; Xie, X.Y.; Tang, T.T.; Xie, Q. Project Portfolio Network Risk Propagation Modeling: A Risk Perception Perspective. IEEE Trans. Eng. Manag. 2024, 71, 14608–14620. [Google Scholar] [CrossRef]
- Liu, H.; Geng, T.T. Measurement and Path of China’s Energy Carbon Emission Reduction from the Perspective of Ecological Environment Zoning Regulation. J. Shanghai Jiao Tong Univ. (Philos. Soc. Sci.) 2023, 31, 46–58. [Google Scholar] [CrossRef]
- Han, M. A Study on the Basis, Barriers, and Countermeasures of Sino-European Green Financial Cooperation under the Dual-Carbon Goals. Theory J. 2022, 2, 65–73. [Google Scholar] [CrossRef]
Disclaimer/Publisher’s Note: The statements, opinions and data contained in all publications are solely those of the individual author(s) and contributor(s) and not of MDPI and/or the editor(s). MDPI and/or the editor(s) disclaim responsibility for any injury to people or property resulting from any ideas, methods, instructions or products referred to in the content. |
© 2025 by the authors. Licensee MDPI, Basel, Switzerland. This article is an open access article distributed under the terms and conditions of the Creative Commons Attribution (CC BY) license (https://creativecommons.org/licenses/by/4.0/).