Abstract
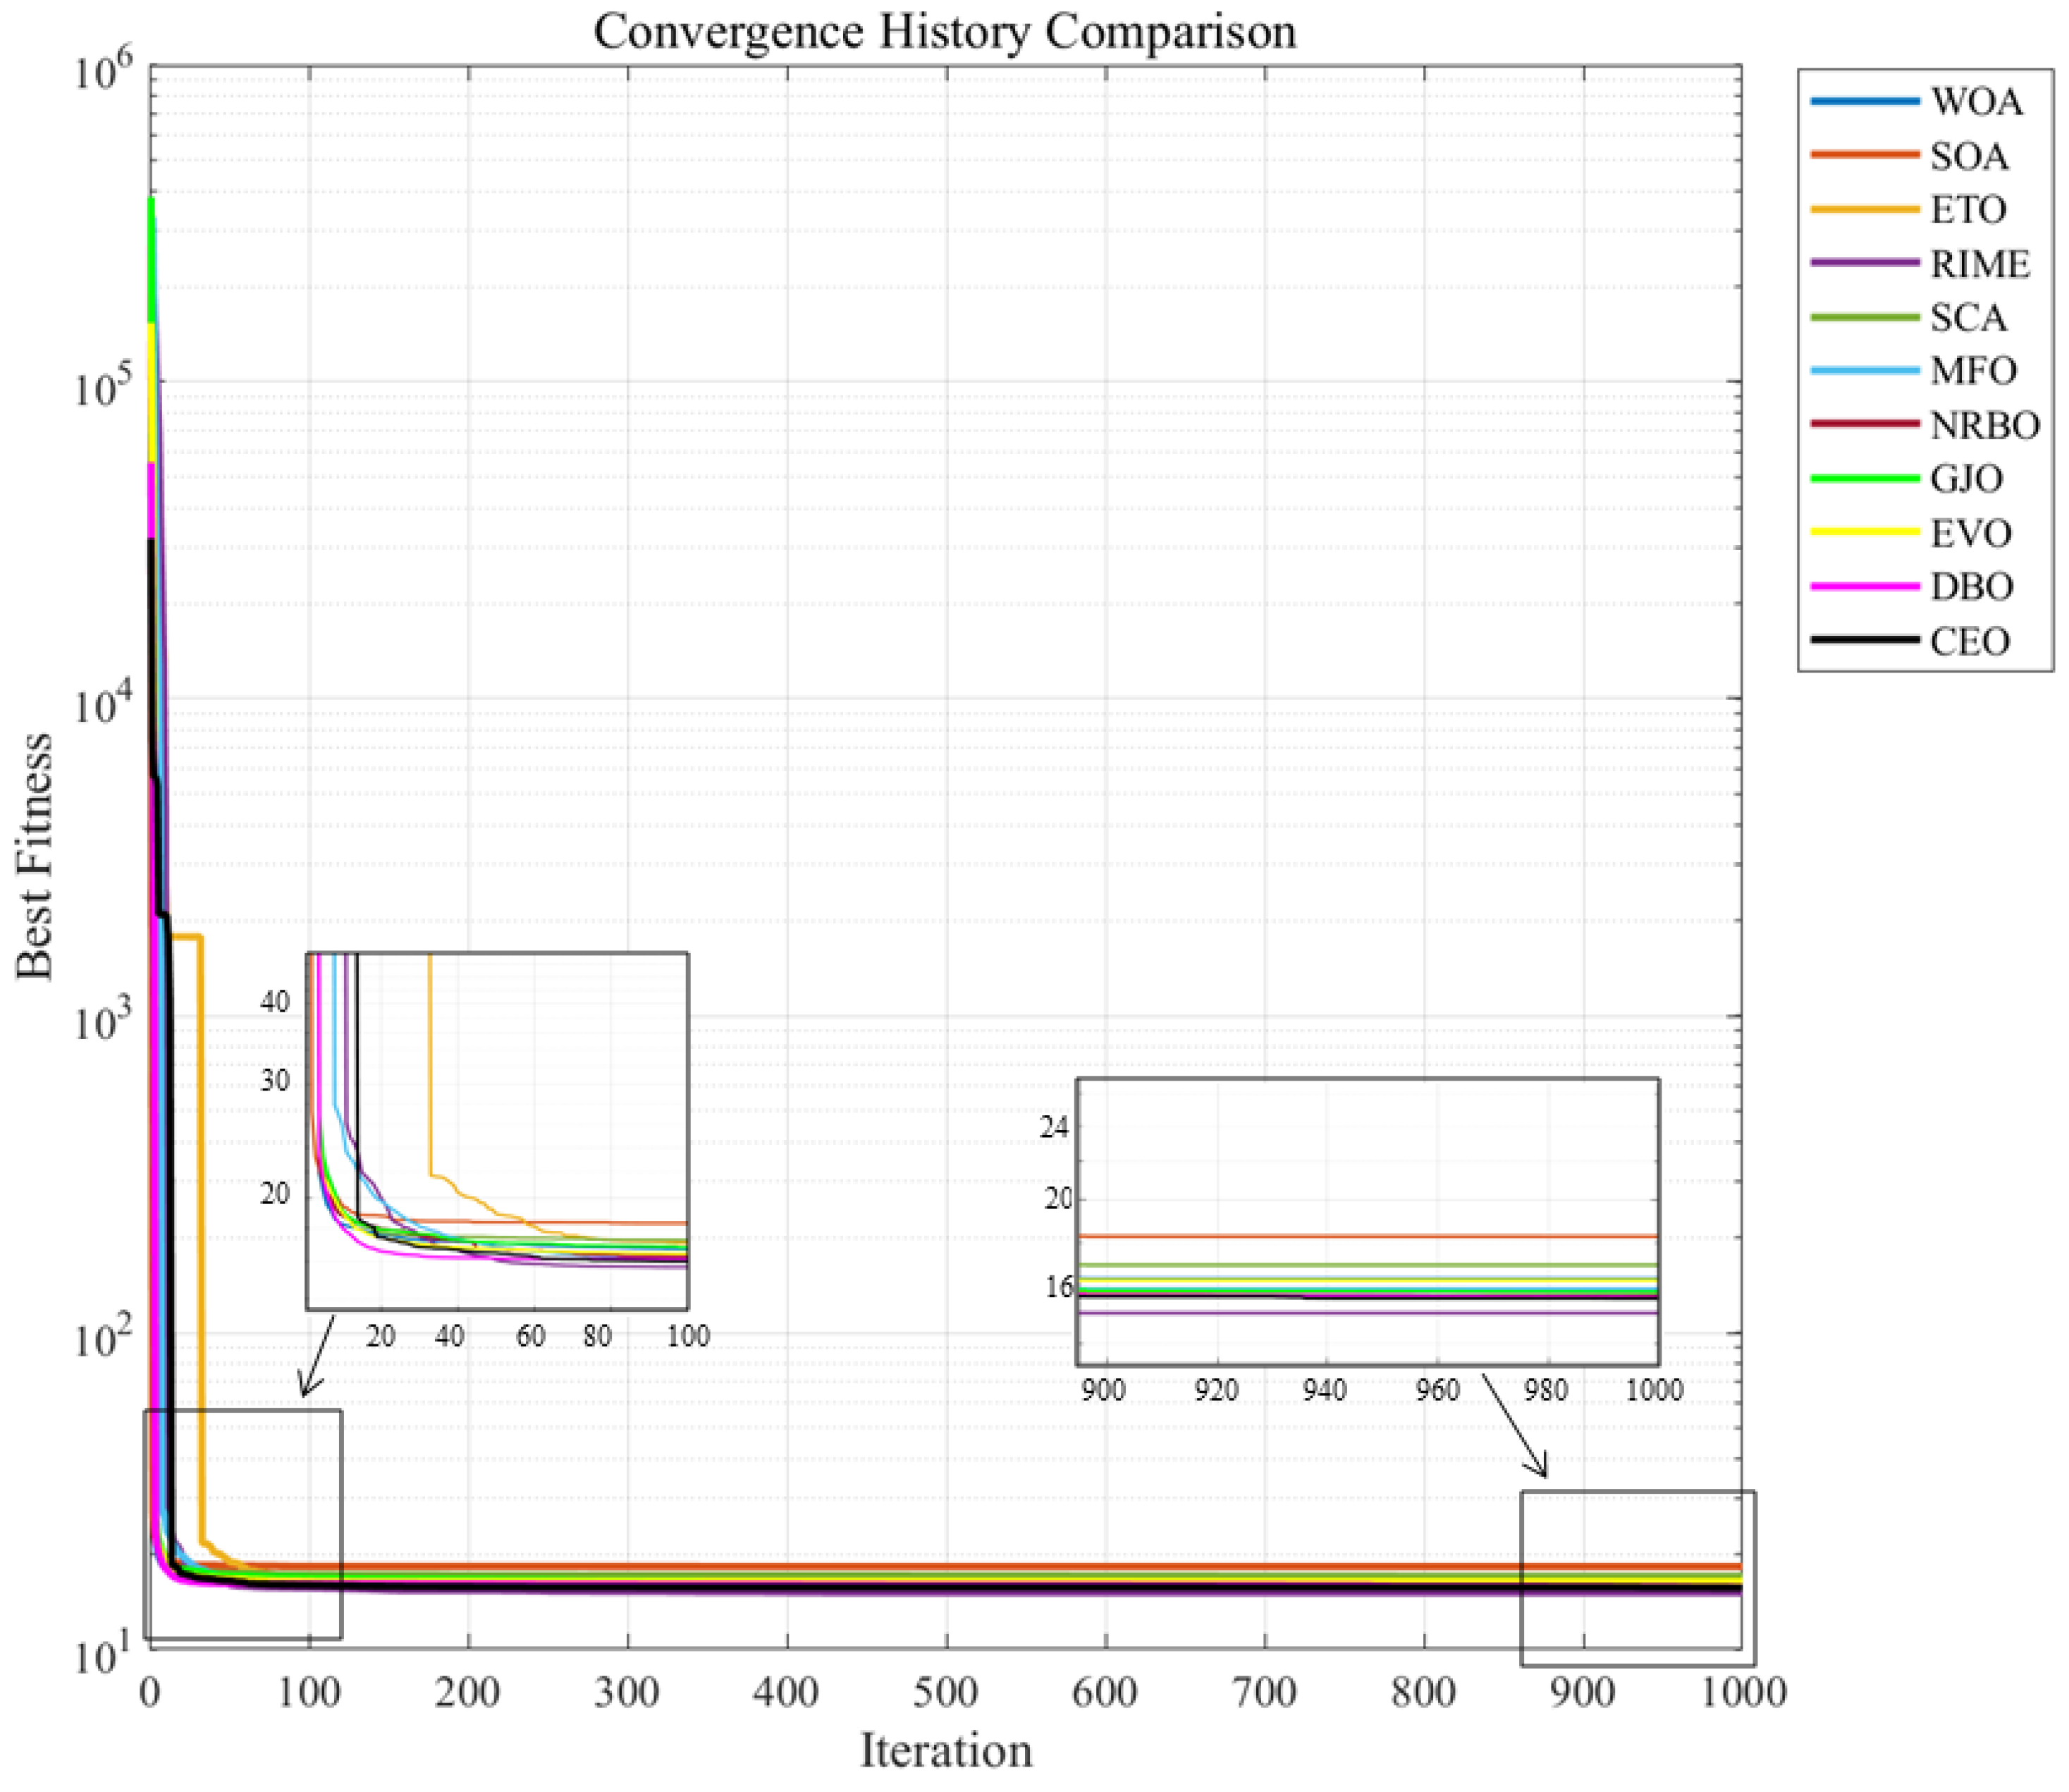
This study proposes a novel metaheuristic algorithm, Cosmic Evolution Optimization (CEO), for numerical optimization and engineering design. Inspired by the cosmic evolution process, CEO simulates physical phenomena including cosmic expansion, universal gravitation, stellar system interactions, and celestial orbital resonance.The algorithm introduces a multi-stellar framework system, which incorporates search agents into distinct subsystems to perform simultaneous exploration or exploitation behaviors, thereby enhancing diversity and parallel exploration capabilities. Specifically, the CEO algorithm was compared against ten state-of-the-art metaheuristic algorithms on 29 typical unconstrained benchmark problems from CEC2017 across different dimensions and 13 constrained real-world optimization problems from CEC2020. Statistical validations through the Friedman test, the Wilcoxon rank-sum test, and other statistical methods have confirmed the competitiveness and effectiveness of the CEO algorithm. Notably, it achieved a comprehensive Friedman rank of 1.28/11, and the winning rate in the Wilcoxon rank-sum tests exceeded 80% in CEC2017. Furthermore, CEO demonstrated outstanding performance in practical engineering applications such as robot path planning and photovoltaic system parameter extraction, further verifying its efficiency and broad application potential in solving real-world engineering challenges.
MSC:
90C59
1. Introduction
With the rapid development of science and technology, optimization problems in various fields have become increasingly complex, characterized by nonlinearity, the large-scale nature, high dimensionality, numerous constraints, etc. Traditional exact optimization algorithms, such as the simplex method [1] and the branch-and-bound method [2], can obtain more accurate solutions than metaheuristic algorithms by searching the entire space for small-scale problems, but they are often inadequate when dealing with large-scale and high-dimensional complex problems [3]. Compared with metaheuristic algorithms, traditional optimization algorithms are not only time-consuming but also prone to falling into local optima. They highly depend on the mathematical properties of the problem and struggle to handle complex optimization problems involving discontinuities, non-differentiability, and noisy disturbances.
To overcome the limitations of traditional exact optimization algorithms, researchers have drawn inspiration from natural phenomena to develop numerous global optimization algorithms based on simulations and nature-inspired principles, also known as metaheuristic algorithms [4]. By simulating biological behaviors, physical phenomena, or social mechanisms in nature, metaheuristic algorithms design a series of efficient search strategies to conduct global exploration in complex solution spaces, thereby effectively avoiding local optima [5,6]. Notably, these algorithms demonstrate exceptional adaptability in scenarios involving NP-hard problems and contexts where derivative computation is prohibitively expensive. This adaptability is further validated by their success in real-world engineering challenges, such as robot path planning and photovoltaic system parameter extraction, where traditional methods often struggle with high-dimensionality and non-differentiable constraints. Additionally, metaheuristic algorithms do not require complex processes such as differentiation, pay no attention to the differences between problems, and only need to focus on input and output data, exhibiting strong flexibility for many different problems [7].
Based on their search structures and inspiration sources, metaheuristic algorithms can be systematically categorized into two classes. Under the first classification scheme, metaheuristics are divided into population-based iterative optimization algorithms and single-candidate-solution-based algorithms [8]. The former explores the solution space through collaboration among multiple solutions, guiding the search direction via information interaction between individuals; a typical example is Particle Swarm Optimization (PSO) [9]. Single-solution-based algorithms generally iterate optimization around a single solution, improving solution quality through neighborhood search or perturbation strategies. For instance, Tabu Search (TS) [10] generates candidate solutions through neighborhood search around a single solution, utilizing a tabu list to record recent moves and avoid redundant searches, thereby overcoming tabu restrictions via an aspiration criterion to achieve directed optimization of the single solution. Such algorithms do not rely on population interaction and thus have advantages in computational cost. Population-based algorithms, leveraging parallel search of multiple solutions and information-sharing mechanisms, can cover the solution space more efficiently when handling high-dimensional complex problems. Their diversity advantage significantly enhances the search efficiency for global optimal solutions, while a drawback is that they require a longer running time and more function evaluations.
In another classification system, metaheuristic algorithms can be divided into four categories according to different sources of inspiration: evolutionary algorithms (EAs) based on biological evolution in nature, hysical algorithms (PhAs) based on physical laws, human-based algorithms (HBAs) inspired by the emergence and development of human society, and swarm intelligence (SI) algorithms based on the social behaviors of biological groups [11]. The genetic algorithm (GA) [12] is the most famous evolutionary algorithm, first proposed by John Holland in the 1960s and systematically expounded by him in 1975 to formally mark the birth of evolutionary algorithms. Inspired by Darwin’s theory of natural selection and Mendel’s principles of genetics, the GA simulates the processes of natural selection, crossover, and mutation in biological evolution, replacing poorer solutions with better ones. The GA can effectively address multi-objective, nonlinear, and other high-dimensional problems. Other evolutionary algorithms, such as differential evolution (DE) [13], guide the search direction by utilizing the difference information between individuals in the population to expand the global search scope, while the core ideas of evolutionary algorithms like genetic programming (GP) [14], evolutionary programming (EP) [15], and the evolutionary strategy (ES) [16] also involve processes such as crossover, mutation, and recombination.
Human-based algorithms are a class of metaheuristic optimization algorithms inspired by human behaviors, social structures, or cultural evolution, treating optimization problems as evolutionary processes of social systems by simulating behaviors such as collaboration, competition, and learning in human society. One of the most famous human-based algorithms is the teaching–learning-based optimization (TLBO) algorithm [17], which was proposed by Rao et al. in 2011 and inspired by the process of teaching and learning in classrooms. The algorithm divides the population into teachers and learners: the teacher phase transmits knowledge through the optimal solution, and the learning phase updates positions through communication among students, thus rapidly achieving or approaching the optimal solution. TLBO offers advantages such as a straightforward algorithmic structure and minimal parameter settings. Other human-based algorithms include social group optimization (SGO) [18] based on collaboration and competition in human social groups, social cognitive optimization (SCO) [19] based on individual learning through observing and imitating others, the memetic algorithm (MA) [20] based on cultural gene transmission and evolution, social emotional optimization (SEO) [21] based on emotional changes in social interactions, political optimization (PO) [22] based on political party competition and voter voting, and the war strategy algorithm (WSA) [23] based on offensive, defensive, and alliance strategies in ancient warfare.
Swarm intelligence algorithms are the most widely studied and applied algorithms to date. They treat optimization problems as dynamic evolutionary processes of groups in the solution space by simulating the collaborative behaviors of biological populations in nature. One of the most famous algorithms is Particle Swarm Optimization (PSO) [9], which simulates the behavior of bird flocks or fish schools seeking food or habitats through information sharing among individuals. Each particle updates its velocity and position by tracking its own historical best and the global best, continuously adjusting until convergence to the optimal solution at the end of iterations. Other classic swarm intelligence algorithms include ant colony optimization (ACO) [24], which mimics pheromone sharing in ant colonies to find the shortest path; the artificial bee colony (ABC) [25], which simulates the division of labor in honeybees (employed bees, onlooker bees, and scout bees) during foraging; the gray wolf optimizer (GWO) [26], which models the social hierarchy and hunting behavior of gray wolves, assuming three leader wolves (,, and Ω) to guide position updates and track prey; the bat algorithm (BA) [27], which imitates bats’ echolocation for predation by adjusting the frequency, loudness, and pulse emission rate to update positions; cuckoo search (CS) [28], which simulates cuckoos’ brood parasitism and leverages Lévy flight for optimization; and the whale optimization algorithm (WOA) [29], which emulates humpback whales’ hunting behaviors (encircling prey, random search, and bubble-net attack) to gradually converge to optimal solutions.
The last category of physics-based algorithms treats optimization problems as deductions in physical systems by simulating processes such as energy minimization, force equilibrium, and particle motion, often with intuitive physical backgrounds. Simulated annealing (SA) [30], a classic physics-inspired algorithm proposed by Kirkpatrick et al. in 1983, draws inspiration from the thermodynamics of solid annealing: at high temperatures, it favors global exploration by accepting worse solutions to escape local optima; as the temperature decreases, it shifts to local exploitation, eventually converging to a global optimum or a high-quality approximate solution. SA demonstrates strong adaptability in high-dimensional problem-solving, featuring a simple structure, few parameters, and broad applicability in engineering. The Gravitational Search Algorithm (GSA) [31] is another classic physical algorithm inspired by Newton’s law of universal gravitation. It models individuals in the solution space as mass-bearing objects, updating their positions through gravitational forces and accelerations to converge to optimal solutions. Other physics-inspired algorithms include the black hole algorithm (BHA) [32] based on astrophysical black hole phenomena; the artificial electric field algorithm (AEFA) [33] inspired by charge interactions in electric fields; the atom search optimization (ASO) algorithm [34] based on interatomic forces; the heat transfer search (HTS) algorithm [35] mimicking heat exchange in thermodynamics; ray optimization (RO) [36] inspired by light propagation and reflection; quantum particle swarm optimization (QPSO) [37] based on quantum mechanical particle behavior; and the arcing search algorithm (ASA) [38] simulating lightning phenomena.
In recent years, many novel physics-inspired metaheuristic algorithms have emerged, such as the energy valley optimizer (EVO) [39], which microscopically simulates particle stabilization and decay; the propagation search algorithm (PSA) [40], inspired by wave propagation of current and voltage in long transmission lines; the attraction–repulsion optimization algorithm (AROA) [41], inspired by the simultaneous attraction and repulsion forces acting on all objects in nature; and the rime optimization algorithm (RIME) [42], which simulates the growth processes of soft and hard rime (frost ice). These new algorithms far surpass traditional metaheuristic algorithms in exploitation and exploration capabilities when applied to specific engineering design optimization problems. For example, the PSA exhibits much faster convergence than algorithms such as AEFA, CS, and SSA in solving problems requiring a rapid response. The EVO provides competitive and excellent results in handling complex benchmark and real-world problems. The RIME’s excellent balance between exploration and exploitation during iterations indicates its potential for a wide range of problems.
However, as the No Free Lunch (NFL) theorem [43] suggests, although metaheuristic algorithms have been widely applied and performed well in various fields, no single algorithm can solve all optimization problems. This perspective has motivated researchers to continuously propose new algorithms or attempt optimization measures to enhance algorithmic exploration or exploitation capabilities, achieving a balance between them [44] to facilitate broader dissemination and application.
To address these challenges, this work presents a novel physics-inspired metaheuristic algorithm, CEO. Inspired by the process of cosmic evolution, the algorithm simulates physical phenomena such as cosmic expansion [45], universal gravitation, stellar system interactions [46], and celestial orbital resonance [47]. By introducing the concept of cosmic space, CEO partitions the search space into multiple stellar systems, each containing several celestial bodies. The algorithm treats current solutions as celestial bodies in the universe, updating their positions by calculating the mutual gravitational forces between each celestial body and the surrounding stars. Additionally, it models the interactive behaviors between stellar systems and the influence of cosmic expansion on celestial bodies. This mechanism enables the algorithm to achieve a robust balance between global exploration and local exploitation.
Unlike other metaheuristic algorithms inspired by cosmic phenomena, CEO introduces a multi-stellar system framework wherein search agents are hierarchically organized into distinct subsystems overseen by high-performing “stellar” leaders. This hierarchical architecture enables multi-centered gravitational steering, which bolsters population diversity and facilitates parallel exploration. In contrast, algorithms such as the GSA [31] and BHA [32] lack such hierarchical differentiation, relying instead on a single-centered interaction paradigm. Furthermore, CEO’s celestial orbital resonance mechanism emulates micro-scale orbital modulations inspired by celestial mechanics, transcending conventional gravitational analogies. CEO achieves both search breadth and exploitation precision relative to the GSA and BHA, thereby attaining a superior exploration–exploitation balance and robust performance across diverse scenarios.
The main contributions of this work are summarized as follows:
- A novel algorithm based on cosmic evolution phenomena, the Cosmic Evolution Optimization (CEO) algorithm, is proposed, which simulates the formation process of stellar celestial systems in the universe.
- The capabilities of the CEO algorithm were tested on 29 CEC2017 benchmark functions with 30-dimensional, 50-dimensional, and 100-dimensional spaces and compared with ten other advanced metaheuristic algorithms. CEO demonstrated superior performance in benchmark function tests.
- CEO was tested on 13 CEC2020 real-world constrained problems and compared with other metaheuristic algorithms. The results show that CEO outperforms other algorithms in optimizing most real-world problems.
- The CEO algorithm has shown promising application values in two typical engineering problems: robot path planning and photovoltaic system parameter extraction.
- Statistical analysis methods such as the Friedman test and the Wilcoxon rank-sum test were used to explore the performance of the CEO algorithm, and the results indicate that CEO performs outstandingly in many cases.
2. Cosmic Evolution Algorithm
Natural phenomena have long served as a wellspring of inspiration for designing metaheuristic algorithms. The complex systems in the universe offer unique insights into balancing exploration and exploitation in optimization problems, which directly inspired the proposal of the CEO algorithm. This section first introduces the inspiration sources of CEO. Subsequently, the mathematical model of CEO is presented, encompassing four key components: the exploration phase, the exploitation phase, and two distinctive algorithmic mechanisms, namely the stellar system collision strategy and the celestial orbital resonance strategy.
2.1. Inspiration
The CEO algorithm draws inspiration from the evolutionary processes of the universe, particularly phenomena such as cosmic expansion, interactions between stellar systems, and gravitational interactions between celestial bodies. In this algorithm, the universe is modeled as a complex dynamic system, where each solution (celestial body) is part of this system, seeking optimal solutions through mutual interactions and evolution. As the universe evolves, celestial bodies gradually aggregate under the gravitational pull of stars to form stable stellar systems, while the cosmic expansion process enables celestial bodies to expand globally. During optimization, these cosmic physical phenomena are abstracted into objective functions, allowing the CEO algorithm to be widely applied to various optimization problems.
The cosmic evolution mechanisms regulate the motion and distribution of celestial bodies holistically, and the algorithm simulates four phenomena of cosmic evolution: cosmic expansion, universal gravitational interactions between celestial bodies, stellar system interactions, and celestial orbital resonance, where the cosmic expansion [45] process acts as a global exploration mechanism enabling celestial bodies to conduct large-scale searches across the vast cosmic space and avoid being trapped in local optima while the universal gravitational interaction process mimics the gravitational effects between celestial bodies to cause them to deviate in specific directions and explore unknown regions along fixed trajectories for fine-grained local exploitation. Stellar system interactions are categorized into two types—first, all celestial bodies are attracted by the most massive star and migrate toward it, and second, celestial bodies are allowed to migrate to other positions with a certain probability due to violent system collisions to enhance the algorithm’s global search capability [46]. The celestial orbital resonance mechanism simulates the phenomenon where the orbital path of a celestial body resonates with surrounding bodies to potentially alter or restrict its current trajectory [47]. These mechanisms serve as the core strategies of the CEO algorithm.
2.2. Initialization Phase of CEO
Inspired by the evolutionary process of the universe, the initialization process of the CEO algorithm simulates the birth and development of the universe. Initialization is divided into two stages: the first stage represents the generation of celestial bodies, and the second stage represents the formation of stellar systems.
The first-stage initialization of the celestial body population can be represented by an dimensional matrix, as shown in Equation (1):
where X is a set of random celestial body populations obtained using Equation (2). denotes the j-th dimensional coordinate of the i-th celestial body. N represents the total number of celestial bodies, and represents the dimension of the problem.
where is a random number in the interval , and and denote the upper and lower bounds of the variables, respectively.
The second-stage formation of stellar systems involves partitioning the search space into multiple stellar systems, each containing multiple celestial bodies. In algorithms such as the GSA (Gravitational Search Algorithm), the fitness of solutions is abstracted as the mass of particles or objects. The CEO algorithm borrows this concept, treating the fitness of solutions in the search space as the mass of celestial bodies. Thus, the solution with the optimal fitness has the largest mass and is regarded as the star in the celestial system, while the remaining solutions are treated as planets orbiting the star. The system radius is jointly determined by multiple planets orbiting the edge of the star.
2.3. Exploration Phase
Metaheuristic algorithms emphasize balancing the relationship between exploration and exploitation during the optimization process. These algorithms can update the next position through iteration based on the current position and the location of the best solution. Therefore, in this study, the exploration of the next position is still related to the algorithm’s own current position and the currently known optimal solution.
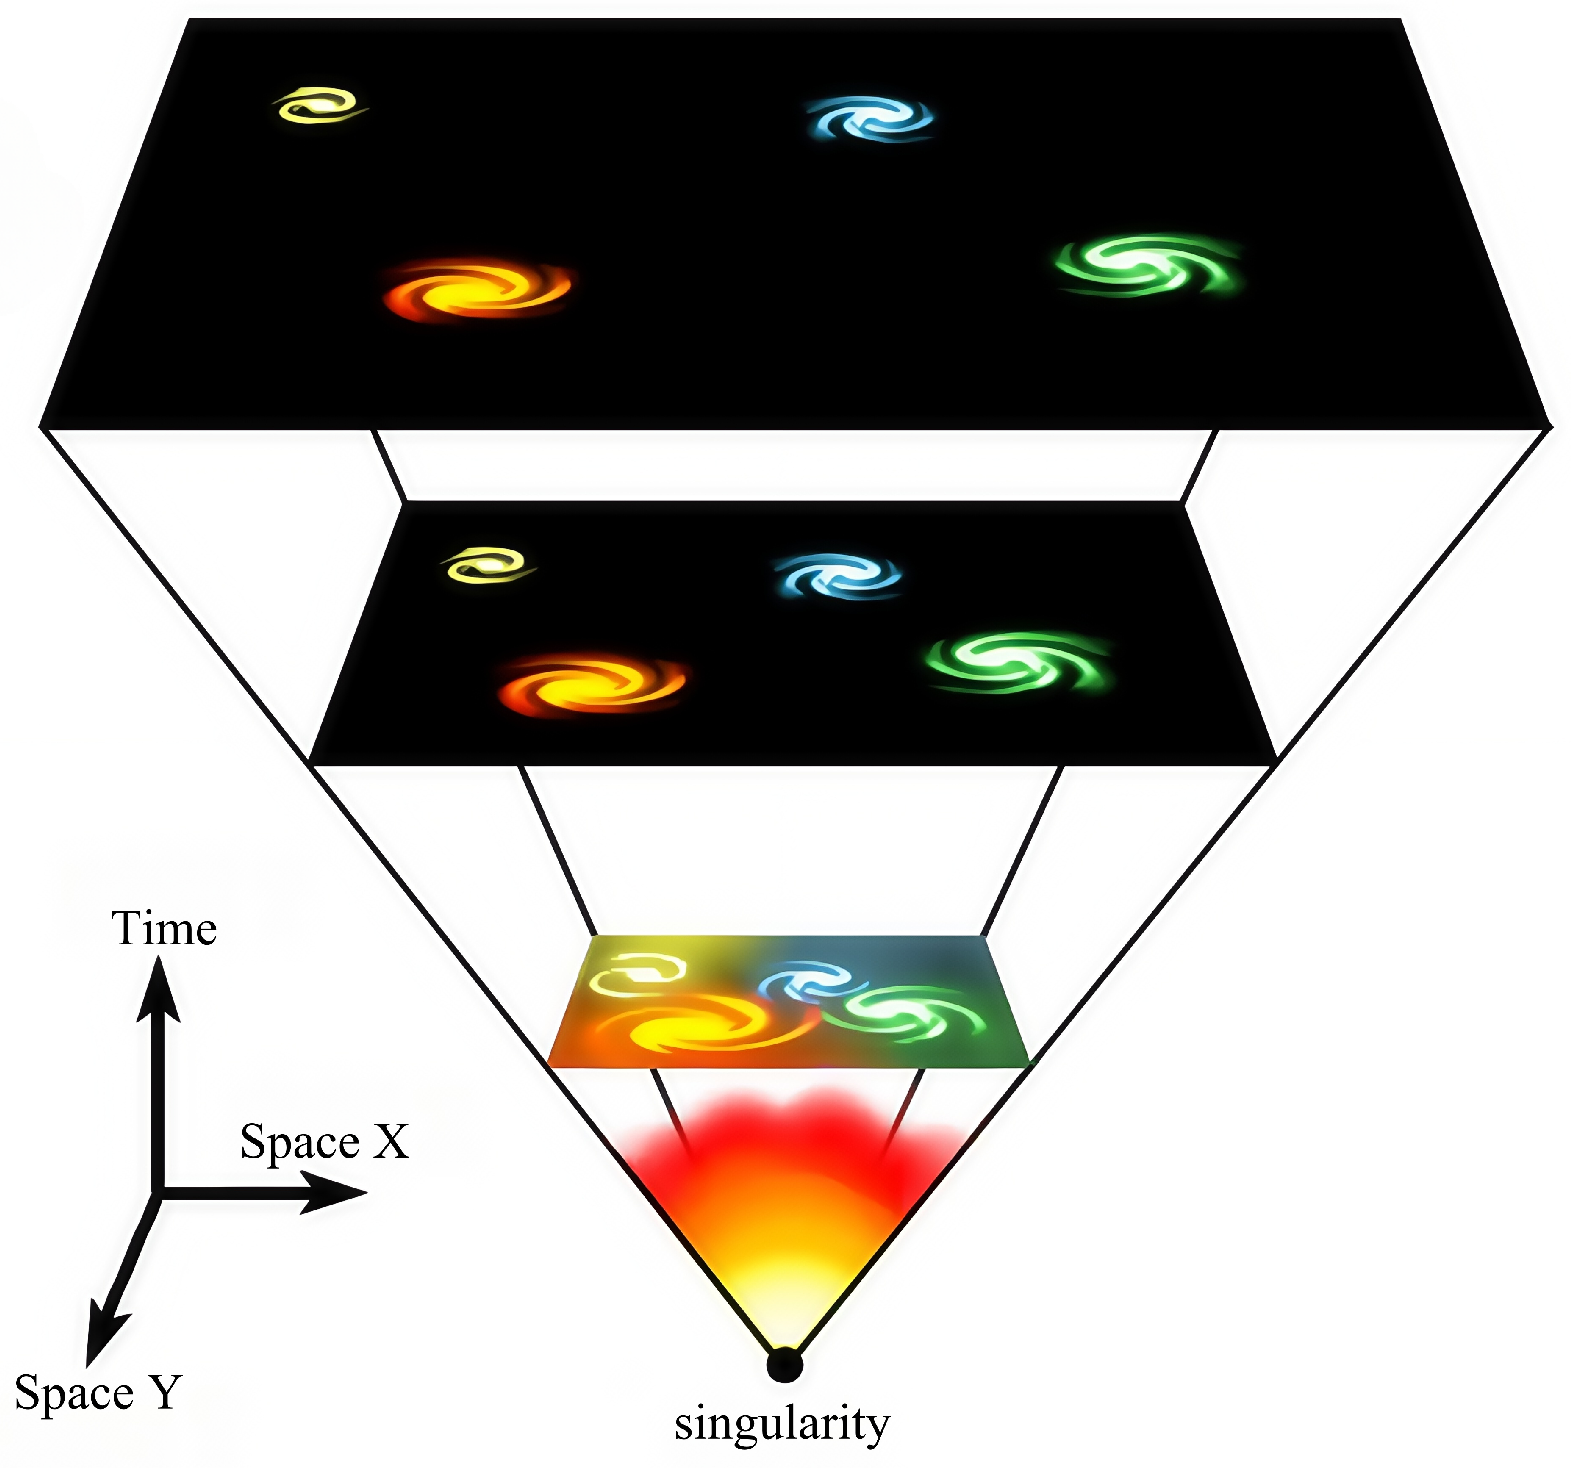
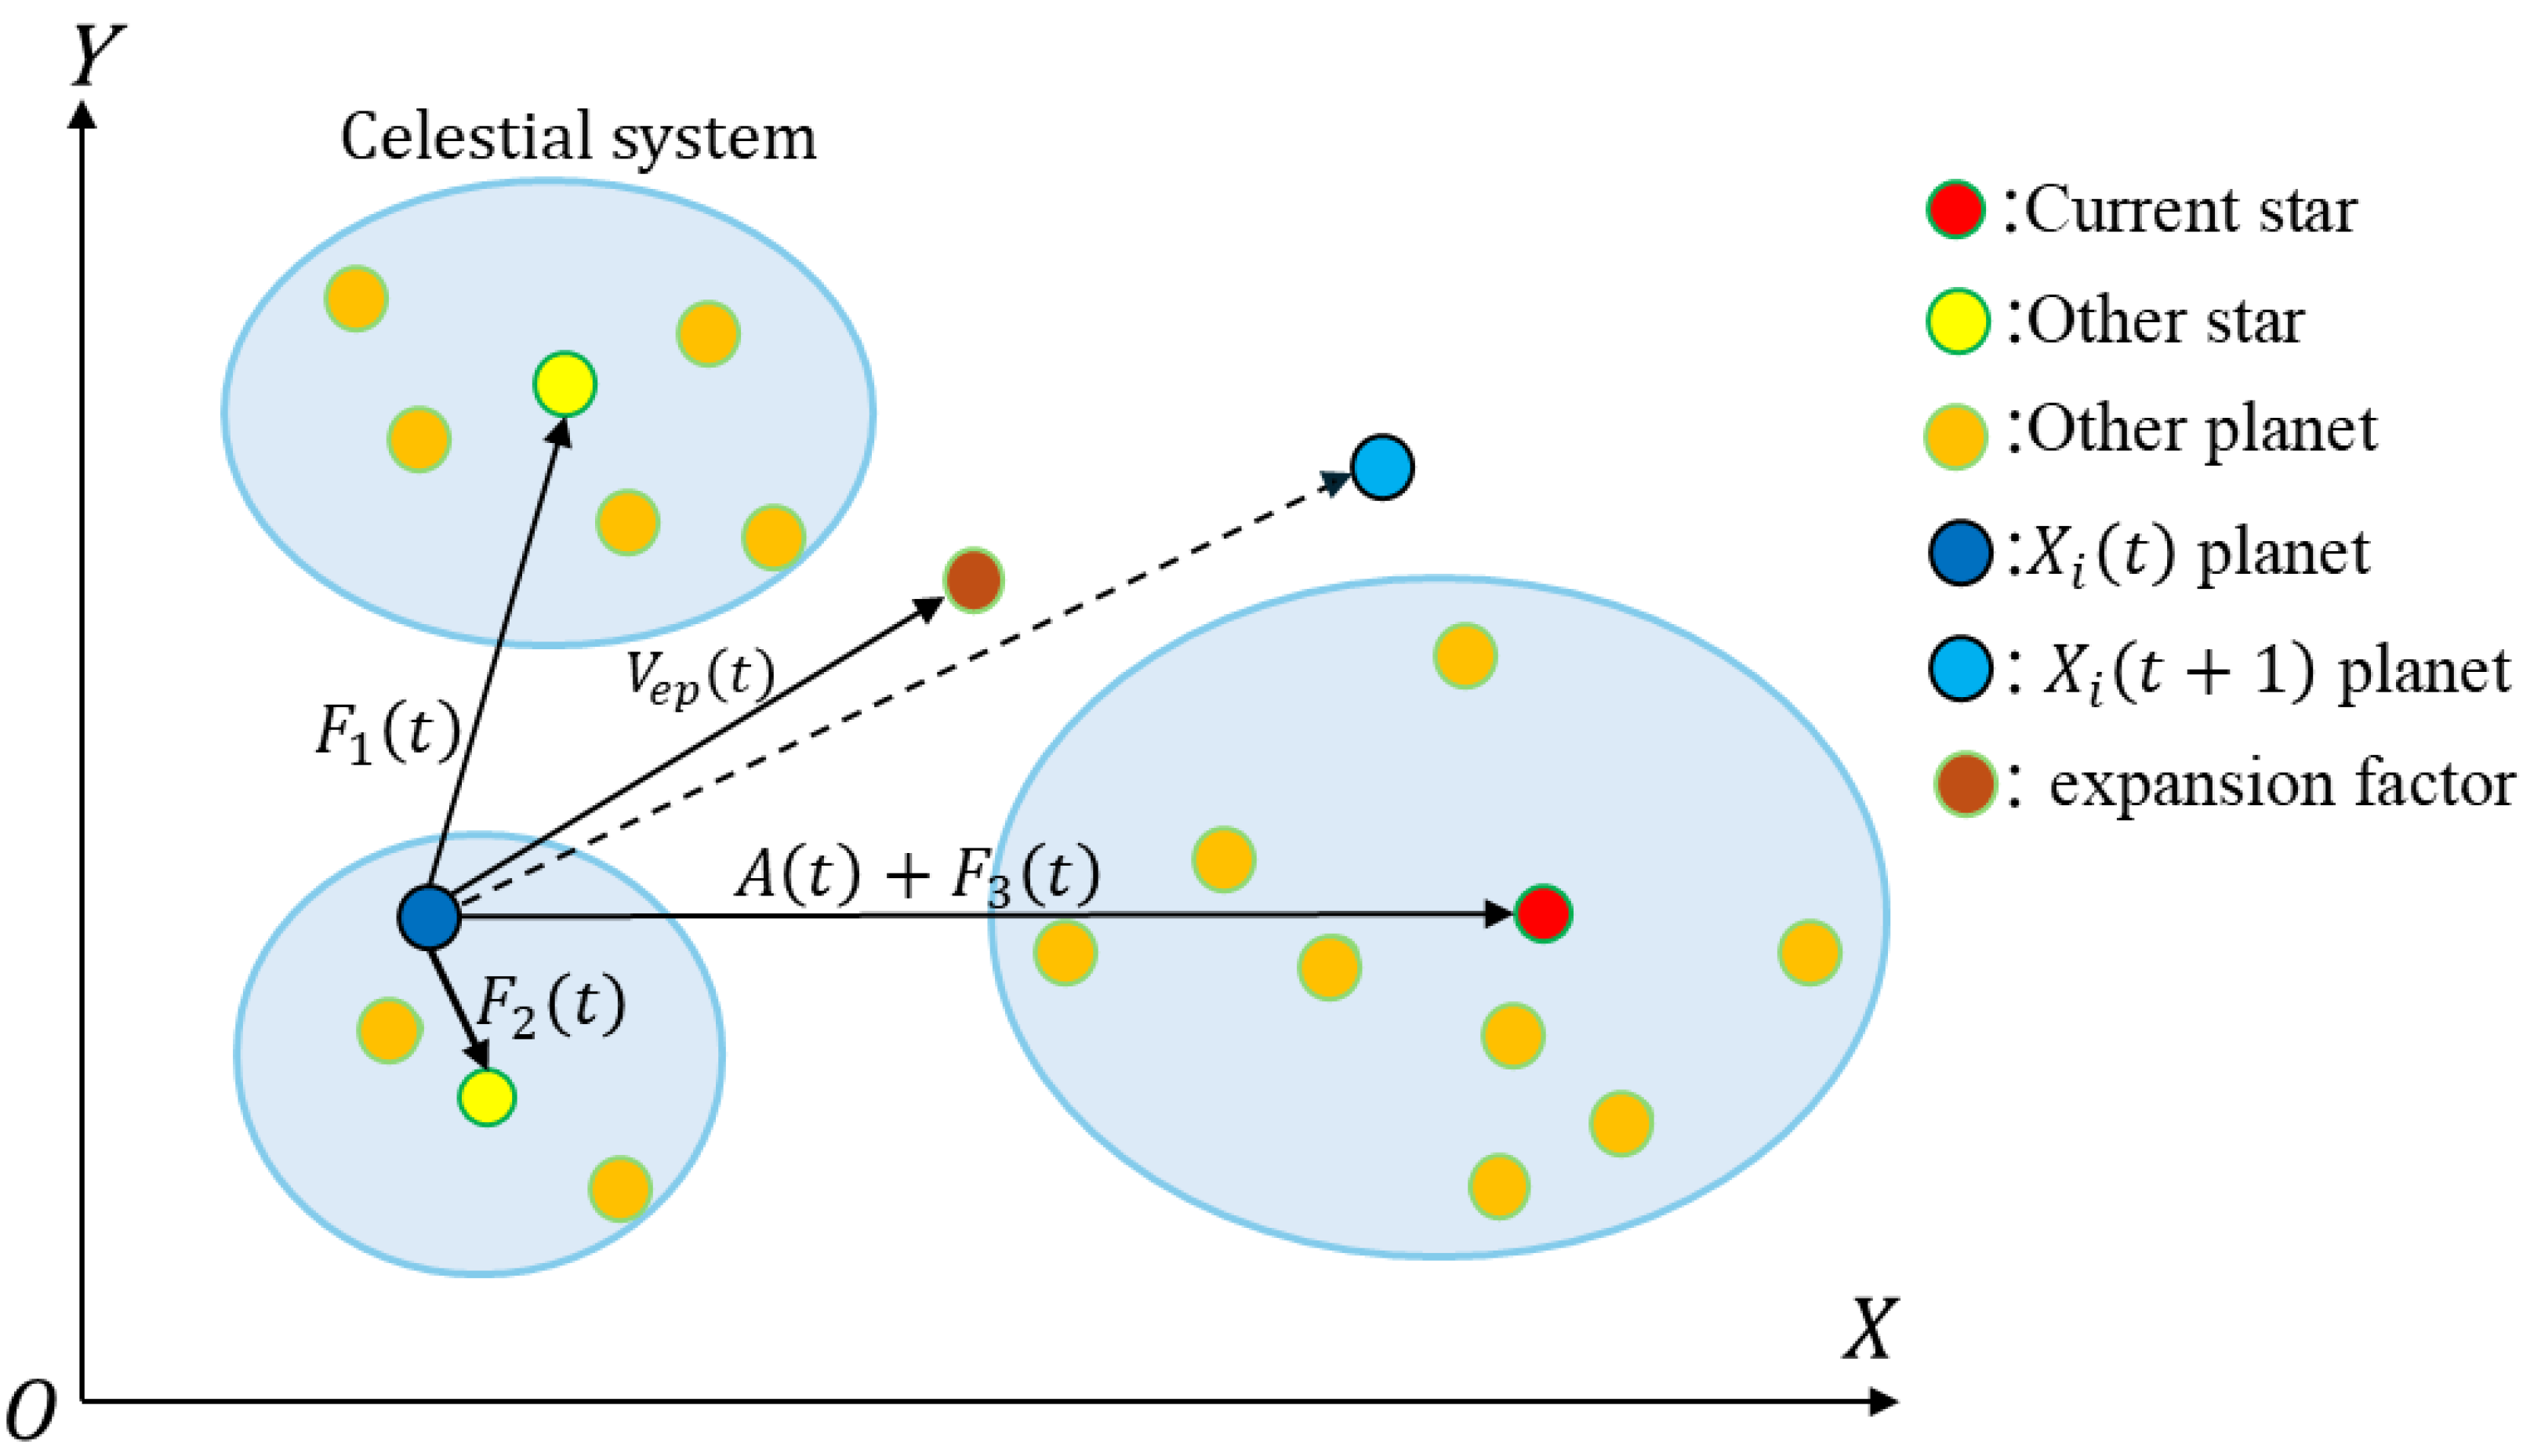
As shown in Figure 1, during the optimization process of the CEO algorithm, the search space is treated as cosmic space and divided into multiple expanding stellar system regions. This allows search agents to continuously explore broader areas, significantly enhancing the scope of global search.
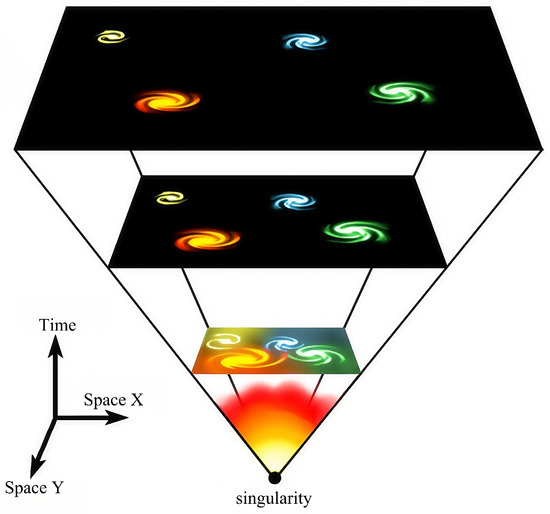
Figure 1.
Schematic diagram of cosmic expansion.
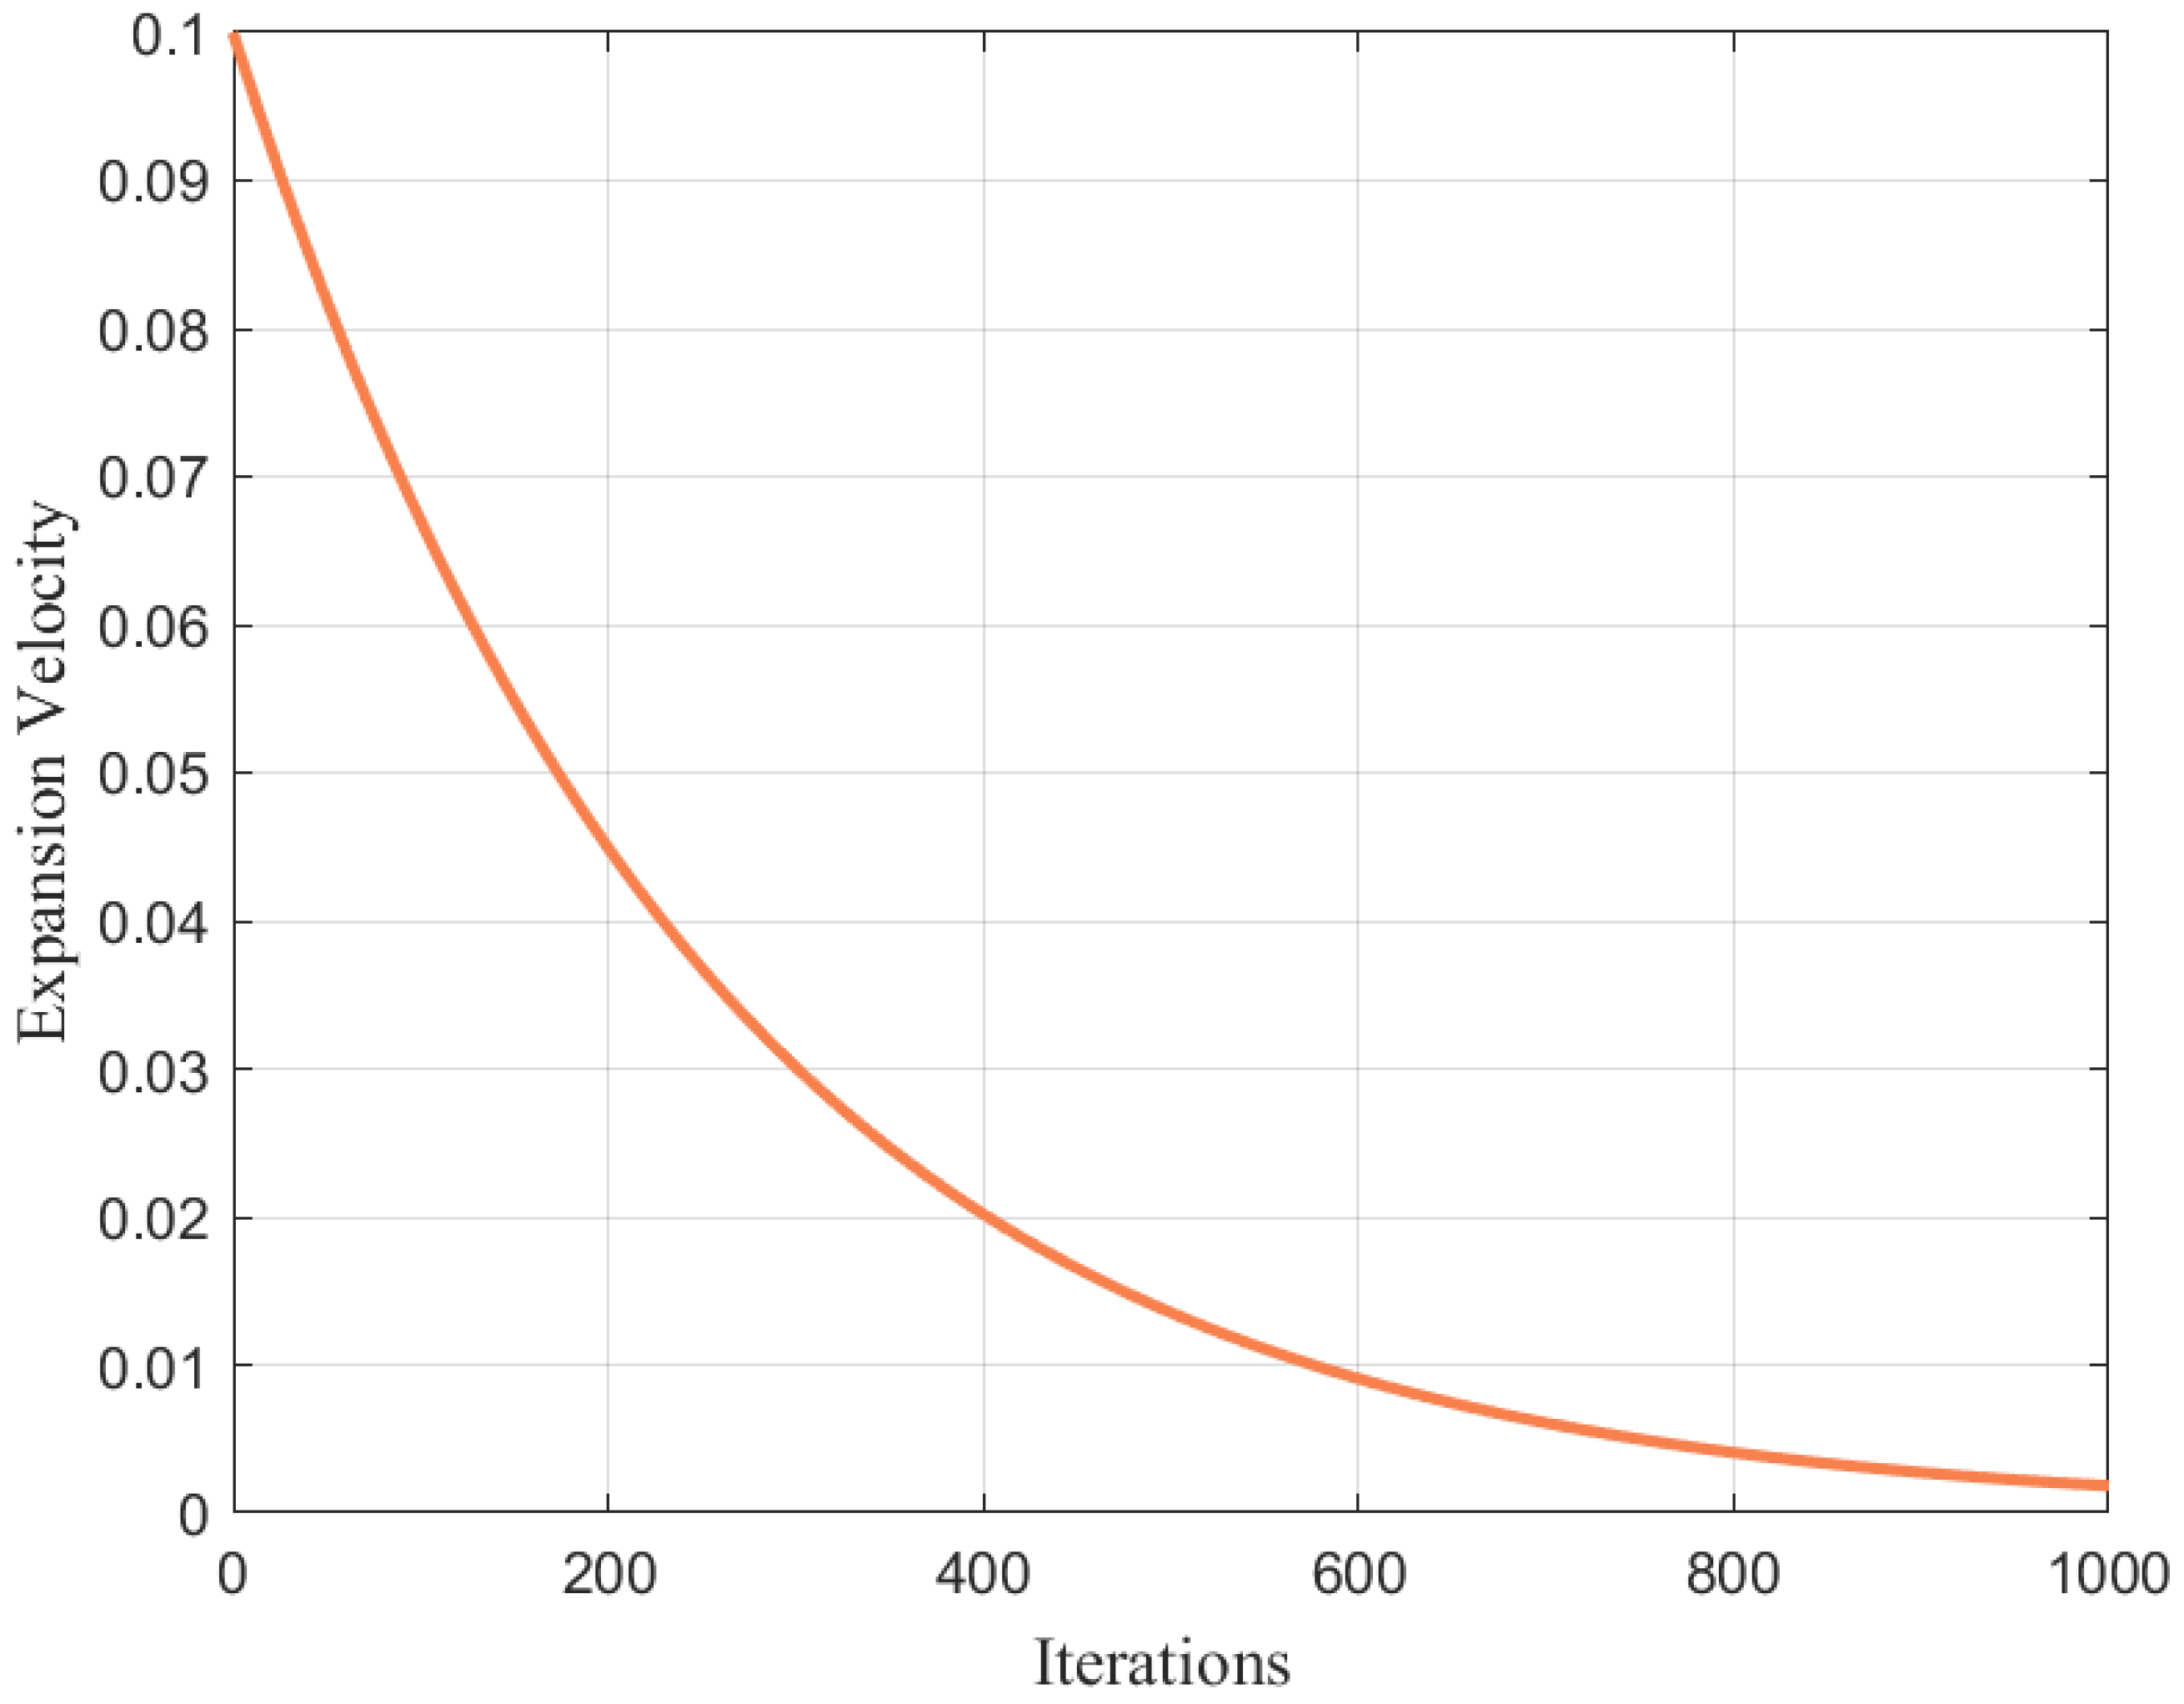
However, in the evolutionary process, the cosmic expansion coefficient does not remain constant. We adopt an adaptive parameter dynamic adjustment mechanism, where the expansion coefficient gradually weakens over time. The cosmic expansion velocity can be described by the following model:
where t is the iteration step, T is the maximum number of iterations, and is the expansion decay factor, which controls the precision of the exploration phase. Through experiments, its value is fixed at 0.1. The trend of Equation (3) is shown in Figure 2.
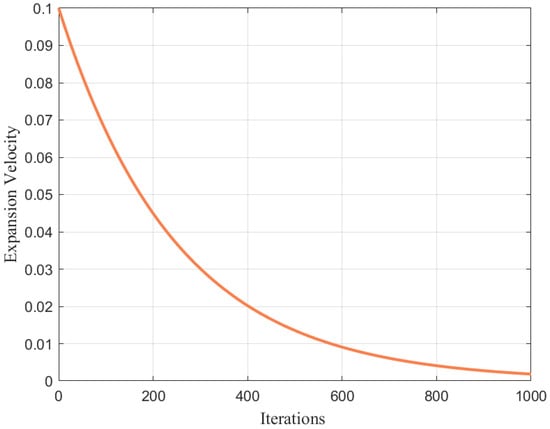
Figure 2.
Cosmic expansion velocity when .
Therefore, the update equation for celestial body motion is as follows:
In the exploration phase, the random number is employed to simulate the uncertainty in the direction of cosmic expansion, ensuring that celestial bodies can explore the search space as extensively as possible and expand into more feasible regions deep within the universe. In the early stage of algorithm iteration, the exponential term approaches 1, and is close to the initial value . At this time, the cosmic expansion effect is significant, driving celestial bodies to perform large-scale random searches in the search space. In the later stage of iteration, the exponential term approaches 0, and tends to 0. The cosmic expansion effect weakens, and the algorithm gradually shrinks the exploration range, shifting to local fine-grained search, and the search space decreases step by step. Additionally, the influence of cosmic expansion on the motion of celestial bodies is also related to the dimension: the higher the dimension, the greater the impact of cosmic expansion on celestial bodies.
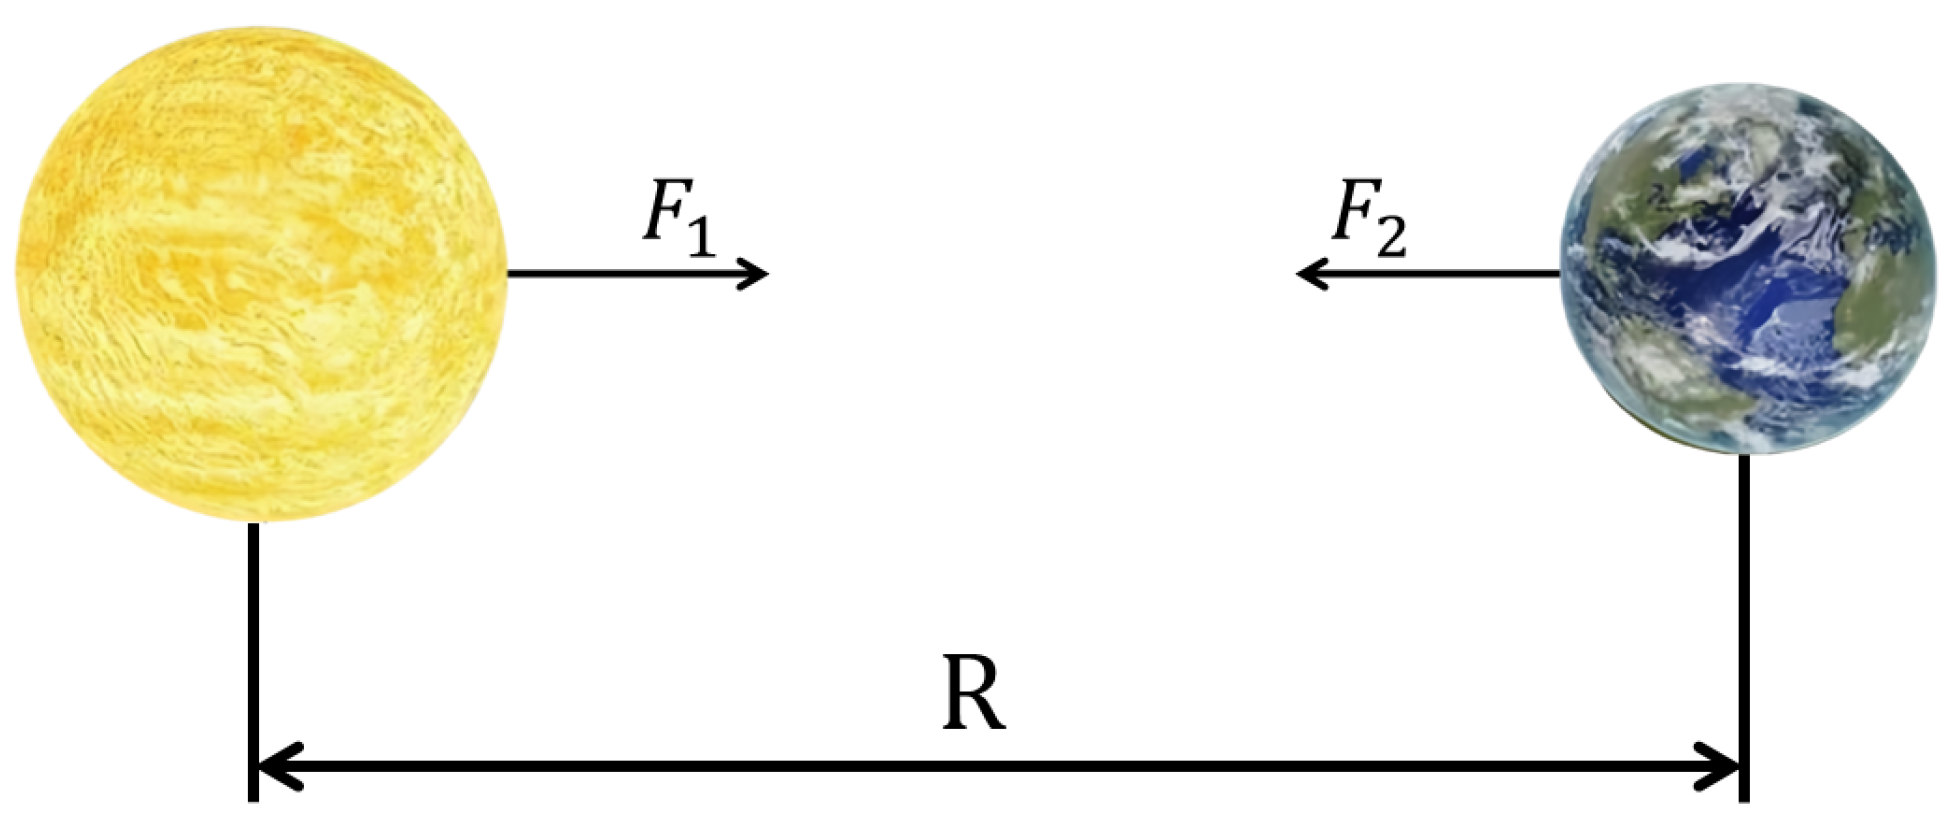
Moreover, considering that the motion of celestial bodies is influenced not only by cosmic expansion but also by the gravitational attraction of stars and other celestial bodies within each stellar system, we simulate the universal gravitation phenomenon by which stellar systems attract celestial bodies to move, as shown in Figure 3.
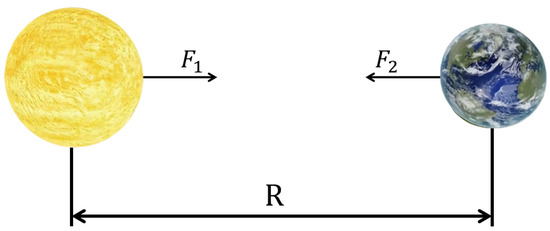
Figure 3.
Schematic diagram of universal gravitation.
First, the central coordinate and central fitness of each system are determined by the celestial body currently regarded as the star. The size of each stellar system is calculated by the following formula:
where C represents the number of initialized celestial systems and N denotes the total number of celestial bodies. Thus, signifies the number of celestial bodies selected to calculate the average radius of the c-th stellar system. represents the coordinate of the j-th celestial body in the top candidate solution vectors after sorting by fitness. denotes the central coordinate of the c-th stellar system before update, and represents the absolute distance from the -th celestial body to the center of the c-th stellar system.
For the gravitational force exerted by the c-th stellar system on , the calculation formula is as follows:
In the gravitational force formula above, directs the search trend of the solution toward the system center of each celestial system, forming multi-target guided exploration paths to avoid the limitations of a single search direction. Meanwhile, the gravitational strength is dynamically adjusted using an exponential decay function: when a celestial body is far from the system center (), the gravitational strength decays exponentially to reduce the search weight in invalid regions; when the celestial body is close to the center (), the gravitational force significantly increases to strengthen local refined searching. Since multiple stellar systems exist in the search space, celestial bodies are influenced by the gravitational forces of multiple stars. In this algorithm, a weight coefficient W is introduced to calculate the comprehensive gravitational force of each stellar system on the current celestial body. For the c-th system, the calculation model of its weight coefficient is
where represents the mass of the current celestial body, denotes the mass of the c-th star, and represents the mass of the largest star (also the fitness of the current optimal solution). A very small positive number is introduced to avoid the case where the divisor tends to infinity when = 0.
The total weight is obtained by summing the weights of all stars, where
The weight calculation model in Equation (7) enhances the local exploitation capability of the search space. If the current solution is inferior to the stellar system, the weight exponentially decays with the increase in difference, reducing the focus on this system and guiding the population to migrate to potential regions.
Based on Equations (6)–(8) above, the comprehensive gravitational force formula of the stellar system on the celestial body is derived as
Thus, the updated equation for celestial body movement modified by universal gravitation can be summarized as follows:
This formula describes the motion of the current celestial body, which is simultaneously influenced by cosmic expansion and the gravitational forces of multiple stellar systems.
2.4. Exploitation Phase
In the exploitation phase of the CEO algorithm, to simulate the influence of interactions between stellar systems on celestial bodies within their systems, we introduce a mechanism where all celestial bodies gradually adjust their positions under the gravitational attraction of the current largest star, namely the celestial alignment effect. To model the gravitational direction of the largest star on the current celestial body, we use the following reference direction:
Due to the highly dispersed positions of celestial body populations, a normally distributed random number is used to simulate the multi-directional movement of planets under the gravitational force of stars. This avoids all solutions approaching the optimal solution with the same amplitude and direction, thereby maintaining population diversity throughout the iteration process. Specifically, the influence of the alignment effect can be expressed as
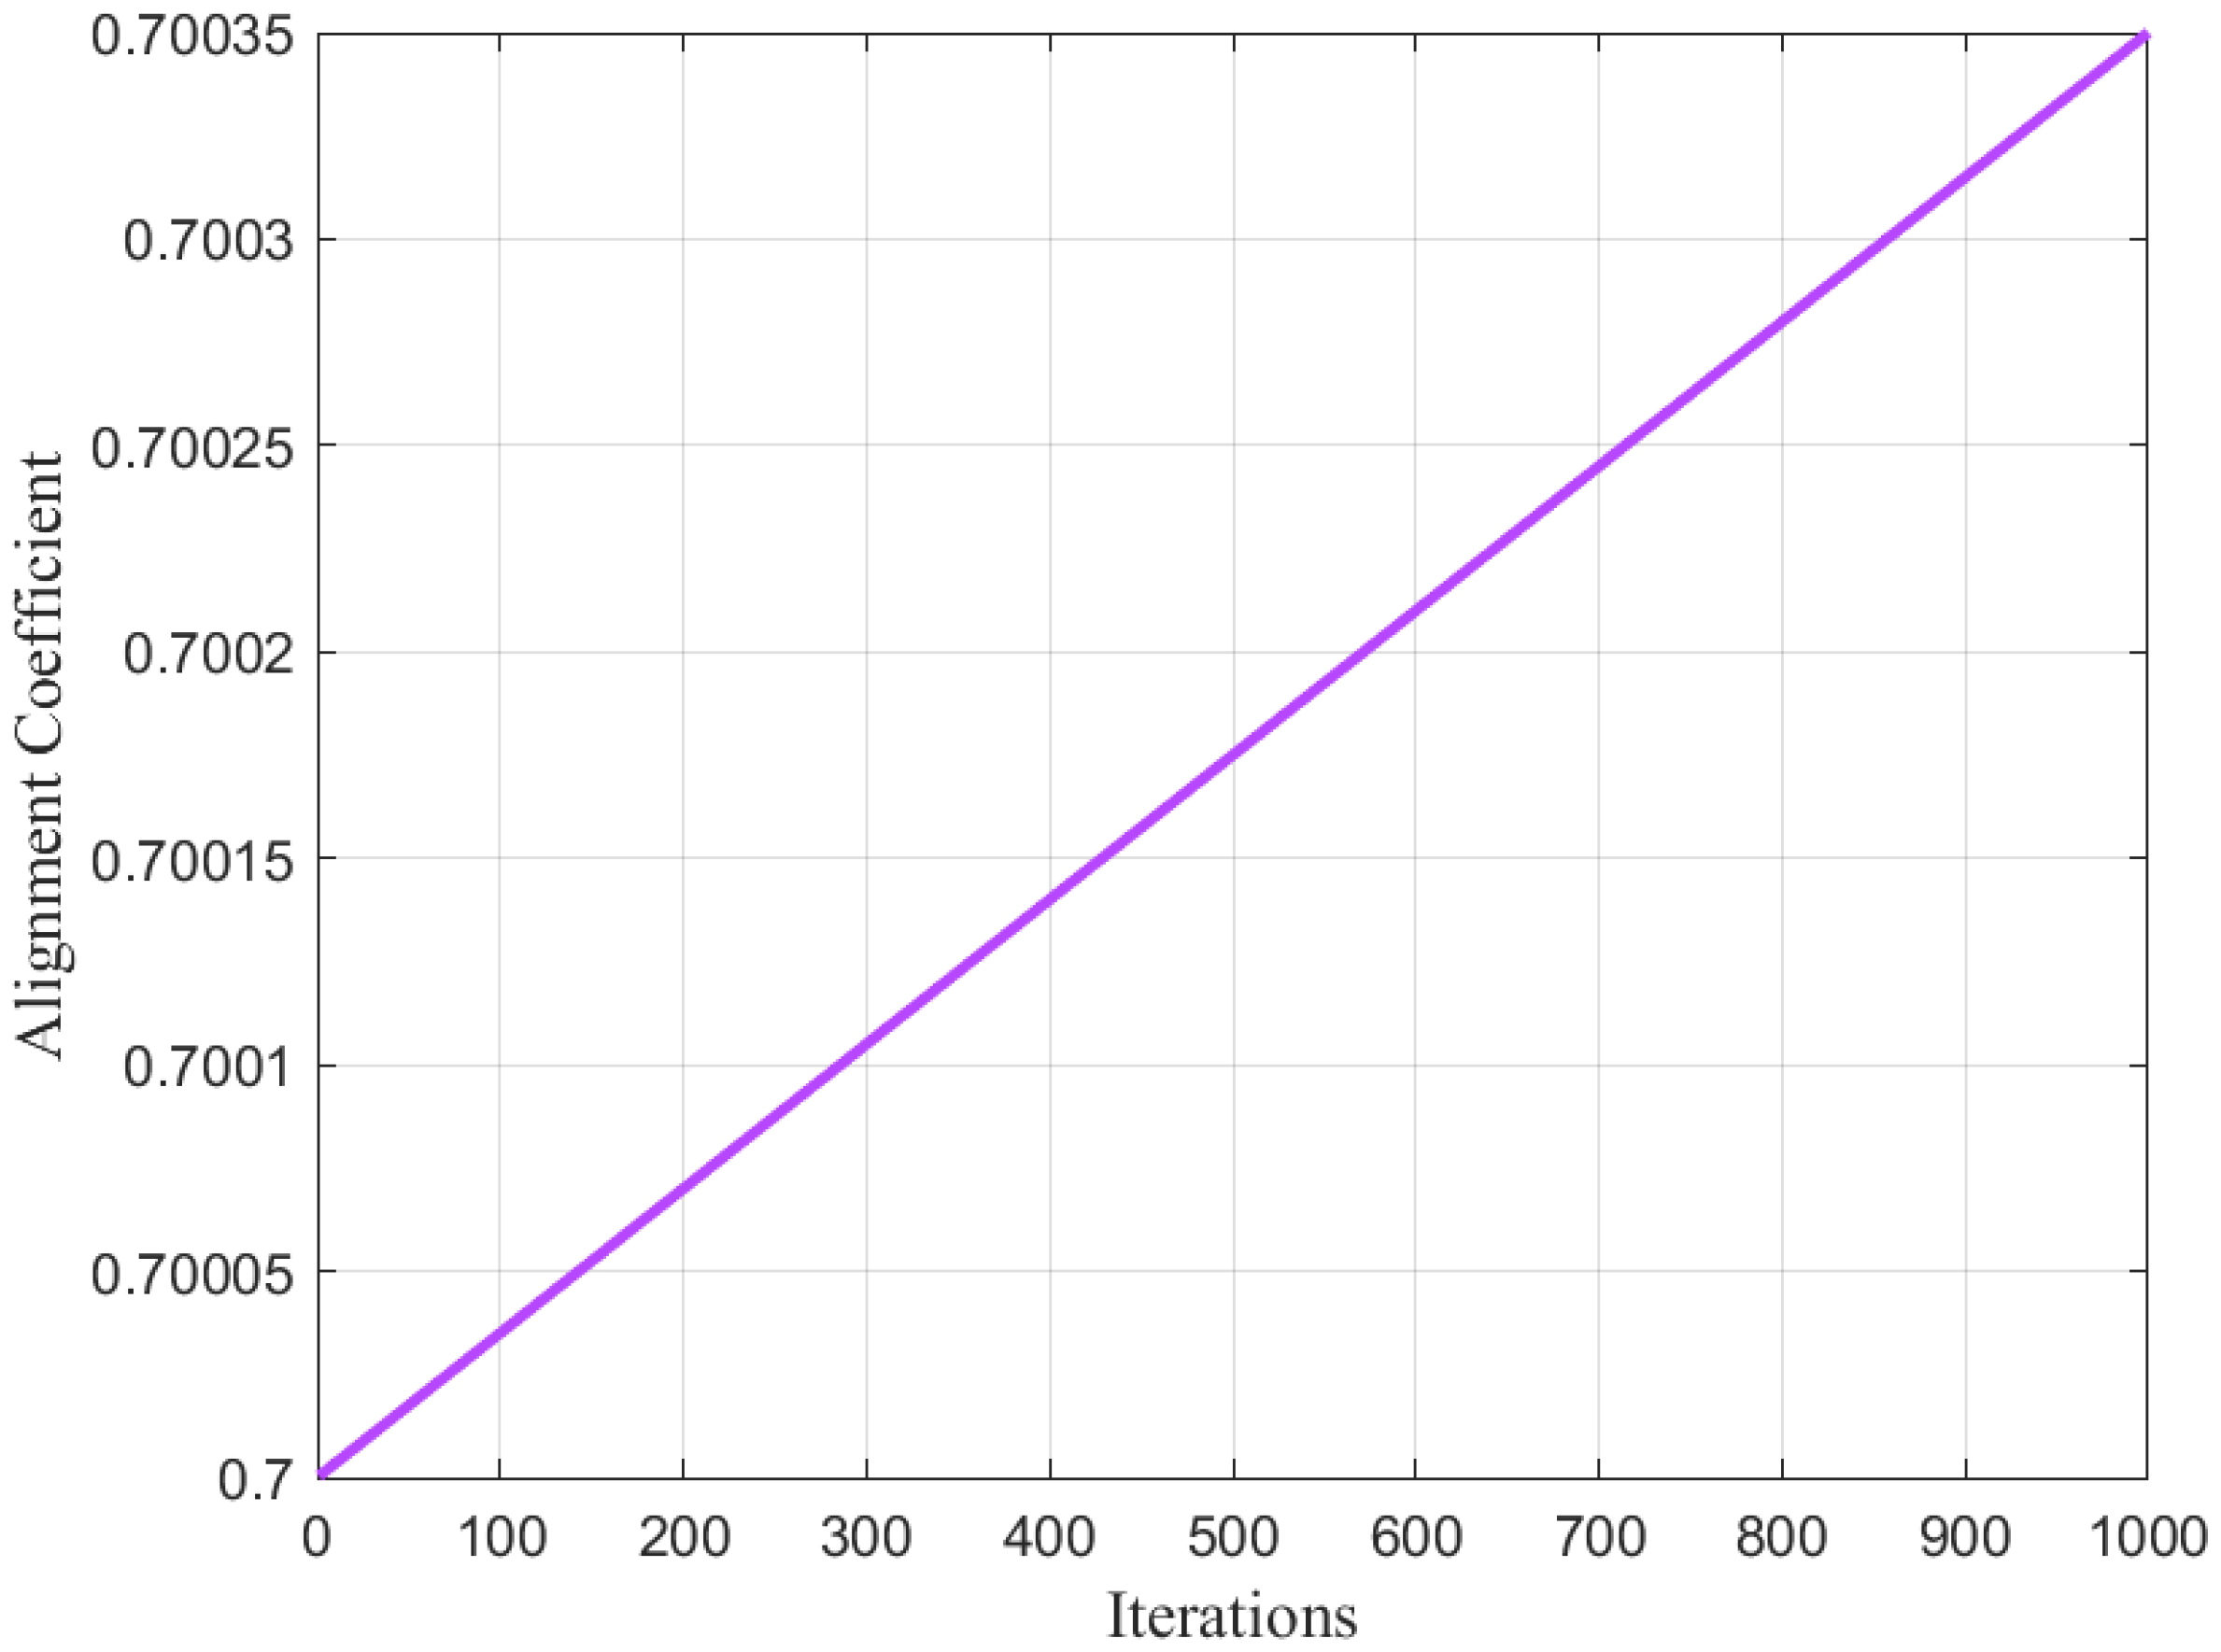
where denotes the alignment coefficient, whose value is not fixed but adaptively adjusted with the number of iterations. In this work, the initial value of is set to 0.7. As the number of iterations t increases, the algorithm gradually enhances the weight of the alignment effect, where
As can be seen from Equation (13), the alignment coefficient adopts an adaptive adjustment strategy, which enables the algorithm to possess certain global exploration capabilities in the early iterations. In the later iterations, as increases, the update direction of solutions becomes more concentrated toward the current optimal solution, thereby accelerating local fine-grained exploration and exploitation. The variation trend of is shown in Figure 4.
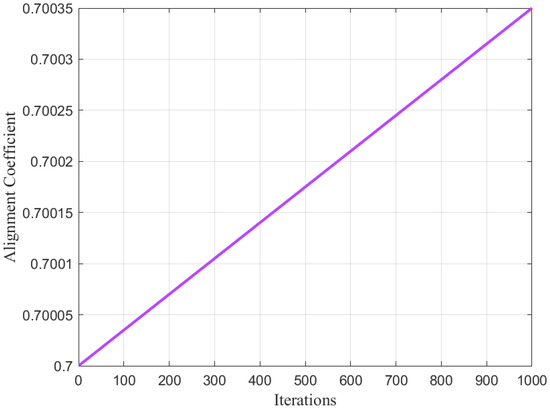
Figure 4.
Alignment coefficient when T = 1000.
Thus, the trajectory of celestial body movement can be updated using the following formula:
Figure 5 shows the overall updated trajectory of celestial body movement in a two-dimensional parameter space. It can be observed that the cosmic expansion effect enables the algorithm to conduct large-scale searches in the early iteration stage, covering the entire search space. Notably, as the number of iterations increases, the influence of cosmic expansion on celestial bodies gradually weakens, while the gravitational forces from stellar systems and the largest mass celestial body gradually strengthen, guiding the population to explore more optimal regions.
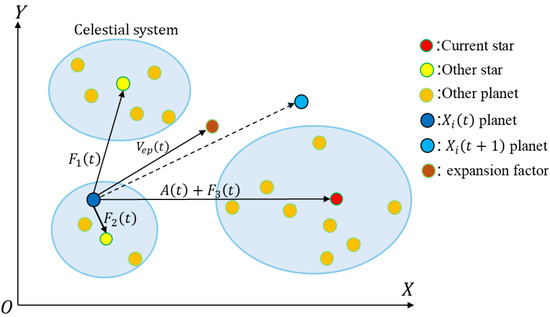
Figure 5.
Schematic diagram of celestial body movement.
2.5. Stellar System Collision Strategy
In the early stages of cosmic evolution, stellar systems are generally internally fragile and unstable, with frequent collisions and close encounters between galaxies [46]. Therefore, when two planetary systems collide or pass close to each other, gravitational perturbations may cause significant deviations in the trajectories of some celestial bodies, leading them to enter new orbital paths for revolution.
To expand the global search scope and enable solutions to continuously explore unknown regions in the search space, the algorithm simulates the above evolutionary phenomenon by introducing a global exploration strategy applicable to early iterations, also known as the stellar system collision perturbation strategy. To fully explore and utilize the potential search space, all solutions have a probability of executing the system collision strategy during the optimization process.
The following formula represents the probability of the current solution executing the system collision strategy:
where the initial collision probability is set to a fixed value of 0.2. If < , a trajectory deviation is generated for the current celestial body :
where denotes a standard normal distribution random vector and R represents the average radius of the stellar system.
During each iteration, this strategy performs omni-directional searches across the entire solution space through dynamically controlled probability and random collision mechanisms. In the initial stage, with a higher value, the algorithm favors large-scale global searches. In later stages, as decreases, the algorithm gradually shifts to local refined searches. The adaptive adjustment mechanism of achieves a smooth transition from broad exploration to local exploitation. Meanwhile, this jumping strategy uses the average stellar system radius R to calculate the jump step size, enabling dynamic changes in the exploration region of the current solution and ensuring matching between the search scope and the problem scale.
To ensure continuous algorithm convergence, the collision strategy introduces an elite retention mechanism: after jumping, the new solution is compared with the original solution ; if is better, it is accepted; otherwise, is retained. This mechanism not only preserves the elite characteristics of the population but also synchronously updates the global optimal solution .
2.6. Celestial Orbital Resonance Strategy
During the optimization process, to break through the gravitational potential well of local optimal solutions, this work proposes a cross-scale search mechanism guided by celestial orbit resonance, enabling the algorithm to conduct fine exploration toward the optimal solution.
In the early iteration stage, the universe is still in a chaotic period, and effective orbital spacing cannot be formed between celestial bodies within the system, making resonance phenomena extremely unstable. If a stable proportional relationship between orbits has not been established, gravitational forces will force changes in the current celestial orbits until stability is achieved [47]. Conversely, if the current stellar system enters a stable period, integer-ratio resonance phase-locking states are often formed between celestial orbits, resulting in minimal changes in the current celestial orbits.
Based on the above celestial mechanics phenomena, we propose a search mechanism for celestial orbit resonance applied to the algorithm, and its specific mathematical model is as follows:
where represents the trigger probability of orbital resonance, which periodically weakens with iterations to simulate the phenomenon that the celestial orbits within stellar systems tend to stabilize in the late stage of cosmic evolution. denotes the amplitude of resonance perturbation, which uses to generate tiny offsets, indirectly simulating the uncertainty of celestial orbit direction deviation after resonance occurs.
If the fitness of the current position is < after the resonance perturbation of a celestial body, it indicates that the current celestial orbit is more stable, and the trajectory equation of the celestial body’s movement is updated as follows:
This strategy introduces the theory of celestial orbital resonance into the optimization search framework, significantly improving issues such as the algorithm being trapped in local optimal solutions. Combined with Equation (16), it forms a multi-scale search architecture. The stellar system collision perturbation strategy achieves cross-potential-well migration at the scale of stellar systems from a macro perspective, while the celestial orbital resonance mechanism performs intra-system orbital fine-tuning, keeping the algorithm highly active in exploration during iterations and enabling algorithm convergence and updates.
2.7. Computational Complexity of CEO
The computational complexity of the CEO algorithm primarily depends on four factors: population initialization, fitness function evaluations and sorting, solution updates, and cosmic circle updates. Assuming N is the number of solutions, dim is the dimension of the solution space, and T is the maximum number of iterations, the computational complexity of initializing the population is , where represents the initial fitness evaluation. During the iteration process, the complexity of evaluating and sorting the fitness functions is , the complexity of updating the solutions is , and the complexity of updating the cosmic circles is . Therefore, the total computational complexity of CEO is , which simplifies to .
2.8. Pseudo-Code and Flowchart of CEO
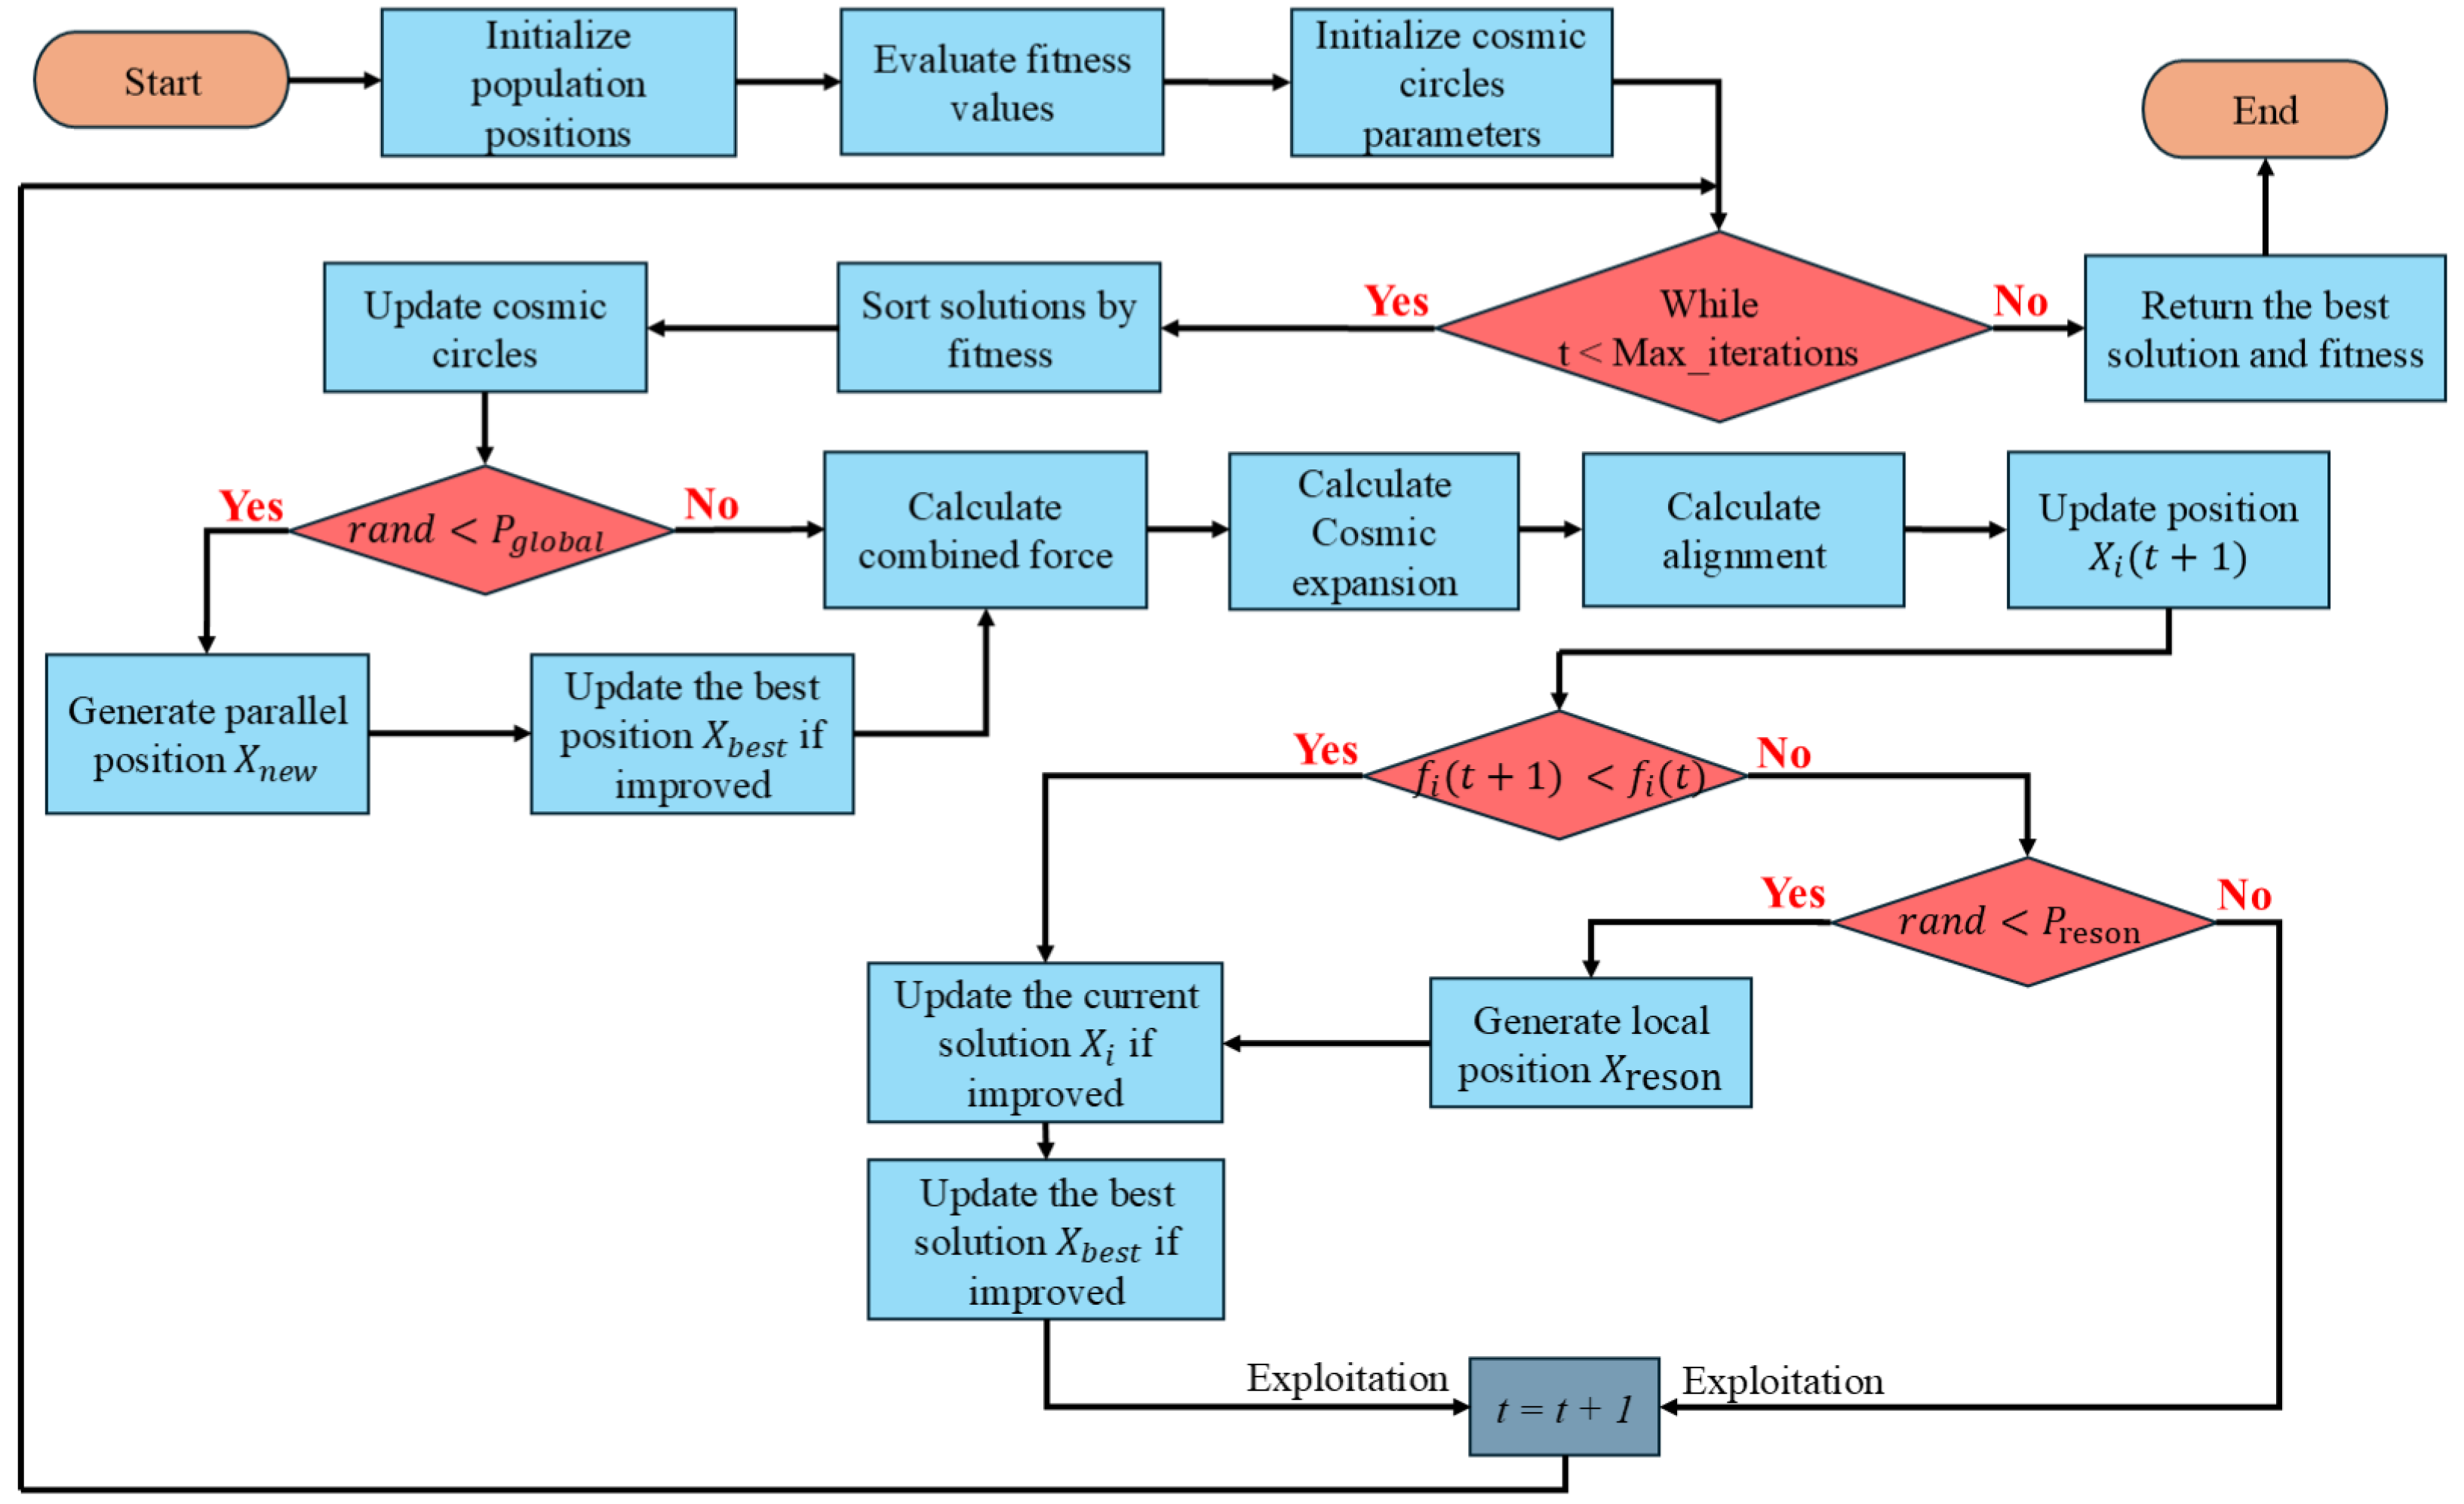
The workflow of the CEO algorithm is illustrated in Figure 6, and its pseudo-code is presented as Algorithm 1. During the initialization process, all initial candidate solutions are sorted according to fitness in sequence to generate three stellar celestial bodies. The stellar celestial bodies attract surrounding planetary celestial bodies to form a stellar celestial body system, which enters the early iteration stage.
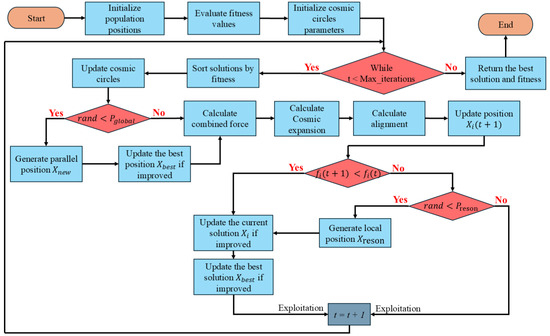
Figure 6.
Flowchart of the CEO algorithm.
At the beginning of each iteration, the stellar celestial bodies will change according to the fitness-based ranking, and the size of the stellar celestial body system will also change accordingly. At this time, phenomena such as collisions of stellar systems may occur, and this process will expand the scope of the global search of the algorithm in the solution space. If this strategy is not executed, the position coordinates of each celestial body for the next iteration will continue to be updated.
After each iteration, the algorithm may provide a strategy for solutions that have not been improved during the iteration to escape from local optima, namely the celestial orbit resonance strategy. If there is still no improvement at this point, the algorithm proceeds to the next round of iteration until the overall iteration is completed.
| Algorithm 1: Cosmic evolution optimizer (CEO) |
| Initialize population positions within search space bounds |
| Evaluate fitness values for each solution candidate |
| Initialize Stellar systems parameters: numbers & centers & radius |
| while Iteration < Maximum iterations T |
| Sort solutions by fitness |
| Update Stellar system |
| for |
| Set center to best solution |
| Calculate radius as mean distance to nearest solutions by using Equation (5) |
| end |
| for |
| if |
| Generate parallel position with cosmic noise by using Equation (16) |
| if |
| Update best fitness |
| end |
| end |
| Calculate celestial forces from all circles by using Equation (6) |
| Calculate combined force by using Equation (9) |
| Calculate Cosmic expansion by using Equation (3) |
| Calculate alignment by using Equation (12) |
| Update position by using Equation (14) |
| if |
| Update solution |
| else |
| if |
| Generate local position by using Equation (17) |
| Update solution if improved |
| end |
| end |
| end |
| end while |
| Return the best solution and its fitness |
3. Experimental Results and Analysis
In this section, the performance of the cosmic evolution optimizer (CEO) algorithm is validated via the CEC2017 test suite, CEC2020 real-world constrained optimization problems, and multiple typical engineering problems. The experimental investigation comprises five components: (1) benchmark functions and experimental configurations; (2) experiments on the CEC2017 test suite; (3) an analysis of the exploration–exploitation balance in CEO; (4) CEC2020 real-world constrained problems; and (5) two engineering application cases.
All experiments and simulation studies in this section were implemented using the MATLAB R2024a. The code was executed on a computer equipped with a 12th-generation Intel Core i5-12450H processor (2.0GHz), 16.0 GB of RAM, and the Windows 11 operating system. The specific MATLAB version employed was R2024a.
3.1. Benchmark Functions and Experimental Settings
This subsection employs the 30-dimensional, 50-dimensional, and 100-dimensional variants of the 29 benchmark functions from the CEC2017 test suite for experimental investigations. Table 1 classifies these 29 unconstrained CEC2017 benchmark problems according to their characteristics; for classification criteria and detailed specifications, refer to the corresponding literature [48].

Table 1.
Classification of CEC2017 benchmark functions.
As shown in Table 1, unimodal problems (F1 and F3) are often used to verify the exploitation capability of algorithms due to their single global optimum. In contrast, multimodal problems (F4–F10) contain numerous local optima. Premature convergence to any local optimum indicates insufficient exploration capability, making them suitable for validating an algorithm’s exploratory power. Hybrid problems (F11–F20) and composite problems (F21–F30) typically exhibit multimodality and nonlinearity, better simulating real-world search spaces. Their evaluation metrics generally reflect an algorithm’s comprehensive performance.
The CEC2017 test functions consist of 20 basic functions. Unimodal and simple multimodal functions are formed by translating and rotating nine basic functions, while hybrid and composite functions are constructed from multiple basic functions. Since exact mathematical expressions for these functions are difficult to provide, Table 2 lists the basic information and theoretical optimal values of the CEC2017 test functions. For detailed specifications, refer to Reference [48].

Table 2.
Details of the IEEE CEC2017 test suite.
These typical benchmark functions comprehensively reflect an algorithm’s potential performance. Thus, this subsection focuses on a comprehensive evaluation of CEO on CEC2017, including its testing and performance analysis.
3.2. Experiments on the CEC2017 Test Suite
3.2.1. Convergence Behavior of CEO
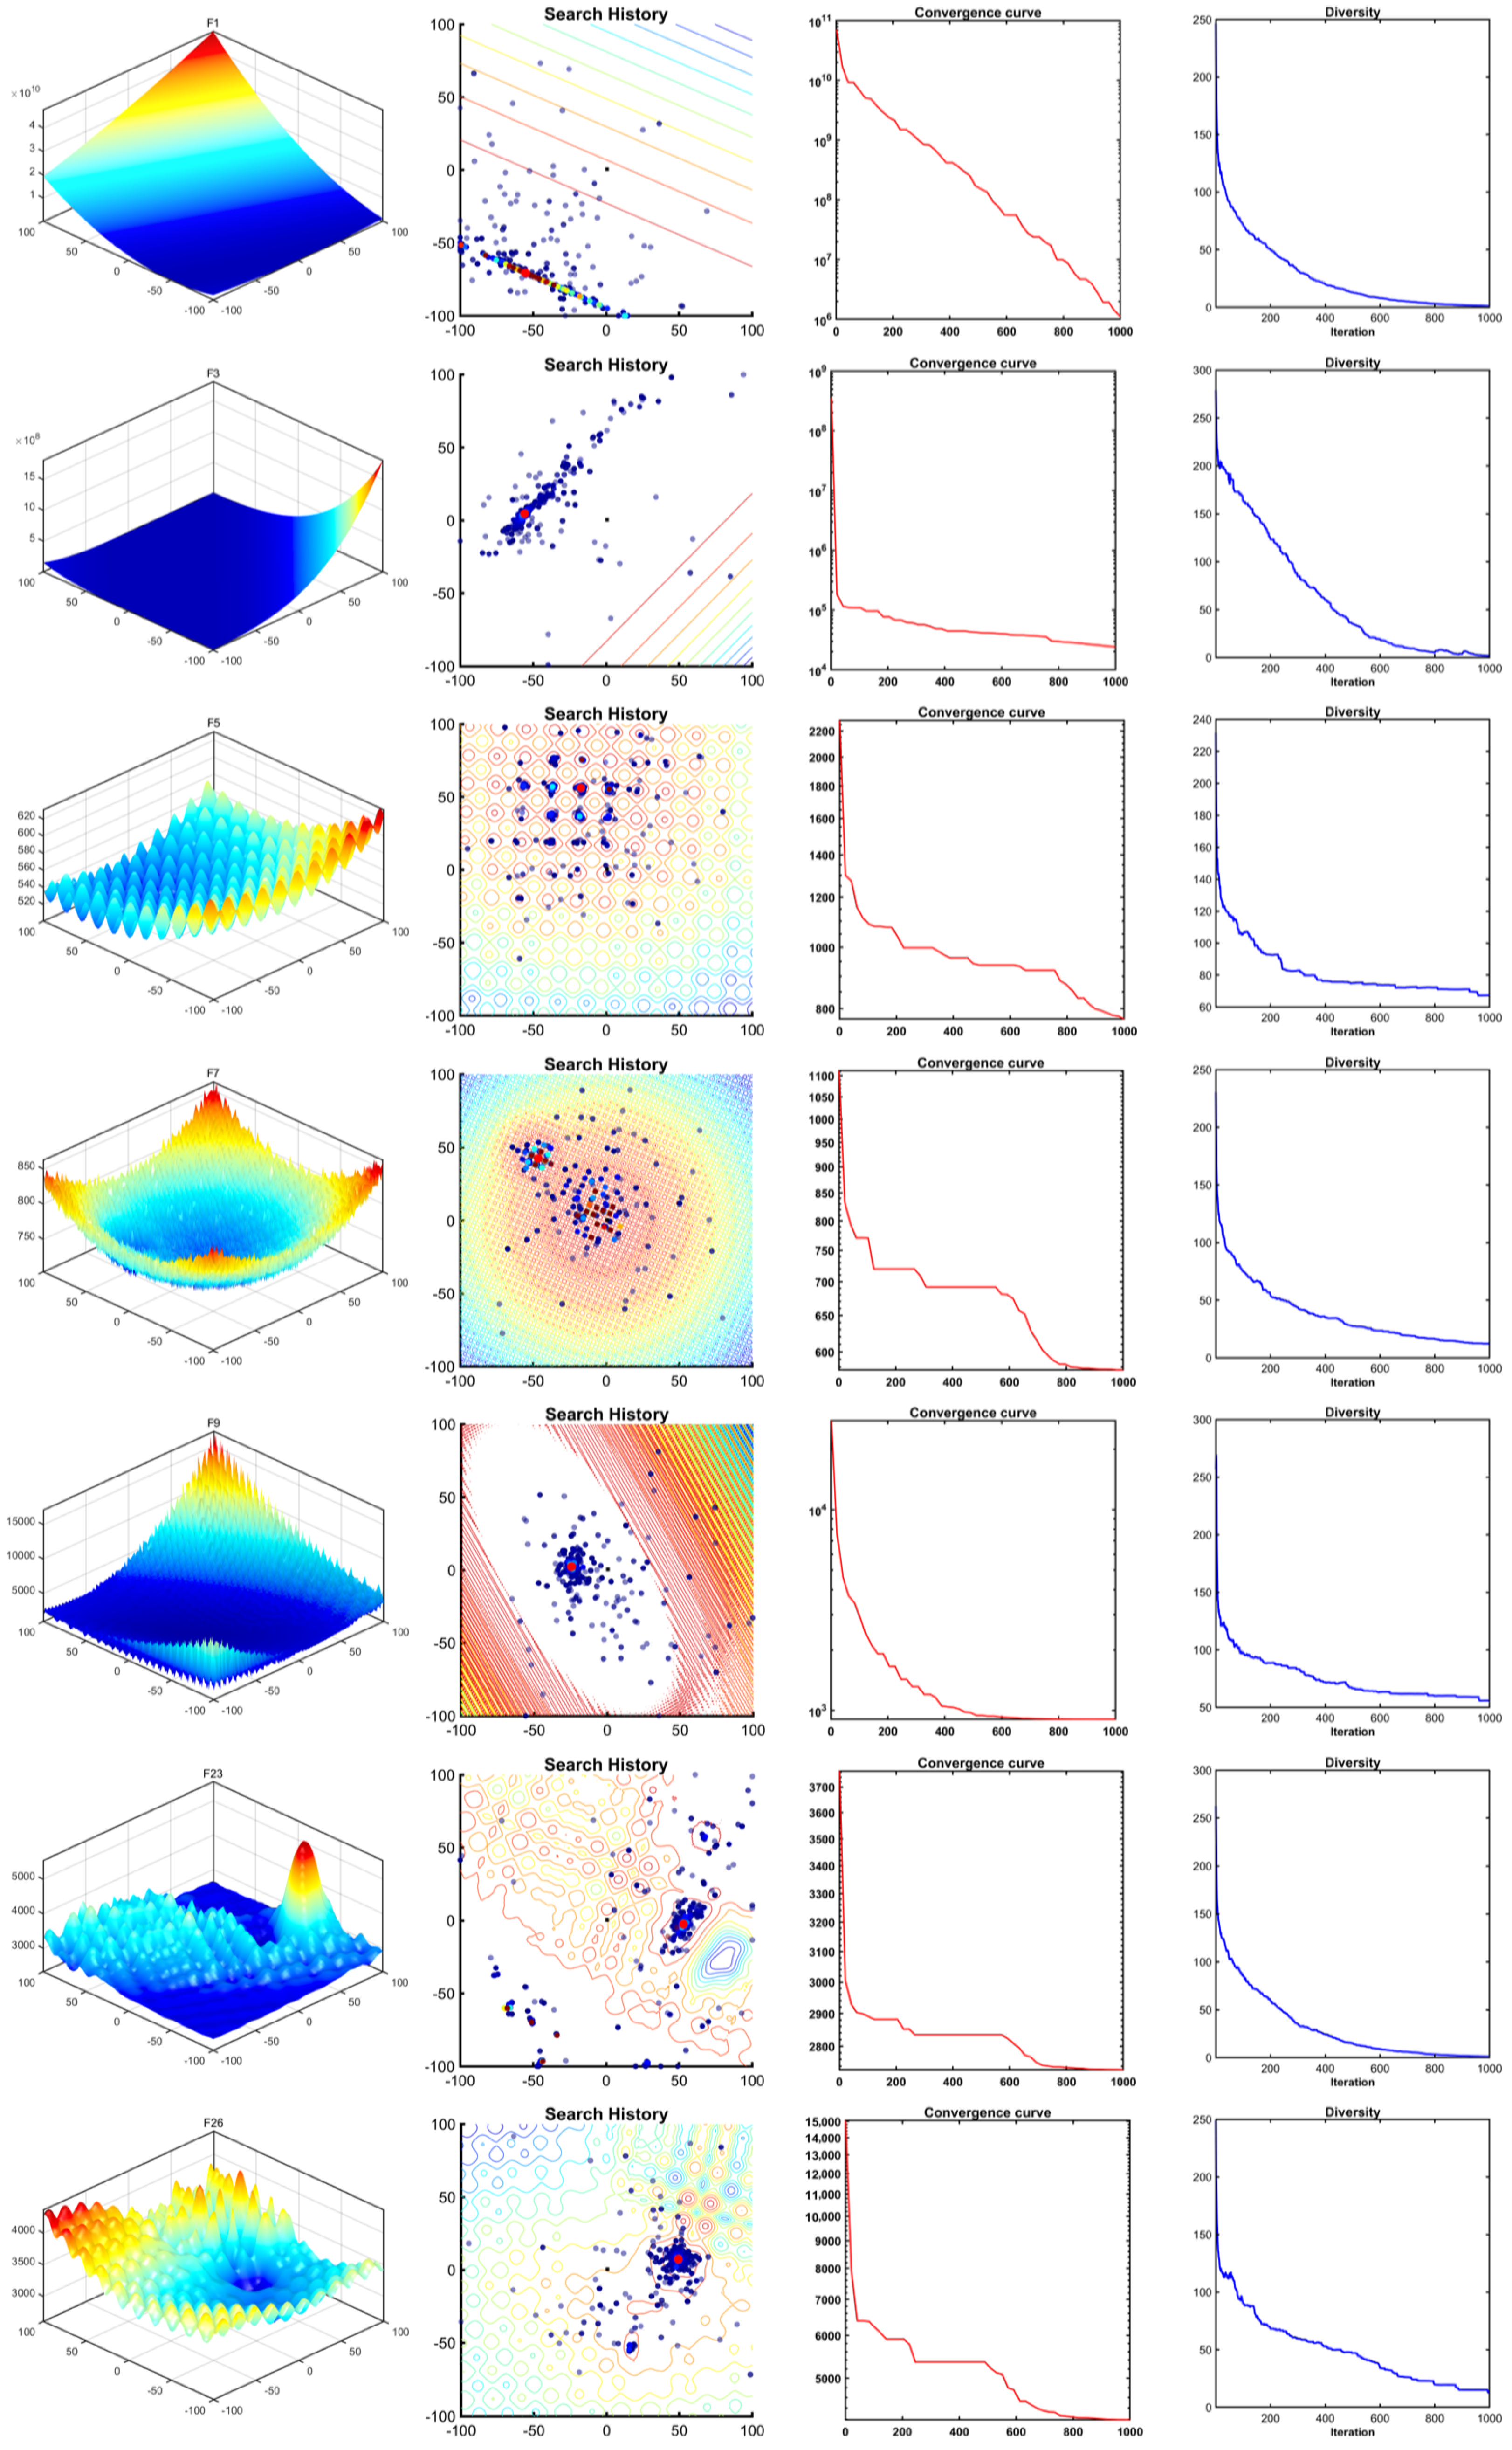
In this subsection, qualitative experimental analyses of the CEO algorithm are conducted using several benchmark functions from CEC2017, focusing on search history, convergence plots, and population diversity. The experiments set the CEO population size to 30 and use a total of 1000 iterations as the termination criterion. The results are presented in Figure 7.
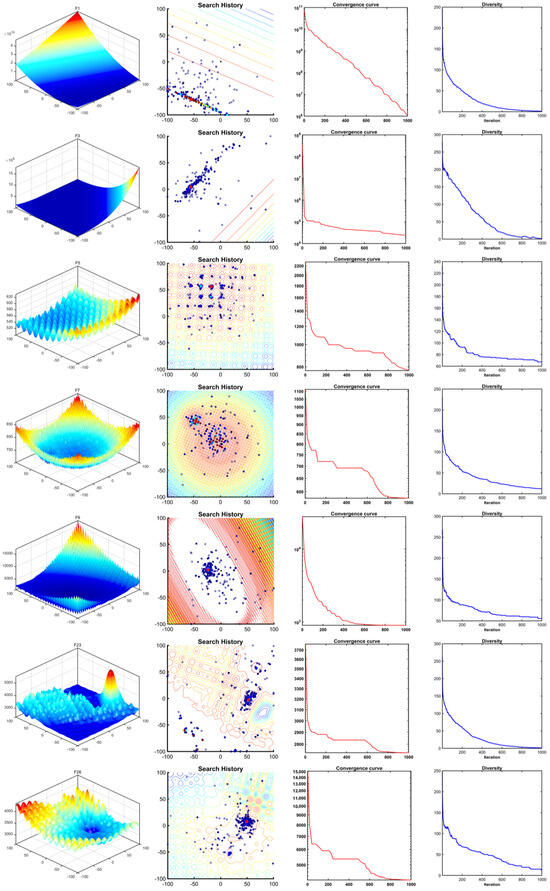
Figure 7.
Results of CEO on seven CEC2017 benchmark tests.
The first column depicts the parameter spaces of the benchmark problems, visually illustrating their structural characteristics. F1–F3 exhibit smooth landscapes, classified as unimodal problems, while F11–F30 simulate realistic solution spaces with complex multimodality.
The second column shows search history plots, intuitively reflecting the positional changes of all individuals during iterations. The plots reveal that a small number of historical best solutions are dispersed in the space, whereas most converge near the global optimum.
Then in the third column, the result records the best fitness values of the CEO algorithm after each iteration. It can be seen from the figure that for most test functions, the CEO algorithm gradually improves the quality of its solutions as the number of iterations increases. Thanks to the synergistic effect of macroscopic system interaction behaviors and the celestial orbit resonance mechanism, the CEO algorithm can escape from the local-optimum trap after being stagnant for a while and then search for the global optimum again.
The last column records the change in population diversity during the optimization process. It can be seen that as the optimization problem iterates, the growth population slowly decreases, indicating that the CEO algorithm can quickly locate the general position of the global optimal solution, with all populations gathering near the optimal solution and conducting in-depth exploitation around it.
In summary, CEO demonstrates the following characteristics: (1) Early-stage Parallel Exploration: Multiple search agents independently explore distinct celestial systems, enabling rapid approximation of the global optimum. (2) Adaptive Search Dynamics: Random position adjustments throughout optimization maintain global exploration capabilities and prevent entrapment in local optima. (3) Dual-strategy Balance: The algorithm’s dual perturbation strategies ensure continuous exploration of unexplored regions in early iterations and prevent premature convergence in late stages, achieving a robust balance between exploration and exploitation.
3.2.2. Comparison and Analysis with State-of-the-Art Algorithms
To further validate the optimization performance of CEO and demonstrate its novelty and superiority, this subsection compares CEO with ten state-of-the-art algorithms using the 30-dimensional, 50-dimensional, and 100-dimensional CEC2017 test suites. The compared algorithms include NRBO [49], ETO [50], EVO, DBO [51], RIME, GJO [52], SOA [53], WOA, SCA [54], and MFO [55]. Detailed information on the specific names of the compared algorithms and their key parameters is provided in Table 3.

Table 3.
Parameter settings of compared algorithms.
All algorithms were configured with identical fundamental parameters: a search agent population size of N = 50, solution space dimensions of , and a maximum of 1000 iterations. Each algorithm was independently executed 30 times to ensure the reliability of results. The mean (average) and standard deviation were employed to evaluate optimization performance and are defined as follows:
where the mean value reflects the algorithm’s convergence accuracy, while the standard deviation indicates its stability. i denotes the iteration index. N is the total number of runs, and represents the global optimal solution obtained in the i-th run.
The simulation results of the 11 algorithms are summarized in Table 4, Table 5 and Table 6. Based on the mean and standard deviation, the following conclusions were drawn:

Table 4.
Results of CEO and compared algorithms on the CEC2017 30-dimensional benchmark functions.

Table 5.
Results of CEO and compared algorithms on the CEC2017 50-dimensional benchmark functions.

Table 6.
Results of CEO and compared algorithms on the CEC2017 100-dimensional benchmark functions.
For the unimodal problems and , when the problem dimension was 30, the CEO algorithm outperformed all competing algorithms except RIME, and the quality of its optimal solution was significantly improved compared with other algorithms, while algorithms such as SCA and NRBO could not directly find the global optimum. In the case of 50 and 100 dimensions, CEO outperformed all algorithms on the F1 function and showed a clear lead. Although its performance on the F3 function was similar to that of other algorithms, it proved that the performance of the CEO algorithm did not deteriorate with the increase in dimension but remained stable.
For the simple multimodal problems , in the tested 30-dimensional, 50-dimensional, and 100-dimensional problems, CEO surpassed all other compared algorithms under the F4–F9 functions and obtained the average optimal solution. Among them, in the 30-dimensional and 50-dimensional cases, CEO’s performance on the F10 function was second only to RIME, while in the 100-dimensional case, CEO’s performance exceeded RIME and led all algorithms. It can be seen that in high-dimensional cases, the standard deviation of CEO for the F10 function was even significantly improved.
For the mixed problems , in the 30-dimensional case, CEO surpassed WOA, SOA, ETO, RIME, SCA, MFO, NRBO, GJO, EVO, and DBO on 10, 10, 10, 7, 10, 10, 10, 10, 10, and 10 problems, respectively. In the 50-dimensional case, CEO surpassed the same algorithms on 10, 10, 10, 7, 10, 10, 10, 10, 10, and 10 problems. In the 100-dimensional case, CEO surpassed these algorithms on 10, 10, 10, 8, 10, 10, 10, 10, 10, and 10 problems, respectively. CEO performed better in handling high-dimensional hybrid problems than in low-dimensional ones, demonstrating adaptability to hybrid problem processing across all dimensions.
For the combination problems , in the 30-dimensional, 50-dimensional, and 100-dimensional cases, CEO surpassed WOA, SOA, ETO, RIME, SCA, MFO, NRBO, GJO, EVO, and DBO on 10, 10, 10, 9, 10, 10, 10, 10, 10, and 10 problems, respectively.
Based on the above data, we performed the Friedman test [56] on these eleven algorithms, and the specific ranking results are shown in Table 7. It can be seen from the table that the proposed CEO algorithm performed exceptionally well, achieving a comprehensive rank of 1.2333 on 30-dimensional functions, 1.24318 on 50-dimensional functions, and 1.36667 on 100-dimensional functions. Notably, as the dimension of the solution space increased, CEO demonstrated superior optimization performance, making it more suitable for solving high-dimensional problems.

Table 7.
Friedman test ranks of CEO and other algorithms on CEC2017.
To comprehensively evaluate the performance of the CEO algorithm from a statistical perspective, we employed the non-parametric Wilcoxon rank-sum test [56] with a significance level set at 0.05, conducting validation experiments on CEC2017 benchmark functions. This test aims to measure the performance differences between CEO and other comparative algorithms across different dimensions. For intuitive presentation, we use a “+/=/-” notation system: “+” indicates CEO significantly outperforms other algorithms (p-value < 0.05); “=” denotes no significant difference (p-value = 0.05), and “-” signifies that CEO does not significantly outperform other algorithms (p-value > 0.05). The specific results are shown in Table 8.

Table 8.
Wilcoxon rank-sum test results.
Statistical results reveal that CEO achieved 257 significant wins and only 33 non-significant outcomes in 30-dimensional problems, yielding a win rate of 88.6%. In more challenging 50D and 100D tests, the significant win rates remained high at 85.1% (247/290) and 81.7% (237/290), demonstrating strong dimensional adaptability and algorithmic robustness. Notably, CEO excelled in comparisons with mainstream algorithms such as EVO, GJO, RIME, and WOA, achieving over 25 significant wins (with a superiority rate exceeding 86%) in both 30D and 50D. This highlights the synergistic optimization of its global search capability and convergence speed. When facing algorithms with more complex structures or dynamic mechanisms, such as NRBO, SOA, and SCA, CEO still secured over 20 statistical wins, verifying its strong adaptability and competitiveness.
In summary, the Wilcoxon test statistically confirms the stability and superiority of the CEO algorithm in solving CEC2017 multi-dimensional complex optimization problems, providing robust support for its practical application promotion.
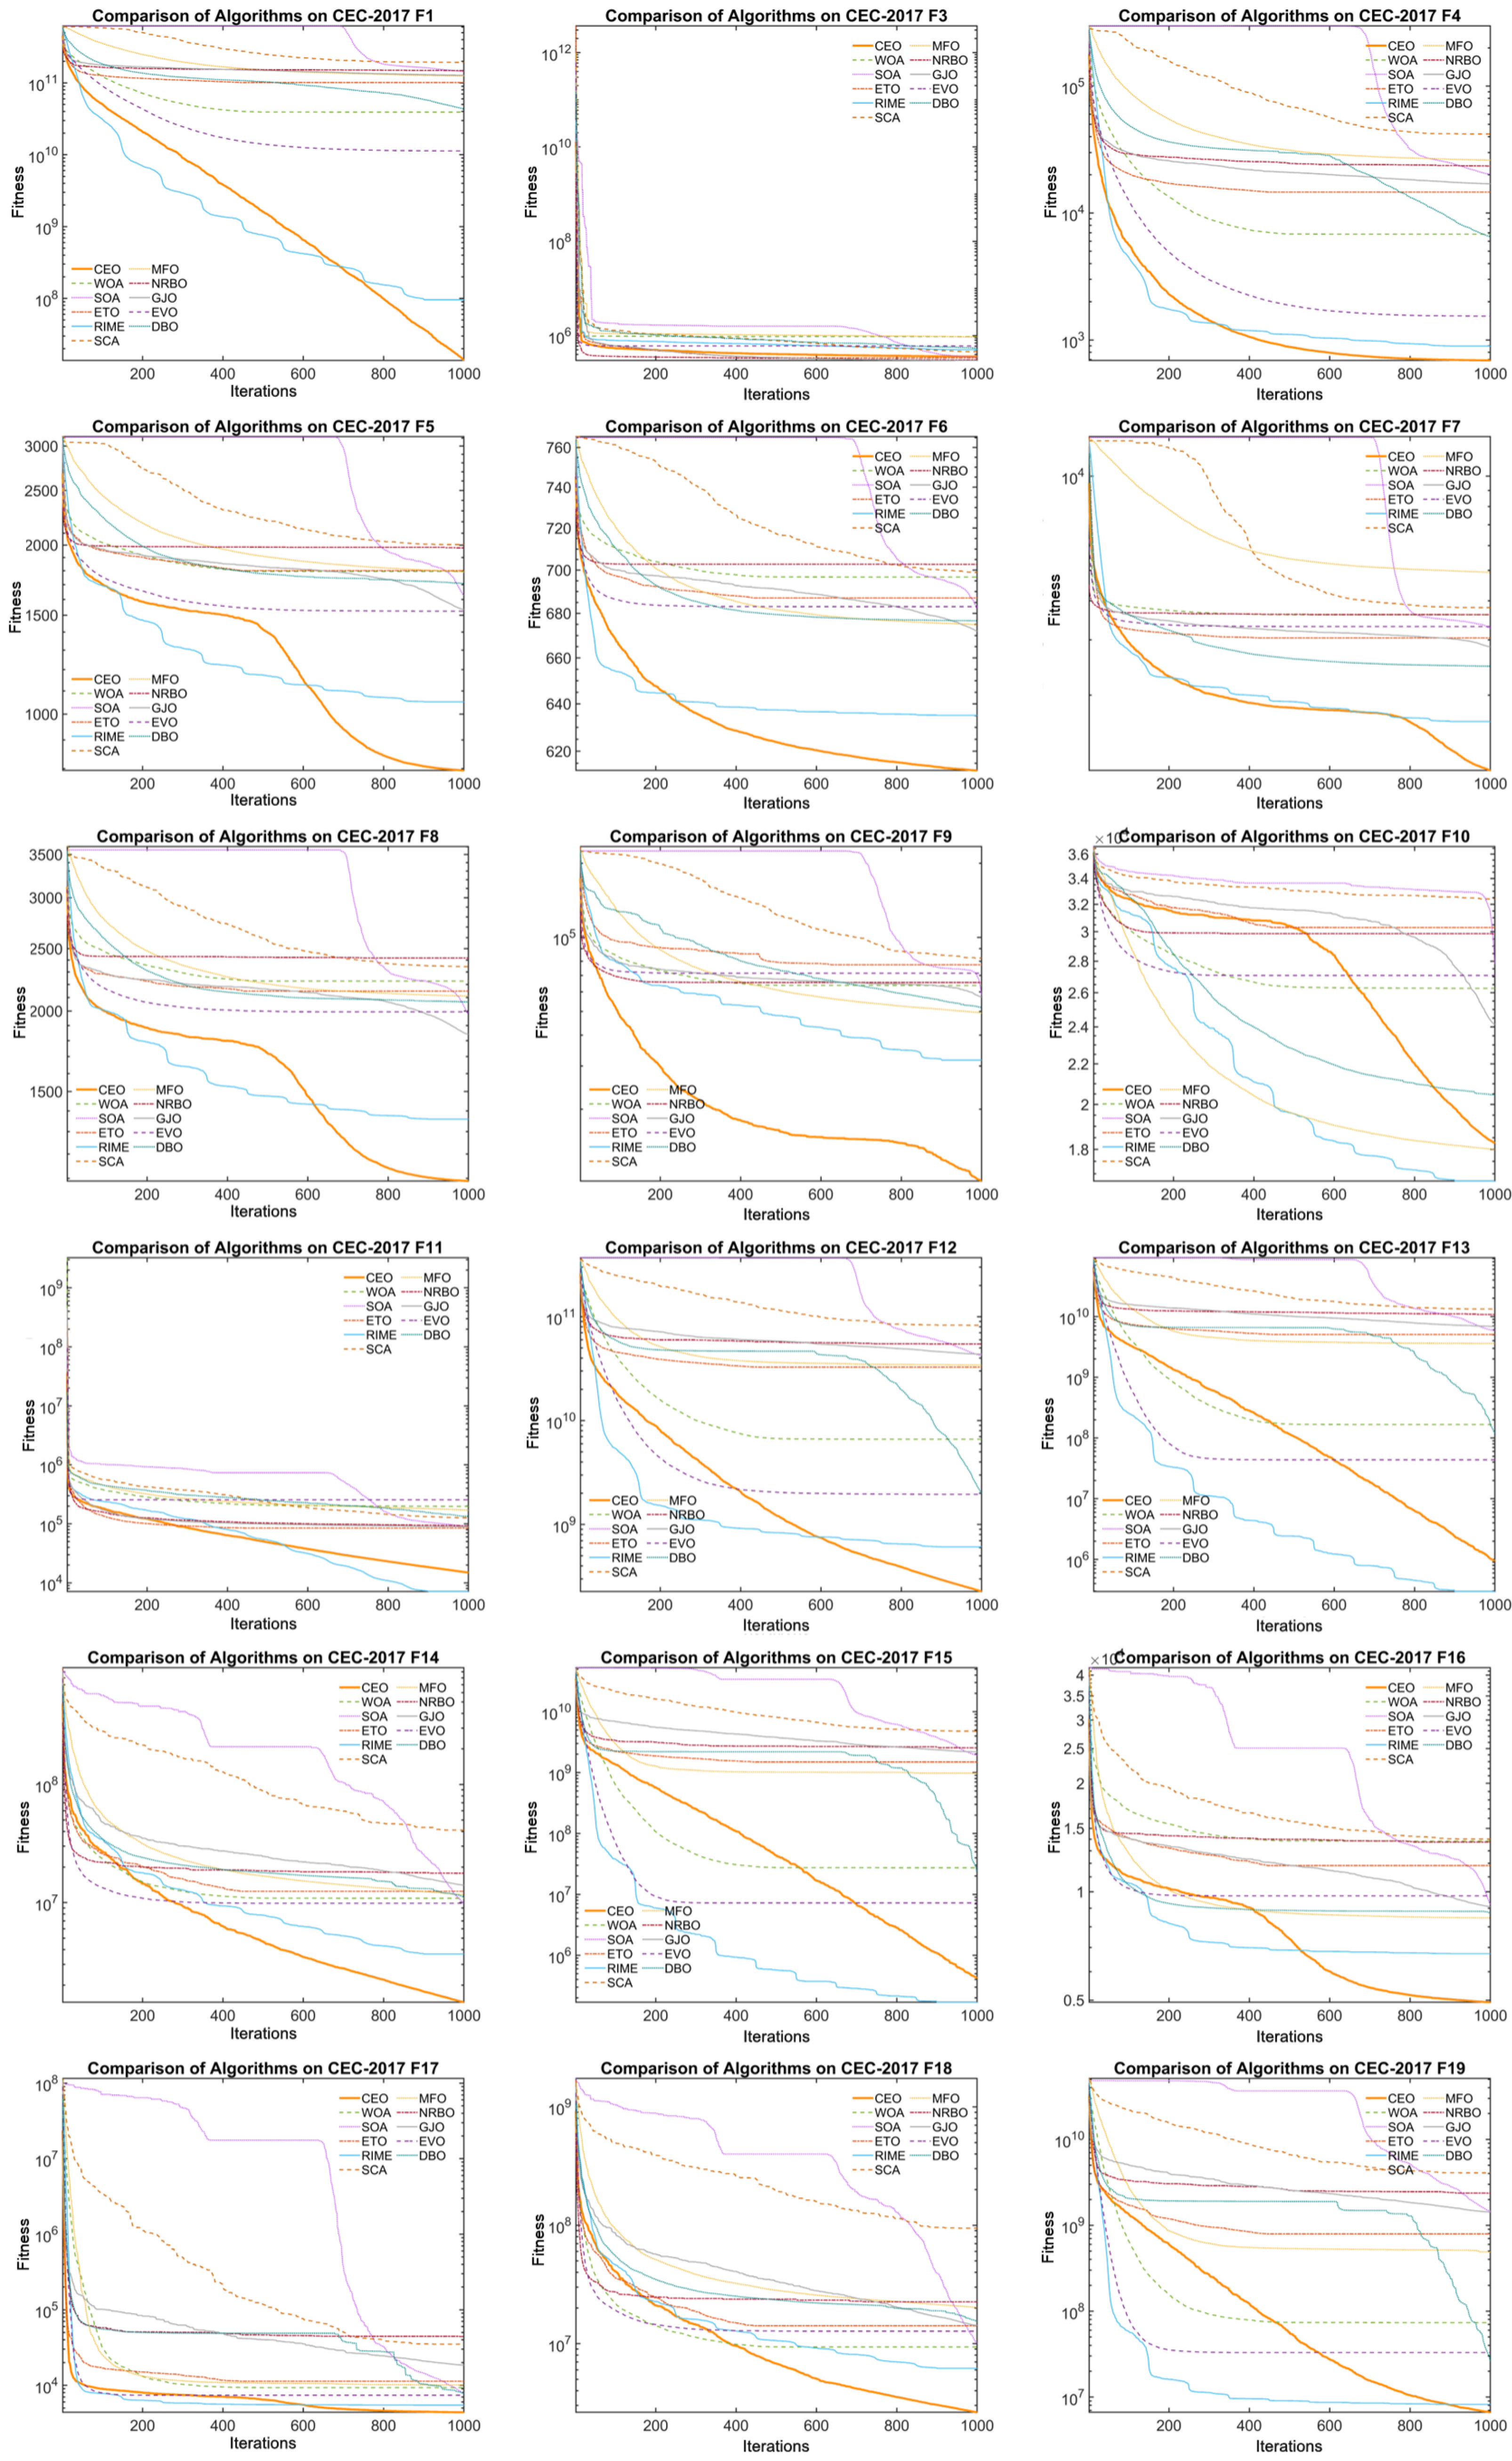
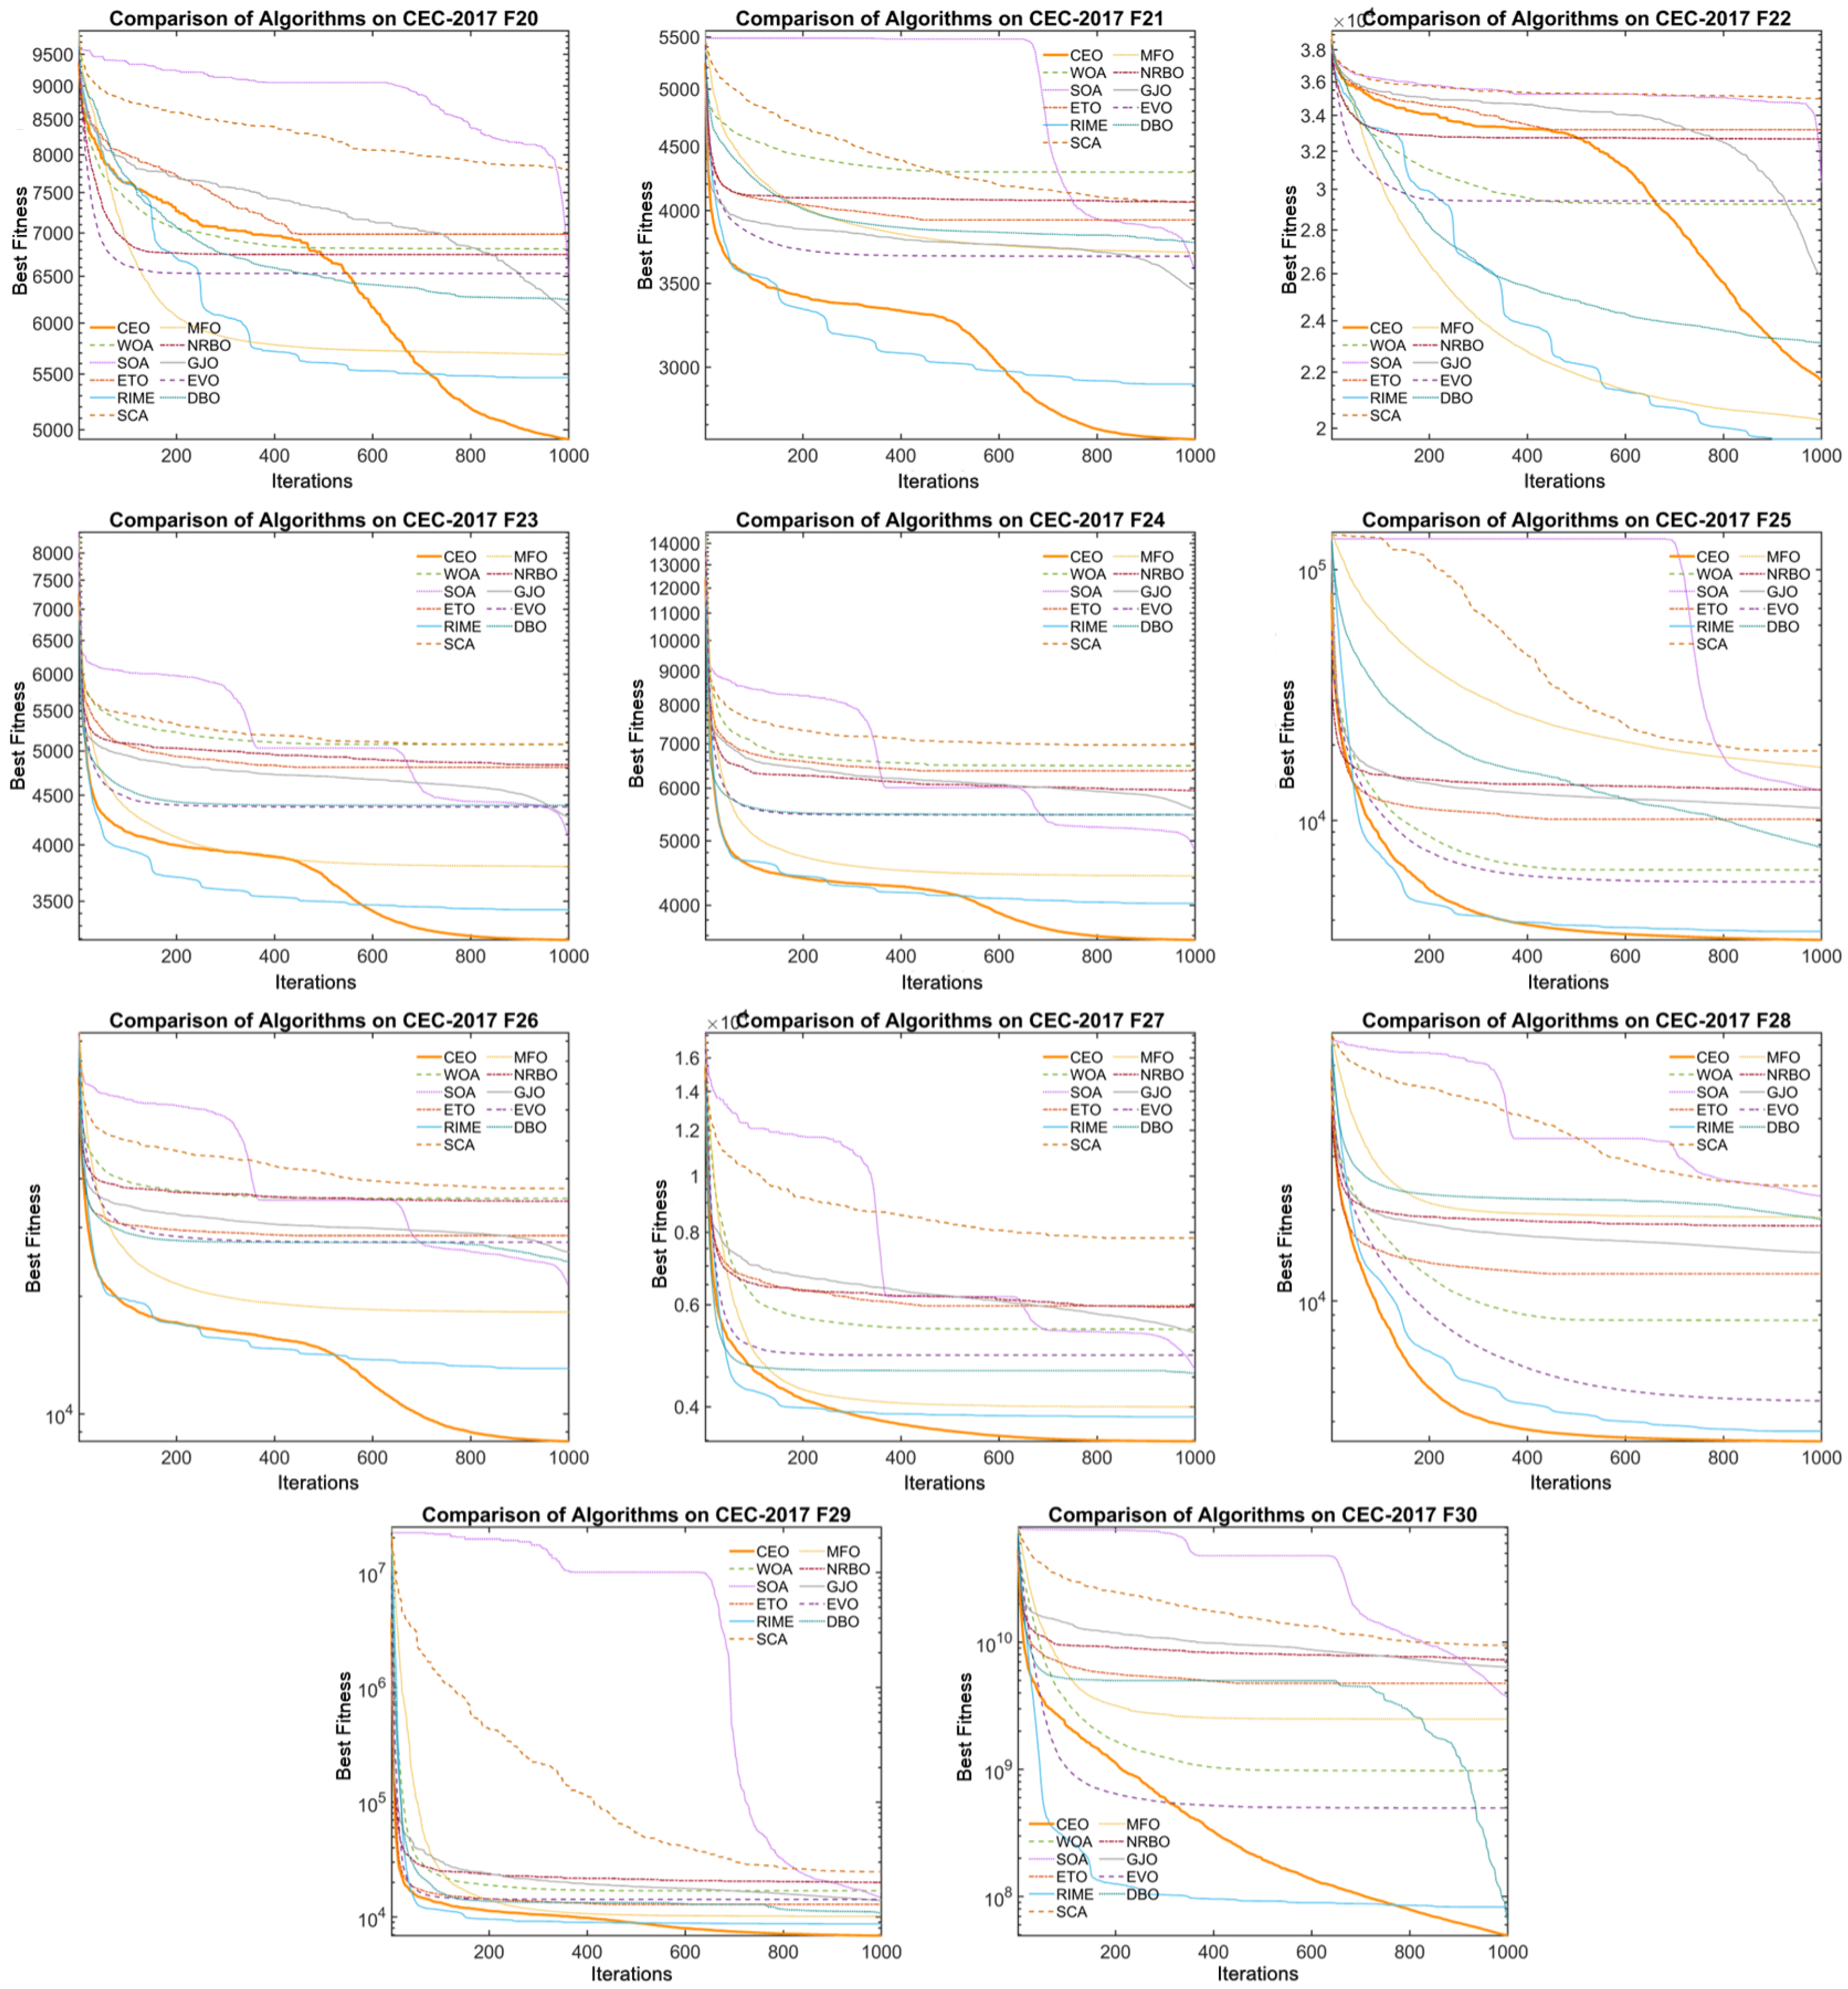
Additionally, Figure 8 and Figure 9 illustrate the convergence curves of CEO and other algorithms on 100-dimensional CEC2017 benchmark functions. From the figure, it can be observed that CEO’s convergence speed far exceeds that of other algorithms on most functions, rapidly converging to the optimal value. Additionally, the plot reveals that CEO exhibits strong global search capability in the early stages of iteration, with the convergence curve dropping sharply. In the mid-to-late stages of iteration, CEO demonstrates excellent local exploitation capability, with the convergence curve declining gradually, thereby avoiding premature convergence.
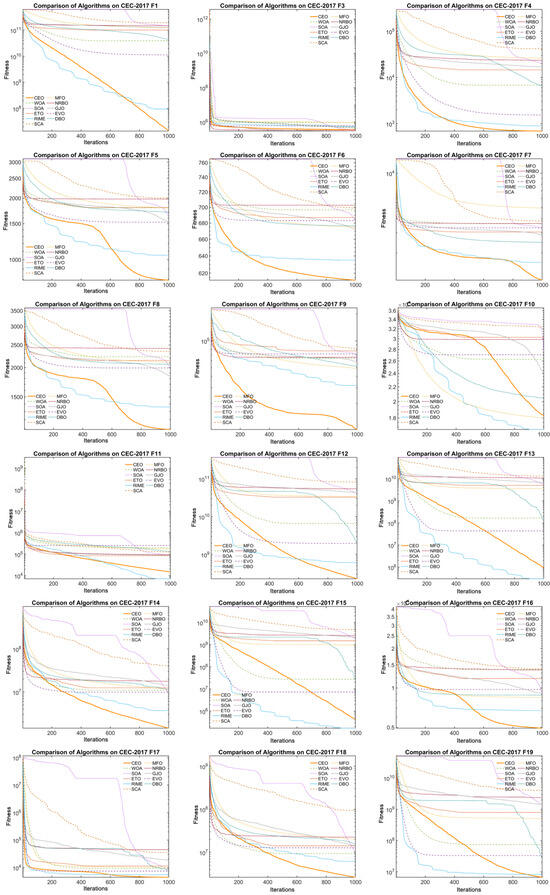
Figure 8.
Convergence plots of CEO and other algorithms on CEC2017(F1–F19).
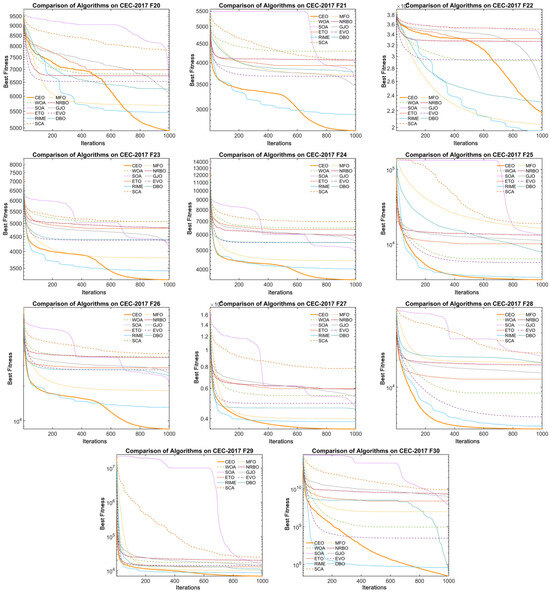
Figure 9.
Convergence plots of CEO and other algorithms on CEC2017(F20–F30).
3.3. Analysis of Exploration and Exploitation in CEO
In this section, a visual analysis of exploration and exploitation in CEO is conducted using the CEC2017 unconstrained benchmark tests (100 dimensions). Although the experiments in Section 3.2 evaluated CEO using metrics such as the standard deviation and mean, they did not clarify the trends in exploration and exploitation performance during optimization. Therefore, this subsection elaborates on the relationship between exploration and exploitation in the CEO algorithm to explain the reasons behind its excellent performance.
Hussian et al. (2018) proposed a method [57] to measure and analyze the exploitation and exploration performance of metaheuristic algorithms, which use mathematical representations of dimensional diversity. The formulas are as follows
where denotes the median value of the j-th dimension.
The formulas for calculating the exploration percentage and exploitation percentage are summarized as
where represents the maximum dimensional diversity, while and denote the exploration percentage and exploitation percentage, respectively.
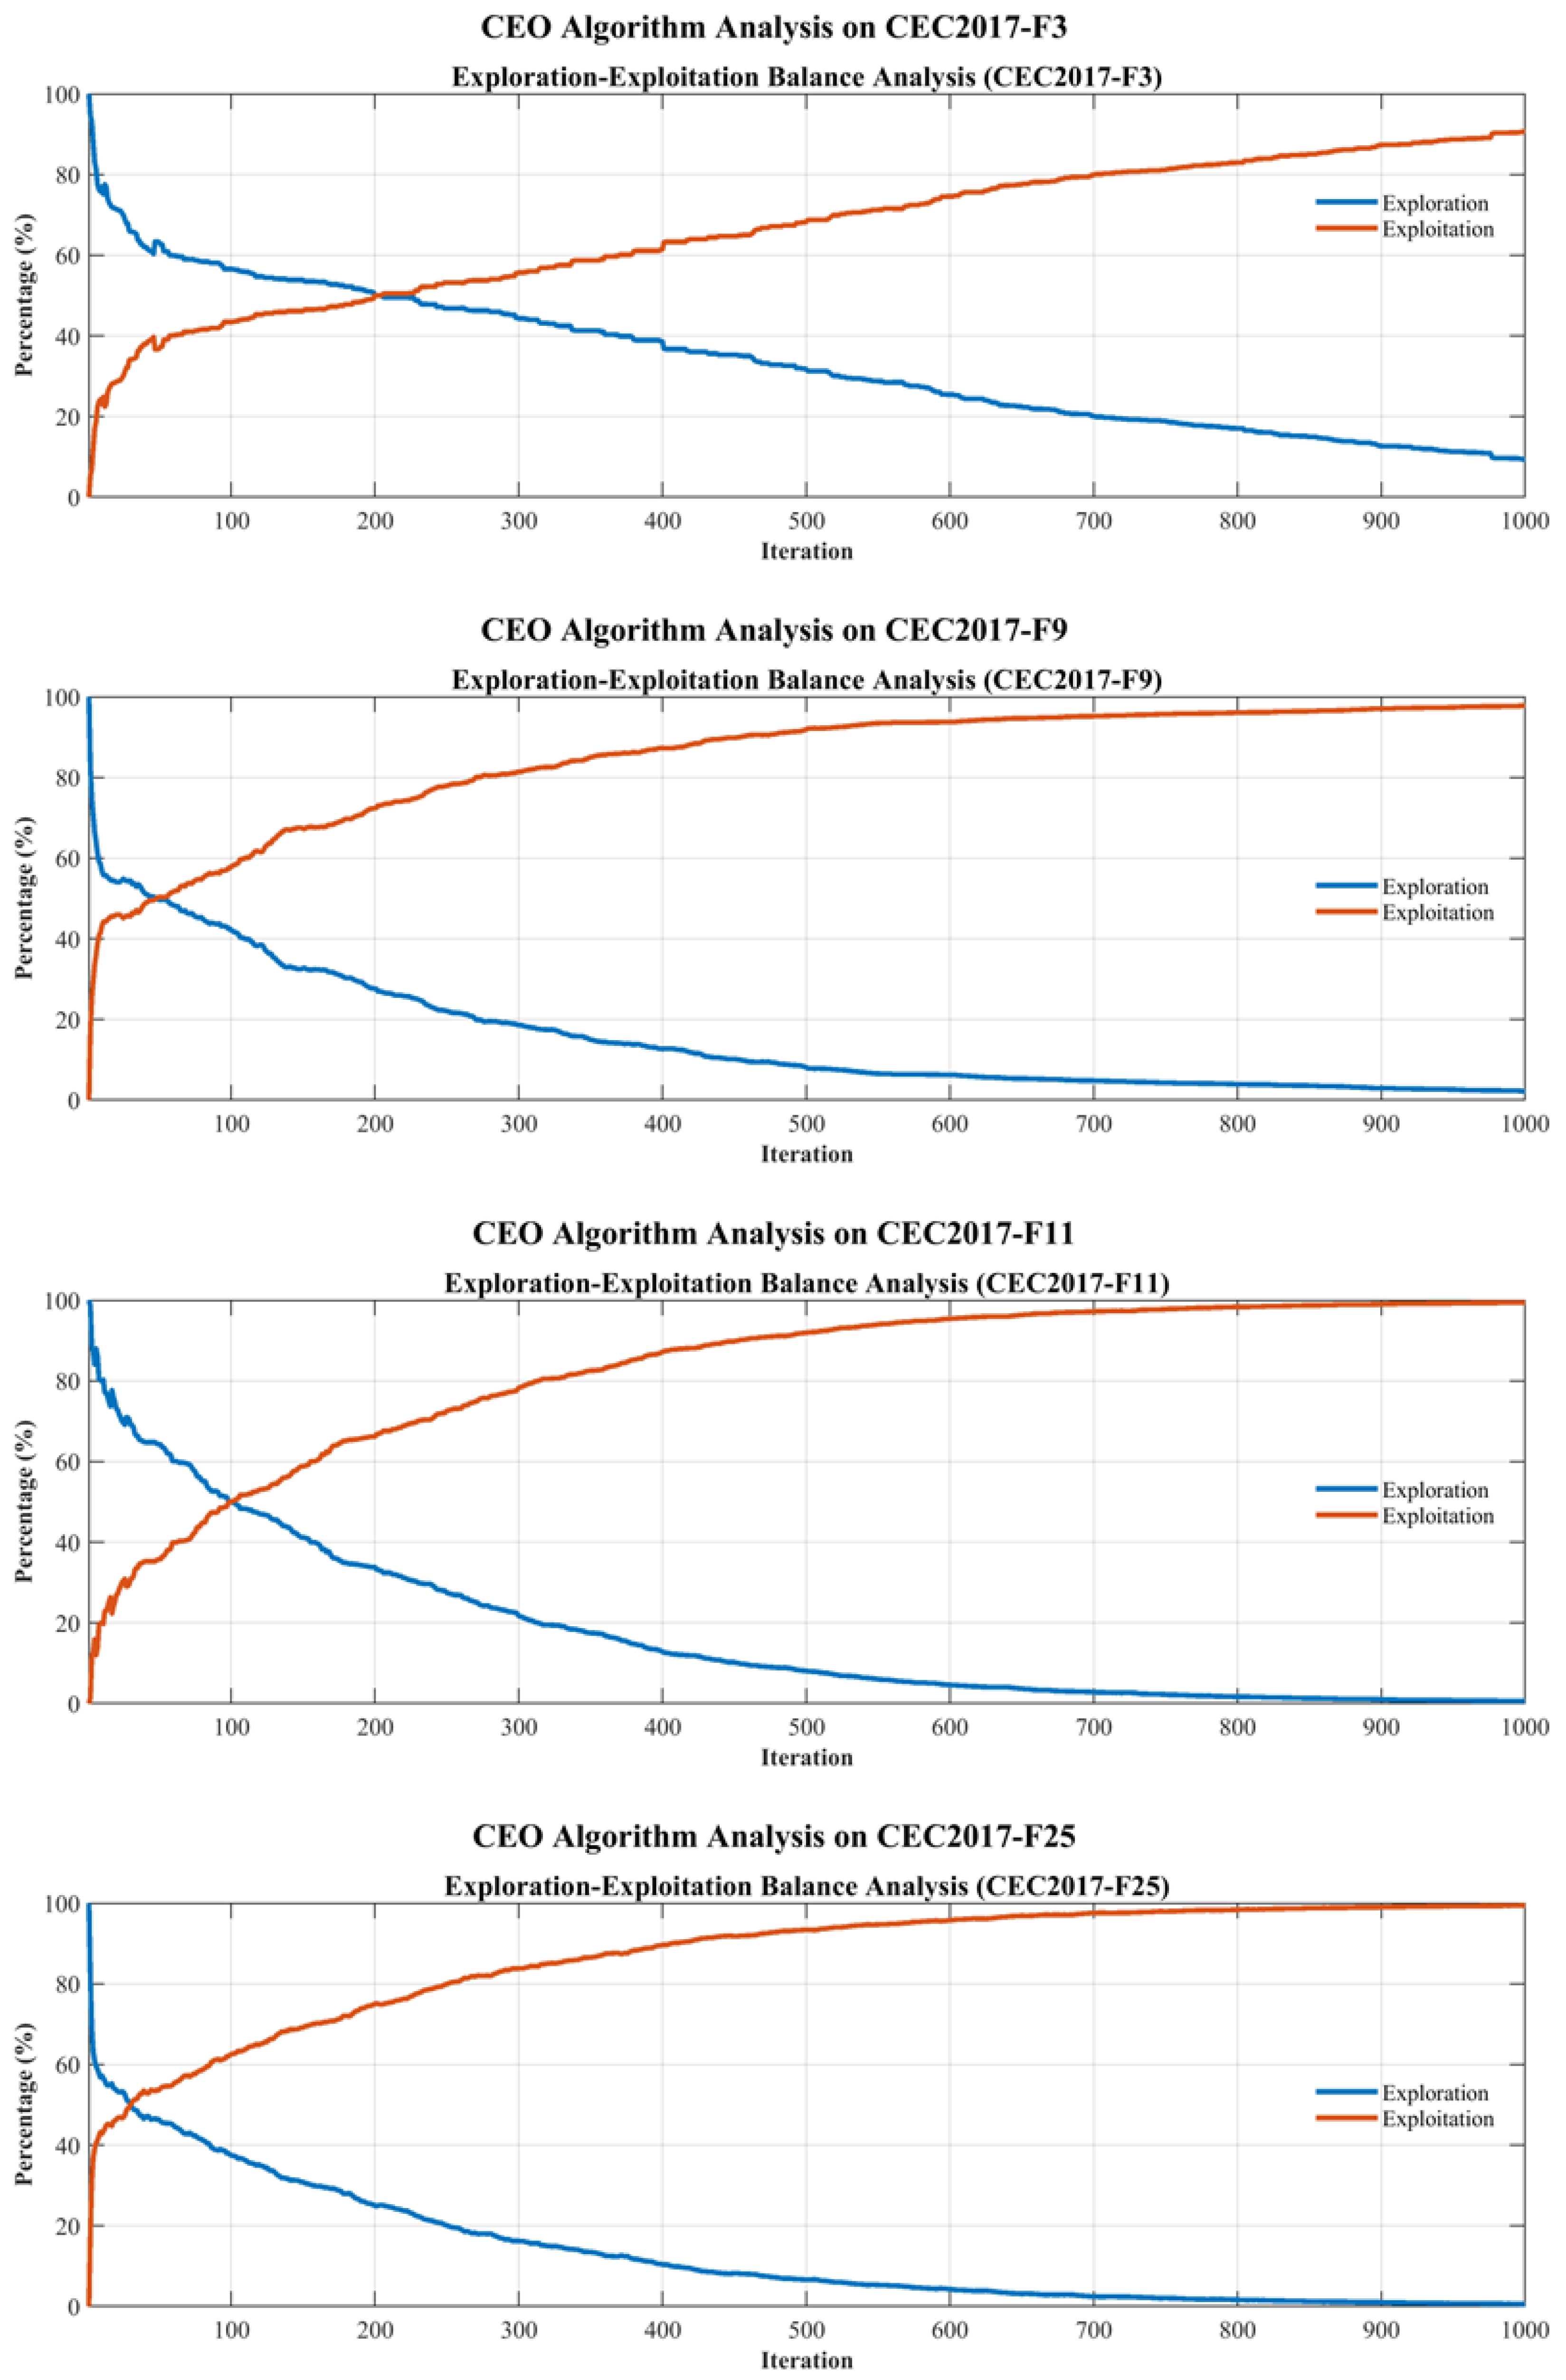
As clearly illustrated in the curves of CEC2017-F3, F9, F11, and F25 in Figure 10, the CEO algorithm demonstrates differentiated dynamic switching patterns between exploration and exploitation across iterative processes for distinct functions.
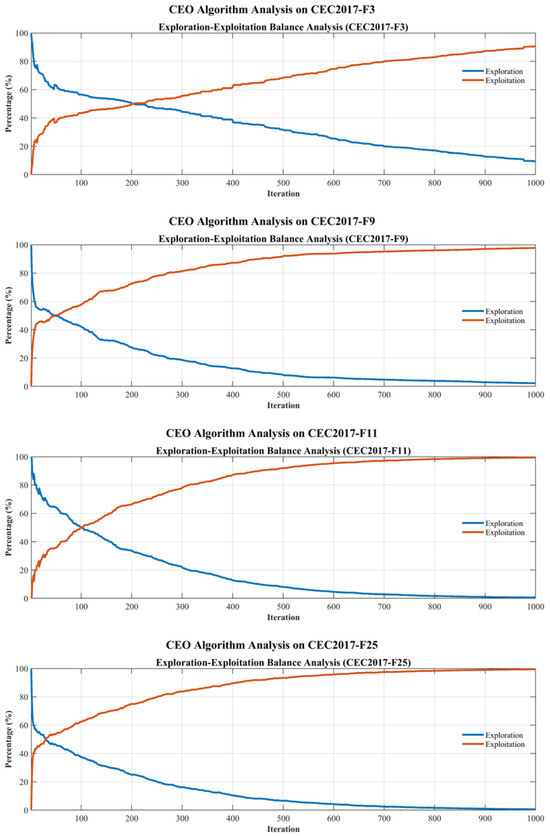
Figure 10.
Exploitation and exploration percentages of CEO on four CEC2017 unconstrained benchmark tests.
For simple unimodal and multimodal problems, such as F3 and F9, CEO initially employs exploration to rapidly cover the solution space, identifying regions with exploitable potential. Exploitation then dominantly drives the convergence process. In contrast, for hybrid and composite problems with abundant local optima, such as F11 and F25, CEO maintains a high exploration rate in the early stage to evade local trapping. Following mid-term iterations, exploitation gradually assumes dominance, forming a hierarchical mechanism comprising wide-area searching, local focusing, and fine-grained tuning. This mechanism enables exploration and exploitation to synergistically advance the optimization process, demonstrating that a high exploration rate does not impede exploitation.
The trade-off between exploration and exploitation in CEO essentially represents a dynamic strategy adapted to function complexity.Empirical results further validate that CEO outperforms the majority of comparative algorithms in solving CEC2017 benchmark functions across varying dimensions.
In summary, CEO achieves a balance between exploration and exploitation to a certain extent, enabling superior performance in solving both low-dimensional and high-dimensional problems.
3.4. Experiments on CEC2020 Real-World Constrained Optimization Problems
In this subsection, 13 CEC2020 real-world constrained optimization problems from diverse engineering domains are employed to validate the capabilities of CEO against other comparative algorithms. Unlike the unconstrained benchmark problems in CEC2017, CEC2020 real-world constrained optimization problems exhibit high non-convexity and complexity, involving multiple equality and inequality constraints.
Consequently, when addressing the constrained optimization problems in CEC2020, the penalty function method serves as a critical approach for transforming constrained problems into unconstrained ones by introducing terms that penalize constraint violations. This methodology is primarily categorized into static penalty functions and dynamic penalty functions. The static penalty function employs a fixed penalty coefficient throughout the optimization process. For instance, for the constraint , its typical construction is expressed as , where k denotes a pre-specified constant. This approach is characterized by its straightforward implementation and is well-suited for CEC2020 problems with stable constraint structures. In contrast, the dynamic penalty function adaptively adjusts the penalty coefficient during the optimization process, which is often defined by the form , where represents the initial coefficient and signifies the growth factor. This strategy imposes lenient penalties in the early optimization phase to facilitate extensive exploration of the solution space by the algorithm while progressively increasing the penalty intensity in subsequent stages to ensure strict compliance with constraint conditions.
CEC2020-RW can be categorized into six problem classes: industrial chemical processes, process synthesis and design problems, mechanical engineering problems, power system problems, and livestock feed formulation optimization problems. Detailed descriptions of these problems can be found in Reference [58]. Considering that different optimization algorithms may not be compatible with all problems, 13 typical problems from CEC2020-RW are selected to validate CEO and ten other algorithms. The problem names, primary parameters, and theoretical optimal values are listed in Table 9. In the experiments, each algorithm was independently run 30 times with a population size of 50 and a termination criterion of 1000 total iterations.

Table 9.
Names and parameters of 13 typical problems in CEC2020-RW.
Table 10 presents the results of eleven algorithms on 13 practical engineering applications in CEC2020-RW, with the best results bolded. Based on the data in the table, the following conclusions can be drawn:

Table 10.
Results of CEO and competing algorithms on CEC2020-RW problems.
For industrial chemical process problems R1 and R2, CEO achieved the best performance, obtaining optimal values in both problems. This indicates that CEO has excellent potential in solving industrial chemical process problems.
For process synthesis and design problems R3–R7, CEO also performed remarkably well. Except for ranking third in problem R7, CEO achieved the best results in all other optimization problems, demonstrating its non-negligible potential in process synthesis and design.
For mechanical engineering problems R8–R13, CEO outperformed WOA, SOA, ETO, RIME, SCA, MFO, NRBO, GJO, EVO, and DBO in six, five, six, five, five, five, six, three, six, and six problems, respectively, highlighting its superior performance in handling mechanical engineering issues.
Additionally, a Friedman test was conducted on the eleven algorithms based on the 13 practical engineering problems. Table 11 shows the performance rankings of the algorithms on CEC2020-RW, where CEO ranked 1.85. This confirms that CEO meets the requirements of practical engineering problems and holds research prospects for future engineering applications.

Table 11.
Friedman Test Ranks of CEO and other algorithms on CEC2020-RW problems.
3.5. CEO for Robot Path Planning Problem
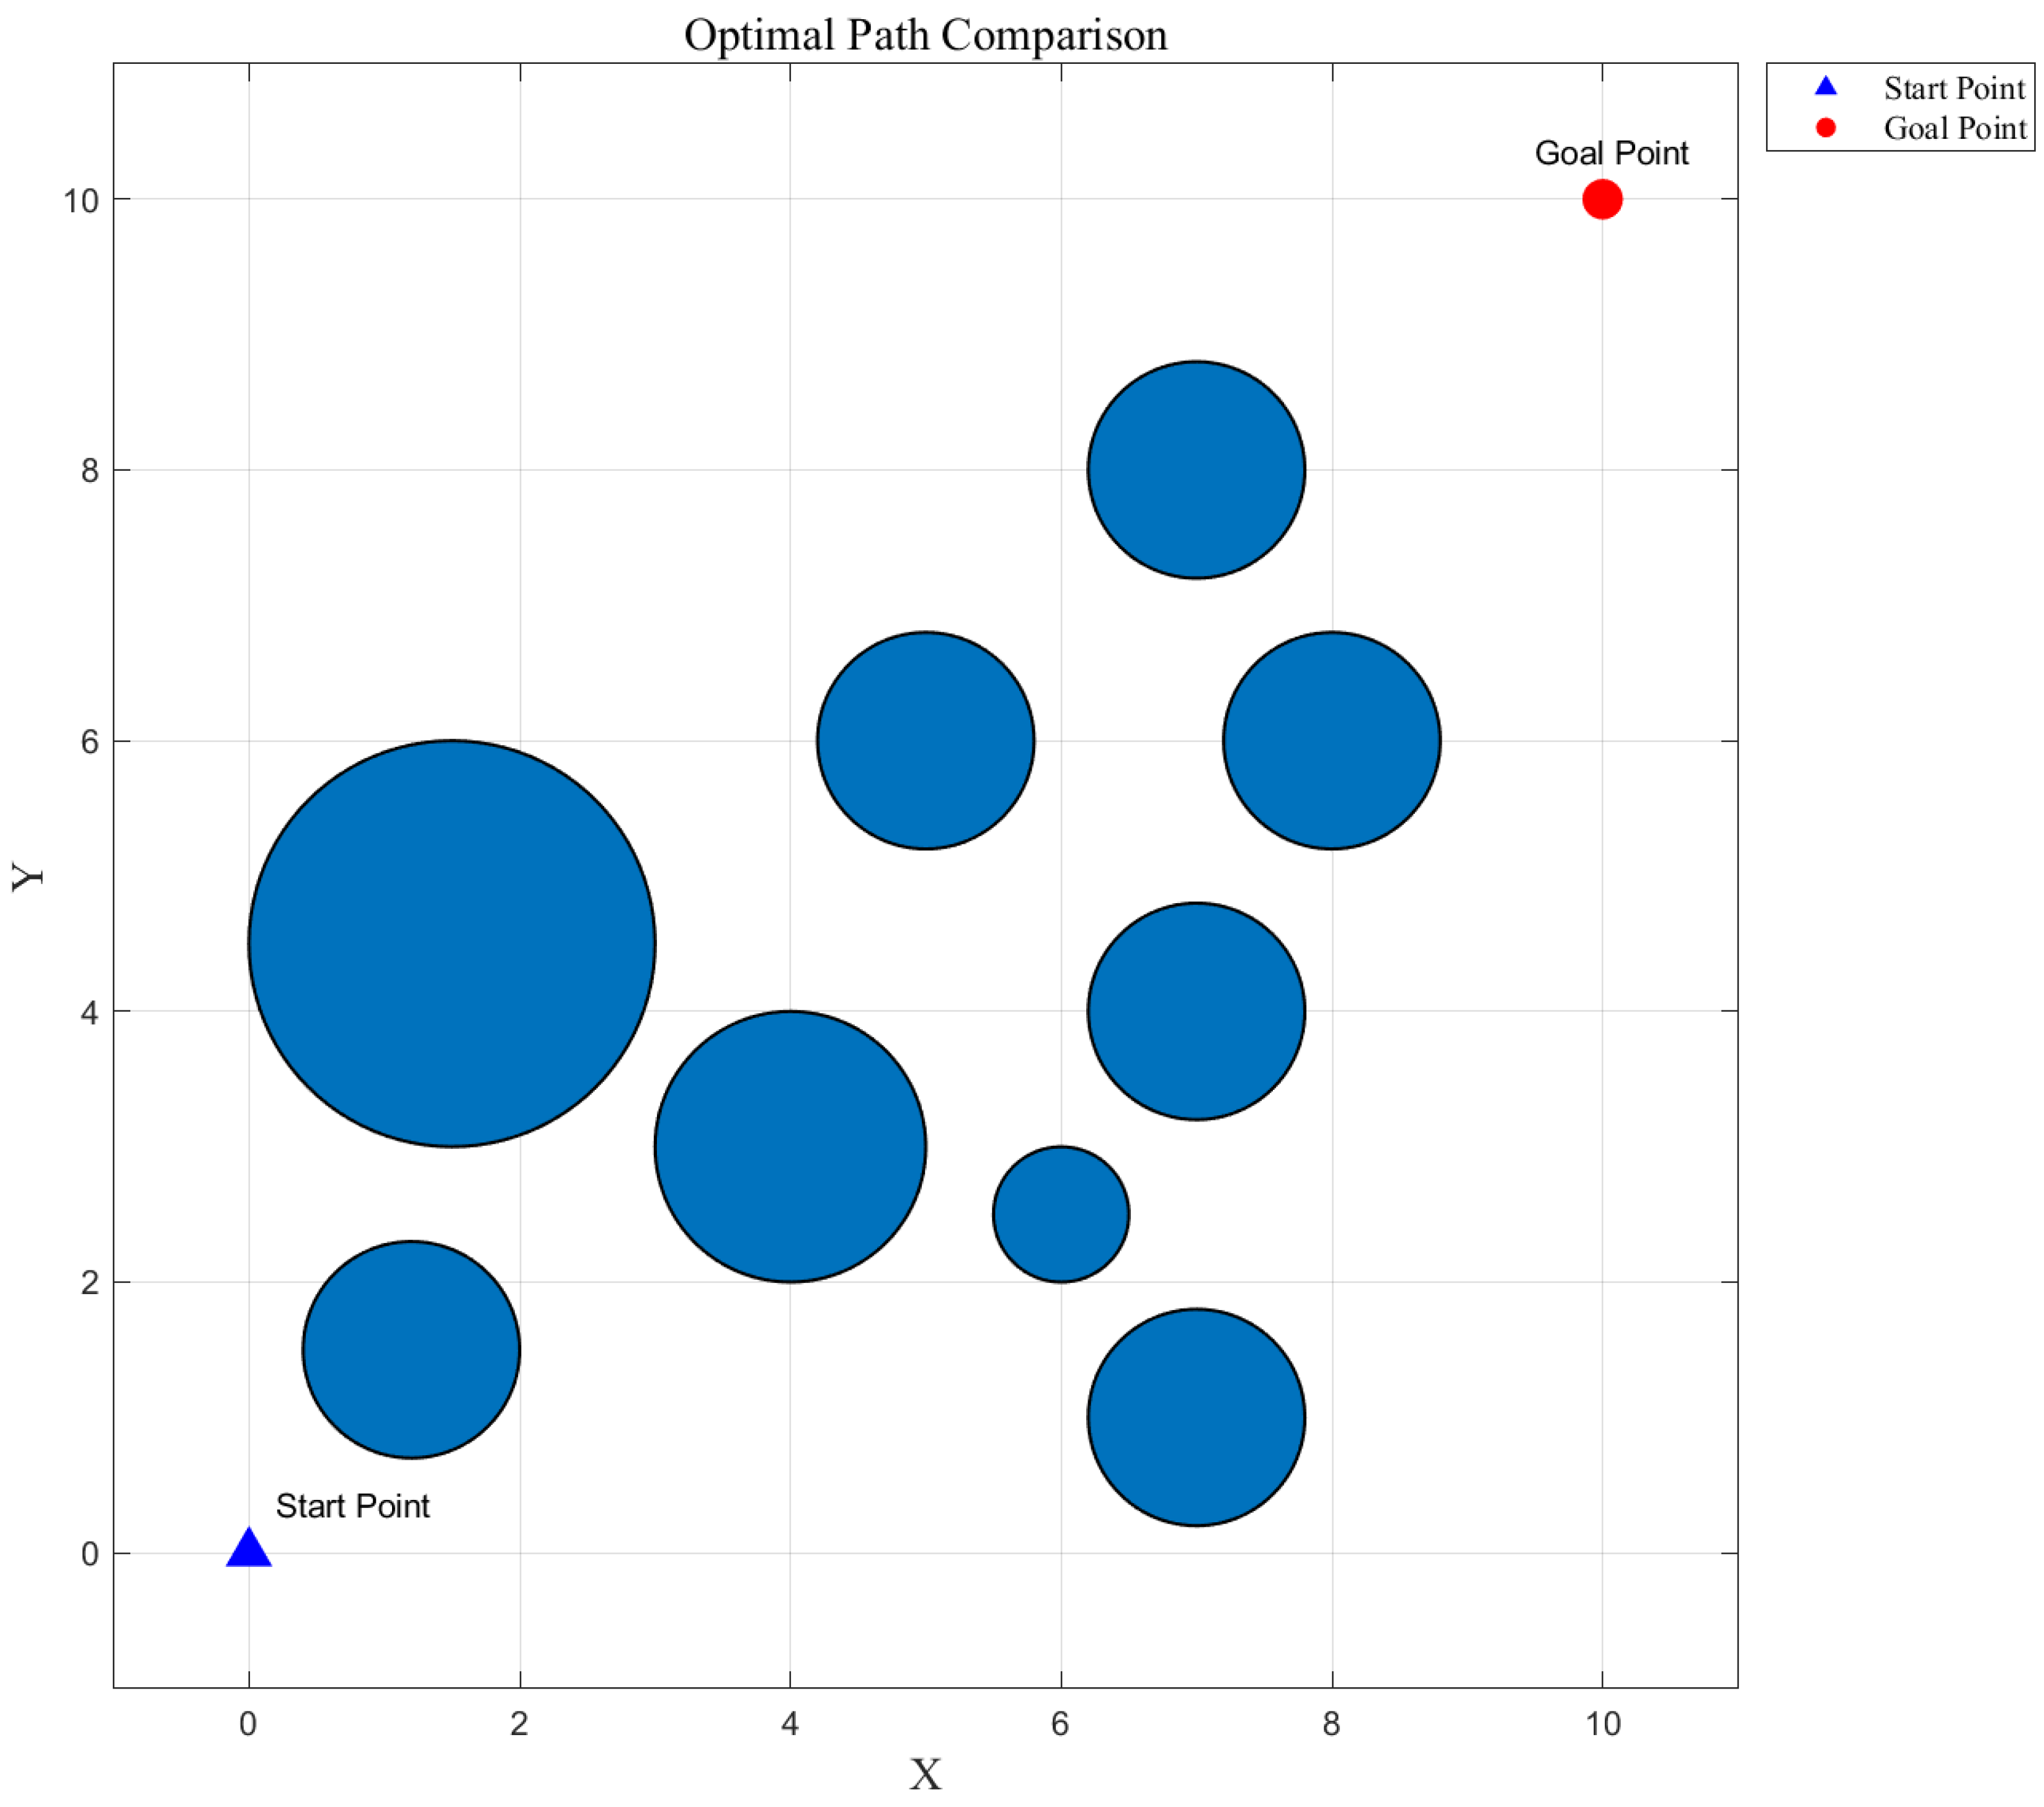
In this subsection, eleven algorithms are employed to solve the path planning problem for a robot, aiming to find the shortest path from the start point to the end point while avoiding obstacles. Based on this engineering context, a 10 × 10 two-dimensional configuration space X is constructed, where the start coordinate is (0, 0) and the end coordinate is (10, 10). The coordinates and radii of the nine obstacles are listed in Table 12, and the entire 2D space is shown in Figure 11.

Table 12.
Center coordinates and radii of the obstacles.
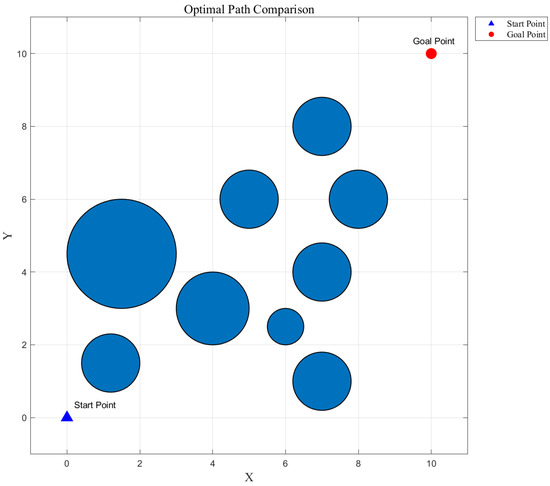
Figure 11.
The 2D space for robot path planning.
The 2D path planning problem in this study can be formulated as the following optimization model:
where denotes the interpolation control points on the path (excluding the start and end points), is the total path length, represents the collision penalty term between the path and all obstacles, is the distance between the k-th point on the path and the center of the j-th obstacle, is the radius of the j-th obstacle, O is the total number of obstacles, M is the number of path interpolation points, and is the penalty coefficient. The goal of path planning is to minimize the path length from start to end while ensuring obstacle-avoidance constraints.
The penalty function specifically calculates the distance between path interpolation points and obstacles. If a path point is inside an obstacle <, this point affects the overall path through the penalty term; if it is outside, it does not influence path planning. The robot’s path is thus obtained by optimizing the path points through the algorithm, with the total number of interpolation points M set to 101.
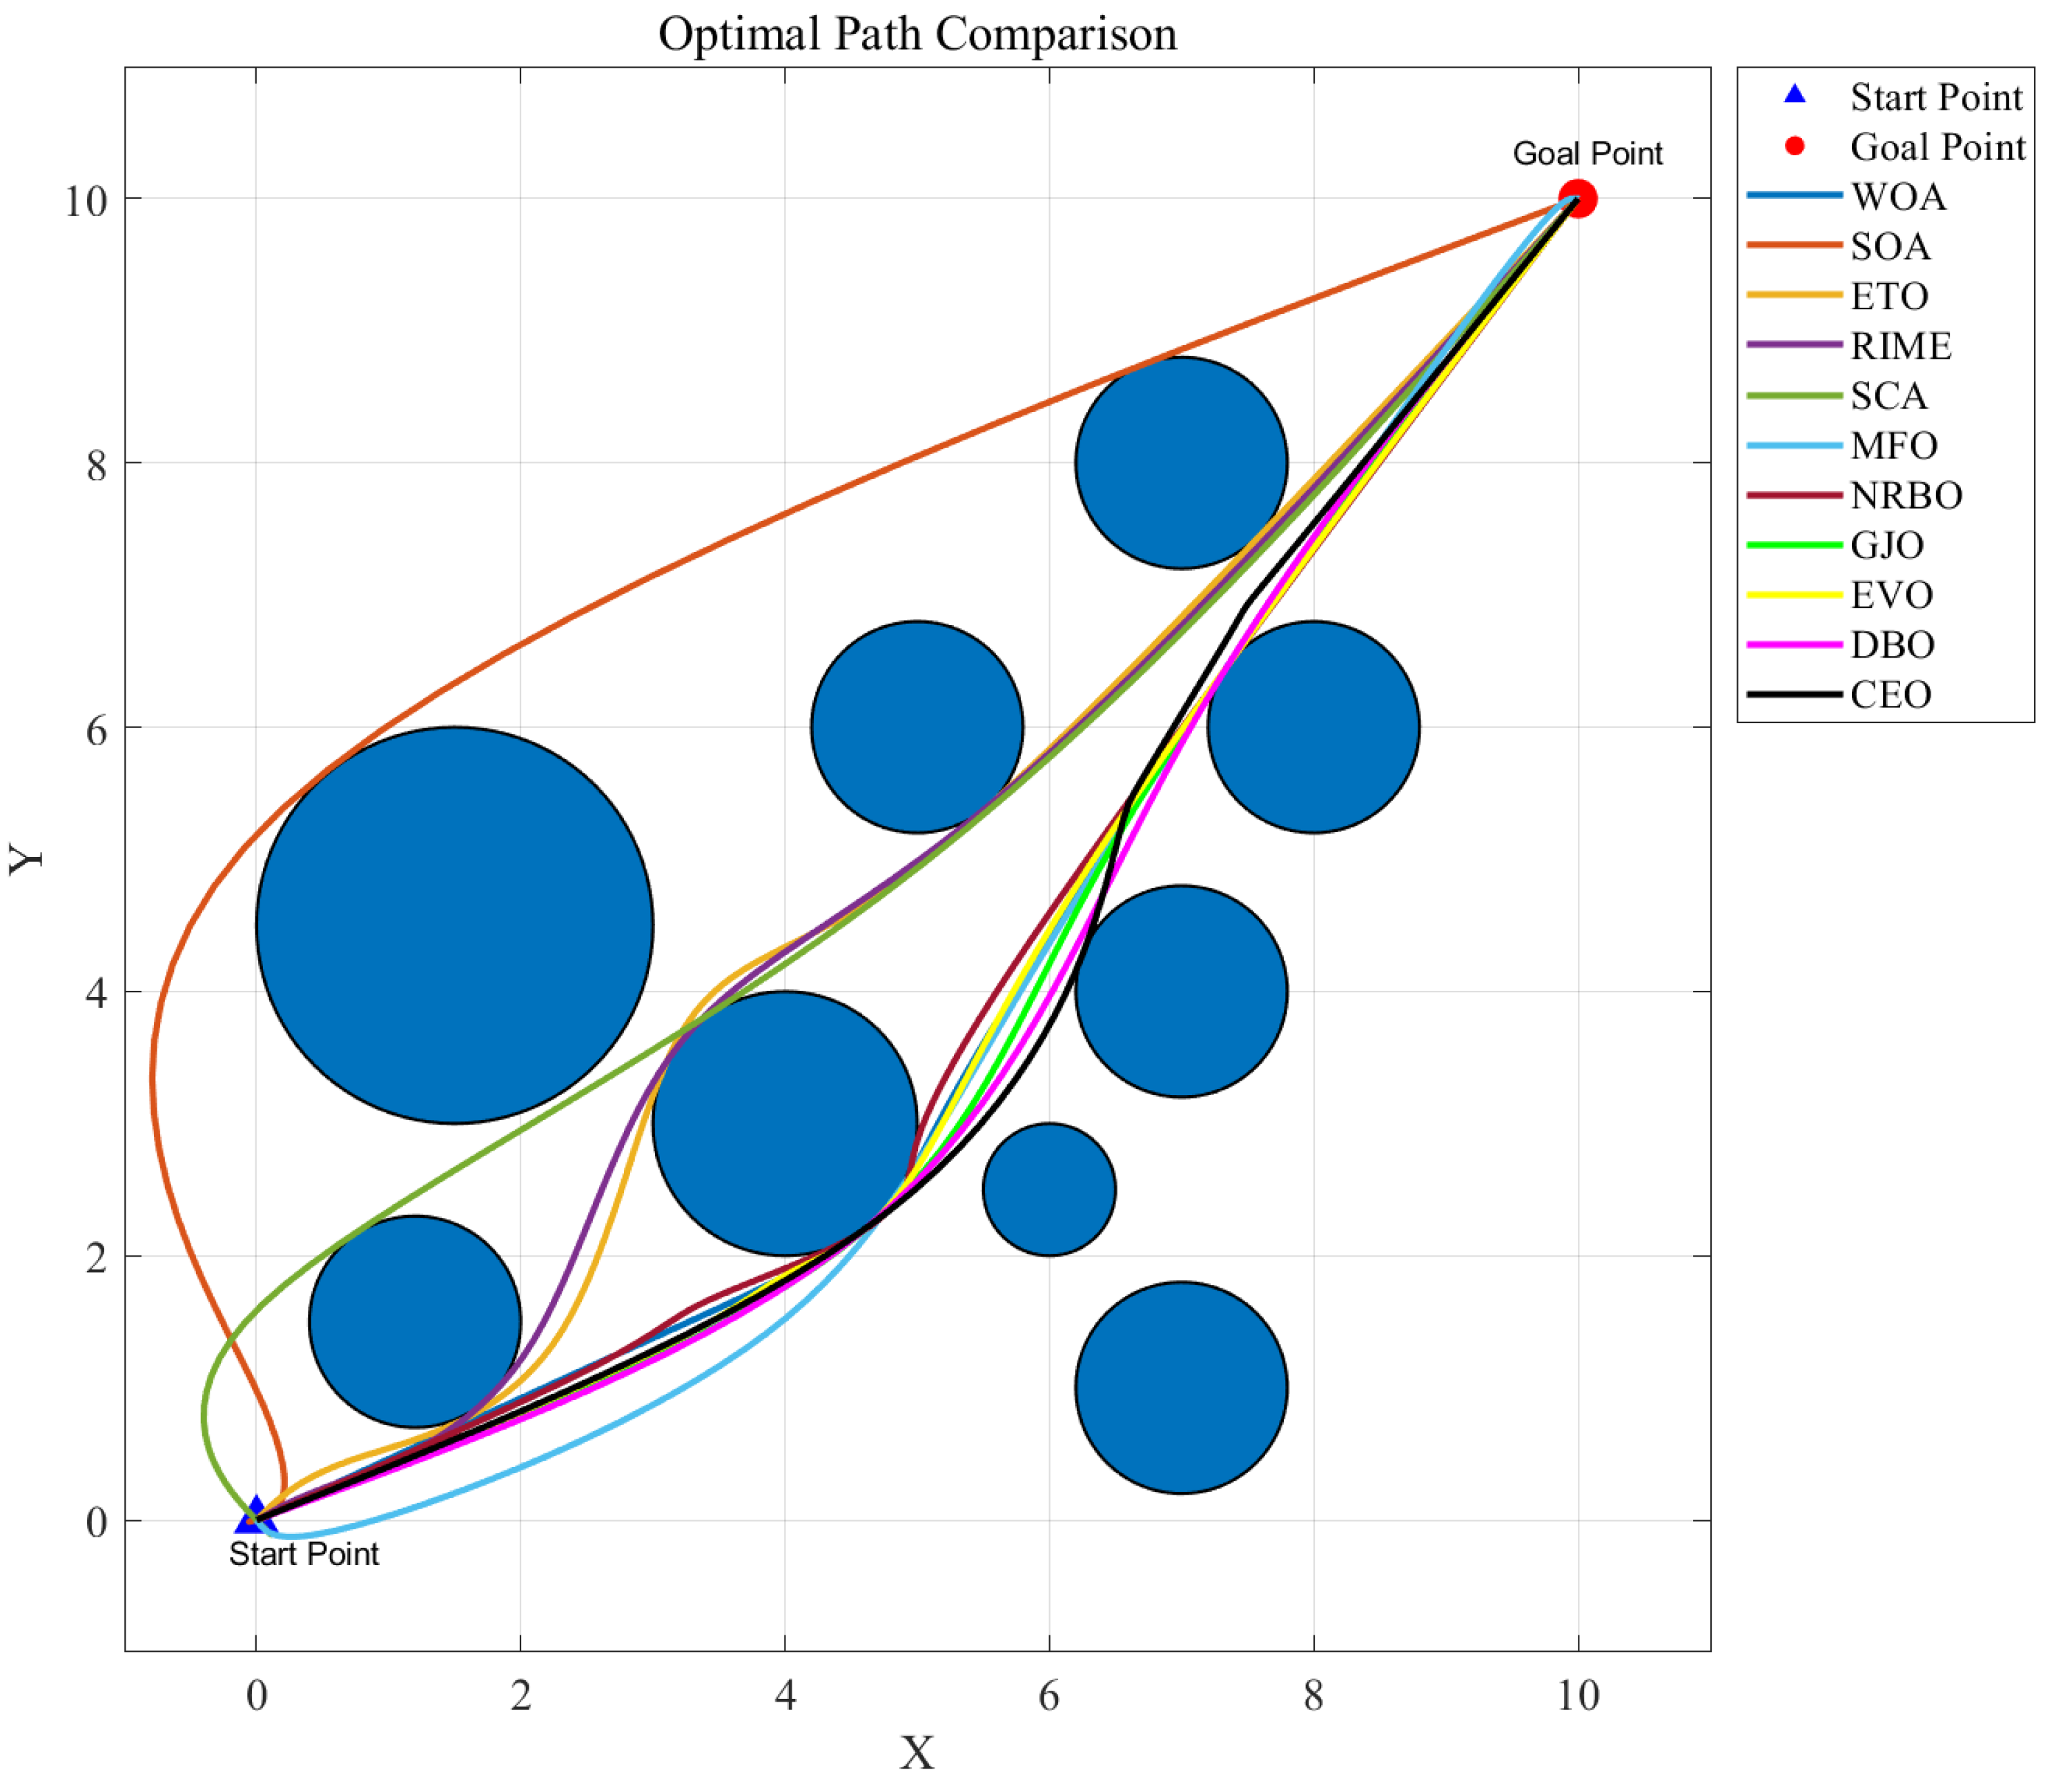
In the experiments, a total of 1000 iterations were set, with each algorithm independently run 30 times on a population size of 100. Figure 12 shows the optimal paths of various algorithms, while Figure 13 displays the average convergence curves of different optimization algorithms. Table 13 presents the mean and standard deviation of the optimized paths for each algorithm, with the best results in bold.
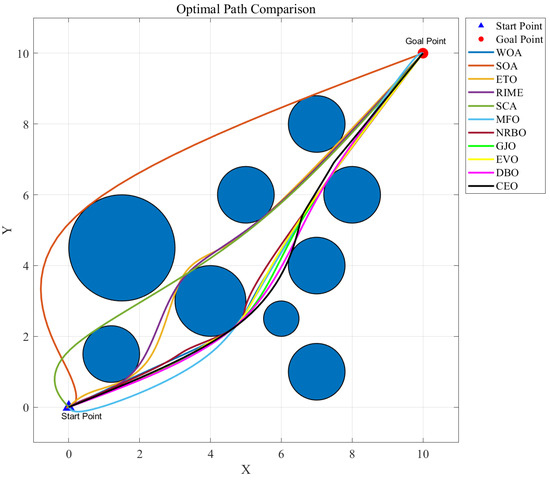
Figure 12.
Optimal paths of CEO and other algorithms.
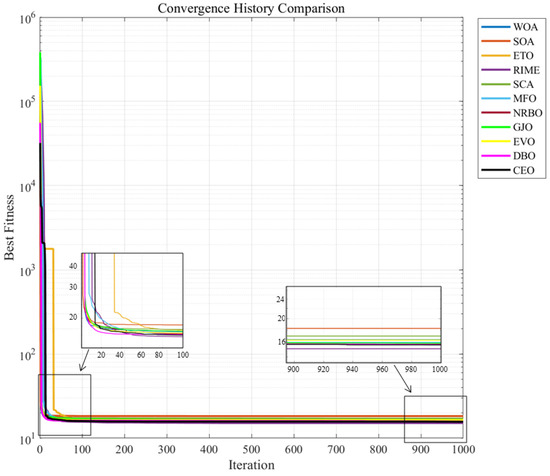
Figure 13.
Convergence curves of CEO and other algorithms in robot path planning.

Table 13.
Results of CEO and other algorithms in robot path planning.
As shown in Figure 12, most algorithms attempt to navigate through the middle of obstacles to reach the endpoint, whereas SOA chooses to bypass obstacles from the outside. According to Table 13, CEO outperformed most algorithms, ranking second only to RIME in mean value, while SCA performed the worst. CEO’s standard deviation also stood out, leading most algorithms, further confirming that CEO not only achieves optimality but also ensures stability in path planning. From the average convergence curve (Figure 13), CEO demonstrated remarkable capability in quickly finding the optimal value, approaching the optimal solution at around 120 iterations—far superior to other algorithms—indicating stronger local exploitation ability. By the 1000th iteration, CEO’s final convergence result was significantly better than all algorithms except RIME.
Given that RIME employs mechanisms of hard rime puncture and positive greedy selection, it enables rapid local refinement of path inflection points. With more sensitive parameter adaptability, RIME is well-suited for specialized tasks like path planning, thus outperforming CEO to a certain extent.
In summary, CEO performed outstandingly in the robot path planning problem, further validating its capability to solve complex real-world problems and warranting further research.
3.6. Application of CEO in Photovoltaic System Parameter Extraction
In the field of new energy, photovoltaic (PV) systems are powerful tools for harnessing solar energy and converting it directly into electrical energy. Therefore, extracting parameters based on measured current–voltage data to design accurate and efficient models for PV systems holds significant engineering significance.
In this subsection, three classical photovoltaic models [59] are selected to validate the effectiveness and stability of CEO against ten other algorithms in this engineering problem: the single-diode model (SDM), the double-diode model (DDM), and the photovoltaic module model (PVMM). The equivalent circuit diagrams of these three photovoltaic models are shown in Figure 14.

Figure 14.
Equivalent circuit diagrams for photovoltaic cells.
In the SDM, five core parameters need to be extracted: the photo-generated current source (), the reverse saturation current (), series resistance (),shunt resistance (), and the diode ideality factor (n), as shown in Figure 14a. The mathematical models of these core parameters are summarized as follows:
where denotes the output current, denotes the diode current, denotes the shunt resistance current, denotes the output voltage, T denotes the temperature measured in Kelvin, q denotes the electron charge , and k denotes the Boltzmann constant . Therefore, the calculation formula for in the SDM is as follows:
In the DDM, seven core parameters need to be extracted: the photo-generated current source (), the diffusion current of , the saturation current (), series resistance (), shunt resistance (), and diode ideality factors ( and ).The circuit model is shown in Figure 14b. The calculation formula for in the DDM is as follows:
The PVMM is composed of multiple identical photovoltaic cells connected in parallel or series, and its specific circuit model is shown in Figure 14c. The calculation formula for in the PVMM is as follows:
where and denote the number of photovoltaic cells in parallel and series, respectively. In this model, five core parameters (, , , , and n) need to be extracted. The specific ranges of different parameters in the three photovoltaic models are listed in Table 14.

Table 14.
Bounds of different parameters in three PV models.
In the parameter extraction problem of photovoltaic systems, the primary objective is to minimize the discrepancy between the experimental data estimated by the algorithm and the actual measured data. As a complex nonlinear optimization problem, the root mean square error (RMSE) amplifies the impact of larger errors through squaring operations and is more sensitive to errors than other error metrics. Therefore, the RMSE is selected as the objective function for this problem, with its mathematical formula defined as follows:
where N represents the number of actual measurement data points and X denotes the solution vector of unknown core parameters to be extracted in the photovoltaic model. Therefore, the specific forms of in the three models are as follows:
For SDM,
For DDM,
For PVMM,
In this experiment, the benchmark measured current–voltage data were taken from Easwarakhanthan et al. [60], who used a French RTC commercial silicon solar cell with a diameter of 57 mm (under conditions of 1000 W/m2 and 33 °C). The maximum iteration count was set to 1000; the population size was 50, and each algorithm was independently run 30 times. Based on the above experimental parameter settings, the root means square error (RMSE) statistical results of the eleven algorithms on the SDM, DDM, and PVMM are presented in Table 15.

Table 15.
Statistical outcomes of the RMSE attained by eleven algorithm on three PV models.
As shown in Table 15, CEO outperformed the vast majority of optimization algorithms, achieving the best mean values in both the SDM and DDM. Although the CEO algorithm’s local fine-tuning precision in the PVMM is slightly insufficient, its test results still outperform more than half of the optimization algorithms. Additionally, a Friedman test was conducted on these eleven algorithms based on the three photovoltaic models.
As indicated in Table 16, the CEO algorithm’s superior performance ranked it first among the eleven algorithms, further demonstrating its efficiency in extracting photovoltaic system parameters. Its excellent exploitation and exploration capabilities outperform most current optimization algorithms.

Table 16.
Ranks of eleven algorithms on three PV models based on Friedman’s test.
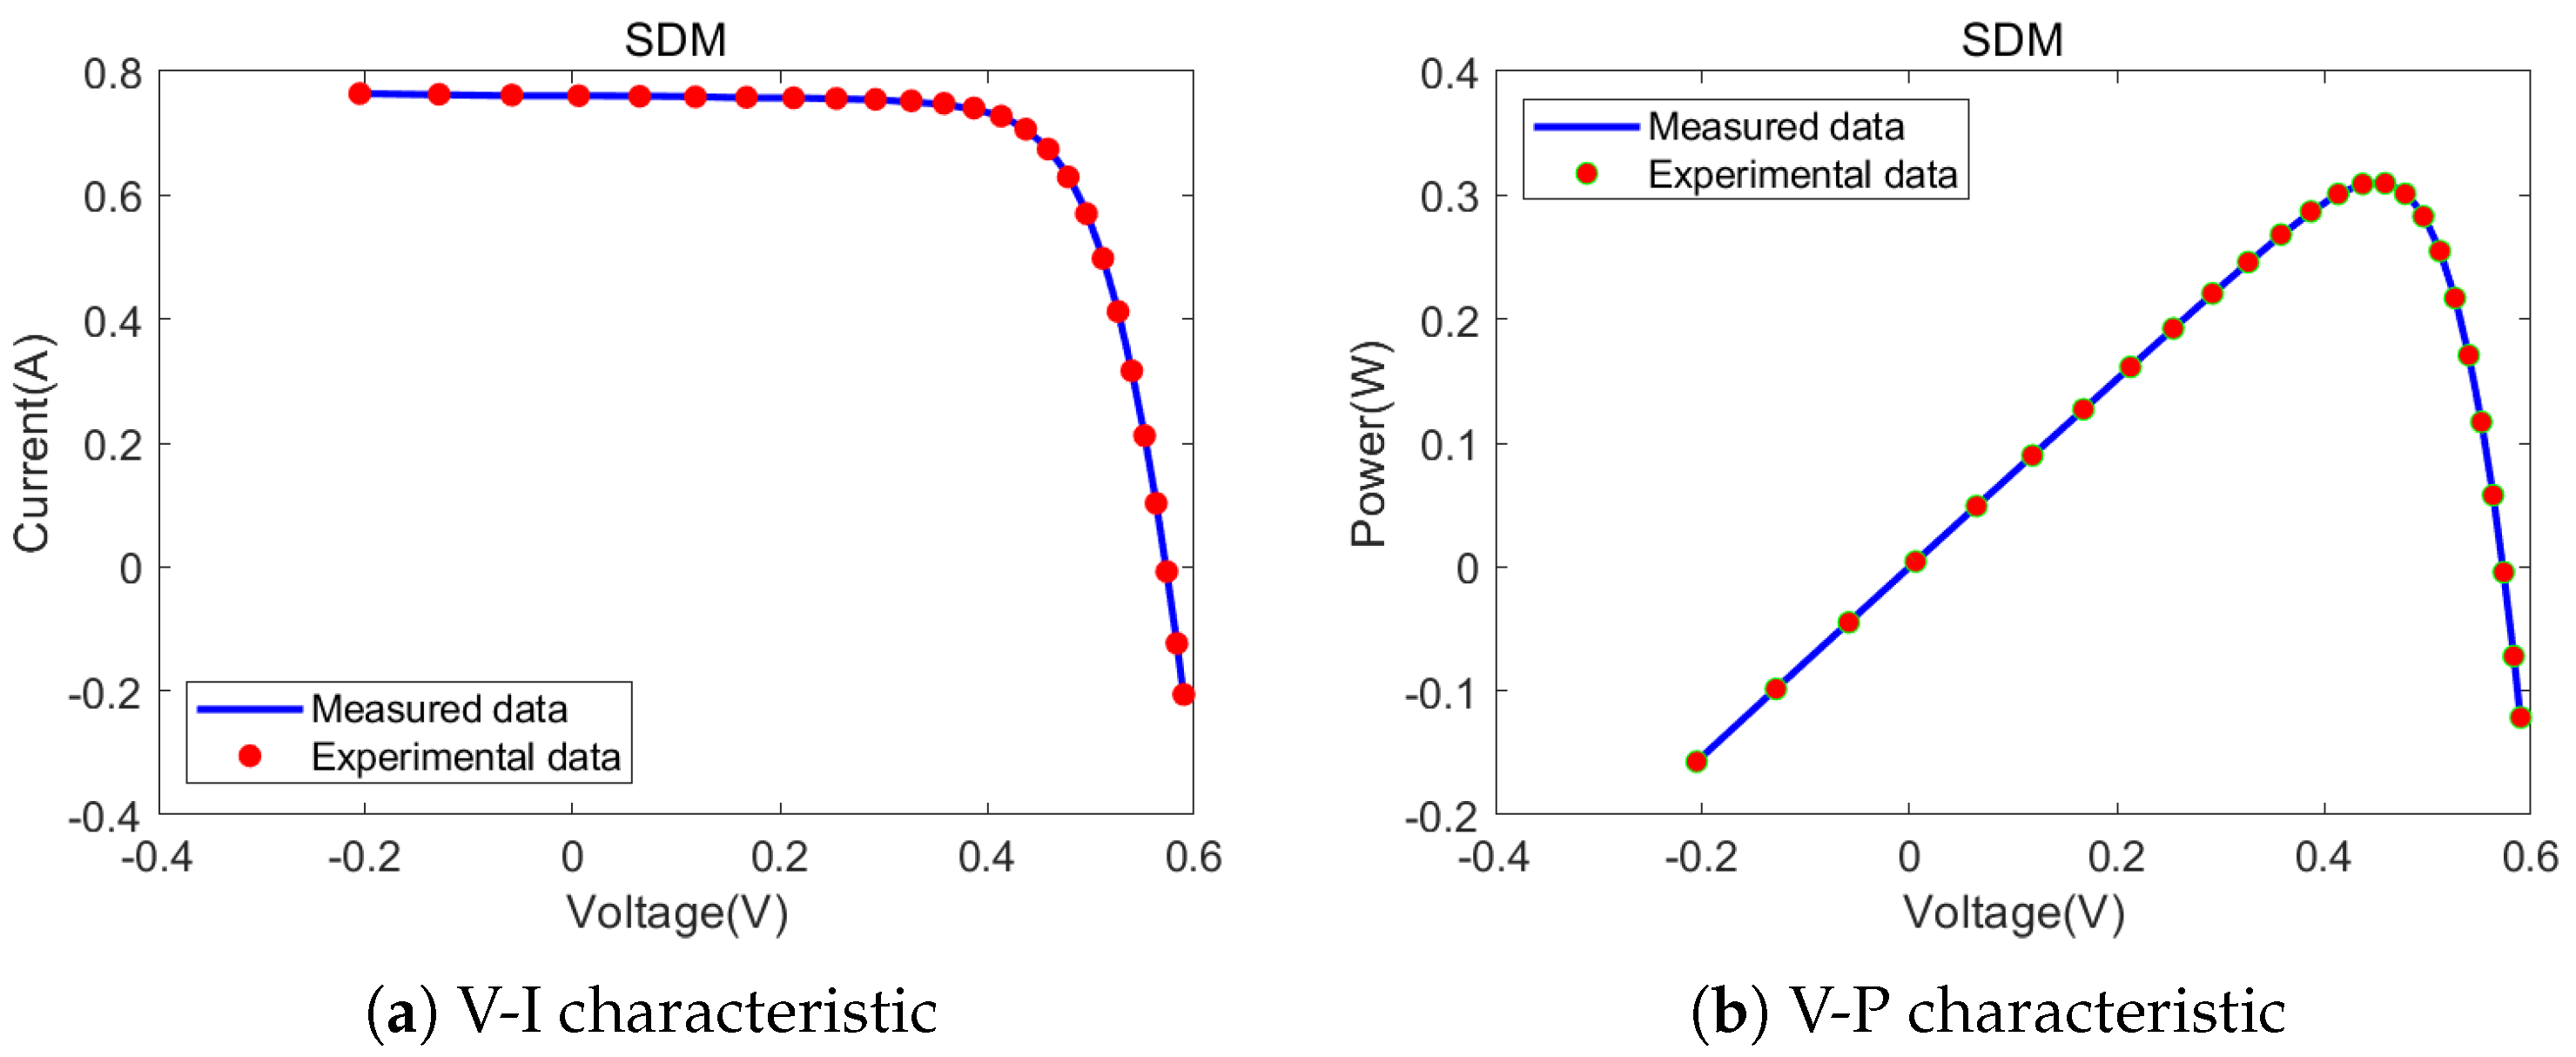
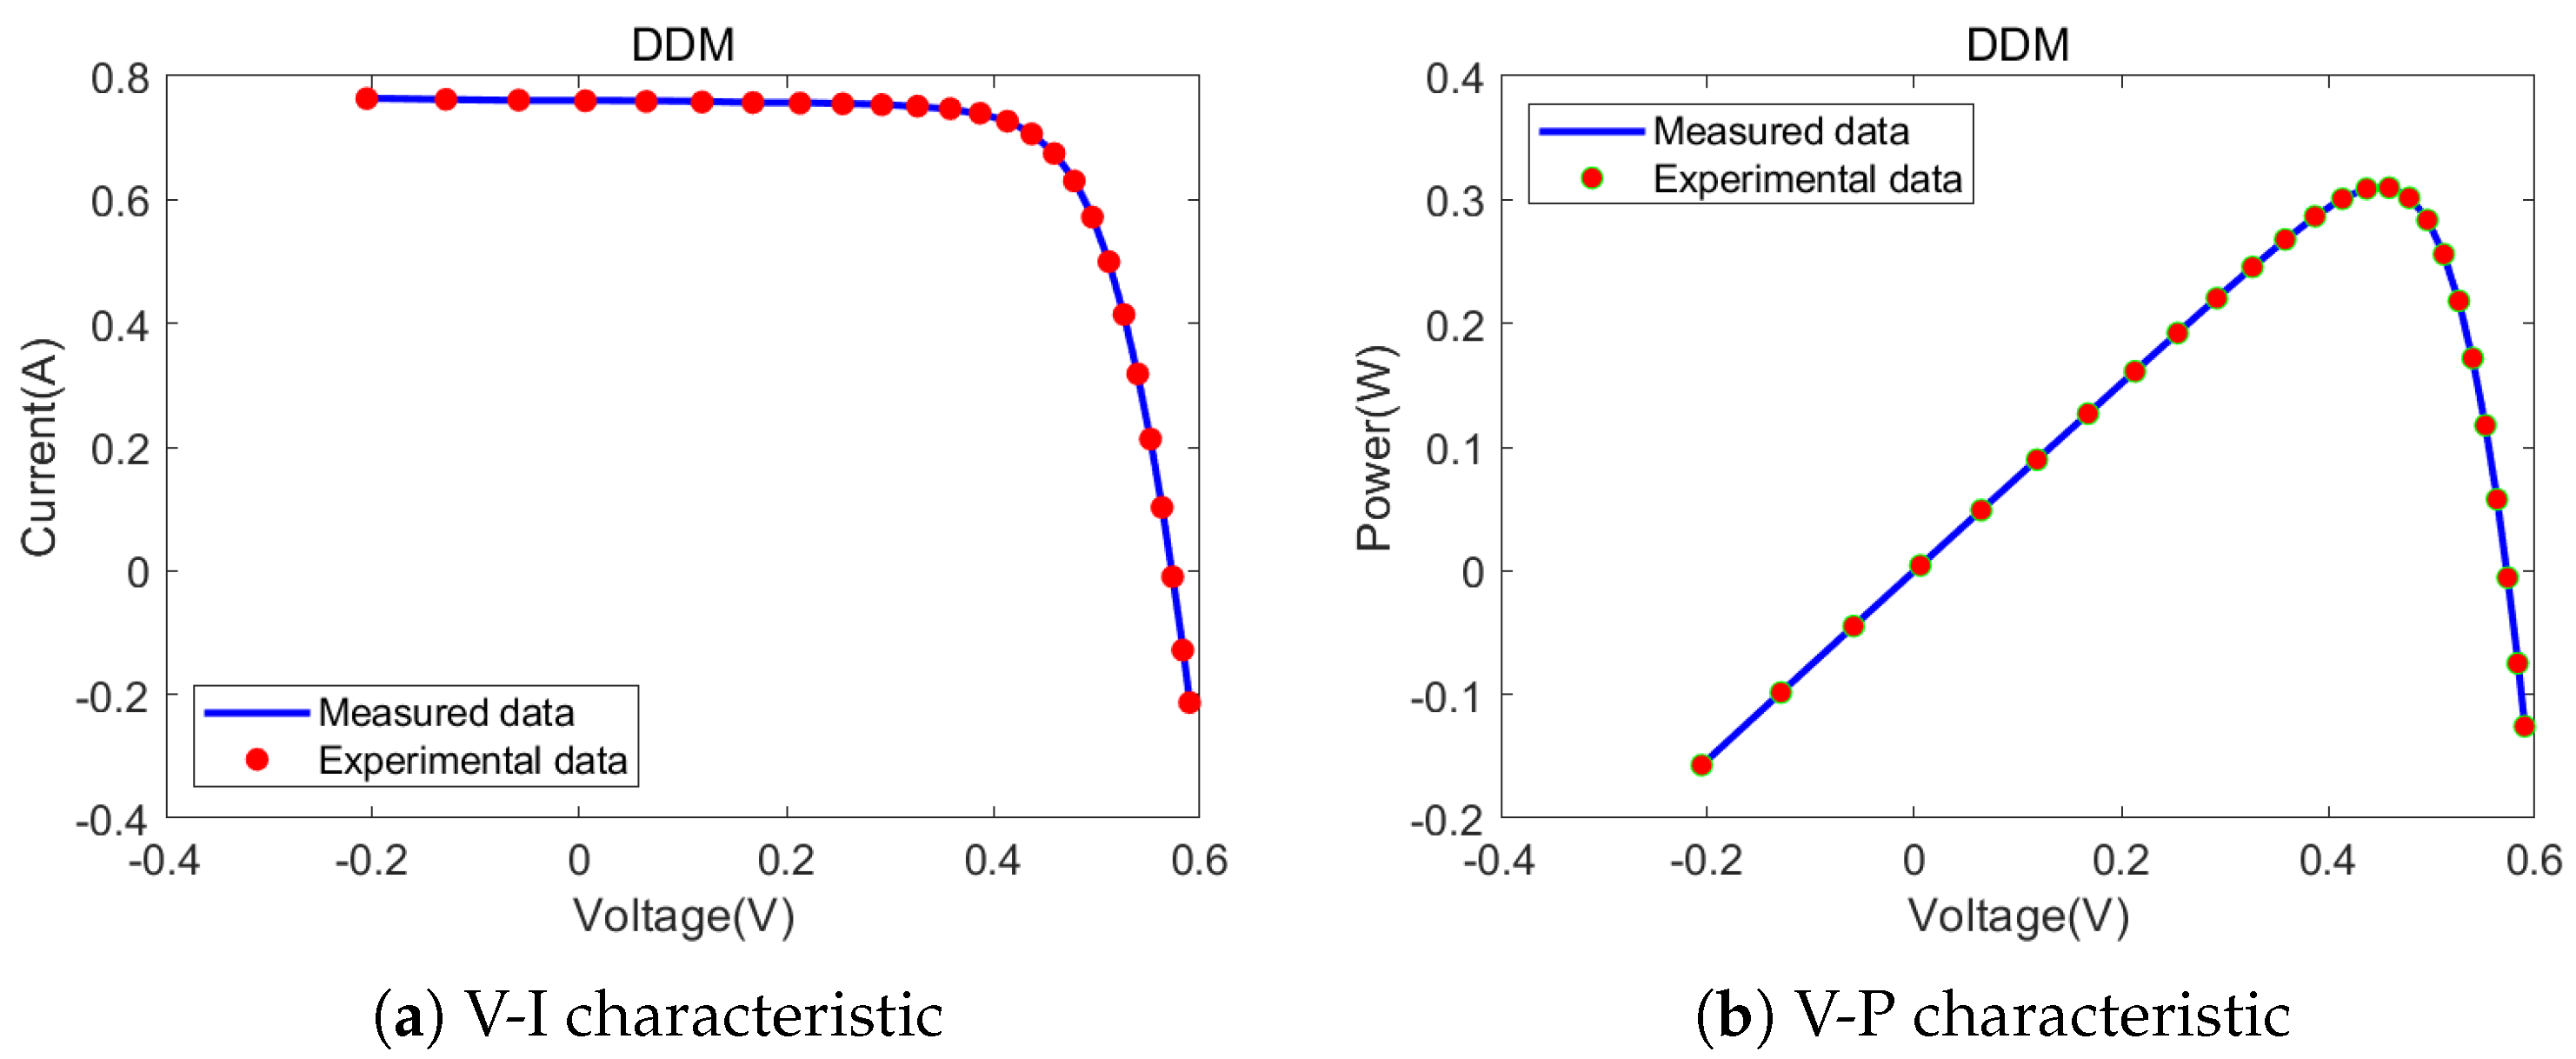
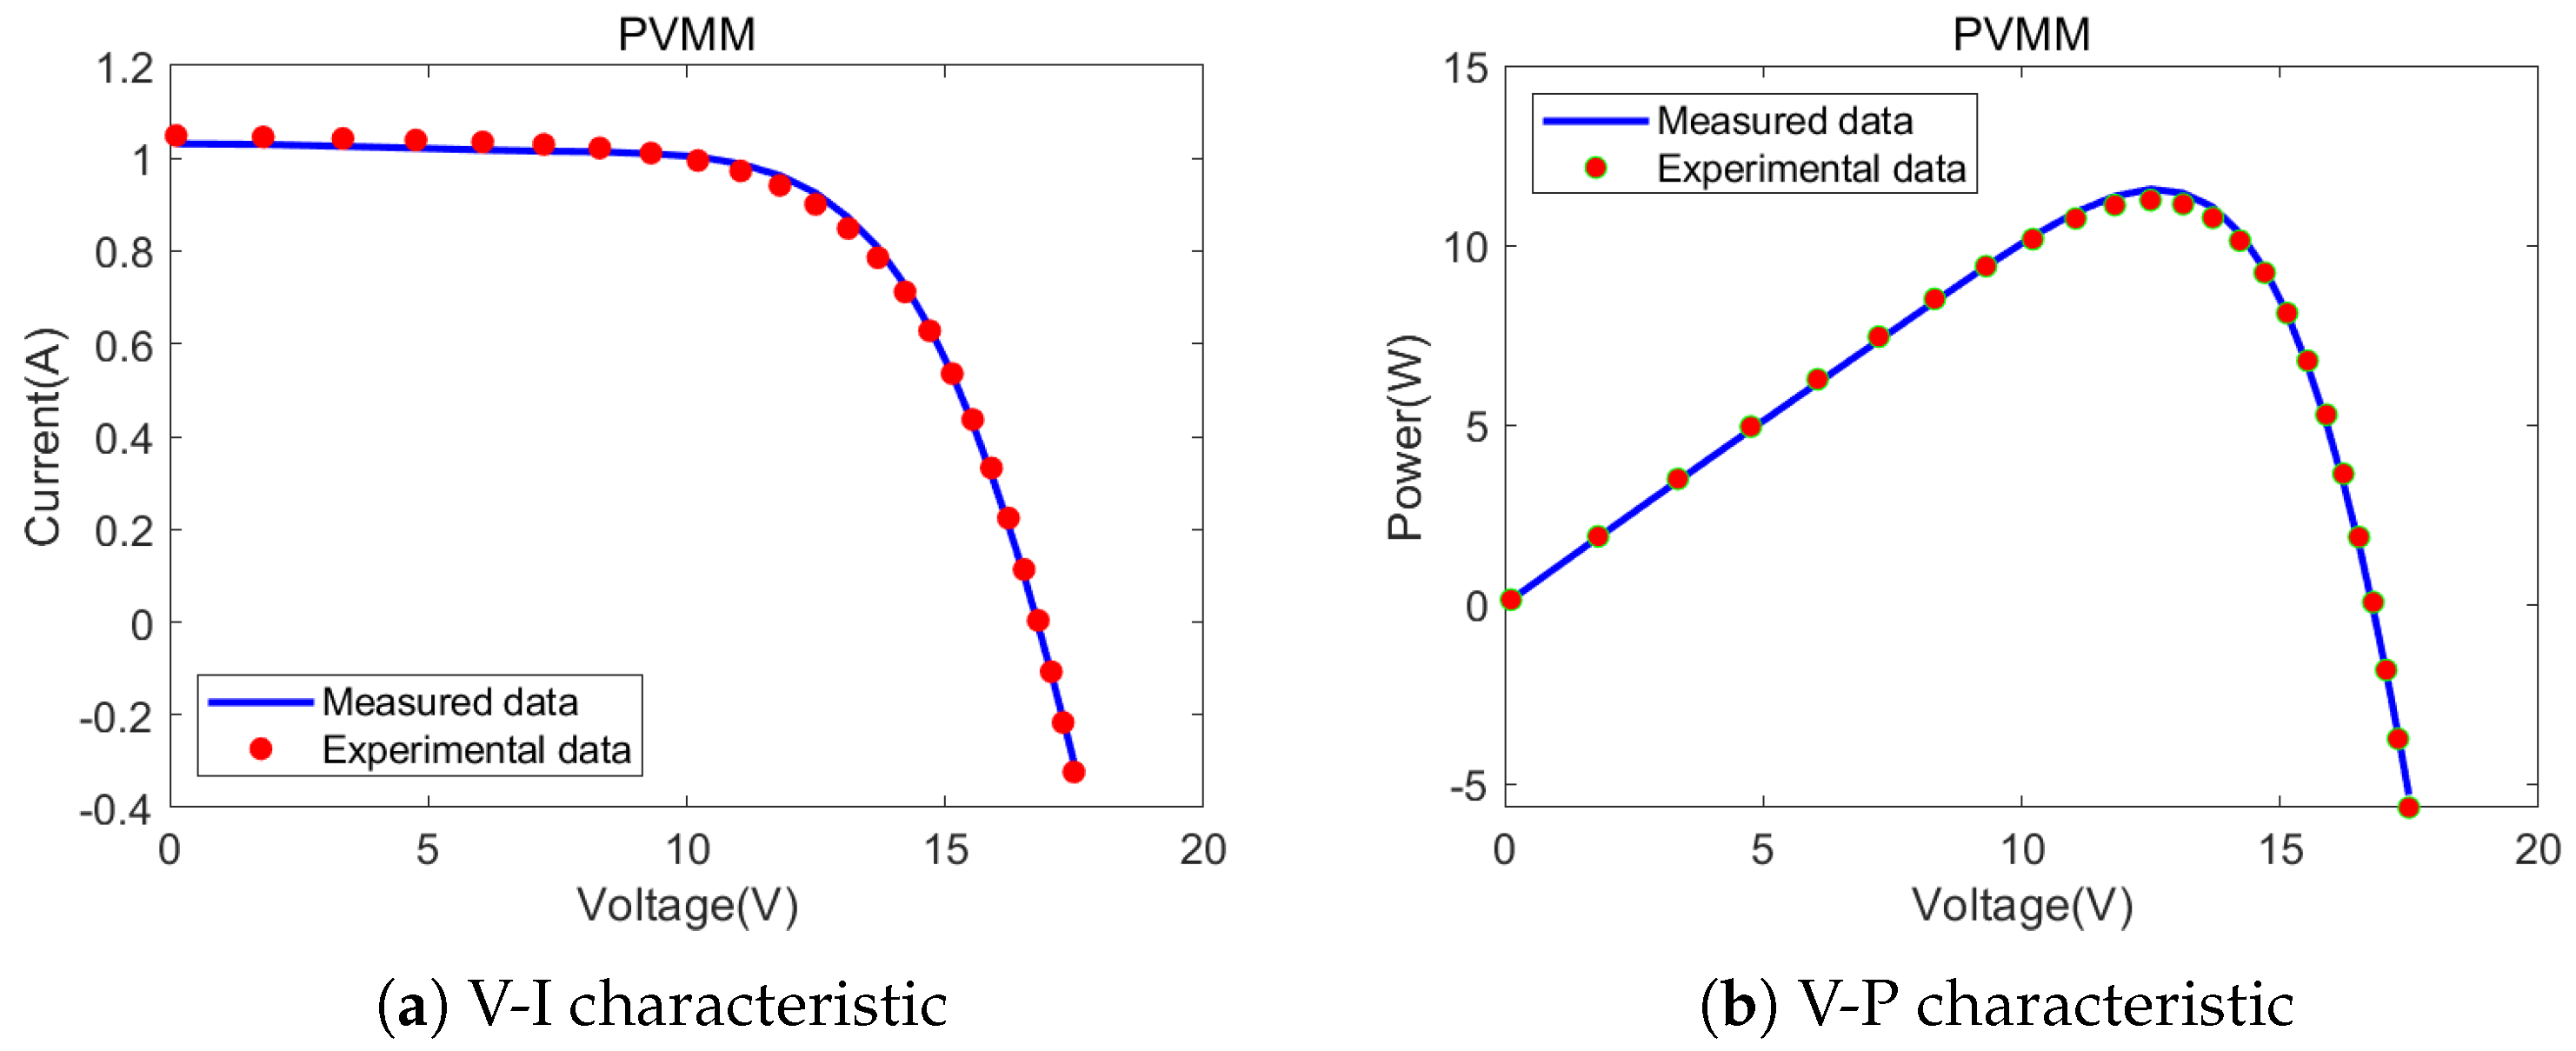
Furthermore, Figure 15, Figure 16 and Figure 17, respectively, show the comparisons between the CEO test results on the SDM, DDM, and PVMM and the actual measured values. As shown in Figure 15, Figure 16 and Figure 17, it can be seen that the experimental data obtained by the CEO algorithm can perfectly fit the measured data.
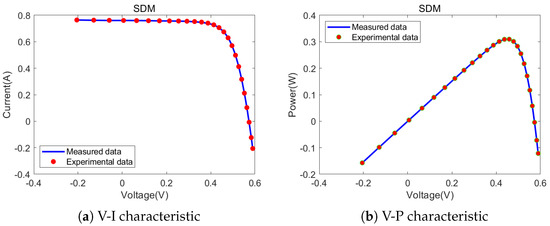
Figure 15.
Comparisons between measured data and experimental data attained by CEO for the SDM.
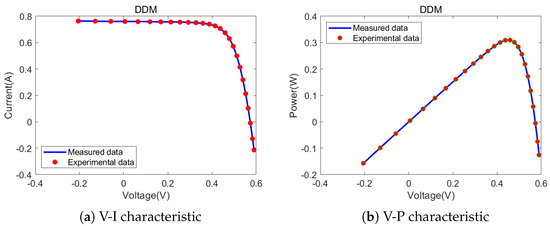
Figure 16.
Comparisons between measured data and experimental data attained by CEO for the DDM.
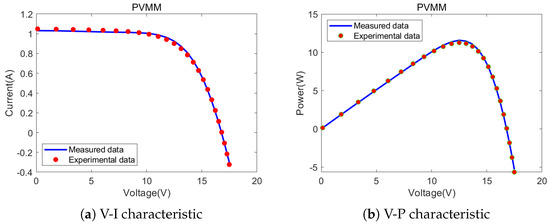
Figure 17.
Comparisons between measured data and experimental data attained by CEO for the PVMM.
4. Conclusions
This work proposes a novel metaheuristic optimization algorithm, CEO; it is inspired by cosmic evolution and simulates the formation process of stellar systems in the universe. CEO introduces exploration strategies of cosmic expansion and multiple gravitational forces for search steps, mimicking the early-stage evolution of the universe. By simulating the phenomenon of celestial bodies being attracted by the largest star, a gravitational alignment mechanism based on gravitational forces is proposed for local exploitation. Finally, improved strategies such as multi-stellar system interactions and the celestial orbital resonance strategy are introduced to enhance the algorithm’s exploration performance in the early stages and avoid local optimal traps.
The superior performance of CEO was successfully validated through 29 CEC2017 unconstrained benchmark tests and 13 CEC2020 real-world constrained optimization problems, particularly in handling high-dimensionality and multi-convexity complex problems, where CEO demonstrated high convergence speed and accuracy. The comparison algorithms included WOA, SOA, ETO, RIME, SCA, MFO, NRBO, GJO, EVO, and DBO. The experimental results show that CEO performed excellently in most test functions and practical applications.
Furthermore, this work verified the value of the engineering application of CEO through two practical engineering problems: robot path planning and extraction of photovoltaic system parameters. In the robot path planning problem, the CEO algorithm not only quickly found the optimal path while avoiding obstacles but also demonstrated superior stability in path planning. In the photovoltaic system parameter extraction problem, the CEO algorithm’s optimization performance was outstanding, successfully optimizing model parameters and improving the efficiency of the photovoltaic system, thus validating the value of the engineering application of the algorithm. These application cases further demonstrate that CEO has broad application potential in practical engineering. As future research directions, CEO will be studied in image segmentation and celestial trajectory prediction to explore its potential in more fields.
Author Contributions
Conceptualization, Z.J.; methodology, Z.J. and R.W.; software, Z.J. and R.W.; validation, R.W.; formal analysis, R.W.; resources, G.D.; data curation, R.W.; writing—original draft preparation, R.W. and Z.J.; writing—review and editing, R.W. and G.D. All authors have read and agreed to the published version of the manuscript.
Funding
This research received no external funding.
Data Availability Statement
The original contributions presented in this study are included in the article. Further inquiries can be directed to the corresponding author.
Acknowledgments
The authors are very grateful to the anonymous reviewers, whose valuable comments and suggestions improved the quality of this paper.
Conflicts of Interest
The authors declare no conflicts of interest.
References
- Nelder, J.A.; Mead, R. A simplex method for function minimization. Comput. J. 1965, 7, 308–313. [Google Scholar] [CrossRef]
- Ibaraki, T.; Ishii, H.; Mine, H. An Assignment Problem On A Network. J. Oper. Res. Soc. Jpn. 1976, 19, 70–90. [Google Scholar] [CrossRef]
- Shih, P.C.; Zhang, Y.; Zhou, X. Monitor system and Gaussian perturbation teaching–learning-based optimization algorithm for continuous optimization problems. J. Ambient. Intell. Humaniz. Comput. 2022, 13, 705–720. [Google Scholar] [CrossRef]
- Almufti, S.M. Historical survey on metaheuristics algorithms. Int. J. Sci. World 2019, 7, 1. [Google Scholar] [CrossRef]
- Li, H.; Li, J.; Wu, P.; You, Y.; Zeng, N. A ranking-system-based switching particle swarm optimizer with dynamic learning strategies. Neurocomputing 2022, 494, 356–367. [Google Scholar] [CrossRef]
- Chen, H.; Li, C.; Mafarja, M.; Heidari, A.A.; Chen, Y.; Cai, Z. Slime mould algorithm: A comprehensive review of recent variants and applications. Int. J. Syst. Sci. 2023, 54, 204–235. [Google Scholar] [CrossRef]
- Khishe, M.; Mosavi, M.R. Chimp optimization algorithm. Expert Syst. Appl. 2020, 149, 113338. [Google Scholar] [CrossRef]
- Talbi, E.G. Metaheuristics: From Design to Implementation; John Wiley & Sons: Hoboken, NJ, USA, 2009. [Google Scholar]
- Kennedy, J.; Eberhart, R. Particle swarm optimization. In Proceedings of the ICNN’95-International Conference on Neural Networks, Perth, WA, Australia, 27 November–1 December 1995; IEEE: Piscataway, NJ, USA, 1995; Volume 4, pp. 1942–1948. [Google Scholar]
- Glover, F. Future paths for integer programming and links to artificial intelligence. Comput. Oper. Res. 1986, 13, 533–549. [Google Scholar] [CrossRef]
- Rajabi Moshtaghi, H.; Toloie Eshlaghy, A.; Motadel, M.R. A comprehensive review on meta-heuristic algorithms and their classification with novel approach. J. Appl. Res. Ind. Eng. 2021, 8, 63–89. [Google Scholar]
- Holland, J.H. Adaptation in Natural and Artificial Systems: An Introductory analysis with Applications to Biology, Control, and Artificial Intelligence; MIT Press: Cambridge, MA, USA, 1992. [Google Scholar]
- Storn, R.; Price, K. Differential evolution—A simple and efficient heuristic for global optimization over continuous spaces. J. Glob. Optim. 1997, 11, 341–359. [Google Scholar] [CrossRef]
- Poli, R.; Langdon, W.B.; McPhee, N.F. A Field Guide to Genetic Programming; Lulu.com; Springer: Cham, Switzerland, 2008; 250p, ISBN 978-1-4092-0073-4. [Google Scholar]
- Yao, X.; Liu, Y.; Lin, G. Evolutionary programming made faster. IEEE Trans. Evol. Comput. 1999, 3, 82–102. [Google Scholar] [CrossRef]
- Robbiano, A.; Tripodi, A.; Conte, F.; Ramis, G.; Rossetti, I. Evolutionary optimization strategies for Liquid-liquid interaction parameters. Fluid Phase Equilibria 2023, 564, 113599. [Google Scholar] [CrossRef]
- Rao, R.V.; Savsani, V.; Balic, J. Teaching–learning-based optimization algorithm for unconstrained and constrained real-parameter optimization problems. Eng. Optim. 2012, 44, 1447–1462. [Google Scholar] [CrossRef]
- Satapathy, S.; Naik, A. Social group optimization (SGO): A new population evolutionary optimization technique. Complex Intell. Syst. 2016, 2, 173–203. [Google Scholar] [CrossRef]
- Xie, X.F.; Zhang, W.J. Solving engineering design problems by social cognitive optimization. In Proceedings of the Genetic and Evolutionary Computation—GECCO 2004: Genetic and Evolutionary Computation Conference, Seattle, WA, USA, 26–30 June 2004; Proceedings Part I. Springer: Cham, Swizterland, 2004; pp. 261–262. [Google Scholar]
- Moscato, P.; Cotta, C. A gentle introduction to memetic algorithms. In Handbook of Metaheuristics; Springer: Cham, Switzerland, 2003; pp. 105–144. [Google Scholar]
- Cui, Z.; Xu, Y. Social emotional optimisation algorithm with Levy distribution. Int. J. Wirel. Mob. Comput. 2012, 5, 394–400. [Google Scholar] [CrossRef]
- Askari, Q.; Younas, I.; Saeed, M. Political Optimizer: A novel socio-inspired meta-heuristic for global optimization. Knowl.-Based Syst. 2020, 195, 105709. [Google Scholar] [CrossRef]
- Ayyarao, T.S.; Ramakrishna, N.; Elavarasan, R.M.; Polumahanthi, N.; Rambabu, M.; Saini, G.; Khan, B.; Alatas, B. War strategy optimization algorithm: A new effective metaheuristic algorithm for global optimization. IEEE Access 2022, 10, 25073–25105. [Google Scholar] [CrossRef]
- Dorigo, M.; Maniezzo, V.; Colorni, A. Ant system: Optimization by a colony of cooperating agents. IEEE Trans. Syst. Man Cybern. Part B (Cybern.) 1996, 26, 29–41. [Google Scholar] [CrossRef]
- Karaboga, D. An Idea Based on Honey Bee Swarm for Numerical Optimization; Erciyes University: Kayseri, Türkiye, 2005. [Google Scholar]
- Mirjalili, S.; Mirjalili, S.M.; Lewis, A. Grey wolf optimizer. Adv. Eng. Softw. 2014, 69, 46–61. [Google Scholar] [CrossRef]
- Yang, X.S. A new metaheuristic bat-inspired algorithm. In Nature Inspired Cooperative Strategies for Optimization (NICSO 2010); Springer: Cham, Swizteralnd, 2010; pp. 65–74. [Google Scholar]
- Yang, X.S.; Deb, S. Cuckoo search via Lévy flights. In Proceedings of the 2009 World Congress on Nature & Biologically Inspired Computing (NaBIC), Coimbatore, India, 9–11 December 2009; IEEE: Piscataway, NJ, USA, 2009; pp. 210–214. [Google Scholar]
- Mirjalili, S.; Lewis, A. The whale optimization algorithm. Adv. Eng. Softw. 2016, 95, 51–67. [Google Scholar] [CrossRef]
- Kirkpatrick, S.; Gelatt, C.D., Jr.; Vecchi, M.P. Optimization by simulated annealing. Science 1983, 220, 671–680. [Google Scholar] [CrossRef]
- Rashedi, E.; Nezamabadi-Pour, H.; Saryazdi, S. GSA: A gravitational search algorithm. Inf. Sci. 2009, 179, 2232–2248. [Google Scholar] [CrossRef]
- Farahmandian, M.; Hatamlou, A. Solving optimization problems using black hole algorithm. J. Adv. Comput. Sci. Technol. 2015, 4, 68–74. [Google Scholar] [CrossRef]
- Petwal, H.; Rani, R. An improved artificial electric field algorithm for multi-objective optimization. Processes 2020, 8, 584. [Google Scholar] [CrossRef]
- Zhao, W.; Wang, L.; Zhang, Z. Atom search optimization and its application to solve a hydrogeologic parameter estimation problem. Knowl.-Based Syst. 2019, 163, 283–304. [Google Scholar] [CrossRef]
- Patel, V.K.; Savsani, V.J. Heat transfer search (HTS): A novel optimization algorithm. Inf. Sci. 2015, 324, 217–246. [Google Scholar] [CrossRef]
- Kaveh, A.; Khayatazad, M. A new meta-heuristic method: Ray optimization. Comput. Struct. 2012, 112, 283–294. [Google Scholar] [CrossRef]
- Sun, J.; Feng, B.; Xu, W. Particle swarm optimization with particles having quantum behavior. In Proceedings of the 2004 Congress on Evolutionary Computation (IEEE Cat. No. 04TH8753), Portland, OR, USA, 19–23 June 2004; IEEE: Piscataway, NJ, USA, 2004; Volume 1, pp. 325–331. [Google Scholar]
- Shareef, H.; Ibrahim, A.A.; Mutlag, A.H. Lightning search algorithm. Appl. Soft Comput. 2015, 36, 315–333. [Google Scholar] [CrossRef]
- Azizi, M.; Aickelin, U.; A. Khorshidi, H.; Baghalzadeh Shishehgarkhaneh, M. Energy valley optimizer: A novel metaheuristic algorithm for global and engineering optimization. Sci. Rep. 2023, 13, 226. [Google Scholar] [CrossRef]
- Qais, M.H.; Hasanien, H.M.; Alghuwainem, S.; Loo, K.H. Propagation search algorithm: A physics-based optimizer for engineering applications. Mathematics 2023, 11, 4224. [Google Scholar] [CrossRef]
- Cymerys, K.; Oszust, M. Attraction–repulsion optimization algorithm for global optimization problems. Swarm Evol. Comput. 2024, 84, 101459. [Google Scholar] [CrossRef]
- Su, H.; Zhao, D.; Heidari, A.A.; Liu, L.; Zhang, X.; Mafarja, M.; Chen, H. RIME: A physics-based optimization. Neurocomputing 2023, 532, 183–214. [Google Scholar] [CrossRef]
- Wolpert, D.H.; Macready, W.G. No free lunch theorems for optimization. IEEE Trans. Evol. Comput. 1997, 1, 67–82. [Google Scholar] [CrossRef]
- Hashim, F.A.; Houssein, E.H.; Mabrouk, M.S.; Al-Atabany, W.; Mirjalili, S. Henry gas solubility optimization: A novel physics-based algorithm. Future Gener. Comput. Syst. 2019, 101, 646–667. [Google Scholar] [CrossRef]
- Linder, E.V. Mapping the cosmological expansion. Rep. Prog. Phys. 2008, 71, 056901. [Google Scholar] [CrossRef]
- Schweizer, F. Colliding and merging galaxies. Science 1986, 231, 227–234. [Google Scholar] [CrossRef] [PubMed]
- Peale, S. Orbital resonances in the solar system. In Annual Review of Astronomy and Astrophysics; (A76-46826 24-90); Annual Reviews, Inc.: Palo Alto, CA, USA, 1976; Volume 14, pp. 215–246. [Google Scholar]
- Wu, G.; Mallipeddi, R.; Suganthan, P. Problem Definitions and Evaluation Criteria for the CEC 2017 Competition and Special Session on Constrained Single Objective Real-Parameter Optimization; Technical Report; Nanyang Technology University: Singapore, 2016; pp. 1–18. [Google Scholar]
- Sowmya, R.; Premkumar, M.; Jangir, P. Newton-Raphson-based optimizer: A new population-based metaheuristic algorithm for continuous optimization problems. Eng. Appl. Artif. Intell. 2024, 128, 107532. [Google Scholar] [CrossRef]
- Luan, T.M.; Khatir, S.; Tran, M.T.; De Baets, B.; Cuong-Le, T. Exponential-trigonometric optimization algorithm for solving complicated engineering problems. Comput. Methods Appl. Mech. Eng. 2024, 432, 117411. [Google Scholar] [CrossRef]
- Xue, J.; Shen, B. Dung beetle optimizer: A new meta-heuristic algorithm for global optimization. J. Supercomput. 2023, 79, 7305–7336. [Google Scholar] [CrossRef]
- Chopra, N.; Ansari, M.M. Golden jackal optimization: A novel nature-inspired optimizer for engineering applications. Expert Syst. Appl. 2022, 198, 116924. [Google Scholar] [CrossRef]
- Dhiman, G.; Kumar, V. Seagull optimization algorithm: Theory and its applications for large-scale industrial engineering problems. Knowl.-Based Syst. 2019, 165, 169–196. [Google Scholar] [CrossRef]
- Mirjalili, S. SCA: A sine cosine algorithm for solving optimization problems. Knowl.-Based Syst. 2016, 96, 120–133. [Google Scholar] [CrossRef]
- Mirjalili, S. Moth-flame optimization algorithm: A novel nature-inspired heuristic paradigm. Knowl.-Based Syst. 2015, 89, 228–249. [Google Scholar] [CrossRef]
- Derrac, J.; García, S.; Molina, D.; Herrera, F. A practical tutorial on the use of nonparametric statistical tests as a methodology for comparing evolutionary and swarm intelligence algorithms. Swarm Evol. Comput. 2011, 1, 3–18. [Google Scholar] [CrossRef]
- Hussain, K.; Mohd Salleh, M.N.; Cheng, S.; Shi, Y. Metaheuristic research: A comprehensive survey. Artif. Intell. Rev. 2019, 52, 2191–2233. [Google Scholar] [CrossRef]
- Kumar, A.; Wu, G.; Ali, M.Z.; Mallipeddi, R.; Suganthan, P.N.; Das, S. A test-suite of non-convex constrained optimization problems from the real-world and some baseline results. Swarm Evol. Comput. 2020, 56, 100693. [Google Scholar] [CrossRef]
- Liu, C.; Zhang, D.L.W. Crown Growth Optimizer: An Efficient Bionic Meta-Heuristic Optimizer and Engineering Applications. Mathematics 2024, 12, 2343. [Google Scholar] [CrossRef]
- Easwarakhanthan, T.; Bottin, J.; Bouhouch, I.; Boutrit, C. Nonlinear minimization algorithm for determining the solar cell parameters with microcomputers. Int. J. Sol. Energy 1986, 4, 1–12. [Google Scholar] [CrossRef]
Disclaimer/Publisher’s Note: The statements, opinions and data contained in all publications are solely those of the individual author(s) and contributor(s) and not of MDPI and/or the editor(s). MDPI and/or the editor(s) disclaim responsibility for any injury to people or property resulting from any ideas, methods, instructions or products referred to in the content. |
© 2025 by the authors. Licensee MDPI, Basel, Switzerland. This article is an open access article distributed under the terms and conditions of the Creative Commons Attribution (CC BY) license (https://creativecommons.org/licenses/by/4.0/).

