1. Introduction
In recent years, the widespread usage of digital financial services has brought remarkable convenience and popularity to us all, but it has also led to increasingly sophisticated forms of online banking fraud and financial cybercrimes [
1,
2]. As mobile device users transition to online banking, real-time immediate (on-time) payments, and interconnected transaction banking platforms, malicious actors have exploited system vulnerabilities, which led to an urgent need for intelligent, responsive, and privacy-conscious fraud detection systems.
Traditional fraud detection methods mostly rely on supervised learning algorithms, such as Support Vector Machines (SVM), Decision Trees, and ensemble models including Random Forests [
3]. These algorithms are trained on labelled transaction data to distinguish between legitimate and fraudulent activities. However, this paradigm poses several challenges [
4]. For example, financial fraud has a severe class imbalance that hinders the learning process due to its uncommon occurrence in society. Also, centralizing sensitive financial data for model training introduces substantial risks regarding data leakage, non-compliance with data protection regulations, such as the UK’s May 2018 General Data Protection Regulation (GDPR), and tends to reduce trust among organizations.
To address such challenging financial problems, this study proposes a decentralized anomaly detection approach. So, instead of sharing data or model parameters, each institution trains an unsupervised deep autoencoder locally to detect fraud based on reconstruction error. This architecture enables fraud detection without the need to expose raw data externally, which results in protecting institutional privacy boundaries and aligning with compliance requirements and data privacy regulations.
Further, interpretability remains a critical factor in real-world fraud detection systems. Stakeholders in financial institutions require not only reliable predictions, but also insights into how those predictions are made. This work incorporates explainability tools, such as confusion matrices, reconstruction error distributions, ROC curves, and correlation heatmaps, to facilitate transparent decision making and support compliance audits.
Furthermore, the complexity of fraud detection has been amplified by the diversity of money transaction patterns across financial entities [
5,
6]. Fraud behaviors can vary significantly between user demographics and operational environments. To evaluate the robustness of the proposed model under various real-world conditions, two well-recognized (trusted) datasets have been used: (1) a publicly available credit card transaction dataset; (2) a synthetic banking dataset from the NeurIPS 2022 challenge.
The key contributions of this research study are:
a decentralized, privacy-respecting anomaly detection framework in which each institution independently trains its model without exchanging its data;
the application of deep autoencoders to detect fraud in highly imbalanced and/or unlabelled online banking transaction environments;
an evaluation process that includes threshold sensitivity analysis, ROC and PR curves, confusion matrices, and reconstruction error distributions, which can be used for detecting the model performance and operational interpretability.
Overall, the research study, with the explained theoretical and practical components, presents a robust, ethical, and scalable online banking approach to modern financial cybercrime and fraud detection for balancing performance, privacy, and interpretability.
2. Related Work
The rapid expansion of digital financial services has significantly raised concerns over fraud detection for both scholarly research and professional practices [
6]. As fraud tactics become more sophisticated, the need for detection frameworks that provide accuracy, interpretability, scalability, and compliance with data protection laws has become increasingly urgent. Machine learning models have long been used for automating fraud detection systems, but such traditional models trained in centralized environments have important limitations [
7]. These include the difficulty of managing highly imbalanced datasets, the risk of exposing sensitive user data while training such traditional models, and limited transparency in how decisions are made using such models.
Traditional fraud detection model performance and limitations led to a shift toward more privacy-aware and decentralized machine learning (DML) frameworks. These DML models allow institutions to train fraud detection algorithms locally, which eliminates the need to share customer data across organizational boundaries [
7]. At the same time, there has been increasing emphasis on explainable systems [
8]. Financial professionals, auditors, and regulatory bodies require not only reliable results but also clarity on how such results are generated using artificial intelligence (AI) techniques.
2.1. Traditional Models for Financial Fraud Detection
Financial fraud detection has historically relied on rule-based systems, where expert-defined thresholds, policies and manual logic rules are used in order to flag suspicious activities. While these systems worked well for known fraud signatures, they lacked adaptability against evolving fraud tactics and had limited scalability. This limitation prompted a shift towards automated machine learning models trained on transactional data to identify anomalous patterns.
Supervised machine learning techniques, such as SVM, Decision Trees, Logistic Regression, Random Forests, and Neural Networks, have become widely used for classifying financial transactions [
8]. These models are used to learn from labelled datasets that contain both legitimate and fraudulent examples. They analyze input features extracted from transaction metadata, user profiles, and behavioral patterns to identify potential anomalies. Each method has its strengths. SVMs are efficient in high-dimensional settings, while Decision Trees and Random Forests provide interpretability and robust accuracy performance. Deep learning models, particularly fully connected feedforward neural networks, are capable of modeling complex, nonlinear interactions between features. However, their interpretability is limited, making them less suitable in environments where transparency is a regulatory requirement.
A major challenge encountered in fraud detection is class imbalance [
9]. Fraudulent transactions usually constitute less than 1% of all records, which results in fraud detection models that are biased toward predicting the majority class. This often leads to high accuracy but poor recall for fraud cases. To mitigate this, several strategies have been adopted [
4]. Data-level techniques, such as Synthetic Minority Oversampling Technique (SMOTE) and Adaptive Synthetic Sampling (ADASYN), artificially increase the number of fraud samples by generating realistic synthetic data points. Alternatively, under sampling techniques reduce the majority class size to balance the dataset, though there is a chance of losing valuable information.
Algorithmic solutions include cost-sensitive learning where misclassification penalties are adjusted, and ensemble learning methods, such as bagging and boosting, are used to aggregate predictions from multiple models to improve generalization. Recent hybrid methods combining both data balancing and algorithm enhancements have demonstrated improved performance on benchmark datasets. Further, model performance is commonly evaluated using metrics, such as Precision, Recall, F1-score, ROC-AUC, and PR-AUC [
9]. In fraud detection, Recall is often prioritized to ensure that as many fraudulent activities as possible are flagged, even if it comes at the cost of higher false positives. The ROC and PR curves provide a more reliable performance outcome when class distributions are skewed.
While traditional models struggle with data imbalance and lack transparency, newer methods address privacy, scalability, and interpretability, which make modern models more suited to the current and future financial ecosystems.
Table 1 summarizes prominent studies in fraud detection, which demonstrate the progression from traditional machine learning classifiers to more advanced, privacy-conscious, and interpretable models.
2.2. Decentralized and Privacy-Conscious Learning Models
The growth in data privacy regulations, such as the UK’s May 2018 GDPR, has created new challenges for fraud detection systems that traditionally rely on centralized data collection. Sharing raw financial data across institutions or digital platforms is no longer feasible in many domains [
12]. As a result, researchers and professionals have begun exploring privacy-conscious and decentralized approaches that allow data to remain within its source domain while still enabling effective model training.
In decentralized machine learning (DML) paradigms, fraud detection models are trained independently on each node or institution’s data without transferring the raw data [
8]. This setup recognizes data sovereignty and minimizes regulatory exposure. In some implementations, only model outputs or metrics are shared to simulate collaboration without revealing sensitive information. As such, privacy-aware designs provide a practical balance between performance and confidentiality.
Several studies have proposed autoencoder-based frameworks where anomaly detection is performed locally using reconstruction errors [
7]. Others have used distributed graph-based techniques to model relationships between transactions while preserving data isolation [
13]. These methods have demonstrated promising results, especially in scenarios with heterogeneous or institution-specific data patterns. However, decentralized methods come with their own set of challenges. These include data inconsistencies across nodes, the absence of a global coordination mechanism, and potential issues with convergence and synchronization. The lack of centralized control may result in variability in model quality, especially when the data across institutions differs significantly in scale or structure. Nevertheless, the promise of privacy preservation continues to make decentralized models an active area of research in fraud analytics and explanatory analysis.
2.3. Explainable AI in Financial Fraud Detection
As machine learning methods become more integral to financial decision making, the demand for explainability has grown. Fraud detection, in particular, requires models whose predictions can be interpreted and justified [
4]. Financial analysts, auditors, and regulators must be able to understand why a transaction was flagged before taking action. This is not only important for transparency but also necessary for compliance in regulated industries.
Explainable Artificial Intelligence (XAI) provides techniques that enhance the interpretability of otherwise opaque models. Popular methods such as SHAP (Shapley Additive exPlanations) and LIME (Local Interpretable Model-agnostic Explanations) provide insights into which features most influenced a particular prediction [
13,
14]. These tools can be applied to both supervised and unsupervised models and help bridge the gap between model performance and decision accountability.
In the context of privacy-aware systems, explainability must be achieved without compromising data confidentiality. This requires careful integration of interpretability tools that do not expose sensitive feature values or individual-level data. Recent studies have shown that local explainability can still be implemented within decentralized frameworks by analyzing model outputs in conjunction with protected summary statistics [
13]. Further, visualization tools, such as ROC curves, confusion matrices, error distribution plots, and feature correlation heatmaps, are increasingly used in published work to present results in a manner that supports interpretability [
14]. These visual aids help stakeholders grasp the strengths and weaknesses of a model at a glance, promoting better decision making and model trust.
In conclusion, modern fraud detection is not solely concerned with performance. It must also satisfy expectations of transparency, fairness, and compliance. By incorporating explainable techniques within secure machine learning frameworks, it is possible to build systems that are not only effective but also trustworthy for detecting fraudulent activities.
3. Material and Methods
A decentralized anomaly detection framework has been applied as the research methodology with the aim of identifying fraudulent banking transactions in scenarios where raw data cannot be centralized due to financial service privacy or institutional constraints, using decentralized learning (DML), which recognizes Federated Learning (FL) concepts [
15,
16]. The methodology is designed to emulate real-world banking conditions, where institutions maintain data autonomy and collaborate only at the insight level. This system emphasizes privacy preservation, scalability, and adaptability to heterogeneous data environments. The following sections detail the research study framework, applied methods and workflow stages, which include dataset integration, preprocessing procedures, model design, decentralized model training setup, evaluation metrics, and reproducibility infrastructure.
3.1. Dataset Description
To create a realistic environment for evaluating decentralized fraud detection methods, this study draws on two publicly available datasets [
12,
17]. Each dataset is treated as originating from an independent institutional source to emulate online banking practice conditions found within real-world financial organizations that operate under data privacy constraints.
The first dataset utilized is the widely referenced Credit Card Fraud Detection dataset provided by the Université Libre de Bruxelles [
12]. It consists of 284,807 anonymized credit card transactions collected over a two-day period in Europe. Each record is represented by thirty numerical features that have been transformed using Principal Component Analysis (PCA), a technique applied to protect sensitive information while retaining important variance patterns. The target variable, labelled as “Class”, indicates whether a transaction is fraudulent (1) or legitimate (0). This dataset is especially challenging for fraud detection systems due to its severe class imbalance; fraudulent transactions make up less than 0.2% of the total data, which complicates the learning process for many traditional classification algorithms.
The second dataset, titled Bank Account Fraud, was sourced from the NeurIPS 2022 competition [
17]. It was created through collaboration among researchers including Sérgio Jesus, José Pombal, Duarte Alves, André F. Cruz, Pedro Saleiro, Rita P. Ribeiro, João Gama, and Pedro Bizarro. Unlike the first dataset, this one is synthetic in origin but generated using domain-specific simulations that closely replicate real-world online banking activity. It contains over six million transaction records, distributed across six structured CSV files. These records include a rich set of features, such as user demographics, behavioral traits, and device metadata. Fraudulent instances are flagged using indicators, such as “fraud_bool” or “is_fraud”, which are inconsistently labelled across different files and must be standardized as part of the data preprocessing pipeline.
Despite its synthetic nature, the NeurIPS dataset provides a high-fidelity testing ground for evaluating fraud detection models under the type of complex and large-scale conditions that financial institutions routinely face. The combination of the two datasets allows for a dual-node simulation that preserves the structural independence and privacy of institutional data, while enabling comparative evaluation across differing bank transactional contexts [
12,
17].
3.2. Data Preprocessing
To align the structure and quality of both datasets, a comprehensive preprocessing strategy was implemented [
18]. This step was essential to ensure consistency in feature representation to enable effective model training across independent data sources. In the NeurIPS Bank Account Fraud dataset, several features were categorical in nature and attributes, such as employment status, device operating system, and housing status, were transformed into a numerical format using label encoding. This conversion allowed the model to interpret categorical variables as part of the learning process without introducing bias from arbitrary ordering. For numerical features, Z-score normalization was applied. This technique adjusted the values of variables, including transaction amount, time, and behavioral indicators, to have a mean of zero and a standard deviation of one. Such normalization was critical in ensuring that no single feature disproportionately influenced the learning process due to differences in scale or units of measurement.
Indeed, data quality checks were conducted to remove any records containing missing or infinite values. The presence of such values can introduce instability in training by causing undefined gradients or numerical errors. Following this cleaning step, the datasets were filtered to retain only those attributes that were shared and numeric across both sources [
19]. This ensured that the models could be trained independently on structurally compatible inputs.
Fraud indicators within the datasets, which varied in naming conventions, such as fraud_bool or is_fraud, were standardized into a single binary label column named Class. This column consistently recognized fraudulent transactions with a value of one and legitimate transactions with a value of zero [
18]. Non-essential metadata, including transaction identifiers, timestamps, and unique user IDs, was excluded from the final datasets to focus the model’s attention on behavioral and transactional patterns rather than attributes that may introduce data leakage or overfitting [
19]. The outcome of this preprocessing pipeline was a pair of harmonized datasets, cleaned and transformed to support robust and fair anomaly detection across two decentralized nodes.
3.3. Autoencoder Model Architecture
In this study, an unsupervised deep autoencoder was applied as the primary anomaly detection mechanism due to its proven capacity to learn compact representations of normal transaction patterns and flag deviations without reliance on extensive labelled data [
9,
20]. This approach is especially advantageous in financial fraud detection, where fraudulent samples are significantly outnumbered by legitimate ones, which makes supervised techniques less effective.
An autoencoder consists of two main components: the encoder, which compresses the high-dimensional input features into a low-dimensional latent space, and the decoder, which attempts to reconstruct the original input from this compressed representation [
9,
21]. The discrepancy between the input and its reconstruction serves as an anomaly score by reflecting the degree to which the transaction deviates from the learned normal [
22,
23].
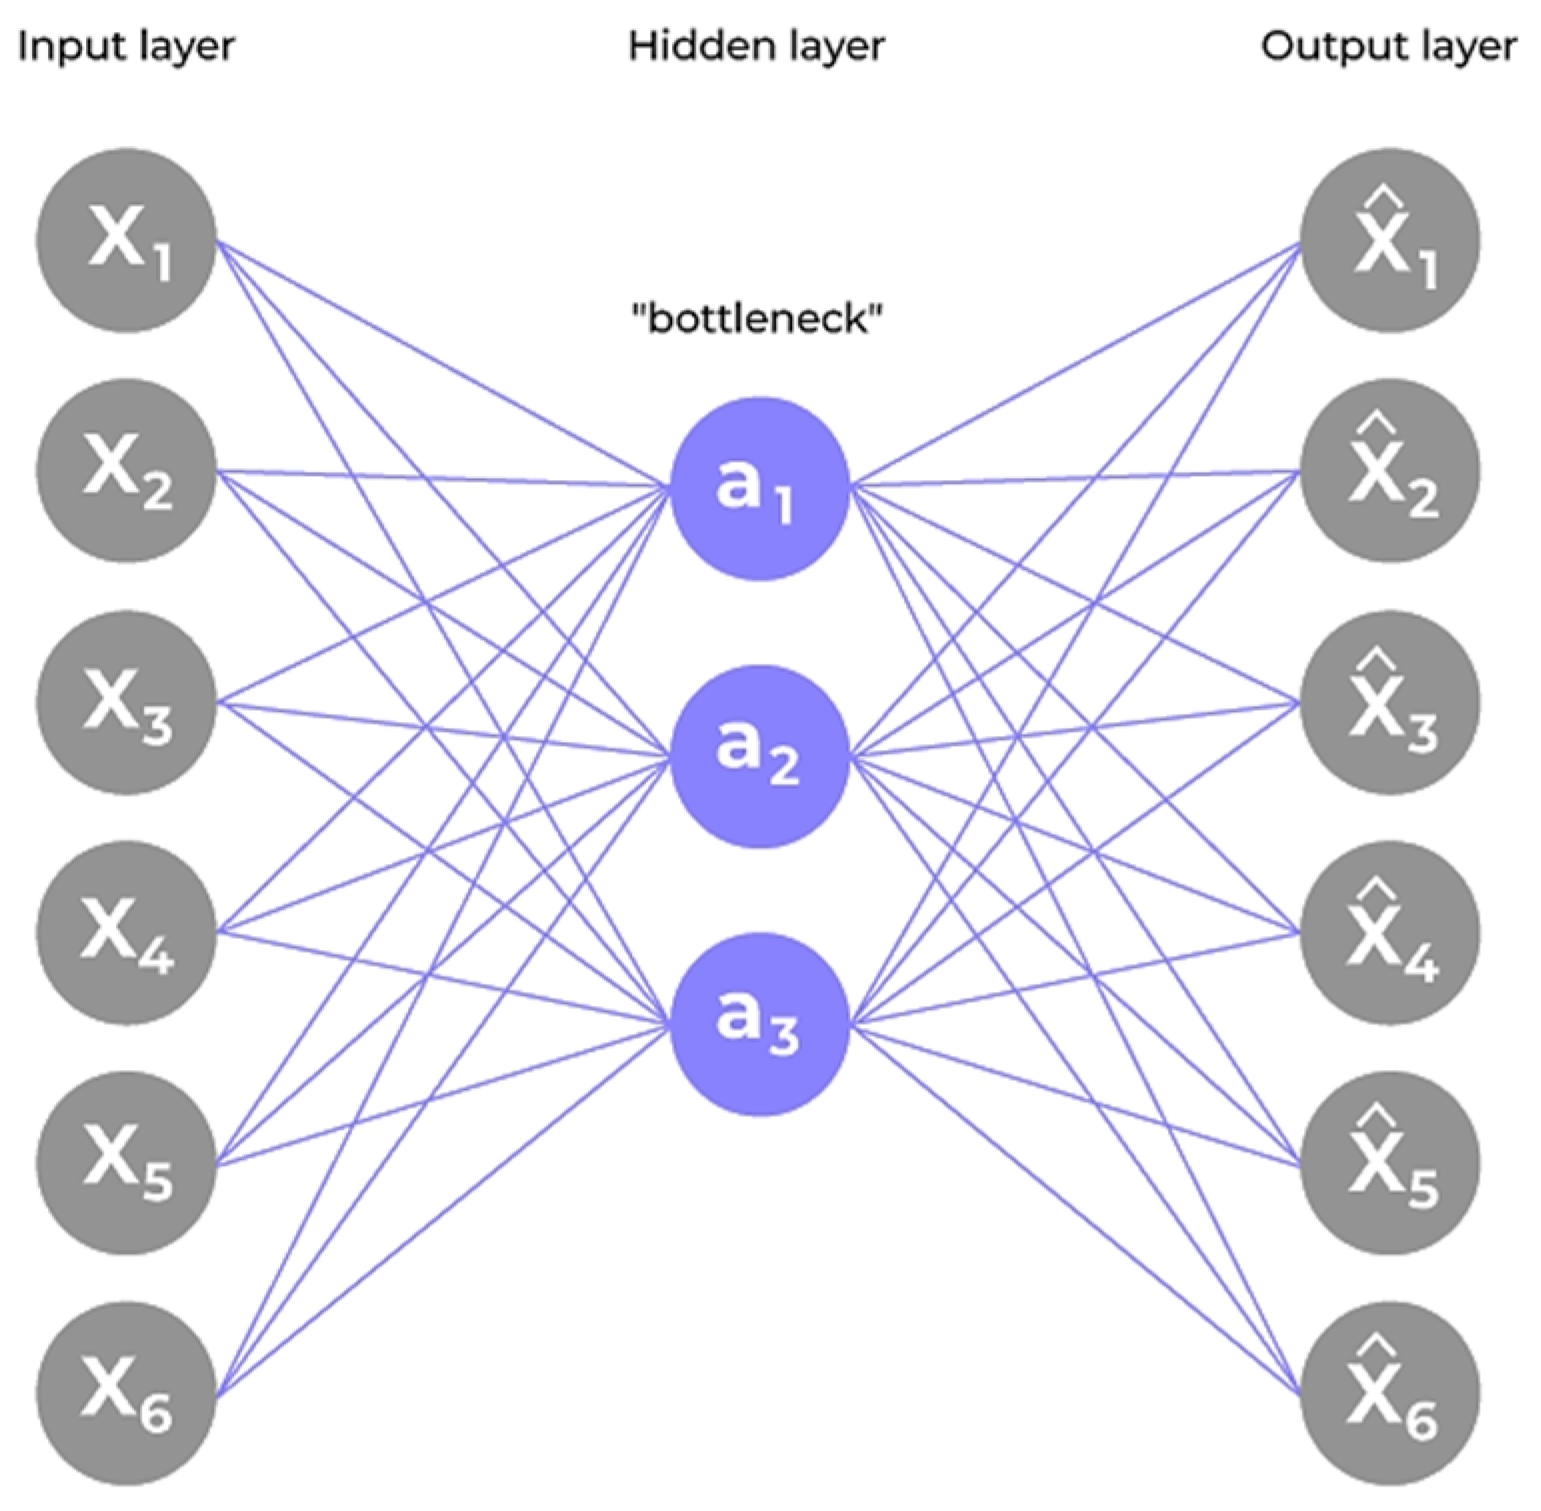
The autoencoder architecture applied in this research study is shown in
Figure 1. It illustrates a symmetric structure with three primary layers in both the encoder and decoder. The encoder comprises fully connected layers of 16, 8, and 4 neurons, respectively, applying the Rectified Linear Unit (ReLU) activation function [
9,
20]. The decoder mirrors this configuration in reverse order by culminating in a linear output layer to ensure real-valued reconstruction.
The input data is first compressed by the encoder into a smaller latent representation, and then reconstructed by the decoder to closely match the original input [
24,
25]. The bottleneck layer at the center of the model captures the key patterns that describe normal transaction behavior.
Mathematically, the reconstruction process of the autoencoder can be represented by the following formulation:
where
denotes the original input vector encapsulating the transaction features, and
represents the reconstructed output vector generated by the network. The function
corresponds to the encoder, which compresses the input into a lower-dimensional latent space, while
denotes the decoder that reconstructs the input from the latent representation [
24]. Both components are governed by their respective learnable parameters,
and
. The primary objective of training the autoencoder is to minimise the reconstruction loss, typically the mean squared error (MSE) between
and
, thereby enabling the detection of anomalies through deviations in reconstruction fidelity.
The autoencoder is trained to minimize the reconstruction loss, quantified using the MSE between the original input and its reconstruction:
Here, and refer to the elements of the original and reconstructed vectors, respectively, and n denotes the number of input features.
This architectural and mathematical formulation ensures that the autoencoder becomes highly attuned to the normal distribution of transactional data. Consequently, when a transaction deviates significantly from this learned pattern, resulting in a large reconstruction error, it is flagged as anomalous, potentially indicating fraud activity [
25]. The compact latent representation also enhances the model’s robustness by enabling generalization across both real and synthetic datasets used in this research framework [
26].
3.4. Decentralized Simulation Framework
To replicate the privacy and operational constraints frequently encountered in financial institutions, this study applied a decentralized simulation framework. As in many banking environments, sensitive data cannot be pooled into a centralized system due to legal and regulatory limitations. This framework aimed to reflect that real-world scenario by ensuring that each dataset remained fully local and isolated during model training.
In this configuration, the two datasets used in the study, the Credit Card Fraud Detection dataset and the NeurIPS Bank Account Fraud dataset, were treated as separate entities, each representing a distinct financial institution. Instead of combining the datasets or sharing insights between them, each one was used to independently train its own anomaly detection model [
27]. This allows a realistic assessment of how well a model can perform when only local data is available and no external information is incorporated.
The design intentionally avoided any form of centralized aggregation or parameter sharing. There was no exchange of model weights, gradients, or training outputs. Each model was trained using its respective dataset, with no communication or synchronization across nodes [
27]. This strict isolation ensured that the simulation maintained high standards of data privacy and closely mirrored the constraints faced by real institutions operating under privacy regulations, such as the GDPR and Data Protection Act 1998.
Although no global model was constructed, the decentralized approach provided valuable insights. By comparing the performance of models trained on different datasets, the study examined how variations in data scale, structure, and quality affect anomaly detection outcomes [
27,
28]. The simulation also demonstrated the potential and limitations of relying solely on local models in scenarios where data sharing is restricted. This approach is highly applicable to financial environments where institutions must operate independently and still achieve effective fraud detection. It provides both a practical and ethically sound alternative to traditional centralized systems and demonstrates how institutions can implement privacy-aware anomaly detection without compromising regulatory compliance or operational efficiency.
3.5. Evaluation Strategy
The evaluation process served as a vital phase in this study, as it aimed at thoroughly measuring the effectiveness of the anomaly detection model trained using decentralized machine learning conditions. To ensure a comprehensive understanding of performance, the evaluation applied both numerical metrics and visual analysis techniques [
29]. This dual approach provided a balanced perspective on the model’s ability to identify fraudulent behavior in money transactional datasets.
After training was completed independently on each dataset, the reconstruction error was calculated for every transaction. This error was derived by comparing the original transaction vector (X) with its reconstructed version
, as produced by the autoencoder. Specifically, the MSE was used to quantify the difference, using the formula:
where
n denotes the number of features per input sample [
29]. Samples exhibiting higher reconstruction errors were indicative of deviations from the learned representation of legitimate transactional behavior, thereby suggesting potentially fraudulent activity.
To operationalize anomaly detection, a thresholding mechanism was applied based on the distribution of reconstruction errors [
29]. The 98th percentile of the reconstruction errors observed in legitimate transactions was set as the detection point. Transactions producing reconstruction errors greater than this threshold were classified as potentially fraudulent. This choice of high percentile threshold strikes a balance between sensitivity and specificity by favoring the identification of rare anomalies over significant anomalies.
For quantitative validation, the Receiver Operating Characteristic–Area Under Curve (ROC-AUC) score was used as a validation variable [
30]. The ROC-AUC metric is particularly well-suited for imbalanced datasets, such as fraud detection, where the positive class (fraud) constitutes a very small minority. The ROC curve plots the True Positive Rate (TPR) against the False Positive Rate (FPR) across varying threshold settings, where:
Here, TP represents True Positives (correct fraud predictions), FP denotes False Positives (legitimate transactions misclassified as frauds), TN indicates True Negatives (correct non-fraud predictions), and FN stands for False Negatives (fraud cases incorrectly predicted as legitimate). A high ROC-AUC value closer to one (1.0) indicates that the model effectively (100%) separates fraudulent from legitimate transactions.
Further, confusion matrices were constructed to provide a detailed breakdown of classification outcomes [
25]. From the confusion matrix, secondary performance metrics, such as Precision, Recall, and F1-Score, were derived, which indicate the model’s ability to accurately detect fraud without incurring excessive false alarms. These metrics were computed as follows:
Precision reveals how many of the flagged fraud cases were indeed fraudulent, while recall shows how many actual frauds were successfully identified. The F1 score provides a single value that balances both aspects, which shows its reliability in measuring imbalanced data. To further support these quantitative metrics, several visualizations were generated. This includes histograms of reconstruction error distributions, plotted separately for fraudulent and legitimate transactions. Such visual representation offered clear insight into the separation between the two classes and illustrated how the threshold affected classification [
30]. Afterwards, a sensitivity analysis was conducted by testing thresholds at the 95th, 98th, and 99th percentiles. The resulting variations in precision, recall, and F1 score demonstrated the trade-offs involved in choosing a threshold point.
Lastly, the relationship between precision and recall was illustrated using a precision–recall curve, which provided a graphical understanding of the model’s performance under different operating points. This enriched the evaluation by showcasing how well the model maintained balance across these competing objectives.
Together, these methods presented a detailed and balanced evaluation framework [
30]. They ensured not only that the model performed effectively on unseen data but also that its decision-making process could be interpreted, validated, and trusted. This made the anomaly detection model suitable for deployment in real financial environments where accuracy, accountability, and reliability are equally essential.
3.6. Implementation Tools and Reproducibility
All experiments were conducted in Python 3.11 version using standard machine learning and data science libraries [
23,
24]. Data preprocessing was managed using Pandas and Scikit-learn, while model development and training were carried out using TensorFlow and Keras for Python 3.11 [
28]. Visualizations were created using Matplotlib and Seaborn for Python 3.11. The full source code, notebooks, and training logs are publicly accessible through the Figshare website [
31]. This ensures that all findings can be replicated and further extended by future researchers or practitioners.
4. Experiments and Results
The research experimental framework is explained in this section, which simulates a DML financial environment for fraud detection to adhere to data privacy constraints. The decentralized simulation framework was constructed using financial real-world datasets to simulate online banking transactions [
12,
14]. Each dataset was treated as a standalone node, representing an individual financial institution operating independently with its own customer data. Each experimental output is critically evaluated, with emphasis on the underlying patterns observed in fraud detection across these datasets.
4.1. Experimental Setup
To replicate the operational realities of privacy-conscious financial systems, all data remained strictly local to its respective node throughout the study [
10]. At no point were raw data or learned parameters shared across nodes. This strict separation was intended to mirror regulatory limitations commonly enforced under legal frameworks, such as the European Union (EU) Payment Services Directive 2 (PSD2) or GDPR. As such, the setup intentionally avoided any implementation of parameter aggregation or collaborative model fusion methods, including Federated Averaging (FedAvg). Each node trained its model in full isolation from the others, reflecting an extreme but realistic case of decentralized machine learning (DML), where collaboration occurs only through protocol design and not data interchange.
The model selected for each node was a deep autoencoder, a class of unsupervised neural network that has been shown to be particularly well suited for anomaly detection in environments with extreme class imbalance. The autoencoder consisted of an encoder and decoder module with symmetric architecture [
9,
20]. The encoder included three fully connected layers with 16, 8, and 4 neurons, each using the ReLU activation function. The decoder mirrored this structure in reverse order and concluded with a linear output layer, which is suitable for reconstructing real-valued inputs.
Once trained on normal transaction data, the autoencoder produced reconstruction errors by comparing original inputs with their reconstructions. To distinguish between legitimate and potentially fraudulent transactions, a percentile-based thresholding method was applied [
29]. Specifically, the 98th percentile of the reconstruction errors derived from non-fraudulent transactions was chosen as the anomaly threshold. Any transaction with a reconstruction error exceeding this value was flagged as suspicious behavior [
30]. This threshold was selected after conducting a sensitivity analysis comparing 95%, 98%, and 99%, with results showing a trade-off between precision and recall that aligned best at 98% for balanced fraud detection.
Overall, the experimental setup closely simulates the organizational, technical, and legal challenges encountered by financial institutions attempting to detect fraud without compromising customer privacy. It emphasizes the value of isolated anomaly detection models and careful threshold tuning as practical tools for effective and interpretable fraud prevention strategies.
4.2. Receiver Operating Characteristic (ROC) Curve Analysis
To evaluate the discriminative capacity of the autoencoder-based anomaly detection model, the receiver operating characteristic curve has been utilized, as it has been a widely accepted metric in the domain of binary classification, particularly well-suited to contexts involving class imbalance [
10]. The ROC curve represents the trade-off between the True Positive Rate (TPR) and the False Positive Rate (FPR) across a continuum of threshold values, which provides a comprehensive view of the model’s performance under various operational conditions.
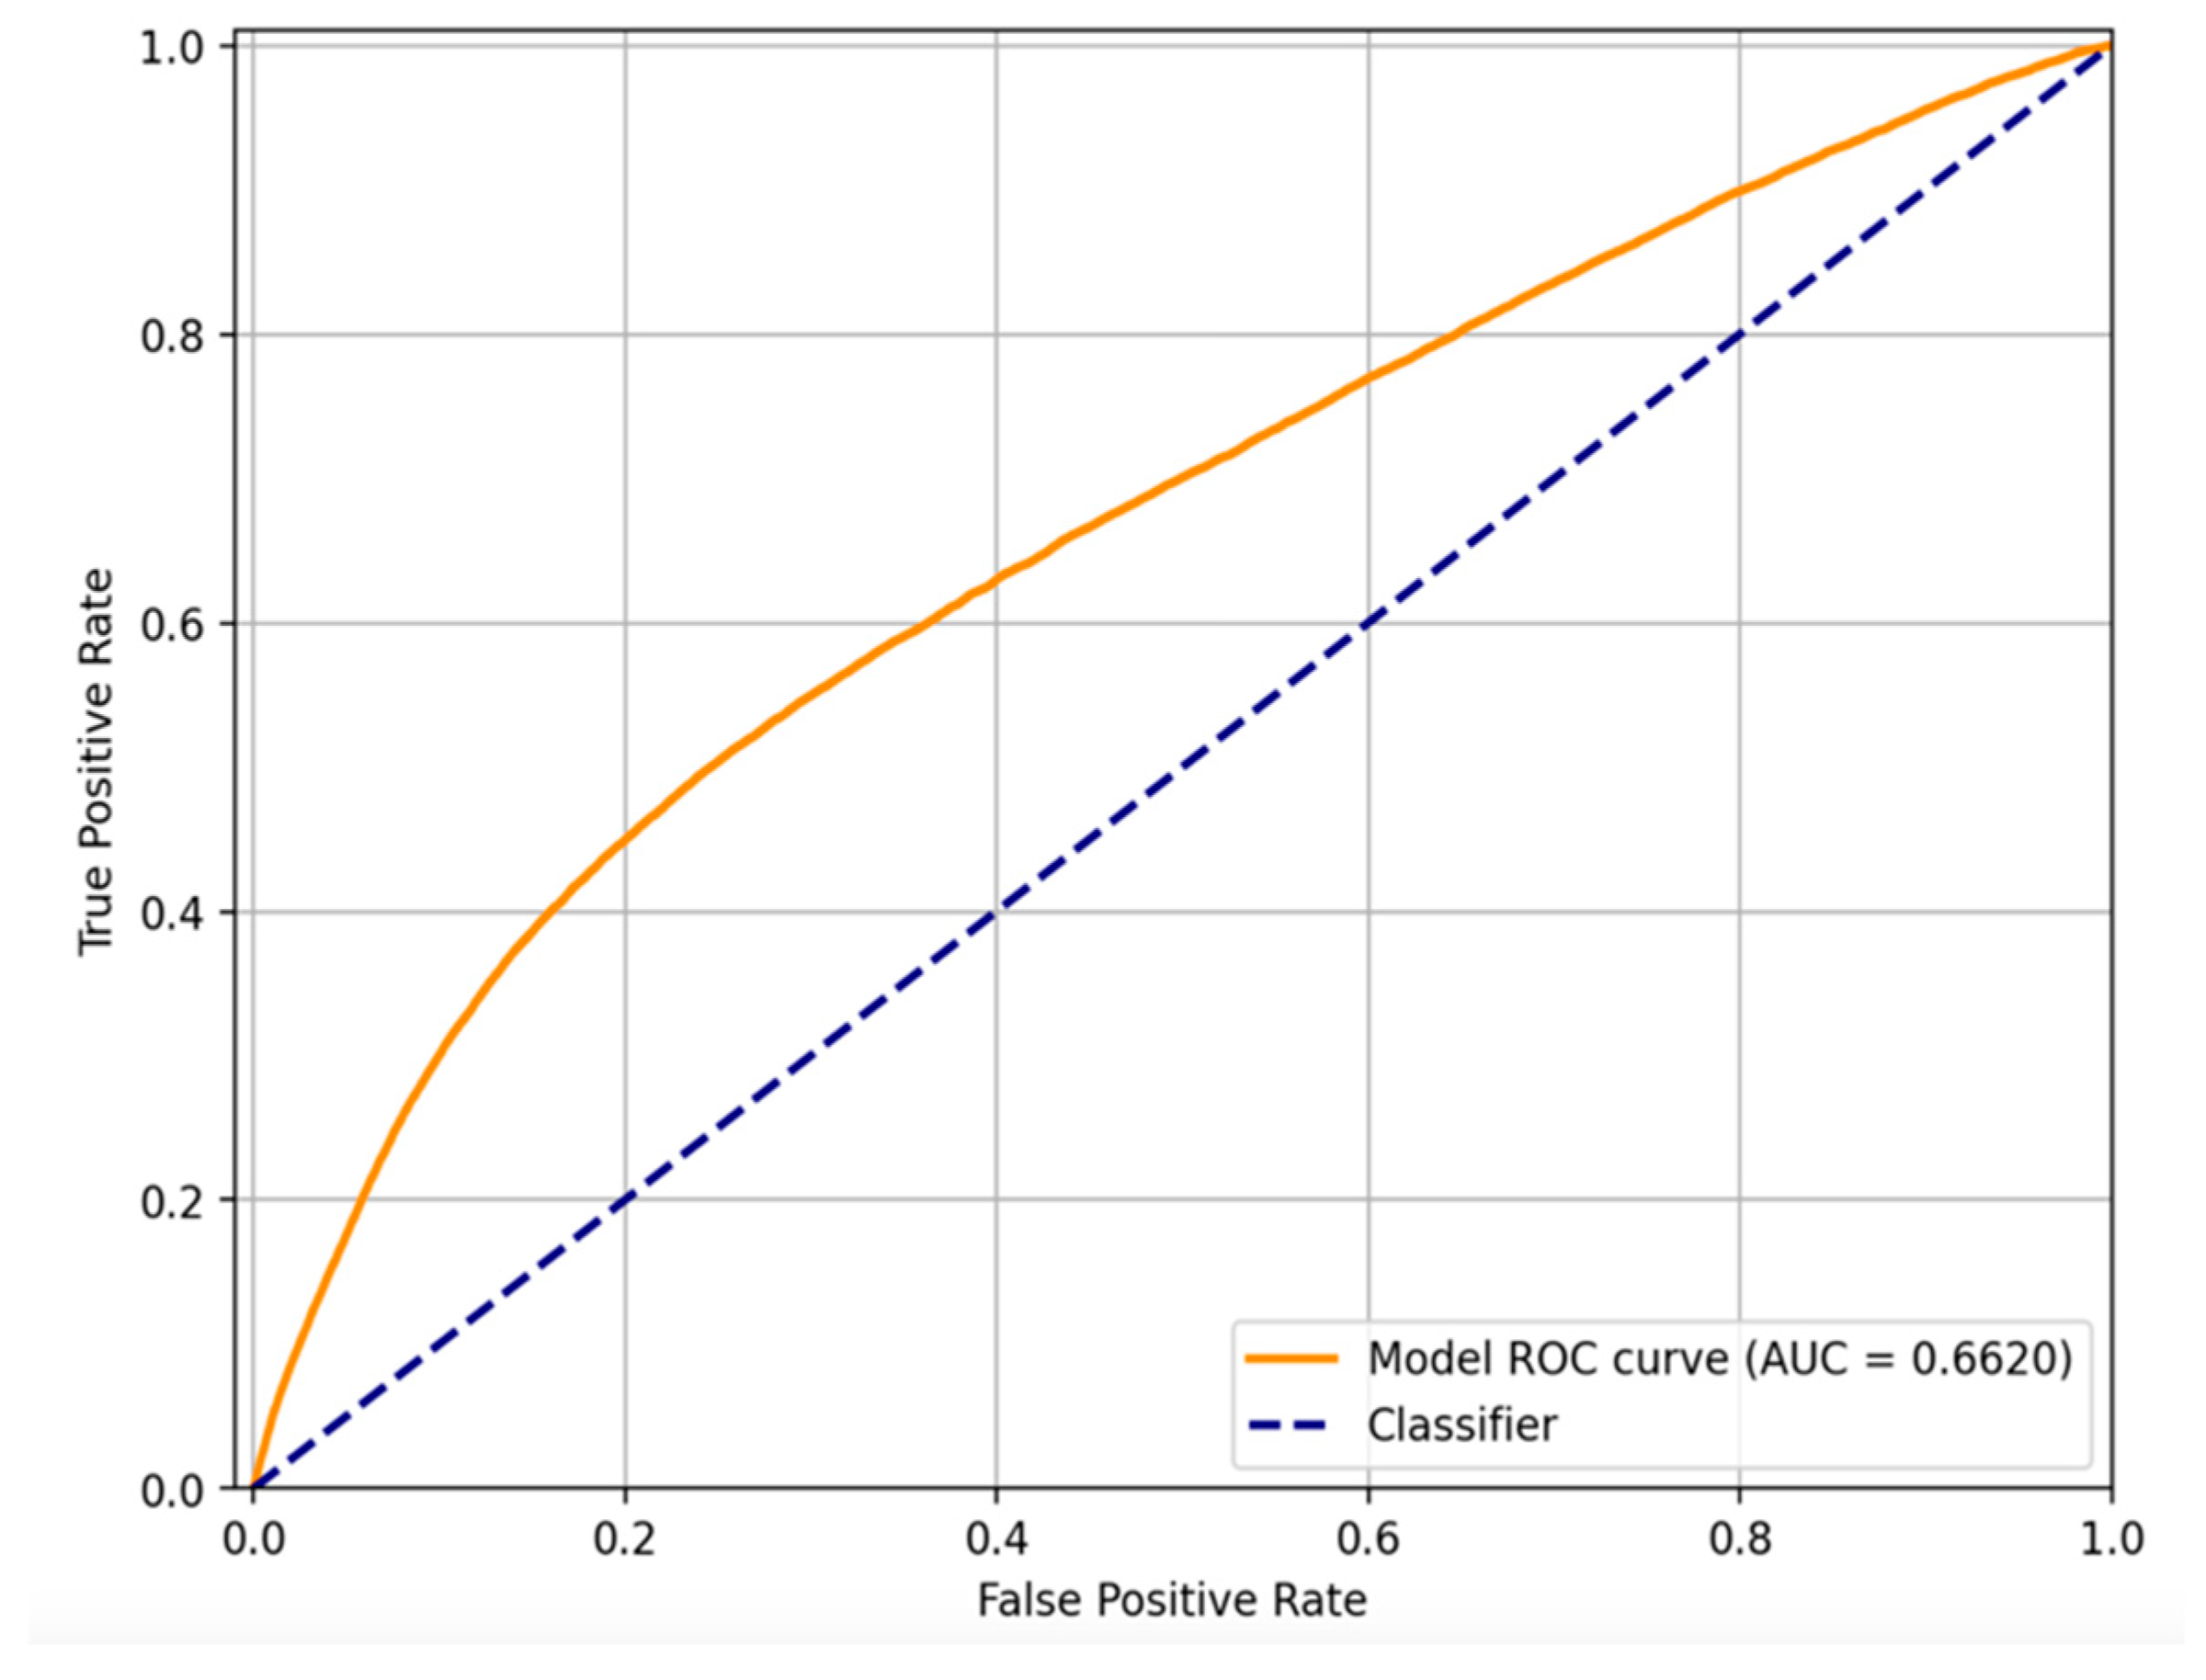
As shown in
Figure 2, the orange curve demonstrates the ROC performance of the autoencoder model trained within our decentralized simulation. The model achieves an Area Under the Curve (AUC) value of 0.6620, indicating a modest yet meaningful capacity to distinguish between fraudulent and legitimate transactions [
10]. Although the AUC value is not close to the ideal score of 1.0, it must be interpreted in the context of extreme class imbalance and the absence of supervised labels during model training. This is particularly relevant for unsupervised learning approaches, where no ground-truth guidance is available during such machine learning practice.
The dashed blue diagonal line in the same figure represents the performance of a random classifier, which effectively guesses class labels without learning from data. This line serves as a baseline reference, where the model exhibits no discriminatory power (i.e., TPR equals FPR at all thresholds). A ROC curve that consistently lies above this diagonal confirms that the autoencoder is, indeed, learning a useful representation of normal versus anomalous transaction patterns, despite the challenging nature of the task.
Further, the ROC curve shape indicates that the model performs best in low-FPR regions, where it is able to identify a significant number of true positives (TP), while maintaining a manageable rate of false alarms. This is of critical importance in financial fraud detection, where false positives translate into operational costs, such as manual review or customer inconvenience, and false negatives lead to undetected fraud losses.
In conclusion, while the ROC-AUC score may appear conservative, it validates the potential of the unsupervised autoencoder in identifying fraudulent behaviors without explicit labels. This sets a foundational performance benchmark that can be further optimized using techniques such as threshold tuning and architectural adjustments.
4.3. Confusion Matrix Analysis
To provide a comprehensive evaluation of the model’s performance, confusion matrices were utilized alongside ROC and Precision–Recall curves. These matrices provide valuable insights by breaking down the classification results into true positives, true negatives, false positives, and false negatives [
30]. This is particularly important in the domain of financial fraud detection, where both false alarms and missed fraud cases carry significant operational and financial implications.
Figure 3 presents the confusion matrix based on the entire testing data using the 98th percentile threshold for anomaly detection. The matrix reveals that the model successfully identified 1,828,447 legitimate transactions and flagged 36,995 of them as fraudulent, which are considered false positives. In parallel, it detected 714 TP fraudulent transactions correctly, while 19,287 FN fraud cases remained undetected (counted as false negatives).
Further, the results demonstrated a critical trade-off observed in many unsupervised anomaly detection systems. The proposed decentralized model shows high specificity in affirming legitimate behavior, but the recall rate for fraud remains relatively low. This is a direct consequence of the severe class imbalance inherent in financial fraud datasets, where legitimate transactions vastly outnumber fraudulent ones. However, the precision (the percentage of predicted frauds that were actually fraud) appears low. This is expected in large-scale real-world datasets with rare fraud occurrences. The confusion matrix also reinforces that the autoencoder learns typical transaction behavior effectively, as seen from the high true negative count. However, its ability to catch rare outliers, particularly fraudulent ones, requires enhancement through either adaptive thresholding, inclusion of domain-specific features, or hybrid modelling.
Lastly, the confusion matrix in
Figure 3 supports the earlier ROC and F1-score analysis. The findings recommend that while the model performs reliably in filtering benign transactions, improvements are necessary to bolster fraud detection sensitivity, especially in the context of critical use cases, such as online banking security and automated fraud investigation systems.
4.4. Reconstruction Error Distribution Analysis
To further support the performance evaluation of the proposed model, the reconstruction error distribution was analyzed to determine how well the autoencoder distinguishes normal transactions from anomalies. This analysis provides visual insight into the fundamental mechanism driving anomaly detection, where a high reconstruction error typically signals behavior that deviates from what the model has learned as legitimate.
Figure 4 presents the reconstruction error distribution compiled from both datasets used in this study. The histogram exhibits the frequency of reconstruction error values across all transactions, distinguishing between legitimate and fraudulent samples.
Likewise,
Figure 4 demonstrates that the most legitimate transactions exhibit very low reconstruction errors, forming a sharp peak near zero. In contrast, fraudulent transactions, although significantly fewer in number, tend to produce higher reconstruction errors. This contrast forms the basis for the anomaly detection logic applied by the autoencoder. A threshold was established at the 98th percentile of the reconstruction errors calculated from legitimate transactions. This threshold, marked by a red dashed vertical line in the figure, is used to classify transactions as potentially fraudulent if their reconstruction error exceeds this boundary.
Further, the visual separation between the two classes confirms that the autoencoder has successfully captured the underlying structure of legitimate behavior [
9]. However, a noticeable overlap still exists between the fraudulent and legitimate distributions. This overlap highlights a common limitation of reconstruction-based detection models; certain fraudulent transactions can closely resemble normal patterns, thereby escaping detection, while some legitimate transactions may exhibit atypical behavior and trigger false alarms.
Furthermore, a key observation is that using a single fixed threshold across both datasets provides a baseline for detecting anomalies but may not fully account for the nuanced differences in distribution shapes and noise levels specific to each dataset. Future research may benefit from implementing adaptive thresholding techniques that dynamically respond to dataset-specific characteristics.
In conclusion, the reconstruction error distribution analysis demonstrates that the proposed decentralized model has the capability to differentiate normal and abnormal behaviors with reasonable precision. This analysis not only confirms the feasibility of using autoencoders in fraud detection but also enhances the interpretability of the model’s decisions, supporting its application in banking environments where privacy constraints and class imbalance are critical concerns.
4.5. Precision–Recall Curve Evaluation
In the context of highly imbalanced datasets, such as those commonly encountered in financial fraud detection, the Precision–Recall (PR) curve serves as a particularly effective evaluation metric [
9,
30]. While Receiver Operating Characteristic (ROC) curves are valuable for measuring the general discriminative ability of a model, they may overestimate performance in cases where negative samples vastly outnumber positives. The PR curve, by contrast, provides a more focused evaluation of the model’s ability to correctly identify rare positive instances, in this case, fraudulent bank transactions.
Figure 5 presents the PR curve for the anomaly detection model applied across both datasets. The curve demonstrates the trade-off between precision (the proportion of predicted fraud cases that are actual fraud) and recall (the proportion of actual fraud cases that are successfully identified) at various classification thresholds.
The area under the Precision–Recall curve (PR-AUC) is recorded as 0.0124, which indicates the inherent difficulty in achieving both high precision and recall within a highly skewed class distribution. This low PR-AUC is not unexpected given the rare occurrence of fraud events in the dataset. Nonetheless, it highlights the real-world challenge of developing anomaly detection systems that maintain high sensitivity without producing an unmanageable number of false positives (FP).
Despite the modest PR-AUC, the inclusion of this metric provides essential context for evaluating model performance beyond accuracy or ROC-AUC scores. It underscores the importance of continuing to refine threshold selection methods and exploring hybrid techniques that can improve sensitivity to true fraud cases while preserving operational efficiency.
To conclude, the PR-AUC complements other performance visualizations and reinforces the conclusion that while the model is proficient at filtering out legitimate activity, enhancements are needed to boost its effectiveness in consistently identifying fraudulent behavior under extreme class imbalance conditions.
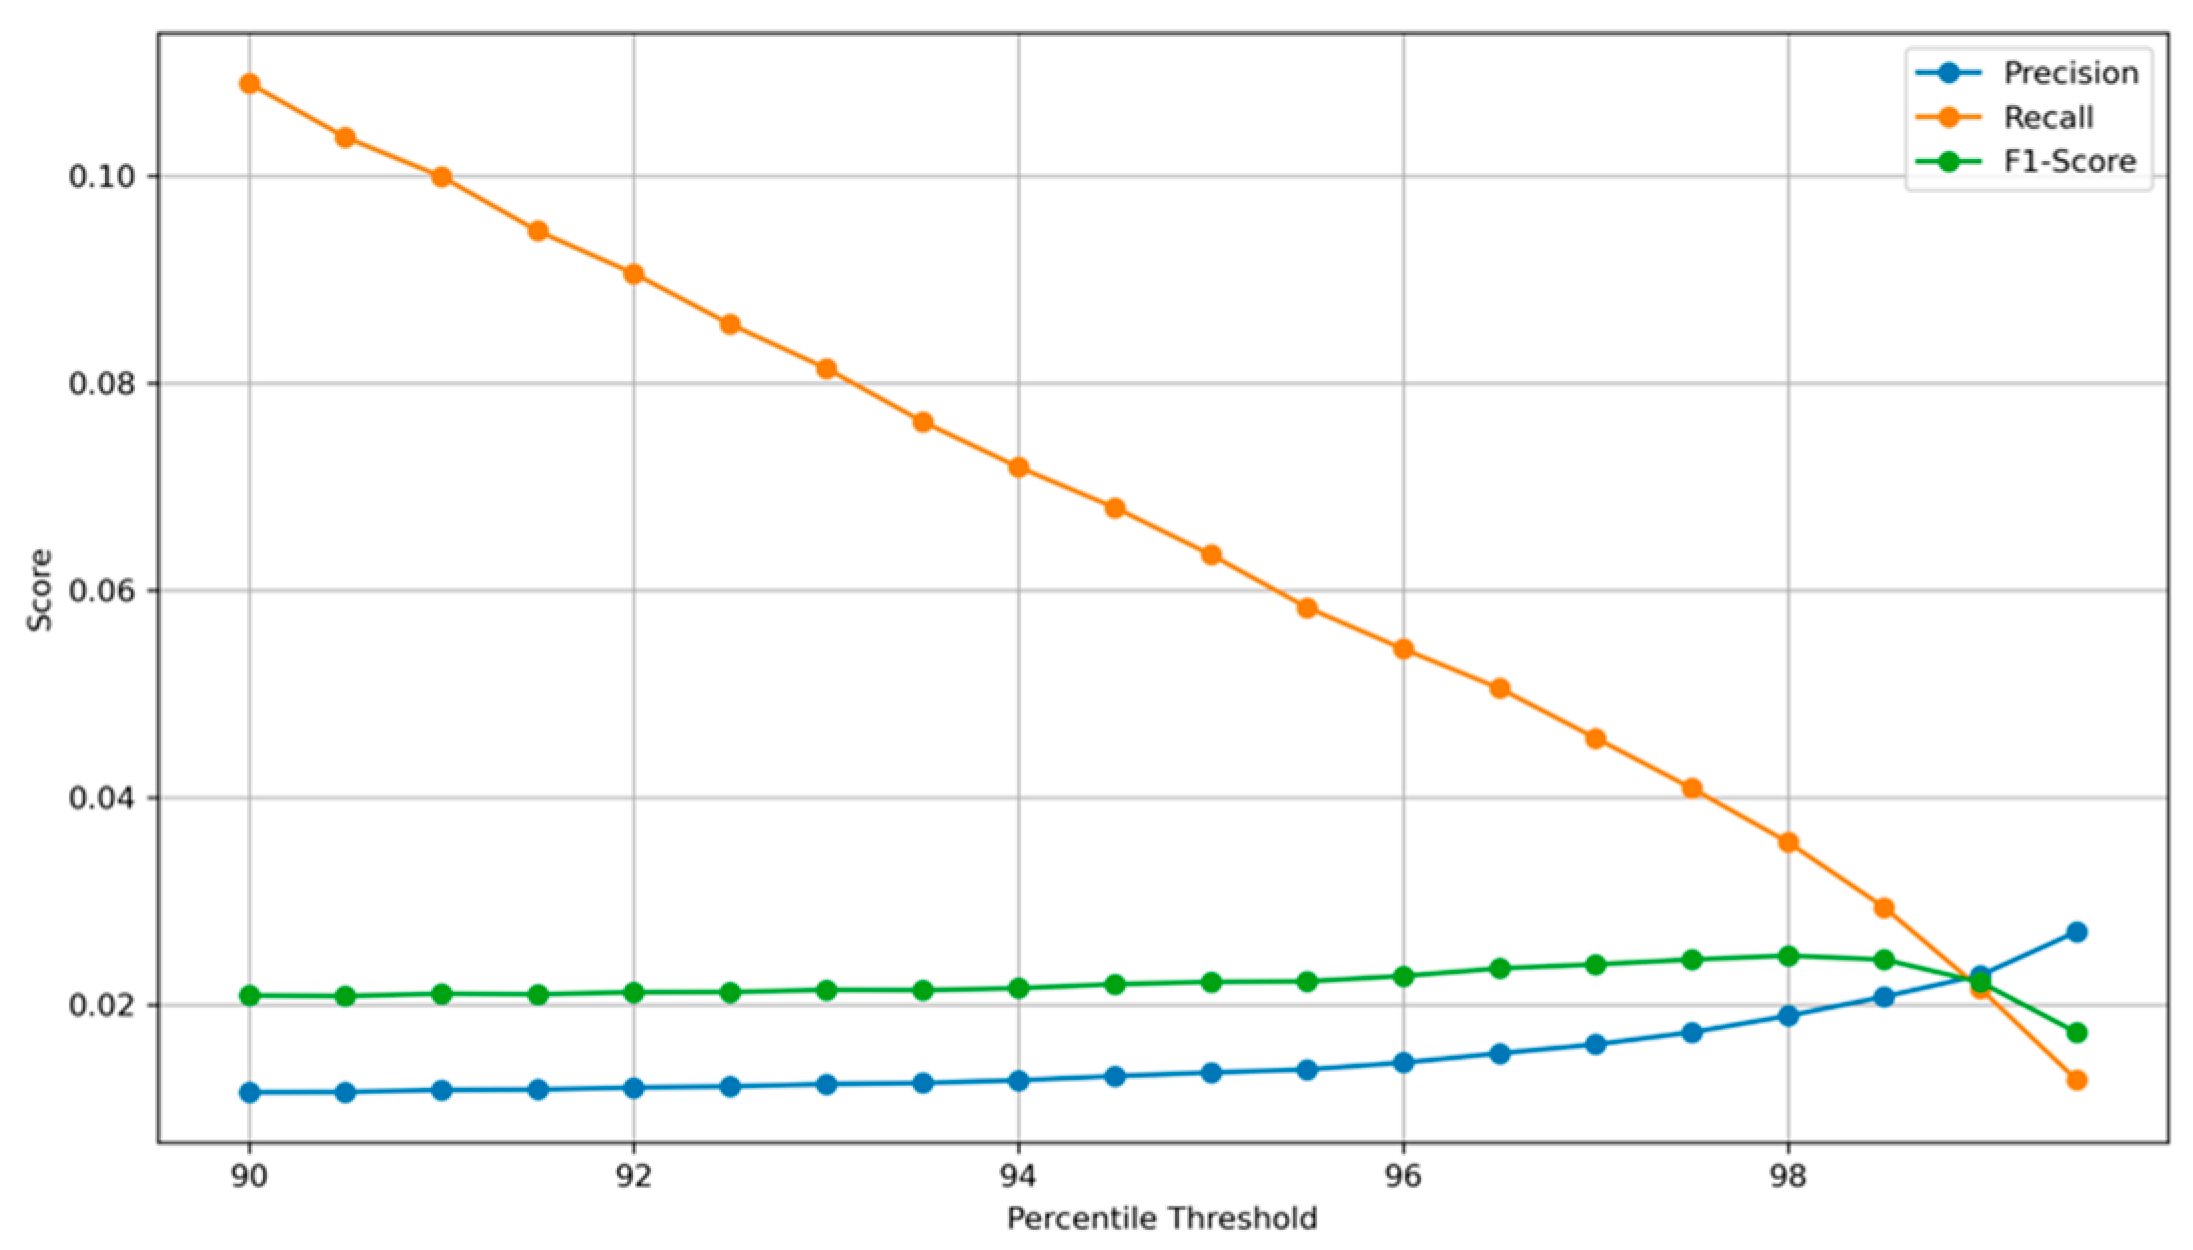
4.6. Threshold Sensitivity Analysis
To better understand the impact of the decision threshold on the performance of the anomaly detection model, a detailed threshold sensitivity analysis was conducted [
10]. This evaluation investigates how key metrics, precision, recall, and F1-score respond to varying percentile-based thresholds applied to the reconstruction error, as demonstrated in
Figure 6 [
11].
Figure 6 visualizes the relationship between the percentile threshold and the corresponding values of precision, recall, and F1-score. The horizontal axis represents the percentile cut-off used to define the anomaly detection threshold that ranges from 90% to 99% of reconstruction errors. The vertical axis quantifies the performance metrics, providing a comparative view of their evolution as the threshold is adjusted.
The observed trend demonstrates a typical trade-off in anomaly detection systems:
Precision increases gradually as the threshold indicator rises. This is expected, since a higher threshold results in fewer flagged bank transactions, and those that are flagged are more likely to be actual anomalies. However, this comes at the cost of missing many true fraud transactions, identified as TPs.
Recall exhibits a consistent downward trend, indicating that fewer actual fraudulent transactions are identified as the threshold indicator increases. While this improves specificity, it can result in more FNs, thereby reducing the model’s sensitivity to rare events.
F1-score, the harmonic mean of precision and recall, remains relatively stable across most of the range but peaks at a point that strikes a practical balance between detecting fraudulent bank transactions and minimizing FPs.
Threshold sensitivity analysis reveals that the selection of a fixed percentile threshold is a non-trivial decision and must be carefully tuned to the operational priorities of the institution deploying the system. For instance, organizations prioritizing maximum fraud capture may choose a lower threshold to enhance recall, whereas those focusing on minimizing false alarms may prefer a higher threshold. Further, the shape and inflexion points of these curves recommend that a dynamic thresholding strategy, potentially based on statistical properties or external risk signals, could further enhance detection accuracy in real-world deployments.
In conclusion, the threshold sensitivity curve provides critical insights into how varying the anomaly detection criteria affects the performance trade-offs inherent in imbalanced classification problems, such as fraud detection. It supports decision-makers with a visual tool to inform threshold calibration in accordance with both the domain-specific risk tolerance and operational capacity.
5. Discussion and Findings
The outcomes of this research study provide valuable insights into the practical strengths and current limitations of using an autoencoder-based fraud detection framework within a decentralized data environment [
9]. The results suggest that this approach holds strong potential as a privacy-conscious alternative to traditional machine learning models, centralized methods, particularly when labeled data is limited or restricted by institutional or legal constraints.
Performance through the experiments confirmed the framework’s proficiency in validating legitimate bank transactions. The ROC-AUC scores indicate that the model achieved a fair degree of success in distinguishing between fraudulent and non-fraudulent transaction cases, especially in the presence of severe class imbalance. Further, the confusion matrices in
Figure 6 revealed that the model consistently maintained a low false positive rate, which is vital in minimizing disruption to everyday transactions and maintaining confidence in fraud detection alerts.
On the other hand, certain challenges were evident. The recall scores remained relatively low, signalling that the framework occasionally failed to detect subtle or cleverly disguised fraudulent activities. This limitation is commonly observed in unsupervised anomaly detection systems, where the rarity and complexity of fraud make learning effective representations more difficult. Furthermore, although the distribution of reconstruction errors displayed distinct separation between fraudulent and normal behavior, some overlap persisted. This overlap emphasizes the need for more adaptive and finely tuned threshold mechanisms to improve classification sensitivity.
Indeed, the study has implications for real-world deployment, as the research findings underscore the applicability of this method in operational banking environments. By enabling local training without sharing raw data, the system inherently supports data protection laws and standards, including the UK May 2018 GDPR. This makes it especially attractive for use by institutions that prioritize compliance and risk mitigation.
At the same time, the performance gaps observed demonstrate the importance of further refinement before full-scale deployment. One of the most critical challenges involves dealing with the variability in data distributions across institutions, which can limit generalizability. In practice, each financial institution may exhibit unique bank transaction behaviors or fraud typologies. Thus, implementing personalized model adjustments tailored to individual node characteristics could enhance adaptability. Also, the lack of model interpretability remains a concern. For fraud detection systems to gain acceptance in regulated financial industries, stakeholders must be able to understand the reasoning behind flagged transactions [
13,
14]. Hence, incorporating explainability techniques, such as SHAP values or integrated attention mechanisms, can significantly increase the model’s trustworthiness to validate bank transactions.
Threshold sensitivity, in particular, also deserves lots of attention. As fraud patterns evolve, relying on static thresholds may not be adequate. Implementing dynamic threshold strategies or anomaly scoring based on contextual behavior can provide a more robust and responsive defense against emerging threats.
Following the observations outlined in
Table 2, it is clear that while the current federated architecture provides a secure and scalable approach, several enhancements are necessary to achieve optimal operational efficacy. Specifically, improvements in threshold calibration, handling data imbalance, and utilizing model explainability are critical for achieving broader real-world applicability. By systematically addressing these research areas, future iterations of federated learning (FL) fraud detection models can offer both improved performance and greater transparency, which align more closely with the evolving demands of financial compliance and trustworthiness [
20].
6. Conclusions
A detailed investigation with an in-depth examination has been undertaken in this research study for the application of unsupervised learning for financial fraud detection in a decentralized data environment. By utilizing autoencoder-based models within a simulated decentralized framework, the research explored how fraud detection systems can be designed to uphold stringent data privacy requirements without compromising detection capability. The simulation utilized two distinct datasets, each representing an independent financial institution with isolated, non-sharable data.
The study results prove that anomaly detection based on reconstruction errors can serve as a practical and scalable mechanism for identifying irregular transaction patterns. Despite the challenges imposed by real-world constraints, such as class imbalance and variation in data distributions, the autoencoder demonstrated the capacity to learn general representations of legitimate activity and to distinguish anomalous cases with reasonable precision. Thresholding using statistical percentiles provides a flexible strategy for classification, which provides a balance between sensitivity and false alarm rates.
Further, the experiment affirmed the viability of a privacy-preserving detection approach, which eliminates the need for data centralization or parameter exchange. This framework aligns closely with emerging regulatory expectations and provides a foundation for institutions seeking to utilize collaborative intelligence strategies while maintaining local data control.
Furthermore, the limitations encountered during experimentation emphasize important avenues for future enhancement. These include increasing the model’s sensitivity to rare or novel fraud patterns by improving adaptability through dynamic threshold mechanisms, applying FL fraud detection models, and incorporating interpretable outputs to ensure the decisions are comprehensible to stakeholders and auditors.
In conclusion, the feasibility of deploying autoencoder-based fraud detection systems within a decentralized infrastructure has been validated in this research study. It provides a meaningful step toward developing ethical and transparent artificial intelligence systems capable of navigating the complexities of modern financial ecosystems. As the sector continues to evolve, systems that harmonize innovation with accountability and privacy will become not only beneficial but also essential for responsible digital technology transformation.


