Abstract
Alzheimer’s disease (AD) and Parkinson’s disease (PD) are prevalent neurodegenerative disorders among the elderly, leading to cognitive decline and motor impairments. As the population ages, the prevalence of these neurodegenerative disorders is increasing, providing motivation for active research in this area. However, most studies are conducted using brain imaging, with relatively few studies utilizing voice data. Using voice data offers advantages in accessibility compared to brain imaging analysis. This study introduces a novel ensemble-based classification model that utilizes Mel spectrograms and Convolutional Neural Networks (CNNs) to distinguish between healthy individuals (NM), AD, and PD patients. A total of 700 voice samples were collected under standardized conditions, ensuring data reliability and diversity. The proposed ternary classification algorithm integrates the predictions of binary CNN classifiers through a majority voting ensemble strategy. ResNet, DenseNet, and EfficientNet architectures were employed for model development. The experimental results show that the ensemble model based on ResNet achieves a weighted F1 score of 91.31%, demonstrating superior performance compared to existing approaches. To the best of our knowledge, this is the first large-scale study to perform three-class classification of neurodegenerative diseases using voice data.
Keywords:
Alzheimer’s disease; convolution neural networks; ensemble classification; Parkinson’s disease; voice data MSC:
68T07
1. Introduction
The global aging trend is drawing increased attention to elderly health issues. This common shift is directly linked to the growing incidence of cognitive impairment [1]. Representative conditions among the elderly include AD and PD. These conditions significantly impact the independence and quality of life of the elderly, leading to cognitive impairment, motor disorders, psychological distress, and a reduction in daily functioning [2,3]. Given the lack of curative treatments, ongoing management is essential [4].
In response to this need, research utilizing artificial intelligence (AI)-driven approaches for the classification and management of brain diseases has attracted considerable interest. Although neuroimaging techniques such as Magnetic Resonance Imaging (MRI), Computed Tomography (CT), and Electroencephalography (EEG) offer high diagnostic accuracy, they often require expensive equipment and specialized expertise, limiting their accessibility [5]. In contrast, voice data-based approaches are non-invasive, cost-effective, and easily deployable, making them highly suitable for routine use. Consequently, AI research utilizing voice data has emerged as a promising alternative.
This study proposes an AI-based classification model that distinguishes between NM and patients with AD or PD using a total of 700 voice samples collected under standardized conditions [6]. Unlike previous studies that primarily focused on data collection for a single disease, making multiclass classification difficult, this study collected data for both AD and PD, enabling the implementation of an effective ternary classification approach to distinguish between NM, AD, and PD. The ensemble model integrates the outputs of binary classifiers—validated in prior work—through a majority voting mechanism to produce the final classification outcome. The overall analysis pipeline is displayed in Figure 1.
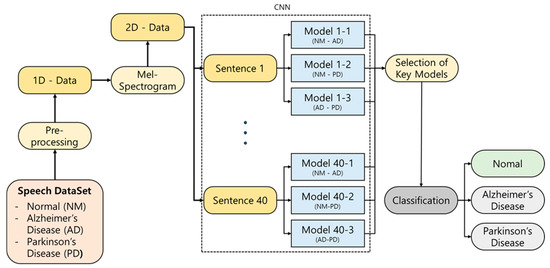
Figure 1.
Schematic illustration of our proposed classification approach.
This study presents the first large-scale voice-based ternary classification model, addressing the limitations of previous research in terms of data quantity and diversity. By doing so, it significantly improves the reliability and applicability of voice-based approaches in neurodegenerative disease classification. Moreover, the proposed model could serve as a foundation for accessible, non-invasive screening tools, paving the way for the development of personalized health management systems. The key contributions of this study are the following:
- Utilizing a well-balanced dataset of 700 voice samples across NM, AD, and PD classes, thereby overcoming limitations of small and imbalanced datasets seen in prior studies.
- Developing an ensemble-based ternary classification model and evaluating its performance using weighted F1 scores, which account for class imbalance.
- To the best of our knowledge, this is the first study to use this voice dataset for the multi-class classification of cognitive impairment conditions.
The remainder of the paper is structured as follows: Section 2 presents a review of related work on cognitive impairment classification, highlighting studies based on voice data and deep learning techniques. Section 3 describes the materials and methods used in this study, including dataset, preprocessing, and the proposed ensemble model architecture. Section 4 reports the experimental results and classification performance of the proposed method. Section 5 discusses the implications, limitations, and potential improvements. Finally, Section 6 concludes the paper and outlines directions for future research.
2. Literature Review
Previous studies on the classification of neurodegenerative diseases have primarily focused on brain imaging and physiological examinations, including MRI, CT, and EEG [5]. Peng et al. [7] classified PD patients vs. healthy individuals using Support Vector Machines (SVMs), achieving a classification accuracy of 85.8% with a study sample of 103 healthy individuals and 69 Parkinson’s disease patients. Yagis et al. [8] employed 2D CNN to distinguish between Parkinson’s disease patients and healthy individuals, reporting a classification accuracy of 88.6% based on imaging data from 204 healthy individuals and 452 Parkinson’s disease patients. Liu et al. [9] applied 2D CNN to classify AD patients, individuals with mild cognitive impairment (MCI), and healthy individuals. Their study involved 100 healthy individuals, 204 MCI patients, and 93 AD patients, achieving classification accuracies of 93% for distinguishing healthy individuals from AD patients and 83% for distinguishing NM from MCI patients. Lastly, Ahmad et al. [10] utilized 2D CNN to classify Alzheimer’s disease patients and healthy individuals, achieving a remarkably high classification accuracy of 99% on data from 2633 healthy individuals, 1512 MCI patients, and 2480 AD patients. Despite demonstrating excellent diagnostic performance, these existing studies have limitations in terms of data interpretation and accessibility of measurement [2,11]. Brain imaging data, such as MRI and CT scans, require expensive specialized equipment and expertise for diagnosis. Although these methods deliver strong diagnostic performance, they pose limitations. Brain imaging techniques often require costly equipment and skilled professionals, limiting their accessibility. Even though EEG is relatively affordable, it is sensitive to artifacts such as eye blinks and head movements [12]. Consequently, these modalities may not be practical for routine or at-home monitoring [13].
To overcome these limitations and enhance the accessibility of cognitive impairment classification, this study proposes a method based on patients’ voice data. Voice data includes vocal characteristics, speech patterns, and pronunciation, and individuals with cognitive impairment often experience difficulties in speaking due to muscle rigidity, tremors, and cognitive decline [14]. Recent studies have also clinically supported that voice data can serve as a powerful biomarker in diagnosing cognitive impairment. In the case of Alzheimer’s disease (AD), large-scale longitudinal studies have identified voice biomarkers associated with dementia onset [15], and research has shown improved classification performance using voice-related features [16]. This suggests that statistically significant changes in acoustic features observed in AD patients may indicate early signs of neurodegenerative changes. Parkinson’s disease (PD) is also known to present early voice abnormalities, including low volume, monotonous intonation, and unclear articulation [17]. These scientific and clinical findings support the validity of voice-based diagnosis not merely as a technical alternative but as a legitimate diagnostic method directly linked to underlying pathological changes. Based on these voice characteristics, we propose an AI-based classification model. The voice-based classification model is non-invasive, provides quick results at low cost, and is thus easily accessible to the general public.
Recent years have witnessed increasing interest in using voice data to classify individuals with cognitive impairment, including NM, AD, and PD [18]. As the quantity and quality of available voice data have improved, research efforts have expanded to incorporate both machine learning and deep learning techniques. In earlier studies, machine learning approaches were more prevalent. For example, Rusz et al. [19] used data from 24 PD patients and 22 NM, combining Factorial Discriminant Analysis and Logistic Regression, achieving a classification performance of approximately 80%. A similar study utilizing data from 25 NM, 25 AD patients, and 25 individuals with MCI combined acoustic features and linguistic features to achieve a classification accuracy of 86% [20]. Li et al. [21] conducted a study to differentiate between PD and Progressive Supranuclear Palsy (PSP) using data from 25 patients. This study addressed the highly similar aspects of the two diseases in their early stages and achieved a classification rate of approximately 80% using a linear SVM model.
More recent studies increasingly rely on deep learning methods, which are well-suited for modeling the complex high-dimensional features of voice data [22]. Voice data contain numerous variables, so deep learning-based algorithms tend to exhibit superior average classification accuracy compared to machine learning methods [22]. A study by Gunduz [23] utilizing deep learning combined CNN and feature combination techniques, achieving a classification accuracy of 86.9% in a study involving 64 NM and 188 PD patients. In the study by Agbavor et al. [24], a Deep Neural Network (DNN) was utilized to classify Alzheimer’s patients, achieving an accuracy of 85%. Additionally, a recent study by Park et al. [25] classified the progression stages of Alzheimer’s disease into MCI, AD, and Alzheimer’s disease dementia (ADD), with a classification result of 81%.
These findings collectively demonstrate the viability of voice data for distinguishing between healthy individuals and those with cognitive impairment. The results of some notable previous studies are presented in Table 1. As shown in Table 1, most existing studies still rely on relatively small-scale or heterogeneous datasets, primarily due to the difficulty in recruiting patient populations. While some studies have attempted to address this issue by merging multiple datasets, inconsistencies in recording environments remain a significant limitation. Moreover, classification accuracy in voice-based studies often remains below 90%, highlighting the need for further improvement. Therefore, further research is needed to improve these limitations.

Table 1.
Summary of the key literature describing the data, analytical methods, and findings used in the research.
3. Materials and Methods
3.1. Dataset
In this study, we collected voice data from 700 elderly participants, including both cognitively impaired individuals and healthy controls. The dataset consists of 300 samples from NM, and 200 samples each from AD and PD participants, maintaining a balanced 1:1 ratio between the two patient groups. The group of individuals with cognitive impairment consisted of patients who had been clinically diagnosed in hospitals and elderly individuals residing in care facilities who exhibited symptoms of cognitive decline. The included neurodegenerative diseases were classified according to the International Classification of Diseases (ICD), focusing specifically on Parkinson’s disease (G20) and Alzheimer’s disease (G30) within the F00–G31 range. Voice data were collected only from those who provided informed consent to participate in the study. All participants provided informed consent before taking part in the study. The study was conducted in accordance with the Declaration of Helsinki, and the protocol was approved by the Ethics Committee of Dong-A University Hospital (DAUHURB-21-049, approved on 17 March 2021).
Participants consisted of hospital outpatients and residents of nursing homes who exhibited symptoms of cognitive impairment. All voice recordings were conducted on-site using standardized equipment to maintain a consistent recording environment. The recording settings were arranged within hospitals and care facilities to resemble conditions familiar to participants in their daily lives. To ensure consistent audio quality, high-performance microphones and laptops with identical specifications were used, and recordings were carried out in dedicated spaces designed to minimize ambient noise and environmental interference. Additionally, to standardize the recording procedures, trained personnel were assigned to guide participants through the process and to address any issues that might arise during the recordings.
Participants were instructed to read a structured script composed of monosyllabic words, full words, sentences, and paragraphs, presented in a fixed speech task format. This scripted approach was adopted to enhance comparability among participants, in contrast to spontaneous speech tasks. Each participant read 60 items of monosyllabic and word content, 30 sentences, and 10 paragraphs, totaling 100 items. Since monosyllabic and single-word readings were insufficient to capture lesion-related vocal characteristics, this study focused on the 30 sentences and 10 paragraphs for analysis.
Initially, continuous recordings were obtained from each participant. These recordings underwent a two-step preprocessing procedure. In the first step, audio quality was reviewed, and any flawed recordings were excluded. In the second step, the continuous recordings were segmented into 100 individual files per speaker. After this internal refinement, a final quality check was conducted by speech experts, and the resulting dataset was used for model training.
The demographic distribution of the constructed dataset is shown in Table 2. The subjects are mature to individuals aged between 40 and 100 years, with details on the gender and age distribution of the patients recorded.
Table 2.
Demographic characteristics of the gender and age distribution of the subjects.
3.2. Mel Spectrogram
A Mel spectrogram is a visual representation of an audio signal that shows how its frequency content evolves over time [26]. It maps the frequency scale to a perceptually motivated Mel scale, which better reflects how humans perceive pitch. Mel spectrograms are widely used in speech recognition, synthesis, and audio signal analysis to extract meaningful acoustic features.
A Mel spectrogram consists of components such as frequency axis, time axis, and color. The frequency axis represents the frequency of an audio signal, the time axis expresses the time information of the audio signal, and the color indicates the intensity of the audio signal. Typically, the frequency ranges from 0 Hz to 20,000 Hz, while the intensity ranges from 0 to 1.
To generate a Mel spectrogram, the audio signal undergoes a Short-Time Fourier Transform (STFT) followed by a conversion to the Mel scale using a set of Mel filter banks. This approach allows for an efficient and interpretable visualization of speech characteristics, especially in alignment with human auditory perception.
A Mel spectrogram finds applications in various fields such as speech recognition, speech synthesis, and music analysis. In speech recognition, a Mel spectrogram is used to extract features of the audio signal, and in speech synthesis, these features are generated and used. Additionally, a Mel spectrogram is employed in music analysis to analyze the characteristics of music signals.
Therefore, in this study, a Mel spectrogram is utilized to analyze the speech data of patients with cognitive impairment. This preprocessing step helps isolate key frequency patterns relevant to disease classification and provides a rich input format for CNN.
3.3. CNN Architecture
Voice data that has been transformed using a Mel spectrogram is represented as a structure, capturing both temporal and frequency characteristics. CNN is highly suitable tool for processing such two-dimensional representations. By extracting features from each Mel-channel, CNN can learn various levels of patterns, ranging from low level acoustic patterns to high level acoustic features. Accordingly, this study employs leading CNN architectures, including ResNet, DenseNet, and EfficientNet, all of which have been successfully applied in various medical data analyses [27,28].
ResNet, the CNN model that emerged victorious in the 2015 ILSVRC, was introduced to overcome the limitations of VGGNet and enhance the training stability of deep CNN models [29]. While the depth of VGGNet posed challenges in training and increased computational complexity, ResNet addressed these issues through the implementation of skip connections. Comprising of 34 layers, ResNet consists of convolutional and fully connected layers. It utilizes 3 × 3 kernels in the convolutional layers and 2 × 2 kernels in the max pooling layers.
The key idea behind ResNet is the skip connection, where the output of the previous layer is directly forwarded to the subsequent layer, effectively addressing the vanishing gradient problem. This is represented by Equation (1), illustrating residual learning in ResNet. ResNet aims to minimize the value of f(x) + x, with the goal of approaching f(x) close to zero. This simple structural modification minimizes additional learning load.
ResNet holds significance as a crucial model for enhancing the performance and stability of deep CNN models, exerting a profound influence on subsequent CNN models. Despite its deep architecture, ResNet is known for using a small number of weights, making it applicable in various medical diagnostic research studies. Its advantages of fast learning and high classification performance make it a candidate model for this study.
DenseNet, the champion model of the 2016 ILSVRC, introduced a novel approach to CNNs [30]. To overcome the limitations of previous models like ResNet, DenseNet significantly advances skip connections. In contrast to ResNet, DenseNet efficiently propagates the output of all preceding layers to the subsequent layer, comprehensively utilizing information. Structurally, DenseNet comprises 121 layers, with the initial 112 being convolutional layers and the subsequent layers being fully connected. The architecture uses 3 × 3 kernels for convolution and 2 × 2 kernels for max pooling. In the ILSVRC 2016 competition, DenseNet secured victory with a top-5 error rate of approximately 2.99%, highlighting an improvement of around 1.58%. DenseNet has emerged as a pivotal model for deep CNN and, therefore, was selected as a candidate model for this study.
EfficientNet, the CNN model that won the 2019 ILSVRC, proposed a method to simultaneously improve performance and efficiency by adjusting three factors: depth, width, and resolution [31]. While conventional CNN models increased depth, width, and resolution to enhance performance, this approach, though effective, led to increased computational complexity and reduced efficiency. To address this issue, EfficientNet introduced a method to optimize depth, width, and resolution, aiming to boost both performance and efficiency. The structure of EfficientNet consists of an input and stem, inverted residual blocks, and a classifier. The stem acts as a conduit, transferring information from the input layer to the output layer. Inverted residual blocks play a role in adjusting depth, width, and resolution to enhance performance. The classifier is responsible for the final classification. EfficientNet achieved victory in ILSVRC 2019 with a top-5 error rate of 2.24%, highlighting an improvement of approximately 1.75% compared to previous models. As EfficientNet is a significant model that provides a method for simultaneously enhancing performance and efficiency, it has also been included as a candidate model for this study.
3.4. Ensemble Architecture
This study proposes an ensemble-based classification approach that leverages voice data to detect cognitive impairment. The ensemble method integrates predictions from multiple models to enhance classification accuracy and ensure greater robustness against variability in the data.
Initially, binary classification tasks were conducted using individual CNN architectures, including ResNet, DenseNet, and EfficientNet, to distinguish between NM, AD, and PD. The best performing models were then selected and combined to construct the final ensemble. Figure 2 illustrates the operational principle of the proposed ensemble architecture. Each binary classification model outputs a class label among {0, 1, 2}. Based on a majority voting strategy, the final output is determined by the class that receives the most votes. This approach helps mitigate the risk of overfitting from individual models and enhances generalization across diverse speech patterns.
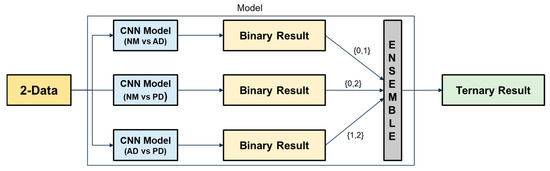
Figure 2.
Ensemble-based ternary classification process using binary classifiers.
3.5. Evaluation
The final performance of the model was assessed using the F1 score, which represents the harmonic mean of Precision and Recall. This metric is particularly useful for handling imbalanced datasets, as it considers both false positives and false negatives. Given the class distribution in our dataset (NM:AD:PD = 3:2:2), we adopted the weighted F1 score to provide a more balanced evaluation. Equation (2) represents the weighted F1 score.
In Equation (2), k denotes the total number of classes, F1i denotes the F1 score for the i-th class, and wi represents the weight for the i-th class, determined based on the proportion of the i-th class. The F1 score for each class is defined as the harmonic mean of Precision and Recall, as shown in the second equation.
Weighted AUROC (Area Under the Receiver Operating Characteristic Curve) is a useful supplementary metric for evaluating the discriminative performance of models in multi-class classification problems. This metric calculates the AUROC for each class using the one-vs-rest approach and then derives a weighted average based on the proportion of each class. The formulation is presented in Equation (3).
In Equation (3), k denotes the total number of classes, and AUROCi represents the AUROC score for the i-th class, and wi represents the ratio of the number of samples in class i to the total number of samples. In AUROC calculation, n refers to the number of threshold points used to compute the ROC curve. and represent the true positive rate and false positive rate at the i-th threshold, respectively. The AUROC is estimated using the trapezoidal rule over these threshold points.
AUROC indicates the probability that the model will correctly distinguish between a randomly chosen positive and negative sample. This allows for a robust assessment of overall classification reliability, even in datasets with class imbalance.
In this paper, the following auxiliary evaluation metrics are used to derive the weighted F1 score, which is utilized as the final evaluation metric:
- NM Precision: Precision for the NM class.
- AD Precision: Precision for the AD class.
- PD Precision: Precision for the PD class.
- NM Recall: Recall for the NM class.
- AD Recall: Recall for the AD class.
- PD Recall: Recall for the PD class.
- NM F1 score: F1 score for the NM class.
- AD F1 score: F1 score for the AD class.
- PD F1 score: F1 score for the PD class.
- Accuracy: the proportion of correct predictions.
4. Results
4.1. Data Transformation Through Mel Spectrogram Application
In this section, we present the results of converting voice data using Mel spectrograms as part of the proposed classification algorithm for distinguishing between NM, AD, and PD. First, raw voice samples were converted into Mel spectrograms to capture the temporal and spectral characteristics of the audio signal.
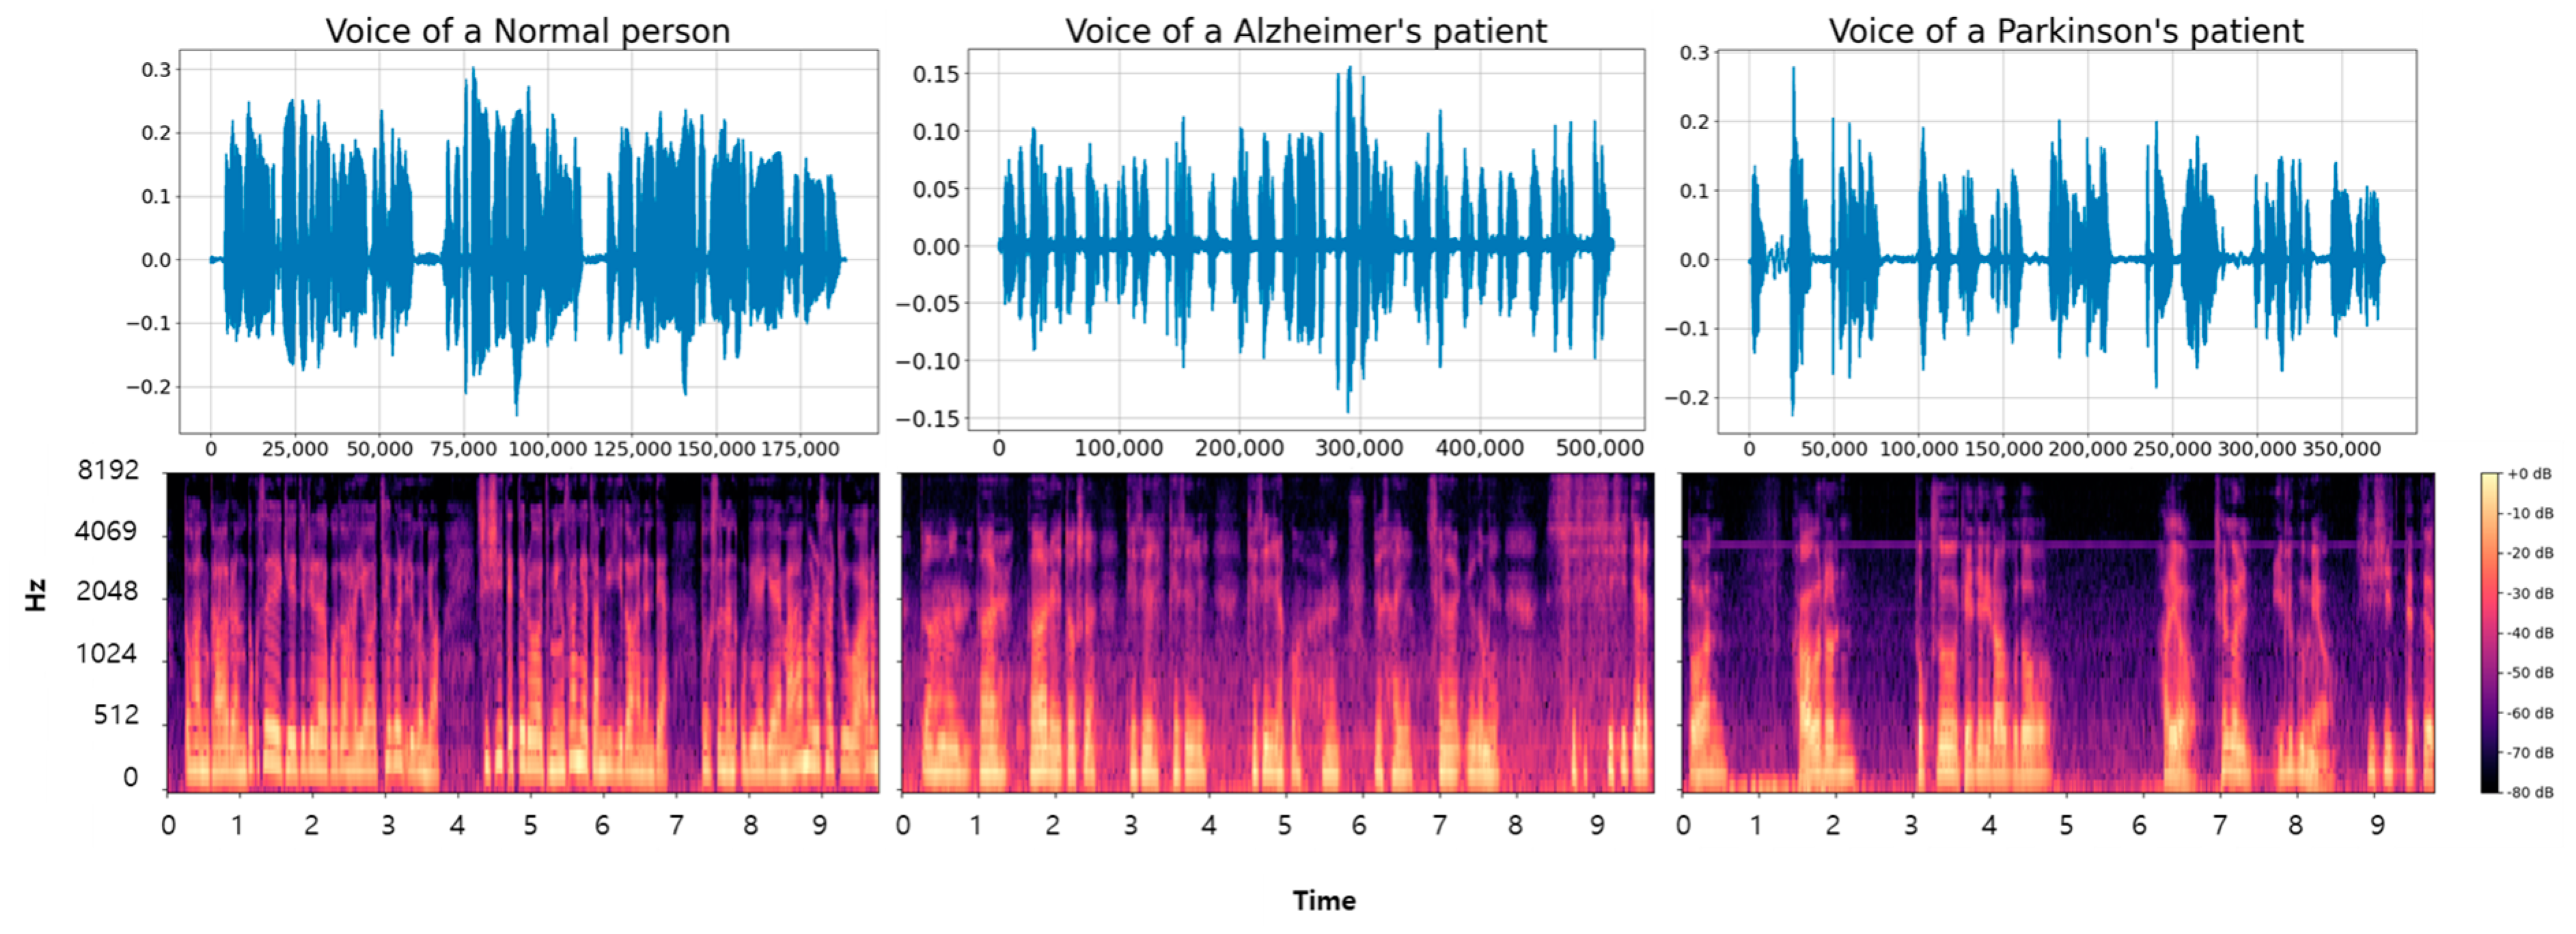
Additionally, we conducted a visual analysis to examine the acoustic differences among the three categories. The voice data for the longest paragraph among the entire dataset were visualized, with the converted results shown in Figure 3. The top images represent the voice data in a one-dimensional form, while the bottom images are the Mel spectrogram-based conversions of the top images. The data transformed through the Mel spectrogram reveal noticeable differences. Healthy voice samples display clear and periodic frequency patterns. AD voice samples show interruptions and irregularities in frequency continuity. Frequent stuttering due to the disease results in more interruptions compared to NM samples. PD samples demonstrate weakened signal intensity and prolonged silent segments, likely due to tremors and articulation difficulties associated with the disease [30,31]. Moreover, there were segments without speech during the recordings, leading to longer recording times due to difficulties in articulation.
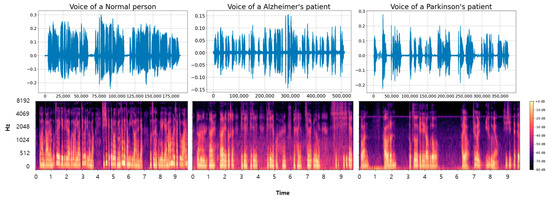
Figure 3.
The figure shows the visualization of voice data samples and the results of applying a Mel spectrogram to NM, AD, and PD classes.
Based on the visual analysis results, the application of a Mel spectrogram has been confirmed to extract meaningful features for developing classification algorithms. Therefore, in this study, we propose a classification algorithm based on data transformed using the Mel spectrogram.
4.2. Results of Binary Classification Algorithm
This section protocols the results of binary classification algorithms. Binary classification algorithms are presented to classify NM vs. AD, NM vs. PD, and AD vs. PD, which will be implemented in ensemble-based ternary classification algorithms in the future. Such binary classification algorithms can reduce complex voice signal analysis into more manageable tasks, thereby improving classification accuracy for each disease state. Previous studies have confirmed that classification accuracy is higher when distinguishing between healthy and disease groups [9,10,25]. Based on this, binary classification is prioritized, and then the results of the binary classifiers are combined to perform the final ternary classification. Therefore, models were built for a total of 40 sentences, and the model exhibiting the highest performance was selected using 10% validation data. Following the training and evaluation of the models, the results were obtained as shown in Appendix A.
The analysis of voice data through binary classification algorithms showed high classification performance for healthy, AD, and PD groups. Particularly, the classification results for healthy and AD groups were notably strong across the three models proposed in this study. In the task of distinguishing between healthy and AD, ResNet achieved the best classification performance with an average F1 score of 81.26%, followed by DenseNet with 52.12% and EfficientNet with 42.42%. For the task of distinguishing healthy and PD groups, ResNet averaged 90.64%, DenseNet averaged 52.02%, and EfficientNet averaged 34.44%. Finally, in the task of distinguishing between AD and PD groups, ResNet achieved an average accuracy of 68.86%, DenseNet achieved 64.58%, and EfficientNet achieved 61.79%. Based on these results, ResNet demonstrates the highest classification accuracy. DenseNet and EfficientNet, on the other hand, show relatively lower classification accuracy.
The modeling of 40 sentences confirmed that certain sentence-level classifications performed exceptionally well in addressing each problem. Therefore, this study selects the key models that are most important for addressing the classification problems of NM vs. AD, NM vs. PD, and AD vs. PD groups. This task effectively reduces unnecessary computations while significantly improving the performance of the classification models.
4.3. Selection of Key Models
In this study, individual modeling was performed for 40 voice sentences, and key models were selected for ensemble-based ternary classification. Figure 3 illustrates the results of ternary classification as the number of models gradually increases, with the process conducted using 10% validation data. We gradually increased the number of models used for the final classification and performed iterations accordingly.
As shown in Figure 4, the ResNet model consistently maintained F1 scores between 85% and 90% across most iterations, demonstrating the most stable and superior performance. Notably, with three models, approximately 90% classification accuracy was achieved. Although DenseNet did not perform as well as ResNet, it maintained relatively stable F1 scores between 75% and 80% and similarly achieved relatively high performance when using three models. On the other hand, EfficientNet exhibited more fluctuation, starting with F1 scores between 60% and 70% but gradually declining to around 40% as iterations progressed.
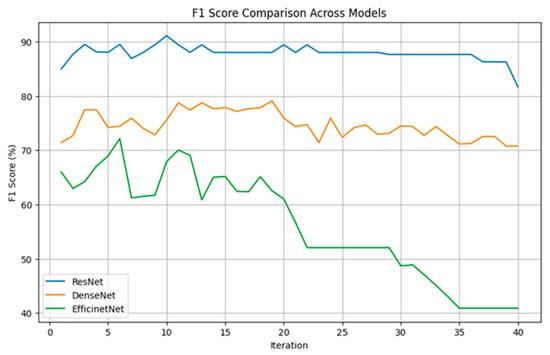
Figure 4.
The figure shows the classification accuracy of each CNN algorithm based on the number of selected models.
These findings indicate that selecting a certain number of key models is advantageous for achieving high classification accuracy across all three algorithms. To enhance computational efficiency, this study was designed to achieve high classification performance with a minimal number of models. As a result, three key models were selected for each ensemble-based ternary classification.
4.4. Results of Ensemble-Based Ternary Classification Algorithm
This section presents the results of an ensemble-based ternary classification algorithm capable of classifying NM, AD, and PD. We conducted experiments using the test data (10%). This algorithm combines the results of binary classification algorithms to obtain the final outcome. Each binary classification model learns the characteristics of voice data extracted through Mel spectrograms to classify NM, AD, and PD. Therefore, the ternary classification algorithm effectively analyzes complex voice signals and contributes to distinguishing each disease state. The performance of each model was evaluated using Precision, Recall, F1 score, and weighted F1 score metrics.
Table 3 shows the classification results of the ensemble-based ternary classification algorithm. The ResNet model exhibited the best overall performance. Notably, it achieved a perfect Recall of 100% for the NM class, indicating flawless prediction. Additionally, it maintained high Precision and Recall for the AD and PD classes. The superior performance of ResNet is reflected in its balanced Precision and Recall across the NM, AD, and PD classes, leading to the highest F1 scores in all classes. Furthermore, it recorded the highest weighted F1 score of 91.31%. In addition, the model achieved the highest accuracy of 91.43%, and the confusion matrix confirms that the classification results were consistently strong across all classes.
Table 3.
This table compares the Precision, Recall, F1 score, accuracy, weighted AUROC, confusion matrix and weighted F1 score of the NM, AD, and PD classes for the ResNet, DenseNet, and EfficientNet models to evaluate each model’s performance. The final model performance is assessed using the weighted F1 score.
The DenseNet model showed lower performance than ResNet but still achieved a relatively high Recall of 92.59% for the NM class. However, it demonstrated lower Precision and Recall for the AD and PD classes, resulting in an overall weighted F1 score of 70.56%. The EfficientNet model exhibited the lowest performance overall. It recorded a Precision of 69.23% and a Recall of 66.67% for the NM class. Although it achieved a high Recall of 85.00% for the AD class, its Precision was low. For the PD class, EfficientNet had the lowest Precision and Recall, resulting in the lowest F1 scores and a weighted F1 score of 66.55%. Both models exhibited accuracies of 71.43% and 67.14%, respectively, which were consistent with their corresponding weighted F1 scores. Additionally, in terms of the weighted AUROC, the ResNet model achieved the highest score of 96.11%, demonstrating strong classification reliability and discriminative capability across all classes. DenseNet and EfficientNet followed with weighted AUROC scores of 89.54% and 83.60%, respectively, which were in line with their trends in F1 scores and overall accuracy. Analysis of their confusion matrices reveals a notable tendency to misclassify AD as NM and PD as AD. These patterns suggest inherent challenges in differentiating between the neurodegenerative conditions.
ResNet demonstrated superior performance, making it the most suitable model for this study. In all aspects, ResNet outperformed the other models. Therefore, the ensemble model based on ResNet is the most effective for solving the NM-AD-PD ternary classification problem in this study.
5. Discussion
This study proposed an AI-based voice classification algorithm to identify cognitive impairment between AD and PD. These disorders result from the degeneration and death of nerve cells and are accompanied by distinctive vocal characteristics related to disease manifestation. Symptoms include reduced vocal volume due to tremors or muscle rigidity, inaccurate articulation or stuttering caused by impaired language processing, and slowed speech or monotonous intonation due to cognitive decline [32,33].
Recognizing the diagnostic potential of these vocal characteristics for cognitive impairment classification, this study was conducted. To effectively capture participants’ vocal features, recorded speech data were preprocessed using Mel spectrogram transformation. Additionally, various CNN architectures were applied to develop an ensemble-based classification algorithm that identifies cognitive impairment from speech signals. The Mel spectrogram representation enabled the effective extraction of both time-domain and frequency-domain features, which are known to reflect changes in motor control and cognitive–linguistic processing frequently observed in AD and PD. The final ensemble model based on ResNet achieved a weighted F1 score of 91.31%, demonstrating its strong potential for voice-based classification in neurodegenerative disease diagnosis.
While most existing studies focus on binary classification (e.g., AD vs. NM) or rely on expensive neuroimaging techniques such as MRI and PET, this study utilized voice data that can be collected non-invasively in everyday settings, significantly improving accessibility. This approach is particularly useful for early screening and continuous monitoring in clinical contexts [34,35]. To address the challenge of ternary classification (NM, AD, PD), this study decomposed the task into binary classification subproblems and applied a majority voting ensemble method. Since AD and PD share overlapping symptoms such as slowed speech, monotony, and articulation issues, this strategy proved effective in reducing classification errors caused by such similarities.
Among the CNN architectures used, ResNet outperformed DenseNet and EfficientNet. This result appears to stem from ResNet’s architecture, which facilitates stable training even with moderately sized datasets. In contrast, while DenseNet and EfficientNet are highly effective in large-scale image classification tasks, they tend to perform poorly when applied to voice data characterized by limited size and diversity. These findings emphasize the importance of selecting data-efficient and domain-appropriate architectures in medical AI applications.
Several practical limitations were identified during the study. First, although voice data from AD and PD patients were collected, clinical details such as disease severity and progression stage were not included. The absence of such clinical information can lead to label ambiguity, especially in mild cases where patients may exhibit vocal characteristics similar to those of cognitively healthy individuals, potentially resulting in reduced classification performance. Moreover, integrating clinical data could enable the development of multimodal diagnostic models. Recent studies on Alzheimer’s disease diagnosis have shown that incorporating clinical data can significantly enhance model performance [36]. Second, the type of speech tasks used also influenced classification performance. Complex tasks such as sentence and paragraph reading were effective in reflecting pathological features, while simpler tasks such as vowel or word reading lacked sufficient discriminative power and were excluded from analysis. Future studies should quantitatively examine which vocal characteristics are most effectively expressed in each speech task type.
6. Conclusions
The study proposed and validated an ensemble classification model based on Mel-spectrogram features and multiple CNN architectures to classify cognitive impairment using voice data. A total of 700 voice samples were collected from elderly participants classified as NM, AD, and PD. The analysis empirically confirmed that speech contains distinct acoustic features associated with cognitive impairment conditions. The voice recordings were transformed into Mel spectrograms and optimized for CNN model training, effectively capturing the frequency characteristics of the human voice.
The ensemble approach, particularly the ResNet-based model, achieved a weighted F1 score of 91.31%, outperforming DenseNet and EfficientNet. These findings were consistently confirmed through performance evaluations using both accuracy and weighted AUROC. This result confirms that deep learning can deliver high classification accuracy in a ternary classification task using speech, and that ResNet is robust even in environments with limited medical data.
This study contributes to the broader utilization of speech as a digital biomarker, proposing it as a non-invasive, cost-effective, and scalable tool for cognitive health assessment. Unlike neuroimaging-based diagnostic methods that require specialized equipment and personnel, voice data can be conveniently collected through mobile devices or telemedicine platforms, offering a promising alternative in resource-limited settings.
The results of this study suggest that AI-based voice classification technologies can be effectively utilized for the early detection and classification of cognitive impairment, providing a foundational framework for clinical application. As voice technologies continue to advance, the proposed framework is expected to offer an innovative breakthrough in cognitive decline management. Moreover, from a practical standpoint, this research demonstrates the potential for integrating voice-based early screening tools into both clinical settings and telemedicine platforms. However, ensuring the model’s generalizability across diverse languages, dialects, and acoustic environments remains a critical challenge. Future research should focus on validating the model across languages, enabling real-time application, and integrating with other digital health indicators.
In conclusion, this study proposes a novel ensemble classification model that utilizes CNNs and Mel spectrogram features to validate the potential of voice-based cognitive impairment classification. The proposed model demonstrated high weighted F1 scores and accuracy, effectively classifying Alzheimer’s and Parkinson’s disease in a non-invasive and scalable manner. This framework contributes meaningfully to the field of digital health and lays the groundwork for clinical application of AI-based voice analysis.
Author Contributions
Conceptualization, S.-H.S., M.P. and S.K.; methodology, S.-H.S., M.P. and S.K.; software, S.-H.S. and M.P.; validation, M.P.; formal analysis, D.-Y.K. and W.-Y.B.; investigation, D.-Y.K. and W.-Y.B.; data curation, D.-Y.K., W.-Y.B. and Y.-J.H.; writing—original draft preparation, S.-H.S.; writing—review and editing, S.-H.S., M.P., Y.-J.H. and S.K.; supervision, S.K.; project administration, S.K. The authors S.-H.S. and M.P. contributed equally to this work. All authors have read and agreed to the published version of the manuscript.
Funding
This research was funded by Dong-A University, Republic of Korea (10.13039/501100002468).
Institutional Review Board Statement
All participants provided informed consent before taking part in the study, which was conducted in accordance with the Declaration of Helsinki and approved by the Ethics Committee of Dong-A University Hospital (DAUHURB-21-049, approved on 17 March 2021).
Informed Consent Statement
Not applicable.
Data Availability Statement
Data can be obtained at the following URL: https://github.com/sanghasung/Ensemble_CNN_Model (accessed on 24 June 2025).
Conflicts of Interest
The authors declare no conflicts of interest.
Appendix A
Model-Wise Binary Classification Outcomes on 40 Sentences
The appendix presents the binary classification results for NM-AD, NM-PD, and AD-PD using ResNet, DenseNet, and EfficientNet across 40 individual sentences. The performance of each model is summarized in Table A1 (ResNet), Table A2 (DenseNet), and Table A3 (EfficientNet). A total of 100 iterations were conducted using 10% of the data for validation, and the results were averaged. Each table reports the mean and standard deviation for every sentence, and the top three sentences in each table are highlighted in bold.
As a result, ResNet consistently demonstrated superior performance across all binary classification tasks, showing the highest mean values and the lowest standard deviations. DenseNet and EfficientNet followed, with DenseNet generally outperforming EfficientNet in terms of both stability and accuracy.
Table A1.
The table presents the binary classification results obtained using ResNet.
Table A1.
The table presents the binary classification results obtained using ResNet.
| Sentence Number | NM-AD | NM-PD | AD-PD | |||
|---|---|---|---|---|---|---|
| Mean | Standard Deviation | Mean | Standard Deviation | Mean | Standard Deviation | |
| 1 | 86.74 | 0.04 | 76.69 | 0.05 | 63.71 | 0.08 |
| 2 | 77.94 | 0.05 | 69.28 | 0.07 | 63.68 | 0.06 |
| 3 | 78.91 | 0.05 | 80.71 | 0.05 | 71.8 | 0.05 |
| 4 | 78.71 | 0.05 | 70.86 | 0.06 | 63.32 | 0.06 |
| 5 | 71.1 | 0.06 | 69.07 | 0.06 | 69.2 | 0.06 |
| 6 | 83.81 | 0.05 | 76.28 | 0.06 | 51.54 | 0.09 |
| 7 | 77.11 | 0.05 | 81.42 | 0.05 | 67.7 | 0.07 |
| 8 | 76.67 | 0.04 | 80.62 | 0.05 | 62.05 | 0.07 |
| 9 | 82.89 | 0.05 | 73.27 | 0.06 | 74.49 | 0.05 |
| 10 | 80.99 | 0.04 | 77.29 | 0.06 | 72.72 | 0.06 |
| 11 | 85.55 | 0.05 | 77.31 | 0.06 | 70.91 | 0.06 |
| 12 | 69.72 | 0.07 | 82.29 | 0.05 | 50.8 | 0.08 |
| 13 | 84.87 | 0.05 | 75.9 | 0.05 | 65.62 | 0.07 |
| 14 | 81.57 | 0.05 | 76.22 | 0.06 | 64.97 | 0.07 |
| 15 | 79.89 | 0.05 | 82.23 | 0.05 | 67.38 | 0.06 |
| 16 | 87.15 | 0.04 | 86.09 | 0.04 | 67.42 | 0.06 |
| 17 | 74.54 | 0.06 | 73.7 | 0.06 | 52.24 | 0.08 |
| 18 | 76.72 | 0.07 | 75.5 | 0.06 | 78.59 | 0.05 |
| 19 | 84.2 | 0.05 | 84.2 | 0.05 | 65.88 | 0.06 |
| 20 | 76.43 | 0.05 | 78.33 | 0.05 | 61.52 | 0.06 |
| 21 | 82.23 | 0.05 | 80.04 | 0.04 | 75.23 | 0.05 |
| 22 | 80.94 | 0.05 | 73.43 | 0.06 | 61.5 | 0.07 |
| 23 | 74.84 | 0.04 | 75.92 | 0.05 | 75.24 | 0.05 |
| 24 | 76.88 | 0.06 | 68.81 | 0.06 | 78.1 | 0.05 |
| 25 | 83.36 | 0.04 | 78.32 | 0.06 | 81.22 | 0.05 |
| 26 | 82.43 | 0.05 | 90.42 | 0.03 | 76.8 | 0.05 |
| 27 | 80.97 | 0.05 | 82.86 | 0.05 | 71.8 | 0.05 |
| 28 | 83.23 | 0.04 | 76.9 | 0.06 | 71.16 | 0.06 |
| 29 | 78.94 | 0.05 | 84.02 | 0.04 | 75.23 | 0.05 |
| 30 | 82.23 | 0.05 | 82.58 | 0.05 | 66.82 | 0.06 |
| 31 | 70.54 | 0.06 | 79.89 | 0.05 | 69.06 | 0.05 |
| 32 | 83.87 | 0.05 | 84.8 | 0.05 | 73.53 | 0.06 |
| 33 | 82.42 | 0.05 | 90.64 | 0.03 | 77.01 | 0.05 |
| 34 | 90.76 | 0.03 | 88.17 | 0.03 | 69.17 | 0.06 |
| 35 | 74.33 | 0.06 | 87.36 | 0.04 | 74.22 | 0.04 |
| 36 | 93.34 | 0.03 | 85.68 | 0.04 | 70.02 | 0.06 |
| 37 | 92.62 | 0.03 | 81.98 | 0.05 | 73.85 | 0.05 |
| 38 | 86.3 | 0.04 | 84.71 | 0.04 | 68.14 | 0.06 |
| 39 | 89.96 | 0.03 | 89.08 | 0.04 | 68.78 | 0.07 |
| 40 | 84.75 | 0.05 | 87.32 | 0.04 | 72.04 | 0.06 |
Table A2.
The table presents the binary classification results obtained using DenseNet.
Table A2.
The table presents the binary classification results obtained using DenseNet.
| Sentence Number | NM-AD | NM-PD | AD-PD | |||
|---|---|---|---|---|---|---|
| Mean | Standard Deviation | Mean | Standard Deviation | Mean | Standard Deviation | |
| 1 | 86.74 | 0.04 | 76.69 | 0.05 | 63.71 | 0.08 |
| 2 | 77.94 | 0.05 | 69.28 | 0.07 | 63.68 | 0.06 |
| 3 | 78.91 | 0.05 | 80.71 | 0.05 | 71.8 | 0.05 |
| 4 | 78.71 | 0.05 | 70.86 | 0.06 | 63.32 | 0.06 |
| 5 | 71.1 | 0.06 | 69.07 | 0.06 | 69.2 | 0.06 |
| 6 | 83.81 | 0.05 | 76.28 | 0.06 | 51.54 | 0.09 |
| 7 | 77.11 | 0.05 | 81.42 | 0.05 | 67.7 | 0.07 |
| 8 | 76.67 | 0.04 | 80.62 | 0.05 | 62.05 | 0.07 |
| 9 | 82.89 | 0.05 | 73.27 | 0.06 | 74.49 | 0.05 |
| 10 | 80.99 | 0.04 | 77.29 | 0.06 | 72.72 | 0.06 |
| 11 | 85.55 | 0.05 | 77.31 | 0.06 | 70.91 | 0.06 |
| 12 | 69.72 | 0.07 | 82.29 | 0.05 | 50.8 | 0.08 |
| 13 | 84.87 | 0.05 | 75.9 | 0.05 | 65.62 | 0.07 |
| 14 | 81.57 | 0.05 | 76.22 | 0.06 | 64.97 | 0.07 |
| 15 | 79.89 | 0.05 | 82.23 | 0.05 | 67.38 | 0.06 |
| 16 | 87.15 | 0.04 | 86.09 | 0.04 | 67.42 | 0.06 |
| 17 | 74.54 | 0.06 | 73.7 | 0.06 | 52.24 | 0.08 |
| 18 | 76.72 | 0.07 | 75.5 | 0.06 | 78.59 | 0.05 |
| 19 | 84.2 | 0.05 | 84.2 | 0.05 | 65.88 | 0.06 |
| 20 | 76.43 | 0.05 | 78.33 | 0.05 | 61.52 | 0.06 |
| 21 | 82.23 | 0.05 | 80.04 | 0.04 | 75.23 | 0.05 |
| 22 | 80.94 | 0.05 | 73.43 | 0.06 | 61.5 | 0.07 |
| 23 | 74.84 | 0.04 | 75.92 | 0.05 | 75.24 | 0.05 |
| 24 | 76.88 | 0.06 | 68.81 | 0.06 | 78.1 | 0.05 |
| 25 | 83.36 | 0.04 | 78.32 | 0.06 | 81.22 | 0.05 |
| 26 | 82.43 | 0.05 | 90.42 | 0.03 | 76.8 | 0.05 |
| 27 | 80.97 | 0.05 | 82.86 | 0.05 | 71.8 | 0.05 |
| 28 | 83.23 | 0.04 | 76.9 | 0.06 | 71.16 | 0.06 |
| 29 | 78.94 | 0.05 | 84.02 | 0.04 | 75.23 | 0.05 |
| 30 | 82.23 | 0.05 | 82.58 | 0.05 | 66.82 | 0.06 |
| 31 | 70.54 | 0.06 | 79.89 | 0.05 | 69.06 | 0.05 |
| 32 | 83.87 | 0.05 | 84.8 | 0.05 | 73.53 | 0.06 |
| 33 | 82.42 | 0.05 | 90.64 | 0.03 | 77.01 | 0.05 |
| 34 | 90.76 | 0.03 | 88.17 | 0.03 | 69.17 | 0.06 |
| 35 | 74.33 | 0.06 | 87.36 | 0.04 | 74.22 | 0.04 |
| 36 | 93.34 | 0.03 | 85.68 | 0.04 | 70.02 | 0.06 |
| 37 | 92.62 | 0.03 | 81.98 | 0.05 | 73.85 | 0.05 |
| 38 | 86.3 | 0.04 | 84.71 | 0.04 | 68.14 | 0.06 |
| 39 | 89.96 | 0.03 | 89.08 | 0.04 | 68.78 | 0.07 |
| 40 | 84.75 | 0.05 | 87.32 | 0.04 | 72.04 | 0.06 |
Table A3.
The table presents the binary classification results obtained using EfficientNet.
Table A3.
The table presents the binary classification results obtained using EfficientNet.
| Sentence Number | NM-AD | NM-PD | AD-PD | |||
|---|---|---|---|---|---|---|
| Mean | Standard Deviation | Mean | Standard Deviation | Mean | Standard Deviation | |
| 1 | 86.74 | 0.04 | 76.69 | 0.05 | 63.71 | 0.08 |
| 2 | 77.94 | 0.05 | 69.28 | 0.07 | 63.68 | 0.06 |
| 3 | 78.91 | 0.05 | 80.71 | 0.05 | 71.8 | 0.05 |
| 4 | 78.71 | 0.05 | 70.86 | 0.06 | 63.32 | 0.06 |
| 5 | 71.1 | 0.06 | 69.07 | 0.06 | 69.2 | 0.06 |
| 6 | 83.81 | 0.05 | 76.28 | 0.06 | 51.54 | 0.09 |
| 7 | 77.11 | 0.05 | 81.42 | 0.05 | 67.7 | 0.07 |
| 8 | 76.67 | 0.04 | 80.62 | 0.05 | 62.05 | 0.07 |
| 9 | 82.89 | 0.05 | 73.27 | 0.06 | 74.49 | 0.05 |
| 10 | 80.99 | 0.04 | 77.29 | 0.06 | 72.72 | 0.06 |
| 11 | 85.55 | 0.05 | 77.31 | 0.06 | 70.91 | 0.06 |
| 12 | 69.72 | 0.07 | 82.29 | 0.05 | 50.8 | 0.08 |
| 13 | 84.87 | 0.05 | 75.9 | 0.05 | 65.62 | 0.07 |
| 14 | 81.57 | 0.05 | 76.22 | 0.06 | 64.97 | 0.07 |
| 15 | 79.89 | 0.05 | 82.23 | 0.05 | 67.38 | 0.06 |
| 16 | 87.15 | 0.04 | 86.09 | 0.04 | 67.42 | 0.06 |
| 17 | 74.54 | 0.06 | 73.7 | 0.06 | 52.24 | 0.08 |
| 18 | 76.72 | 0.07 | 75.5 | 0.06 | 78.59 | 0.05 |
| 19 | 84.2 | 0.05 | 84.2 | 0.05 | 65.88 | 0.06 |
| 20 | 76.43 | 0.05 | 78.33 | 0.05 | 61.52 | 0.06 |
| 21 | 82.23 | 0.05 | 80.04 | 0.04 | 75.23 | 0.05 |
| 22 | 80.94 | 0.05 | 73.43 | 0.06 | 61.5 | 0.07 |
| 23 | 74.84 | 0.04 | 75.92 | 0.05 | 75.24 | 0.05 |
| 24 | 76.88 | 0.06 | 68.81 | 0.06 | 78.1 | 0.05 |
| 25 | 83.36 | 0.04 | 78.32 | 0.06 | 81.22 | 0.05 |
| 26 | 82.43 | 0.05 | 90.42 | 0.03 | 76.8 | 0.05 |
| 27 | 80.97 | 0.05 | 82.86 | 0.05 | 71.8 | 0.05 |
| 28 | 83.23 | 0.04 | 76.9 | 0.06 | 71.16 | 0.06 |
| 29 | 78.94 | 0.05 | 84.02 | 0.04 | 75.23 | 0.05 |
| 30 | 82.23 | 0.05 | 82.58 | 0.05 | 66.82 | 0.06 |
| 31 | 70.54 | 0.06 | 79.89 | 0.05 | 69.06 | 0.05 |
| 32 | 83.87 | 0.05 | 84.8 | 0.05 | 73.53 | 0.06 |
| 33 | 82.42 | 0.05 | 90.64 | 0.03 | 77.01 | 0.05 |
| 34 | 90.76 | 0.03 | 88.17 | 0.03 | 69.17 | 0.06 |
| 35 | 74.33 | 0.06 | 87.36 | 0.04 | 74.22 | 0.04 |
| 36 | 93.34 | 0.03 | 85.68 | 0.04 | 70.02 | 0.06 |
| 37 | 92.62 | 0.03 | 81.98 | 0.05 | 73.85 | 0.05 |
| 38 | 86.3 | 0.04 | 84.71 | 0.04 | 68.14 | 0.06 |
| 39 | 89.96 | 0.03 | 89.08 | 0.04 | 68.78 | 0.07 |
| 40 | 84.75 | 0.05 | 87.32 | 0.04 | 72.04 | 0.06 |
References
- Al-Shoukry, S.; Rassem, T.H.; Makbol, N.M. Alzheimer’s diseases detection by using deep learning algorithms: A mini-review. IEEE Access 2020, 8, 77131–77141. [Google Scholar] [CrossRef]
- Pulido, M.L.B.; Hernández, J.B.A.; Ballester, M.Á.F.; González, C.M.T.; Mekyska, J.; Smékal, Z. Alzheimer’s disease and automatic speech analysis: A review. Expert Syst. Appl. 2020, 150, 113213. [Google Scholar] [CrossRef]
- Rowe, T.W.; Katzourou, I.K.; Stevenson-Hoare, J.O.; Bracher-Smith, M.R.; Ivanov, D.K.; Escott-Price, V. Machine learning for the lifetime risk prediction of Alzheimer’s disease: A systematic review. Brain Commun. 2021, 3, fcab246. [Google Scholar] [CrossRef] [PubMed]
- Arya, A.D.; Verma, S.S.; Chakarabarti, P.; Chakrabarti, T.; Elngar, A.A.; Kamali, A.M.; Nami, M. A systematic review on machine learning and deep learning techniques in the effective diagnosis of Alzheimer’s disease. Brain Inform. 2023, 10. [Google Scholar] [CrossRef]
- Cassani, R.; Estarellas, M.; San-Martin, R.; Fraga, F.J.; Falk, T.H. Systematic review on resting-state EEG for Alzheimer’s disease diagnosis and progression assessment. Dis. Markers 2018, 2018, 5174815. [Google Scholar] [CrossRef]
- AI Hub. Available online: https://www.aihub.or.kr/aihubdata/data/view.do?currMenu=115&topMenu=100&aihubDataSe=data&dataSetSn=565 (accessed on 1 April 2025).
- Peng, B.; Wang, S.; Zhou, Z.; Liu, Y.; Tong, B.; Zhang, T.; Dai, Y. A multilevel-ROI-features-based machine learning method for detection of morphometric biomarkers in Parkinson’s disease. Neurosci. Lett. 2017, 651, 88–94. [Google Scholar] [CrossRef]
- Yagis, E.; De Herrera, A.G.S.; Citi, L. Generalization performance of deep learning models in neurodegenerative disease classification. In Proceedings of the 2019 IEEE International Conference on Bioinformatics and Biomedicine (BIBM), San Diego, CA, USA, 18–21 November 2019; pp. 1692–1698. [Google Scholar] [CrossRef]
- Liu, M.; Cheng, D.; Wang, K.; Wang, Y.; Alzheimer’s Disease Neuroimaging Initiative. Multi-modality cascaded convolutional neural networks for Alzheimer’s disease diagnosis. Neuroinformatics 2018, 16, 295–308. [Google Scholar] [CrossRef]
- Salehi, A.W.; Baglat, P.; Sharma, B.B.; Gupta, G.; Upadhya, A. A CNN model: Earlier diagnosis and classification of Alzheimer disease using MRI. In Proceedings of the 2020 International Conference on Smart Electronics and Communication (ICOSEC), Trichy, India, 10–12 September 2020; pp. 156–161. [Google Scholar] [CrossRef]
- Ebrahimighahnavieh, M.A.; Luo, S.; Chiong, R. Deep learning to detect Alzheimer’s disease from neuroimaging: A systematic literature review. Comput. Methods Programs Biomed. 2020, 187, 105242. [Google Scholar] [CrossRef]
- Billeci, L.; Badolato, A.; Bachi, L.; Tonacci, A. Machine learning for the classification of Alzheimer’s disease and its prodromal stage using brain diffusion tensor imaging data: A systematic review. Processes 2020, 8, 1071. [Google Scholar] [CrossRef]
- López-de-Ipiña, K.; Solé-Casals, J.; Eguiraun, H.; Alonso, J.B.; Travieso, C.M.; Ezeiza, A.; Beitia, B. Feature selection for spontaneous speech analysis to aid in Alzheimer’s disease diagnosis: A fractal dimension approach. Comput. Speech Lang. 2015, 30, 43–60. [Google Scholar] [CrossRef]
- Bind, S.; Tiwari, A.K.; Sahani, A.K. A survey of machine learning based approaches for Parkinson disease prediction. Int. J. Comput. Sci. Inf. Technol. 2015, 6, 1648–1655. [Google Scholar]
- Lin, H.; Karjadi, C.; Ang, T.F.; Prajakta, J.; McManus, C.; Alhanai, T.W.; Au, R. Identification of digital voice biomarkers for cognitive health. Explor. Med. 2020, 1, 406. [Google Scholar] [CrossRef] [PubMed]
- Ding, H.; Mandapati, A.; Karjadi, C.; Ang, T.F.A.; Lu, S.; Miao, X.; Glass, J.; Au, R.; Lin, H. Association between acoustic features and neuropsychological test performance in the Framingham heart study: Observational study. J. Med. Internet Res. 2022, 24, e42886. [Google Scholar] [CrossRef]
- Cao, F.; Vogel, A.P.; Gharahkhani, P.; Renteria, M.E. Speech and language biomarkers for Parkinson’s disease prediction, early diagnosis and progression. npj Park. Dis. 2025, 11, 57. [Google Scholar] [CrossRef]
- Rana, A.; Dumka, A.; Singh, R.; Rashid, M.; Ahmad, N.; Panda, M.K. An efficient machine learning approach for diagnosing Parkinson’s disease by utilizing voice features. Electronics 2022, 11, 3782. [Google Scholar] [CrossRef]
- Rusz, J.; Cmejla, R.; Ruzickova, H.; Klempír, J.; Majerova, V.; Picmausova, J.; Roth, J.; Ruzicka, E. Acoustic analysis of voice and speech characteristics in early untreated Parkinson’s disease. In Proceedings of the MAVEBA 2011, Florence, Italy, 25–27 August 2011; pp. 181–184. [Google Scholar]
- Gosztolya, G.; Vincze, V.; Tóth, L.; Pákáski, M.; Kálmán, J.; Hoffmann, I. Identifying mild cognitive impairment and mild Alzheimer’s disease based on spontaneous speech using ASR and linguistic features. Comput. Speech Lang. 2019, 53, 181–197. [Google Scholar] [CrossRef]
- Li, G.; Daoudi, K.; Klempir, J.; Rusz, J. Linear classification in speech-based objective differential diagnosis of parkinsonism. In Proceedings of the 2018 IEEE International Conference on Acoustics, Speech and Signal Processing (ICASSP), Calgary, AB, Canada, 15–20 April 2018; pp. 5999–6003. [Google Scholar] [CrossRef]
- Vigo, I.; Coelho, L.; Reis, S. Speech- and language-based classification of Alzheimer’s disease: A systematic review. Bioengineering 2022, 9, 27. [Google Scholar] [CrossRef]
- Gunduz, H. Deep learning-based Parkinson’s disease classification using vocal feature sets. IEEE Access 2019, 7, 115540–115551. [Google Scholar] [CrossRef]
- Agbavor, F.; Liang, H. Artificial intelligence-enabled end-to-end detection and assessment of Alzheimer’s disease using voice. Brain Sci. 2022, 13, 28. [Google Scholar] [CrossRef]
- Park, C.-Y.; Kim, M.; Shim, Y.; Ryoo, N.; Choi, H.; Jeong, H.T.; Yun, G.; Lee, H.; Kim, H.; Kim, S.; et al. Harnessing the power of voice: A deep neural network model for Alzheimer’s disease detection. Dement. Neurocogn. Disord. 2024, 23, 1. [Google Scholar] [CrossRef]
- Hwang, Y.; Cho, H.; Yang, H.; Won, D.O.; Oh, I.; Lee, S.W. Mel-spectrogram augmentation for sequence to sequence voice conversion. arXiv 2020. [Google Scholar] [CrossRef]
- Noor, M.B.T.; Zenia, N.Z.; Kaiser, M.S.; Mamun, S.A.; Mahmud, M. Application of deep learning in detecting neurological disorders from magnetic resonance images: A survey on the detection of Alzheimer’s disease, Parkinson’s disease and schizophrenia. Brain Inform. 2020, 7, 1–21. [Google Scholar] [CrossRef] [PubMed]
- Celik, G.; Başaran, E. Proposing a new approach based on convolutional neural networks and random forest for the diagnosis of Parkinson’s disease from speech signals. Appl. Acoust. 2023, 211, 109476. [Google Scholar] [CrossRef]
- He, K.; Zhang, X.; Ren, S.; Sun, J. Deep residual learning for image recognition. In Proceedings of the IEEE Conference on Computer Vision and Pattern Recognition, Las Vegas, NV, USA, 27–30 June 2016; pp. 770–778. [Google Scholar]
- Huang, G.; Liu, Z.; Van Der Maaten, L.; Weinberger, K.Q. Densely connected convolutional networks. In Proceedings of the IEEE Conference on Computer Vision and Pattern Recognition, Honolulu, HI, USA, 21–26 July 2017; pp. 4700–4708. [Google Scholar]
- Tan, M.; Le, Q. EfficientNet: Rethinking model scaling for convolutional neural networks. In Proceedings of the 36th International Conference on Machine Learning, Long Beach, CA, USA, 9–15 June 2019; pp. 6105–6114. [Google Scholar]
- Suppa, A.; Costantini, G.; Asci, F.; Di Leo, P.; Al-Wardat, M.S.; Di Lazzaro, G.; Scalise, S.; Pisani, A.; Saggio, G. Voice in Parkinson’s disease: A machine learning study. Front. Neurol. 2022, 13, 831428. [Google Scholar] [CrossRef]
- Ma, A.; Lau, K.K.; Thyagarajan, D. Voice changes in Parkinson’s disease: What are they telling us? J. Clin. Neurosci. 2020, 72, 1–7. [Google Scholar] [CrossRef]
- Younis, A.; Qiang, L.; Nyatega, C.O.; Adamu, M.J.; Kawuwa, H.B. Brain tumor analysis using deep learning and VGG-16 ensembling learning approaches. Appl. Sci. 2022, 12, 7282. [Google Scholar] [CrossRef]
- Alsharabi, N.; Shahwar, T.; Rehman, A.U.; Alharbi, Y. Implementing magnetic resonance imaging brain disorder classification via AlexNet–quantum learning. Mathematics 2023, 11, 376. [Google Scholar] [CrossRef]
- Alorf, A. Transformer and Convolutional Neural Network: A Hybrid Model for Multimodal Data in Multiclass Classification of Alzheimer’s Disease. Mathematics 2025, 13, 1548. [Google Scholar] [CrossRef]


Disclaimer/Publisher’s Note: The statements, opinions and data contained in all publications are solely those of the individual author(s) and contributor(s) and not of MDPI and/or the editor(s). MDPI and/or the editor(s) disclaim responsibility for any injury to people or property resulting from any ideas, methods, instructions or products referred to in the content. |
© 2025 by the authors. Licensee MDPI, Basel, Switzerland. This article is an open access article distributed under the terms and conditions of the Creative Commons Attribution (CC BY) license (https://creativecommons.org/licenses/by/4.0/).