Article

Risk Assessment of Supplier R&D Investment Based on Improved BP Neural Network

1
China Research Center for Emergency Management, Wuhan University of Technology, Wuhan 430070, China
2
School of Safety Science and Emergency Management, Wuhan University of Technology, Wuhan 430070, China
*
Authors to whom correspondence should be addressed.
Mathematics 2025, 13(13), 2094; https://doi.org/10.3390/math13132094
Submission received: 17 April 2025 / Revised: 10 June 2025 / Accepted: 11 June 2025 / Published: 26 June 2025

Abstract

As market competition intensifies, the survival and development of suppliers increasingly rely on research and development (R&D) investment and innovation. Due to the uncertainty of factors affecting supplier R&D investment, the risks faced by supplier R&D investment are also uncertain. Therefore, identifying and assessing risks in advance and controlling risks can provide effective support for suppliers to carry out risk management of R&D investment. This paper selects key factors through literature review and factor analysis, and establishes a risk index evaluation system for R&D investment of medical material suppliers. Seventeen indicators that affect and constrain project investment factors were identified as input variables of the back propagation (BP) neural network, the comprehensive score of the R&D investment risk assessment was used as the output variable of medical supplies suppliers, and a risk assessment model for the R&D investment of medical material suppliers was established. By leveraging the ability of particle swarm optimization (PSO), whale optimization algorithm (WOA), and genetic algorithm (GA) to search for global optimal solutions, the BP neural network is improved to avoid becoming trapped in local optimal solutions and enhance the model’s generalization ability. The improvement in accuracy and convergence speed of these three methods is compared and analyzed. The results show that the BP neural network improved by the genetic algorithm has better accuracy and faster convergence speed in predicting and assessing risks. This indicates that the BP neural network model improved by genetic algorithm is effective and feasible for predicting the risk assessment of the R&D investment of medical supplies suppliers.

1. Introduction

In today’s globalized and knowledge-based world, facing the development of personalized products, users are increasingly demanding, putting forward higher requirements for enterprise product development capabilities, leading to more intense competition among enterprises and increasing difficulty in their survival. In order to continuously develop in the fierce competition, enterprises must adapt to the market demand and develop new products in time. However, the R&D of medical products has a long cycle, slow effectiveness, large investment, and high risk. Although enterprises have certain R&D abilities, often limited by talent, technology, experience, or capital and other factors, unable to bear the risks of developing new products alone. This requires medical material suppliers to organize their production and operation activities through production socialization, realize resource sharing and complementary advantages, effectively reduce the cost and risk required for R&D, accelerate the R&D process, achieve product personalized and low-cost manufacturing, and improve the market competitiveness of enterprises.
In practice, although cooperative R&D has provided more effective funding and talent support to all parties, the complexity of the R&D process and the uncertainty of the external environment have increased the probability of systemic risks in collaborative R&D, which will threaten the production of products. Therefore, the risk management of cooperative R&D is particularly important, and risk assessment is the core and top priority of risk management. To reduce the losses caused by the R&D investment of medical material suppliers, it is necessary to adopt reasonable and effective methods to develop the risk assessment system and model of enterprise R&D investment, providing decision-makers with a basis for risk avoidance.
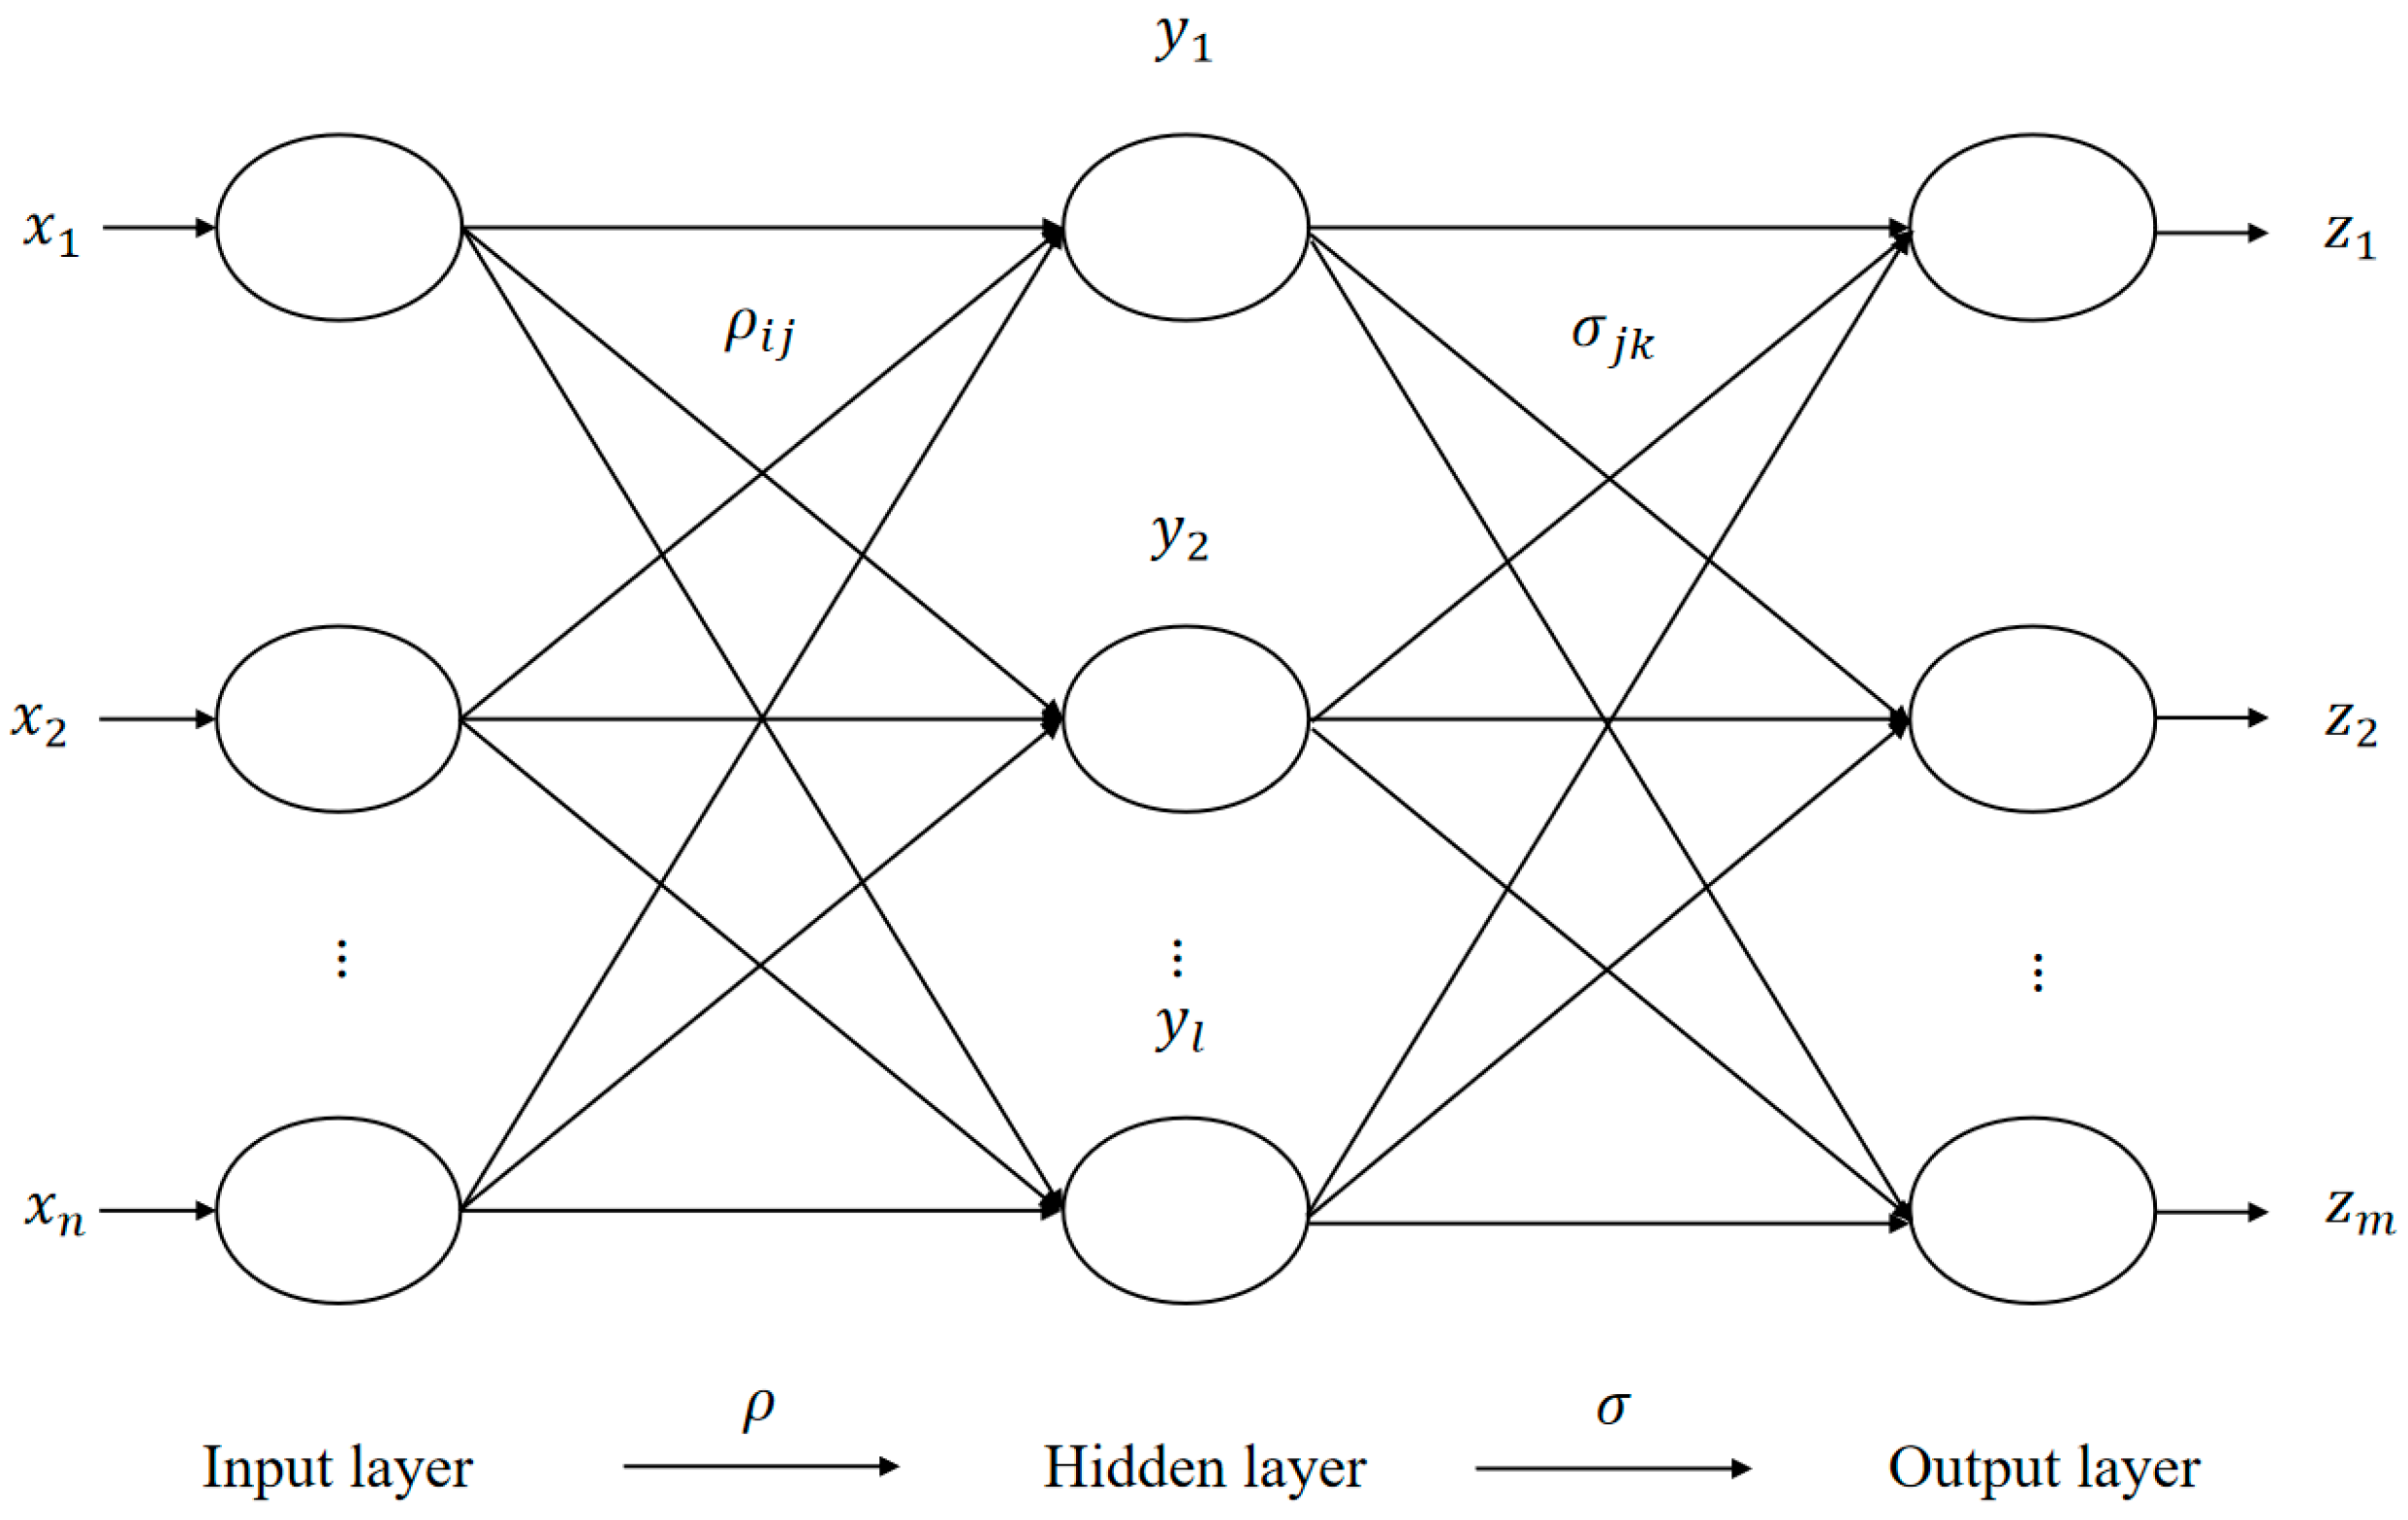
Firstly, based on the existing research results at home and abroad and the performance evaluation indicators of enterprises of the Ministry of Finance of China, this paper initially constructs a risk assessment system for R&D investment of medical supplies suppliers. Then, the risk of R&D investment of medical material suppliers is predicted by using the adaptive learning and generalization ability of the BP neural network. Meanwhile, in order to avoid the defects of slow convergence speed and being prone to falling into local minima of the BP neural network, the particle swarm optimization algorithm, whale optimization algorithm and genetic algorithm are, respectively, used to optimize the BP neural network, and a risk assessment model for R&D investment of medical supplies suppliers is established. Finally, the evaluation results of these three models are compared and analyzed through case analysis. The results show that all three algorithms have good risk prediction effects. Among them, the BP neural network improved by genetic algorithm has a faster convergence speed and higher prediction accuracy, and is more suitable for predicting the risks of R&D investment of medical supplies suppliers.

Literature Review

As for the research on risk assessment of enterprise R&D investment, this paper mainly summarizes the risk assessment index system and evaluation method from two aspects. Scholars divide risk factors from different angles, give different evaluation indicators, and build an enterprise risk index evaluation system. At present, the common risk investment evaluation methods at home and abroad include fuzzy comprehensive evaluation, analytic hierarchy process, gray system theory, rough set theory, regression analysis, and BP neural network.
Many risk assessment methods require the use of a variety of evaluation indicators. Systematic and scientific risk assessment indicators are crucial for risk assessment and even the risk management of the entire product R&D activity. Ref. [1] were the first to use telephone surveys and questionnaires to draw the American risk project evaluation model through factor analysis. It includes five categories: market attractiveness, product differentiation, management capability, ability to withstand environmental threats, and liquidity. After the 1990s, Professors [2] from the United States jointly conducted relevant surveys again. They categorized the aspects into strategic thinking, management ability, and revenue, and came up with 15 basic evaluation criteria. Ref. [
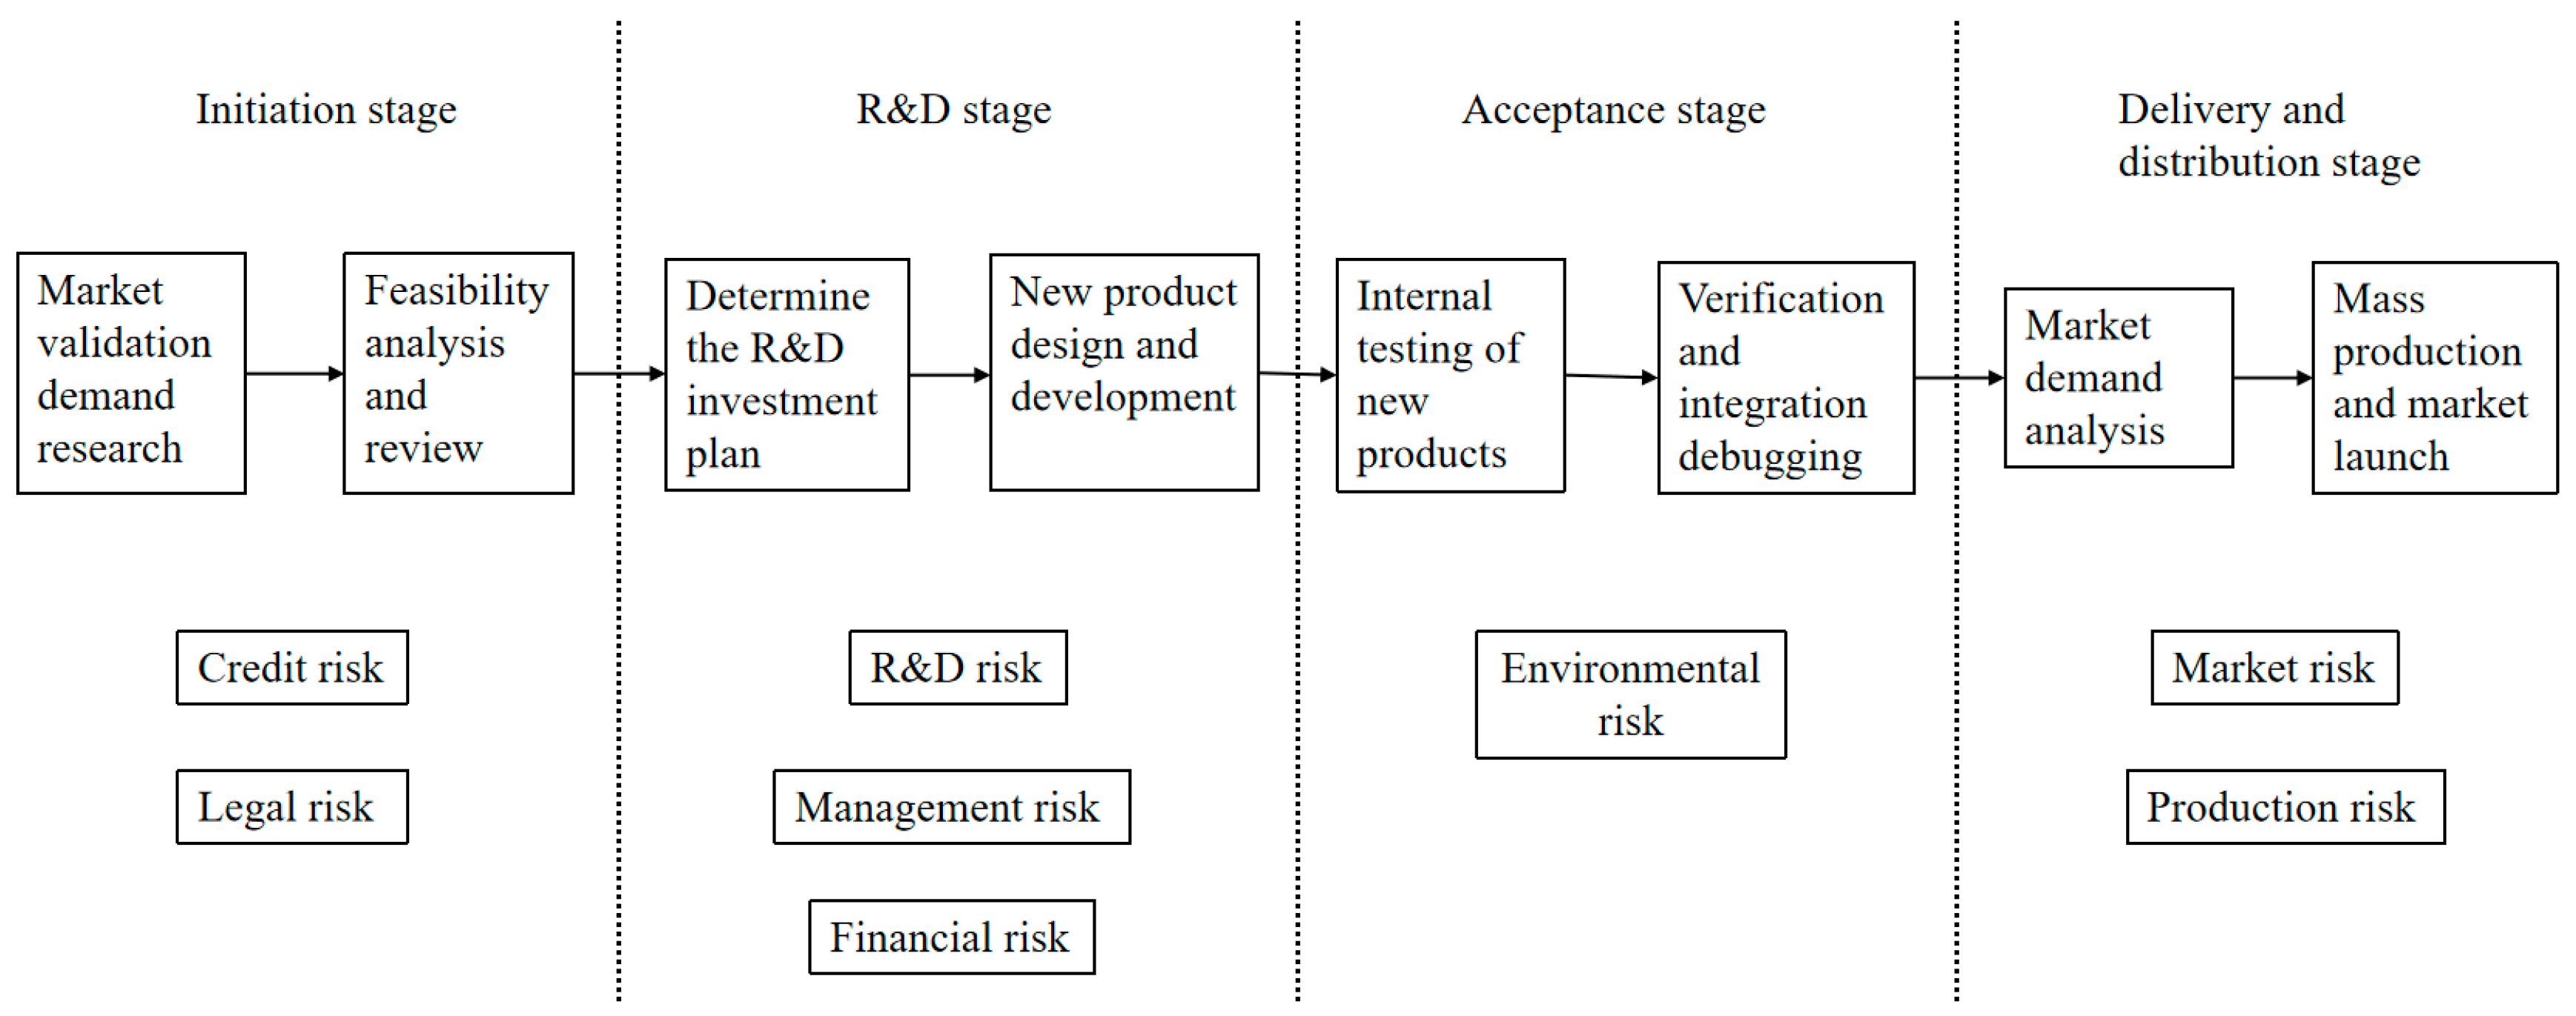
3] selected six indicators, including R&D risk, technology risk, production risk, market risk, management risk, and environmental risk, as the evaluation indicators for venture capital. According to the characteristics of cooperative R&D projects of high-tech enterprises, [4] classified the risks of R&D projects into three categories: performance risk, relationship risk, and knowledge spillover risk. Ref. [5] analyzed and summarized the factors affecting supply chain risk, and identified environmental risk, political risk, cooperation risk, demand risk, supply risk, logistics risk, and information risk as the first-level evaluation indicators of the supply chain risk evaluation index system. Ref. [6] sorted out eight primary risks faced by cooperative R&D projects between enterprises, namely technical risk, market risk, financial risk, management risk, cooperation risk, intellectual property risk, environmental risk, and force majeure risk. Each primary risk was subdivided into two to five secondary risks. Ref. [7] screened and filtered multiple selected risk factors through fishbone analysis and a four-quadrant diagram of risk factors. He divided the risk factors of chemical new material product R&D projects into five parts: management, finance, technology, environment, and market.
At present, the combination of qualitative and quantitative methods is commonly used both domestically and internationally to evaluate the risk of enterprise R&D investment. Many scholars choose to use expert evaluation scores to score and determine indicator weights. Ref. [8] proposed a fuzzy set theory approach to deal with the imprecision of language and the fuzziness of human judgment. They applied the Mamdani fuzzy reasoning system to evaluate the green performance of enterprises. However, the expert scoring method is highly subjective, and some scholars have begun to seek other ways to correct the weights. Ref. [9] comprehensively applied gray system theory and AHP to construct a gray multi-level evaluation model. By processing scattered evaluation information into weight vectors describing different gray classes, and then performing single processing. Thus, a comprehensive evaluation value was obtained, which improved the evaluation accuracy. Ref. [10] studied the credit risk assessment of supply chain under the financial model and proposed a supply chain credit risk evaluation index system based on the credit status of core enterprises and the relationship between supply chains. The evaluation model was established by the support vector machine (SVM) method and compared with the regression analysis method to verify its effectiveness. Ref. [11] used the analytic hierarchy process (AHP) and fuzzy comprehensive evaluation method, respectively, to build a risk evaluation index system and a risk warning system of the enterprise R&D alliance. Ref. [12] combined the SMOTE algorithm with the random forest model and applied it to the research of credit risk management of supply chain finance. It was compared and analyzed with the SMOTE-RF model and the Logistic model. The results show that the random forest model based on the C-SMOTE algorithm was more effective in helping commercial banks manage the credit risk of online supply chain finance and reduce credit losses. Ref. [13] implemented a three-classification system based on the two-classification system and constructed a sample-weighted support vector machine model. Through empirical analysis, they verified that the optimized and improved multi-classification sample-weighted support vector machine has better predictive ability. Based on rough set theory and fuzzy comprehensive evaluation, from the perspective of supply and demand risk of supply chain, [14] adopted AHP to analyze the supply and demand risk factors existing in the supply chain of emergency materials from both supply and demand sides. They established a dual-objective optimization model with the goal of maximum customer satisfaction and total supply chain revenue.
The evaluation results of these methods are easily influenced by the subjective consciousness and experience of evaluators. In recent years, the rapidly developing neural network has been widely applied due to its unique advantages of self-learning, self-organization, and self-adaptation, which can better deal with multi-factor, uncertainty, and nonlinear problems [15,16,17]. It does not require a precise mathematical model, once the weight and threshold values are determined by learning a certain number of instances, the investment risk of the same type of high-tech projects can be evaluated, avoiding the subjective influence of artificially setting weights and correlation [18,19,20]. However, the initial weights and thresholds of traditional BP neural networks are randomly selected, and improper values will easily cause the network to fall into a local optimal state, affecting the accuracy of evaluation. Therefore, some scholars have sought other algorithms to optimize the performance of BP neural networks. Ref. [21] proposed a method to optimize BP neural networks based on the ant colony optimization algorithm to make it jump out of the local optimal solution. However, the training speed of this method has not been significantly improved. Ref. [22] constructed a risk assessment model of industrial technology innovation alliance based on BP neural network improved by particle swarm optimization, which improved the accuracy and feasibility of the risk assessment model. Ref. [23] used the method of combining particle swarm optimization and BP neural network to research the financial risk early warning of manufacturing enterprises. The results show that particle swarm optimization accelerates the convergence speed of the network and improves the prediction accuracy. Ref. [24] applied the improved particle swarm optimization algorithm to optimize the distribution path of emergency supplies in public health emergencies and verified the effectiveness of the algorithm. Ref. [25] proposed a BP algorithm optimization method based on a genetic algorithm to accelerate the training speed of BP and overcome the disadvantage of BP being easily stuck in local minima. Ref. [26] utilized principal component analysis and combined a genetic algorithm with a BP neural network to evaluate the credit risk of micro, small, and medium-sized enterprises. The research results show that this model demonstrates strong stability in assessing the credit risks of micro, small, and medium-sized enterprises. Ref. [27] used the improved whale optimization algorithm as the shallow BP neural network structure search strategy and constructed a weight threshold search optimization method based on the optimal network structure of the shallow BP neural network. The experimental results show that the improved whale optimization algorithm not only has good optimization performance in solving complex functions of different dimensions, but also has better prediction accuracy and generalization performance in regression tasks.
Choosing which evaluation method to evaluate the R&D investment risks of medical supplies suppliers is a key factor that affects the authenticity, objectivity, simplicity, and effectiveness of the evaluation results. To sum up, the comparison of several methods in terms of core capabilities and data requirements is shown in Table 1:
Artificial neural network has good objectivity and accuracy, and is widely used in various fields. However, its application in the field of risk assessment for collaborative R&D among high-tech enterprises is relatively limited. In this paper, the literature research method and factor analysis method are used to build a risk assessment system for R&D investment of medical materials suppliers. By the ability of global search for the optimal solution of PSO, WOA, and GA to improve the BP neural network, a risk assessment model for R&D investment is established, and the prediction accuracy and convergence speed of the three algorithms were compared. Applying this model to predict the risks of medical material suppliers in selecting R&D investment projects can help enterprises analyze the problems existing in the process of cooperative R&D, help enterprises have a deeper understanding of the feasibility and investment value of R&D investment projects, and reduce the losses caused by project failures.

2. Materials and Methods

2.1. Supplier R&D Investment Risk Evaluation Index System

The causes of R&D investment risk of medical material suppliers have multi-dimensional driving characteristics. They are mainly affected by endogenous variables such as technological maturity of the enterprises themselves, the efficiency of management resource allocation, and the stability of the capital chain, as well as exogenous variables such as market volatility and natural environment changes. In order to build a suitable risk assessment index system for cooperative R&D projects, this paper first collected and analyzed the relevant literature and sorted out the business of major medical material suppliers in China. The business process diagram of medical material products from the project initiation stage, R&D stage, acceptance stage, and delivery and distribution stage was obtained. According to the main business processes of each stage, the main risk points of each main process were analyzed, as shown in Figure 1.
According to the possible risks in the main business process, we follow the design principles of scientificity, applicability, standardization, systematicness, operability, and the combination of qualitative analysis and quantitative analysis of the R&D investment risk assessment index system for medical material suppliers. It covers various types of risk factors and ensures that the selected indicators are highly independent. Data acquisition and calculation are relatively convenient. On the basis of the existing literature review, based on the research results at home and abroad, and the enterprise benefit evaluation index system of the Ministry of Finance of China, the risk factors are sorted and classified, and the risk factors related to R&D cooperation are extracted. Then, combined with the characteristics of high risk, long cycle, strong supervision, and technology-intensive R&D investment of medical material suppliers, the factors suitable for cooperative R&D of medical material suppliers are screened out. A comprehensive index system for supplier R&D investment risk evaluation is designed preliminarily. As shown in Table 2, there are six categories and 17 secondary indicators.
Different from the previous qualitative research, all the indicators in this paper are quantitative. This paper uses growth rate of credit impairment value to represent the credit rating, the number of patents to represent the intellectual property protection, the proportion of administrative expenses to operating income to represent the senior decision-making ability, the growth rate of staff compensation payable to represent the team staff mobility, the growth rate of administrative expenses to represent the talent management, the gross profit rate to represent the production efficiency, and the growth rate of revenue to represent the market share, etc. Although not entirely accurate, it avoids the bias caused by subjective ratings to a certain extent.

2.2. BP Neural Network Optimized by Different Algorithms

In this paper, a BP neural network is used to establish the risk assessment model of R&D investment of medical material suppliers, which can not only get rid of the influence of human factors and fuzzy randomness, but also ensure the accuracy of the assessment. To accurately analyze the risk level of R&D investment of medical material suppliers and effectively implement the risk management and other aspects in the process of R&D investment of medical material suppliers, an effective evaluation system should be established.
BP neural network has been well applied in nonlinear simulation problems. However, due to the gradient descent method used by BP neural network, the error training function is a strict convex function, which leads to the difference in the results of each operation when searching for the optimal connection weights and thresholds, making the model unstable, easy to fall into local optimal values, and difficult to obtain the global optimal solution. Through literature research, it has been found that PSO is suitable for solving the problem of finding global optimal solutions [38]. WOA can help BP neural networks avoid becoming stuck into local optimal solutions and improve the generalization ability of the model [39]. GA can avoid the problem of BP networks falling into local optimal solutions when optimizing weights and thresholds [40,41]. Therefore, the algorithms tested in this study mainly include PSO, WOA, and GA. They have excellent abilities in global search, convergence speed, balance between exploration and development, parallel search, and adaptability, making them suitable for solving many optimization problems. These three algorithms are typical and commonly used, and have shown good performance and predictive ability in previous research [42].

2.2.1. Structure and Parameter Design of BP Neural Network

Most BP neural network models are divided into an input layer, a hidden layer, and an output layer. Their network topology structure is shown in Figure 2.
The input layer has n neurons, the hidden layer has l neurons, and the output layer has m neurons. The first input neuron n , that is, the n -dimensional vector X R n , where X = ( x 1 , x 2 , , x n ) T . The output of l neurons in the hidden layer are Y R l , where Y = ( y 1 , y 2 , , y l ) T , and the neuron thresholds are α j , j ( 1 , l ) . The weights from the input layer to the hidden layer can be an n × l matrix, that is, ρ i j i 1 , n , j ( 1 , l ) . The output of m neurons in the output layer are Z R m , where Z = ( z 1 , z 2 , , z m ) T , and the neuron threshold is β k , k ( 1 , m ) . The weight from the hidden layer to the output layer can be an l × m matrix, that is, σ j k j 1 , l , k ( 1 , m ) .
The hidden layer of the BP neural network requires a continuous excitation function. Compared with the threshold type and linear transfer type excitation function, the S-type excitation function has a simple differential expression and easy representation, and it also has good nonlinear mapping ability. In this case, the sigmoid function is selected as the transfer function.
According to the calculation formula of neuron output signal, each element output of each unit layer of the neural network can be obtained as follows:
U i = i = 0 n ρ i j x i ,
V i = U i α j = i = 0 n ρ i j x i α j ,
Z i = f ( V i ) .
U i is the output after linear weighting and summation, V i is the output after deviation adjustment, f ( · ) is the activation function, and Z i is the neuron output. The output signals of each neuron in the hidden layer and output layer of the BP neural network are:
y j = f ( i = 1 n ρ i j x i α j ) ,
z k = f ( j = 1 n σ j k y j β k ) .
The learning process of the BP neural network is to dynamically adjust the connection weights ρ i j and σ j k between the neurons of the input layer, the hidden layer, and the output layer, as well as the threshold values α j and β k of the neurons of the hidden layer and the output layer. So as to obtain the output values consistent with the actual expectation.
The output error of the k -th neuron in the output layer is defined as:
e k = d k z k .
d k is the desired output of the k -th neuron, and z k is the output of the k -th neuron.
When the k -th training sample is sent to the output layer, the error between the single-layer output and the expected value is:
E k = 1 m k = 1 m ( d k z k ) 2 .
The total error of the training samples is
E = l = 1 T E k = 1 m T l = 1 T k = 1 m ( d k z k ) 2 .
l represents the number of neurons in the hidden layer, T is the number of training set samples, and m is the number of nodes in the output layer. If E < ε , ( ε is the set minimum error value), then the learning process ends, and the threshold of the neuron and the corresponding weight are determined. if E > ε , ( t + 1 ) times of learning are required.
Adjust the weight along with the negative gradient, that is
Δ σ j k = μ E σ j k = μ E N k N k σ j k ,
Δ ρ i j = μ E ρ i j = μ E N i N i ρ i j .
where μ is the learning rate, μ ( 0 ,   1 ) , and N k is the input of neurons in each layer.
N k σ j k = y j ,
N k ρ i k = x i .
The error signal between the output layer and the hidden layer is defined as follows:
δ k z = E N k ,
δ j y = E N j .
Then, the adjusted weight expression can be rewritten as follows:
Δ σ j k = μ δ k z y j ,
Δ ρ i j = μ δ j y x i .
Combined with the activation function, we can obtain the following:
δ k z = ( d k z k ) z k ( 1 z k ) ,
δ j y = ( k = 1 m δ k z σ j k ) y j ( 1 y j ) .
At present, there is no unified standard for the selection of the number of hidden layer nodes, which is usually determined based on multiple simulation experiments or some reference formulas of previous scholars. This paper first determines the boundary of the number of hidden layers according to the following formula:
l = n + m + α ,
l = log 2 n ,
l = n m + α .
where l is the number of hidden layer nodes, n is the number of input layer nodes, m is the number of output layer nodes, α is a constant between 1 and 10. Continuously change the value of α and train with the sample set to determine the number of nodes in the hidden layer corresponding to the minimum network error.

2.2.2. Improved BP Neural Network Based on PSO

The PSO algorithm originated from the research on the foraging behavior of birds. When looking for food, they will determine their position in the group based on their speed and position, and also adjust their behavior according to environmental conditions and the distribution of food. The core idea is to search for the optimal solution of each particle and use these optimal solutions to make the whole particle swarm optimal.
In the PSO algorithm, it is assumed that each particle represents one candidate solution in the solution space, and the fitness function is used to determine the quality of the candidate solution. This article assumes that the search for the optimal solution is carried out in a D-dimensional space mapping. Assuming that there are M particles initialized, these particles form a swarm intelligence dynamical system to be studied T = { Z 1 , Z 2 , , Z M } , i = 1,2 , , M , where Z i = Z i 1 , Z i 2 , , Z i D , i = 1,2 , , M , Z i represents the position vector of the i -th particle in the D-dimensional space. S i = S i 1 , S i 2 , , S i D , i = 1,2 , , M , S i represents the velocity vector of the i -th particle in the D-dimensional space. The optimal position of the individual particles searched so far is represented as P b e s t i = ( P b e s t i 1 , P b e s t i 2 , , P b e s t i D ) , and the global optimal position is G b e s t = ( G b e s t 1 , G b e s t 2 , , G b e s t D ) . The update of particle position consists of four parts: the current position and velocity of the particle, and the distance between the current position of the particle and P b e s t i and G b e s t , respectively.
The key to optimizing the BP neural network by applying the particle swarm optimization algorithm is to optimize the initial weight and threshold, so as to obtain the BP neural network composed of the optimal initial weight and threshold. It overcomes the problem that the model is prone to fall into local optimization, and improves the prediction accuracy of the model. The basic idea is to find the optimal solution through the cooperation and information sharing among individuals in the group. The specific process is as follows:
(1)
Initialize parameters. Determine the number of neurons in each layer of the BP neural network and initialize their connection weights and thresholds. According to the number of the weights and thresholds, the particle swarm dimension D , population size M , iteration number N , particle velocity vector s i , d , position vector p i , d , and learning factor c i are determined. The weights and thresholds of the neural network are encoded with real numbers to obtain the initial population. The recursive formula of the particle algorithm is
s i , d k + 1 = s i , d k + c 1 r 1 P i , d p i , d k + c 2 r 2 G i , d p i , d k ,
p i , d k + 1 = p i , d k + s i , d k .
where s i , d k represents the velocity of the d -th dimension of the i -th particle in the k -th iteration, p i , d k represents the position of the d -th dimension of the i -th particle in the k -th iteration, P i , d and G i , d represent the pithiness value of the optimal position and the global optimal position of the particle, respectively. c 1 , c 2 represent the learning factors, and r 1 and r 2 represent the random numbers within (0, 1).
(2)
The mean square error of each iteration in the neural network is taken as the fitness function of the particle.
f i , k = 1 m k = 1 m ( d k z k ) 2 .
The current fitness value of the individual is compared with the fitness value P i , d of the optimal position of the individual. If the current fitness value is greater than the fitness value of P i , d , then update P i , d ; otherwise, the optimal position of the individual remains unchanged. The minimum fitness value of the particle in the current round is compared with the fitness value of the optimal position G i , d of the group. If the minimum fitness value of the particle in the current round is greater than the fitness value of G i , d , then update G i , d ; otherwise, the optimal position of the group remains unchanged.
(3)
Check whether the iteration termination condition is met. If it is met, stop and output the optimal particle. Then, reverse decode to obtain the optimal weight and threshold. Otherwise, repeat steps 2–3.
(4)
Learn and train according to the BP neural network, and use the results to predict supplier R&D investment risk assessment.

2.2.3. Improved BP Neural Network Based on WOA

The whale optimization algorithm is an intelligent optimization algorithm proposed by [43] to simulate the hunting behavior of humpback whales. When looking for food, whales will determine their position in the group based on their size and speed, and adjust their behavior according to environmental conditions and the distribution of food. The core idea is to find the optimal solution by simulating the behavior of biological groups in the environment. It mainly includes three stages: encircling the prey, hunting for prey, and searching for prey. The main steps of WOA are as follows:
(1)
Encircling the prey. Assuming that the whale closest to the prey is considered the local optimum. The remaining whales update their position from the optimal distance and gradually move towards it, encircling the prey:
D = C · X * t X ( t ) ,
X t + 1 = X * t A · D .
where t represents the current number of iterations, X * is the local optimal solution, X is the position vector, D is the distance difference between the current individual X ( t ) and the current optimal individual X * t , and A and C are coefficient vectors.
A = 2 · a · r a ,
C = 2 · r .
where a is a vector that linearly decreases from 2 to 0, and r is a random vector of [0, 1].
(2)
Hunting for prey. This process is divided into two parts: contraction enveloping and spiral swimming, where the contraction enveloping mechanism is achieved by reducing the value of a in Equation (27). The mathematical equation for spiral swimming is as follows:
X t + 1 = D · e b l · cos 2 π l + X * t .
where D = X * t X ( t ) represents the distance from the i -th whale to the prey, b is a constant that defines the spiral shape of the number, and l is a random number between [−1, 1].
(3)
Search for prey. After encircling the prey, the individual humpback whale gradually approaches the optimal value when the distance coefficient A is less than 1. Under the premise of A < 1 , the larger A is, the more humpback whales can swim in a larger space, which makes the whale algorithm more capable of global optimization.
In addition to bubble net hunting, humpback whales also randomly search for prey by changing the value of A. The mathematical model is as follows:
D = C · X r X ,
X t + 1 = X r A · D .
where X r is a random position vector selected from the current population.
The key to applying WOA to improve the BP neural network is to optimize its initial weights and thresholds. The training error of the BP neural network is taken as the individual fitness value, and the optimal initial weight and threshold of the BP neural network are selected. The improvement steps of the BP neural network by the WOA are as follows:
(1)
BP neural network initialization. Determine the number of input layer, hidden layer, and output layer of the network, and initialize the weights and threshold of the BP neural network.
(2)
Calculate the length of the decision variable of the whale optimization algorithm WOA and select the mean square error as the objective function of the optimization.
(3)
Calculate individual whale fitness. According to the above WOA, find the position of the optimal fitness value, record the position vector, and use it as the current optimal individual position to update the whale individual position.
(4)
Terminate the optimization algorithm when the maximum number of iterations is met or the error accuracy requirements are achieved, and assign the currently obtained optimal weights and threshold parameters to the BP neural network.
(5)
Train and test using the optimized BP neural network. If the error condition is met, terminate the algorithm and output the model; otherwise, repeat steps (2)–(4).

2.2.4. Improved BP Neural Network Based on GA

The basic individual in a genetic algorithm is a set of encoding strings, which are composed of chromosomes using binary encoding. Each encoding unit is a gene, corresponding to a parameter dimension of the solution space. Each chromosome represents a possible candidate solution. Genetic algorithm, as an iterative optimization process of the biological evolution mechanism, performs selection, crossover, and mutation operations on chromosomes. Individuals are evaluated according to the fitness value, so that the population evolves to the best individual in the population in a global parallel way, and gradually obtains a better population until the expected error requirement is reached.
The improvement steps of GA on the BP neural network are as follows:
(1)
Select network structure and learning rules. Randomly generating a set of network weight values is equivalent to randomly generating multiple chromosomes to generate an initial population.
(2)
Input the initial weights and thresholds corresponding to each chromosome into the BP neural network, and calculate the error E i of the neural network under each chromosome, and obtain the fitness value of chromosome i :
f i = M E i
Among them, M is a large number, in order to prevent the fitness value from being too small.
(3)
Select some individuals with the highest fitness values to form the paternal parent. Using operators such as crossover and mutation to deal with the current population and generate a new generation population.
(4)
Repeat steps (2) and (3) above to continuously evolve the weight distribution until a complete set of initial weights and thresholds with the minimum error in the BP neural network is obtained.
(5) Bring the trained initial weights into the established BP neural network for neural network training.

3. Risk Assessment of Supplier R&D Investment Under Different Improved Algorithms

3.1. Parameter Setting

In this paper, a three-layer BP neural network topology is adopted. The first layer is the input layer, which includes 17 input nodes corresponding to 17 risk assessment indicators of the BP neural network algorithm. The second layer is the hidden layer, where the training sample set is trained under different hidden layer nodes using BP neural network and PSO-BP neural network, resulting in the optimal number of hidden layer nodes being three for both algorithms. The third layer is the output layer, with one output node, which provides a score for the R&D investment risk assessment of medical material suppliers. The training parameters are shown in Table 3, Table 4, Table 5 and Table 6.

3.2. Sample Data Selection and Preprocessing

This paper selects the medical material supplier as the main research object. After removing some enterprises with missing or incomplete data, a total of 20 listed companies were selected for this study. The operating income of these enterprises all exceeds 100 million yuan. As the industry leaders, these enterprises face more pressure to innovate. How to enhance their market competitiveness and ensure the healthy and sustainable development of the industry, developing new products may be a way. The sample data in this paper are from the Shanghai Stock Exchange and the Shenzhen Stock Exchange. After comprehensive sorting, the sample data of 20 listed enterprises in the past 3 years were obtained. The data from these three years was sorted into 60 sample points. In order to further verify the prediction accuracy of the model, the total samples were randomly divided into training samples and test samples at a ratio of 2:1.
The various index levels and dimensions of enterprises are different. In order to keep the correlation of indicators consistent. First of all, this paper normalizes and dimensionless the indicators. Then, after standardizing the data, the SPSS20 software is used to calculate the correlation matrix of indicators, and the indicators with a correlation degree exceeding 0.8 are filtered. It is found that none of the selected indicators has a correlation degree greater than 0.8, as shown in Table 7. In addition, it is found that there is a correlation between most of the indicators, indicating that principal component analysis and factor analysis can be performed to extract common factors.
SPSS software is used to conduct factor analysis on the 17 standardized indicators, and the explanation of total variance, scree map, and component matrix is obtained, respectively. The key to the explanation of the total variance table is the eigenvalue and variance contribution rate. The eigenvalue greater than 1 is usually regarded as the standard to retain the principal component, because it indicates that the information interpreted by the component exceeds a single original variable. The cumulative variance contribution rate of 70–85% is enough to show that the component extraction effect is great. The explanation of total variance in Table 8 shows that the cumulative variance contribution rate of the first five factors reached 74.500%, more than 70%.
The scree plot in Figure 3 is a visual verification of the explanation of the total variance table. It can also be found that the eigenvalue decreases gently after principal component 5. It shows that the number of principal components is reasonable and can reflect almost all the information of the index system. Therefore, this paper selects the first 5 principal components as eigenvalues for analysis.
The initial component matrix can be obtained after the rotation of the first 5 common factors by the factor load. The Kaiser normalized maximum variance method is used to orthogonally rotate the initial component matrix to obtain the rotation component matrix, so as to calculate the correlation between the five common factors and the initially selected variables. The absolute value of the factor loading of each indicator on each component is greater than 0.4, so these 17 variables are retained, as shown in Table 9.
We obtain the component score coefficient matrix through the characteristic values in the component matrix and the explanation of total variance. Then, we extract the variance contribution rate of each principal component as the weight from the explanation of the total variance table. The five selected principal components are weighted and summed to obtain the comprehensive score of the sample as the target output of the model.

3.3. Analysis of Results Under Different Algorithms

This paper uses MATLAB 2018 software to analyze the improved BP neural network. Firstly, 60 sets of data that have been dimensionless processed by SPSS are disordered, and then divided into training samples and test samples in a 2:1 ratio. Using these sample data and the comprehensive values of risk assessment calculated in the previous section, the BP neural network is optimized and iterated, respectively, by PSO, WOA, and GA to obtain the optimal weights and thresholds. The training samples are then used to train the model, and the trained model is applied to the prediction of the test samples. The prediction results of the three improved algorithms are compared with the true values, respectively. The prediction effect is shown in Figure 4.
Obviously, there are differences in the predictive effectiveness of different models. Among the three improved neural networks, the GA-BP neural network model has better prediction performance than the other neural networks, and the change trend of its predicted value is highly consistent with the real value, which indicates that the BP neural network improved by GA has better prediction accuracy.
As shown in Figure 5, the GA-BP neural network algorithm has a faster convergence speed. The algorithm finds the global optimal solution after 27 iterations and obtains the optimal solution of 0.009. The PSO-BP neural network algorithm finds the optimal solution after 50 iterations and obtains the optimal solution of 0.0085. The WOA-BP neural network algorithm finds the optimal solution after 45 iterations and obtains the optimal solution of 0.0153. The above results demonstrate that the GA-BP neural network algorithm has faster convergence speed and higher computational accuracy.
In addition to calculating and evaluating the predicted value and the individual fitness of R&D investment risk of medical material suppliers, this paper also introduced indicators such as mean absolute error (MAE), mean square error (MSE) and root mean square error (RMSE) to evaluate the model, as shown in Table 10.
Table 10 presents the statistical results of MAE, MSE, and RMSE of the four models. Meanwhile, compared with the BP neural network model, the MAE, MSE, and RMSE of the PSO-BP and GA-BP neural network models are both smaller. And the MSE of the GA-BP neural network model is only 0.34%, indicating a significant improvement in the accuracy of the improved model. The GA-BP neural network model outperforms the BP neural network in terms of prediction accuracy, demonstrating that the GA-BP neural network model is effective and feasible for predicting the R&D investment risk assessment of medical material suppliers.

4. Conclusions

In order to reduce the losses of R&D investment of medical material suppliers caused by failure and enhance the risk resistance ability of medical material suppliers, this paper presents a risk evaluation system and model for the R&D investment of medical material suppliers. Firstly, aiming at the R&D investment risk of medical material suppliers, this paper uses a literature research method to sort out the risk factors affecting the R&D investment of medical material suppliers. Seventeen key factors are selected through factor analysis to establish a risk index evaluation system for R&D investment of medical material suppliers. Then, the BP neural network is improved by using the ability of the PSO algorithm, WOA, and GA to search for the optimal solution globally. It makes up for the gradient descent method used in BP neural network training and reduces the possibility of becoming stuck in a local optimal solution. A risk assessment model for R&D investment of medical material suppliers is established. Finally, by comparing the prediction accuracy and convergence speed of three improved BP neural networks with the actual cases, the results show that all three improved algorithms have good prediction effects. Among them, the GA-BP neural network risk assessment model has higher accuracy and faster convergence speed, proving the practicality and reliability of the algorithm.
The work of this paper has the following significance: (1) The key factors affecting R&D investment of medical material suppliers are screened out through literature analysis. And the quantitative analysis method is applied to express the meaning of each indicator, reducing the error caused by subjective judgment. The risk evaluation system for R&D investment of medical material suppliers is established, which provides an important decision-making basis for the risk determination of R&D investment for medical material suppliers. (2) Five main indicators are selected by principal component analysis. The comprehensive evaluation value is obtained by calculating the factor score, which is used as the output of the model. It provides an important reference for verifying the reliability of the model and error analysis. (3) Due to the weights and thresholds of the BP neural network being different each time, the results of each run are different, resulting in the lack of stability of the model and being prone to falling into the local optimal solution. By optimizing BP neural networks using PSO algorithm, WOA, and GA, risk assessment models for R&D investment of medical material suppliers are established. Case studies showed that GA has a stronger ability to search for global optimal solutions, improving the accuracy and convergence speed of the model, and providing a more reliable basis for R&D investment risk assessment and prediction of medical material suppliers.
In practical applications, medical material suppliers who want to achieve a significant return on investment must consider not only the potential losses caused by the possible failure of early R&D investment, but also the volatility of market demand. According to the R&D investment risk evaluation model established in this paper, enterprises can predict the product development trend in the next few years based on the past data and grasp the investment opportunity in time. Through the actual case, it can be seen that the GA-BP neural network implemented by MATLAB can make highly accurate predictions for the R&D investment of medical material suppliers. Therefore, it provides reliable guidance for enterprises to decide whether to invest and understand the risks of subsequent projects. Meanwhile, the time cost of expert review is saved through the prediction method of a neural network.
This paper mainly uses the literature analysis method to select the influencing factor indicators, the risk index system changes dynamically, and has limitations in terms of time. In the future, questionnaires and other methods can be used to further analyze the characteristics of the influencing factor indicators, thereby enhancing the scientific and rational basis of predictions.

Author Contributions

Methodology, supervision, Y.S.; conceptualization, methodology, software, formal analysis, validation, visualization, writing—original draft, writing—review and editing, X.S.; conceptualization, methodology, formal analysis, visualization, writing—original draft, writing—review, Z.W.; methodology, writing—review and editing, H.X. All authors have read and agreed to the published version of the manuscript.

Funding

This work was supported by the National Social Science Fund of China (grant number 21&ZD127), Humanities and Social Sciences Youth Foundation, Ministry of Education of the People’s Republic of China (grant number 20YJC630154), and the Fundamental Research Funds for the Central Universities (grant number WUT2020-YB-043).

Data Availability Statement

The data presented in this study are openly available in [Soochow Securities]. The link is as follows: https://data.eastmoney.com/report/orgpublish.jshtml?orgcode=80000031.

Acknowledgments

The authors would like to express sincere gratitude to the reviewers and editors for their insightful comments and valuable suggestions, which have significantly contributed to improving the quality and clarity of this article.

Conflicts of Interest

The authors declare no conflicts of interest.

References

  1. Tyebjee, T.T.; Bruno, A.V. A model of venture capitalist investment activity. Manag. Sci. 1984, 30, 1031–1042. [Google Scholar] [CrossRef]
  2. Fried, V.H.; Hisrich, R.D. Toward a model of venture capital investment decision making. Financ. Manag. 1994, 23, 28–37. [Google Scholar] [CrossRef]
  3. Zhao, X. The study of the comprehensive valuation of investment risks of venture investment projects. Stat. Res. 2001, 12, 36–39. [Google Scholar] [CrossRef]
  4. Zhou, K.; Yang, M. Research on risk assessment for R&D cooperation between high-tech enterprises based on artificial neural network. Sci. Technol. Manag. Res. 2010, 30, 39–42+47. [Google Scholar] [CrossRef]
  5. Hou, M. A Study on the Evaluation Methods of the Supply Chain Risk Based on BP Neural Network. Master’s Thesis, Liaoning Normal University, Dalian, China, 2013. [Google Scholar]
  6. Zhan, Y. Research on Risk Assessment of Cooperative R&D Projects Between Enterprise. Master’s Thesis, Xidian University, Xi’an, China, 2019. [Google Scholar] [CrossRef]
  7. Jiang, G. Risk Evaluation and Risk Early Warning Study of Chemical New Material Product R&D Projects. Master’s Thesis, Donghua University, Shanghai, China, 2022. [Google Scholar] [CrossRef]
  8. Pourjavad, E.; Shahin, A. The application of mamdani fuzzy inference system in evaluating green supply chain management performance. Int. J. Fuzzy Syst. 2018, 20, 901–912. [Google Scholar] [CrossRef]
  9. Zhang, B.; Chen, J. Assessment of supply chain risk based on grey multilevel evaluation model. Sci.-Technol. Manag. 2011, 13, 56–59. [Google Scholar] [CrossRef]
  10. Hu, H.; Zhang, L.; Zhang, D.; Chen, L. Research on finance credit risk assessment of supply chain based on SVM. Soft Sci. 2011, 25, 26–30. [Google Scholar] [CrossRef]
  11. Liu, J. Research on the Mechanism of Corporate risk Decision-Making of R&D Alliance. Master’s Thesis, Wuhan University of Technology, Wuhan, China, 2013. [Google Scholar] [CrossRef]
  12. Dai, X. Empirical study on credit risk evaluation model of commercial bank—Based on the online supply chain finance. Soft Sci. 2018, 321, 139–144. [Google Scholar] [CrossRef]
  13. Geng, C.; Li, X. Financing risk prediction of science and technology enterprises based on sample weighted SVM model. J. Ind. Technol. Econ. 2020, 39, 56–64. [Google Scholar] [CrossRef]
  14. Wu, Z.; Liu, J.; Yang, D.; Liu, X.; Jiang, J. Optimization of emergency materials supply chain based on analytic hierarchy process and dual-objective planning. Logist. Technol. 2023, 42, 107–114. [Google Scholar]
  15. Chen, G.; Luo, Y.; Huang, B.; Liu, C.; Xiong, Z. Uncalibrated visual servo based on bp neural network and fuzzy control for robotic application. Sci. Technol. Eng. 2023, 231, 11282–11291. [Google Scholar]
  16. Chen, H.; Wang, Y.; Liu, Y. Forecast method for flights based on bp neural network during public emergency. Oper. Res. Manag. Sci. 2023, 321, 105–111. [Google Scholar] [CrossRef]
  17. Li, X.; Qian, Y. Evaluation of project investment risk based on BP neural network. J. Hohai Univ. Chang. 2005, 3, 9–12. [Google Scholar]
  18. Gao, X. Study on Risk Evaluation of High-Tech Projects Investment Based on Rough Sets and bp Neuron Network. Master’s Thesis, Lanzhou University, Lanzhou, China, 2008. [Google Scholar]
  19. Li, J. Application of BP Neural Network algorithm in biomedical diagnostic analysis. Int. J. Bioautom. 2016, 20, 417–426. [Google Scholar]
  20. Wan, H.; Deng, Y.; Gao, X. Evaluation model of investment risk of high-tech project. Stat. Decis. 2008, 03, 63–65. [Google Scholar]
  21. Liu, K.; Guo, W.; Shen, X.; Tan, Z. Research on the forecast model of electricity power industry loan based on GA-BP neural network. Energy Procedia 2012, 14, 1918–1924. [Google Scholar] [CrossRef]
  22. Wang, L. Influence Factor and Risk Prevention and Control of Knowledge Fusion in Growing Alliances. Ph.D. Thesis, Jilin University, Changchun, China, 2021. [Google Scholar] [CrossRef]
  23. Du, Y. Research on Financial Risk Early Warning Based on PSO-BP Neural Network. Master’s Thesis, Wuhan Polytechnic University, Wuhan, China, 2024. [Google Scholar] [CrossRef]
  24. Shuai, C.; Zhang, T.; Wang, W.; Ouyang, X. Investigation into relief materials distribution schemes during public health emergencies. J. Saf. Environ. 2025, 25, 227–236. [Google Scholar] [CrossRef]
  25. Ding, S.; Su, C.; Yu, J. An optimizing BP neural network algorithm based on genetic algorithm. Artif. Intell. Rev. 2011, 36, 153–162. [Google Scholar] [CrossRef]
  26. Chen, B.; Jin, W.; Lu, H. Using a genetic backpropagation neural network model for credit risk assessment in the micro, small and medium-sized enterprises. Heliyon 2024, 10, e33516. [Google Scholar] [CrossRef]
  27. Liu, W.; Guo, Z.; Wang, D.; Liu, G.; Jiang, F.; Niu, Y.; Ma, L. Improved whale optimization algorithm and its weights and thresholds optimization in shallow neural architecture search. Control Decis. 2023, 38, 1144–1152. [Google Scholar] [CrossRef]
  28. Liao, M.; Zhang, J.; He, Q. Evaluating knowledge sharing risk in the service-oriented manufacturing cluster based on the EBP model. Ind. Eng. J. 2016, 19, 128–137. [Google Scholar] [CrossRef]
  29. Yang, X. Research on risk assessment of green supply chain finance comparative study based on logit model and BP neural network. J. Ind. Technol. Econ. 2020, 39, 46–53. [Google Scholar] [CrossRef]
  30. Xia, S.; Kong, Z.; Ding, X.; Shi, X. Research on risk assessment of equity crowdfunding based on principal component analysis and BP neural network algorithm. J. Technol. Econ. 2021, 40, 146–154. [Google Scholar]
  31. Su, H. The Study of Supplier’s Evaluation and Selection for Company A Based on BP Neural Network. Master’s Thesis, South China University of Technology, Guangzhou, China, 2016. [Google Scholar]
  32. Liu, L.; Wu, M.; Li, J. Impact of R&D uncertainty on supplier innovation benefits. Comput. Integr. Manuf. Syst. 2017, 23, 2728–2736. [Google Scholar] [CrossRef]
  33. Ding, Q. Research on Financial Risk Assessment of Sci-Tech Innovation Board Enterprises Based on BP Neural Network. Master’s Thesis, Jilin University, Changchun, China, 2022. [Google Scholar] [CrossRef]
  34. Wu, G. Research on Risk Factors of Science and Technology Project in Native Companies Based on Full Life-Cycle Perspective. Master’s Thesis, South China University of Technology, Guangzhou, China, 2014. [Google Scholar]
  35. Wang, E. The risk assessment method of logistics alliance based on BP neural network. Logist. Sci-Tech 2017, 40, 4–7. [Google Scholar] [CrossRef]
  36. Han, P.; Dong, J.; Wen, M.; Xiong, L.; Li, W. Research on grey comprehensive evaluation of enterprise dynamic alliance risk. J. Commer. Econ. 2018, 6, 105–107. [Google Scholar] [CrossRef]
  37. Lin, C. Research on Risk Identification and Evaluation of R&D Projects of Green Building Materials Enterprises. Master’s Thesis, Hebei GEO University, Shijiazhuang, China, 2022. [Google Scholar] [CrossRef]
  38. Zheng, J.; Feng, Z. Research on financial risk prediction of listed companies based on PSO-BP neural network. Inf. Technol. Informatiz. 2016, 8, 43–47. [Google Scholar] [CrossRef]
  39. Wang, B.; Gao, D.; Gu, H.; Ding, M.; Wu, Z. Guided wave based composite structural fatigue damage monitoring utilizing the WOA-BP neural network. Comput. Mater. Contin. 2025, 83, 455–473. [Google Scholar] [CrossRef]
  40. Duan, Y.; Mu, C.; Yang, M.; Deng, Z.; Chin, T.; Zhou, L.; Fang, Q. Study on early warnings of strategic risk during the process of firms’ sustainable innovation based on an optimized genetic BP neural networks model: Evidence from Chinese manufacturing firms. Int. J. Prod. Econ. 2021, 242, 108293. [Google Scholar] [CrossRef]
  41. Tian, Y.; Bai, L.; Wei, L.; Zheng, K.; Zhou, X. Modeling for project portfolio benefit prediction via a GA-BP neural network. Technol. Forecast. Soc. Change 2022, 183, 121939. [Google Scholar] [CrossRef]
  42. Kang, W.; Cheung, C.F. Model for technology risk assessment in commercial banks. Risks 2024, 12, 26. [Google Scholar] [CrossRef]
  43. Mirjalili, S.; Lewis, A. The whale optimization algorithm. Adv. Eng. Softw. 2016, 95, 51–67. [Google Scholar] [CrossRef]
Figure 1. Analysis of enterprise R&D investment business process based on the process diagram.
Mathematics 13 02094 g001
Figure 2. BP neural network topology structure diagram.
Mathematics 13 02094 g002
Figure 3. Eigenvalue scree plot.
Mathematics 13 02094 g003
Figure 4. Comparison of the actual and predicted value of R&D investment risk of medical material suppliers.
Mathematics 13 02094 g004
Figure 5. Comparison of convergence speed of three improved algorithms.
Mathematics 13 02094 g005
Table 1. Comparison of several evaluation methods.
MethodCore CapabilityData RequirementsMedical Decision-Making Examples
Fuzzy comprehensive evaluation methodDeal with fuzzy language evaluationQuantitative qualitative indicatorsRanking of suppliers’ comprehensive capabilities
AHPMulti-criteria weight distributionExpert judgment matrix is requiredPrioritization of R&D projects
Gray system theorySmall sample predictionA small amount of time series dataPrediction of material demand for outbreak
Rough set theoryDimensionality reduction and rule extraction of high-dimensional dataDiscrete dataScreen key parameters of quality control
Regression analysisCausality quantification and linear predictionContinuous variableAnalysis of influencing factors of R&D investment
BP neural networkStrong nonlinear fitting abilityLarge-scale samplesNonlinear prediction of market demand
Random forestStrong resistance to over-fittingLarge-scale samplesComprehensive risk assessment
SVMGreat high-dimensional small-sample generalization performanceSmall and medium sample sizesBiomarker classification
Table 2. Risk evaluation index system of inter-enterprise cooperative R&D investment.
Primary IndicatorsSecondary IndicatorsReference
Credit and legal risksX1 Credit rating[11,28,29,30]
X2 Intellectual property protection
R&D riskX3 R&D expenditure as a percentage of operating revenue[31,32,33]
X4 Proportion of R&D personnel
X5 Return on R&D investment
Management riskX6 Senior decision-making ability[34,35,36]
X7 R&D team staff mobility
X8 Talent management
Financial riskX9 Return on equity[6,32]
X10 Return on total assets
X11 Profit margin on sales
X12 Current ratio
X13 Quick ratio
X14 Asset liability ratio
Market riskX15 Market share[36,37]
Production riskX16 Production efficiency[3,34]
X17 Inventory turnover ratio
Table 3. Parameter setting of the BP neural network.
AlgorithmsNumber of Hidden NodesTraining TimesTarget ErrorLearning Rate
BP3–1410 10 5 0.01
Table 4. Parameter setting of the PSO algorithm.
AlgorithmsInitial Population SizeParticle LengthLearning RateNumber of IterationsTarget Error
PSO-BP10580.0150 10 5
Table 5. Parameter setting of WOA.
AlgorithmsInitial Population SizeSpiral Current LengthLearning RateNumber of IterationsTarget Error
WOA-BP10580.0150 10 5
Table 6. Parameter setting of GA.
AlgorithmsInitial Population SizeCross ProbabilityMutation ProbabilityLearning RateHereditary AlgebrasTarget Error
GA-BP100.80.010.0150 10 5
Table 7. Correlation matrix.
VariableX1X2X3X4X5X6X7X8X9X10X11X12X13X14X15X16X17
X110.0320.1240.4070.0050.4210.0430.1930.3350.3470.4800.2050.2380.1520.0960.0530.069
X20.03210.4210.1800.4120.3310.2480.0100.1240.1950.1250.0870.0900.2190.0220.4720.346
X30.1240.42110.0070.0910.1140.3460.0720.0290.0890.2040.0520.0590.3570.0470.0010.032
X40.4070.1800.00710.3330.4020.1200.2380.0000.0000.0000.0870.0550.0270.0000.0790.255
X50.0050.4120.0910.33310.0320.0000.0040.1020.0290.0500.0960.0910.2060.0030.1120.000
X60.4210.3310.1140.4020.03210.0690.0040.4430.3240.4420.4310.4070.3000.4300.0770.012
X70.0430.2480.3460.1200.0000.06910.0020.0070.0080.0150.3760.3200.3650.0930.2290.000
X80.1930.0100.0720.2380.0040.0040.00210.4790.3190.3200.3810.3960.0720.0230.1270.001
X90.3350.1240.0290.0000.1020.4430.0070.47910.0000.0000.0730.0360.1690.0000.2960.011
X100.3470.1950.0890.0000.0290.3240.0080.3190.00010.0000.0250.0130.0370.0020.3440.001
X110.4800.1250.2040.0000.0500.4420.0150.3200.0000.00010.0050.0020.0030.0000.0400.001
X120.2050.0870.0520.0870.0960.4310.3760.3810.0730.0250.00510.0000.0000.0000.1740.009
X130.2380.0900.0590.0550.0910.4070.3200.3960.0360.0130.0020.00010.0000.0000.2290.007
X140.1520.2190.3570.0270.2060.3000.3650.0720.1690.0370.0030.0000.00010.0000.0160.063
X150.0960.0220.0470.0000.0030.4300.0930.0230.0000.0020.0000.0000.0000.00010.0000.002
X160.0530.4720.0010.0790.1120.0770.2290.1270.2960.3440.0400.1740.2290.0160.00010.106
X170.0690.4210.0320.3330.0320.0120.0000.0010.0110.0010.0010.0090.0070.0630.0020.1061
Table 8. Explanation of total variance.
ComponentInitial EigenvalueExtract the Sum of Squared LoadsRotate the Sum of Squared Loads
Total% of Var.Cum. %Total% of Var.Cum. %Total% of Var.Cum. %
14.96829.22329.2234.96829.22329.2233.65121.47721.477
22.57915.17144.3942.57915.17144.3942.95017.35138.827
32.41414.20358.5962.41414.20358.5962.80216.48055.307
41.4648.61467.2111.4648.61467.2111.85810.93266.239
51.2397.28974.5001.2397.28974.5001.4048.26174.500
60.8955.26579.765
70.8675.10084.865
80.6553.85188.715
90.5883.46292.177
100.4042.37894.555
110.3842.25796.812
120.1751.03097.842
130.1500.88098.722
140.1200.70799.429
150.0660.38699.816
160.0290.17199.987
170.0020.013100.000
Table 9. Component matrix.
Secondary Indicators12345
Credit rating−0.0320.035−0.5560.431−0.226
Intellectual property protection−0.0620.3560.2720.0490.760
R&D expenditure as a percentage of operating revenue0.063−0.591−0.2690.2640.523
Proportion of R&D personnel0.5750.5240.0410.196−0.091
Return on R&D investment0.532−0.5120.431−0.1870.150
Senior decision-making ability−0.1680.417−0.225−0.2390.070
R&D team staff mobility0.487−0.3070.544−0.119−0.148
Talent management−0.2650.576−0.244−0.1610.395
Return on equity0.7340.5380.2630.113−0.031
Return on total assets0.7530.4060.2400.016−0.014
Profit margin on sales0.8460.4210.1110.1400.043
Current ratio−0.5990.1070.6180.439−0.115
Quick ratio−0.6230.0810.5930.446−0.107
Asset liability ratio−0.5480.0670.4850.1410.135
Market share0.750−0.114−0.2880.321−0.087
Production efficiency−0.3600.2720.233−0.677−0.232
Inventory turnover ratio0.670−0.4750.347−0.1750.128
Table 10. Comparison of prediction errors of two neural network models.
ModelMAEMSERMSE
BP0.15920.09180.3030
PSO-BP0.10960.04540.2130
WOA-BP0.46460.53550.7318
GA-BP0.13740.03730.1932
Disclaimer/Publisher’s Note: The statements, opinions and data contained in all publications are solely those of the individual author(s) and contributor(s) and not of MDPI and/or the editor(s). MDPI and/or the editor(s) disclaim responsibility for any injury to people or property resulting from any ideas, methods, instructions or products referred to in the content.

