Article

Research on Collaborative Governance Mechanism of Air Pollutant Emissions in Ports: A Tripartite Evolutionary Game Analysis with Evidence from Ningbo-Zhoushan Port

School of Economics and Management, Ningbo University of Technology, Ningbo 315211, China
*
Author to whom correspondence should be addressed.
Mathematics 2025, 13(12), 2025; https://doi.org/10.3390/math13122025
Submission received: 7 April 2025 / Revised: 13 June 2025 / Accepted: 17 June 2025 / Published: 19 June 2025

Abstract

Under the “Dual Carbon” strategy, collaborative governance of port atmospheric pollutants and carbon emissions is critical for low-carbon transformation. Focusing on Ningbo-Zhoushan Port (48% regional ship emissions), this study examines government, port enterprises, and public interactions. A tripartite evolutionary game model with numerical simulation reveals dynamic patterns and key factors. The results show the following: (1) A substitution effect exists between government incentive costs and penalty intensity—increased environmental governance budgets reduce the probability of government incentives, whereas higher public reporting rewards accelerate corporate emission reduction convergence. (2) Public supervision exhibits cyclical fluctuations due to conflicts between individual rationality and collective interests, with excessive reporting rewards potentially triggering free-rider behavior. (3) The system exhibits two stable equilibria: a low-efficiency equilibrium (0,0,0) and a high-efficiency equilibrium (1,1,1). The latter requires policy cost compensation, corporate emission reduction gains exceeding investments, and a supervision benefit–cost ratio greater than 1. Accordingly, the study proposes a three-dimensional “Incentive–Constraint–Collaboration” governance strategy, recommending floating penalty mechanisms, green financial instrument innovation, and community supervision network optimization to balance environmental benefits with fiscal sustainability. This research provides a dynamic decision-making framework for multi-agent collaborative emission reduction in ports, offering both methodological innovation and practical guidance value.

1. Introduction

Ports and shipping networks are critical nodes in global supply chains [1] and major sources of energy consumption and pollutant emissions [2]. Globally, the International Maritime Organization (IMO)’s MARPOL Annex VI constitutes a critical legal foundation for green port governance, creating an international legal framework for ship emission reduction and low-carbon transition in maritime transport [3]. The port industry contributes approximately 3% of global greenhouse gas emissions [4]. The green and low-carbon port concept has emerged as a consensus for addressing emissions and achieving sustainable development [5]. Under China’s “Dual Carbon” goals (peaking carbon emissions by 2030 and achieving carbon neutrality by 2060), synergistic governance of pollutants and carbon emissions has become pivotal for port sustainability. The convergence of global regulatory frameworks and China’s decarbonization commitments has intensified pressure on major ports. Ningbo-Zhoushan Port, the world’s largest cargo hub for 14 consecutive years, presents a critical case study. In 2022, it accounted for 48% of regional NOx emissions from ships, with its environmental performance directly impacting air quality in the Yangtze River Delta and global carbon neutrality efforts. Port pollutants (e.g., PM2.5, SO2, and NOx) and carbon emissions share common sources—primarily fossil fuel consumption by ships, handling equipment, and transport vehicles [6]. This synergy necessitates integrated strategies for pollution and carbon reduction. China’s environmental policies, from the Air Pollution Prevention Law to the “Dual Carbon” targets, have shifted from total emission control to coordinated air quality improvement and low-carbon transition.
Currently, port collaborative governance faces two core challenges: There are the nonlinear interactions among stakeholders’ strategies, including the substitution effects between government incentive costs and penalty intensity, as well as the fluctuating “free-rider” dynamics of public supervision, which are difficult to capture through static game models. There are also the stability conditions of collaborative mechanisms. Existing cases demonstrate that the Port of Rotterdam achieved emission reductions through shore power systems and carbon trading mechanisms, yet its experience proves challenging to directly replicate in ports of developing countries.
Against this backdrop, this study takes Ningbo-Zhoushan Port as the research object and constructs a tripartite evolutionary game model involving “government–port enterprises–the public”, aiming to reveal the evolutionary patterns and stable strategies of multi-agent collaborative governance. In the model, the government, as the policy provider and regulator, directly influences corporate emission reduction behaviors through incentive and constraint policies; port enterprises, as the main polluters, make emission reduction decisions constrained by cost-benefit tradeoffs, while the health demands and supervisory actions of the public serve as a crucial supplements to the governance system.
Evolutionary game theory, which captures bounded rationality and dynamic decision making, offers methodological support for analyzing long-term policy effects. Existing research often focuses on bilateral government–enterprise interactions, neglecting public participation and dynamic pathways [7]. Regional port governance, however, relies heavily on local stakeholders. Factors such as public supervision costs, health demands, and incentive structures require quantification. By integrating dynamic reward–punishment mechanisms and interest-related parameters, this study deciphers how policy costs, penalties, and supervision benefits shape strategic choices. Numerical simulations validate stable equilibria under varying conditions. The results provide theoretical foundations for Ningbo-Zhoushan Port’s green transition and practical insights for China’s port clusters under the “Dual Carbon” framework.
Compared to existing research, the innovation of this paper is reflected in two aspects: the construction of a multi-agent dynamic coordination mechanism and the design of nonlinear policy simulation. Firstly, this paper innovatively incorporates the masses as independent participants into the game framework, constructing a tripartite dynamic evolutionary game model among the government, port enterprises, and the masses, providing a new theoretical tool for multi-agent collaborative governance. Secondly, combining empirical data from Ningbo-Zhoushan Port, this paper verifies the nonlinear effects of policy tools through dynamic parameter simulation, breaking through the limitations of traditional static policies and providing an operational solution for balancing incentive dependence and fiscal sustainability. This study provides a mechanism solution for port multi-agent collaborative emission reduction, which is both firm and flexible, combining methodological breakthroughs with practical application value.

2. Literature Review

In terms of policy guidance, the existing research presents multi-dimensional and cross-regional perspectives on environmental policy regulation. This annex establishes a global framework for ship emission reduction by introducing mandatory technical standards such as the Energy Efficiency Design Index (EEXI) and Carbon Intensity Indicator (CII) while facilitating a low-carbon transition in shipping through the establishment of a Net-Zero Framework. Future studies should prioritize the alignment mechanisms between regional policies and international conventions [8]. The International Energy Agency (IEA)’s net-zero targets have accelerated the integration of ports into the global sustainable development agenda [9]. European ports have implemented emission reduction policies featuring innovative instruments [10], such as that exemplified by the Environmental Ship Index (ESI) that incentivizes low-carbon vessels through port fee reductions, demonstrating policy–market synergies [11]. Case studies like the Port of Liverpool reveal the necessity of concurrent breakthroughs in policy design and technological bottlenecks (e.g., hydrogen storage infrastructure) [12]. However, their experience heavily relies on well-developed carbon trading markets and high public environmental awareness, making it difficult to directly replicate in emerging economies. To advance green shipping and improve air quality in coastal regions, China established Emission Control Areas (ECAs) in December 2015 [13]. The implementation of a mandatory constraint of 0.5% sulfur content in ship fuels in the Yangtze River Delta, Pearl River Delta, and Bohai Rim regions has shown significant emission reduction effects [14]. In September 2020, the Chinese government proposed the “Dual Carbon” goal, aiming to reach peak carbon dioxide emissions by 2030 and achieve carbon neutrality by 2060 [15]. This goal sets higher development requirements for China’s transportation industry [16].
In terms of industry practices, renewable energy adoption demonstrates significant potential in reducing CO2 emissions from port-bound vessels [17]. International governance cases reveal diversified approaches: The Port of Hamburg has substantially decreased ship emissions and enhanced energy efficiency through proactive shore power system integration [18,19]; the Port of Rotterdam achieved seven consecutive years of industrial carbon reduction via green technology partnerships with shipping companies, exemplifying port–shipping synergy [20]; the Port of Long Beach implemented market-based mechanisms through its Clean Air Action Plan, linking carbon allowance allocation to corporate emission performance, thereby optimizing governance efficacy [21]. Chinese ports exhibit technological innovation: Tianjin Port established the nation’s first intelligent ecological environment air quality monitoring platform [22], with monitoring data indicating that dustfall levels in the port area have consistently remained below the average levels of the urban area [23]; Zhuhai Port, as a South China shipping hub, promotes green transition through emission monitoring technologies, clean energy adoption (e.g., shore power), and pollution control systems [24]. Notably, the Port of Busan pioneered blockchain-based carbon footprint tracing across maritime supply chains, achieving full-cycle carbon data transparency [25]. Some countries rely on mature carbon trading markets and high fiscal investments, yet they face the dual obstacles of technological adaptation and funding constraints when promoting these in developing country ports. This “policy transplantation dilemma” exposes the existing research’s neglect of regional governance mechanism design, particularly failing to address how to balance incentive intensity with long-term sustainability under fiscal limitations.
In terms of collaborative governance theory, Ostrom’s polycentric governance theory emphasizes the collaborative-checking mechanisms among governments, enterprises, and communities in addressing environmental challenges [26]. Evolutionary game theory has gained prominence in environmental policy analysis due to its capacity to model bounded rationality in dynamic decision making. Sheng and Tang [2] developed a tripartite game model (government–shipping companies–ports), revealing governments’ pivotal role in promoting shore power adoption for maritime decarbonization. Li and Tian [2] constructed a tripartite evolutionary game model involving governments and dual ports, demonstrating that policy incentives significantly enhance port collaboration stability in resource integration scenarios. Gao et al. [27] analyzed governmental impacts on regional port cluster evolution, concluding that competitive port alliances constitute key success factors for port consolidation. Zheng et al. [28] further identified allocation coefficients and policy incentive–penalty mechanisms as decisive factors in regional port integration through empirical analysis of government–port enterprise games. However, the aforementioned studies still exhibit certain limitations, indicating that the current theoretical framework significantly lacks endogenous modeling of nongovernmental actors’ behaviors, particularly in revealing the cost–benefit tradeoffs of public oversight and their nonlinear impacts on multi-agent strategic interactions.
Current research on the collaborative governance of port atmospheric pollution has formed a multi-dimensional theoretical framework and practical experience. However, significant deficiencies still exist in existing studies: Firstly, the research perspective is limited, with most of the literature focusing on the bilateral game between government and enterprises, neglecting the supervision costs, health demands, and dynamic participation paths of the public as an independent entity. This leads to a lack of realistic explanatory power driven by social forces in the collaborative governance model. Secondly, the analytical methods are static, and traditional game models struggle to capture the nonlinear characteristics of multi-agent strategic interactions (such as the substitution effect of policy incentives and penalties or the “free-rider” fluctuations of public supervision), and there is a lack of dynamic simulation validation based on real port data. Thirdly, the mechanism design is homogenized, with existing policy recommendations relying heavily on fixed subsidies or single fines, failing to resolve the contradiction between incentive dependency and fiscal sustainability and not establishing a long-term incentive mechanism linking corporate emission reduction performance with financial markets. This paper addresses the aforementioned shortcomings by innovatively introducing the general public as an independent game participant. Through constructing a tripartite dynamic evolutionary game model involving the government, port enterprises, and the public, combined with empirical data from Ningbo-Zhoushan Port, it analyzes the stable conditions for collaborative governance. The study provides a mechanism solution integrating both rigid constraints and flexible incentives for multi-agent collaborative emission reduction, offering methodological tools and practical references to fill the existing research gap.

3. Model Construction

3.1. Problem Description

This study constructs a multi-agent game model involving “government–port enterprises–general public” from the perspectives of various stakeholders, with the logical relationships among the three gaming entities illustrated in Figure 1.
As the third-party regulatory body, the government plays a crucial role in promoting emission reduction by port enterprises. The strategic interactions among the entities exhibit dynamic correlations: The government regulates corporate emission reduction behaviors and public supervision willingness through “Incentivize/Nonincentivize” policies, where incentive measures directly reduce corporate emission reduction costs, while the “Not incentivize” strategy relies on penalty mechanisms to constrain noncompliant emissions. Port enterprises weigh the options between “Emission reduction/Nonemission reduction” based on cost–benefit considerations, with their emission reduction investments influenced by government incentive intensity, carbon market returns, and public supervision pressure. The general public participates in governance through “Supervise/Nonsupervise” strategies, where “Supervise” actions rely on government-provided reporting channels to obtain rewards while amplifying the reputational losses of noncompliant enterprises through public opinion pressure.
A nested effect exists among the three parties’ strategies—government incentive policies indirectly enhance public supervision efficiency by reducing the marginal costs of corporate emission reduction, while public supervision data feedback can optimize the government’s environmental budget allocation, forming a closed-loop collaborative mechanism of “policy incentives–corporate response–social feedback”.

3.2. Model Assumptions

As the main body of macroeconomic regulation and control in the market, the government’s incentive policies constitute an important institutional support for the port emission reduction system [29]. However, most existing policy tools rely on unilateral government incentives or penalties while neglecting the dynamic feedback role of social supervision, resulting in low governance efficiency. This study constructs a dual-incentive mechanism encompassing positive support and reverse penalties, with the government, port enterprises, and the general public as the three main entities, establishing a tripartite game model to examine their interest relationships. The parameters used are derived from the annual budget report of the Ningbo Municipal Ecological and Environmental Protection Bureau (http://sthjj.ningbo.gov.cn/art/2024/2/27/art_1229051503_4364171.html (accessed on 16 June 2025)) and the “Shore Power Transformation” project of Ningbo-Zhoushan Port (https://www.ningbo.gov.cn/art/2023/5/10/art_1229095998_1773019.html (accessed on 16 June 2025)).
Assumption 1.
The government, enterprises, and the public are all bounded rational subjects, pursuing the maximization of their interests. Governments seek a balance between environmental governance performance and fiscal sustainability; enterprises weigh emission reduction costs against market benefits, and the public makes tradeoffs between health demands and monitoring costs. This assumption aligns with the actual interaction patterns among the government, enterprises, and society in the Ningbo-Zhoushan Port. In the process of multiple games, each party gradually reaches an evolutionary stable state by adjusting strategies.
Assumption 2.
The application of emission reduction subsidy policies in port emission reduction has important practical significance [30]. Under the collaborative governance framework, the government promotes emission reduction through incentive measures (e.g., subsidies, policy support, etc.), enterprises reduce pollutant emissions via green transition, and the public enhances governance efficiency through oversight. Successful collaborative governance generates environmental benefits for all parties. Conversely, governance failure would result in environmental remediation costs for the government, fines or market losses for enterprises, and health risks for the public.
Assumption 3.
The probability that the local government chooses to incentivize is x, and the probability of choosing not to incentivize is 1 − x. Similarly, the probability that the port enterprise chooses to implement emission reduction is y, and the probability of choosing to maintain the status quo is 1 − y. The probability that the public chooses to supervise is z, and the probability of choosing not to supervise is 1 − z. Among them, (x, y, z) are not fixed values but constantly adjust and change during the evolutionary game process, with their value ranges being [0, 1].
Based on these assumptions, the parameters of the evolutionary game model are defined in Table 1.

3.3. Model Construction

The government adopts an incentive strategy (x): The government must bear the special budget for environmental governance (C1) and the cost of incentive policies (C2) but gains public support (S1) through successful governance and retains partial tax revenue ((1 − a) R1). If enterprises do not reduce emissions and public supervision occurs, the government benefits from fines (M) but must deduct pollution control costs (L). The government adopts a nonincentive strategy (1 − x): The government saves incentive costs (C2) but bears pollution control costs (L), retaining only (1 − a) R1 in tax revenue (when enterprises reduce emissions) or full tax revenue (R1) (when enterprises do not reduce emissions).
Port enterprises adopt an emission reduction strategy (y): Enterprises must pay emission reduction investment costs (C3) but gain carbon market trading revenue (S2), green financing incentives (K), government subsidies (S3), and enhanced market competitiveness (S4). Port enterprises adopt a nonemission reduction strategy (1 − y): Enterprises face fines (M) and reputational losses (D) but incur no emission reduction costs.
The public adopts a supervision strategy (z): The public bears supervision costs (C4) but receives whistleblower rewards (S5) and health–economic value (J), with environmental satisfaction increasing to (1 + b) R2. The public adopts a nonsupervision strategy (1 − z): They only receive baseline environmental satisfaction (R2), with additional health–economic value (J) if enterprises reduce emissions.
Based on the aforementioned assumptions and parameters, the payoff matrix is presented in Table 2, involving the government, port enterprises, and the public.

3.4. Replicator Dynamics Equations

Based on the tripartite game payoff matrix above, the replicator dynamics equations for the government, port enterprises, and the public are derived as follows.
The expected payoffs for the government adopting the “incentive” strategy (UG1) and the “no incentive” strategy (UG0) are, respectively,
UG1 = yz(−C1 − C2 + S1 + (1 − a)R1) + y(1 − z )(−C1 − S3 + S1 + (1 − a)R1) + (1 − y)z(−C1 − S5 + R1 + M − L) + (1 − y)(1 − z)(−C1 + R1 + M − L)
UG0 = yz((1 − a)R1) + y(1 − z)((1 − a)R1) + (1 − y)z(R1 − L) + (1 − y)(1 − z)(R1 − L)
The average payoff for the government is
U ¯ G = x U G 1 + ( 1 x ) U G 0 .
The replicator dynamics equation is
d x d t = x ( U G 1 U ¯ G ) .
The expected payoffs for port enterprises adopting the “emission reduction” strategy (UE1) and the “status quo maintenance” strategy (UE0) are, respectively,
UE1 = xz(−C3 + S2 + K + S3 + S4) + x(1 − z)(−C3 + S2 + K + S3 + S4) + (1 − x)z(−C3 + S2 + K + S4) + (1 − x)(1 − z)(−C3 + S2 + K + S4)
UE0 = xz(−M − D) + x(1 − z)(−M) + (1 − x)z(−D) + 0(1 − x)(1 − z)
The average payoff for port enterprises is
U ¯ E = y U E 1 + ( 1 y ) U E 0
The replicator dynamics equation is
d y d t = y ( U E 1 U ¯ E ) .
The expected payoffs for the public adopting the “oversight” strategy (US1) and the “nonoversight” strategy (US0) are, respectively,
US1 = xy(−C4 + J + S5 + (1 + b)R2) + x(1 − y)(−C4 + S5 + R2) + (1 − x)y(−C4 + J + (1 + b)R2) + (1 − x)(1 − y)(−C4 + R2)
US0 = xy(J + (1 + b)R2) + x(1 − y)(R2) + (1 − x)y(J + (1 + b)R2) + (1 − x)(1 − y)(R2)
The average payoff for the public is
U ¯ S = z U S 1 + ( 1 z ) U S 0
The replicator dynamics equation is
d z d t = z ( U S 1 U ¯ S ) .

4. Evolutionary Game Analysis

Evolutionary Strategy Stability Analysis

According to the above replication dynamic equation, the simplification is obtained as follows:
F ( x ) = d x d t = x ( x 1 ) ( C 1 M + y M y S 1 + y S 3 + z S 5 + y z C 2 y z S 3 y z S 5 )
F ( y ) = d y d t = y ( y 1 ) ( K C 3 + S 2 + S 4 + D Z + M s + S 3 x )
F ( z ) = d z d t = z ( C 4 S 5 x ) ( Z 1 )
By simplifying the above replicator dynamics equations and setting F(x) = 0, F(y) = 0, F(z) = 0, the system exhibits eight pure strategy equilibrium points: E1(0,0,0), E2(0,0,1), E3(0,1,0), E4(1,0,0), E5(0,1,1), E6(1,0,1), E7(1,1,0), and E8(1,1,1).
Calculate the partial derivatives of F(x), F(y), and F(z) concerning x, y, and z, respectively, to obtain the Jacobian matrix as follows:
J = F ( x ) x F ( x ) y F ( x ) z F ( y ) x F ( y ) y F ( y ) z F ( z ) x F ( z ) y F ( z ) z = a 11 a 12 a 13 a 21 a 22 a 23 a 31 a 32 a 33
Among which
a11 = (2x − 1)(C1 − M + yM − yS1 + yS3 + zS5 + yzC2 − yzS3 − yzS5)
a12 = x(x − 1)(M − S1 + S3 + zC2 − zS3 − zS5)
a13 = x(x − 1)(zS5 + yC2 − yS3 − yS5)
a21 = −y(y − 1)(M + S3)
a22 = (−2y + 1)(K − C3 + S2 + S4 + DZ + xM + xS3)
a23 = −y(y − 1)D
a31 = z(−S5)(z − 1)
a32 = 0
a33 = (2z − 1)(C4 − xS5)
According to the indirect method of Lyapunov, if all eigenvalues of the Jacobi matrix have a negative real part, the equilibrium point is asymptotically stable; if at least one eigenvalue of the Jacobi matrix has a positive real part, the equilibrium point is unstable [31]. The stability of eight equilibrium points is shown in Table 3.
Furthermore, to better analyze the positivity or negativity of the matrix eigenvalues at different equilibrium points, and in light of the current public situation, assumptions are made: S 5 C 4 > 0 . That is, the reward from the government for public reporting on enterprises’ illegal emissions is greater than the effort and time cost of the public participating in supervision, thus making supervision rational.
The eigenvalues of equilibrium points E1(1,0,0), E3(0,0,1), E6(1,1,0), and E8(0,1,1) after substituting into the Jacobian matrix all exhibit non-negative values. Hence, these points are not stable.
The eigenvalues of E1(0,0,0) are λ 1 = M C 1 , λ 2 = K C 3 + S 2 + S 4 , and λ 3 = C 4 . Clearly, λ 3 < 0 only when λ 1 = M C 1 < 0 and λ 2 = K C 3 + S 2 + S 4 < 0 . The point (0,0,0) is the asymptotic equilibrium point. At this juncture, only when the government’s fine for the port enterprise’s failure to reduce emissions is less than the cost of monitoring equipment and personnel training required for the government to implement enterprise supervision, and the total profit of the port enterprise after emission reduction is much less than its cost of emission reduction investment, the government will choose not to incentivize. The port enterprise will choose not to reduce emissions. For the public, the cost of time and energy to participate in supervision will always exist, and the public will choose not to supervise. Thus, the system will reach a balanced and stable state.
The eigenvalues of E3(0,1,0) are λ 1 = S 1 C 1 S 3 , λ 2 = C 3 K S 2 S 4 , and λ 3 = C 4 . Clearly, λ 3 < 0 only when λ 1 = S 1 C 1 S 3 < 0 and λ 2 = C 3 K S 2 S 4 < 0 . The point (0,1,0) is the asymptotic equilibrium point. That is, the investment required for government regulation plus the benefits of subsidies received by enterprises from the government is greater than the gain from the increased public reputation the government would obtain after successful governance, which the government chooses not to incentivize. Moreover, when the comprehensive benefits of emission reduction by enterprises are greater than their costs of emission reduction investment, enterprises will choose to implement emission reduction. For the public, the cost of time and effort to participate in supervision always exists, and the public will choose not to supervise. At this point, the system will reach a balanced and stable state.
The eigenvalues of E6(1,0,1) are λ 2 = D + K C 3 + M + S 2 + S 3 + S 4 and λ 3 = C 4 S 5 ; the above text has already assumed S 5 C 4 > 0 . Clearly, this is only when λ 2 = D + K C 3 + M + S 2 + S 3 + S 4 < 0 . The point (1,0,1) is the asymptotic equilibrium point. When the government’s investment required for regulation plus its rewards for public reporting of corporate violations of emission standards is less than the fines imposed on port enterprises for not reducing emissions, the government chooses the incentive strategy. Moreover, if the comprehensive benefits of emission reduction by enterprises are less than the sum of the reputation loss and fines plus government subsidy benefits loss faced by not reducing emissions, meaning the benefits are poor, the enterprise chooses not to reduce emissions. However, for the public, due to the relationship that the cost of supervision itself is less than the reward for reporting, they choose to supervise. The system reaches stability under these conditions.
The eigenvalues of E8(1,1,1) are λ 1 = C 1 + C 2 S 1 , λ 2 = D + C 3 K M S 2 S 3 S 4 , and λ 3 = C 4 S 5 ; the above text has already assumed S 5 C 4 > 0 . Clearly, λ 3 < 0 only when λ 1 = C 1 + C 2 S 1 < 0 and λ 2 = D + C 3 K M S 2 S 3 S 4 < 0 . The point (1,1,1) is the asymptotic equilibrium point. When the sum of government investment in regulation and the cost of incentive policies is less than the benefit gained from the increased public reputation after successful governance, the government chooses the incentive strategy. Moreover, when the comprehensive benefits of corporate emission reduction are greater than the sum of the reputation loss and fines faced without emission reduction, as well as the loss of government subsidy benefits, that is, when the benefits are feasible, the choice is made to reduce emissions. For the public, when the reward for reporting is greater than the cost of supervision, the system reaches stability under this positive governance strategy combination.

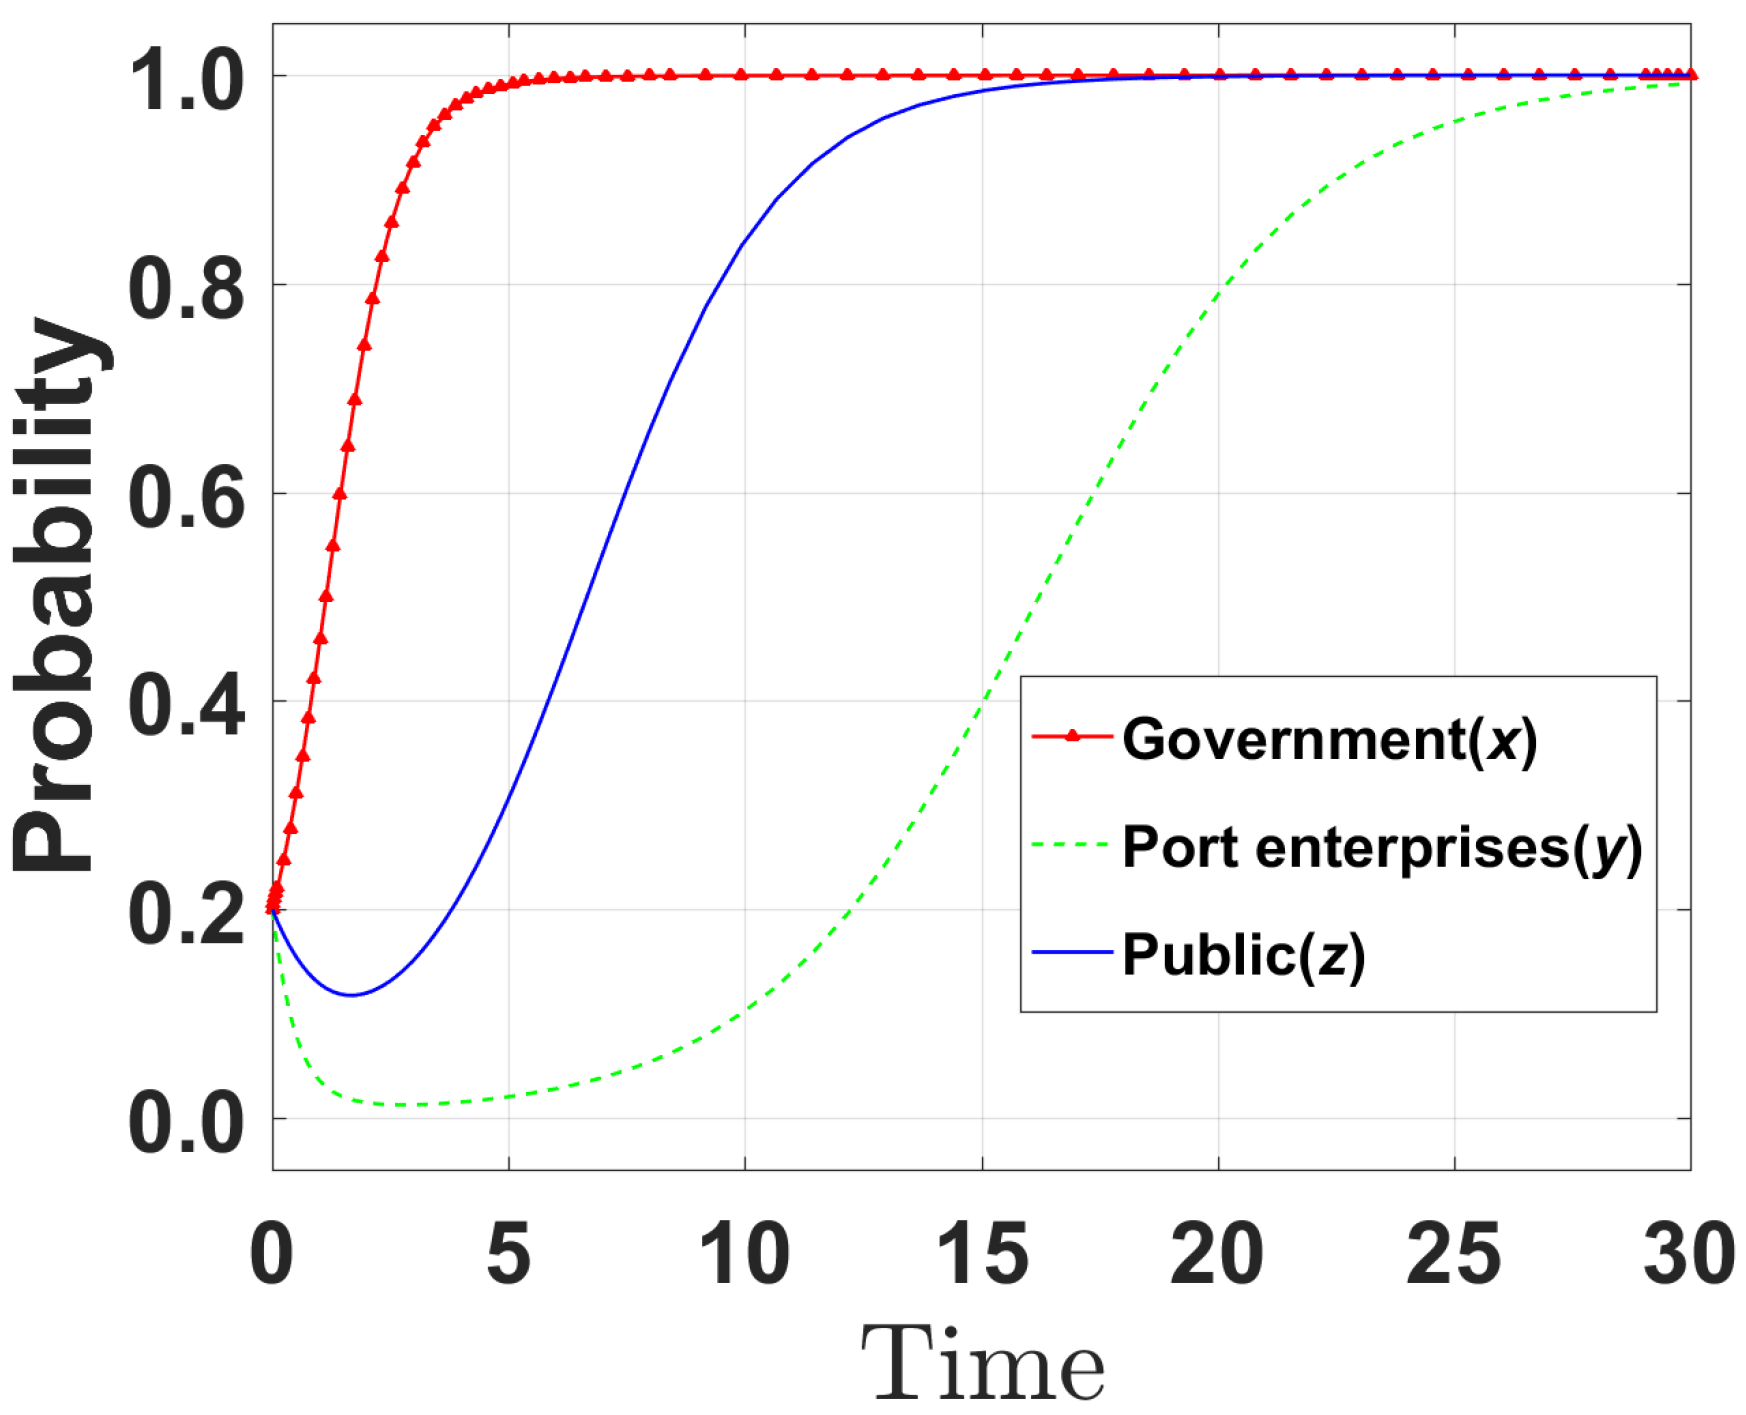
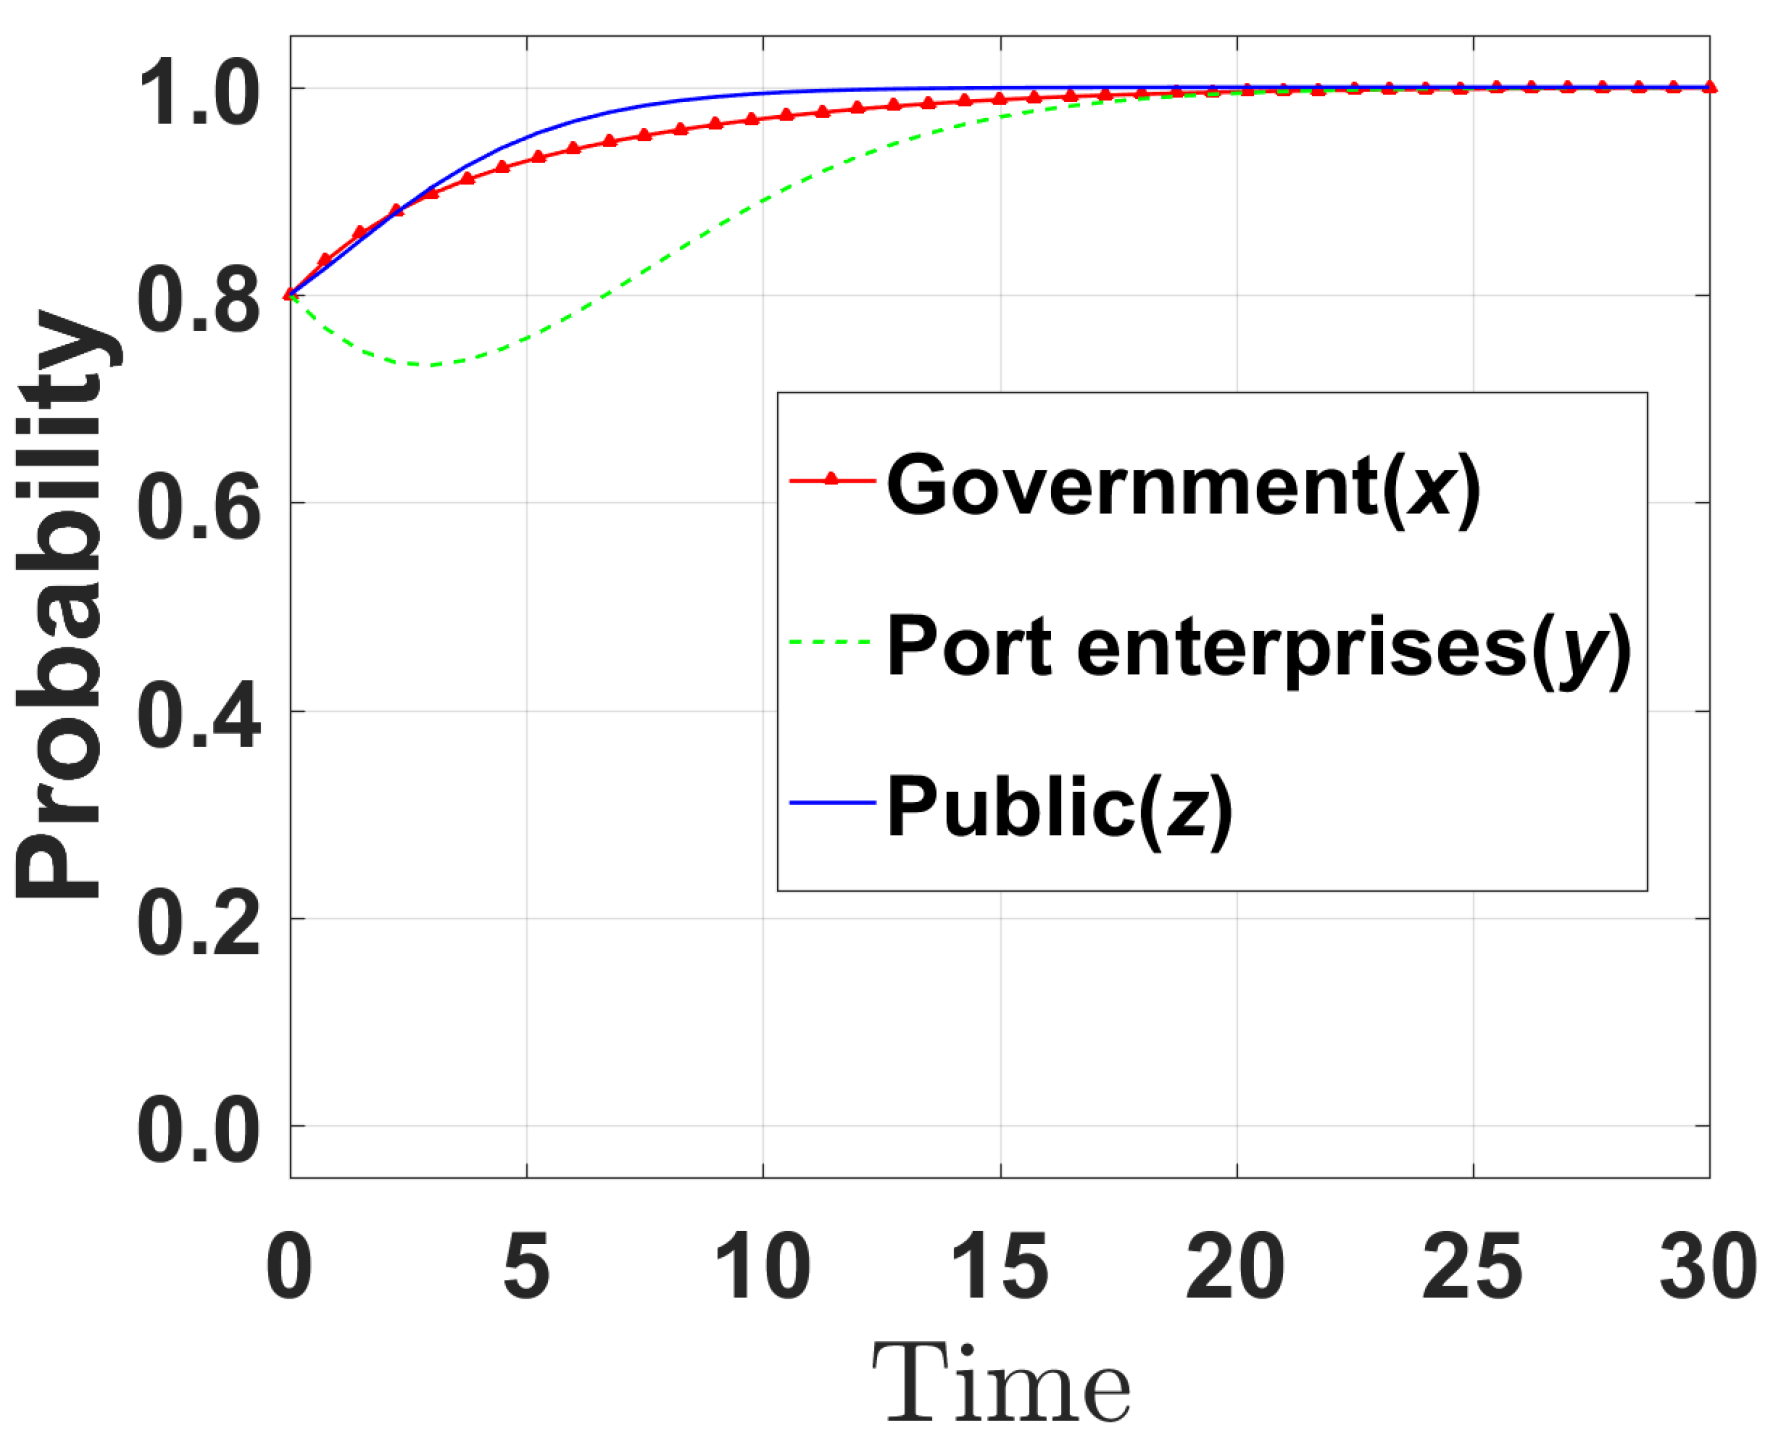
5. Simulation Analysis

Based on the theoretical analysis of collaborative governance of atmospheric pollutants in ports, Matlab R2016b numerical simulation tools can be utilized to experimentally verify the evolution process. The existing research indicates that the intervention of higher-level governments in local environmental governance can enhance policy implementation rigidity, integrating multi-stakeholder resources through fiscal transfer payments and accountability mechanisms to promote cross-level collaborative governance [32]. However, there exists an adaptation contradiction between the unified emission reduction standards promulgated by higher-level governments and the differentiated operational characteristics of ports, which may affect cooperation stability [33]. Distinct from the randomness of individual supervision, port-adjacent community organizations leverage localized information advantages and collective action capabilities to systematically monitor pollution sources and participate in environmental decision making. Their organizational supervision model is more conducive to forming a long-term governance mechanism. It is noteworthy that the stable point E8(1,1,1) demonstrates that when government incentives, enterprise emission reductions, and public supervision form positive interactions, the system can achieve a win-win scenario of pollutant reduction and port development. Therefore, under the E8(1,1,1) scenario, we explore the strategic choices of various game participants under different parameter changes in the system, thereby making the evolutionary paths of the tripartite game among government, port enterprises, and the public more intuitive.

5.1. Initial Setup of System Simulation

Due to insufficient attention to regional differences in port emission reduction in existing studies [34], this study takes Ningbo-Zhoushan Port as the research object, which is mainly based on the following three considerations:
(1) Global shipping hub status: Ningbo-Zhoushan Port has been the world’s largest cargo throughput for 14 consecutive years since 2009. Its operation scale and pollution emission intensity have an overall impact on the air quality of the Yangtze River Delta region and the “double carbon” process, and it is urgent to explore a multi-subject collaborative governance mechanism.
(2) Typical policy practice: As a pilot project of the 14th Five-Year Plan for green port construction in China, Ningbo-Zhoushan Port has implemented projects such as the “green wharf” transformation and full coverage of the shore power system, which provide a realistic basis for model parameter setting.
(3) Data availability and adaptability: The parameters of this study were all derived from local documents such as the 2024 Annual Budget Report of Ningbo Environmental Protection Bureau (http://sthjj.ningbo.gov.cn/art/2024/2/27/art_1229051503_4364171.html (accessed on 16 June 2025)) and the Tax Report of Ningbo Port Economy (http://tjj.ningbo.gov.cn/art/2025/3/20/art_1229042825_58921061.html (accessed on 16 June 2025)) to ensure that the model parameters are highly consistent with the actual operation characteristics of the port.
Through the empirical analysis of integrating port operation data and policy text, the initial value of parameters was set as shown in Table 4 (unit of CNY 1 billion).
Government parameters: The special budget for environmental governance (C1) was set at CNY 150 million, referring to the “2023 Budget Report of the Ningbo Municipal Ecology and Environmental Protection Bureau” (http://sthjj.ningbo.gov.cn/art/2024/10/8/art_1229051503_4448001.html (accessed on 16 June 2025)); the cost of incentive policies (C2) was proposed to be CNY 80 million based on the allocation plan of the Ningbo Municipal Green Port Construction Special Fund; the baseline tax revenue loss (R1) was taken from the annual tax revenue baseline value of port enterprises in the “2023 Port Economic Tax Report of Ningbo City”, which was reported at CNY 12 billion; the public support gain (S1) was set at 2.5 based on environmental governance performance and public satisfaction survey data.
Enterprise parameters: The emission reduction investment cost (C3) was proposed to be CNY 600 million, referring to the cost accounting of the “Green Terminal” renovation project of Ningbo-Zhoushan Port; the carbon market trading revenue (S2) was set at CNY 150 million based on the average trading price of the national carbon market; the green financing incentive (K) was converted to CNY 75 million based on the low-interest loan ratio in the Ningbo Municipal “Carbon Account” pilot policy.
Public parameters: The supervision cost (C4) was set at CNY 100 million based on environmental supervision behavior survey data; the whistleblower reward (S5) was proposed to be CNY 150 million, referring to the Shenzhen environmental whistleblower reward standard; the baseline environmental satisfaction value (R2) was taken from the average air quality satisfaction value of 28.2 in the “2023 People’s Livelihood Satisfaction Survey of Ningbo City”.
The probabilities of the three initial strategies were set to [0.2, 0.2, 0.2], [0.5, 0.5, 0.5], and [0.8, 0.8, 0.8]. The initial likelihood of the government selecting incentive strategies was set at 0.2, 0.5, and 0.8. Similarly, the initial probabilities for businesses to adopt emission reduction strategies and for the public to exercise supervision strategies were also specified as 0.2, 0.5, and 0.8. The simulation diagrams of the initial state at the equilibrium point (1,1,1) are shown in Figure 2, Figure 3 and Figure 4. Based on these diagrams, various parameters were changed, and the influence mechanism among various factors was studied. When the initial probability of all three parties was set to 0.2 (Figure 2), the probability (y) of port enterprises choosing an emission reduction strategy quickly converged to 1 after t = 18. This scenario suggests that the low initial willingness to participate leads to cautious strategy adjustments of all parties, and it takes longer to promote system optimization through the feedback mechanism of policy incentives and public supervision. When the initial probabilities of all three parties were set to 0.5 (Figure 3), the probability (y) of port enterprises choosing to reduce emissions quickly converged to 1 after t = 10. When the initial probabilities of all three parties were set to 0.8 (Figure 4), the probability (y) of port enterprises choosing to reduce emissions quickly converged to 1 after t = 5. Such a scenario suggests that high initial willingness accelerates the transmission of policy effects, and enterprises respond to reduce emissions quickly due to dual pressures (government incentives and public supervision). However, some small- and medium-sized terminals at Ningbo-Zhoushan Port still rely on diesel power generation due to funding shortages. The model did not account for heterogeneity in enterprise scale, resulting in an overly optimistic prediction of the convergence speed results.

5.2. Impact of Parameter Changes

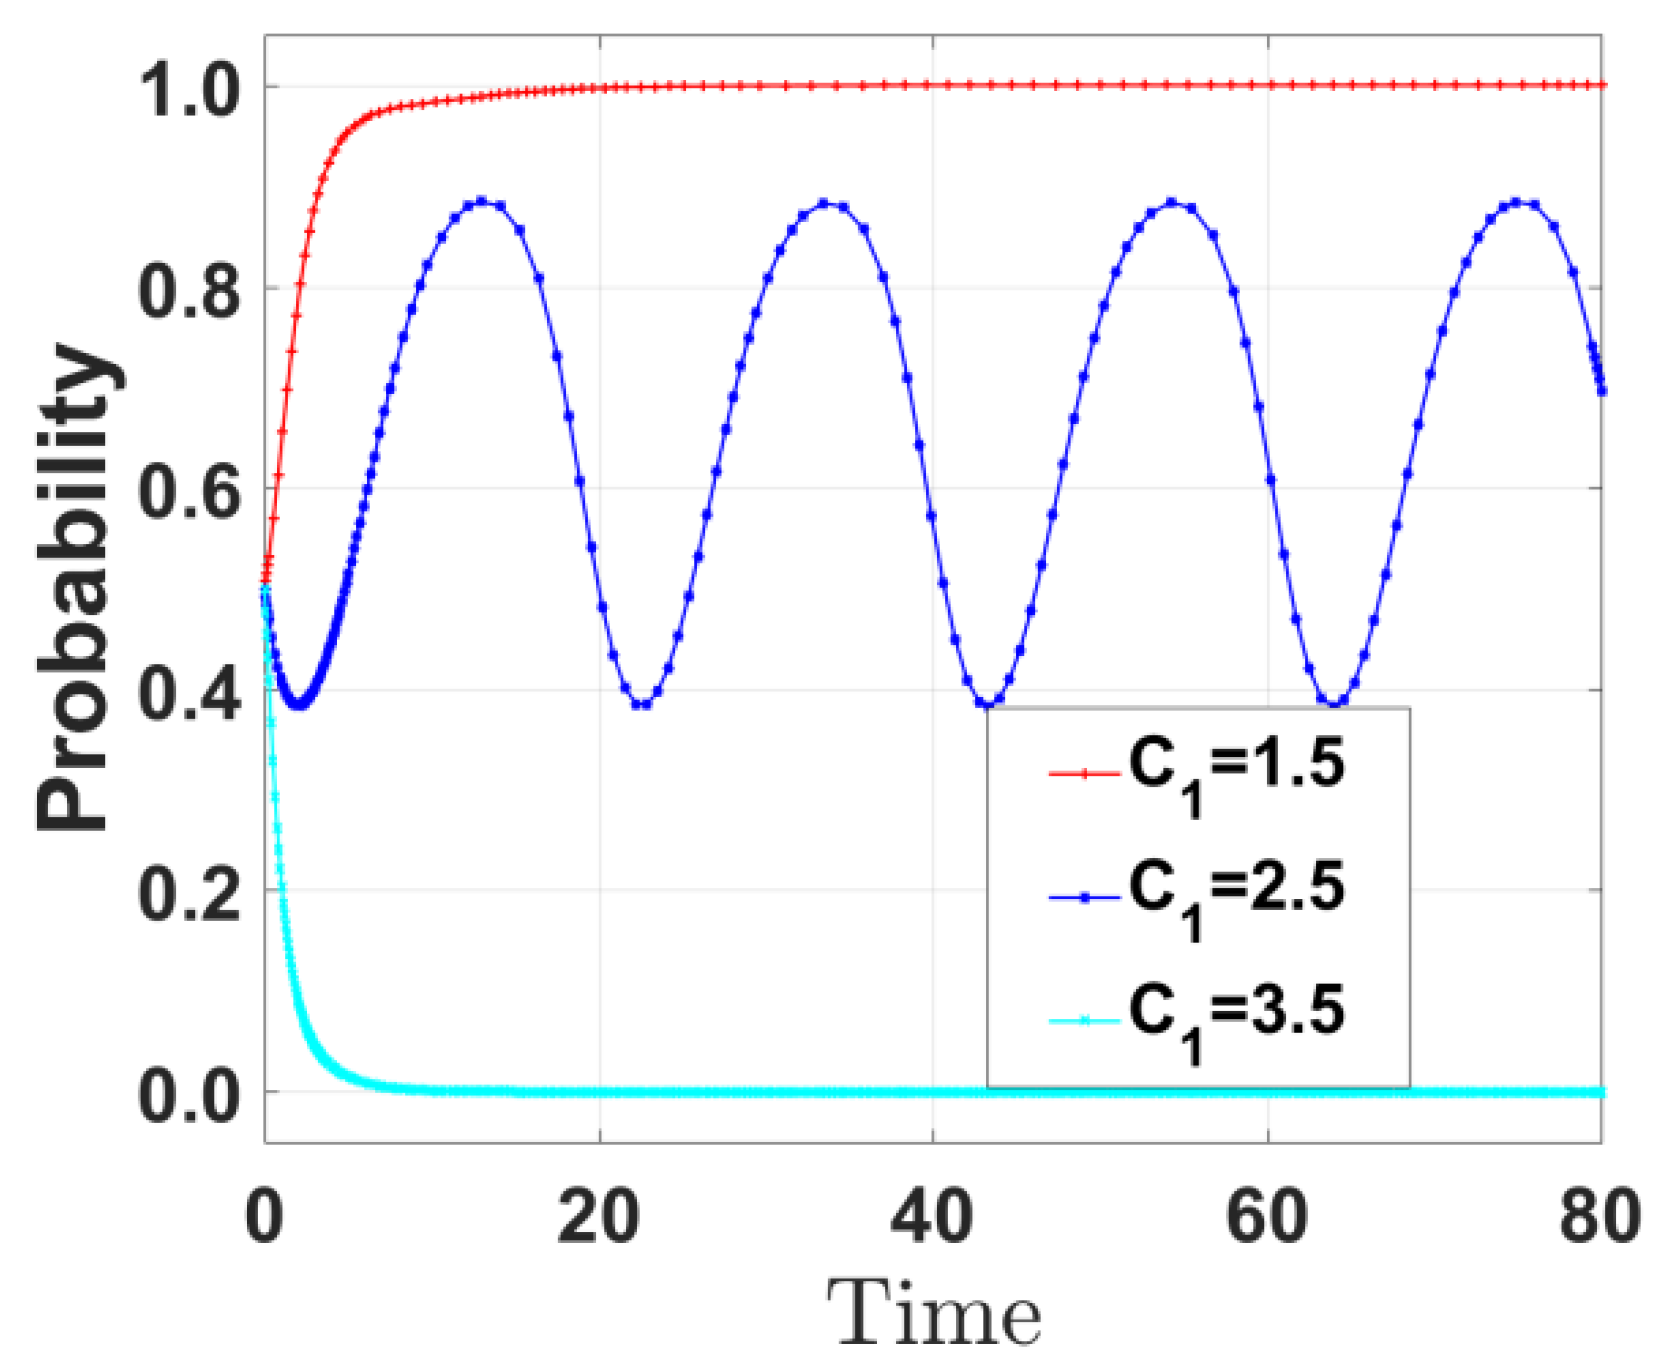
5.2.1. Impact of C1 Variation

By varying the government’s special budget for environmental governance (C1) and increasing it to 2.5 and 3.5, respectively, the evolution path of the government’s strategy was derived and is shown in Figure 5. When C1 increases from 1.5 to 3.5, the probability of the government choosing incentive strategies decreases gradually. The reason is that the higher the C1, the greater the direct cost for the government to implement incentive policies. When the cost exceeds the expected benefits, the government tends to reduce incentives and instead chooses “no incentive” to save the budget.
When C1 is 1.5, the government’s incentive cost is low, and the net benefit of incentive strategies is high, so the government quickly converges to incentive strategies. When C1 is 2.5, the government’s incentive cost and expected benefits are close to equilibrium, but there is a diminishing marginal benefit effect. At this point, if the government chooses to incentivize, it needs to bear higher costs, but the effect of enterprise emission reduction may be limited due to insufficient policy efforts, resulting in no significant increase in S1 (public support gain). However, if the government does not incentivize, although it saves incentive costs, it needs to bear the governance cost (L) of aggravated pollution and the hidden loss of decreased public support. Therefore, the government is caught in a dilemma between “high incentive costs but poor effects” and “high risks of no incentive”, and there is a lack of clear benefit orientation in strategy choices. When C1 is 3.5, the high cost of incentive strategies causes the government to weigh the input and benefits, so the government quickly converges to the nonincentive strategy.
By varying the government’s special budget for environmental governance (C1) and increasing it to 2.5 and 3.5, respectively, the evolution path of port enterprises’ strategies was derived and is shown in Figure 6. When C1 increases, the probability of enterprises choosing emission reduction strategies decreases significantly, and the convergence speed slows down. The reduction in the probability of the government choosing incentive strategies leads to a decrease in enterprises’ emission reduction subsidy benefits, which directly weakens their motivation for emission reduction. For instance, the reduced probability of obtaining government subsidies and green financing preferences may result in the net benefits of enterprises’ emission reduction being lower than the expected losses of maintaining the status quo.
When C1 is 1.5, the government actively incentivizes, and the comprehensive benefits of enterprises’ emission reduction are high, so they quickly converge to emission reduction strategies. When C1 is 2.5, the government’s strategy exhibits periodic fluctuations, so enterprises are more inclined to wait and see or maintain the status quo. When C1 is 3.5, the government chooses the nonincentive strategy, so the convergence speed of enterprises choosing the nonemission reduction strategy accelerates. In reality, reduced government incentives may weaken the emission reduction capabilities of small- and medium-sized enterprises (SMEs), particularly those facing high costs for technological upgrades. Some small- and medium-sized logistics companies at the Ningbo-Zhoushan Port have postponed the procurement of shore power equipment due to a lack of subsidies, resulting in uneven progress in emission reduction.
By varying the government’s special budget for environmental governance (C1) and increasing it to 2.5 and 3.5, respectively, the evolution path of the public’s strategies was derived and is shown in Figure 7. When C1 increases from 1.5 to 3.5, the probability of the public choosing oversight strategies decreases gradually. The benefits of the public’s oversight strategy mainly depend on whistleblower rewards and the health economic value, while the oversight cost is a fixed expenditure. The increase in the government’s incentive costs leads to the choice of nonincentive strategies, which in turn reduces the government rewards for the public’s whistleblowing on enterprises’ illegal emissions and lowers their willingness to oversee.
When C1 is 1.5, the government actively incentivizes, and the public can obtain whistleblower rewards, so they quickly converge to oversight strategies. When C1 is 2.5, the government’s incentive costs are relatively high, and whistleblower rewards are high. The public may anticipate that others will actively oversee, thus choosing to “free-ride” to reduce their costs. However, when most people choose not to oversee, the nonemission reduction behavior of port enterprises will increase, forcing some members of the public to choose oversight. This conflict between individual and group strategies may lead to repeated oscillations in the oversight ratio, causing the public’s oversight strategy to swing. When C1 is 3.5, the government chooses the nonincentive strategy, so the public is more inclined to choose the nonoversight strategy.

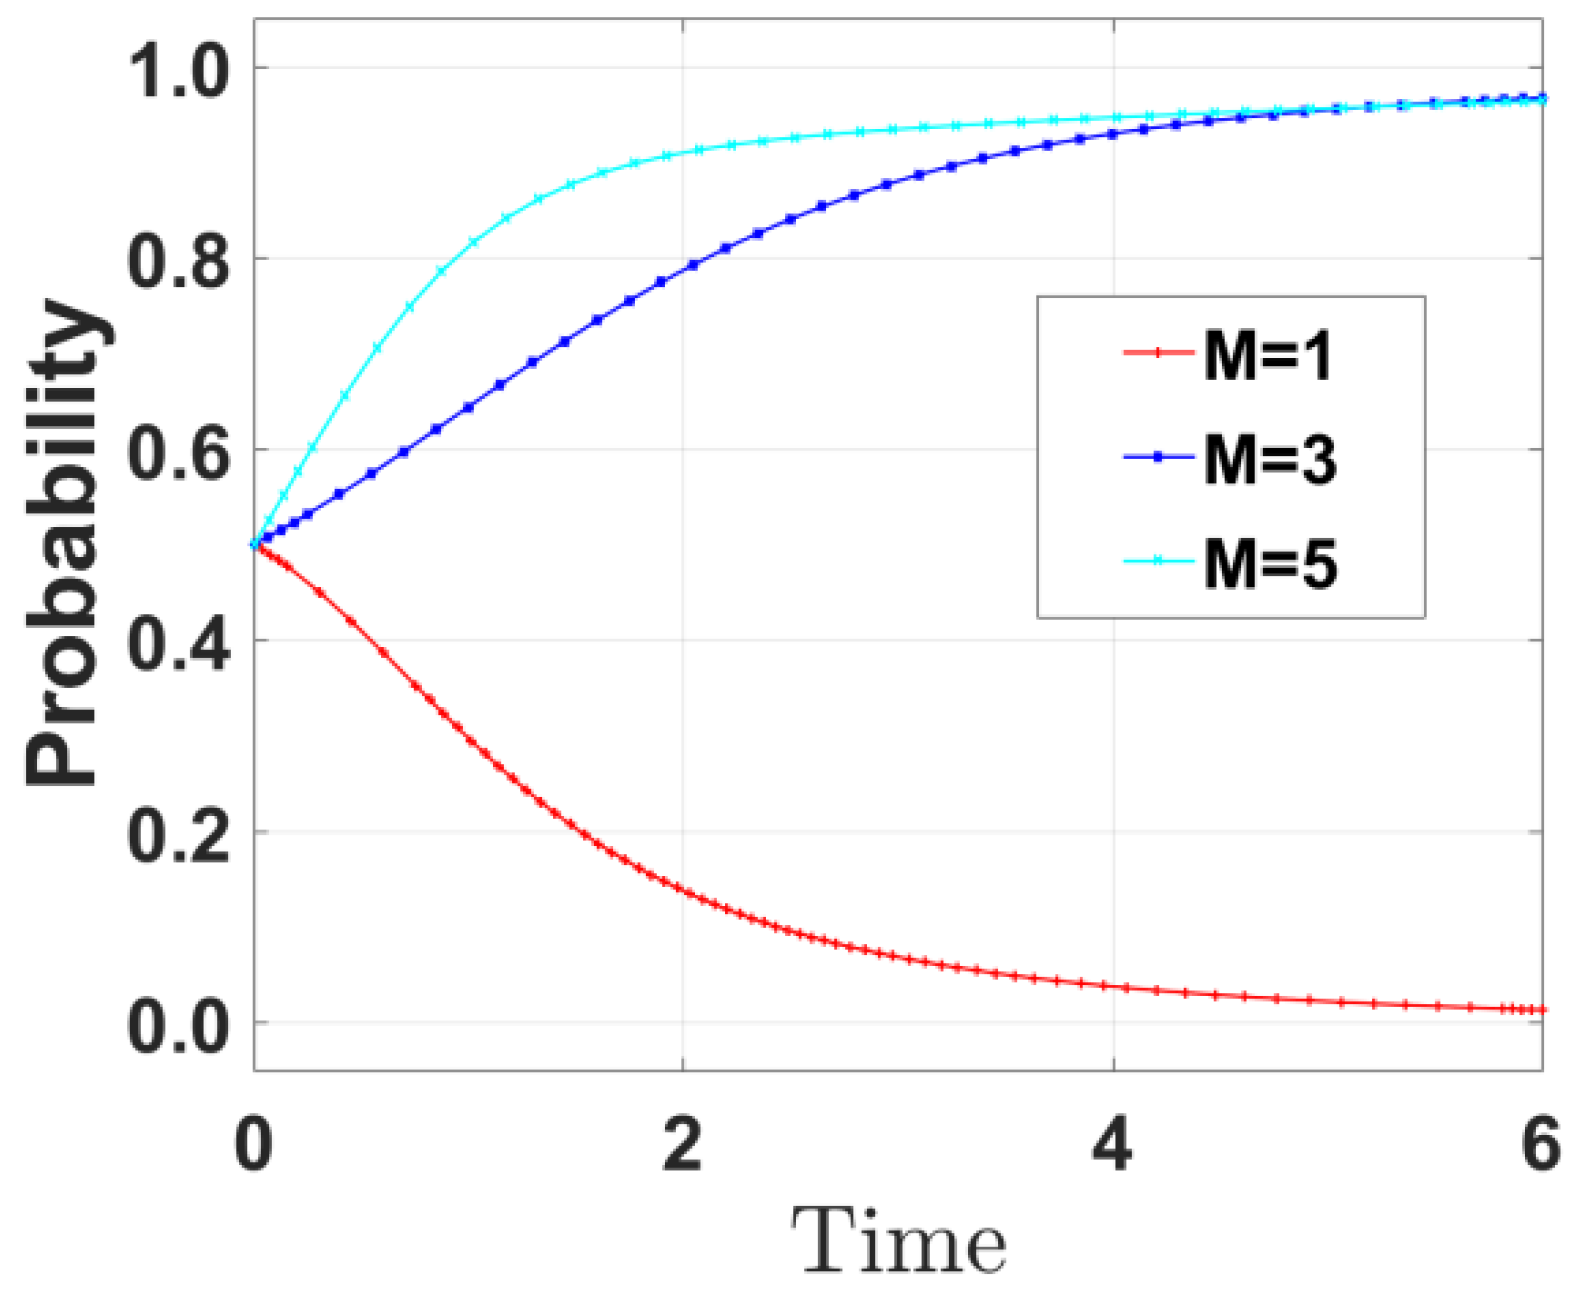
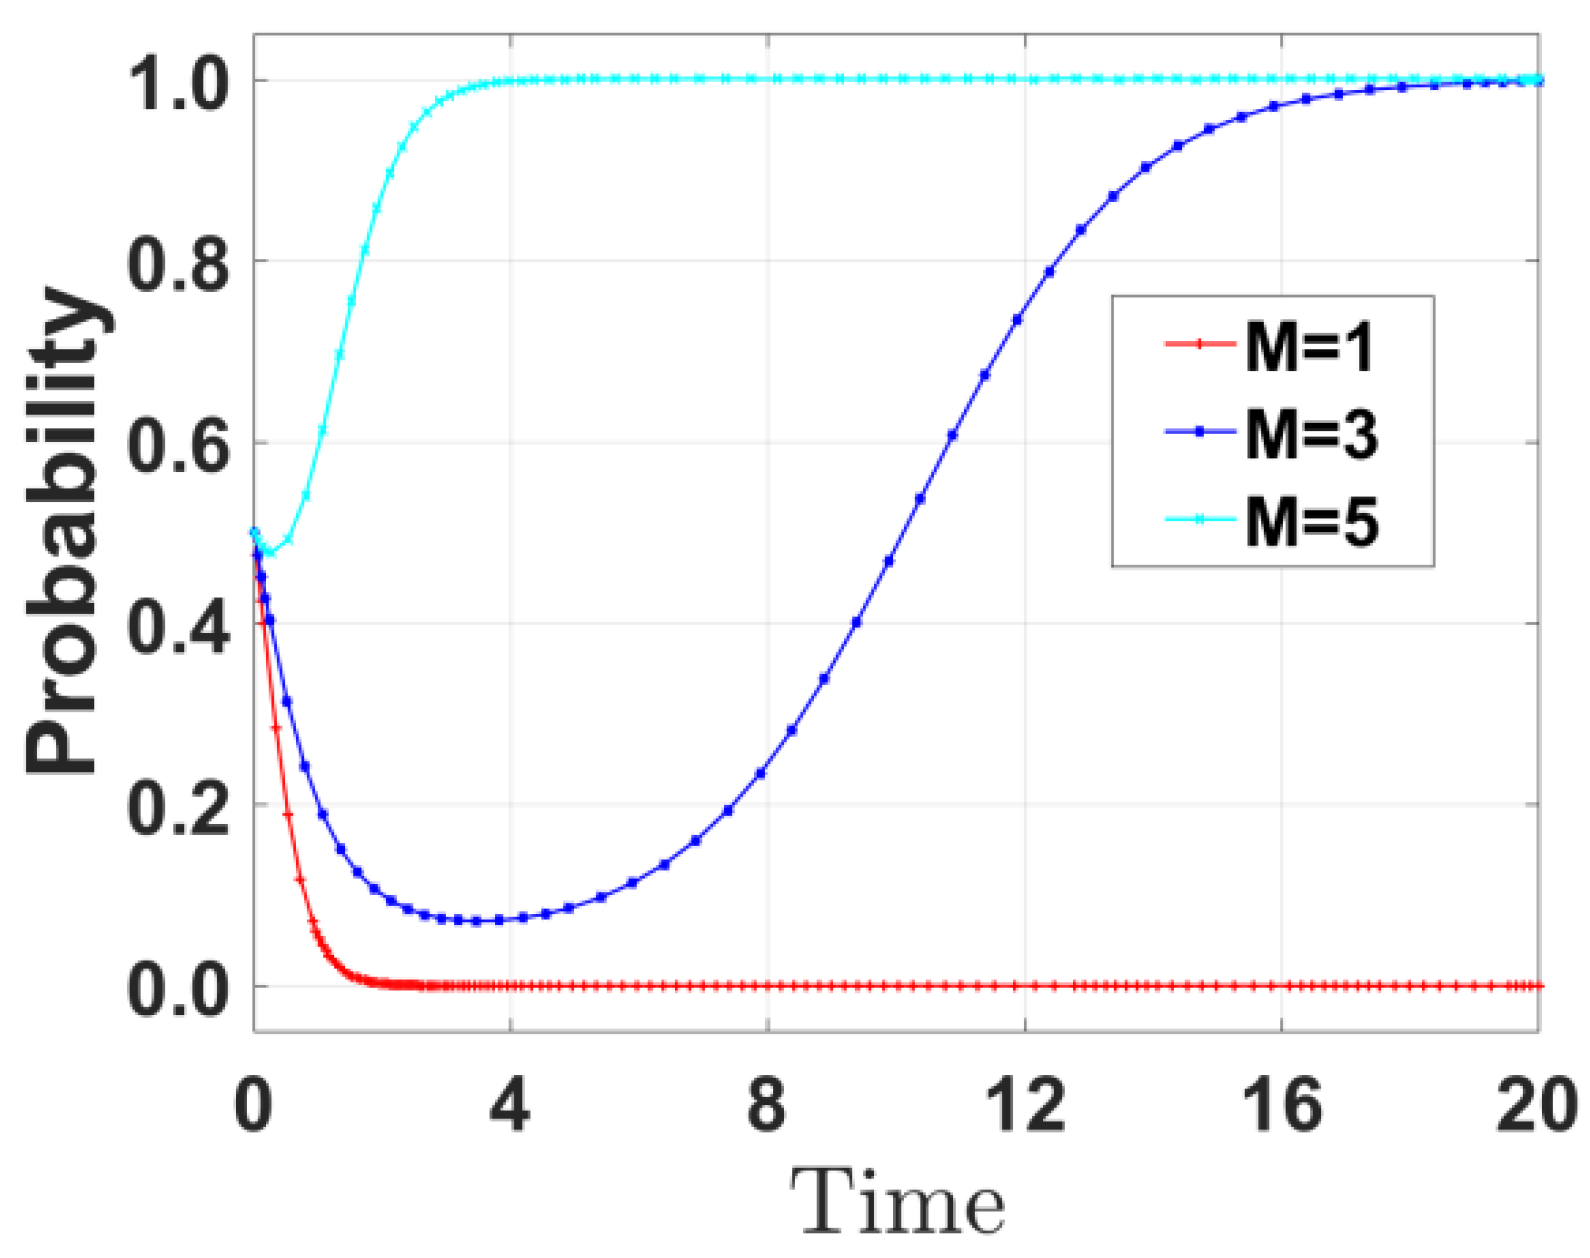
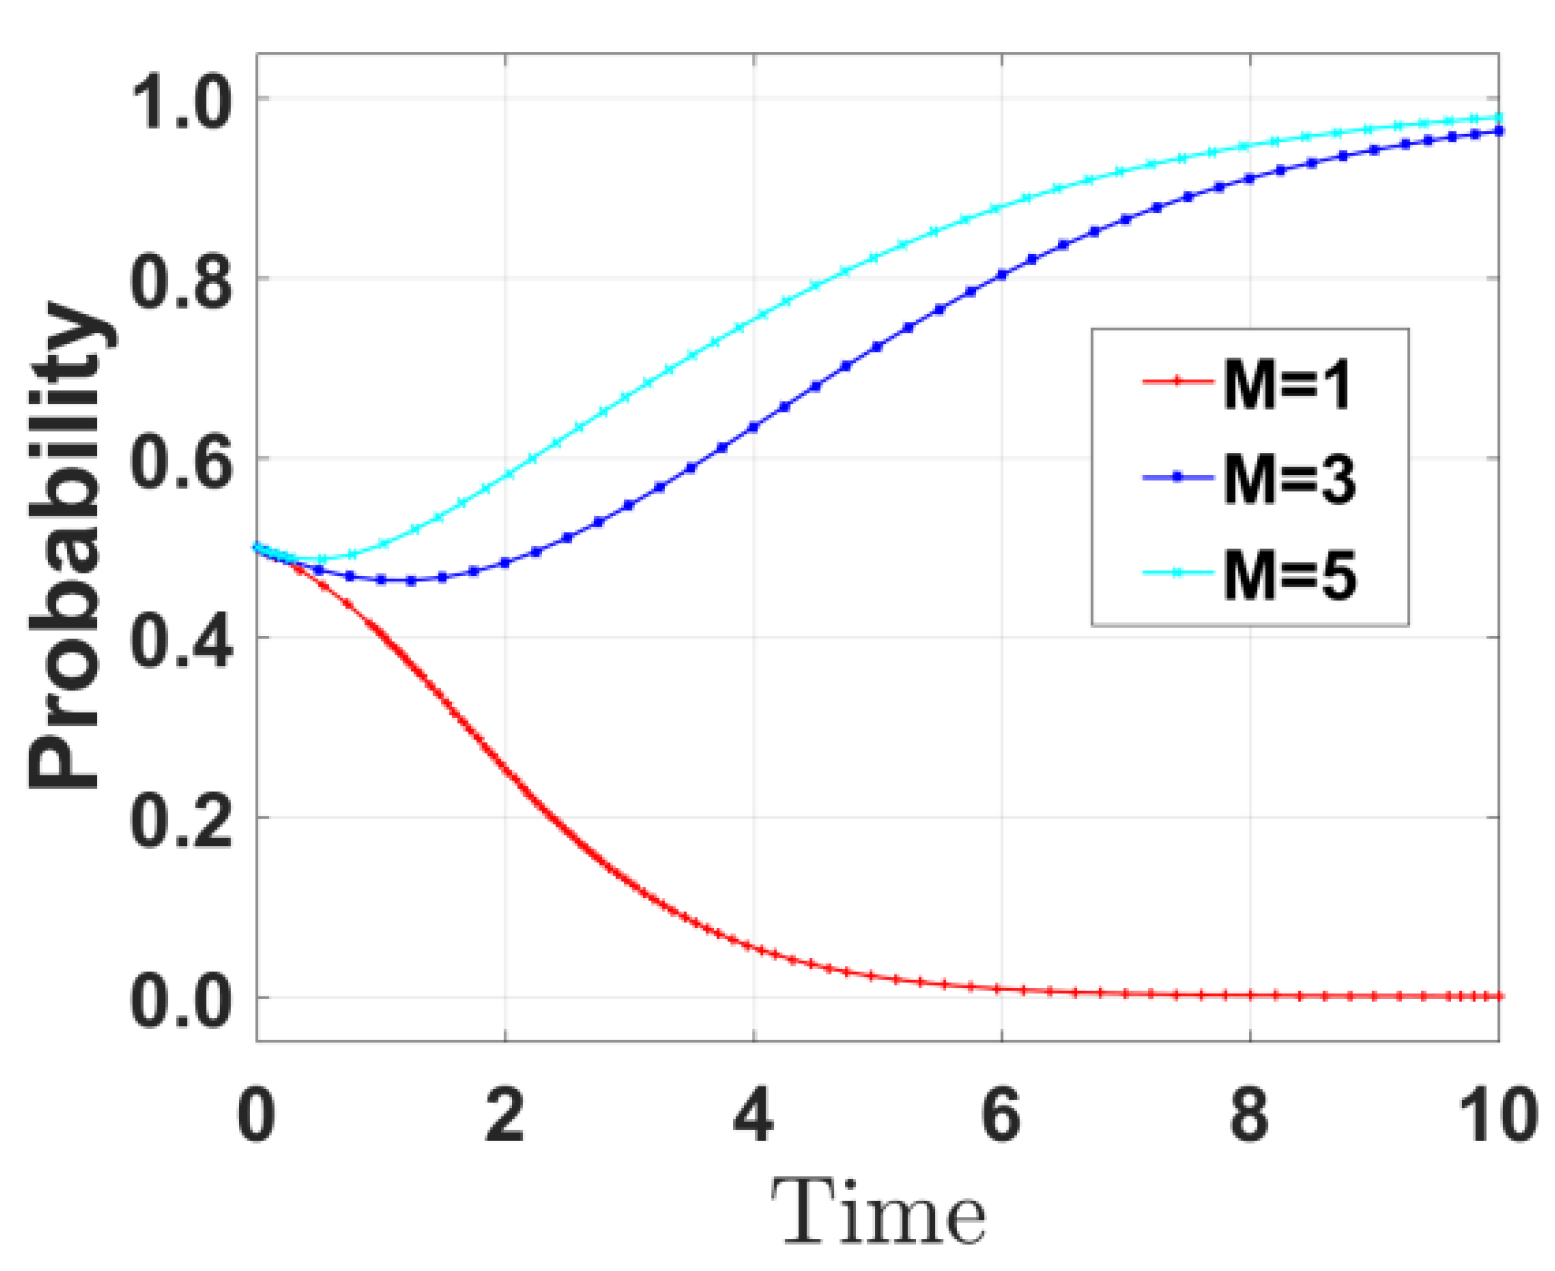
5.2.2. Impact of M Variation

By varying the government fine M faced by port enterprises when they do not reduce emissions and reducing M to 1 and increasing it to 5, respectively, the evolution path of government strategies was derived and is shown in Figure 8. As M increases, the probability of the government choosing incentive strategies shows an upward trend. When M = 1, the government’s incentive probability quickly converges to 0; when M = 3, the incentive probability shows a slow upward trend; when M = 5, the incentive probability quickly rises to 1.
When M = 1, the fine amount is low, and port enterprises tend to choose nonemission reduction strategies. Given this scenario, the government needs to promote enterprise emission reduction through direct incentives to make up for the lack of deterrence of low fines. Moreover, the net benefits of government incentives in the given scenario are lower than the potential losses of nonincentives, so the government chooses nonincentive strategies. When M = 3 and M = 5, high fines significantly increase the costs of enterprises when they do not reduce emissions. The government can still offset part of the governance costs through fine income by choosing “incentives” and saving incentive costs at the same time, so the government actively chooses incentive strategies.
By varying the government fine M faced by port enterprises when they do not reduce emissions and reducing M to 1 and increasing it to 5, respectively, the evolution path of port enterprise strategies was derived and is shown in Figure 9. As M increases, the probability of enterprises reducing emissions increases significantly. When M = 1, the probability of enterprises reducing emissions is below 0.5 for a long time; when M = 3, the probability of emission reduction gradually rises to 1; when M = 5, the probability of emission reduction quickly converges to 1.
When M = 1, low fines have insufficient deterrence to enterprises, and the comprehensive benefits of enterprises’ emission reduction may be lower than the losses of maintaining the status quo, so enterprises are more inclined to not reduce emissions. When M = 3 and M = 5, high fines significantly increase the costs of enterprises when they do not reduce emissions. To avoid fines and reputation losses, enterprises tend to actively reduce emissions even if government incentives are reduced. Under this scenario, the comprehensive benefits of emission reduction and the benefits of avoiding fines exceed the investment costs of emission reduction.
By varying the government fine M faced by port enterprises when they do not reduce emissions and reducing M to 1 and increasing it to 5, respectively, the evolution path of the public’s strategies was derived and is shown in Figure 10. As M increases, the probability of the public overseeing shows a trend of first decreasing and then increasing. When M = 1, the oversight probability quickly drops to 0; when M = 3, the oversight probability briefly decreases and then rises to 1; when M = 5, the oversight probability quickly rises to 1.
When M = 1, under low fines, enterprises have insufficient motivation to reduce emissions. Given this scenario, the government needs to promote enterprise emission reduction through direct incentives, which leads to high government costs and the choice of nonincentive strategies. Consequently, the public receives fewer whistleblower rewards, so they tend to choose nonoversight strategies. When M = 3 and M = 5, high fines encourage enterprises to actively reduce emissions, and the government can also increase whistleblower rewards by offsetting part of the governance costs through fine income. At this time, environmental pollution is reduced, the public’s health risks are lowered, and the marginal benefits of oversight rise, further enhancing oversight motivation. Therefore, the public is more inclined to choose oversight strategies.

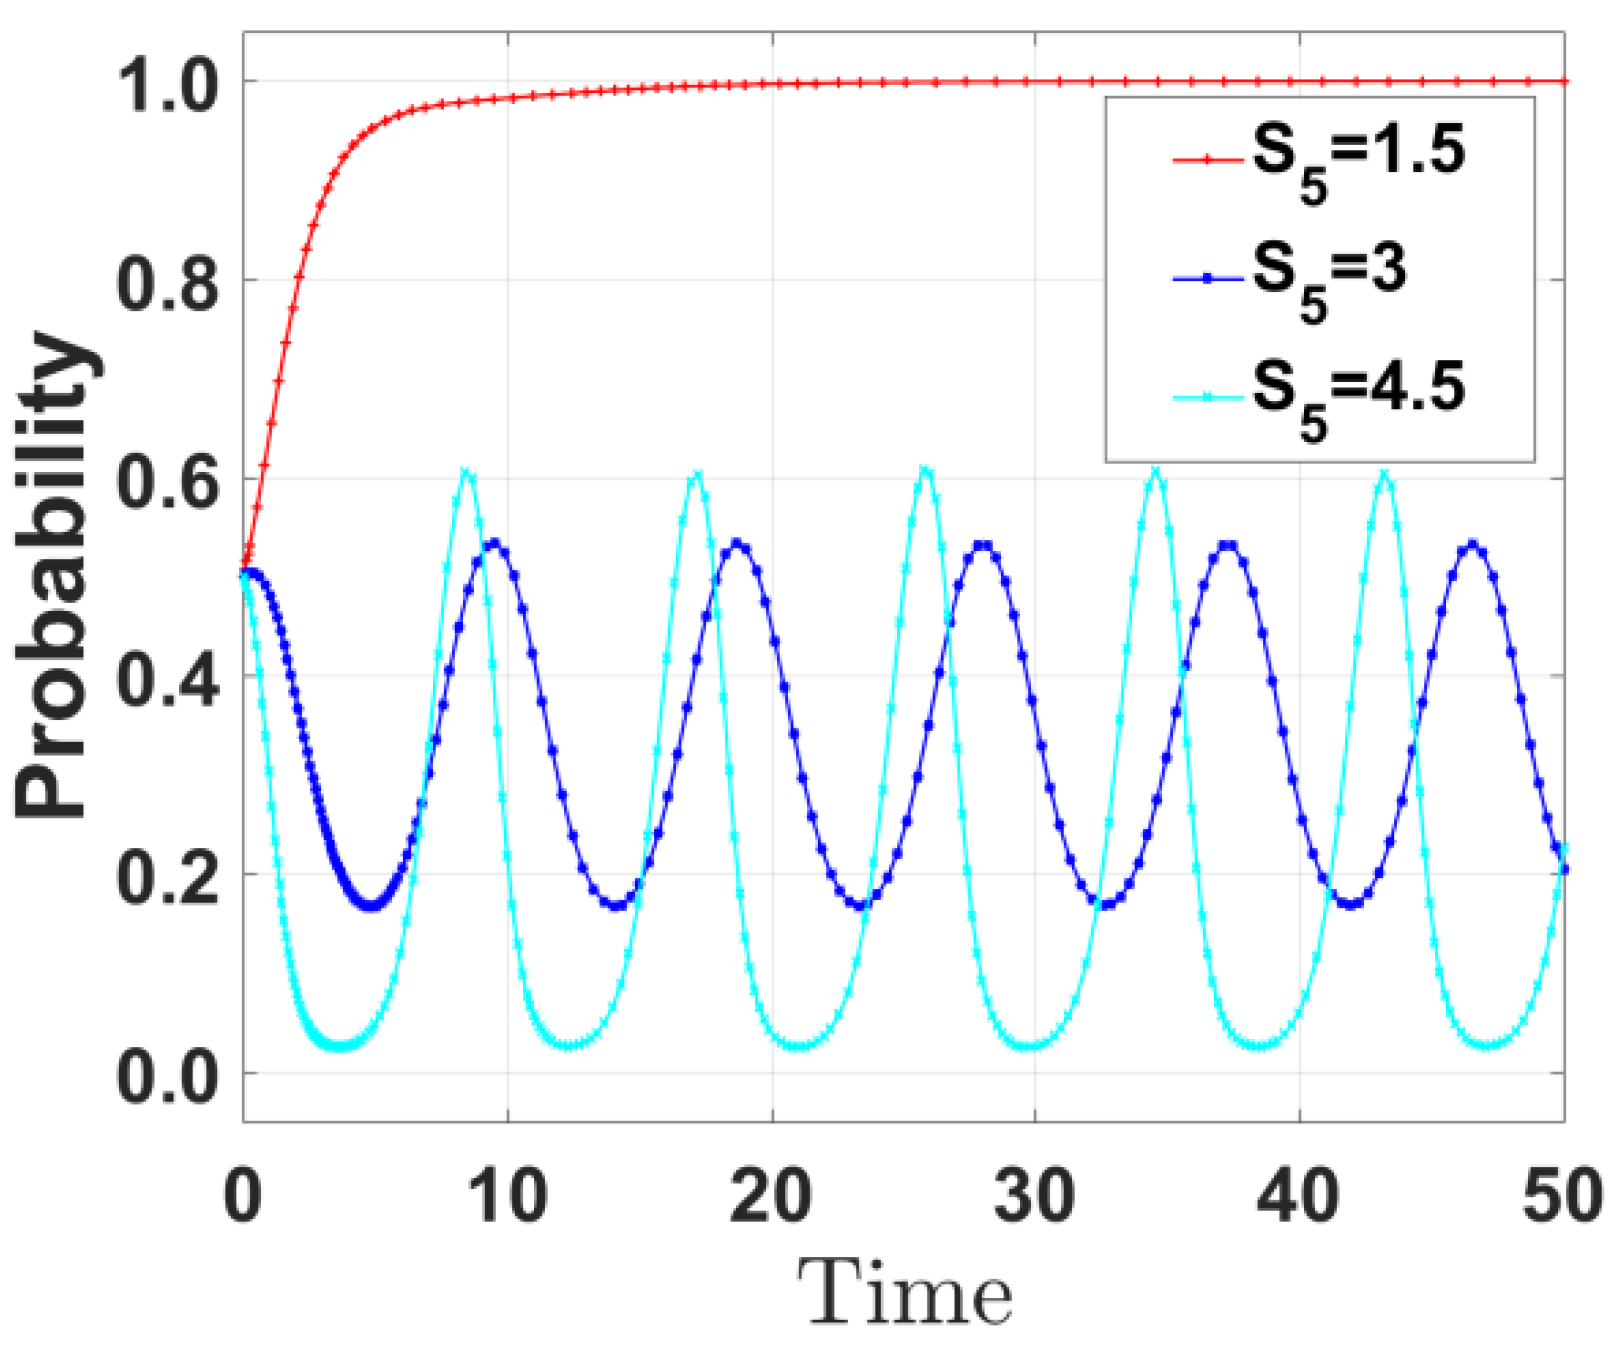
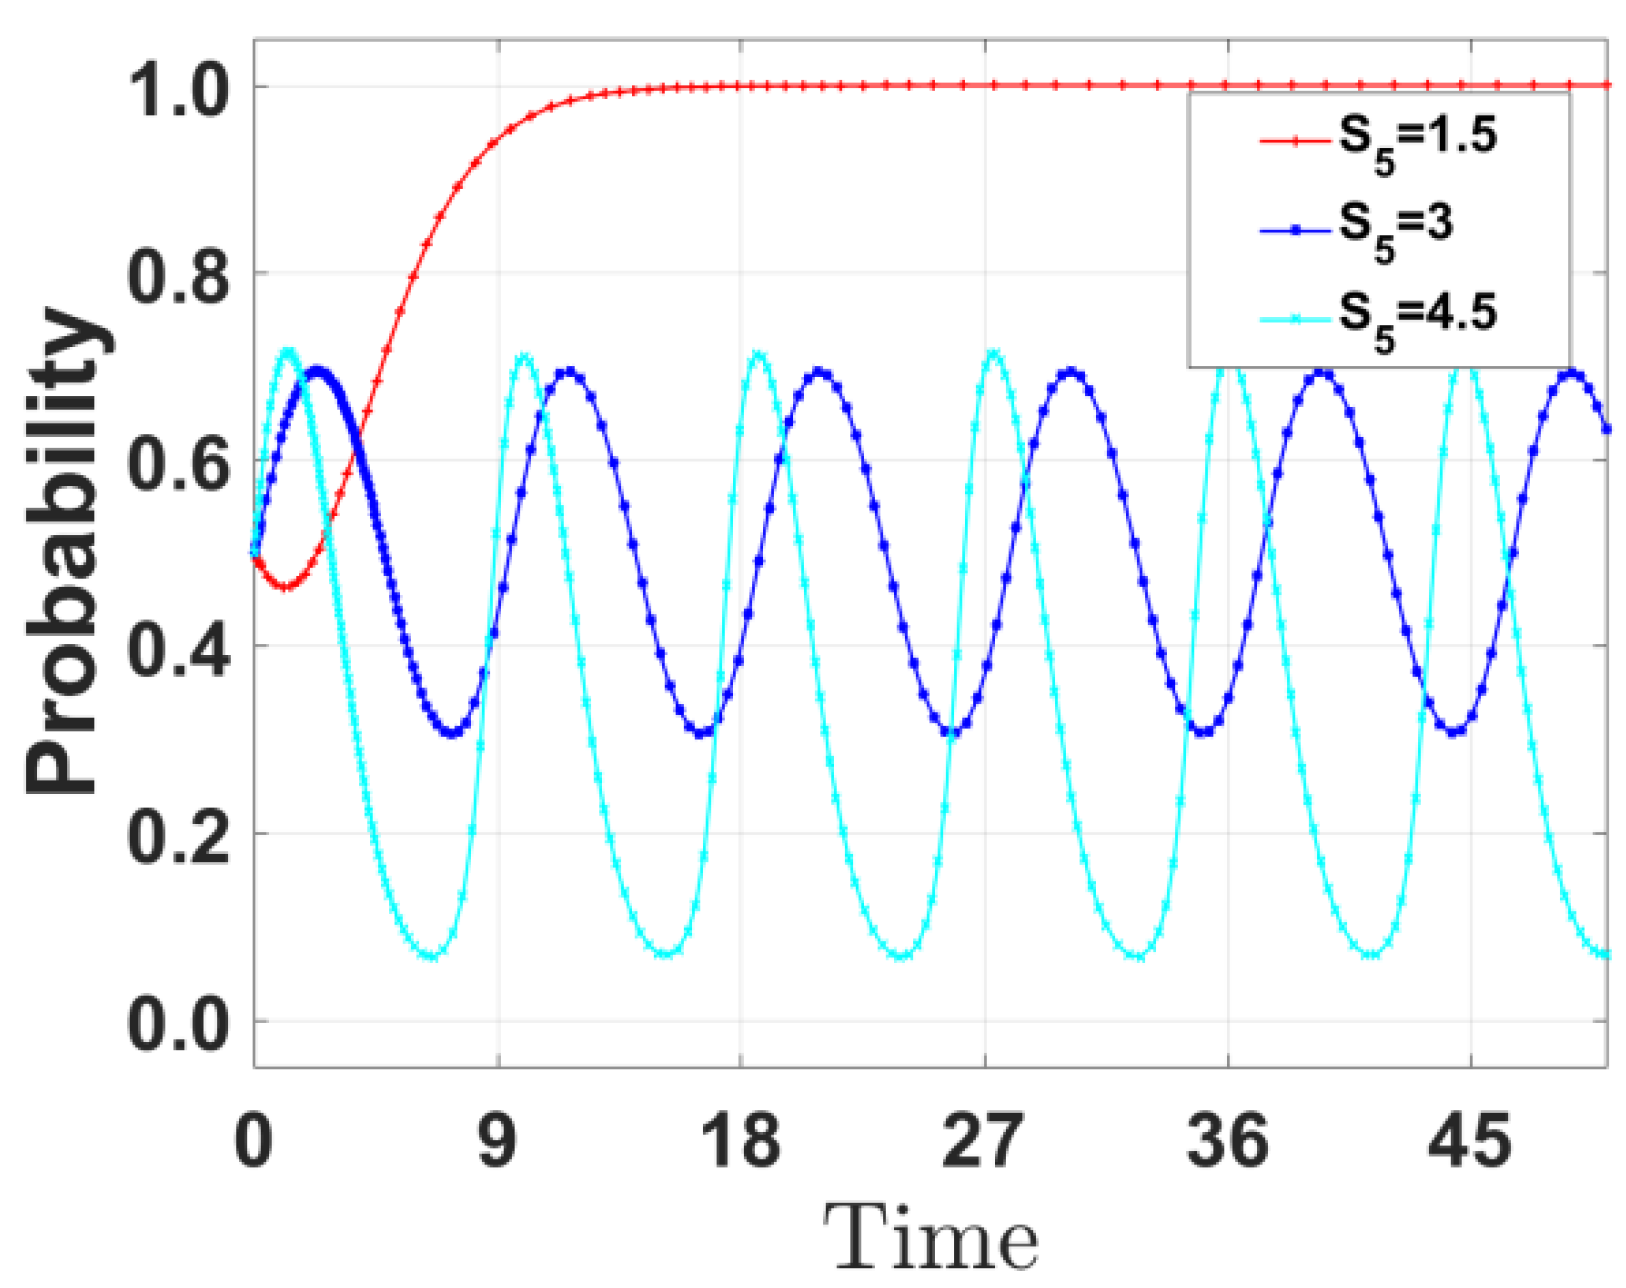
5.2.3. Impact of S5 Variation

By varying the government reward S5 received by the public for reporting illegal emissions by enterprises and increasing S5 to 3 and 4.5, respectively, the evolution path of government strategies was derived and is shown in Figure 11. When S5 increases from 1.5 to 4.5, the probability of the government choosing incentive strategies decreases. When S5 = 1.5, the government’s incentive probability is relatively high. As S5 increases to 3 and 4.5, the incentive probability fluctuates between 0 and 1.
When S5 = 1.5, the whistleblower reward given to the public is low. Given this scenario, the government can focus on the expenditure for enterprise incentives, making it profitable for the government, port enterprises, and the public to participate. However, when S5 increases, the government needs to pay more whistleblower rewards, which directly increases financial pressure. If the government maintains the incentive policy, the total cost may exceed the governance benefits. For this reason the government tends to reduce incentive strategies to balance the budget, but this may lead to insufficient motivation for enterprises to reduce emissions, triggering pollution rebound and forcing the government to increase incentives again. This cycle of “incentive–disincentive–re-incentive” forms strategic oscillation.
We altered the government reward S5 for public reporting of corporate violations of emissions, increasing S5 to 3 and 4.5, respectively. The evolutionary path of port enterprise strategies was derived and is shown in Figure 12. When S5 increases from 1.5 to 4.5, the probability of port enterprises choosing emission reduction strategies gradually decreases. When S5 equals 1.5, the probability of port enterprises choosing emission reduction briefly drops and then rapidly increases to 1; as S5 increases to 3 and 4.5, the probability of emission reduction rapidly decreases to 0.
When S5 = 1.5, the government tends to adopt incentive strategies, and the public also tends to adopt oversight strategies. Given this scenario, the emission reduction behavior of port enterprises is affected by both government incentives and public oversight, thus promoting port enterprises to tilt their strategies toward emission reduction. An increase in S5 means higher incentive costs for the government, so the government will hesitate between oversight and nonoversight strategies. To avoid double losses, the probability of enterprises actively reducing emissions decreases.
By varying the government reward S5 received by the public for reporting illegal emissions by enterprises and increasing S5 to 3 and 4.5, respectively, the evolution path of the public’s strategies was derived and is shown in Figure 13. When S5 is increased from 1.5 to 4.5, the probability of the public choosing oversight strategies decreases. When S5 = 1.5, the probability of the public overseeing is relatively high. As S5 increases to 3 and 4.5, the oversight probability fluctuates between 0 and 1.
When S5 = 1.5, the government will choose incentive strategies. Given this scenario, the whistleblower reward directly covers the oversight costs, and the health–economic value of public oversight increases, forming a positive incentive. Therefore, the public will tend to choose oversight strategies. However, when S5 is high, the attraction of whistleblower rewards may trigger differentiation in group behavior. Some members of the public actively oversee due to high rewards, while others expect others to oversee and choose to “free-ride”. When the proportion of oversight is too high, the pressure on port enterprises to reduce emissions increases sharply. After pollution is reduced, the marginal benefits of public oversight decrease, leading some people to withdraw from oversight. When the proportion of oversight is too low, port enterprises may relax emission reduction, and pollution rebound will stimulate oversight again. This conflict between individual and group interests leads to periodic fluctuations in the public’s oversight strategies. In real-world scenarios, the actual supervision costs include implicit risks, such as conflicts with enterprises, leading some members of the public to opt for “rational neglect”.

6. Conclusions and Recommendations

This study constructs an evolutionary game model involving “government, port enterprises, and the public,” treating the government, port enterprises, and the public as core stakeholders. These three entities are commonly present in pollution control efforts at most ports. Although parameter values may vary by region, the game logic (such as incentive–constraint mechanisms and cost–benefit tradeoffs for supervision) is applicable across different ports. Additionally, this paper combines operational data from the Ningbo-Zhoushan Port with numerical simulations to reveal the dynamic evolution patterns and key influencing factors of multi-stakeholder collaborative governance of atmospheric pollutant emissions. Our research shows the following:
(1) Governmental fiscal incentives vs. penalty mechanisms: The government’s special environmental governance budget (C1) and fines imposed on noncompliant enterprises (M) exert significant influences on system equilibrium. Elevating C1 accelerates the attenuation of the government’s incentive willingness, whereas increasing M effectively drives enterprises’ emission reduction probability toward full compliance (convergence to 1).
(2) Nonlinear characteristics of public oversight: Enhanced government rewards (S5) for whistleblowing on illegal emissions temporarily intensify surveillance motivations, but excessively high incentives trigger “free-rider effects”, causing oscillations in supervision participation rates. This underscores the necessity to calibrate incentive intensity against fiscal sustainability.
(3) The stable equilibrium of collaborative governance (1,1,1) must satisfy three conditions: government incentive costs are lower than public reputation gains, net benefits from corporate emission reduction are higher than opportunity costs, and supervision benefits cover costs.
Based on this, it is recommended to construct a combined policy of “graded fines–dynamic subsidies–precise supervision” by differentially setting the thresholds for M and S5 to optimize resource allocation and to establish a port environmental credit rating system, linking corporate emission reduction performance with financing incentives, to solve the dilemma of “incentive dependence”. This policy framework provides a reference for other ports facing similar challenges. However, given the differences in policy environment, economic foundation, and stakeholder structure among various ports, adjustments should be made to fit the specific circumstances of each port. Specifically, ports with more flexible policy environments could adopt a tiered fine mechanism similar to that of Ningbo-Zhoushan Port, setting different fine standards based on the emission performance of enterprises to incentivize emission reductions through economic pressure. Ports with weaker financial foundations could consider adapting the dynamic subsidy approach. For example, they could collaborate with financial institutions to provide green financial products to port enterprises. Meanwhile, optimizing precise supervision measures, such as leveraging big data and the Internet of Things for real-time monitoring, can enhance regulatory efficiency and reduce supervision costs.
This study innovatively introduces the public as an active participant in environmental governance, revealing the moderating role of nongovernmental entities in monitoring costs and health concerns on governance pathways. It also uncovers the nonlinear effects of policy tools (such as the substitutability of incentives and fines, as well as the diminishing marginal returns of monitoring), addressing the limitations of static game theory models in explaining dynamic evolutionary mechanisms. The findings will contribute to achieving the “Dual Carbon” goals in the Yangtze River Delta region and provide the industry with a mechanism design framework that combines rigidity and flexibility.
However, this paper still has the following limitations: (1) Simplification of model assumptions: The collaborative emission reduction behaviors among upstream and downstream enterprises in the port supply chain were not considered, potentially underestimating the potential benefits of cross-entity cooperation. (2) Data limitations: Parameter calibration relied on local data from Ningbo-Zhoushan Port, and the generalizability of the conclusions needs to be verified through case studies of other ports. (3) Insufficient dynamism: Exogenous variables such as climate policy changes and technological advancements were not incorporated into the long-term evolutionary pathways.
Future research recommendations: (1) Expand the scope of multi-agent participation: Include shipping companies, cargo owners, and other stakeholders in the game-theoretic framework to construct a four-party evolutionary game model involving a “government–enterprise–society–supply chain”. (2) Introduce machine learning methods: Utilize reinforcement learning to simulate dynamic policy adjustment processes and optimize parameter threshold settings. (3) Explore pathways for localizing international experiences: Investigate the impact of cross-border carbon leakage on port governance by referencing the EU’s “Carbon Border Adjustment Mechanism” (CBAM).

Author Contributions

Conceptualization, K.Y. and L.M.; methodology, K.Y.; software, L.M.; validation, K.Y., L.M. and R.W.; formal analysis, K.Y.; investigation, K.Y.; resources, K.Y.; data curation, L.M.; writing—original draft preparation, L.M.; writing—review and editing, K.Y.; visualization, L.M.; supervision, K.Y.; project administration, K.Y. and R.W; funding acquisition, K.Y. All authors have read and agreed to the published version of the manuscript.

Funding

This research was supported by the Ningbo Philosophy and Social Sciences Planning Project (grant no. G2024-1-06) and the Research Launch Fund Project of Ningbo University of Technology (grant no. 2023KQ096).

Data Availability Statement

The data presented in this study are available on request from the corresponding author due to privacy.

Conflicts of Interest

The authors declare that they have no known competing financial interests or personal relationships that could have appeared to influence the work reported in this paper.

References

  1. Zhen, L.; Zhuge, D.; Murong, L.; Yan, R.; Wang, S. Operation management of green ports and shipping networks: Overview and research opportunities. Front. Eng. Manag. 2019, 6, 152–162. [Google Scholar] [CrossRef]
  2. Sheng, J.; Tang, L. Evolution study on low-carbon behavior of port and shipping enterprises based on shore-to-ship power policy. J. Shanghai Marit. Univ. 2024, 45, 62–69. [Google Scholar]
  3. Arof, A.M.; Zakaria, A.; Rahman, N.S.F.A. Green port indicators: A review. In Advanced Engineering for Processes and Technologies II; Springer: Cham, Switzerland, 2021; pp. 237–256. [Google Scholar]
  4. Misra, A.; Panchabikesan, K.; Gowrishankar, S.K.; Ayyasamy, E.; Ramalingam, V. GHG emission accounting and mitigation strategies to reduce the carbon footprint in conventional port activities—A case of the Port of Chennai. Carbon. Manag. 2016, 8, 45–56. [Google Scholar] [CrossRef]
  5. Davarzani, H.; Fahimnia, B.; Bell, M.; Sarkis, J. Greening ports and maritime logistics: A review. Transp. Res. Part D Transp. Environ. 2016, 48, 473–487. [Google Scholar] [CrossRef]
  6. Monjardino, J.; Dias, L.; Fortes, P.; Tente, H.; Seixas, J. Carbon Neutrality Pathways Effects on Air Pollutant Emissions: The Portuguese Case. Atmosphere 2021, 12, 324. [Google Scholar] [CrossRef]
  7. Cao, L. Research on local governance of urban air pollution from the perspective of evolutionary game. In Proceedings of the Statistics and Information Forum, Bern, Switzerland, 3–6 October 2021; pp. 72–83. [Google Scholar]
  8. Alamoush, A.S.; Ballini, F.; Ler, A.I. Revisiting port sustainability as a foundation for the implementation of the United Nations Sustainable Development Goals (UN SDGs). J. Shipp. Trade 2021, 6, 19. [Google Scholar] [CrossRef]
  9. Ahmadi, N.; Rahardjo, S.; Hasriningtyas, S. The Green Ports Future Knowledge Map and Trend. Coast. Ocean J. (COJ) 2023, 7, 102–116. [Google Scholar] [CrossRef]
  10. Sdoukopoulos, E.; Boile, M.; Tromaras, A.; Anastasiadis, N. Energy Efficiency in European Ports: State-Of-Practice and Insights on the Way Forward. Sustainability 2019, 11, 4952. [Google Scholar] [CrossRef]
  11. Motlagh, H.R.S. Study the Role of Maritime Energy Management in achieving the United Nations Sustainable Development Goals (UNSDGS), in particular, Goal 7, in Oman Maritime Community. Sustain. Mar. Struct. 2020, 2, 1–12. [Google Scholar] [CrossRef]
  12. Song, D.-P. A literature review of seaport decarbonisation: Solution measures and roadmap to net zero. Sustainability 2024, 16, 1620. [Google Scholar] [CrossRef]
  13. Wan, Z.; Zhang, Q.; Xu, Z.; Chen, J.; Wang, Q. Impact of emission control areas on atmospheric pollutant emissions from major ocean-going ships entering the Shanghai Port, China. Mar. Pollut. Bull. 2019, 142, 525–532. [Google Scholar] [CrossRef] [PubMed]
  14. Liu, Y.; Chen, J.; Tian, Y. Emission Characteristics of Atmospheric Pollutants from Ships in Sea Area Around Circum-Bohai Sea Economic Zone. Res. Environ. Sci. 2021, 34, 523–530. [Google Scholar]
  15. Liu, Y.; Li, Y.; Wang, W. Challenges, opportunities and actions for China to achieve the targets of carbon peak and carbon neutrality. China Popul. Resour. Environ. 2021, 31, 1–5. [Google Scholar]
  16. Xiong, S.; Yuan, Y.; Zhang, C. Achievement of carbon peak goals in China’s road transport—Possibilities and pathways. J. Clean. Prod. 2023, 388, 135894. [Google Scholar] [CrossRef]
  17. Hoang, A.T.; Foley, A.M.; Nieti, S.; Huang, Z.; Ong, H.C.; Ler, A.I.; Pham, V.V.; Nguyen, X.P. Energy-related approach for reduction of CO2 emissions: A critical strategy on the port-to-ship pathway. J. Clean. Prod. 2022, 355, 131772. [Google Scholar] [CrossRef]
  18. Yan, X.; Tu, M.; Yang, J.; Xu, H.; Zhang, T. Development Path of World-Class Marine Ports in China. Strateg. Study CAE 2025, 27, 236–247. [Google Scholar]
  19. Wu, G. Hainan Province Green Port Construction Model. Port Sci. Technol. 2020, 7, 20–22. [Google Scholar]
  20. Xu, J.; Yang, Y.; Yang, Z. Opportunities and Challenges in Port Construction within the Green Shipping Framework. Trade Fair Econ. 2024, 34–37. [Google Scholar] [CrossRef]
  21. Giuliano, G.; Linder, A. Impacts of the clean air action plan on the port trade industry. Int. J. Shipp. Transp. Logist. IJSTL 2014, 6, 172–188. [Google Scholar] [CrossRef]
  22. Zhu, B. Tianjin Port: Striving to be the “vanguard” in building a modern Chinese-style port to better serve the joint construction of the “Belt and Road Initiative”. China Ports 2023, 11, 16–19. [Google Scholar]
  23. Zhang, W. National Energy Group green port construction demonstration project research. China Ports 2024, 3, 22–26. [Google Scholar]
  24. Hua, C.; Chen, J.; Wan, Z.; Xu, L.; Bai, Y.; Zheng, T.; Fei, Y. Evaluation and governance of green development practice of port: A sea port case of China—ScienceDirect. J. Clean. Prod. 2020, 249, 119434. [Google Scholar] [CrossRef]
  25. Zhang, S.; Song, Q.; Chen, H. Key Technologies and Challenges on Planning of Port Integrated Energy System ConsideringEnergy Flow-logistics Coupling. Proc. CSEE 2024, 44, 7616–7635. [Google Scholar]
  26. Ostrom, E. Polycentric systems for coping with collective action and global environmental change. Glob. Environ. Change 2010, 20, 550–557. [Google Scholar] [CrossRef]
  27. Gao, W.; Guo, W.; Zhou, S.; Wu, S.; Yang, Z. The evolution of the relationship among stakeholders in port integration: Evidence from tripartite evolutionary game analysis. Ocean. Coast. Manag. 2023, 240, 106628. [Google Scholar] [CrossRef]
  28. Zheng, J.; Zhong, M.; Zhang, W. Strategy selection and simulation of regional port integration based on evolutionary game theory. Navig. China 2023, 46, 80–90. [Google Scholar]
  29. Sun, Z.; Xu, Q.; Liu, J. Dynamic incentive contract of government for port enterprises to reduce emissions in the blockchain era: Considering carbon trading policy. Sustainability 2023, 15, 12148. [Google Scholar] [CrossRef]
  30. Wang, A.H.; Hang, L.; He, Y.; Wang, M. Research on Port Competition and Cooperation under the Policy of Emission Reduction Subsidy and Privatization. J. South China Univ. Technol. (Soc. Sci. Ed.) 2021, 23, 12. [Google Scholar]
  31. Yang, Y.; Li, C.J. Study on Dynamic Development Mechanism and Simulation of Network Freight Transport Based on Tripartite Evolutionary Game. J. Highw. Transp. Res. 2022, 39, 180–190. [Google Scholar]
  32. Kou, P.; Han, Y.; Qi, X. The operational mechanism and effectiveness of China’s central environmental protection inspection: Evidence from air pollution. Socio-Econ. Plan. Sci. 2021, 81, 101215. [Google Scholar] [CrossRef]
  33. Yuan, K.B. Research on Port Emission Reduction Management and Cooperation Stability Under the Perspective of Competition. Ph.D. Thesis, Shanghai Maritime University, Shanghai, China, 2023. [Google Scholar]
  34. Wang, R. Research Hotspots and Evolution Trends of Port Emission Reduction: A Bibliometric Analysis Based on CiteSpace. Sustainability 2025, 17, 1474. [Google Scholar] [CrossRef]
Figure 1. Tripartite evolutionary game model.
Mathematics 13 02025 g001
Figure 2. Tripartite initial evolution trend (probability 0.2).
Mathematics 13 02025 g002
Figure 3. Tripartite initial evolution trend (probability 0.5).
Mathematics 13 02025 g003
Figure 4. Tripartite initial evolution trend (probability 0.8).
Mathematics 13 02025 g004
Figure 5. The impact of C1 change on government strategies.
Mathematics 13 02025 g005
Figure 6. Impact of C1 change on the port enterprise strategy.
Mathematics 13 02025 g006
Figure 7. Impact of C1 change on the public strategy.
Mathematics 13 02025 g007
Figure 8. Impact of M change on government strategies.
Mathematics 13 02025 g008
Figure 9. Impact of M change on the port enterprise strategy.
Mathematics 13 02025 g009
Figure 10. Impact of M change on the public strategy.
Mathematics 13 02025 g010
Figure 11. Impact of the S5 change on government strategy.
Mathematics 13 02025 g011
Figure 12. Impact of S5 change on port enterprise strategy.
Mathematics 13 02025 g012
Figure 13. Impact of S5 change on the public strategy.
Mathematics 13 02025 g013
Table 1. Parameter description in a tripartite evolutionary game.
ParticipantParameterParameter Description and Correlation
GovernmentThe special budget for environmental governance (C1) (http://sthjj.ningbo.gov.cn/art/2024/2/27/art_1229051503_4364171.html (accessed on 16 June 2025))Investment required for government supervision (monitoring equipment, personnel training, etc.).
Incentive policy costs (C2) (http://sthjj.ningbo.gov.cn/art/2024/2/27/art_1229051503_4364171.html (accessed on 16 June 2025))Direct expenditure of the government to implement subsidies and technical support.
Benchmark values of tax losses (R1) (http://tjj.ningbo.gov.cn/art/2025/3/20/art_1229042825_58921061.html (accessed on 16 June 2025))Ningbo City Port Enterprise Annual Tax Benchmark Value.
Tax loss coefficient (a)The portion of tax reductions caused by corporate emissions reduction.
No incentive for policy loss (L)Additional treatment costs are caused by increased pollution when the government is not encouraging them.
Public support degree gain (S1)The social reputation of the government has been improved after successful governance.
EnterprisesEmission reduction input cost (C3) (https://www.ningbo.gov.cn/art/2023/5/10/art_1229095998_1773019.html (accessed on 16 June 2025))Initial investment for enterprises to purchase green technology and equipment upgrades.
Carbon market trading gains (S2)Economic gains from trading on carbon emission rights.
Green financing concessions (K)Low-interest bank loans to low-carbon companies.
Income from government subsidies (S3)Companies receive direct subsidies from government incentive policies.
Gain in market competitiveness (S4)Additional benefits brought by the green brand effect after emission reduction.
Not reduce reputation loss (D)Economic losses caused by the influence of public opinion when not reducing emissions and the supervision of the masses.
Fine amount (M)The fines they face when companies cut emissions.
PublicSupervise the cost (C4)The energy and time cost of the masses to participate in the supervision.
Health and economic value (J)Economic value of improving air quality to reduce respiratory diseases.
Report reward (S5)The government rewards the public for reporting on enterprises’ illegal emissions.
Environmental satisfaction benchmark value (R2)The average satisfaction of people with air quality before governance.
Environmental satisfaction coefficient (b)Air quality improvement: 1 unit of satisfaction improvement.
Table 2. The payoff matrix table of the tripartite games.
The Government’s StrategyEnterprise’s StrategyPublic’s StrategyGovernment’s EarningsEnterprise’s IncomePublic Income
Incentive (x)Emission reduction (y)Supervise (z)−C1 − C2 + S1 + (1 − a) R1−C3 + S2 + K + S3 + S4−C4 + J + S5 + (1 + b)R2
Incentive (x)Emission reduction (y)Non-supervise
(1 − z)
−C1 − S3 + S1 + (1 − a)R1−C3 + S2 + K + S3 + S4J + (1 + b)R2
Incentive (x)Nonemission reduction
(1 − y)
Supervise (z)−C1 − S5 + R1 + M − L−M − D−C4 + S5 + R2
Incentive (x)Nonemission reduction (1 − y)Nonsupervise
(1 − z)
−C1 + R1 + M − L−MR2
Nonincentive
(1 − x)
Emission reduction (y)Supervise (z)(1 − a)R1−C3 + S2 + K + S4−C4 + J + (1 + b)R2
Nonincentive
(1 − x)
Emission reduction (y)Nonsupervised
(1 − z)
(1 − a)R1−C3 + S2 + K + S4J + (1 + b)R2
Nonincentive
(1 − x)
Nonemission reduction (1 − y)Supervise (z)R1 − L−D−C4 + R2
Nonincentive
(1 − x)
Nonemission reduction (1 − y)Nonsupervise
(1 − z)
R1 − L0R2
Table 3. Stability of the equilibrium points.
Equilibrium Points Eigenvalue   λ i SymbolStability
E1(0,0,0) λ 1 = M C 1 ×ESS
λ 2 = K C 3 + S 2 + S 4 ×
λ 3 = C 4
E2(1,0,0) λ 1 = C 1 M ×Unstable
λ 2 = K C 3 + M + S 2 + S 3 + S 4 ×
λ 3 = S 5 C 4 +
E3(0,1,0) λ 1 = S 1 C 1 S 3 ×ESS
λ 2 = C 3 K S 2 S 4 ×
λ 3 = C 4
E4(0,0,1) λ 1 = M C 1 S 5 ×Unstable
λ 2 = D + K C 3 + S 2 + S 4 ×
λ 3 = C 4 +
E5(1,1,0) λ 1 = C 1 S 1 + S 3 ×Unstable
λ 2 = C 3 K M S 2 S 3 S 4 ×
λ 3 = S 5 C 4 +
E6(1,0,1) λ 1 = C 1 M + S 5 ×ESS
λ 2 = D + K C 3 + M + S 2 + S 3 + S 4 ×
λ 3 = C 4 S 5
E7(0,1,1) λ 1 = S 1 C 2 C 1 ×Unstable
λ 2 = C 3 D K S 2 S 4 ×
λ 3 = C 4 +
E8(1,1,1) λ 1 = C 1 + C 2 S 1 ×ESS
λ 2 = C 3 D K M S 2 S 3 S 4 ×
λ 3 = C 4 S 5
Note: × indicates uncertainty in the sign of the eigenvalue. “+”means the eigenvalue greater than 0; “−”means the eigenvalue less than 0.
Table 4. Initial values of the parameters.
ParametersC1C2R1aLS1C3S2K
Values1.50.81200.0632.561.50.75
ParametersS3S4DMC4JS5R2b
Values0.30.80.33121.528.20.5
Disclaimer/Publisher’s Note: The statements, opinions and data contained in all publications are solely those of the individual author(s) and contributor(s) and not of MDPI and/or the editor(s). MDPI and/or the editor(s) disclaim responsibility for any injury to people or property resulting from any ideas, methods, instructions or products referred to in the content.

