Article

Size–Frequency Distribution Characteristic of Fatalities Due to Workplace Accidents and Industry Dependency

School of Resources and Safety Engineering, Central South University, Changsha 410083, China
*
Author to whom correspondence should be addressed.
Mathematics 2025, 13(12), 2021; https://doi.org/10.3390/math13122021
Submission received: 17 April 2025 / Revised: 13 June 2025 / Accepted: 16 June 2025 / Published: 19 June 2025

Abstract

The exploration of the statistical characteristics and distribution patterns of workplace accidents can help to reveal the intrinsic features and general laws of safety issues, which is essential for forecasting and decision making in safe production. Here, we conduct the detailed analysis of the distribution characteristics between the fatality number and the frequency of workplace accidents based on the in-depth data mining of various industries. The results show that the distribution between the fatality number and the frequency of workplace accidents follows a power-law distribution. Moreover, the exponents of such power-law distributions in different industries exhibit significant industry dependence, with the characteristic values of the power-law exponents in the coal mining industry, the hazardous chemicals industry, the transportation industry, and the construction industry being 1.55, 2.16, 2.15, and 2.92, respectively. Meanwhile, the temporal variation in the power-law distribution exponent in each industry can be used for the short-term prediction and evaluation of safe production, which will inform the decision making of the safety management department. Last, but not the least, the results of this study provide the theoretical basis for Heinrich’s Law and confirm that a substantial reduction in the number of small-scale accidents can effectively help control the frequency of large-scale fatal accidents.

1. Introduction

1.1. Power-Law Distribution and the Self-Organized Criticality

The power-law distribution phenomenon is a widely observed natural occurrence in diverse fields, such as physics [1], earth and planetary sciences [2], computer science, art [3], biology and ecology [4], demographics and social sciences [5], economics, and finance [6], taking many different forms. Over recent millennia, several types of empirical phenomena in nature, such as catastrophic events [7], natural things with geometric fractal characteristics, heart rate rises and falls, DNA sequences [8], cell membrane potentials, musical melodies, changes in the flow of the Nile, and changes in highway traffic, have been observed and understood to satisfy certain power-laws. In terms of seismic phenomena, large earthquakes are uncommon, while small ones occur from time to time. The distinct similarity found among these phenomena is that they all have a distribution of a statistical quantity that is a straight line on a double-logarithmic plot, which means that it satisfies the “power-law”.
Some scholars have proposed many ideas and theories to explain the mechanisms behind the formation of power-law distributions, including the equilibrium system theory [9], the dissipative structure theory [10], synergetics [11], the chaos theory [12] and Zipf’s law [13]. However, none of these have provided a satisfactory answer. In 1987, Bak and Tang [14] introduced the concept of self-organized criticality (SOC), offering a pioneering theory to explain and explore these complex phenomena.
So-called SOC means that when a system reaches an equilibrium state, the intensity of energy dissipation or size distribution conforms to the power-law relationship. It states that many complex systems naturally evolve toward a critical state, in which small events cause chain reactions that can affect any number of group elements in the system. The results show that systems with SOC properties satisfy the following power-law relationship between their size and distribution function in a critical state:
D V = K V α
In Equation (1), D(V) represents the distribution function of a specific event at a given size, denoted as V. The negative sign indicates that the frequency of events corresponding to larger values decreases as V increases. By taking the logarithm of this equation, the characteristic linear relationship in the double-logarithmic coordinate system is obtained as Equation (2):
l o g D V = l o g K α l o g V
SOC can be used to explain the complex mechanisms inherent in nature, which is mathematically represented as a power-law distribution relationship between the size and frequency of things occurring. A typical example is seismic activity, where smaller-size seismic activities occur frequently, while the larger-size seismic activities are uncommon. In 1954, Gutenberg & Richter [15] first proposed to use the empirical equation of magnitude–frequency (abbreviated as the G-R relationship) to describe the distribution relationship between large-size earthquakes and small-size earthquakes. The number of earthquakes with a magnitude greater than M satisfies the following relationship:
l o g 10 N = a b M
Equation (3) indicates the energy or seismic moment of earthquakes follows a power-law distribution, where N denotes the number of earthquakes with a magnitude greater than M, which is a logarithmic measure of the radiation energy or seismic moment of the source; a and b are constants, where b describes the scale of earthquake size distribution and serves as an important indicator for seismic hazard evaluation.

1.2. Statistical Analysis of Workplace Accidents in Industries

Accidents are considered discrete occurrences with variable frequency and are hard to predict due to uncertain contributing factors [16]. The scientific statistical analysis of workplace accidents can accurately describe the current safe production situation of a country, industry, or enterprise and help us to better control the safety risk and prevent and reduce the occurrence of accidents, ultimately elevating the overall safety level. The statistical analysis of accidents typically employs various statistical methods, such as descriptive statistics, correlation coefficient analysis, the analysis of variance, and regression analysis.
In recent years, numerous researchers both domestically and internationally have conducted statistical analyses of extensive accident datasets, aiming to uncover the macro-level patterns, influencing factors, and distribution characteristics of workplace accidents, or to develop accident prediction models for guiding workplace safety practices. For example, Soodeh Shahsavari et al. [17] employed bivariate regression analysis to study casualties in Iranian road traffic accidents, identifying the key factors affecting the mortality rates and the injury counts in such accidents. Kwang-Kyun Lim [18] conducted the predictive analysis of railway accidents in South Korea using zero-truncated negative binomial regression and artificial neural network models. Wang et al. [19] proposed an autoregressive integrated moving average model with explanatory variables to accurately predict maritime accidents and developed a multi-factor accident prediction framework. These studies are of great significance for safety management in various industries. However, most of these works focus on the relationship between accident frequency or severity and different causal factors, while research on the relationship between accident severity and occurrence frequency is scarce.
In the long process of understanding workplace accidents, statistical analysis has led to the realization that accidents with fewer fatalities and injuries are more numerous, while accidents with more fatalities and injuries occur less frequently. By counting industrial production accidents, in 1941, Heinrich proposed the accident pyramid, i.e., “when an enterprise has 300 violations, there is a high probability of 29 minor injuries and 1 casualty” [20].
However, its scientific validity has been questioned. On the one hand, researchers cannot access Heinrich’s original data, making it impossible to “verify or categorically refute” the specific ratios within the pyramid [21]. On the other hand, the view that “reducing the frequency of less severe events equates to reducing serious injuries” is misleading, potentially causing resources to be concentrated on treating frequent and minor injuries, while ignoring the opportunities to mitigate more severe harm [22]. Additionally, both the validity and scope of the application of Heinrich’s theorem remain questionable [23,24]. Therefore, there is a need for further research into the statistical analysis of workplace accidents, especially the distribution of accident fatalities.
In response to the characteristics of accident data distribution, with a high frequency of minor workplace accidents and a low frequency of major accidents, several researchers have associated power-law distribution. The U.S. Bureau of Labor Statistics quantified accident severity as the number of days of work lost due to nonfatal injuries and explored the power-law relationship between the number of accidents and their severity. They found that power-law distributions were consistent across all the 28 labor categories analyzed and differed only in the slopes and intercepts of the characteristic straight lines in the double-logarithmic coordinate system, strongly suggesting that workplace accidents are governed by SOC [25]. Lopes et al. [26] demonstrated that the statistical distribution of fatalities caused by industrial accidents follows power-law behavior. Additionally, many researchers have concentrated on the power-law distribution characteristics within specific industries or for specific types of accident. For fire accidents, a study shows that fires with many causes exhibit a power-law distribution of frequency and magnitude, regardless of whether the size of the fire is expressed in terms of fatalities, direct losses, or the area burned [27]. As for maritime accidents, a study conducted by Sui et al. [28] demonstrated that the maritime accident time series network is characterized by power-law characteristics at both the macro- and micro levels. In the case of coal mining accidents, Doss et al. [29] found that workplace accidents in the mining industry exhibit SOC and that accident rates associated with employees’ mining experience conform to a power-law distribution. Another researcher [30] has also explored the power-law distribution relationship of the magnitude–frequency of rockfall events and blocks. These studies introduce power-law distribution into the field of workplace accidents and offer reference recommendations for the prevention of accidents and reduction in the number of accidents through this distribution law of accident data. However, the existing studies have not delved into the mechanism behind the power-law distribution of workplace accident data, nor have they compared the consistency of the power-law distribution exponents of accident data across different industries. If such consistency exists, what is its cause? If not, what determines the power-law distribution exponent?
This paper conducts comprehensive data mining and analysis of workplace accidents in typical accident-prone industries to explore the characteristics of the size–frequency distribution of fatalities. It verifies that the number of fatalities and their occurrence frequencies in the workplace accident data adhere to a power-law distribution. Based on the changes in the power-law exponents over a decade for each industry, this study confirms that these exponents exhibit industry dependency. Additionally, by leveraging the characteristics of power-law distributions, the trends in power-law exponent variations, and the resulting statistical insights, this research provides meaningful guidance for enhancing workplace safety practices and safety management strategies.

2. Data Statistics and Analytical Processing

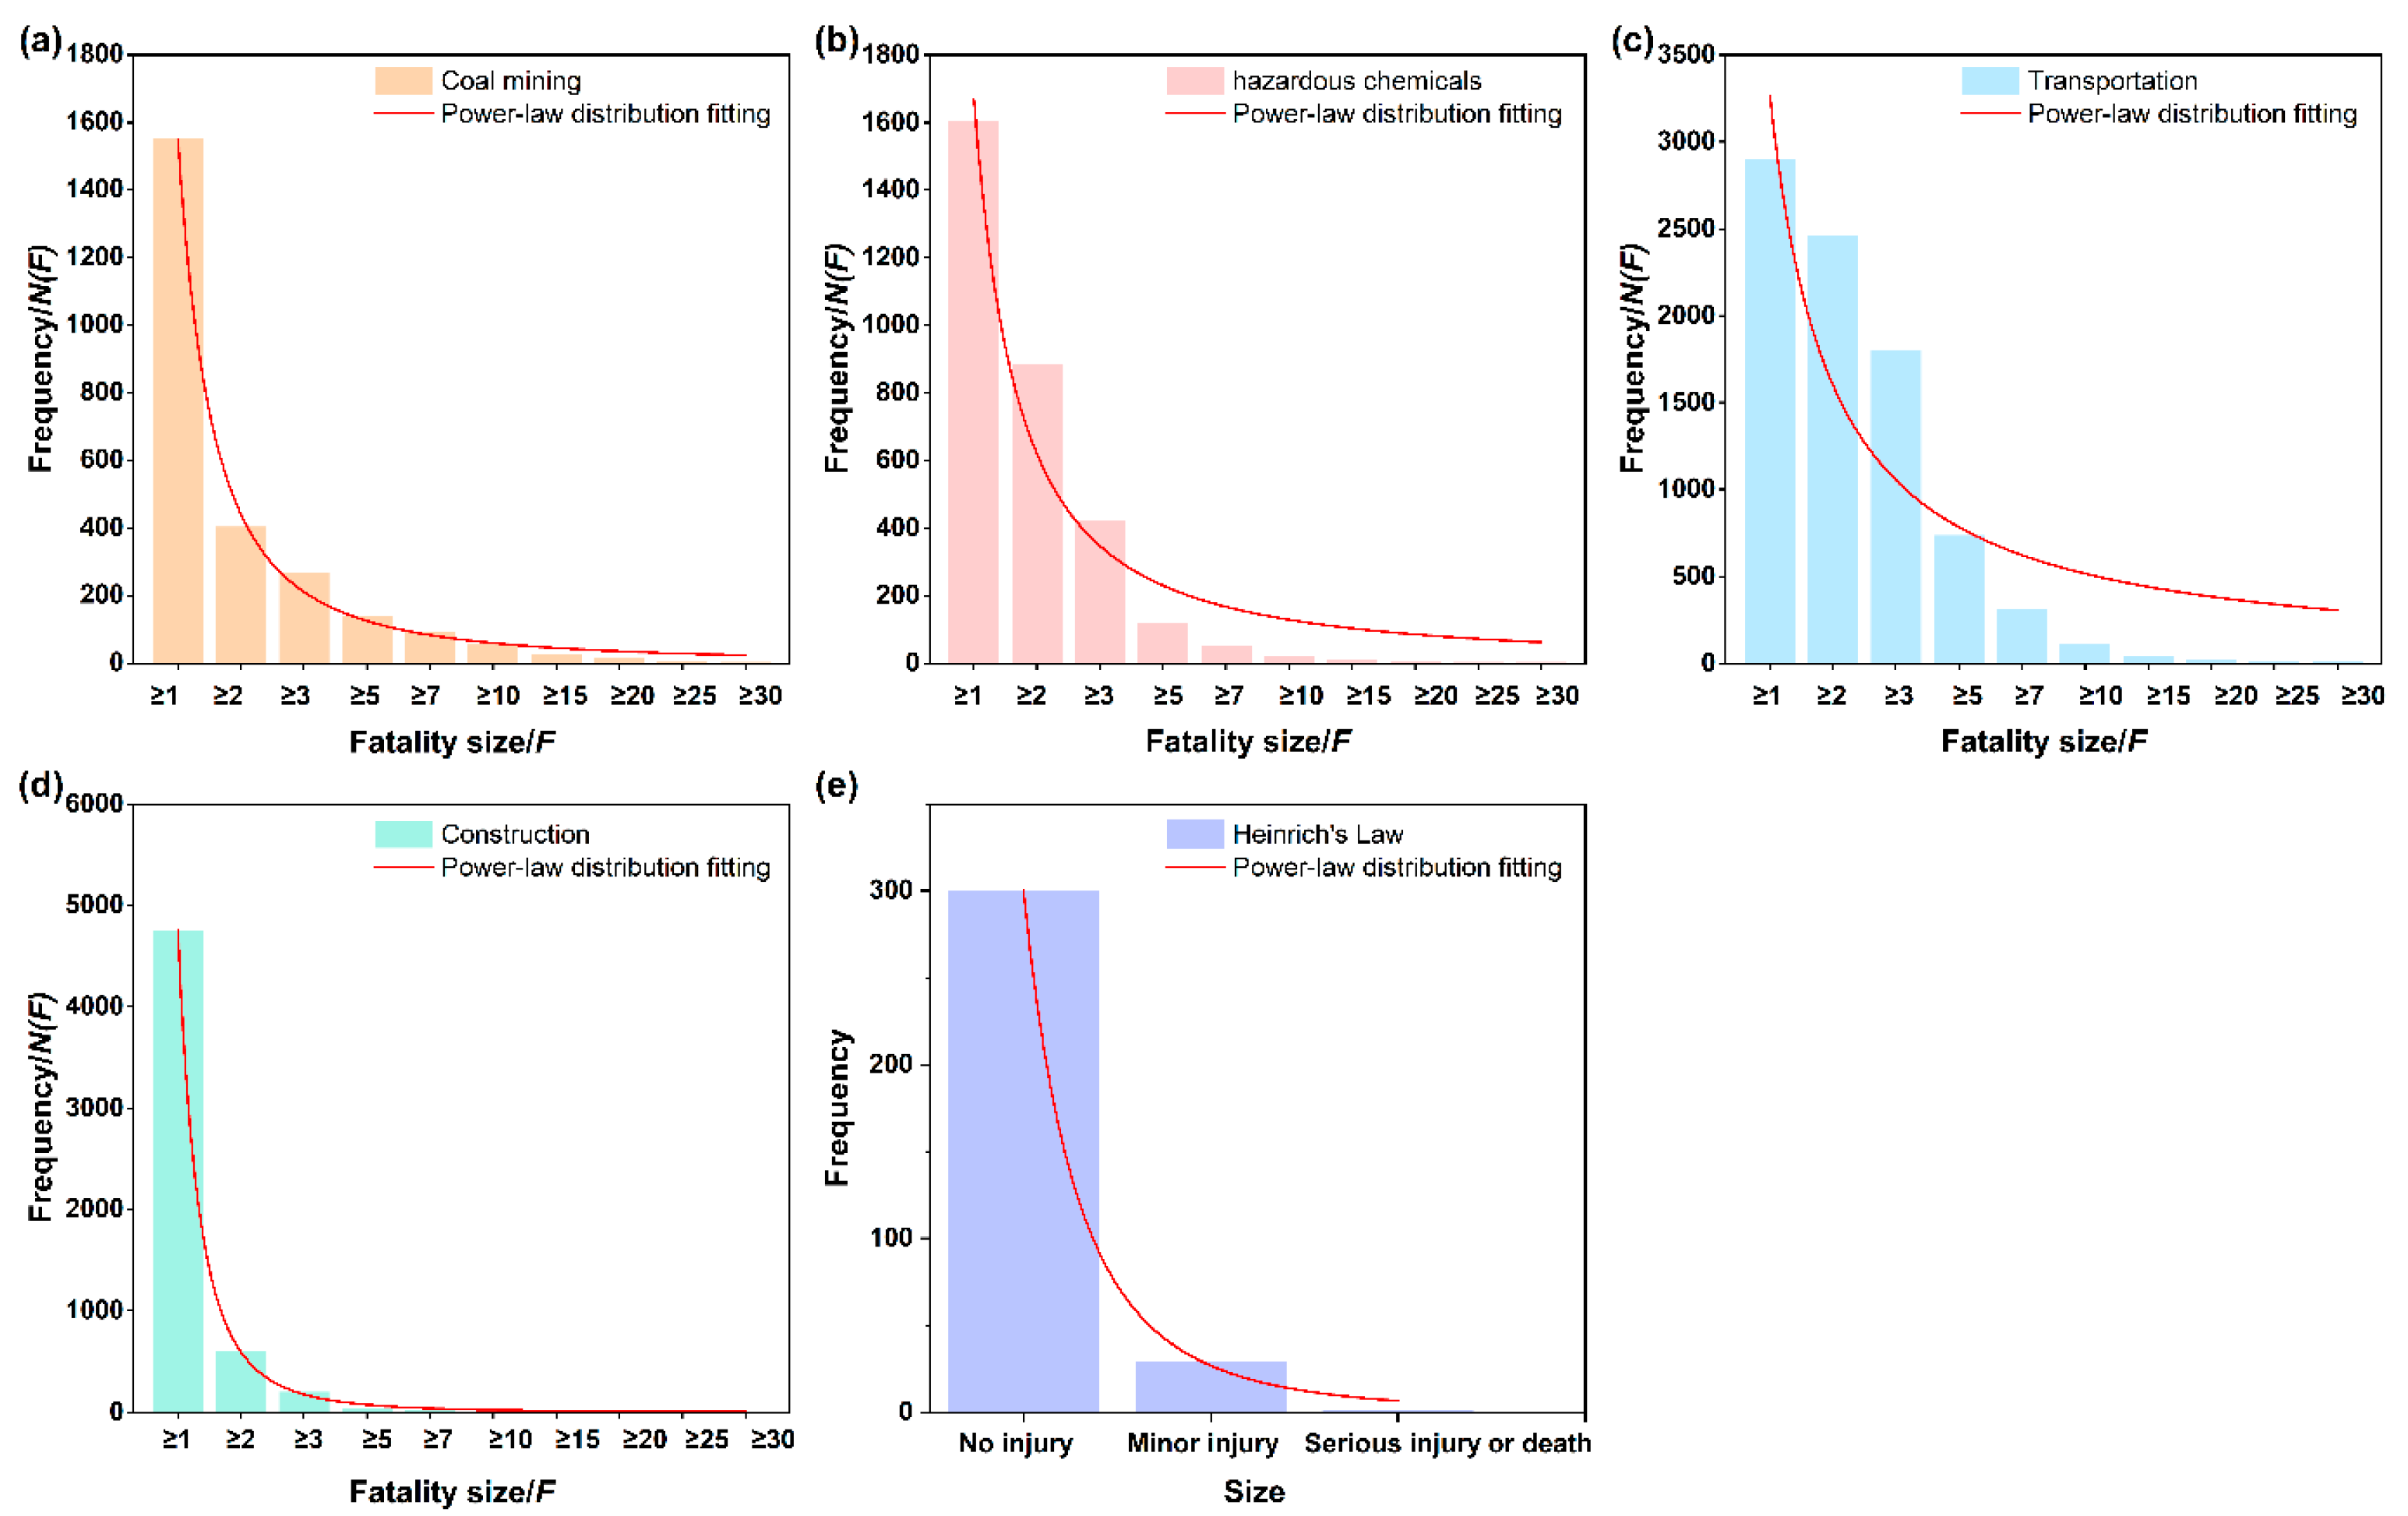
2.1. Statistics of Accident Data

By conducting extensive information review and in-depth data mining, we collected workplace accident data from the last decade in the coal mining, hazardous chemicals, transportation, and construction industries from various sources in China, including the Coal Mine Safety Production website, the Hazardous Chemicals-related Accident Information website, the Safety Management website, and the official website of the Ministry of Housing and Urban-Rural Development. We denote the fatality number as F and counted the frequency of accidents with fatalities greater than size F to be N(F). The fatality number and the corresponding frequency of occurrence were counted for each industry, as shown in Table 1, Table 2, Table 3 and Table 4.

2.2. Testing the Power-Law Hypothesis

Histograms of the fatalities and the frequency of workplace accidents for the coal mining, hazardous chemicals, transportation, and construction industries are shown in Figure 1. Each histogram is fitted with a power-law distribution to assess its initial conformity to the model. It is evident that the accident data for the coal mining and construction industries closely follow a power-law distribution, while the data for hazardous chemical-related and transportation accidents show significant deviations. Therefore, further verification is required to determine whether the power-law distribution between fatalities and accident frequency applies only to specific industries or is a general characteristic of workplace accident distributions across all sectors. Based on the definitions and characteristics of each distribution, we evaluate the fit of the workplace accident data to four potential distributions: power-law, exponential, stretched exponential, and log-normal. The expressions for the four distributions [31], along with their corresponding expressions after logarithmic transformation, are shown in Table 5. The corresponding distributions of the processed data are shown in Figure 2.
If the number of fatalities caused by workplace accidents and corresponding occurrence frequency follow a power-law distribution, there should be a linear relationship between lnN(F) and lnF. In the case of an exponential distribution, a linear relationship should exist between lnN(F) and F. For a stretched exponential distribution, the relationships between lnN(F) and lnF as well as lnN(F) and F are both nonlinear. Similarly, for a log-normal distribution, the relationship between lnN(F) and lnF is nonlinear.
From Figure 2, it is evident that lnN(F) and lnF exhibit characteristics of a linear distribution, while lnN(F) and F display a nonlinear relationship. Therefore, the relationship between the number of fatalities and the frequency of accidents aligns more closely with a power-law distribution.
Additionally, it is worth noting in Figure 2 that, in the double-logarithmic coordinate system, both the coal mining industry and the construction industry exhibit a linear relationship starting from the first data point. In contrast, the hazardous chemical industry and the transportation industry begin to exhibit a linear relationship from the second and third data points, respectively. This observation aligns with the xmin reported in the literature for power-law distributions [31]. In practice, few empirical phenomena strictly follow a power-law distribution across all values of x. More often, the power-law applies only to values exceeding a specific minimum threshold, xmin. On the other hand, this also relates to the completeness of the collected data [32]. For instance, in the hazardous chemical industry, small-scale accidents may go unreported or underreported due to insufficient social attention. Similarly, traffic accidents, especially minor ones, occur frequently and in large numbers, making it challenging for reporting platforms to capture comprehensive data on all accidents. These limitations can result in incomplete statistics for small-scale accidents with fewer fatalities, leading to deviations from the expected linear relationship in the double-logarithmic plots for the data below xmin. Therefore, the datasets used for subsequent refined fitting start from xmin.

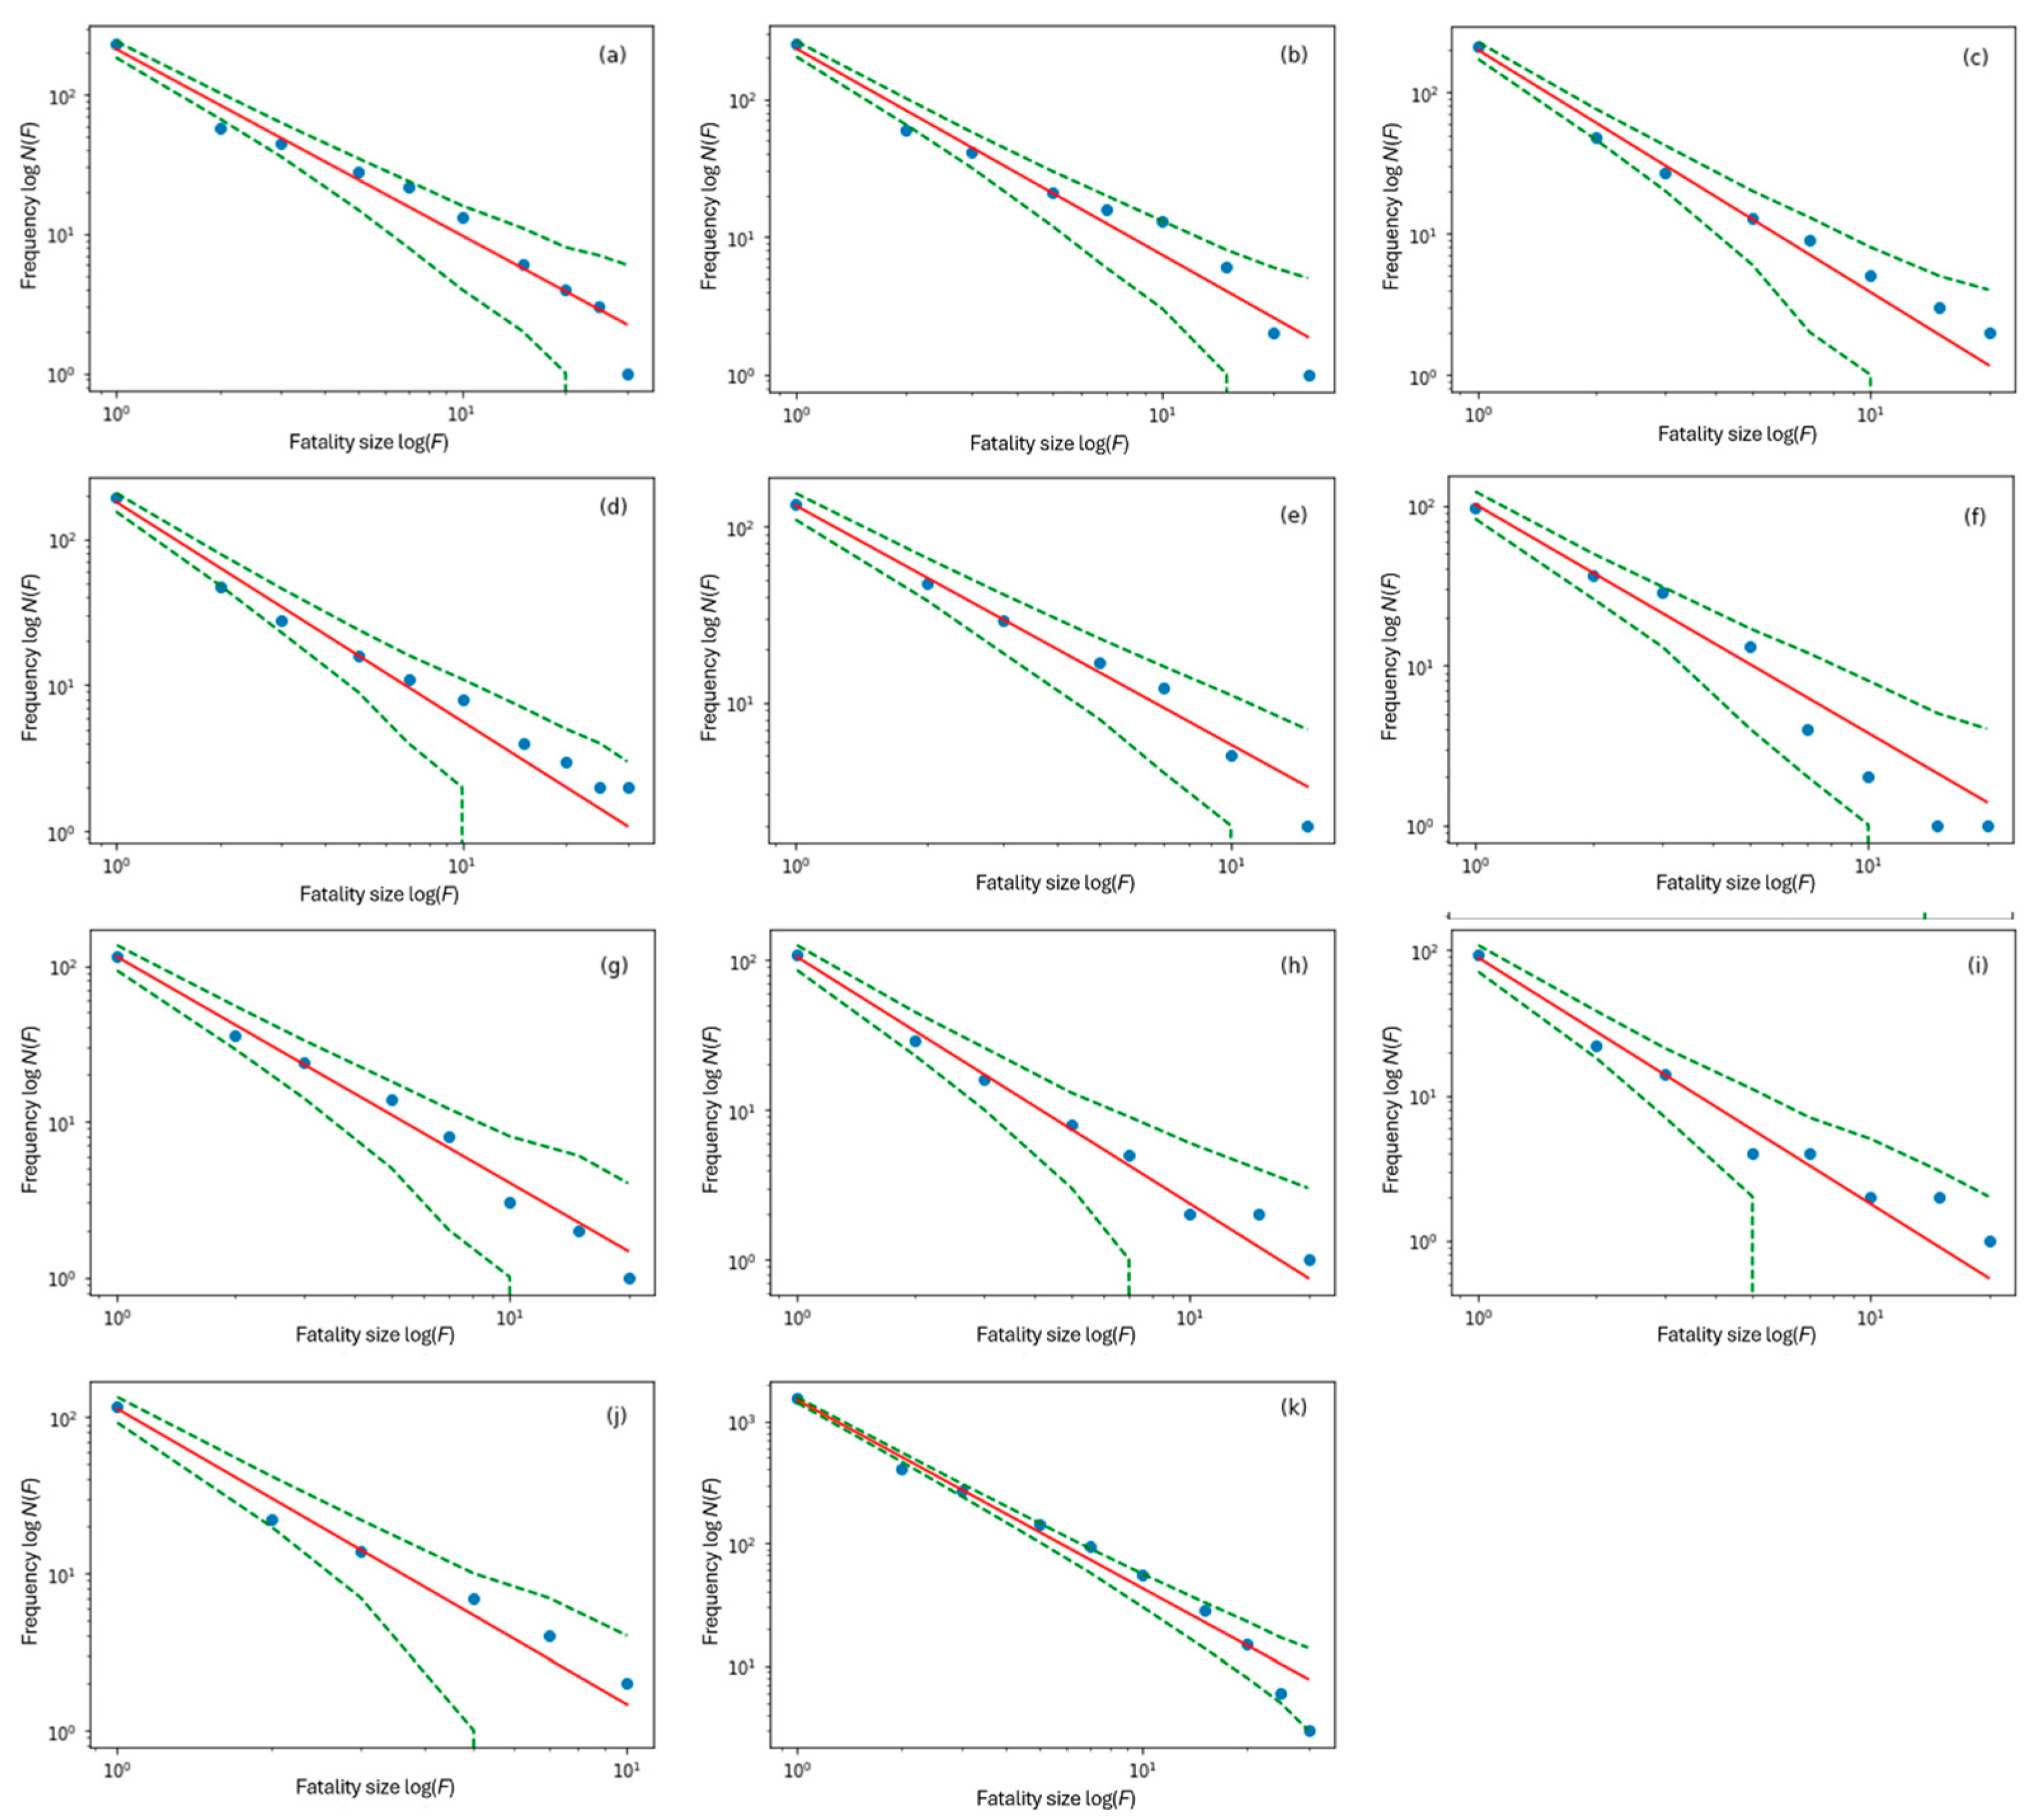
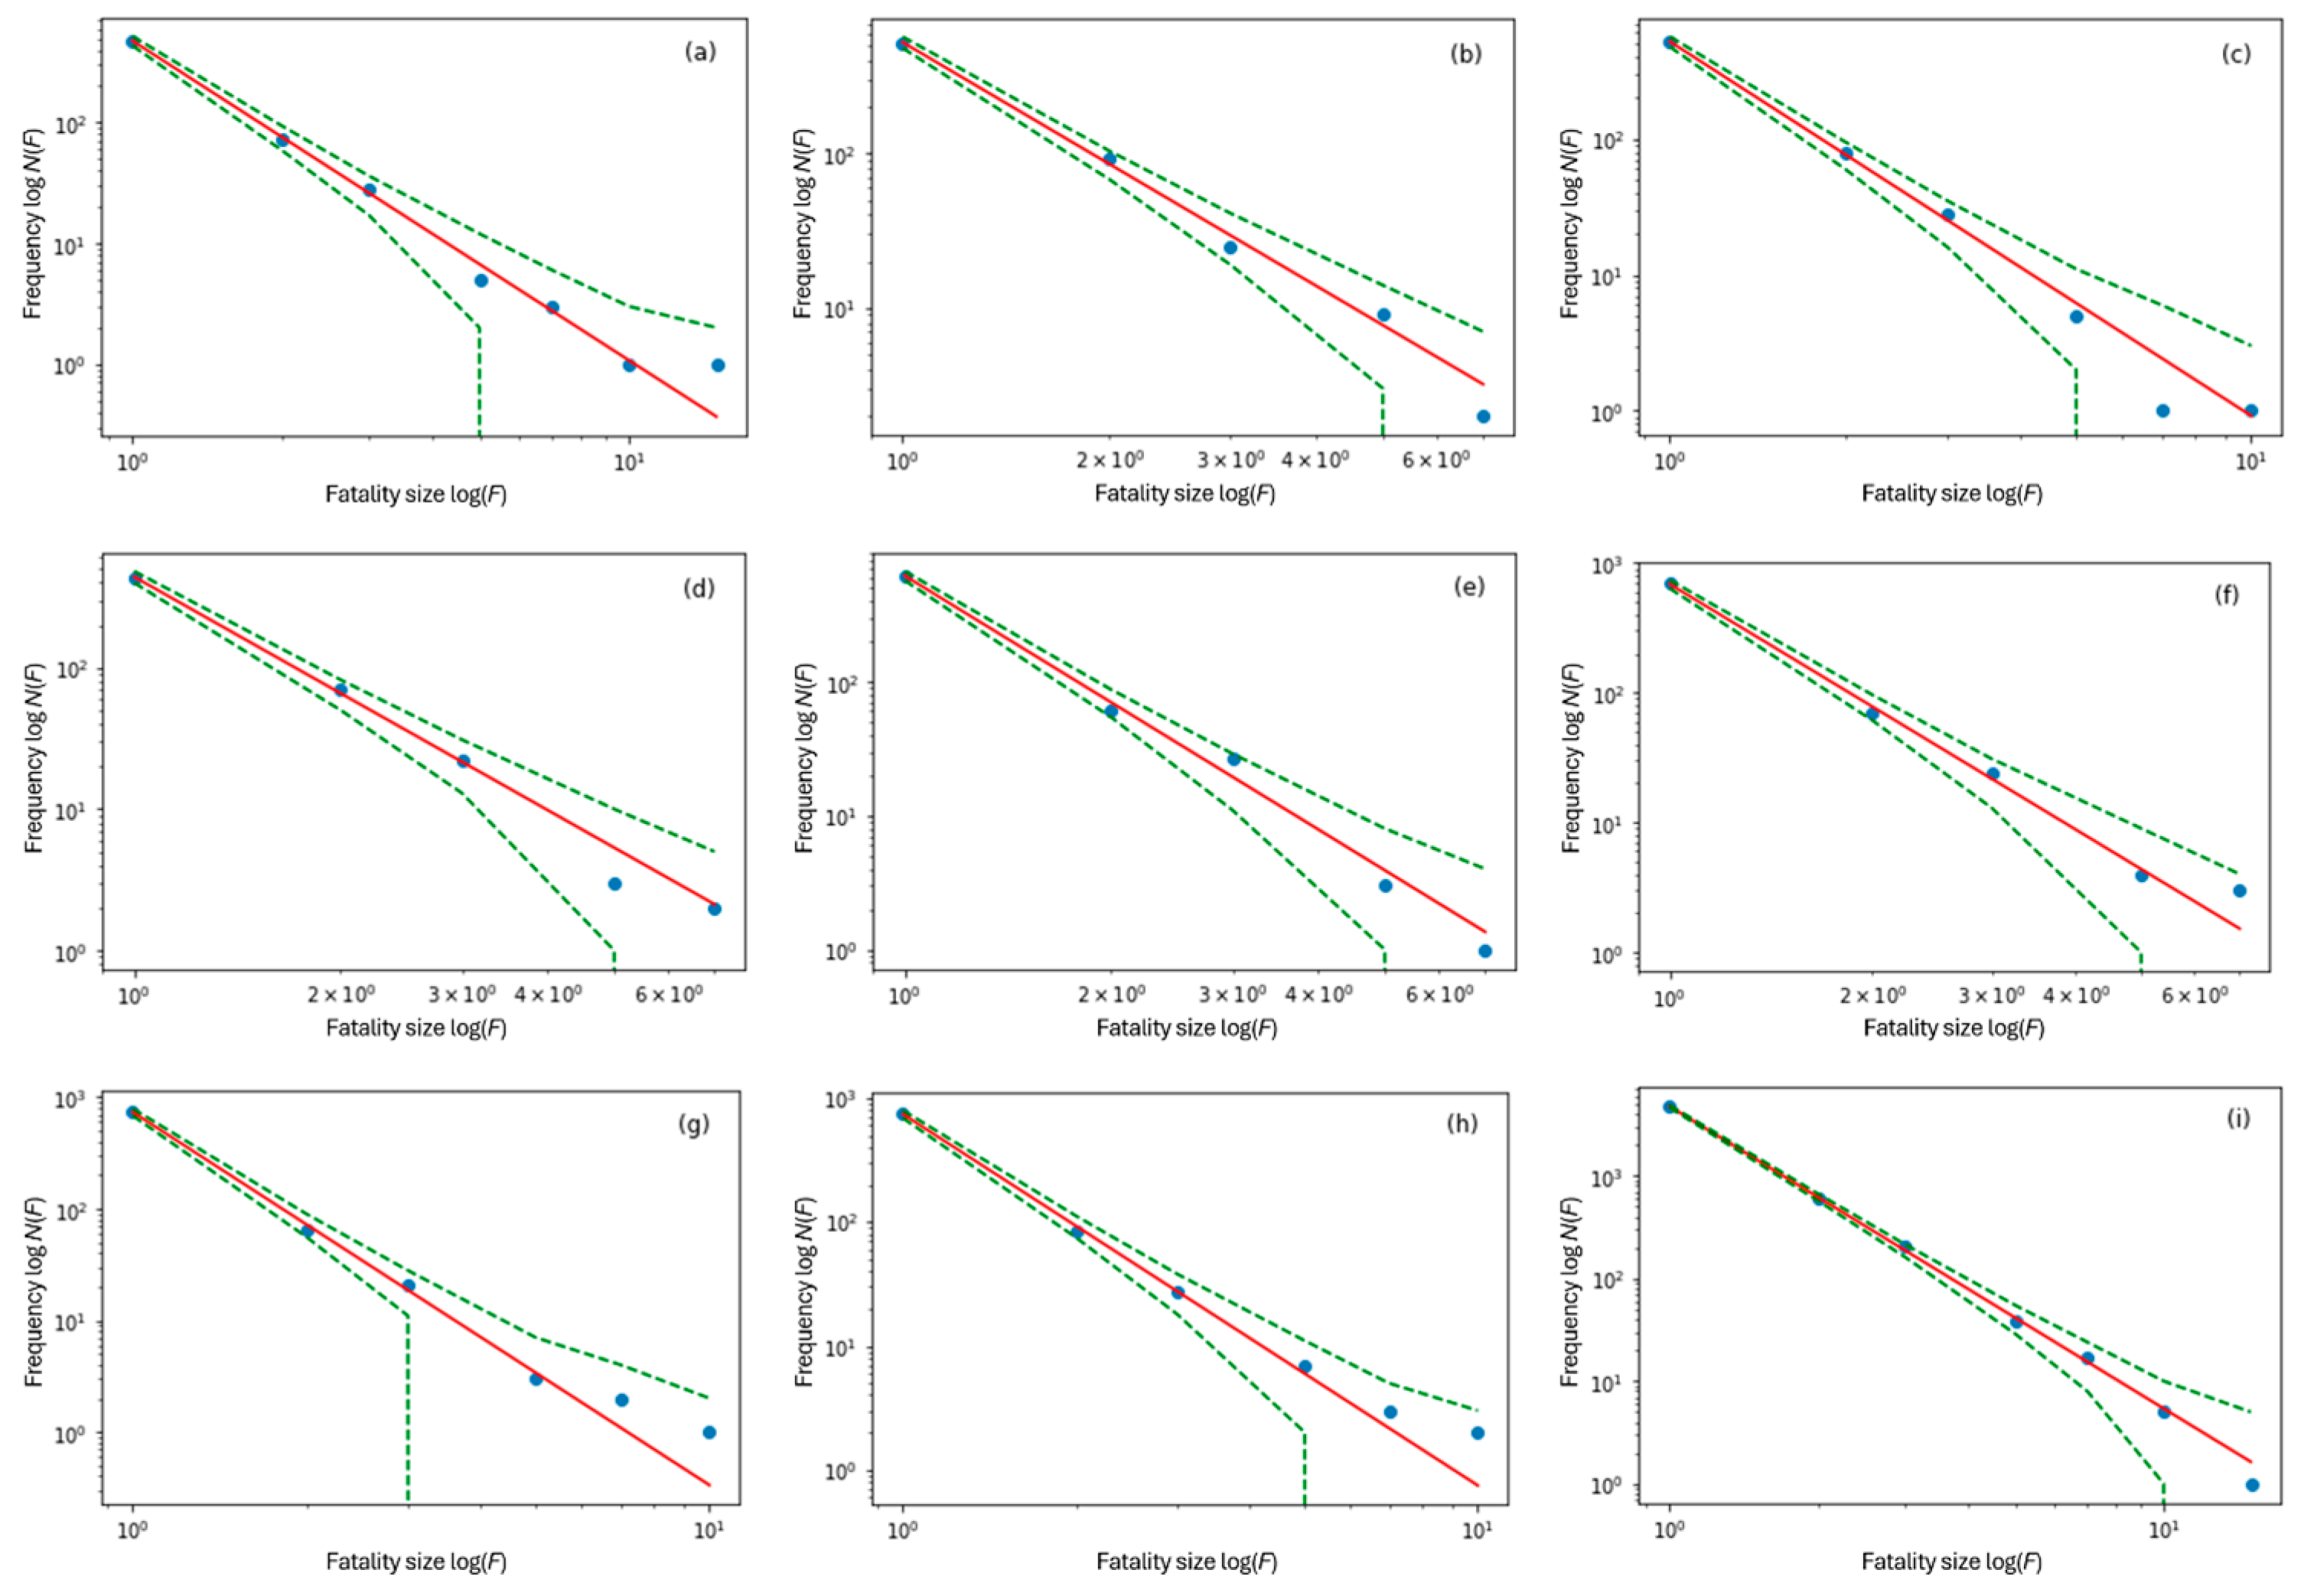
2.3. Methodology and Results of Data Fitting

The distribution of the number of fatalities from workplace accidents in different industries obeys a power-law distribution. Therefore, a characteristic straight line can be obtained in the double-logarithmic coordinate system, and the slope of this characteristic straight line, i.e., the exponent of the power-law distribution, can be obtained by fitting, and then the characteristics of the occurrence of workplace accidents in different industries can be analyzed. The power-law distribution relationship that the size–frequency of fatalities obeys is defined as follows:
N F = c F e
The linear characteristic relationship in the double-logarithmic coordinate system is given as follows:
l o g N F = C e l o g F
Here, c and C are constants, the parameter e is a power-law exponent that describes the fatality distribution scale; a larger e indicates a higher proportion of accidents with some fatalities, while a smaller e shows a higher proportion of accidents with many fatalities. A negative sign demonstrates that the accident frequency N(F) decreases as the number of fatalities F increases.
As frequencies based on the count data of power-law distribution have Poisson sampling uncertainties, a linear regression method that assumes Poisson errors should be employed for such fitting [33,34,35,36]. In this study, we employ a Generalized Linear Model (GLM) for data fitting and specify the Poisson distribution as the error distribution model to be fitted. xmin for fitting is selected based on the criterion of reflecting data patterns and achieving the highest goodness of fit. For the hazardous chemicals industry and the transportation industry, fitting starting from the second and third data points, respectively, yielding a better goodness of fit. The code used for fitting is provided in the Supplementary Materials. The fitting effects of each industry based on different xmin are shown in Tables S1–S4. The fitting results are shown in Figure 3, Figure 4, Figure 5 and Figure 6 for the various industries.
It can be seen from Figure 3, Figure 4, Figure 5 and Figure 6 that the size–frequency distribution of fatalities from the dataset for each year and the cumulative total over the years counted for the different industries are well distributed on both sides of the characteristic straight line fitted using the double-logarithmic coordinate system. In addition, the 95% confidence interval becomes narrower as the frequency of accidents increases, but it widens sharply with fewer accidents with many fatalities and larger residuals and standard deviations. The GLM truly reflects fluctuations in the distribution of the accident data, reflecting Poisson sampling uncertainty in the frequency of power-law-distributed count data. It is further verified that the size–frequency distributions of fatalities in four typical accident-prone industries obey the power-law distribution.
The power-law exponents (e) for each industry for each year fitted by the GLM are shown in Table 6, Table 7, Table 8 and Table 9. There is a significant difference in e for each industry, and it is speculated that the power-law distributions of accidents in the different industries have different distributional characteristics; we will further explore the industry dependency of e in Section 2.3.

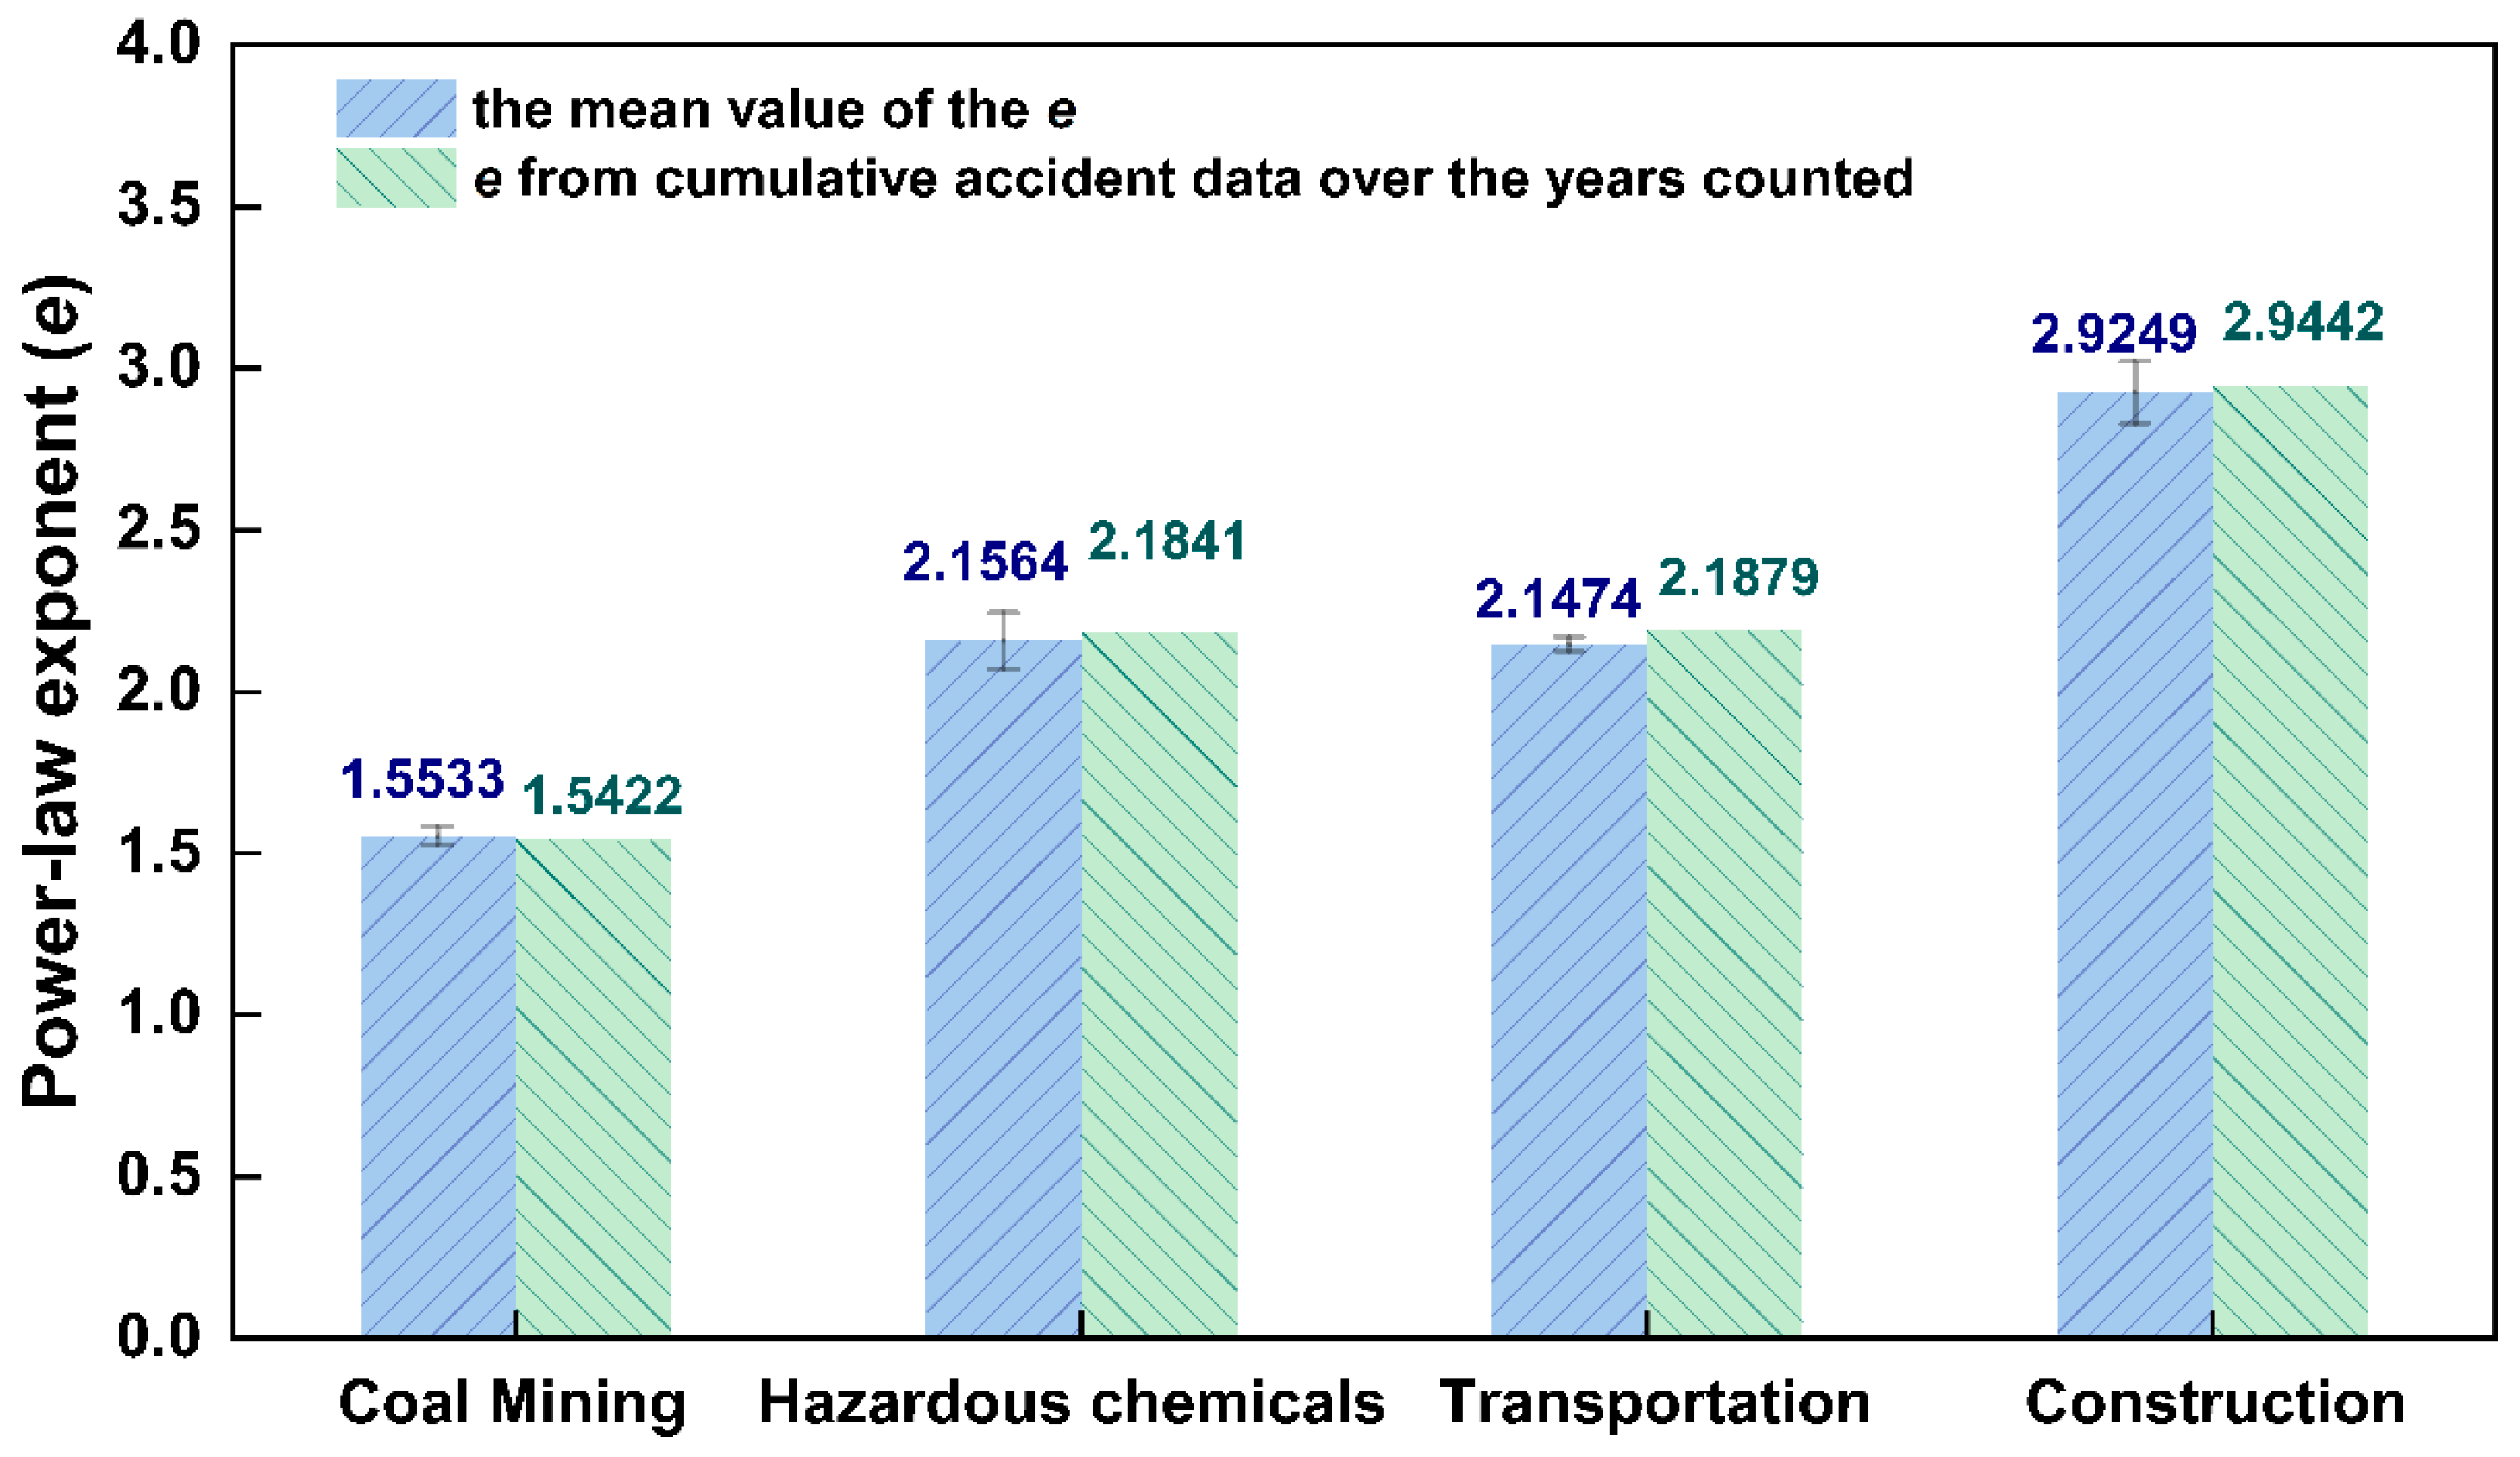
2.4. Industry Dependency of the Power-Law Distribution of Workplace Accidents

As can be seen from Table 6, Table 7, Table 8 and Table 9, over the last decade, the power-law exponent (e) has exhibited a fluctuation range from 1.3 to 1.9 in coal mining accidents, from 1.7 to 2.7 in hazardous chemical-related accidents, from 1.9 to 2.4 in transportation accidents, and from 2.6 to 3.4 in construction accidents. There are differences in e for the various industries. Furthermore, it is evident from Figure 7 that the e of size–frequency distribution of fatalities exhibits clear industry dependence. e of coal mining accidents is relatively low, while e of hazardous chemical-related accidents and traffic accidents are comparable, and e for construction accidents is much higher.
The industry dependency of e can be explained in relation to the characteristics of workplace accidents and the current safety status of the various industries in China. For the coal mining industry, the annual number of accidents is significantly lower compared to traffic and construction accidents. Additionally, gas explosions occur frequently in coal mining, primarily leading to severe and catastrophic injuries [37]. Consequently, the coal mining industry experiences a higher proportion of large-scale fatal accidents, resulting in a lower slope of the characteristic straight line in the double-logarithmic coordinate system of fatality number versus occurrence frequency. Correspondingly, the power-law exponent e is also lower.
Construction accidents are frequent and mostly involve falls or being struck by objects, typically resulting in a single fatality. In contrast, collapses that cause multiple fatalities are rare [38]. As a result, the number of small-scale fatal accidents in the construction industry significantly outweighs that of large-scale fatal accidents. This leads to a steeper slope in the double-logarithmic coordinate system of fatality number versus occurrence frequency, and consequently a much higher power-law exponent e.
In the hazardous chemicals industry, accidents involving poisoning, asphyxiation, and chemical burns are common, typically leading to small-scale accidents with fewer than three fatalities. However, accidents such as fires and explosions that result in multiple fatalities are also relatively frequent [39,40]. Consequently, the power-law exponent e for the hazardous chemicals industry is higher than that of the coal mining industry, but lower than that of the construction industry.
As for the transportation industry, there are numerous traffic accidents each year, with a higher frequency of small-scale fatal accidents. Additionally, multi-vehicle collisions are also common, and since the number of passengers in a single vehicle is often more than one, accidents tend to result in multiple fatalities. As a result, accidents with three or more fatalities occur much more frequently in transportation compared to the other industries. Furthermore, although accidents involving buses and freight vehicles on public roads are less common, when they do occur, they often involve a large number of casualties, leading to a certain number of accidents with many fatalities in the transportation industry. Therefore, similar to the hazardous chemicals industry, the power-law exponent e in the transportation industry is higher than that of the coal mining industry, but lower than that of the construction industry.
Notably, hazardous chemical-related accidents and traffic accidents exhibit comparable power-law exponents, which may be attributed to certain similar characteristics of accidents in the two industries. From the perspective of accident scale, both the industries are prone to small-scale accidents. In the hazardous chemicals industry, these typically involve leaks, chemical burns, or minor fires, all resulting in fewer than three fatalities. In the traffic accident domain, common accidents often stem from speeding, drunk driving, and fatigue-related errors, occurring with notable regularity. A more critical shared trait is their susceptibility to chain reactions that escalate accident severity. For instance, an uncontrolled chemical leak can rapidly evolve into an explosion or toxic gas dispersion into residential areas or water supplies, causing catastrophic casualties and environmental damage. Similarly, a simple vehicle sideswipe may trigger multi-car pileups, potentially escalating into fiery explosions with cascading consequences. Thus, although there is a significant disparity in the total number of accidents between the two industries, their similar accident characteristics result in a comparable proportion of large-scale-to-small-scale accidents, which explains why their power-law exponents are equivalent.

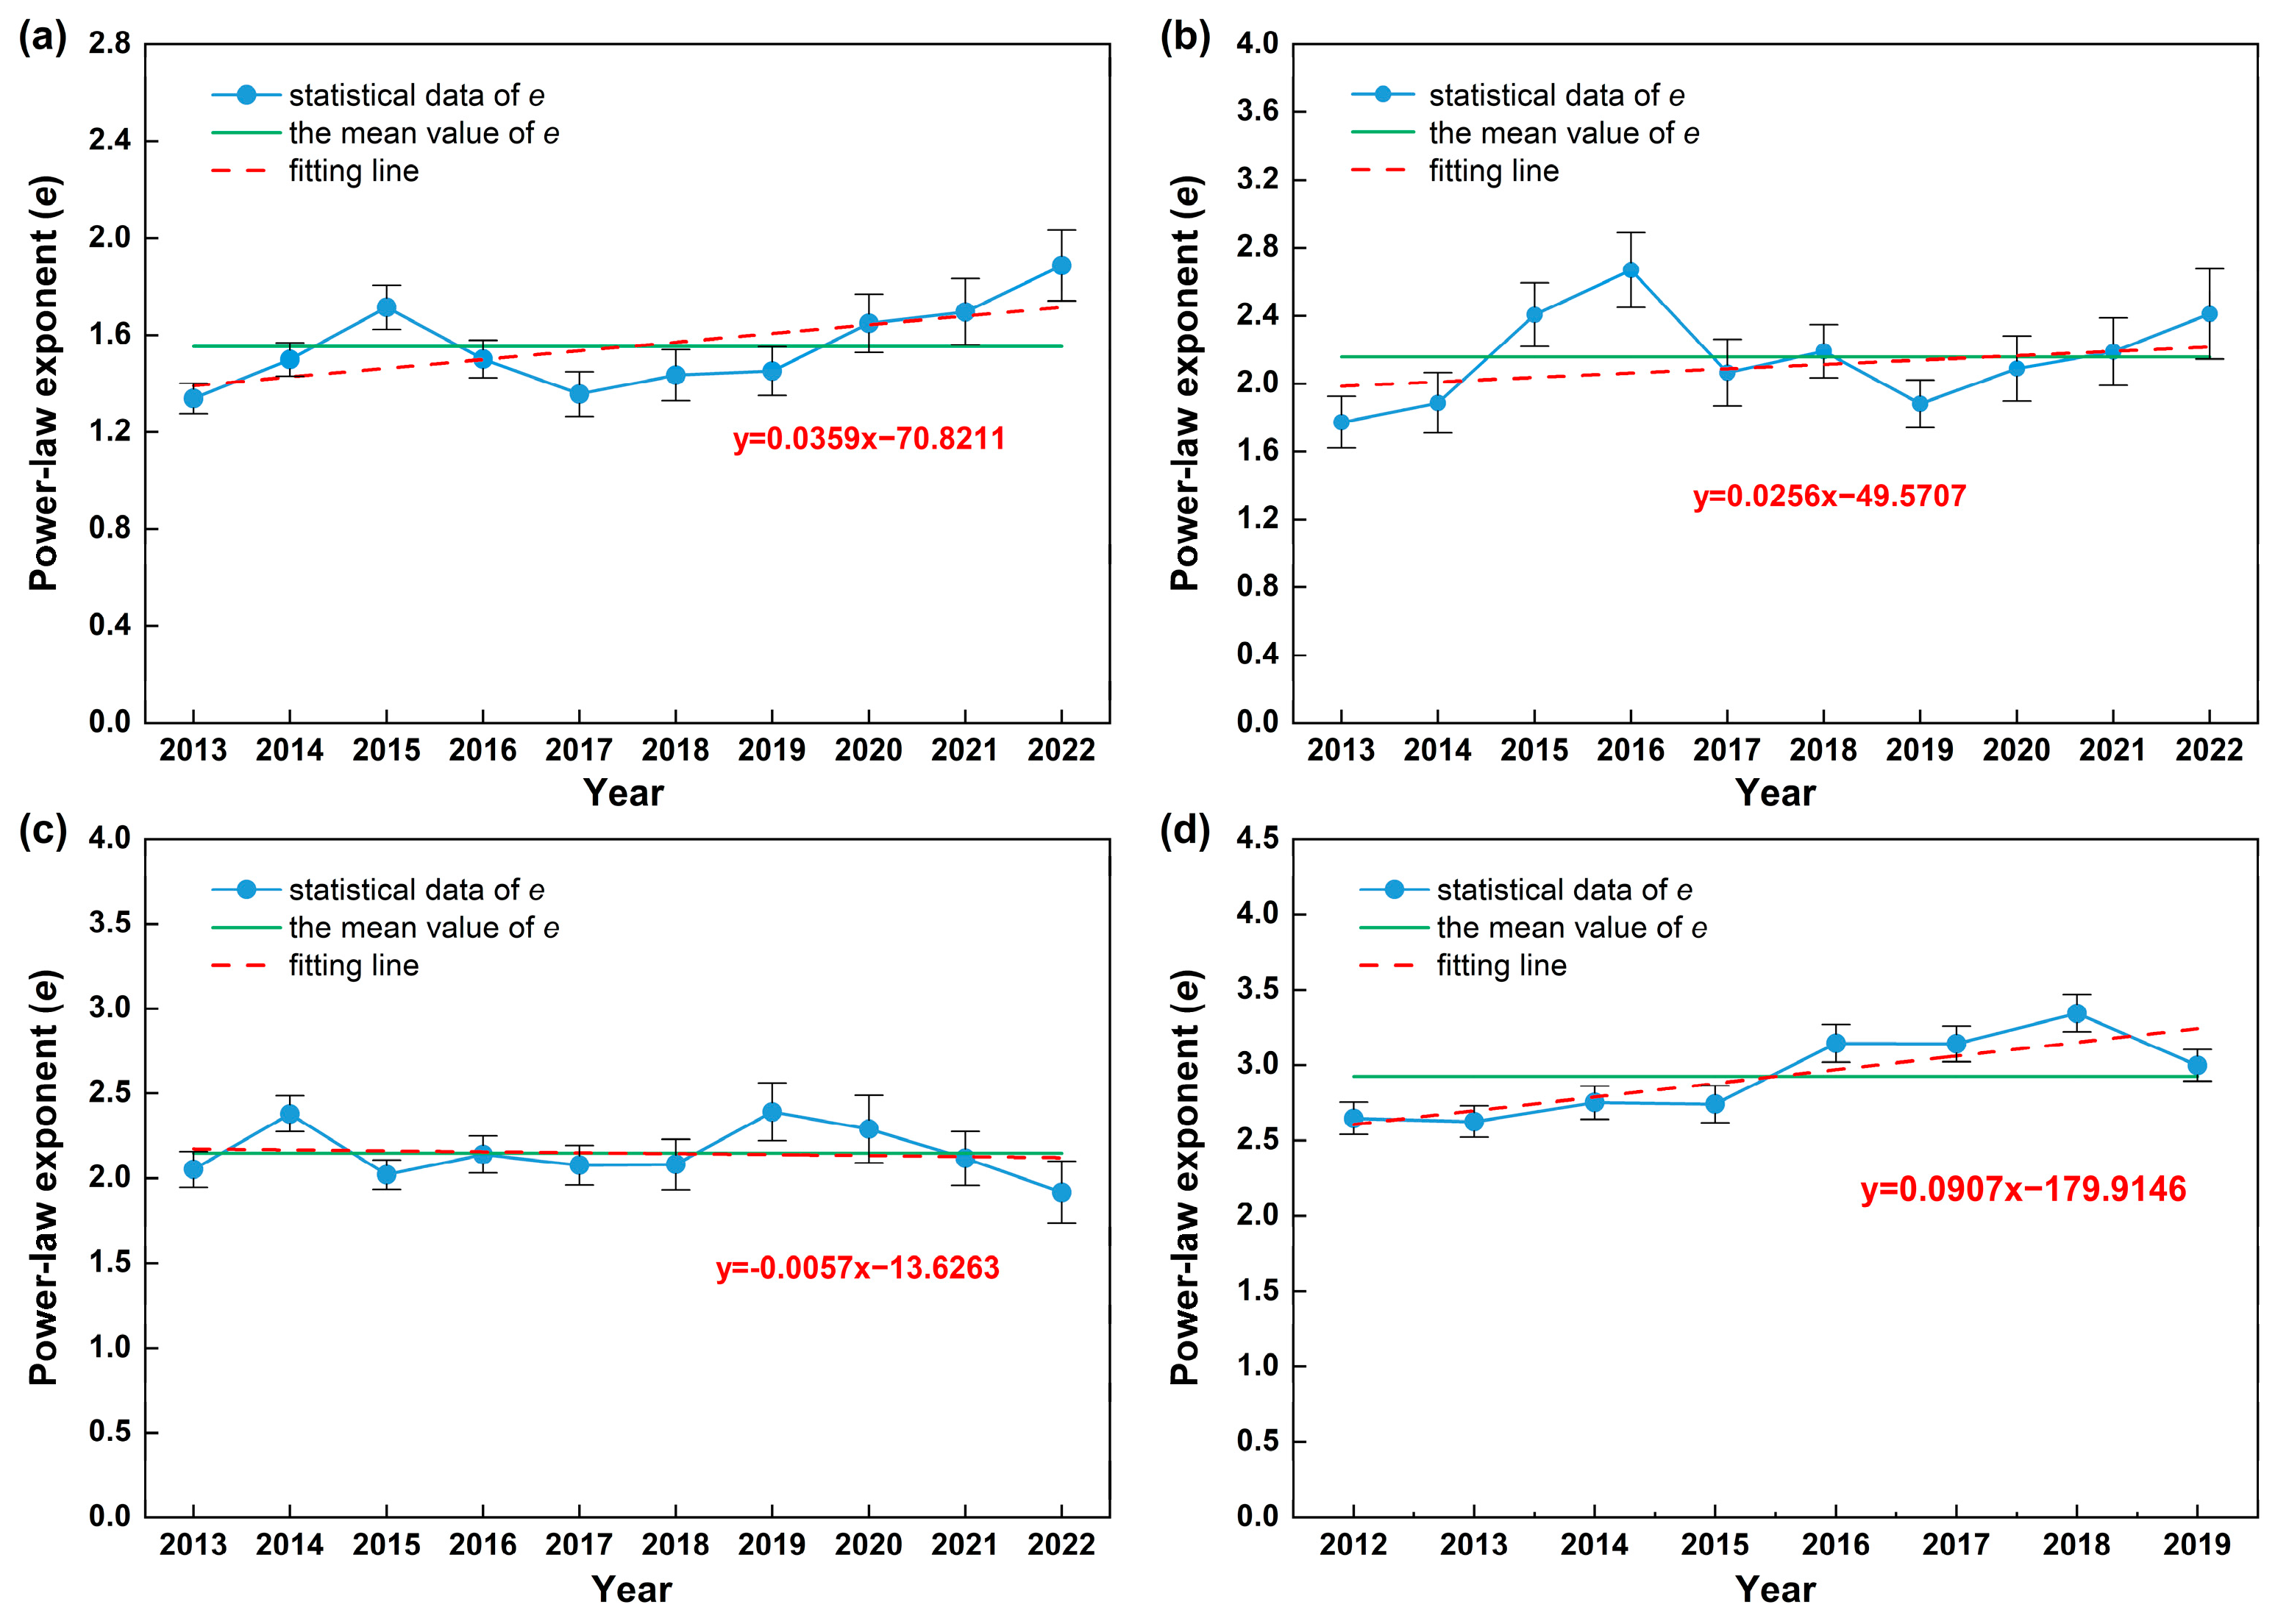
2.5. Temporal Variation in the Power-Law Exponent of Workplace Accidents

The power-law exponents of each year and each industry derived from the data fit in Section 2.2 are plotted in Figure 8.
As can be seen from Figure 8, e in each year of the various industries floats around the mean value, and the variation trend line and the mean line of e do not differ much. As also shown by the data in Table 6, Table 7, Table 8 and Table 9, the variance and the degree of dispersion are small, and the mean value of e is very close to the exponent of cumulative total data distribution. This indicates that the exponents of the power-law distribution of workplace accidents in different industries have a characteristic value, and the exponents of the power-law distribution of statistics over different time intervals fluctuate for a variety of reasons. This fluctuation can be analogized with respect to the law of value in the political economy. The price of commodities rises and falls, not too far from the value, but the average price of these commodities is still in line with the value over a longer period when viewed from the perspective of society as a whole; value is determined by socially necessary labor time, while price is affected by a combination of cost, supply and demand, efficiency, information, and other factors.
For the power-law distribution of workplace accidents in different industries, the characteristic value of the power-law exponent can be analogized as value, which is only determined by the intrinsic accident characteristics in a specific industry. The exponent of the power-law distribution of statistics over time intervals fluctuating up and down can be analogized as price, which is affected by many things, such as the social environment, the national policy, the levels of safety technology and engineering, and safety education. Therefore, the prediction model of the power-law exponent should be described as e = E + f ( a , b , c , , n ) , where E is the characteristic value, and f ( a , b , c , , n ) is a function related to a variety of factors, such as the social environment, the national policy, the safety technology and engineering levels, and safety education, in which a large number of unquantifiable and unexplored factors remain, so we will not continue to discuss them in depth here.
The variation in exponent (e) of the power-law distribution of workplace accidents reflects the safety situation during the time interval. The decreasing trend of e indicates that the proportion of accidents with many fatalities is increasing, signaling deterioration in the safety situation. It is observed in Figure 8 that e of the coal mining, hazardous chemicals, and construction industries shows an increasing trend, while e of the construction industries show a small decreasing trend. This means that the safety situation in construction industries is tending to deteriorate. From a practical perspective, China’s urbanization entered a stage of high-quality development from 2012 to 2019, during which the construction industry experienced rapid growth, with significant increases in the number of housing projects, high-rise buildings, and infrastructure projects. A large number of migrant workers with low educational levels became the main force in front-line construction in the industry. Most of them lacked systematic construction skill training and safety knowledge education and lacked safety awareness, leading to the frequent occurrence of various accidents and a severe safety situation in the construction industry. This is mutually confirmed by the short-term prediction results of the power-law index changes. More action should be taken in the construction industry. This is necessary not only to strengthen safety education and training for construction personnel and provide effective protection, but also to improve the construction safety management system, increase investment in safety funds, and strengthen the efforts to rectify safety hazards. Therefore, variations in e can be used for the short-term prediction and evaluation of safe production to provide a reference for the safety management department to adjust policy in time and improve the safety level of each industry.

3. Results

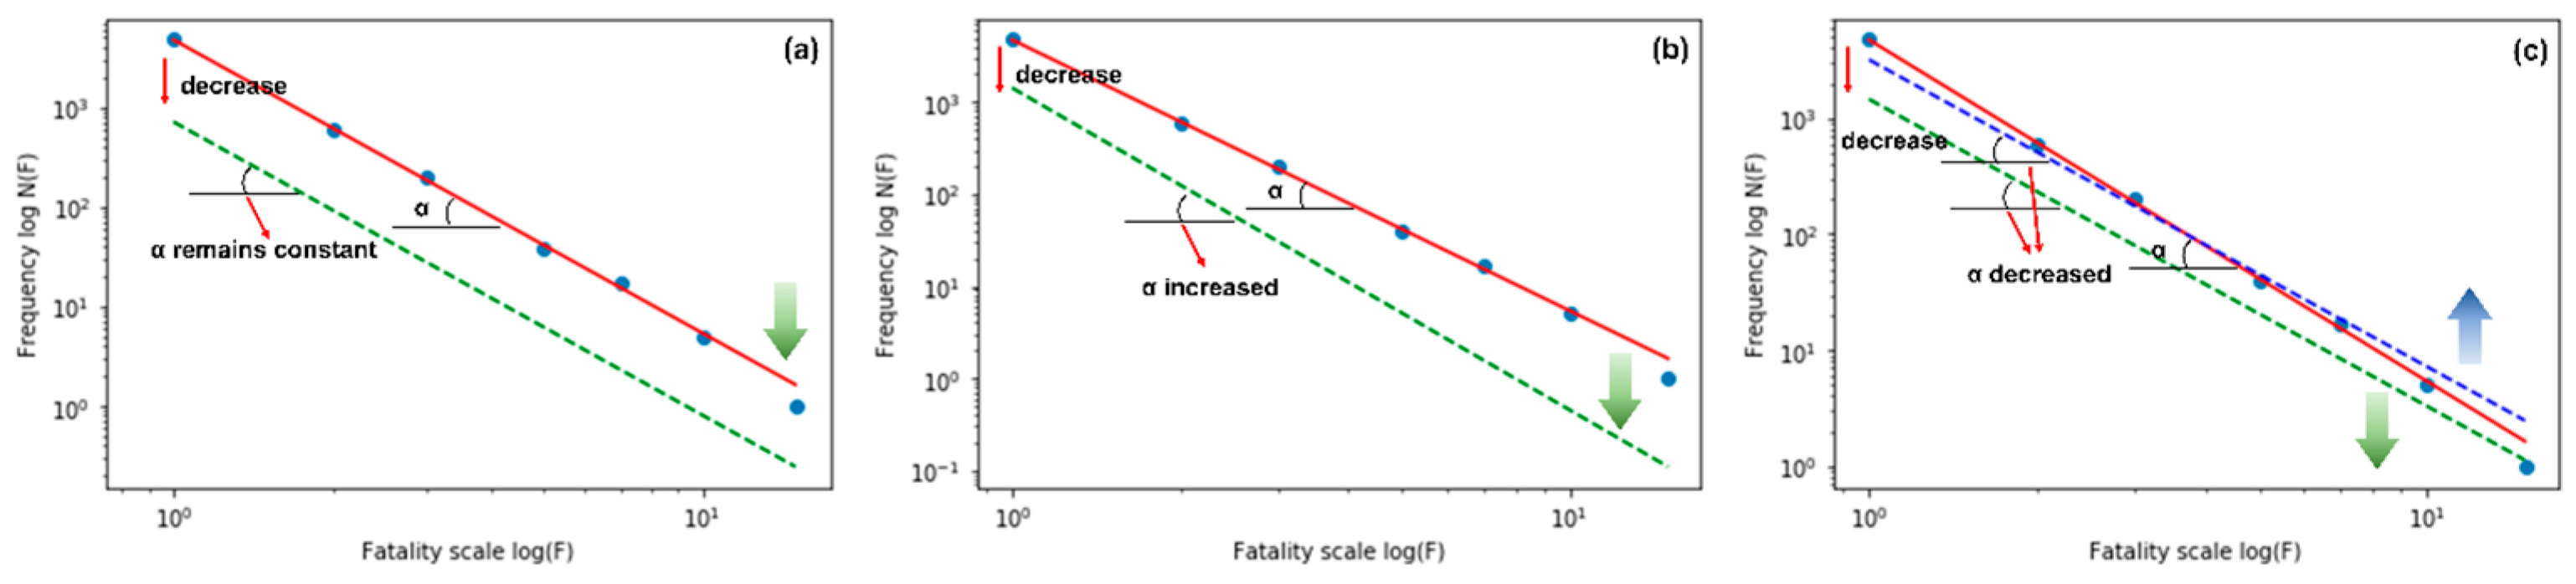
3.1. SOC of Workplace Accidents

As discussed in Section 2, the fatality number and the frequency of workplace accidents follows a power-law distribution. The power-law distribution phenomenon is a widely observed natural occurrence found in diverse fields, and the most obvious characteristics of SOC are the frequency and magnitude of the power-law distribution and its spatial pattern [41]. As a system moves into a critical state, it exhibits SOC. In this case, the distribution of event sizes is scale-invariant [42]. In SOC, the “input” of a complex system is constant, whereas the “output” is a series of events or “avalanches” that follow a power-law size–frequency distribution [43]. Only when a system is open, nonlinear, far from equilibrium, and both robust and sensitive can power-law behavior resulting from SOC be studied systematically [44].
A safe production system generally refers to the organic complex of many elements, many variables, multiple levels, and multiple subsystems that affect safe production and the ability for workers to carry out safe production practice activities in a certain space and time domain (time sequence and spatial location). The safety system is an open system that is closely connected with the environment and continuously exchanges material, energy, and information. The elements and variables of the system present complex nonlinear relationships and nonlinear effects of mutual interference. Through constant competition and synergy, the elements composing the safety system finally move from disorder to order under the action of certain external conditions and the internal nonlinear mechanisms of the system and can achieve local, temporary, and relative stability, but this stability can easily be destroyed by minor perturbations, so the safety system also has a certain robustness and sensitivity. Therefore, a safety system has all the characteristics of SOC. It can evolve to a critical state through a self-organized evolution governed by power-law, and its fatality number–frequency power-law distribution reflects the SOC of workplace accidents.
The classical model describing the idea of SOC is the sand pile model, which simulates the formation and collapse process of a sand pile. Depending on the state of the sand pile and the location of added sand grains, local sand avalanches will occur, or the systematic collapse of the entire pile will occur [14]. Behind the sand pile dynamics lies the idea of SOC; a dynamical system will evolve on its own (without external interference or guidance) to a critical state, where the consequences caused by any small perturbation, such as the addition of a single grain of sand, are unpredictable.
In a safety system, the various components are interconnected and interact to form a sand pile in a state of SOC. Elements such as people, machinery, environment, and management are randomly dispersed throughout the sand pile, with each location having a corresponding value related to the slope of the sand pile. In a safety system, errors can be compared to grains of sand being randomly added to a sand pile. As sand is added, the slope at a particular spot increases until it surpasses a critical threshold, leading to a collapse at that point. The sand then shifts to nearby areas, raising their slopes. Consequently, when an error occurs in one part of the safety system, it may result in no accident or only a minor one, but it also has the potential to trigger a cascading effect, leading to a major accident. Consider a simple example of a common unsafe behavior in traffic accidents: driving while fatigued. In one scenario, no accident occurs. In another, human error disrupts the balance of the human–machine system, leading to improper vehicle operation and resulting in minor accidents like scrapes or collisions. In a more severe case, the fatigued driver loses control of the vehicle, causing erratic driving that disrupts the entire road, potentially triggering a major chain reaction accident such as a multi-vehicle pileup.
Consequently, for the safety system, any one triggering factor may lead to either a small accident with minor or no injuries, or a major accident with serious fatalities and injuries. As a result, the occurrence of workplace accidents is also unpredictable. However, despite the unpredictable nature of workplace accidents, we can delay the occurrence of accidents by eliminating dangerous factors and avoiding small disturbances as much as possible. For hidden dangers that are difficult to eliminate, we can assess their risk level and take measures to reduce the severity of accidents and turn large accidents into small ones. This is also the fundamental approach to the prevention and control of workplace accidents.

3.2. Revisiting Heinrich’s Law

Among all the statistical distributions, power-law is the only scale-invariant distribution. Power-law distributions arise from scale-invariant processes [45], which means that no matter how the data are intercepted, the overall distribution characteristics are not affected, and the power-law exponent remains unchanged. This links the probability of large and small events, without emphasizing any specific event size [42,46]. Since the size–frequency distribution of fatalities caused by workplace accidents across the industries follows the power-law distribution given by Equation (4), it is thus scale-invariant, and large accidents with many fatalities follow the same nonlinear dynamics as small accidents with fewer fatalities. Therefore, the power-law exponents between any two intervals on the horizontal coordinate of Figure 1 are the same, which also means that these power-law exponents are the characteristic values in a specific industry. However, this scale invariance assumes that the safety system remains unaffected by external disturbances, representing an ideal theoretical constant. In practice, safety systems are constantly interacting with their external environment, which causes the power-law exponent to fluctuate around its characteristic value. In the principle of safety science, the relationship between the magnitude and frequency of workplace accidents described by Heinrich’s Law also shows a good correlation with the power-law distribution, as shown in Figure 1e. Therefore, the characteristics of workplace accidents described by Heinrich’s Law are similar to those described by the power-law distribution.
The size–frequency distribution of fatalities caused by workplace accidents obeys power-law distribution with scale-invariance and industry dependency, and the exponent of such power-law distribution in different industries has a characteristic value. Based on the linear relationship of the power-law distribution in the double-logarithmic coordinate system, as shown in Equation (5), we can simplify it into a general formula of the slope-intercept linear relationship, y = a b x . Here, y represents the logN(F) , and a stands for C, the prefactor. We consider accidents with one fatality as small-scale accidents, for which x = l o g F = 0 and a = C = l o g N ( 1 ) . The prefactor is positively correlated with the frequency of small-scale accidents, so a reduction in small-scale accidents corresponds to a decrease in the prefactor. Therefore, if the number of workplace accidents with some fatalities decreases by a certain amount, to keep the power-law exponent constant, the number of workplace accidents with many fatalities is also bound to decrease. As shown in Figure 9a, the frequency of all the accidents is simultaneously reduced by a certain amount to ensure that the slopes of the two characteristic straight lines in the double-logarithmic coordinate system remain constant.
But, in practice, the exponent fluctuates around the characteristic value, with the data from Section 2.2 indicating an average fluctuation range of within 24%. Figure 9b,c shows that when effective measures are taken to reduce the number of small-scale accidents, an upward fluctuation in the power-law exponent will inevitably lead to a decrease in large-scale accidents. Conversely, when the power-law exponent fluctuates downward, a significant reduction in small-scale accidents is required to achieve a decrease in large-scale events. If the reduction in small-scale accidents is minor, the number of large-scale accidents may actually increase. Therefore, from a statistical perspective, even if the power-law exponent is not constant, taking effective measures to substantially reduce the occurrence of small-scale accidents can still reduce the number of large-scale accidents.
Based on the analysis of the workplace accident data from these four industries over the last decade, we have validated our conclusions. Over this period, China’s industrial management systems have become increasingly sophisticated, the laws and the regulations have steadily improved, the industrial structure has been continuously optimized, and the overall competency of the workforce has improved significantly. These developments have undoubtedly led to an improved safety landscape across various industries. As shown in Table 1, Table 2, Table 3 and Table 4, within this enhanced safety environment, the number of accidents with fewer fatalities has decreased in the coal mining, hazardous chemicals, and transportation sectors. Similarly, there has been a reduction in accidents across all the fatality scales, including a notable decline in the occurrence of major accidents. In the construction industry, the period from 2012 to 2019 coincided with a peak in China’s urbanization, leading to a significant increase in construction projects. This boom attracted a large number of workers with varying levels of safety awareness, resulting in a rise in minor accidents and a trend toward more major accidents as well. Overall, there is a correlation between the frequency of minor and major accidents, consistent with the predictions of the power-law; as the number of minor accidents decreases, the occurrence of major accidents tends to decrease accordingly.
This is actually consistent with the ultimate goal reflected in Heinrich’s Law, which states that the safety of personnel and equipment can be protected by preventing small accidents, which will control and reduce the likelihood of large accidents. Many have questioned Heinrich’s Law in recent years. Some argued that Heinrich’s view is a “limitation” on safety professionals who try to attack high-severity, low-probability accidents [47]. Through the analysis in this paper, this is not a “limitation” of Heinrich’s view; there are specific, underlying mechanisms and principles at work, similar to those that generate power-law distributions.

3.3. Limitations of This Study

Through this study, we verified that the number of accident fatalities and the occurrence frequencies in four industries in China—coal mining, hazardous chemicals, transportation, and construction—follow a power-law distribution and explored the industry dependency of the power-law exponents. Based on the characteristics of the power-law distribution, we drew the conclusion that controlling large-scale accidents can be achieved by effectively reducing small-scale accidents. However, this conclusion is based solely on statistical patterns, and it is challenging to uncover the underlying physical mechanisms and logical relationships through statistics alone. To gain deeper insights, we turn to the existing safety theories. According to the accident causation theory [48,49,50], small-scale accidents typically involve fewer factors and are usually localized issues. In contrast, large-scale accidents are much more complex, often arising from the interaction of multiple factors. Therefore, reducing the number of small-scale accidents can help eliminate some of the individual causes of large-scale accidents, potentially preventing them. Additionally, mobilizing substantial human and material resources to implement safety policies, management practices, and technologies to control the number of small-scale accidents can improve safety oversight and raise safety awareness, ultimately reducing the incidence of major accidents. However, it is also important to recognize that frequent small-scale accidents can serve as valuable warnings. If the number of these accidents is significantly reduced, there may be a risk of complacency and overconfidence, which could, in turn, increase the likelihood of large-scale accidents.
Determining whether reducing small-scale accidents can effectively control the frequency of large-scale accidents is a complex and systemic issue. Investigating this question could potentially advance safety science at a deeper level. This situation is somewhat similar to quantum mechanics, where statistical descriptions of quantum behavior are used despite the underlying physical mechanisms being unclear. Similarly, while the exact mechanisms behind safety patterns may not be fully understood, focusing on statistically derived relationships remains valuable. These statistical insights can provide meaningful guidance for improving safety practices and management.

4. Conclusions

This study verifies the power-law distribution characteristics between the fatality number and the frequency of workplace accidents and discusses the self-organized criticality of workplace accidents. In addition, it reveals that the power-law exponents exhibit industry dependency, with each industry having its own characteristic value. The power-law exponent characteristic values for the coal mining industry, the hazardous chemicals industry, the transportation industry, and the construction industry are 1.55, 2.16, 2.15, and 2.92, respectively, which are closely related to the inherent characteristics of accidents in each industry. Meanwhile, by analyzing the temporal variation in the power-law exponent of workplace accidents in a specific industry, the influence of the social environment, the national policy, safety education, and other factors on the safety status of each industry can be reflected, and thus guide decision making and the policy of safety management.
Furthermore, the findings herein establish a theoretical bridge to Heinrich’s Law and provide support for its core theory. Regardless of the underlying physical mechanisms or logical relationships, a substantial reduction in the number of small-scale accidents can indeed statistically control the occurrence of large-scale fatal accidents.

Supplementary Materials

The following supporting information can be downloaded at: https://www.mdpi.com/article/10.3390/math13122021/s1, S1. The fitting code. Table S1. Comparison of goodness of fit for power-law distribution of coal mining industry accident data under different xmin values. Table S2. Comparison of goodness of fit for power-law distribution of hazardous chemicals industry accident data under different xmin values. Table S3. Comparison of goodness of fit for power-law distribution of transportation industry accident data under different xmin values. Table S4. Comparison of goodness of fit for power-law distribution of construction industry accident data under different xmin values.

Author Contributions

Conceptualization, X.L.; methodology, F.W.; validation, X.L.; formal analysis, F.Z.; investigation, F.Z. and F.W.; data curation, F.Z. and F.W.; writing—original draft preparation, F.Z. and F.W.; writing—review and editing, X.L.; supervision, X.L.; funding acquisition, X.L. and F.Z. All authors have read and agreed to the published version of the manuscript.

Funding

This work was supported by the National Natural Science Foundation of China (Grant No. 42172316), the Natural Science Foundation of Hunan Province, China (Grant No 2021JJ30810), and the Fundamental Research Funds for the Central Universities of Central South University (2025ZZTS0274).

Data Availability Statement

The authors confirm that the data supporting the findings of this study are available within this article.

Conflicts of Interest

The authors declare no conflicts of interest.

References

  1. Beskardes, G.D.; Weiss, C.J.; Everett, M.E. Estimating the Power-Law Distribution of Earth Electrical Conductivity from Low-Frequency, Controlled-Source Electromagnetic Responses. Geophys. J. Int. 2017, 208, 639–651. [Google Scholar] [CrossRef]
  2. Kurgansky, M.V. Statistical Distribution of Atmospheric Dust Devils on Earth and Mars. Bound.-Layer Meteorol. 2022, 184, 381–400. [Google Scholar] [CrossRef]
  3. Etro, F.; Stepanova, E. Power-Laws in Art. Phys. A Stat. Mech. Its Appl. 2018, 506, 217–220. [Google Scholar] [CrossRef]
  4. Salahshour, M. Predator-Prey Power Laws: Trophic Interactions Give Rise to Scale-Invariant Ecosystems. New J. Phys. 2023, 25, 123012. [Google Scholar] [CrossRef]
  5. Chol-jun, K. Distribution in the Geometrically Growing System and Its Evolution. Chaos Interdiscip. J. Nonlinear Sci. 2024, 34, 103148. [Google Scholar] [CrossRef]
  6. Gontis, V. Modeling Double Stochastic Opinion Dynamics with Fractional Inflow of New Opinions. Fractal Fract. 2024, 8, 513. [Google Scholar] [CrossRef]
  7. Tenreiro Machado, J.A.; Pinto, C.M.A.; Lopes, A.M. Power Law and Entropy Analysis of Catastrophic Phenomena. Math. Probl. Eng. 2013, 2013, 562320. [Google Scholar] [CrossRef]
  8. Silva, R.; Silva, J.R.P.; Anselmo, D.H.A.L.; Alcaniz, J.S.; da Silva, W.J.C.; Costa, M.O. An Alternative Description of Power Law Correlations in DNA Sequences. Phys. A Stat. Mech. Its Appl. 2020, 545, 123735. [Google Scholar] [CrossRef]
  9. Wang, Z.; Wei, Z.; Sun, K.; He, S.; Wang, H.; Xu, Q.; Chen, M. Chaotic Flows with Special Equilibria. Eur. Phys. J.-Spec. Top. 2020, 229, 905–919. [Google Scholar] [CrossRef]
  10. Zuo, Z.; Liu, G.; Li, H. Research on Inspection and Certification Industry Based on Dissipative Structure Theory. Therm. Sci. 2019, 23, 2839–2848. [Google Scholar] [CrossRef]
  11. Haken, H.; Portugali, J. Information and Self-Organization II: Steady State and Phase Transition. Entropy 2021, 23, 707. [Google Scholar] [CrossRef]
  12. Gauthier, Y. The Construction of Chaos Theory. Found. Sci. 2009, 14, 153–165. [Google Scholar] [CrossRef]
  13. Schwab, D.J.; Nemenman, I.; Mehta, P. Zipf’s Law and Criticality in Multivariate Data without Fine-Tuning. Phys. Rev. Lett. 2014, 113, 068102. [Google Scholar] [CrossRef] [PubMed]
  14. Bak, P.; Tang, C.; Wiesenfeld, K. Self-Organized Criticality: An Explanation of the 1/f Noise. Phys. Rev. Lett. 1987, 59, 381–384. [Google Scholar] [CrossRef]
  15. Gutenberg, B.; Richter, C.F. Frequency of Earthquakes in California. Bull. Seismol. Soc. Am. 1944, 34, 185–188. [Google Scholar] [CrossRef]
  16. Fung, I.W.H.; Tam, V.W.Y.; Lo, T.Y.; Lu, L.L.H. Developing a Risk Assessment Model for Construction Safety. Int. J. Proj. Manag. 2010, 28, 593–600. [Google Scholar] [CrossRef]
  17. Shahsavari, S.; Mohammadi, A.; Mostafaei, S.; Zereshki, E.; Tabatabaei, S.M.; Zhaleh, M.; Shahsavari, M.; Zeini, F. Analysis of Injuries and Deaths from Road Traffic Accidents in Iran: Bivariate Regression Approach. BMC Emerg. Med. 2022, 22, 130. [Google Scholar] [CrossRef]
  18. Lim, K.-K. Analysis of Railroad Accident Prediction Using Zero-Truncated Negative Binomial Regression and Artificial Neural Network Model: A Case Study of National Railroad in South Korea. KSCE J. Civ. Eng. 2023, 27, 333–344. [Google Scholar] [CrossRef]
  19. Wang, J.; Zhou, Y.; Zhuang, L.; Shi, L.; Zhang, S. A Model of Maritime Accidents Prediction Based on Multi-Factor Time Series Analysis. J. Mar. Eng. Technol. 2023, 22, 153–165. [Google Scholar] [CrossRef]
  20. Heinrich, H.W. Industrial Accident Prevention. A Scientific Approach; Mcgraw-Hill Book Company Inc.: New York, NY, USA; London, UK, 1941. [Google Scholar]
  21. Yorio, P.L.; Moore, S.M. Examining Factors That Influence the Existence of Heinrich’s Safety Triangle Using Site-Specific H&S Data from More than 25,000 Establishments. Risk Anal. 2018, 38, 839–852. [Google Scholar] [CrossRef]
  22. Manuele, F.A. Reviewing Heinrich: Dislodging Two Myths From the Practice of Safety. Prof. Saf. 2011, 56, 52–61. [Google Scholar]
  23. Anderson, M.; Denkl, M. The Heinrich Accident Triangle—Too Simplistic A Model for HSE Management in the 21st Century? In Proceedings of the SPE International Conference on Health, Safety and Environment in Oil and Gas Exploration and Production, Rio de Janeiro, Brazil, 12–14 April 2010. [Google Scholar]
  24. Taxis, K.; Gallivan, S.; Barber, N.; Franklin, B. Can the Heinrich Ratio Be Used to Predict Harm from Medication Errors? University of Birmingham: Birmingham, UK, 2006. [Google Scholar]
  25. Mauro, J.C.; Diehl, B.; Marcellin, R.F.; Vaughn, D.J. Workplace Accidents and Self-Organized Criticality. Phys. A Stat. Mech. Its Appl. 2018, 506, 284–289. [Google Scholar] [CrossRef]
  26. Lopes, A.M.; Machado, J.A.T. Power Law Behavior and Self-Similarity in Modern Industrial Accidents. Int. J. Bifurc. Chaos 2015, 25, 1550004. [Google Scholar] [CrossRef]
  27. Lu, S.; Liang, C.; Song, W.; Zhang, H. Frequency-Size Distribution and Time-Scaling Property of High-Casualty Fires in China: Analysis and Comparison. Saf. Sci. 2013, 51, 209–216. [Google Scholar] [CrossRef]
  28. Sui, Z.; Wen, Y.; Huang, Y.; Song, R.; Piera, M.A. Maritime Accidents in the Yangtze River: A Time Series Analysis for 2011–2020. Accid. Anal. Prev. 2023, 180, 106901. [Google Scholar] [CrossRef]
  29. Doss, K.; Hanshew, A.S.; Mauro, J.C. Signatures of Criticality in Mining Accidents and Recurrent Neural Network Forecasting Model. Phys. A Stat. Mech. Its Appl. 2020, 537, 122656. [Google Scholar] [CrossRef]
  30. Moos, C.; Bontognali, Z.; Dorren, L.; Jaboyedoff, M.; Hantz, D. Estimating Rockfall and Block Volume Scenarios Based on a Straightforward Rockfall Frequency Model. Eng. Geol. 2022, 309, 106828. [Google Scholar] [CrossRef]
  31. Clauset, A.; Shalizi, C.R.; Newman, M.E.J. Power-Law Distributions in Empirical Data. SIAM Rev. 2009, 51, 661–703. [Google Scholar] [CrossRef]
  32. Chen, D.; Xia, C.; Liu, H.; Liu, X.; Du, K. Research on b Value Estimation Based on Apparent Amplitude-Frequency Distribution in Rock Acoustic Emission Tests. Mathematics 2022, 10, 3202. [Google Scholar] [CrossRef]
  33. Greenhough, J.; Main, I.G. A Poisson Model for Earthquake Frequency Uncertainties in Seismic Hazard Analysis. Geophys. Res. Lett. 2008, 35, 2008GL035353. [Google Scholar] [CrossRef]
  34. Li, Y.P. Fitting Power-Law Frequency Distribution with a Modified Maximum Likelihood Estimator. Acta Astron. Sin. 2014, 55, 437–443. [Google Scholar]
  35. Liu, X.; Han, M.; He, W.; Li, X.; Chen, D. A New b Value Estimation Method in Rock Acoustic Emission Testing. JGR Solid Earth 2020, 125, e2020JB019658. [Google Scholar] [CrossRef]
  36. Chen, D.; Liu, X.; He, W.; Xia, C.; Gong, F.; Li, X.; Cao, X. Effect of Attenuation on Amplitude Distribution and b Value in Rock Acoustic Emission Tests. Geophys. J. Int. 2022, 229, 933–947. [Google Scholar] [CrossRef]
  37. Cheng, Y.-P.; Fu, J.-H.; Yu, Q.-X. Development of Gas Extraction Technology in Coal Mines of China. Caikuang Yu Anquan Gongcheng Xuebao/J. Min. Saf. Eng. 2009, 26, 127–139. [Google Scholar]
  38. Shao, B.; Hu, Z.; Liu, Q.; Chen, S.; He, W. Fatal Accident Patterns of Building Construction Activities in China. Saf. Sci. 2019, 111, 253–263. [Google Scholar] [CrossRef]
  39. Wang, B.; Li, D.; Wu, C. Characteristics of Hazardous Chemical Accidents during Hot Season in China from 1989 to 2019: A Statistical Investigation. Saf. Sci. 2020, 129, 104788. [Google Scholar] [CrossRef]
  40. Zhou, K.; Xiao, L.; Lin, Y.; Yuan, D.; Wang, J. A Statistical Analysis of Hazardous Chemical Fatalities (HCFs) in China between 2015 and 2021. Sustainability 2022, 14, 2435. [Google Scholar] [CrossRef]
  41. Bak, P. The Discovery of Self-Organized Criticality. In How Nature Works: The Science of Self-Organized Criticality; Bak, P., Ed.; Springer: New York, NY, USA, 1996; pp. 33–48. ISBN 978-1-4757-5426-1. [Google Scholar]
  42. Hergarten, S.; Neugebauer, H.J. Self-Organized Criticality in Landsliding Processes. In Process Modelling and Landform Evolution; Hergarten, S., Neugebauer, H.J., Eds.; Lecture Notes in Earth Sciences; Springer: Berlin/Heidelberg, Germany, 1999; pp. 231–249. ISBN 978-3-540-68307-0. [Google Scholar]
  43. Malamud, B.D.; Turcotte, D.L. Self-Organized Criticality Applied to Natural Hazards. Nat. Hazards 1999, 20, 93–116. [Google Scholar] [CrossRef]
  44. Hui, X.; Ma, F.; Zhao, H.; Xu, J. Monitoring and Statistical Analysis of Mine Subsidence at Three Metal Mines in China. Bull. Eng. Geol. Environ. 2019, 78, 3983–4001. [Google Scholar] [CrossRef]
  45. Ghil, M.; Yiou, P.; Hallegatte, S.; Malamud, B.D.; Naveau, P.; Soloviev, A.; Friederichs, P.; Keilis-Borok, V.; Kondrashov, D.; Kossobokov, V.; et al. Extreme Events: Dynamics, Statistics and Prediction. Nonlinear Process. Geophys. 2011, 18, 295–350. [Google Scholar] [CrossRef]
  46. Malamud, B.D.; Turcotte, D.L. The Applicability of Power-Law Frequency Statistics to Floods. J. Hydrol. 2006, 322, 168–180. [Google Scholar] [CrossRef]
  47. Johnson, A. Examining the foundation: Were Herbert William Heinrich’s theories valid, and do they still matter? Saf. + Health Mag. 2011, 184, 62. [Google Scholar]
  48. Bonsu, J.; van Dyk, W.; Franzidis, J.-P.; Petersen, F.; Isafiade, A. A Systems Approach to Mining Safety: An Application of the Swiss Cheese Model. J. S. Afr. Inst. Min. Metall. 2016, 116, 776–784. [Google Scholar] [CrossRef]
  49. Chen, P.; Fu, G.; Wang, Y.; Meng, H.; Lv, M. Accident Causation Models: A Comparison of SCM and 24Model. Proc. Inst. Mech. Eng. Part O J. Risk Reliab. 2023, 237, 810–822. [Google Scholar] [CrossRef]
  50. Howard, R.; Dimick, J.B. Human Factors and Principles of Patient Safety: The James Reason Model. In Principles of Perioperative Safety and Efficiency; Hoballah, J.J., Kaafarani, H.M., Tsoulfas, G., Eds.; Springer International Publishing: Cham, Switzerland, 2024; pp. 3–15. ISBN 978-3-031-41089-5. [Google Scholar]
Figure 1. Histogram of fatality number (F) and frequency of occurrence (N(F)) and power-law distribution fitting for four industries. (ad) are histograms of cumulative total data over years counted for coal mining, hazardous chemicals, and transportation and construction industries, respectively. (e) presents distribution of accident sizes according to Heinrich’s Law, with red line indicating fitted curve of power-law distribution.
Mathematics 13 02021 g001
Figure 2. (ad) depict the relationship between lnN(F) and lnF for four industries, while (eh) illustrate the relationship between lnN(F) and F.
Mathematics 13 02021 g002
Figure 3. The size–frequency distributions of fatalities and confidence intervals in a double-logarithmic coordinate system for the coal mining industry. (aj) are the data distribution for each year from 2013 to 2022, and (k) is the distribution of cumulative total data over the years counted. (ak) are the double-logarithmic linear distributions fitted by GLM. The red lines indicate the best fit to power-law distribution, the green dashed lines stand for the 95% Poisson confidence limit, and the blue dots are the statistical data in the double-logarithmic coordinates.
Mathematics 13 02021 g003
Figure 4. The size–frequency distributions of fatalities and confidence intervals in a double-logarithmic coordinate system for the hazardous chemicals industry. (aj) are the data distribution for each year from 2013 to 2022, and (k) is the distribution of cumulative total data over the years counted. (ak) are the double-logarithmic linear distributions fitted by the GLM. The red lines indicate the best fit to the power-law distribution, and the green dashed lines stand for the 95% Poisson confidence limit, and the blue dots are the statistical data in double-logarithmic coordinates.
Mathematics 13 02021 g004
Figure 5. The size–frequency distributions of fatalities and confidence intervals in a double-logarithmic coordinate system for the transportation industry. (aj) are the data distribution for each year from 2013 to 2022, and (k) is the distribution of cumulative total data over the years counted. (ak) are the double-logarithmic linear distributions fitted by the GLM. The red lines indicate the best fit to the power-law distribution, and the green dashed lines stand for the 95% Poisson confidence limit, and the blue dots are the statistical data in double-logarithmic coordinates.
Mathematics 13 02021 g005
Figure 6. The size–frequency distributions of fatalities and confidence intervals in a double-logarithmic coordinate system for the construction industry. (ah) are the data distribution for each year from 2012 to 2019, and (i) is the distribution of cumulative total data over the years counted. (ai) are the double-logarithmic linear distributions fitted by the GLM. The red lines indicate the best fit to the power-law distribution, and the green dashed lines stand for the 95% Poisson confidence limit, and the blue dots are the statistical data in double-logarithmic coordinates.
Mathematics 13 02021 g006
Figure 7. Comparison of e by industry.
Mathematics 13 02021 g007
Figure 8. The temporal variation graphs of e for the different industries, with (ad) the distributions indicating the coal mining, hazardous chemicals, transportation, and construction industries, respectively. The blue dots represent the power-law exponents for each year, and the green solid line indicates the mean value used as a baseline to observe the fluctuation of the power-law exponent, while the red dashed line depicts the trend of variations from fitting. The linear relationship in red is the expression for the trend line.
Mathematics 13 02021 g008
Figure 9. The three patterns of variation in the power-law exponents, where (ac) represent the cases when the power-law exponent remains constant, increases, and decreases, respectively. The blue points are the raw data of accidents in the industry, and the red line is the characteristic straight line fitted in the double-logarithmic coordinate system. The green and blue dashed lines illustrate possible power-law distribution states after concurrent changes in small-scale accident counts and the exponent. In (a,b), the decrease in small-scale accidents inevitably causes the tail of the green dashed line to be below that of the red line, meaning the number of large-scale accidents decreases accordingly. The green arrow is used to indicate this corresponding reduction in large-scale accidents. In contrast, in (c), a slight decrease in small-scale accidents raises the blue dashed line’s tail above the red line, the blue arrow indicates an increase in large-scale accidents. Only significant reduction in small-scale accidents shifts the green dashed line below the red line in (c), reducing large-scale accidents correspondingly.
Mathematics 13 02021 g009
Table 1. Fatality number and frequency of coal mining accidents over last 10 years.
YearFatality Number/F
≥1≥2≥3≥5≥7≥10≥15≥20≥25≥30
Frequency
/N(F)
202211822147420000
20219322144422100
202010929168522100
2019116362414832100
201898372913421100
20171334729171252000
20161954728161184322
2015210482713953200
201425159412116136210
201323158452822136431
Total15544052671419555281563
Table 2. Fatality number and frequency of hazardous chemical-related accidents over last 10 years.
YearFatality Number/F
≥1≥2≥3≥5≥7≥10≥15≥20≥25≥30
Frequency
/N(F)
20229458285211000
202110873379311110
202014474409422100
2019163945016942111
20182041245918722100
2017175884615620000
20162461214813210000
20152241185210721000
201412767239532111
2013118684114822111
Total1603885424118532013643
Table 3. Fatality number and frequency of transportation accidents over last 10 years.
YearFatality Number/F
≥1≥2≥3≥5≥7≥10≥15≥20≥25≥30
Frequency
/N(F)
20221228866191143321
202114512298411692111
202016413291301832100
2019198172119421252211
2018212191150672894000
20172872321767531164222
20163583172209037147331
201545341129212853219933
201446239829111741123222
201349439529512861225000
Total28952458179873730811541231411
Table 4. Fatality number and frequency of construction accidents over last 8 years.
YearFatality Number/F
≥1≥2≥3≥5≥7≥10≥15≥20≥25≥30
Frequency
/N(F)
201974985277320000
201874165213210000
201769071244300000
201662061273100000
201543771223200000
201451679285110000
201352593259200000
201247874285311000
Total4756599202391751000
Table 5. Definitions of the four distributions and their expressions after applying the logarithm.
NameFunctionLogarithmic
Power-law f x = C x α l n f x = l n C α l n x
Exponential f x = C e λ x l n f x = l n C λ x
Stretched exponential f x = C x β 1 e λ x β l n f x = l n C + β 1 l n x λ x β ,   β 1
Log-normal f x = 1 x e l n x μ 2 2 σ 2 l n f x = l n x l n x μ 2 2 σ 2
Table 6. e of the coal mining industry obtained using GLM fitting.
YearFmineStd Err[0.0250.975]Variation (%)R2
20131.0001.33890.0621.2161.46113.8080.9187
20141.0001.50000.0701.3631.6383.43800.9280
20151.0001.71510.0921.5361.89510.4090.9346
20161.0001.50100.0781.3481.6543.37300.9214
20171.0001.35740.0921.1771.53812.6170.8922
20181.0001.43510.1051.2301.6407.61600.8788
20191.0001.45210.1011.2551.6496.52100.8964
20201.0001.64940.1201.4131.8856.18000.9033
20211.0001.69690.1361.4311.9639.23800.8876
20221.0001.88760.1461.6012.17521.5140.8986
Mean 1.5534 9.4710
Variance 0.0282
Total1.0001.54220.0281.4871.597 0.9800
Notes: “Fmin” is the starting fatality value that obeys the double-logarithmic linear relationship. “Std err” presents the standard error of GLM fitting. “[0.025, 0.975]” is a confidence interval with a confidence level of 95%, which serves as an estimation range for the true parameter value. “Mean” stands for the average of the power-law exponents (e), and “Variance” refers to the variance in the power-law exponents (e), reflecting the dispersion of the power-law exponents (e) of each year with respect to their mean value. “Variation” denotes the extent to which each year’s power-law exponent fluctuates around the mean. R2, known as the coefficient of determination, was used to evaluate the explanatory power of the model using these data. “Total” is the cumulative total data distribution over the years counted. The same applies in Table 6, Table 7, Table 8 and Table 9.
Table 7. e of hazardous chemicals industry obtained using GLM fitting.
YearFmineStd Err[0.0250.975]Variation (%)R2
20132.0001.77330.1511.4762.07017.7670.8730
20142.0001.88700.1781.5392.23512.4950.8586
20152.0002.40700.1882.0382.77611.6190.9165
20162.0002.66980.2202.2393.10123.8060.9142
20172.0002.06600.1961.6822.4504.19300.8673
20182.0002.19020.1571.8822.4981.56600.9209
20192.0001.88150.1411.6062.15712.7500.9054
20202.0002.08970.1911.7142.4653.09500.8760
20212.0002.18860.1981.8002.5771.49100.8858
20222.0002.41130.2671.8882.93411.8190.8629
Mean 2.1564
Variance 0.0882
Total2.0002.18410.0562.0752.2931.28450.9824
Table 8. e of transportation industry obtained using GLM fitting.
YearFmineStd Err[0.0250.975]Variation (%)R2
20133.0002.05250.1051.8462.2594.41900.9299
20143.0002.38080.1062.1742.58810.8690.9521
20153.0002.02110.0871.8502.1925.88200.9497
20163.0002.14020.1081.9292.3510.33500.9451
20173.0002.07810.1161.8512.3053.22700.9328
20183.0002.08180.1491.7892.3753.05500.8972
20193.0002.39270.1702.0602.72611.4230.9194
20203.0002.29010.1981.9022.6786.64500.8856
20213.0002.11770.1591.8072.4291.38300.9040
20223.0001.91880.1831.5612.27710.6450.8401
Mean 2.1474
Variance 0.0222
Total3.0002.18790.0382.1132.2631.86600.9846
Table 9. e of construction industry obtained using GLM fitting.
YearFmineStd Err[0.0250.975]Variation (%)R2
20121.0002.64820.1072.4382.8589.46000.9797
20131.0002.62610.1052.4202.83310.2160.9778
20141.0002.75240.1102.5362.9685.89800.9809
20151.0002.74170.1222.5022.9816.26300.9759
20161.0003.14540.1252.9003.3917.53900.9825
20171.0003.14120.1192.9093.3747.39500.9846
20181.0003.34500.1243.1013.58914.3630.9870
20191.0002.99900.1042.7943.2042.53300.9856
Mean 2.9249
Variance 0.0633
Total1.0002.94420.0402.8663.0220.65980.9972
Disclaimer/Publisher’s Note: The statements, opinions and data contained in all publications are solely those of the individual author(s) and contributor(s) and not of MDPI and/or the editor(s). MDPI and/or the editor(s) disclaim responsibility for any injury to people or property resulting from any ideas, methods, instructions or products referred to in the content.

