5.1. Low Image Classification Accuracy
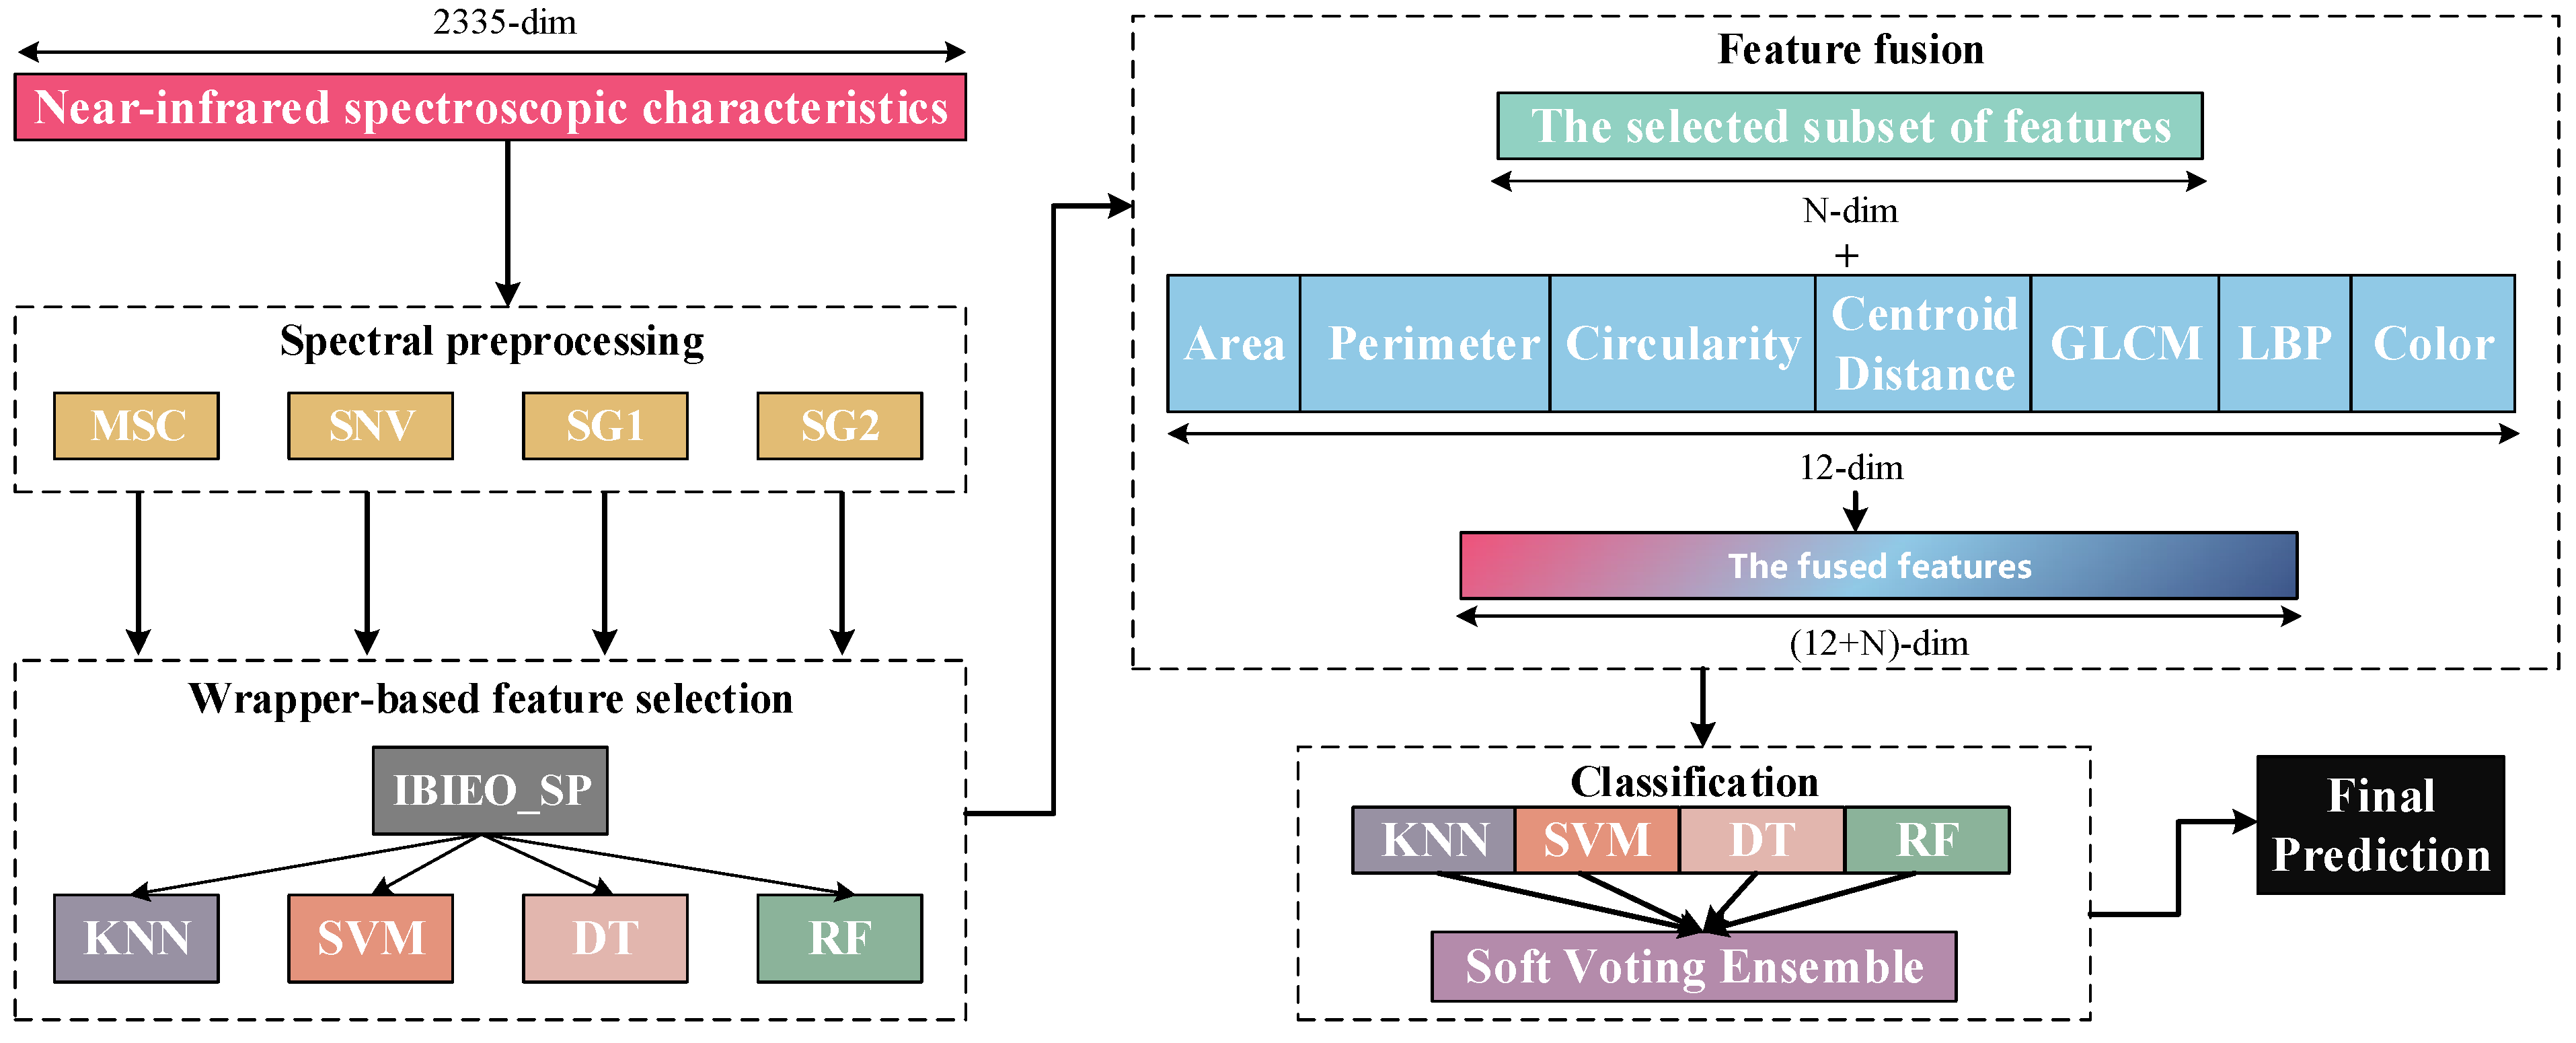
In terms of classification performance of image features, experimental results demonstrate that traditional machine learning models (e.g., random forest) achieved only approximately 50% classification accuracy when using image features alone, significantly lower than the performance of fused-feature models. The primary reasons for this outcome can be analyzed from the following perspectives:
Firstly, the inherent low dimensionality of image features (12 dimensions total), although covering geometric shape characteristics (area, perimeter, and circularity), texture features (GLCM and LBP), and color attributes, results in a sparse overall feature space. This insufficiently captures fine-grained differences in pine nut micro-morphology and surface textures, limiting the model’s ability to establish discriminative boundaries between categories. Secondly, the image dataset exhibits certain class imbalance issues, compounded by subtle visual distinctions between some categories, which increases the difficulty of discrimination. Although training set balance was controlled through repeated sampling in experimental design, the limited original image quantity impedes the model from learning stable and representative discriminative patterns.
Our related work [
10] previously attempted to employ convolutional neural networks (CNNs) like EfficientNet for end-to-end image modeling. However, without data augmentation or sample size expansion, the model accuracy improvements remained constrained. This further confirms that image feature representation reaches inherent limitations under current experimental conditions, proving inadequate to independently support high-precision classification. Consequently, this study adopts feature-level fusion of image features with spectral characteristics to leverage complementary advantages of multi-source information and enhance overall model discrimination. Subsequent work will explore strategies including transfer learning, data augmentation, synthetic image generation (e.g., CutMix, GAN-based synthesis) to enrich image sample diversity. Concurrently, deeper semantic feature extraction through advanced vision backbones (e.g., Vision Transformers/ViT or lightweight CNNs) will be investigated to improve image-side discriminative capability and fusion contribution.
5.2. Robustness and Classification Performance of IBiEO-SP Under Noise Interference
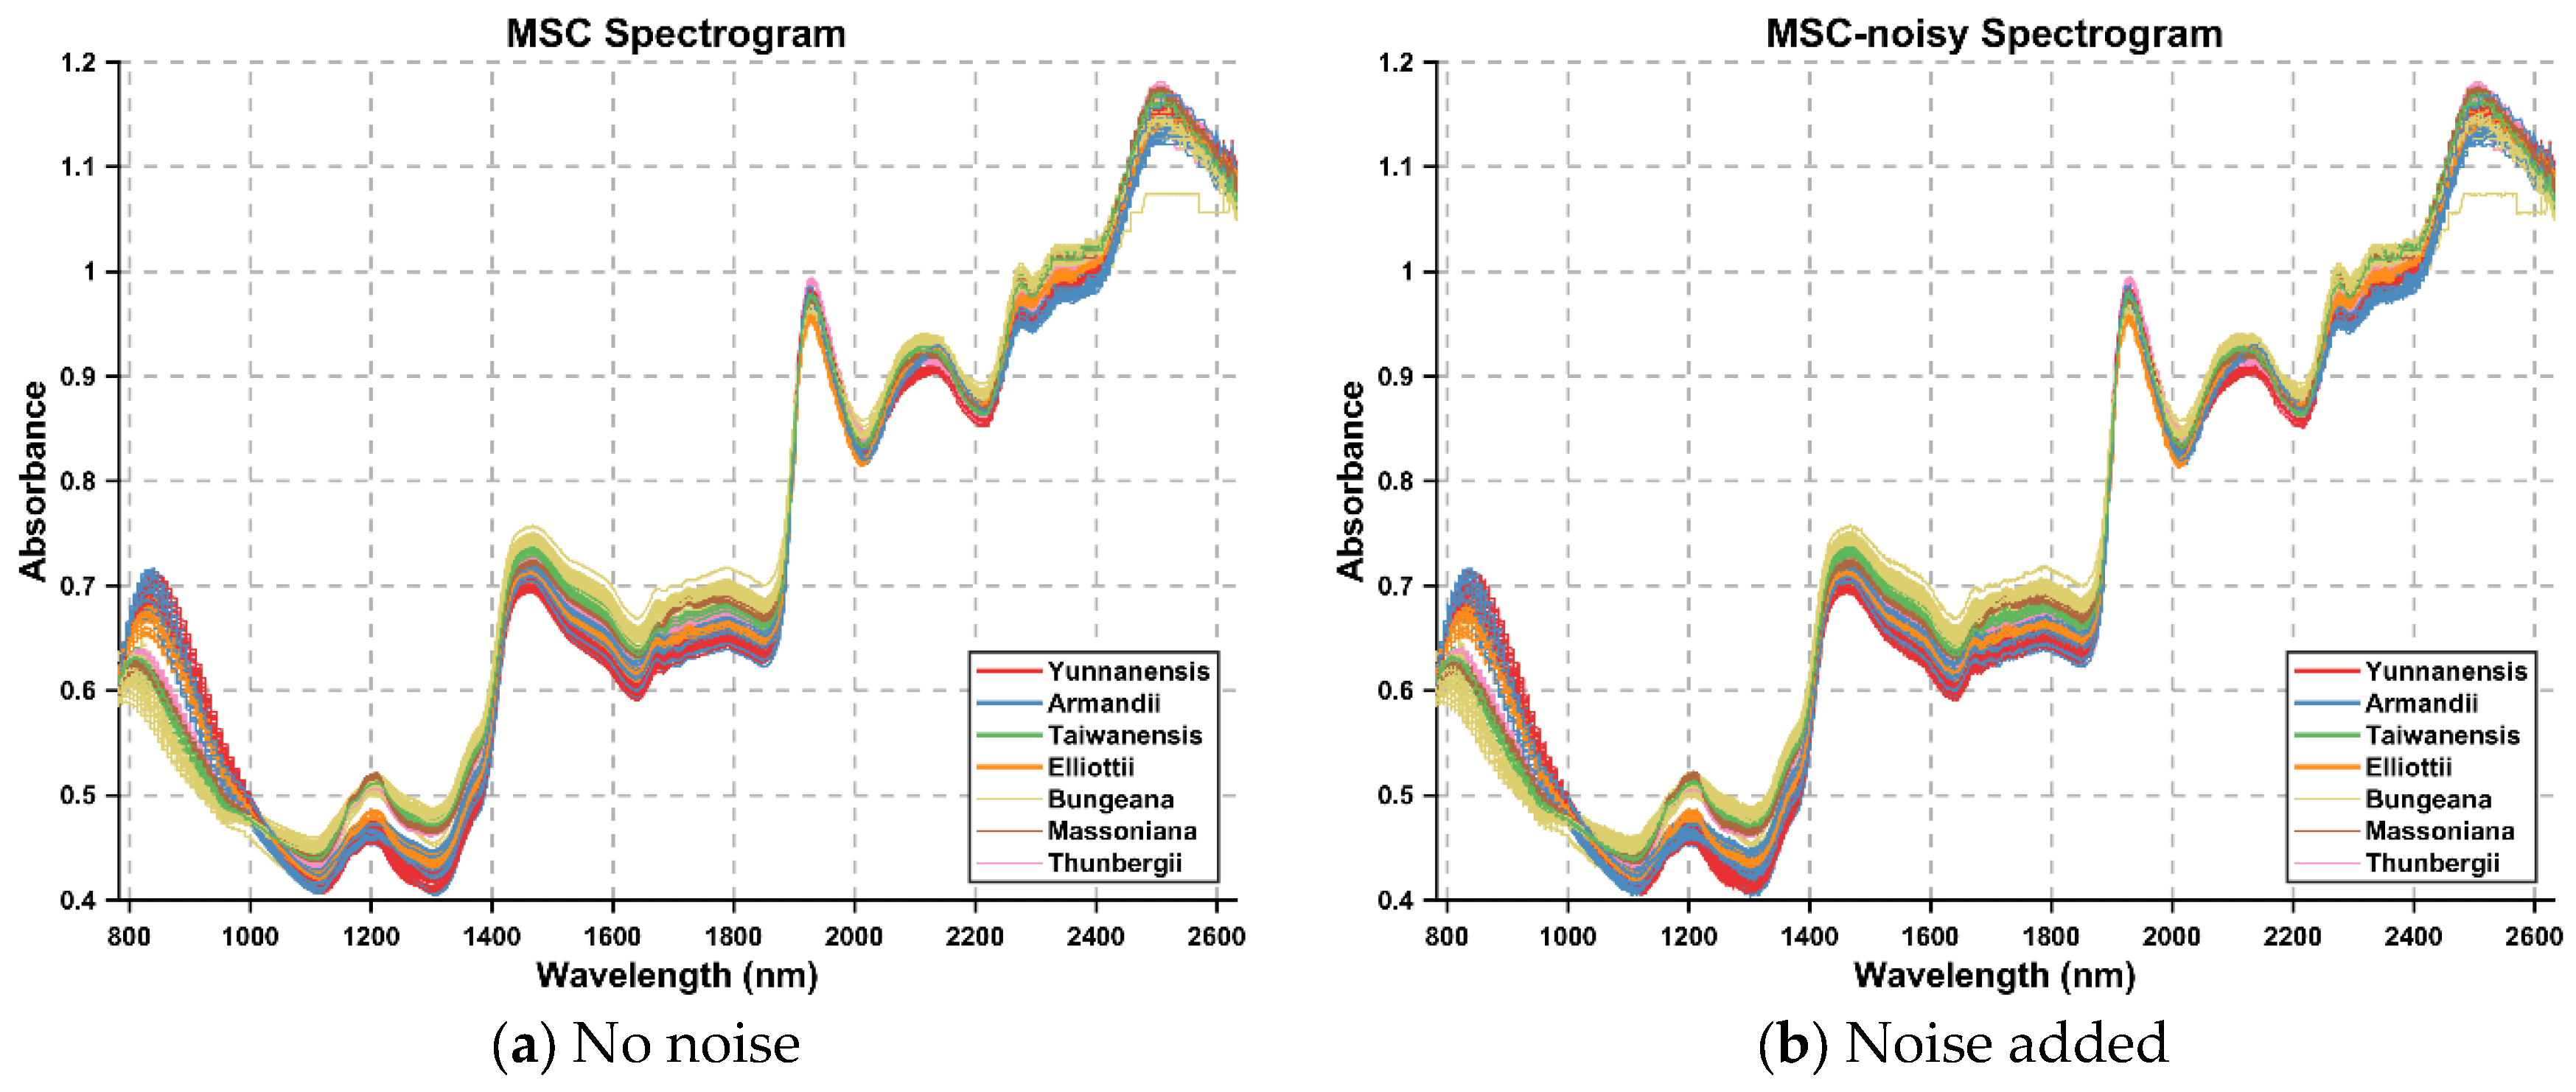
To validate the robustness and classification performance of the proposed IBiEO-SP method under noise interference, we added Gaussian noise with a 1% amplitude to the original data and evaluated the performance using four classifiers—KNN, DT, RF, and SVM—with consistent parameters. The experimental results are presented in
Table 7 and
Figure 7.
Overall, IBiEO-SP demonstrated the most robust classification performance among all feature selection methods. It maintained high accuracy (Acc) and F1 scores even with noise-sensitive classifiers like KNN and SVM. For instance, under the SG1 preprocessing method, IBiEO-SP combined with KNN achieved an accuracy of 0.9571 and an F1 score of 0.9577, outperforming EO (0.9476) and GA (0.9524). Similarly, under the SG2 preprocessing method, it maintained leading performance with an accuracy of 0.9571 and an F1 score of 0.9588. In contrast, EO and GA showed greater performance fluctuation with SVM, especially in SG1, where EO combined with SVM achieved only 0.8190 accuracy, while IBiEO-SP reached a baseline accuracy of 0.5143. Although the value was relatively low, the F1 score was slightly higher at 0.5210, indicating IBiEO-SP’s potential to retain classification capability under high noise conditions.
When using more robust classifiers such as decision trees (DTs) and random forests (RFs), IBiEO-SP remained competitive, suggesting that its selected feature subsets are not only stable but also highly adaptable to various classification models. For example, in the MSC subset, IBiEO-SP combined with DT achieved a high accuracy of 0.9857, and it also performed well with RF (0.9190). In the SG2 subset, IBiEO-SP with RF reached 0.9857 accuracy, nearly matching or slightly outperforming GA and PSO. Notably, under Gaussian noise, the number of selected features (SNF) by IBiEO-SP was generally lower than those selected by EO and GA. For instance, under the SG1 preprocessing method, IBiEO-SP with DT selected 27 features, compared to 928 by EO and DT and 1220 by GA and DT. This result indicates that IBiEO-SP can significantly reduce the number of features while maintaining classification performance, effectively lowering computational cost and enhancing model simplicity and interpretability.
Furthermore, IBiEO-SP exhibited good generalization performance across different sub-datasets, with minimal variation between SG1 and SG2, whereas EO and GA showed significant fluctuations across subsets. This highlights the superior robustness and stability of the proposed method.
Despite its strong performance with KNN, DT, and RF, IBiEO-SP showed relatively unstable results with the SVM classifier. Specifically, in the SG1 dataset, IBiEO-SP combined with SVM yielded an accuracy of only 0.5143 and an F1 score of 0.5210, far below EO (Acc = 0.8190) and GA (Acc = 0.8190) in the same group. This suggests that the feature subset selected by IBiEO-SP may present issues such as linear inseparability or blurred boundaries in SVM, affecting overall performance. In the SG2 dataset with RF, GA (Acc = 0.9857, F1 = 0.9908) and PSO (Acc = 0.9857, F1 = 0.9954) performed comparably or slightly better, indicating that under specific problem scales or feature space structures, IBiEO-SP might not fully capture the optimal subset and still has room for further improvement. For example, in the MSC subset, IBiEO-SP combined with SVM achieved an accuracy of 0.8095. Although it outperformed GA (0.9048), the overall F1 score was still inferior to other mainstream methods.
In summary, IBiEO-SP can effectively identify stable and discriminative feature subsets under slight Gaussian noise interference. It balances accuracy, precision, recall, and feature compression rate, demonstrating superior performance across various classifiers. This makes it particularly suitable for noise-sensitive application scenarios.
5.3. Misclassification Analysis
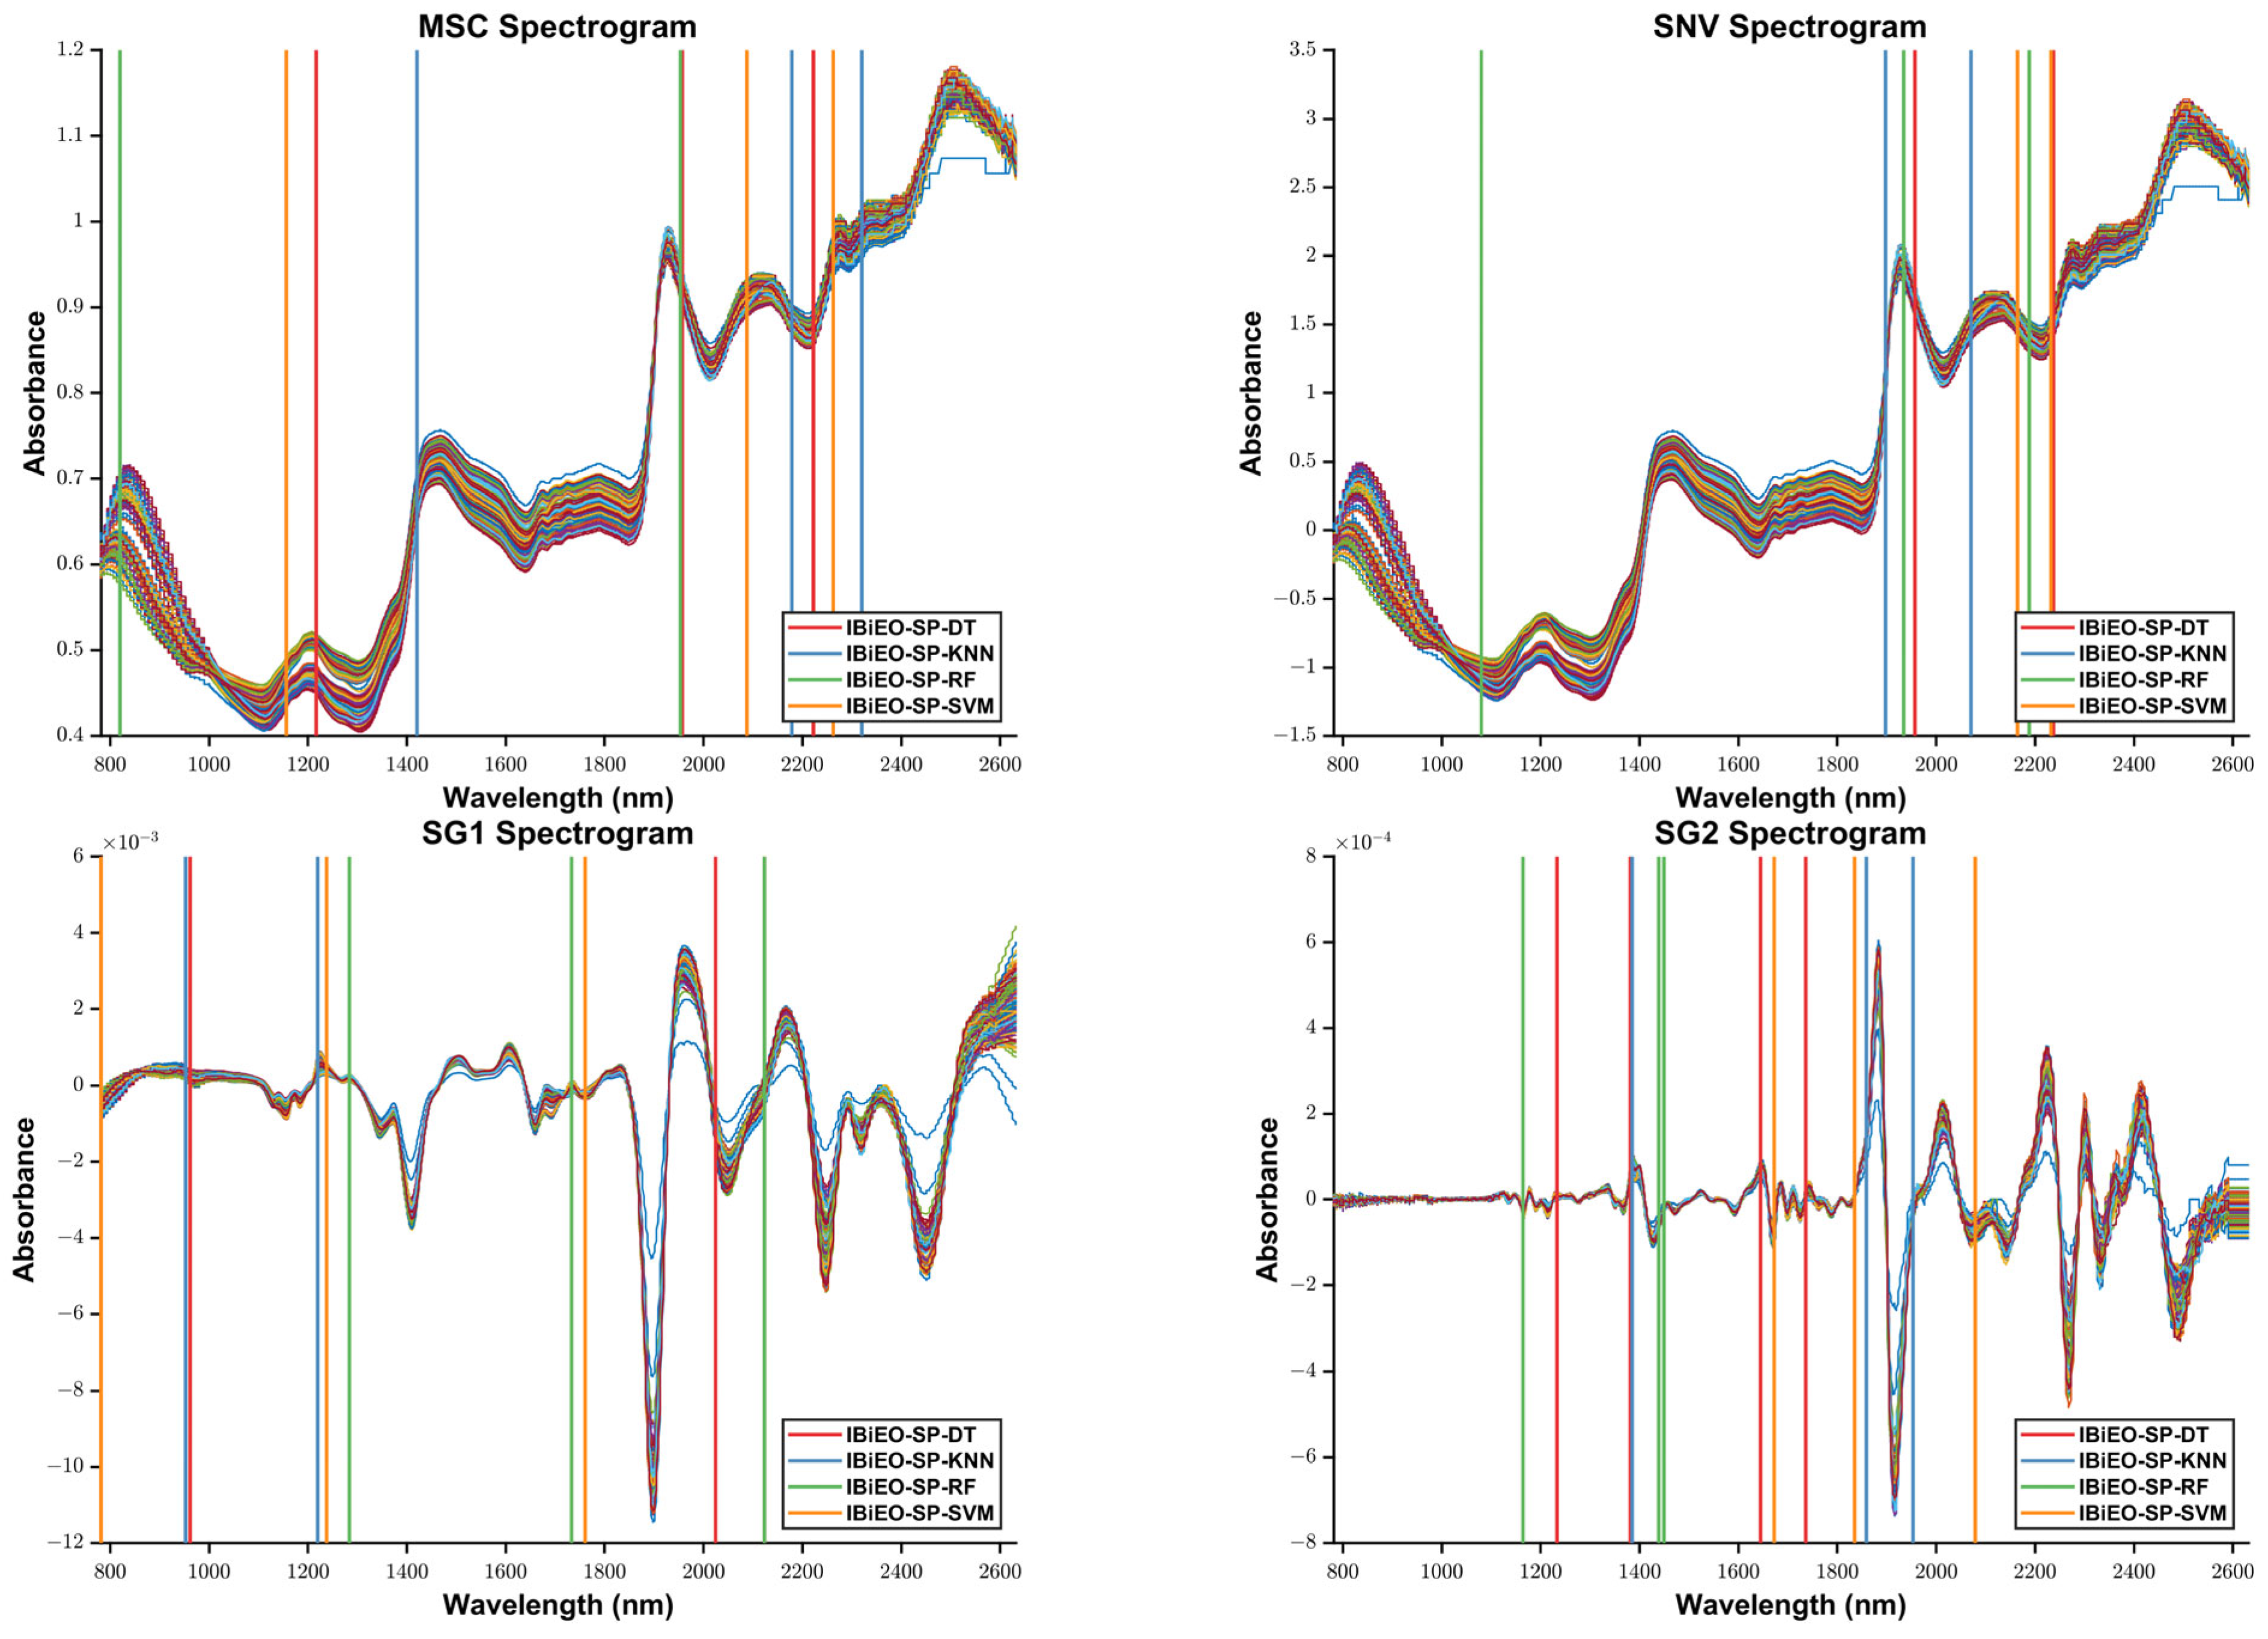
Comparative analysis reveals critical limitations of alternative approaches (as shown in
Figure 8). While EO methods occasionally matched IBiEO-SP’s accuracy (e.g., 99.05% with SNV + KNN), they consistently required more features. The genetic algorithm (GA) exhibited marginal accuracy gains (99.95% with SG1 + RF) only when employing over 1000 features—a 500-fold increase compared to IBiEO-SP’s requirements. Particle swarm optimization (PSO) proved less effective, achieving ≤98.10% accuracy even with 300–400 features. This performance disparity stems from IBiEO-SP’s novel capability to dynamically balance feature importance with classifier demands, effectively resolving the dimensionality paradox that plagues traditional methods. By simultaneously eliminating redundant high-dimensional data while preserving discriminative low-dimensional features, the algorithm establishes a new benchmark for precision–efficiency trade-offs in feature selection tasks.
To further evaluate the classification performance of the IBiEO-SP feature selection method combined with the decision tree (DT) classifier on the SNV dataset, the corresponding confusion matrix was plotted, as shown in the
Figure 9. In the confusion matrix, the diagonal elements represent correctly classified samples, while the off-diagonal elements indicate misclassifications. The dataset includes seven Pinus species, with 30 samples per class. The results demonstrate that the model achieved satisfactory classification performance across most categories. Specifically, p.elliottii and p.taiwanensis were classified with 100% accuracy, showing the best performance. p.massoniana and p.thunbergii each had one sample misclassified, resulting in an accuracy of 96.7%. The classification accuracies for p.armandii and p.bungeana were 93.3% and 90%, respectively, with most misclassifications occurring between these two species, indicating a certain degree of similarity in the feature space. p.yunnanensis was misclassified once each as p.elliottii and p.thunbergii, also yielding an accuracy of 93.3%. Overall, although IBiEO-SP selected only two optimal features for modeling, it achieved a high average classification accuracy of 97.14%, demonstrating its strong discriminative power. The decision tree classifier maintained robust performance despite the low feature dimensionality. Misclassifications mainly occurred among closely related species with similar morphological or spectral characteristics. Future improvements could involve incorporating additional data types, such as texture features or multimodal information, to further enhance classification accuracy.

