Abstract
This study addresses the problem of locating urban green spaces. Public health policies encompass a set of activities aimed at protecting individuals’ physical integrity and well-being, where prevention plays a critical role at both individual and collective levels. Having green spaces in urban areas is essential for providing mental relaxation, stimulating social cohesion and supporting physical activity. However, deciding where to place these green spaces is challenging, as various types of information must be considered, and the impact of such decisions needs thorough evaluation and visualization. To tackle this issue, we propose a methodology that combines mathematical programming with Geographic Information Systems (GIS). GIS tools are crucial for capturing and incorporating real-world data, which supports the mathematical model and helps visualize solutions. Our proposed multi-objective model aims to maximize coverage and equity. We demonstrate the application of this methodology with a case study focused on Valencia, Spain, where 20 potential locations were identified, and five were selected.
MSC:
90C29
1. Introduction
In recent decades, urban population has undergone unprecedented growth. However, insufficient urban planning has often resulted in the development of slums and inadequate basic services, as well as increased vulnerability to natural disasters. Cities, despite occupying only 3% of the Earth’s surface, are responsible for an astonishing 75% of global carbon emissions [1]. According to the global data and business intelligence platform, since 1990, and over the past few decades, global emissions have increased by more than 60% [2]. Moreover, gray infrastructure, characterized by concrete and asphalt with minimal biodiversity, turns cities into ecosystems in a constant imbalance. These challenges are among the driving forces behind the introduction of Goal 11 in the 2030 Agenda: to make cities more inclusive, safe, resilient and sustainable.
Arcadis [3] employs various metrics to classify cities, which are organized into four foundational “Pillars of Sustainability”:
- Planet Pillar: This pillar captures key environmental factors, including energy consumption, air pollution, the availability of green spaces and waste management.
- People Pillar: This measures various aspects of quality of life, such as health, access to education, crime rates, economic inequality, access to public transportation and the availability of Wi-Fi.
- Profit Pillar: This pillar assesses the business environment and economic performance, including the ease of doing business, business network development and employment opportunities.
- Progress Pillar: This measures sustainable progress through key indicators derived from the Planet, People and Profit pillars, which are monitored over a 10-year span.
The first pillar, environmental sustainability, is the most critical, as it forms the foundation for all other sustainability efforts. Protecting the environment is essential for the prosperity of both communities and businesses. The range of actions taken to safeguard a city’s environment is broad, including promoting sustainable transportation through mobility management and adopting circular economy practices for waste management. However, one action stands out for its multifaceted benefits: the protection and/or creation of urban green spaces.
The presence of green spaces in cities is not just beneficial; it is necessary to foster healthier communities. Vegetation plays a crucial role in filtering and reducing air pollution. Studies [4,5] indicate that vegetation helps lower pollutant concentrations in the air and acts as a barrier to their passage. The study by [6] demonstrates the importance of preserving a peri-urban evergreen broadleaf forest to reduce the risk of tropospheric ozone () effects on human health, not only within its own area but also in surrounding regions. Green areas are essential for maintaining natural resources, such as water and food supplies, regulating temperature, reducing the risk of natural disasters and providing healthy urban living spaces [7]. Expanding green spaces in urban areas helps maintain thermal balance, contributing to sustainability by reducing energy consumption [8]. The natural environment not only benefits physical health, by potentially reducing mortality rates [9,10], but also lessens noise pollution, reduces stress, improves emotional well-being and aids in restoring attention and concentration levels [11,12,13]. The conservation of urban green areas yields several favorable benefits, such as improved mental health, better pregnancy outcomes and lower rates of cardiovascular issues, obesity and diabetes [14]. Green environments promote social interaction [15,16,17] and create more appealing spaces that can attract tourists. Notable examples include the Green Roof in Chicago, the CaixaForum Entrance in Madrid and the Vertical Gardens in Mexico City. Cities serve as vast habitats where humans and millions of other species coexist. Biodiversity is essential not only for the well-being of human society, but also to ensure that the planet continues to function as it should. Urban green areas contribute to biodiversity by providing habitats and connecting ecological networks within and beyond city limits [7,18].
One significant area of research, particularly prominent due to the advances in GIS, is the accessibility to urban green areas. Wolch et al. [19] and Ekkel & de Vries [20] present comprehensive reviews of studies related to the accessibility and benefits of urban green spaces. Beyond just proximity to green areas, various studies focus on assessing accessibility [21,22,23] and visitor preferences [24]. The optimization of urban green area locations has not been as extensively studied as other aspects, though recent years have seen increasing interest. Typically, the governance of these areas falls under urban planning, which includes initiatives such as alley greening projects [25], small town improvement efforts [26] and larger urban area reorganization projects [27]. Green et al. [28] identify several complicating factors—such as limited budgets and uncertainty about social and economic conditions—that need consideration when managing a city’s green resources and modeling these challenges.
Optimization problems in urban planning are generally addressed using multi-objective mathematical modeling. Nyelele and Kroll [29] present 14 tree-planting scenarios combining objectives such as minimizing planting costs, maximizing ecosystem service benefits and maximizing canopy cover equity. Wicki et al. [30] introduce a model aimed at minimizing the loss of ecosystem services while maximizing urban density. Liu et al. [31] focus on minimizing carbon emissions, reducing costs and maximizing hydrological benefits in the planning of newly developed urban areas.
In the field of green space planning, Zucca et al. [32] explore the optimal location for a local park, focusing on two key objectives: the protection of valuable areas and the restoration of degraded urban zones. The authors utilize spatial multi-criteria evaluation techniques aided by a specific GIS module, though they do not propose a mathematical programming model.
The authors of [33] apply a genetic algorithm to determine the optimal locations for urban parks, addressing four key objectives, minimizing the distances to highly populated areas, areas with high air pollution, noisy areas and regions without green spaces. The model is implemented in four distinct ways: (1) optimizing single objectives, (2) optimizing multiple objectives without using a weight vector, (3) optimizing multiple objectives with a priority weight vector and (4) optimizing multiple objectives with a dynamic weight vector. While a GIS is employed to visualize the results, the elaboration of alternatives (possible park locations) is not detailed. Similarly, Vallejo et al. [34] utilize genetic algorithms to ascertain the long-term placement of parks, catering for both current and future population needs.
In the study by [35], a multi-objective model is developed to select available plots for neighborhood park locations. This model aims to optimize six objectives simultaneously, maximizing geographic coverage, the proximity externality index, the number of beneficiaries, the accessibility index and the connectivity index, while minimizing total economic costs. A priori lexicographic ordering of decision criteria is applied. Similar to the approach in [33], the potential locations for the parks, or the set of alternatives, are predefined.
The work of [36] introduces a spatial optimization method for urban green areas using a heuristic approach. The algorithm’s inputs include current urban green space plots, building plots, population data for each residential community, parameters for per capita green space, equity constraints and the cost of converting building plots into green areas. The output is an optimal green space layout that minimizes conversion costs while adhering to spatial equity and per capita green area constraints. As in previous studies, the potential locations for green areas are predefined in the problem.
In most of the studies described, the focus is on the mathematical modeling of problems and their solutions, with model inputs assumed to be given. However, in many real-world scenarios, essential information for modeling is not readily available, necessitating the development of methodologies to acquire it. Another important aspect to highlight is the limited emphasis on equity in the location of urban green areas. While economic, ecological and coverage-related factors are often considered, it is crucial to recognize that people in less populated areas also deserve access to the benefits of green spaces.
To address these limitations, this article proposes a methodology for locating urban green areas by combining Operations Research techniques with GIS in an interdisciplinary approach. The proposed multi-objective mathematical model considers both coverage and equity. Before presenting the methodology, it is essential to introduce some theoretical concepts.
Deciding where to establish new green areas within a city’s urban planning framework is a complex strategic task that requires thorough analysis of diverse information. This decision is shaped by various factors, including climatic, topographical, architectural and legislative characteristics, all of which vary significantly from city to city. This article introduces a novel methodology that combines Operational Research (OR) techniques with Geographic Information System (GIS) tools, proposing a multi-objective model to optimize the location of urban green spaces. GIS tools play a crucial role in capturing and incorporating real-world data, which is key for informing the mathematical model and visualizing solutions. To illustrate its effectiveness, the methodology is applied to the Spanish city of Valencia. Notably, the proposed methodology is adaptable to any urban setting, nationally or internationally, and it can assist in the decision-making process for locating a variety of services.
In addition to this introductory section, Section 2 provides an overview of the background necessary to understand the context, while Section 3 outlines the details of the proposed methodology. Section 4 presents the mathematical model. Section 5 demonstrates the tool’s operation through its application to a European city. We conclude with Section 6, which is dedicated to our discussion and conclusions.
2. Background
While the European Union has directives for certain aspects of nature protection, such as the Birds Directive and the Water Framework Directive, each area’s particular characteristics often mean that legislation for protecting green infrastructure remains national or subnational. In this sense, Order PCM/735/2021, dated July 9, approves Spain’s National Strategy for Green Infrastructure and Ecological Connectivity and Restoration [37]. A primary objective of this strategy is to identify and connect key spaces in each municipality while proposing suitable improvements.
Some countries, such as Germany, the Netherlands and the United Kingdom, have developed standards for a minimum green area per capita. For example, in England, there are several recommended indicators [38]: An area of at least 2 hectares should be accessible within a 5 min walk, a space of at least 20 hectares within a 2 km distance, a space of 100 hectares within a 5 km distance and a space of 500 hectares within a 10 km distance; and there should be a minimum of 1 hectare of statutory Local Nature Reserves per 1000 inhabitants.
Following these recommendations, public administrations must decide where to locate green areas. Ideally, every city resident would have access to green space within minutes. However, this is rarely feasible and requires decisions based on various criteria. The challenge lies in the fact that decision-making criteria can often contradict each other. For instance, selecting locations based on population density ensures more people have green areas nearby. However, equity requires balancing this by ensuring all neighborhoods, regardless of population size, have access to green spaces, as public goods should be available to all citizens equally. Additional criteria include budget constraints [35], neighborhood pollution levels [33] and technical capacity, etc. Therefore, the task of locating urban green areas becomes a multi-objective problem, requiring the careful consideration of various, often competing, factors.
2.1. Definition of the Elements of Urban Green Areas
The elements of the green areas of any city can be classified into the following categories [7]:
- Large parks and gardens serve as major green spaces accessible to all residents, extending their significance beyond individual neighborhoods. Due to their size and complexity, these green areas provide a wide array of ecosystem services to the city.
- Neighborhood parks, ranging in size from 1000 to 15,000 (data for Valencia), are designed primarily for use by local residents. Unlike other smaller garden areas, neighborhood parks are distinguished by their ability to provide specific amenities and services. These often include children’s play areas, sports fields and spaces reflecting historical or cultural significance.
- Green areas and gardens with public facilities that are not permanently accessible, such as university or school green areas, cultural facilities or cemeteries.
- Landscaped boulevards, promenades and avenues are key green corridors that connect roads of municipal importance. These spaces are vital for integrating the green infrastructure across a city, enhancing connectivity between various green areas.
2.2. Definition of Coverage
In the context of sustainable city development, prioritizing pedestrian access to urban parks or gardens, particularly neighborhood parks, is a logical step. GIS offers powerful tools to calculate distances and identify areas accessible within a specified time frame. One such tool, an isochrone, represents a set of points accessible from a given location within a certain time using a particular mode of transport. Figure 1 illustrates examples of isochrones for travel times of 5 and 10 min using various transportation methods. It is important to note that isochrone calculations rely on average speeds for walking or cycling and the maximum permitted speed for driving.
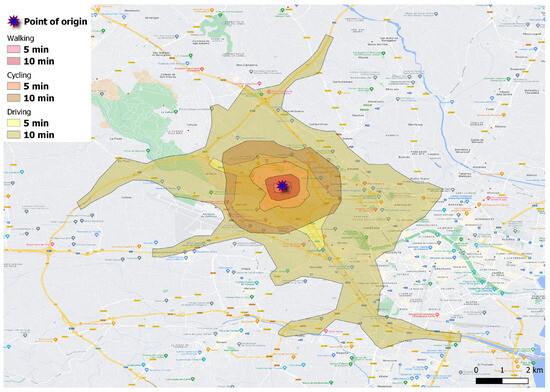
Figure 1.
Example of isochrones.
One significant advantage of isochrones is their ability to reveal the population covered within their boundaries. In the context of car travel, isochrone coverage is unidirectional. A point at the edge of the area can be reached from the isochrone’s center within a given time, but returning to the center might take longer due to one-way streets. Conversely, for pedestrians, there are no such directional restrictions. This means if a point can be reached from the isochrone’s origin in 5 min, the reverse journey also takes 5 min. Thus, all individuals residing within the isochrone area are considered to have coverage, implying they have convenient access to a green space within the specified time radius.
Ideally, a city’s entire population would enjoy access to a green space just a few minutes from their homes, achieving full coverage. However, this goal is not always feasible. Usually, the approach involves selecting the most suitable sites from an array of potential locations, guided by specific criteria.
2.3. Determining Location Criteria
This article considers the following criteria:
- Coverage: Population distribution in a territory is not usually homogeneous; some areas are more densely populated than others. Locating a green space in an area with high population density ensures that more people can access it, thus achieving greater coverage.
- Equity: Economic circumstances, employment or personal preferences may lead individuals to choose less densely populated areas as their residences. These residents should also have access to green spaces near their homes.
These criteria are inherently contradictory. Solutions based on the coverage prioritize access for more individuals, whereas those based on the equity focus on ensuring equitable access, regardless of population density. These criteria serve as distinct objectives within the upcoming mathematical model, each representing different priorities for optimization.
3. Proposed Methodology
This paper introduces an innovative methodology for tackling the complex challenge of locating green areas comprehensively. The methodology comprises a sequence of steps, illustrated in Figure 2.
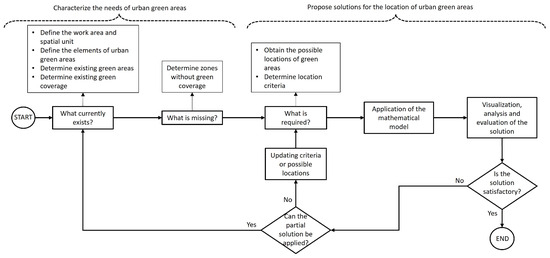
Figure 2.
Tool diagram.
Similar to many real-world challenges, the essential information required to successfully locate a green area is often incomplete. Thus, the first phase involves a detailed characterization of needs, which entails analyzing the current situation and identifying gaps. To identify the need for urban green areas (top left of Figure 2), the following steps are proposed:
- Analyze the existing green coverage.
- –
- Define the work area and spatial unit.
- –
- Define the elements of urban green areas.
- –
- Determine the existing green areas in the city.
- –
- Determine the coverage.
- Identify the area without green coverage.
Once the area without green coverage has been determined, the resolution phase (top right of the Figure 2) begins. The core of this phase is an integer linear programming mathematical model, which requires the prior acquisition of a series of input data and the subsequent evaluation of the solutions. There is no single optimal solution for the location of green areas as different selection criteria may exist. Therefore, before applying a mathematical model, the following points must be resolved:
- Determine the inputs for the mathematical model.
- –
- Obtain the possible locations for the green areas.
- –
- Determine the location criteria.
Alternative options to traditional parks, such as vertical gardens, can reduce technical restrictions when selecting potential sites for green spaces. Despite this flexibility, determining a suitable set of locations for green areas is complex due to combinatorial possibilities—the vast number of potential configurations. Fortunately, GIS offers powerful tools that can simplify this task, enabling detailed analysis and the identification of optimal solutions.
The strategic nature of creating urban green spaces, which cannot be easily altered once established, necessitates a thorough validation of solutions before real-world implementation. Visualization and solution analysis are critical components of the entire process, as they play a decisive role in its successful completion. If the evaluation results are unsatisfactory, the process must continue (bottom right of the Figure 2), potentially altering location criteria or even restarting from the beginning. This flexibility ensures that the final solutions are well-suited to the specific context.
In Section 5, we will demonstrate a practical application of the proposed methodology.
4. Mathematical Model and Solution Method
4.1. Mathematical Model
To define the mathematical model, the notation in Table 1 is used.

Table 1.
Notation.
The set M represents all potential locations for a green zone. We also define the set B as the collection of different neighborhoods into which our geographic unit is divided. Each location within M is associated with a neighborhood. Thus, M can be expressed as a union of subsets (), where each subset contains locations that belong to neighborhood . Each possible location has an associated covered population , which can access the green zone located in i in a given time t. Each possible location also has an associated minimum distance to an existing green zone.
The model is expressed as follows. We define the variable , which takes the value 1 if there is a green zone at location and the value 0 otherwise. Additionally, the binary variable is introduced, which takes the value 1 if there is a green zone at location and at location and the value 0 otherwise.
Objective 1: Maximize coverage. In other words, maximize the number of people who can reach a green zone on foot within a given time.
Objective 2: Maximize the minimum distance from potential locations and existing green spaces. That is, we will try to locate green spaces in zones that are furthest from existing green spaces.
The set of restrictions is common to both objectives:
The restriction in Equation (3) imposes a limit on the total number of possible locations. It is necessary to select areas for green spaces, as this task is difficult and expensive and cannot be performed in all possible locations. The restriction in Equation (4) prevents there being more than one green zone per neighborhood. The restrictions in Equations (5) and (6) control the minimum distance between each pair of new green zones. The restriction in Equation (6) activates the additional binary variable when green zones are located at both i and k. Meanwhile, the restriction in Equation (5) ensures that the distance between two new green zone locations is not less than a predetermined limit. The final restrictions in Equations (7) and (8) require that the decision variables be binary.
4.2. Solution Method
As previously mentioned, the proposed objectives conflict, so they cannot be achieved simultaneously. The options are either to cover the majority of the population or to place the green areas further from the current ones. Therefore, multi-objective modeling is proposed to consider both objectives. Among various approaches to multi-objective linear programming, this paper utilizes goal programming, which, according to Eiselt and Sandblom [39], “blurs the distinction between goals and constraints”. The lexicographic method was selected to order objectives based on the decision-maker’s priorities. Initially, the model optimizes the primary objective, then moves on to the secondary objective, using the solution of the primary as a constraint. In this method, each objective may be worsened by at most % while optimizing the remaining objectives [35].
Following the lexicographic approach, if maximizing coverage is considered the most important (Objective 1), we first determine the optimal value () for the objective function . Next, the secondary objective is to maximize the minimum distance from potential locations to existing green spaces. This is achieved by solving a second model, which includes an added constraint that mirrors the value obtained for .
The following section presents the computational experiments and results of the application of the proposed mathematical model.
5. Computational Experiments
To demonstrate the application of the proposed methodology, we present a real-life case study of the city of Valencia, Spain. To carry out the experiments, QGIS 3.22, an open source GIS [40], was used. All maps presented in the article are original creations developed using QGIS. The calculation of isochrones is performed using the Openrouteservice plugin [41]. The administrative boundaries map of Valencia was obtained using the QGIS Download OpenStreetMap plugin. To solve the mathematical model, Gurobi Optimizer (10.0.0) was used with the Jupyter interface (Python 3.7.) on Intel Core i7, 3.2 GHz and 8 GB RAM. Since the lexicographic method allows the initial model to be reformulated, by introducing one of the objectives as a restriction, the resulting model can be solved in an optimal way.
5.1. Analysis of Existing Green Coverage
- Definition of the work area and the spatial unit.The city of Valencia (Figure 3a) covers an area of 13,465 hectares and has a total population of 797,665 people, as of 2024, distributed across 19 neighborhoods. However, this study focuses only on the central area of Valencia, comprising 17 neighborhoods (Figure 3b). The excluded neighborhoods are of a mixed urban and rural nature. For greater precision, we selected only the populated areas using the land use map [42], including continuous urban network, discontinuous urban network, industrial, sports and commercial areas.
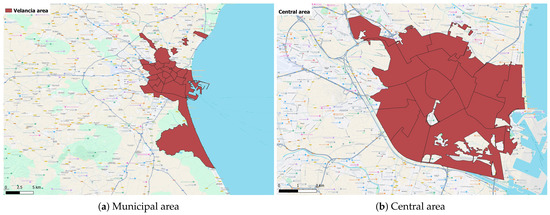 Figure 3. Valencia area.
 - Determination of the elements of urban green areas.This work focuses on the first two groups described in Section 2.1: large parks and gardens and neighborhood parks. Green areas and gardens with public facilities are not permanently accessible, and their regular use is quite restricted. Similarly, landscaped walkways or avenues serve as transit areas rather than spaces for recreational use.
- Determination of existing green areas in the city.The city of Valencia is committed to the 2030 Agenda. The Valencia City Council has launched various projects to honor this commitment, including Missions Valencia 2030 [43], which aims to make Valencia a climate-neutral city by 2030. Additionally, an important initiative called the Green Plan [7] is being developed. This strategic document aims to enhance the management of the municipal green infrastructure.For this work, the map of urban green areas in Valencia has been generated, based on the data provided by the Geoportal [44]. Figure 4 illustrates the location of Valencia’s existing urban green areas. Notably, a green strip, known as the Turia Garden (formerly a riverbed), traverses the entire city and is divided into several sections due to its size. This study focuses on 22 large parks and gardens as well as 31 neighborhood parks, with these green spaces covering a total area of 2,664,360 .
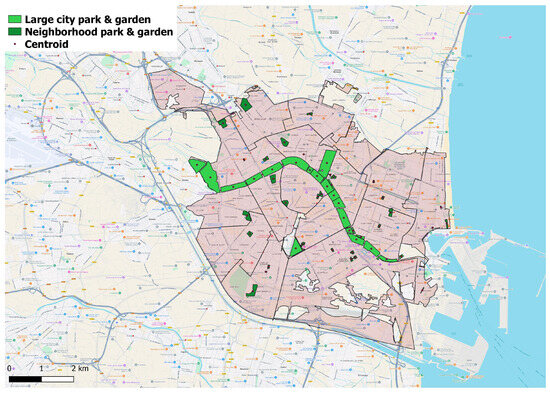 Figure 4. Urban green areas in the city of Valencia.
 - Determination of existing green coverage.An important aspect to consider when discussing spatial objects, such as parks, is their geometry. While isochrone calculations typically start with a point of origin, parks are better represented as polygons rather than single points. To address this, the polygon must be converted into a point for isochrone calculations. In this analysis, we use the centroid of the polygon, effectively the center of the green area, as this is a common practice in the scientific community [23,35].To determine the current coverage, the parameters for calculating isochrones must be established. It is assumed that residents travel on foot. Due to the smaller size of neighborhood green areas, a 5-min isochrone—a commonly accepted time—is used. For large parks and gardens, the isochrone time is extended to 10 min, as these parks typically offer a greater number of recreational amenities, therefore encouraging people to travel further. The result is shown in Figure 5a. Joining all the isochrones gives the current green coverage, i.e., the areas that have access to a green space within a maximum of 10 min’ walk (see Figure 5b).
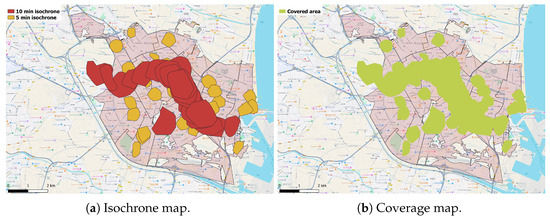 Figure 5. Existing coverage.
5.2. Obtaining the Areas Without Green Coverage
After determining the covered area, the uncovered regions within a maximum of a 10 min walk from a park or garden are extracted, highlighting potential locations for new green spaces. This extraction uses QGIS geoprocessing algorithms and is illustrated in Figure 6. Importantly, while 17 territorial units remain, we now focus on areas lacking green coverage within these neighborhoods. An estimated 316,000 residents must walk over 10 min to reach a green area, underscoring the need for additional green spaces.
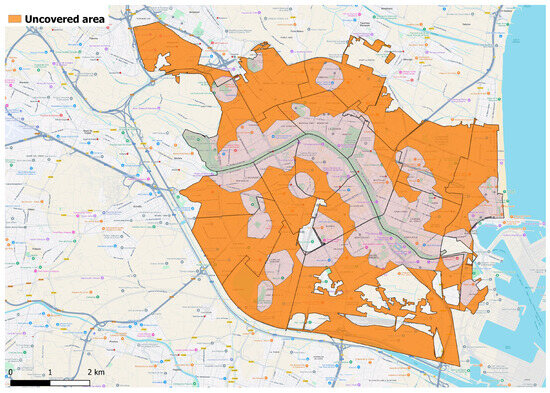
Figure 6.
Zones without green coverage.
5.3. Determination of the Inputs for the Mathematical Model
- Obtaining the possible locations for green areas.To identify potential locations for green spaces within uncovered areas, QGIS provides several useful algorithms. Points can be evenly or variably generated for each neighborhood, either randomly or deterministically. For this analysis, 20 points were randomly generated, guaranteeing at least one location per neighborhood. Three neighborhoods with the most significant uncovered areas received two locations each. Figure 7 shows the 20 possible locations for the green zones.
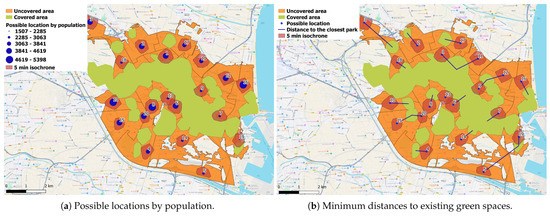 Figure 7. Possible locations of green spaces.
 - Description of the location criteria.
- –
- Coverage.For each of the 20 proposed points, a 5 min walk isochrone is calculated to determine the marginal covered population (), representing individuals who would gain access to green space. This population occurs where the isochrone overlaps with the orange, uncovered area, excluding overlaps with already covered green areas. Using geoprocessing algorithms and the raster layer (pixel image) of population density in the Global Human Settlement Layer [45], we calculate marginal coverage for all proposed locations. This layer was chosen because its population estimate showed a lower deviation from the resident population data for 266 municipalities in the Province of Valencia, as provided by the National Institute of Statistics [46]. In Figure 7a, the size of the points has been represented by the marginal population. The best locations are those that provide the greatest marginal coverage. While selecting these locations may seem straightforward, even with an extensive set of 100, the process becomes intricate when adhering to constraints. For instance, proximity restrictions prevent choosing nearby points, such as points 6 and 13 in Figure 7a. The complexity of selection further escalates with the introduction of additional necessary restrictions.
- –
- Equity.This criterion favors neighborhoods farther from existing green spaces, promoting equitable access. Figure 7b illustrates the Euclidean distances from each of the 20 points to the nearest green space. Variations in blue line lengths highlight these differences. Good solutions increase the minimum distance to existing green spaces. Although Euclidean distances serve for visual purposes here, true optimization relies on real distances obtained using the QGIS Openrouteservice plugin.
5.4. Application of the Mathematical Model
The parameters for the model are shown in Table 2.

Table 2.
Parameters.
Parameters are carefully selected considering real-world data and practical wisdom. Twenty possible locations were chosen based on utilitarian criteria. Visualizing solutions is essential, with too many locations complicating the process. Due to high implementation costs, the number of green areas is intentionally kept low and should be determined by decision-makers; here, an arbitrary number of five was selected. The number of neighborhoods corresponds to the 17 previously mentioned in the city of Valencia. Following the equity criterion, a minimum distance of 1000 m between green area locations has been established, equating to approximately a 10–15 min walk. This ensures that two green areas, though in different neighborhoods, are not located too close to each other. Finally, an alpha of five percent was selected, which we consider relatively small to permit maximum deterioration of the objective function value.
We aim to achieve two objectives: maximize coverage and enhance equity by maximizing the minimum distance between potential locations and existing green zones. To assess these objectives, a payoff matrix is constructed. This square matrix aligns with the number of goals, with diagonal entries reflecting each individually optimized objective and other cells showing the resulting values from each optimized solution. Table 3 illustrates this matrix, facilitating a comparison of trade-offs between the objectives. Achieving the two optimal values on the diagonal of the table simultaneously is not feasible. Thus, we employ the lexicographic method, which allows each objective to degrade by up to five percent while optimizing the other objectives.

Table 3.
Payoff matrix.
If objective 1 is prioritized, the model to be solved is as follows: Maximize the minimum distance from the possible locations, subject to all the restrictions defined in Section 4, plus the restriction
If objective 2 is prioritized, the model to be solved is as follows: Maximize coverage, subject to all the restrictions defined in Section 4, plus the restriction
5.5. Visualization, Analysis and Evaluation of the Solution
Table 4 shows the results for the four models obtained.

Table 4.
Model Results.
In the coverage-maximizing model (Figure 8a), an optimal solution covers 24,526 people by targeting the most populated areas, though this reduces equity, achieving a distance of 7283 m to existing green spaces, or 76% of the maximum possible distance. In contrast, the equity-maximizing model (Figure 8b) aims to maximize the minimum distance to existing green areas, resulting in a distance of 9593 m. This strategy favors the selection of the most remote locations, achieving 83% of the maximum potential coverage.
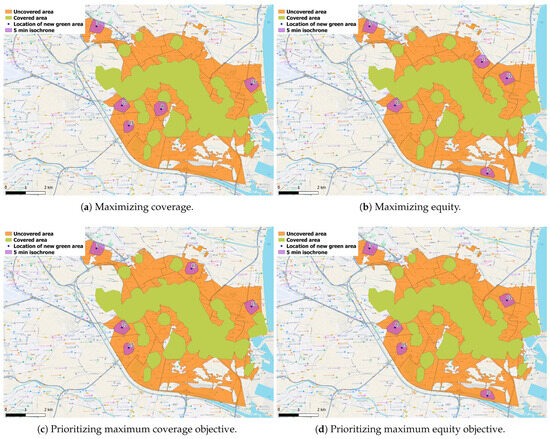
Figure 8.
Solutions for individual models (a,b) and multi-objective models (c,d).
In the solution that prioritizes coverage (Figure 8c), achieving 100% for each objective is not feasible, yet good equity values (78%) are maintained by slightly reducing coverage to 97%. In contrast, prioritizing equity yields another satisfactory solution, achieving 88% of the maximum coverage and 96% of the optimal distance from existing green areas (Figure 8d). In both scenarios, the reduction in the value of the secondary objective is kept below the allowable , with coverage declining by 3% and equity by 4%.
The proposed methodology addresses the stages preceding mathematical modeling, providing insights into each step involved in deriving possible locations. A GIS is integral to this methodology as it facilitates the analysis of accessibility, calculates distance matrices and visualizes solutions. In contrast to [33], which uses Euclidean distance, this work employs real distance measures. Another notable contribution is the application of the isochrone concept, which has significant potential for enhancing operational research problems. While this concept is utilized in public transport [47], rainwater management [48] and ambulance relocation [49], our focus is on its less explored features. Ultimately, while the solutions obtained here, identifying green area locations, may not immediately lead to park construction, they serve as recommendations for enhancing nearby green spaces with features like vertical gardens.
6. Discussion and Conclusions
Solving real-life problems often requires a team of experts from various fields; thus, a multidisciplinary approach is essential. Operations Research offers a unique perspective into these challenges. This paper presents a methodology to identify potential sites for urban green areas. Our approach integrates Geographic Information System (GIS) technology with mathematical programming.
GIS tools typically calculate distance matrices and solve accessibility problems. This paper demonstrates their ability to collect input data, which otherwise may not be readily available. Additionally, they are useful in defining selection criteria, which, without GIS tools, might initially be confusing or subject to change over time. During the post-optimization phase, the complexity of the solutions, cost and strategic nature require validation before real-life implementation. A visual analysis of solutions helps in decision making. The proposed mathematical model aims to achieve two objectives, maximizing coverage and maximizing equity, using the lexicographic method to address the multi-objective model.
The methodology was validated using a case study in Valencia, Spain. Valencia, known as a green city in Europe, offers relatively good conditions for the location of green spaces. However, further validation in other study areas, especially those with scarce green resources, is necessary. One future line of study involves applying this methodology to the cities of Alicante and Castellón within the Valencian Community. These cities differ demographically and in their green infrastructure, providing a basis for comparing the methodology’s applicability across diverse urban settings.
The article relies on data from public statistics and GIS, considered reliable sources due to their regular updates, which reflect the current real-life situation. Future studies could incorporate additional data sources. For example, the Pla Verd project, involving the Valencia City Council, the University of Valencia and the Municipal Autonomous Body of Parks, Gardens and Urban Biodiversity, could provide valuable insights.
Given the rapid changes in urban development, delayed data updates may compromise research accuracy. However, the article’s primary focus is on the proposed methodology, featuring a data update cycle that allows for recalculated results. A promising research avenue is developing an interactive tool to integrate and automate components of the methodology.
Currently, potential green space locations are generated randomly across uncovered areas. However, integrating technical considerations such as minimum required size, irrigation access and sunlight hours could enhance site determination. GIS tools can assist by overlaying the uncovered area with layers like urban and irrigation infrastructure, effectively reducing it. Furthermore, changes in criteria can be addressed; for instance, obtaining CO2 levels for each neighborhood may lead to choosing locations in areas where these levels are highest, thereby delivering a reduction in pollution.
A further potential focus for research is evaluating recreational activities associated with each green space type in order to choose suitable locations, considering their distinct usage scenarios. In situations where constructing large or neighborhood parks is unfeasible, vertical gardens offer a valuable option to supplement ecological functions. However, they cannot replace the recreational opportunities provided by traditional green spaces.
Author Contributions
Conceptualization, Y.K., F.V., E.V. and W.A.P.; Methodology, Y.K., F.V., E.V. and W.A.P.; Validation, Y.K., F.V., E.V. and W.A.P.; Investigation, Y.K., F.V., E.V. and W.A.P.; Resources, Y.K., F.V., E.V. and W.A.P.; Data curation, Y.K., F.V., E.V. and W.A.P.; Writing—original draft, Y.K., F.V., E.V. and W.A.P.; Writing—review & editing, Y.K., F.V., E.V. and W.A.P.; Visualization, Y.K., F.V., E.V. and W.A.P. All authors have read and agreed to the published version of the manuscript.
Funding
This research received no external funding.
Data Availability Statement
The results of the study are available upon request to the authors.
Acknowledgments
Part of the authors are supported by the Faculty of Business Administration and Management at Universitat Politècnica de València.
Conflicts of Interest
The authors declare no conflicts of interest.
References
- UN. 2024. Available online: https://www.un.org/sustainabledevelopment/cities/ (accessed on 1 May 2025).
- Statista. 2024. Available online: https://www.statista.com/statistics/276629/global-co2-emissions/ (accessed on 1 May 2025).
- Arcadis. The Arcadis Sustainable Cities Index 2024. Technical Report. 2024. Available online: https://www.arcadis.com/ (accessed on 1 May 2025).
- Jing, L.; Liang, Y. The impact of tree clusters on air circulation and pollutant diffusion-urban micro scale environmental simulation based on ENVI-met. IOP Conf. Ser. Earth Environ. Sci. 2021, 657, 012008. [Google Scholar] [CrossRef]
- Santiago, J.L.; Martilli, A.; Martin, F. On dry deposition modelling of atmospheric pollutants on vegetation at the microscale: Application to the impact of street vegetation on air quality. Bound.-Layer Meteorol. 2017, 162, 451–474. [Google Scholar] [CrossRef]
- Alonso, R.; Vivanco, M.G.; González-Fernández, I.; Bermejo, V.; Palomino, I.; Garrido, J.L.; Elvira, S.; Salvador, P.; Artíñano, B. Modelling the influence of peri-urban trees in the air quality of Madrid region (Spain). Environ. Pollut. 2011, 159, 2138–2147. [Google Scholar] [CrossRef]
- Ajuntament de València. Plan Verde y de la Biodiversidad de València. 2021. Available online: https://plaverdvalencia.com/es/documentacion/ (accessed on 1 July 2024).
- Iberdrola. 2022. Available online: https://www.iberdrola.com/sustainability/sustainable-cities (accessed on 1 October 2024).
- Khomenko, S.; Cirach, M.; Pereira-Barboza, E.; Mueller, N.; Barrera-Gómez, J.; Rojas-Rueda, D.; de Hoogh, K.; Hoek, G.; Nieuwenhuijsen, M. Premature mortality due to air pollution in European cities: A health impact assessment. Lancet Planet. Health 2021, 5, e121–e134. [Google Scholar] [CrossRef]
- Labib, S.; Lindley, S.; Huck, J.J. Estimating multiple greenspace exposure types and their associations with neighbourhood premature mortality: A socioecological study. Sci. Total Environ. 2021, 789, 147919. [Google Scholar] [CrossRef]
- Gascon, M.; Sánchez-Benavides, G.; Dadvand, P.; Martínez, D.; Gramunt, N.; Gotsens, X.; Cirach, M.; Vert, C.; Molinuevo, J.L.; Crous-Bou, M.; et al. Long-term exposure to residential green and blue spaces and anxiety and depression in adults: A cross-sectional study. Environ. Res. 2018, 162, 231–239. [Google Scholar] [CrossRef]
- Vanaken, G.J.; Danckaerts, M. Impact of green space exposure on children’s and adolescents’ mental health: A systematic review. Int. J. Environ. Res. Public Health 2018, 15, 2668. [Google Scholar] [CrossRef]
- White, M.P.; Elliott, L.R.; Grellier, J.; Economou, T.; Bell, S.; Bratman, G.N.; Cirach, M.; Gascon, M.; Lima, M.L.; Lõhmus, M.; et al. Associations between green/blue spaces and mental health across 18 countries. Sci. Rep. 2021, 11, 8903. [Google Scholar] [CrossRef] [PubMed]
- Yañez, D.V.; Barboza, E.P.; Cirach, M.; Daher, C.; Nieuwenhuijsen, M.; Mueller, N. An urban green space intervention with benefits for mental health: A health impact assessment of the Barcelona “Eixos Verds” Plan. Environ. Int. 2023, 174, 107880. [Google Scholar] [CrossRef]
- Krellenberg, K.; Welz, J.; Reyes-Päcke, S. Urban green areas and their potential for social interaction—A case study of a socio-economically mixed neighbourhood in Santiago de Chile. Habitat Int. 2014, 44, 11–21. [Google Scholar] [CrossRef]
- Wan, C.; Shen, G.Q.; Choi, S. Underlying relationships between public urban green spaces and social cohesion: A systematic literature review. City Cult. Soc. 2021, 24, 100383. [Google Scholar] [CrossRef]
- WHO. Urban Green Spaces and Health. Technical Report. World Health Organization. Regional Office for Europe. 2016. Available online: https://www.who.int/europe/publications/i/item/WHO-EURO-2016-3352-43111-60341 (accessed on 1 October 2024).
- Lin, S.H.; Zhao, X.; Wu, J.; Liang, F.; Li, J.H.; Lai, R.J.; Hsieh, J.C.; Tzeng, G.H. An evaluation framework for developing green infrastructure by using a new hybrid multiple attribute decision-making model for promoting environmental sustainability. Socio-Econ. Plan. Sci. 2021, 75, 100909. [Google Scholar] [CrossRef]
- Wolch, J.R.; Byrne, J.; Newell, J.P. Urban green space, public health, and environmental justice: The challenge of making cities ‘just green enough’. Landsc. Urban Plan. 2014, 125, 234–244. [Google Scholar] [CrossRef]
- Ekkel, E.D.; de Vries, S. Nearby green space and human health: Evaluating accessibility metrics. Landsc. Urban Plan. 2017, 157, 214–220. [Google Scholar] [CrossRef]
- Laan, C.M.; Piersma, N. Accessibility of green areas for local residents. Environ. Sustain. Indic. 2021, 10, 100114. [Google Scholar] [CrossRef]
- Hsu, Y.Y.; Hawken, S.; Sepasgozar, S.; Lin, Z.H. Beyond the backyard: GIS analysis of public green space accessibility in Australian metropolitan areas. Sustainability 2022, 14, 4694. [Google Scholar] [CrossRef]
- Pinto, L.V.; Ferreira, C.S.S.; Inácio, M.; Pereira, P. Urban green spaces accessibility in two European cities: Vilnius (Lithuania) and Coimbra (Portugal). Geogr. Sustain. 2022, 3, 74–84. [Google Scholar] [CrossRef]
- Van Herzele, A.; Wiedemann, T. A monitoring tool for the provision of accessible and attractive urban green spaces. Landsc. Urban Plan. 2003, 63, 109–126. [Google Scholar] [CrossRef]
- Newell, J.P.; Seymour, M.; Yee, T.; Renteria, J.; Longcore, T.; Wolch, J.R.; Shishkovsky, A. Green Alley Programs: Planning for a sustainable urban infrastructure? Cities 2013, 31, 144–155. [Google Scholar] [CrossRef]
- Huang, C.; Huang, P.; Wang, X.; Zhou, Z. Assessment and optimization of green space for urban transformation in resources-based city—A case study of Lengshuijiang city, China. Urban For. Urban Green. 2018, 30, 295–306. [Google Scholar] [CrossRef]
- Plaza, P. València Dispone de 178.000 Metros Cuadrados de Suelo Residencial para Desarrollar Vivienda. 2022. Available online: https://valenciaplaza.com/valencia-dispone-de-178000-metros-cuadrados-de-suelo-residencial-para-desarrollar-vivienda (accessed on 1 October 2024).
- Green, O.O.; Garmestani, A.S.; Albro, S.; Ban, N.C.; Berland, A.; Burkman, C.E.; Gardiner, M.M.; Gunderson, L.; Hopton, M.E.; Schoon, M.L.; et al. Adaptive governance to promote ecosystem services in urban green spaces. Urban Ecosyst. 2016, 19, 77–93. [Google Scholar] [CrossRef]
- Nyelele, C.; Kroll, C.N. A multi-objective decision support framework to prioritize tree planting locations in urban areas. Landsc. Urban Plan. 2021, 214, 104172. [Google Scholar] [CrossRef]
- Wicki, S.; Schwaab, J.; Perhac, J.; Grêt-Regamey, A. Participatory multi-objective optimization for planning dense and green cities. J. Environ. Plan. Manag. 2021, 64, 2532–2551. [Google Scholar] [CrossRef]
- Liu, J.; Zhang, D.; Wang, J.; Ding, X.; Mei, C. Multi-Objective Optimization and Decision-Making of Green Infrastructure Layout Considering Carbon Emission. Energy Proc. 2021, 23, 530. [Google Scholar]
- Zucca, A.; Sharifi, A.M.; Fabbri, A.G. Application of spatial multi-criteria analysis to site selection for a local park: A case study in the Bergamo Province, Italy. J. Environ. Manag. 2008, 88, 752–769. [Google Scholar] [CrossRef]
- Neema, M.N.; Ohgai, A. Multi-objective location modeling of urban parks and open spaces: Continuous optimization. Comput. Environ. Urban Syst. 2010, 34, 359–376. [Google Scholar] [CrossRef]
- Vallejo, M.; Rieser, V.; Corne, D.W. Genetic algorithm evaluation of green search allocation policies in multilevel complex urban scenarios. J. Comput. Sci. 2015, 9, 57–63. [Google Scholar] [CrossRef]
- Sefair, J.A.; Molano, A.; Medaglia, A.L.; Sarmiento, O.L. Locating neighborhood parks with a lexicographic multiobjective optimization method. In Community-Based Operations Research; Springer: New York, NY, USA, 2012; pp. 143–171. [Google Scholar]
- Li, X.; Li, X.; Ma, X. Spatial optimization for urban green space (UGS) planning support using a heuristic approach. Appl. Geogr. 2022, 138, 102622. [Google Scholar] [CrossRef]
- BOE. Orden PCM/735/2021, de 9 de julio, por la que se aprueba la Estrategia Nacional de Infraestructura Verde y de la Conectividad y Restauración Ecológicas. Minist. Pres. Relac. Cortes Mem. Democrática 2021, 166, 83217–83470. [Google Scholar]
- Pengelly Consultants. ‘Nature Nearby’ Accessible Natural Greenspace Guidance; Natural England: York, UK, 2010; Available online: http://www.ukmaburbanforum.co.uk/docunents/other/nature_nearby.pdf (accessed on 1 October 2024).
- Eiselt, H.A.; Sandblom, C.L. Operations Research: A Model-Based Approach; Springer Nature: Cham, Switzerland, 2022. [Google Scholar]
- QGIS. Available online: https://www.qgis.org/es/site/ (accessed on 1 February 2025).
- Openrouteservice. Available online: https://openrouteservice.org/ (accessed on 1 February 2025).
- L’Institut Cartogràfic Valencià. Corine Land Cover 2018 a la Comunitat Valenciana. Available online: https://geocataleg.gva.es/#/?lang=spa (accessed on 1 February 2025).
- Ajuntament de València. Missions València 2030. Available online: https://www.missionsvalencia.eu/?lang=es (accessed on 1 June 2024).
- Ajuntament de València. GEOPORTAL. Available online: https://geoportal.valencia.es/apps/GeoportalHome/es/inicio/ (accessed on 1 March 2025).
- UE. GHSL—Global Human Settlement Layer. Available online: https://ghsl.jrc.ec.europa.eu/download.php?ds= (accessed on 1 July 2024).
- INE. Available online: https://www.ine.es/ (accessed on 1 July 2024).
- Zhang, W.; Nian, P.; Lyu, G. A multimodal approach to assessing accessibility of a high-speed railway station. J. Transp. Geogr. 2016, 54, 91–101. [Google Scholar] [CrossRef]
- Yang, Y.; Li, J.; Huang, Q.; Xia, J.; Li, J.; Liu, D.; Tan, Q. Performance assessment of sponge city infrastructure on stormwater outflows using isochrone and SWMM models. J. Hydrol. 2021, 597, 126151. [Google Scholar] [CrossRef]
- Karpova, Y.; Villa, F.; Vallada, E.; Vecina, M.Á. Heuristic algorithms based on the isochron analysis for dynamic relocation of medical emergency vehicles. Expert Syst. Appl. 2023, 212, 118773. [Google Scholar] [CrossRef]
Disclaimer/Publisher’s Note: The statements, opinions and data contained in all publications are solely those of the individual author(s) and contributor(s) and not of MDPI and/or the editor(s). MDPI and/or the editor(s) disclaim responsibility for any injury to people or property resulting from any ideas, methods, instructions or products referred to in the content. |
© 2025 by the authors. Licensee MDPI, Basel, Switzerland. This article is an open access article distributed under the terms and conditions of the Creative Commons Attribution (CC BY) license (https://creativecommons.org/licenses/by/4.0/).